1. Introduction
African swine fever (ASF) is a highly contagious and deadly viral disease affecting both domestic swine and wild boar at all ages. Currently, there is no safe and available vaccine for controlling and preventing the ASF epidemic. Previous research reported that antibodies can provide immune protection against ASFV. Schlafer et al. found that AFSV infection delayed the time of clinical symptoms occurrence after being fed with colostrum that originated from piglets that recovering from ASFV infection or injected immunoglobulins from anti-ASFV serum into piglets [
1], which attributed to the important role of protective antigens in virus neutralization, antibody dependent cells mediated cytotoxicity, and complement dependent cells lysis. Oura et al. confirmed that the production of specific antibodies depended on ASFV specific T lymphocytes, and cellular immunity dominated by T cells presented significant inhibition against ASFV infection [
2,
3]. Furthermore, T lymphocytes differentiated into different cell subpopulations under the action of antigen presentation and cytokines, determined the final immune response according to the function and type [
4].
Dendritic cells (DCs), as crucial immune response regulators, are not only the first line to defense the natural immune response, but also the initiator of adaptive immune response [
5,
6,
7]. It can guide T cells to mediate the type and duration of the specific immune response. DCs and macrophages recognized antigen, secreted cytokines and chemokines by activating T lymphocytes, B lymphocytes, and NK cells when ASFV entered the host. IFN-γ and TNF-α, as the crutical cytokines, have demonstrated that can promote the activation and antigen presentation of DCs [
8]. IL-8 is a functional chemotactic factor that can activate neutrophil phagocytosis and lysosomal activity, and exhibits chemotactic effect on T lymphocytes [
9]. IL-12p70 plays an important effect in stimulating the differentiation of immature T cells into Th1 type cells and promoting the activation of immune cells (macrophages, NK cells, and cytotoxic T cells) during antigen presentation, thereby enhancing cytotoxicity and activating cellular immunity [
10]. These secreted cytokines further promoted the proliferation and activation of lymphocytes, thereby exerting anti-ASFV infection function. DCs, as a bridge to connect natural and adaptive immunity, can make judgments and choices about the host's immune bias, and transmit information to other immune cells in cytokines form, initiating corresponding immunity in the shortest possible time, thereby maintaining the immune stability of the host. Compared with humoral immune response, the function of cellular immune response mainly cooperated with specialized immune cells (T cells, B cells, and APCs) [
11]. T cells, as the core component of cellular immunity, are divided into different subtypes, including helper T cells (Th; differentiation positive cell group CD4
+), cytotoxic T cell group (CD8
+), and regulatory T cell group (Treg; CD4
+CD25
+Foxp3
+). Among them, helper CD4
+ T cells exhibited immune-protective effect by secreting various cytokines and antibodies, while CD8
+ T lymphocytes performed effect to kill and inhibit different viruses and tumor cells [
12].
The immune system played a defensive role when the organism was invaded by pathogens. Therefore, conducting research on the interaction between pathogens and important immune cells is beneficial for revealing the pathogenic mechanism and immune protection mechanism, thereby providing more theoretical and practical basis for the development of antiviral drugs and vaccines. As a guard of the immune system and the only APC that possessed the capable of activating naive T lymphocytes, DCs has become a crucial target to research the interaction between pathogens and immune cells. In previous studies, porcine reproductive and respiratory syndrome virus (PRRSV) and classical swine fever virus (CSFV) induced a large amount of cytokines secretion and down-regulated the expression of DCs surface antigen presenting molecules in infected DCs, thereby inhibiting the maturation of DCs [
13,
14]. Although Bovine Viral Diarra Virus (BVDV) and Porcine Circovirus 2 (PCV2) can infect DCs, the phenotypes of DCs retained constant [
15]. These results indicated that immune responses may be associated with different types and ways of virus infection in DCs. Vesicular stomatitis virus (VSV) is a promising oncolytic virus and vaccine vector that can synthesize specific antigens through reverse genetic system to maintain higher levels for a long time in cells [
16]. Previous studies have found that VSV
MT effectively induced DCs maturation and promoted efficient immune response by delaying cell apoptosis, secreting cytokines, and up-regulating the expression of surface molecules CD80/86 and MHC-Ⅱ [
17]. In previous research, the live vector vaccine of VSV recombinant ASFV antigen gene also produced efficient humoral and cellular immune responses in mice after immunization [
18]. However, the mechanism that the modified VSV induced efficient immune responses in mice was still unclear. Therefore, the immune regulatory effects of DCs and T lymphocytes during VSV recombinant ASFV antigen gene live vector infection were explored, to further revealed the immune mechanism related to DCs antigen presentation and CD4
+T lymphocytes polarization, which providing more theoretical basis for VSV as an ideal vaccine vector.
2. Materials and Methods
2.1. Animal, Viruses and Cell Lines
The specific pathogen free female C57BL/6 mice were purchased from the experimental animal center of Lanzhou Veterinary Research Institute (LVRI), Chinese Academy of Agricultural Sciences. The recombinant viruses (VSV-p35, VSV-p72) were constructed and rescued as previously described [
18]. VSV-rwt strain were stored in our laboratory. BMDCs were obtained from bone marrow monocytes of female C57BL/6 mice in
vitro. The spleen lymphocytes were isolated from the C57BL/6 mice using Ficoll Plus 1.077 (Solarbio, Beijing, China) according to manufacturer's instruction. The harvested cells were cultured in RPMI 1640 medium (Gibco, Carlsbad, CA) supplemented with 10% fetal bovine sera (FBS, Thermo Fisher Scientific), 100 U/mL penicillin (Thermo Fisher Scientific), and 100 μg/mL streptomycin solution (Thermo Fisher Scientific) at 37 ºC with 5 % CO
2.
2.2. The Preparation of DCs
The C57BL/6 mice were selected as experimental animals for the isolation and culture of BMDCs in this experiment. The cells from mouse bone marrow were rinsed by using a sterile syringe and filtered through 70 µm cell strainers to remove tissue debris and impurities. The supernatants were removed after being centrifuged at 500 g for 5 min, then 4 mL red blood cell lysis solution (Solarbio, Beijing, China) was added to resuspend and lysis the red blood cells at room temperature (RT) for 3 min. 6 mL sterile PBS buffer was added to stop the lysis reaction and the supernatants were removed by centrifugation at 500 g for 5 min. The cells were seeded in a 12 well plate with a density of 1 × 10⁶ cells per well and added RPMI 1640 culture medium (Gibco, Carlsbad, CA) containing 20 ng/ml rmGM-CSF and 10 ng/ml rmIL-4 (Abcam, Cambridge, UK) and 10% FBS. The morphology was observed under microscope every day.
2.3. Purification and Identification of BMDCs
The DCs were collected into a centrifuge tube after being centrifuged at 500 g for 5 min, and added 2 µL Phycoeythrin-CD11c mAb in DCs at the density to 1 × 10⁶ and incubated for 30 min at 4 ℃ darkly. The cells were washed twice with PBS and re-suspended with 100 μL PBS. The positive rate of CD11c was detected by flow cytometry.
2.4. Real-Time Quantitative PCR (RT-qPCR)
Total RNA was extracted from DCs infected with recombinant viruses (VSV-p35, VSV-p72, and VSV-p35+p72) using Trizol reagent (ThermoFisher, USA). VSV-rwt, hiVSV-rwt (heat inactivated VSV-rwt at 65 ℃ for 30 min) and PBS were set up as control groups. RT-qPCR was used to quantify RNA by One Step TB Green PrimeScriptTM RT-qPCR Kit Ⅱ (Takara, Dalian, China) according to the manufacturer's instructions. The cycling program as follows: 42 °C for 5 min, 95°C for 10 s, and 40 cycles of 95 °C for 5 s and 60 °C for 30 s. The β-actin was set to the reference gene and the relative mRNA expression of each gene was calculated using the 2-△△CT method.
The N gene of VSV was amplified with PrimeScript™ One Step RT-PCR Kit (Takara, Dalian, China) and cloned into the pMD19-T vector to construct a standard plasmid. The standard curve was generated by 10-fold dilutions of plasmid and performed absolute quantitative detection of VSV genome copies using One Step TB Green PrimeScript™ RT-PCR Kit. The primers used in this study were shown in
Table 1.
2.5. Western Blotting (WB)
Total proteins from infected DCs were extracted using ice-cold RIPA lysis buffer at indicated time (Solarbio, Beijing, China). Briefly, cultured DCs were infected with VSV-p72, VSV-p35 or VSV-p35+p72, respectively. Cell lysates were centrifuged at 13,000 g for 10 min and collected supernatants to boil for 15 min after being mixed with 4 × loading buffer. The equal amounts of protein lysates were subjected onto 10% SDS-PAGE polyacrylamide gel and transferred into polyvinylidene difluoride (PVDF) membranes subsequently. The membranes were blocked with 5% skim milk at RT for 2 h and then incubated with anti-VSV-G tag antibody (diluted at 1:1000) overnight at 4 °C. Next, the membranes were incubated with horse-raddish peroxidase (HRP)-labeled goat anti-rabbit secondary antibody (diluted at 1:5000) for 1 h at RT, respectively. Subsequently, the membranes were visualized using an enhanced chemiluminescence system and a FluorChem E system (ECL, Thermo Scientific, USA).
2.6. Flow Cytometry Assay
Surface marked molecules detection: The infected DCs were stained with 2 µL PE-CD11c, FITC-CD86, APC-CD80, APC-CD40, and FITC-MHC-Ⅱ mAb (BD Biosciences, San Diego, USA) for 30 min at 4 °C darkly. The cell populations were analyzed by flow cytometry (Beckman Coulter, Brea, CA, USA).
Apoptosis detection: The supernatants from infected DCs were removed and washed with PBS after being centrifuged at 500 g for 5 min. The cells were stained with 2 µL PE-CD11c for 30 min at 4 °C darkly, then added 5 µL of annexin V and 1 μL fixable viability dye to incubate for 15 min on ice, and then performed to flow cytometry analysis.
Lymphocyte phenotype and intracellular cytokine detection: The infected DCs were co-cultured with spleen lymphocytes (DC: T = 1:10) for 12 h, 24 h, and 48 h. The co-cultured cells were collected and washed with PBS after being centrifuged at 500 g for 5 min, then added with 2 µL FITC-CD3, APC-CD4, and PE-CD8 to incubate for 30 min at 4 ℃ darkly. The permeabilization buffer was added and incubated for 30 min at 4 °C darkly. Next, the cells were washed with 1 mL of BD perm/washTM buffer for 5 min in dark. Finally, the cells were re-suspended with 100 µL PBS, and added 2 µL PE-IL-4、PE-IL-17A、PE-IFN-γ, PE-TNF-α mAb to incubate for 45 min at 4 °C darkly. The cell populations were analyzed by flow cytometry.
2.7. Detection of Cytokine and Lymphocyte Proliferation Level
The infected DCs co-cultured with spleen lymphocytes (DC: T = 1:10) were seeded into 96 well plate at density of 1 × 10⁶. Concanavalin A, uninfected cells, and RPMI 1640 medium were set as positive, negative, and blank control, respectively. The level of cytokines in supernatant was detected after the plate was incubated for 12 h, 24 h, and 48 h at 37 °C. The Cell Counting Kit-8 solution (CCK-8, Dojindo, Japan) was added and incubated for 4 h at 37 °C. Finally, the absorbance of OD450 was measured. Calculated formula as follows: the stimulation index SI = (treatment group OD450 - blank control OD450) / (negative control OD450 - blank control OD450).
2.8. Detection of Antigen Uptake Ability
1 mg/mL FITC-Dextran was added to infected DCs and incubated at 37 ℃ or 4 ℃ (negative control) for 2 h after being washed and re-suspended with PBS. The mean fluorescence intensity (MFI) was measured by flow cytometry assay. The calculation formula as follows: Δ MFI = MFI (37 °C treatment group) - MFI (4 ℃ negative group).
2.9. Detection of DCs Migration Ability
The DCs were treated with 0.1 MOI of VSV-p35, VSV-p72, and VSV-p35+p72, respectively, and counted after being washed and re-suspended with PBS. RPMI 1640 culture medium containing different concentrations of CCL19 and CCL21 (concentrations of 10 ng/mL, 50 ng/mL, and 100 ng/mL, respectively) were added to the lower layer of transwell chamber (Corning, USA). The 8.0 μm upper chamber was inserted into the lower chamber and incubated for 4 h at 37 ℃. Removed the upper chamber and collected the lower chamber cells (migrating DCs) for counting. Migration rate = Lower chamber cells / whole cells × 100%.
2.10. Cells Viability Assay
The DCs were infected with 0.1 MOI of VSV-p35, VSV-p72, VSV-p35+p72 and adjusted to density of 1 × 10⁵ cells per well into a 96 well plate at 37 °C for 12 h, 24 h and 48 h, respectively. The PBS group was set as negative control. The CCK-8 reagent was added and incubated for 4 h at 37 °C. Finally, the value of OD450 was measured using a microplate reader (Thermo Fisher Scientific, USA). The cells viability was calculated according to the following formula: cell viability (%) = treatment group OD450 / negative control OD450.
2.11. Indirect Immunofluorescence Assay (IFA)
The infected DCs were incubated for 24 h at 37 °C to perform immunofluorescence detection. Firstly, the cells were fixed with 4% paraformaldehyde solution for 30 min at RT and washed 5 times with PBS. Then, cells were blocked with 5% BSA at RT for 1 h after being permeabilized with 0.25% Triton-X100 for 20 min, and incubated with ASFV p72 or p30 monoclonal antibody (diluted at 1:1000) overnight at 4 °C. Next, cells were incubated with the goat anti-mouse antibody labeled with fluorescence (diluted at 1:5000) for 1 h at 37 °C darkly. Finally, the cells were stained with DAPI for 10 min and observed under fluorescence microscope (Leica, Germany).
2.12. Statistical Analysis
All experiments were repeated thrice and the data in the figures were represented as mean ± standard (SEM). The statistical relationships between the experimental groups and the control groups were determined using Graphpad Prism 7.0 software by two-way ANOVA with Bonferroni’s multiple comparison test. p < 0.05 was considered statistically significant, p < 0.001 was considered to be extremely significant.
4. Discussion
VSV is a non-pathogenic negative stranded and enveloped RNA virus. It has become one of the most promising viral vectors for the development of vaccines against pathogens with high biological requirements, which was attributed to its various advantages, such as easy cultivation, wide host range, stable and efficient expression of exogenous proteins, and comprehensive and strong immune responses production by stimulatation [
19,
20]. In addition, VSV can trigger cytotoxic T cell responses to viral proteins and tumor associated antigens as an oncolytic agent, thereby producing long-lasting anti-tumor effects [
21]. The basic mechanism of interaction between VSV and host cells has confirmed in majority studies, such as the dynamics of virus gene expression and the pathogenesis of virus infection, which provided more information to design more efficient and safer recombinant VSV vectors [
22]. Granulocyte macrophage colony-stimulating factor (GM-CSF) involved in the maturation and migration of macrophages and DCs, thereby activating cytotoxic T cells [
23]. Therefore, Ramsburg et al. inserted the GM-CSF gene into the VSV backbone to construct a VSV-GM-CSF vector, which can induce stronger humoral and cellular immune response as well as anti-tumor immune responses in host [
24,
25]. DCs, a type of key cells that connecting innate and adaptive immunity, not only plays a role in regulating innate immune response, but also plays a dominant role in adaptive immune response as an important APC [
26]. DCs mainly recognized PAMPs through PRRs on the surface and presented antigen information to T cells when the host was invaded by pathogenic microorganisms. Then, the activation of initial T cells and the differentiation of different subtypes Th cells (Th1, Th2, Th17, and Treg) activated specific immune response in host [
27,
28,
29]. In this study, we found that the recombinant VSV effectively activated naive T cells and stimulated the activation and proliferation of Th1 and Th17 cells.
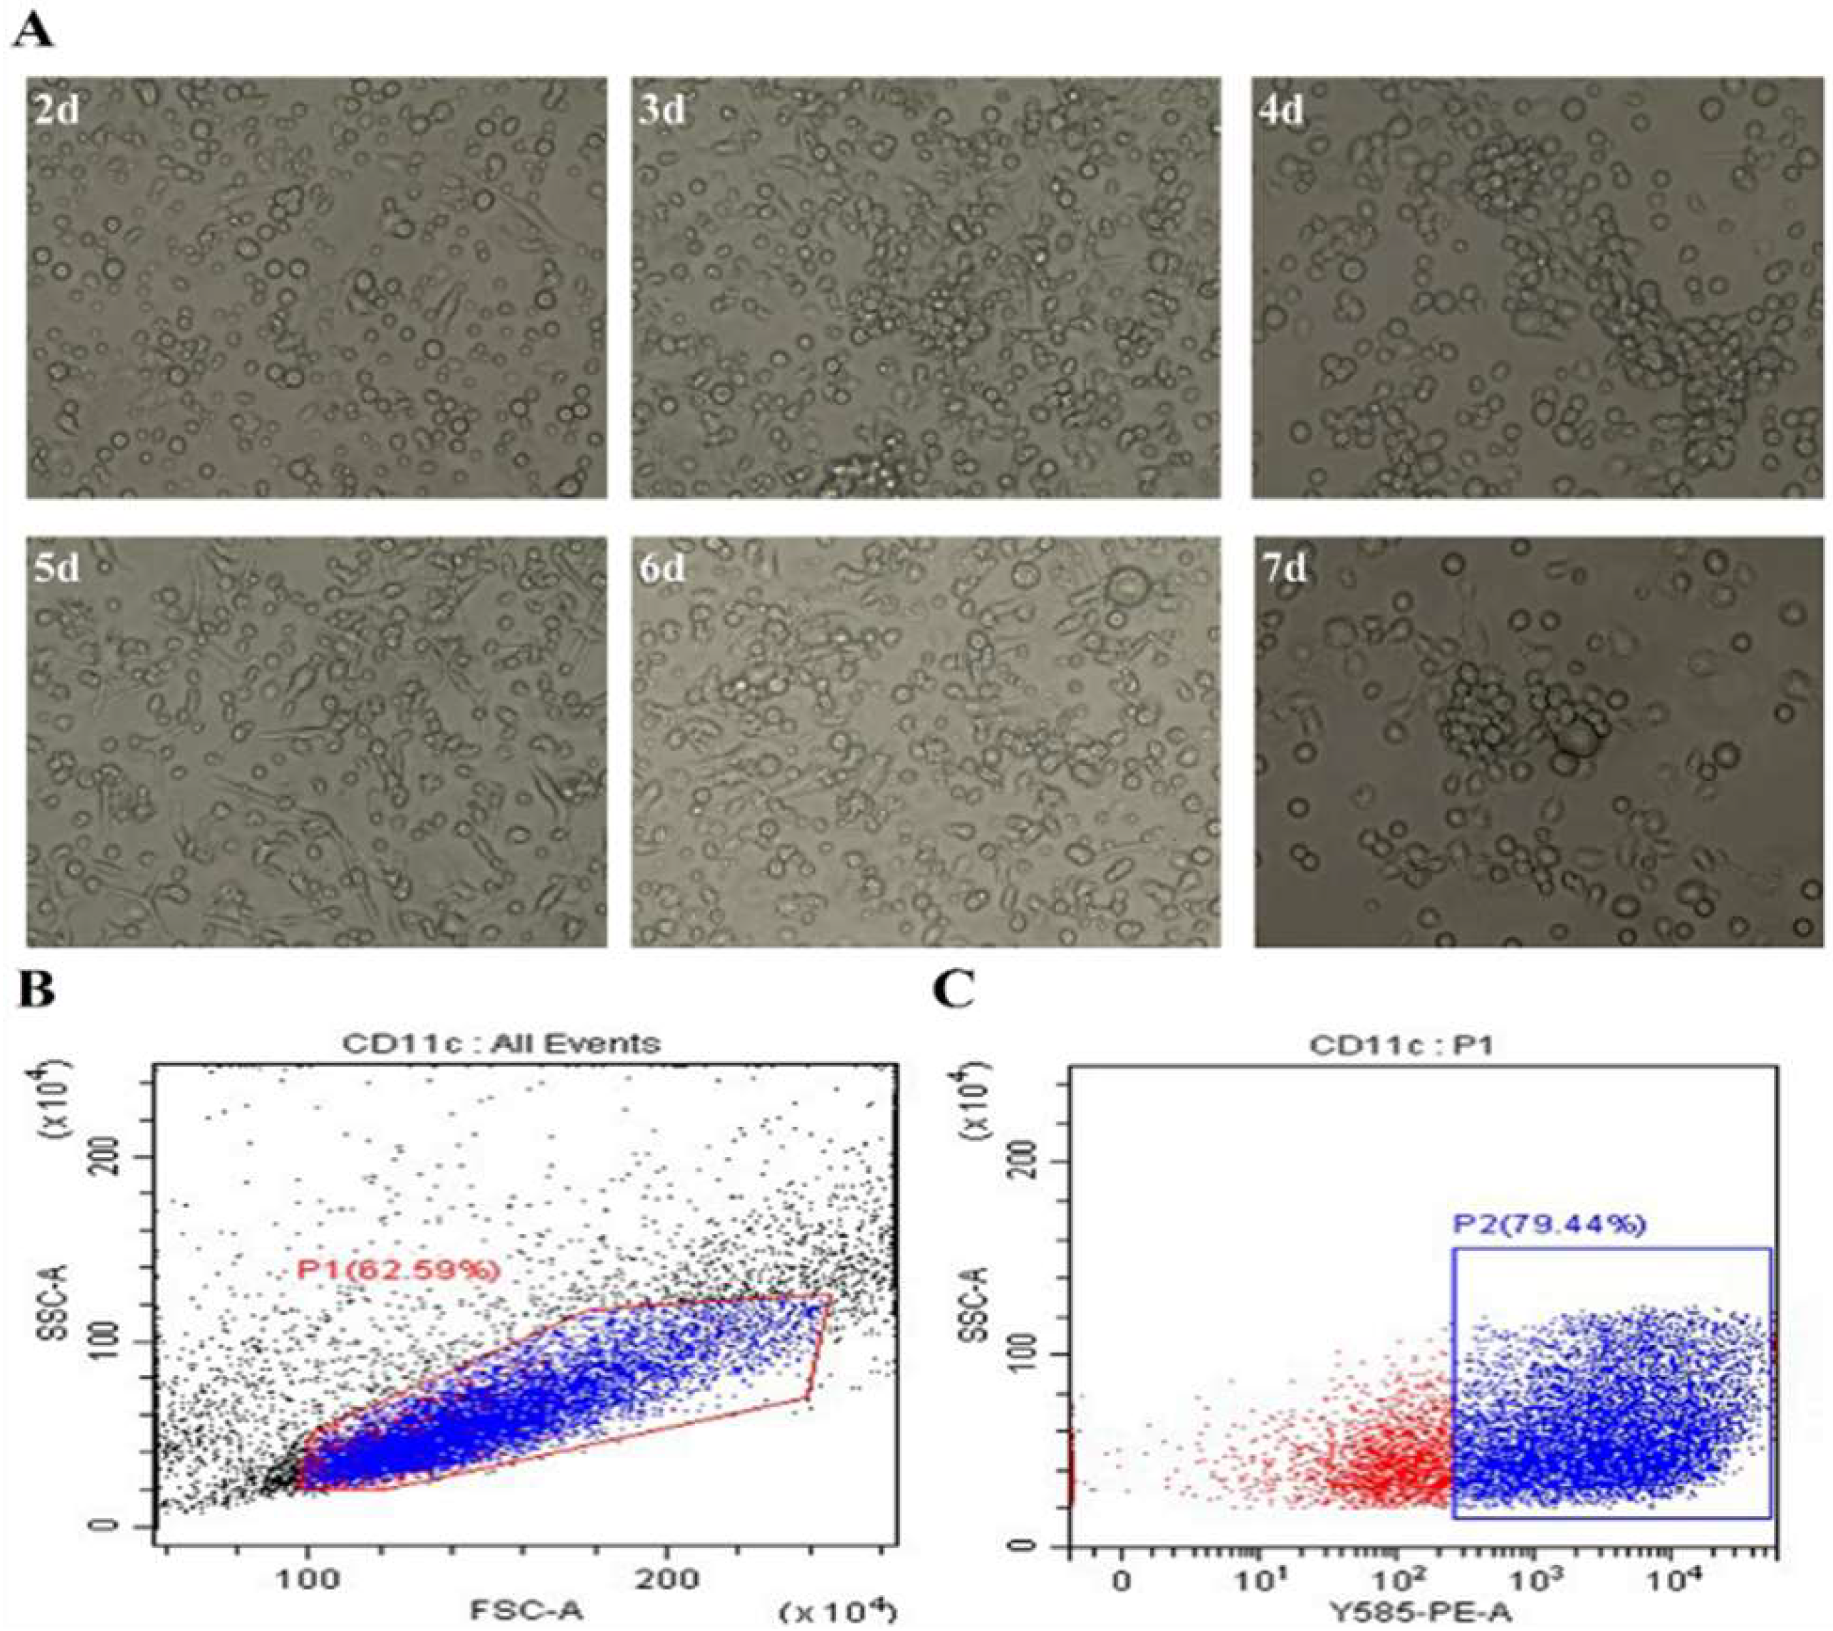
The differential DCs exhibited typical dendritic morphology and had the ability to present antigens. The surface molecules such as CD40, CD80, CD86, and MHC-Ⅱ were highly expressed in mature DCs [
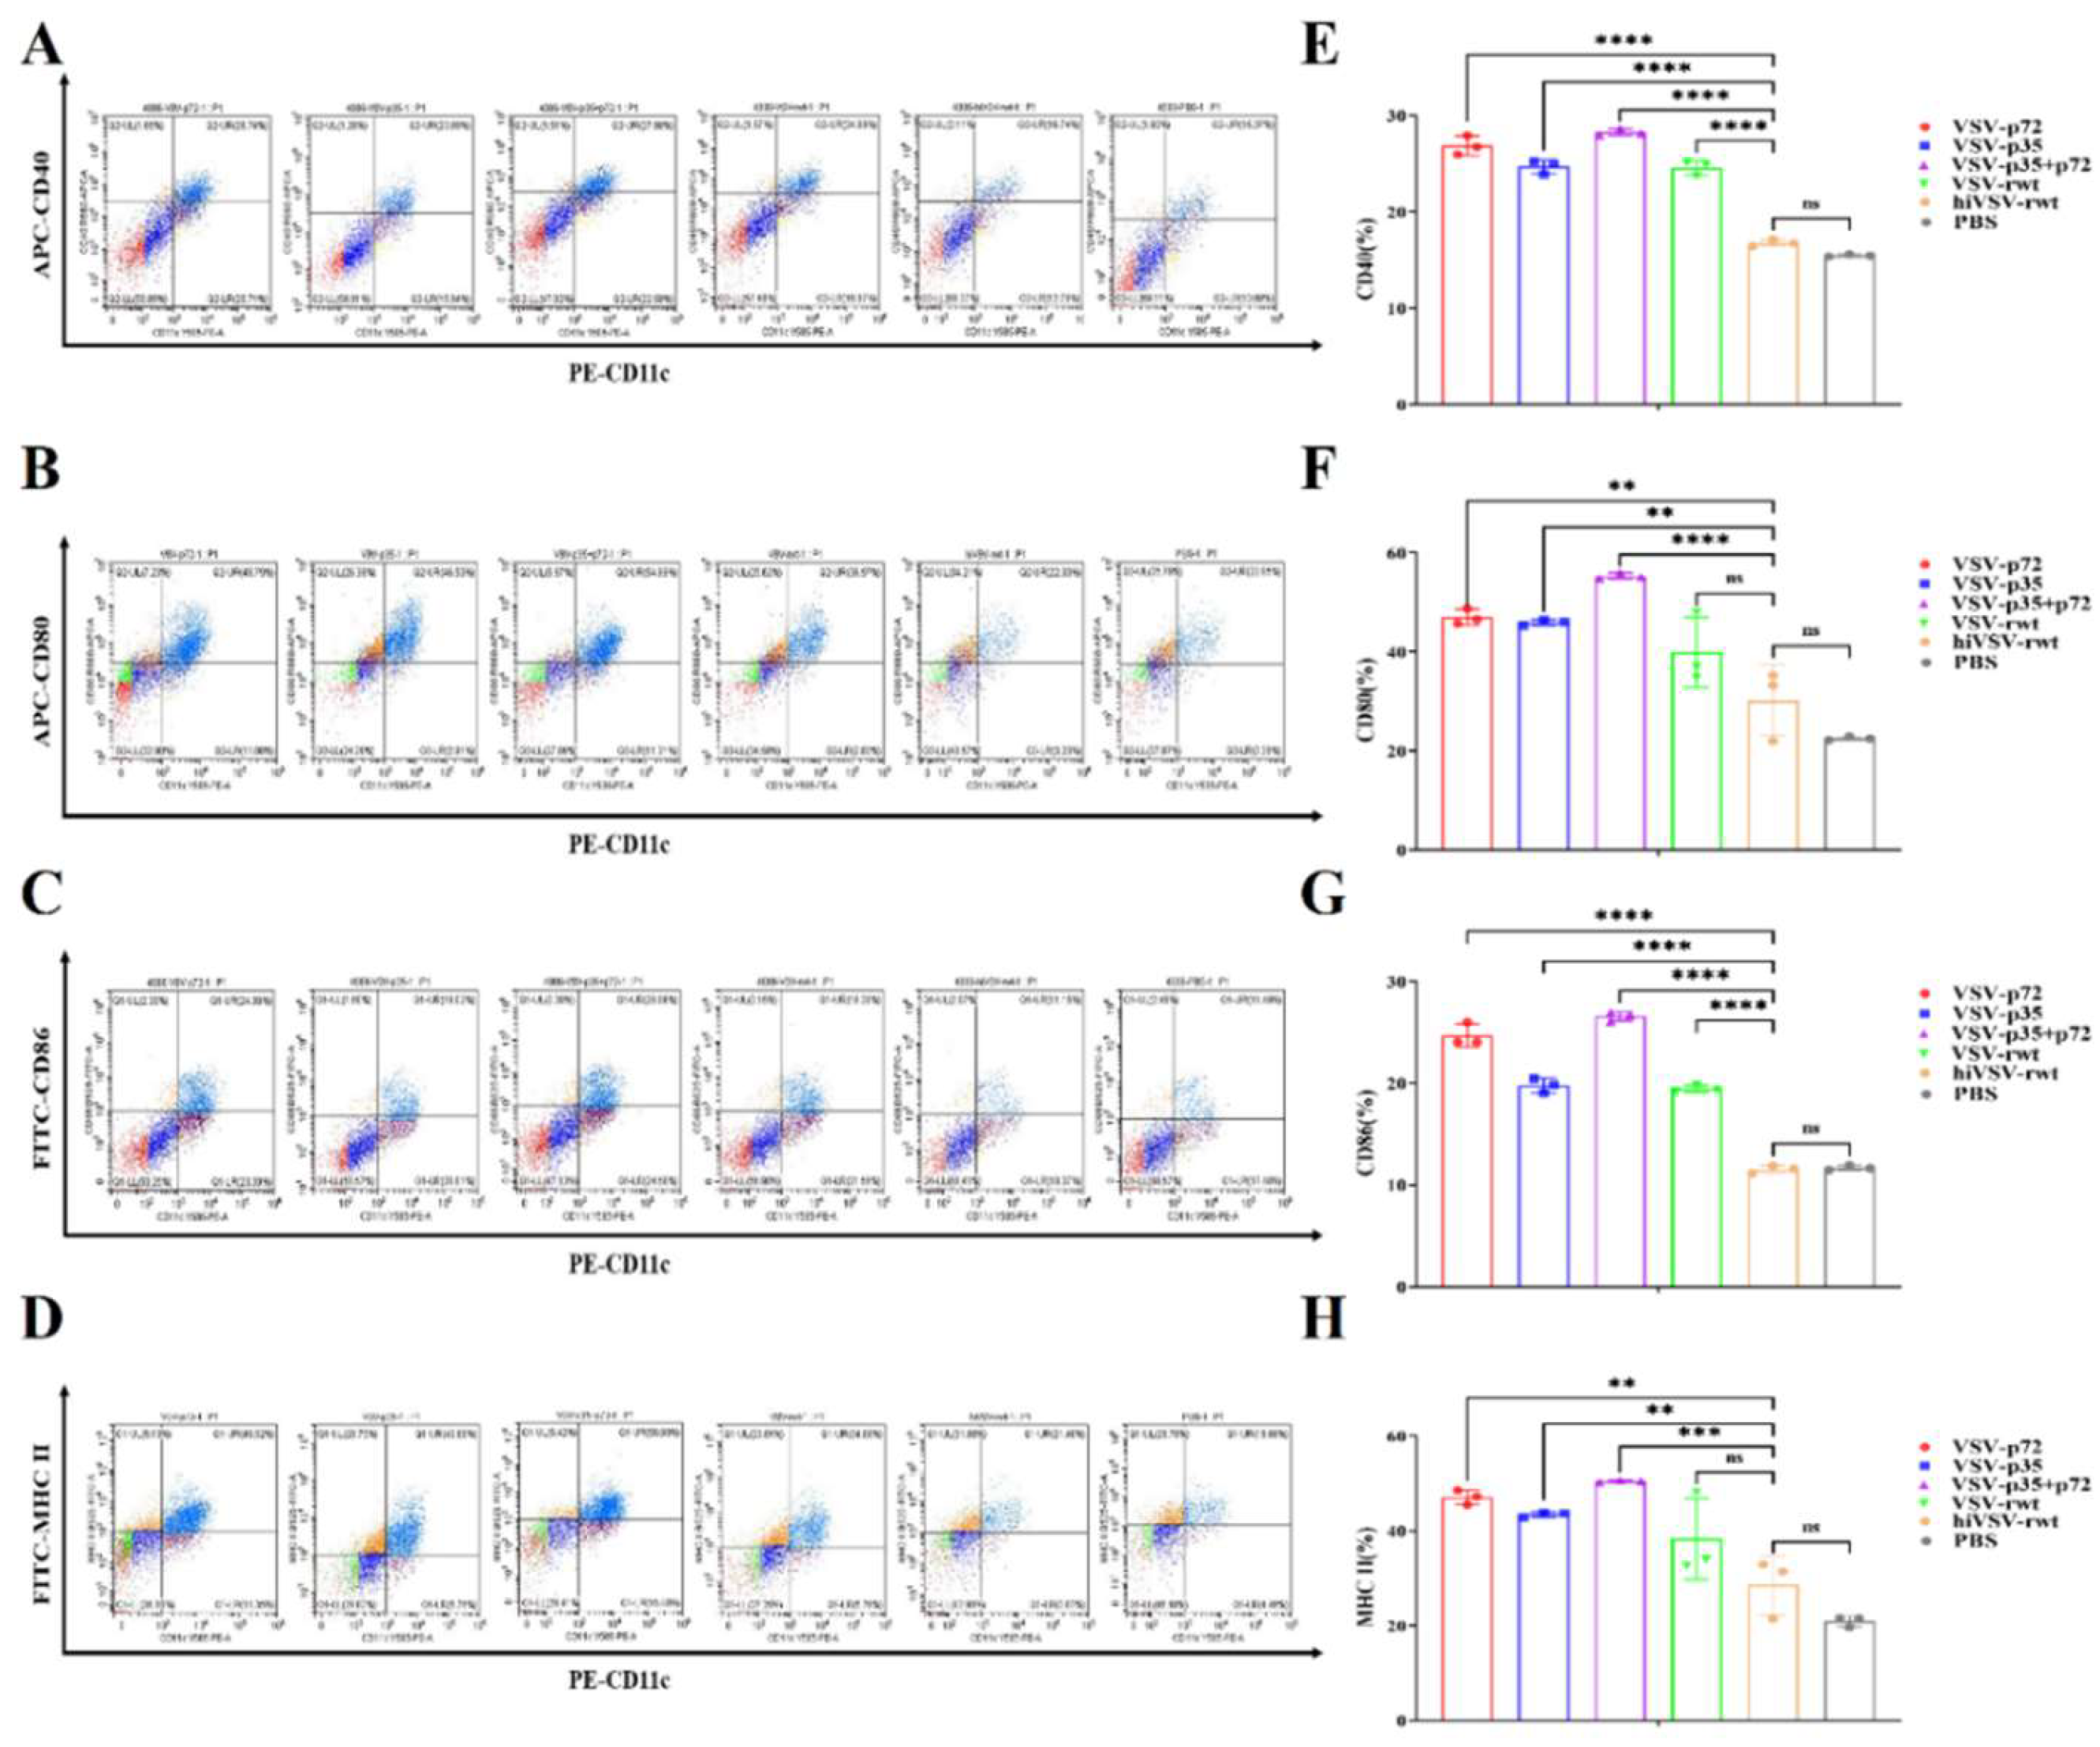
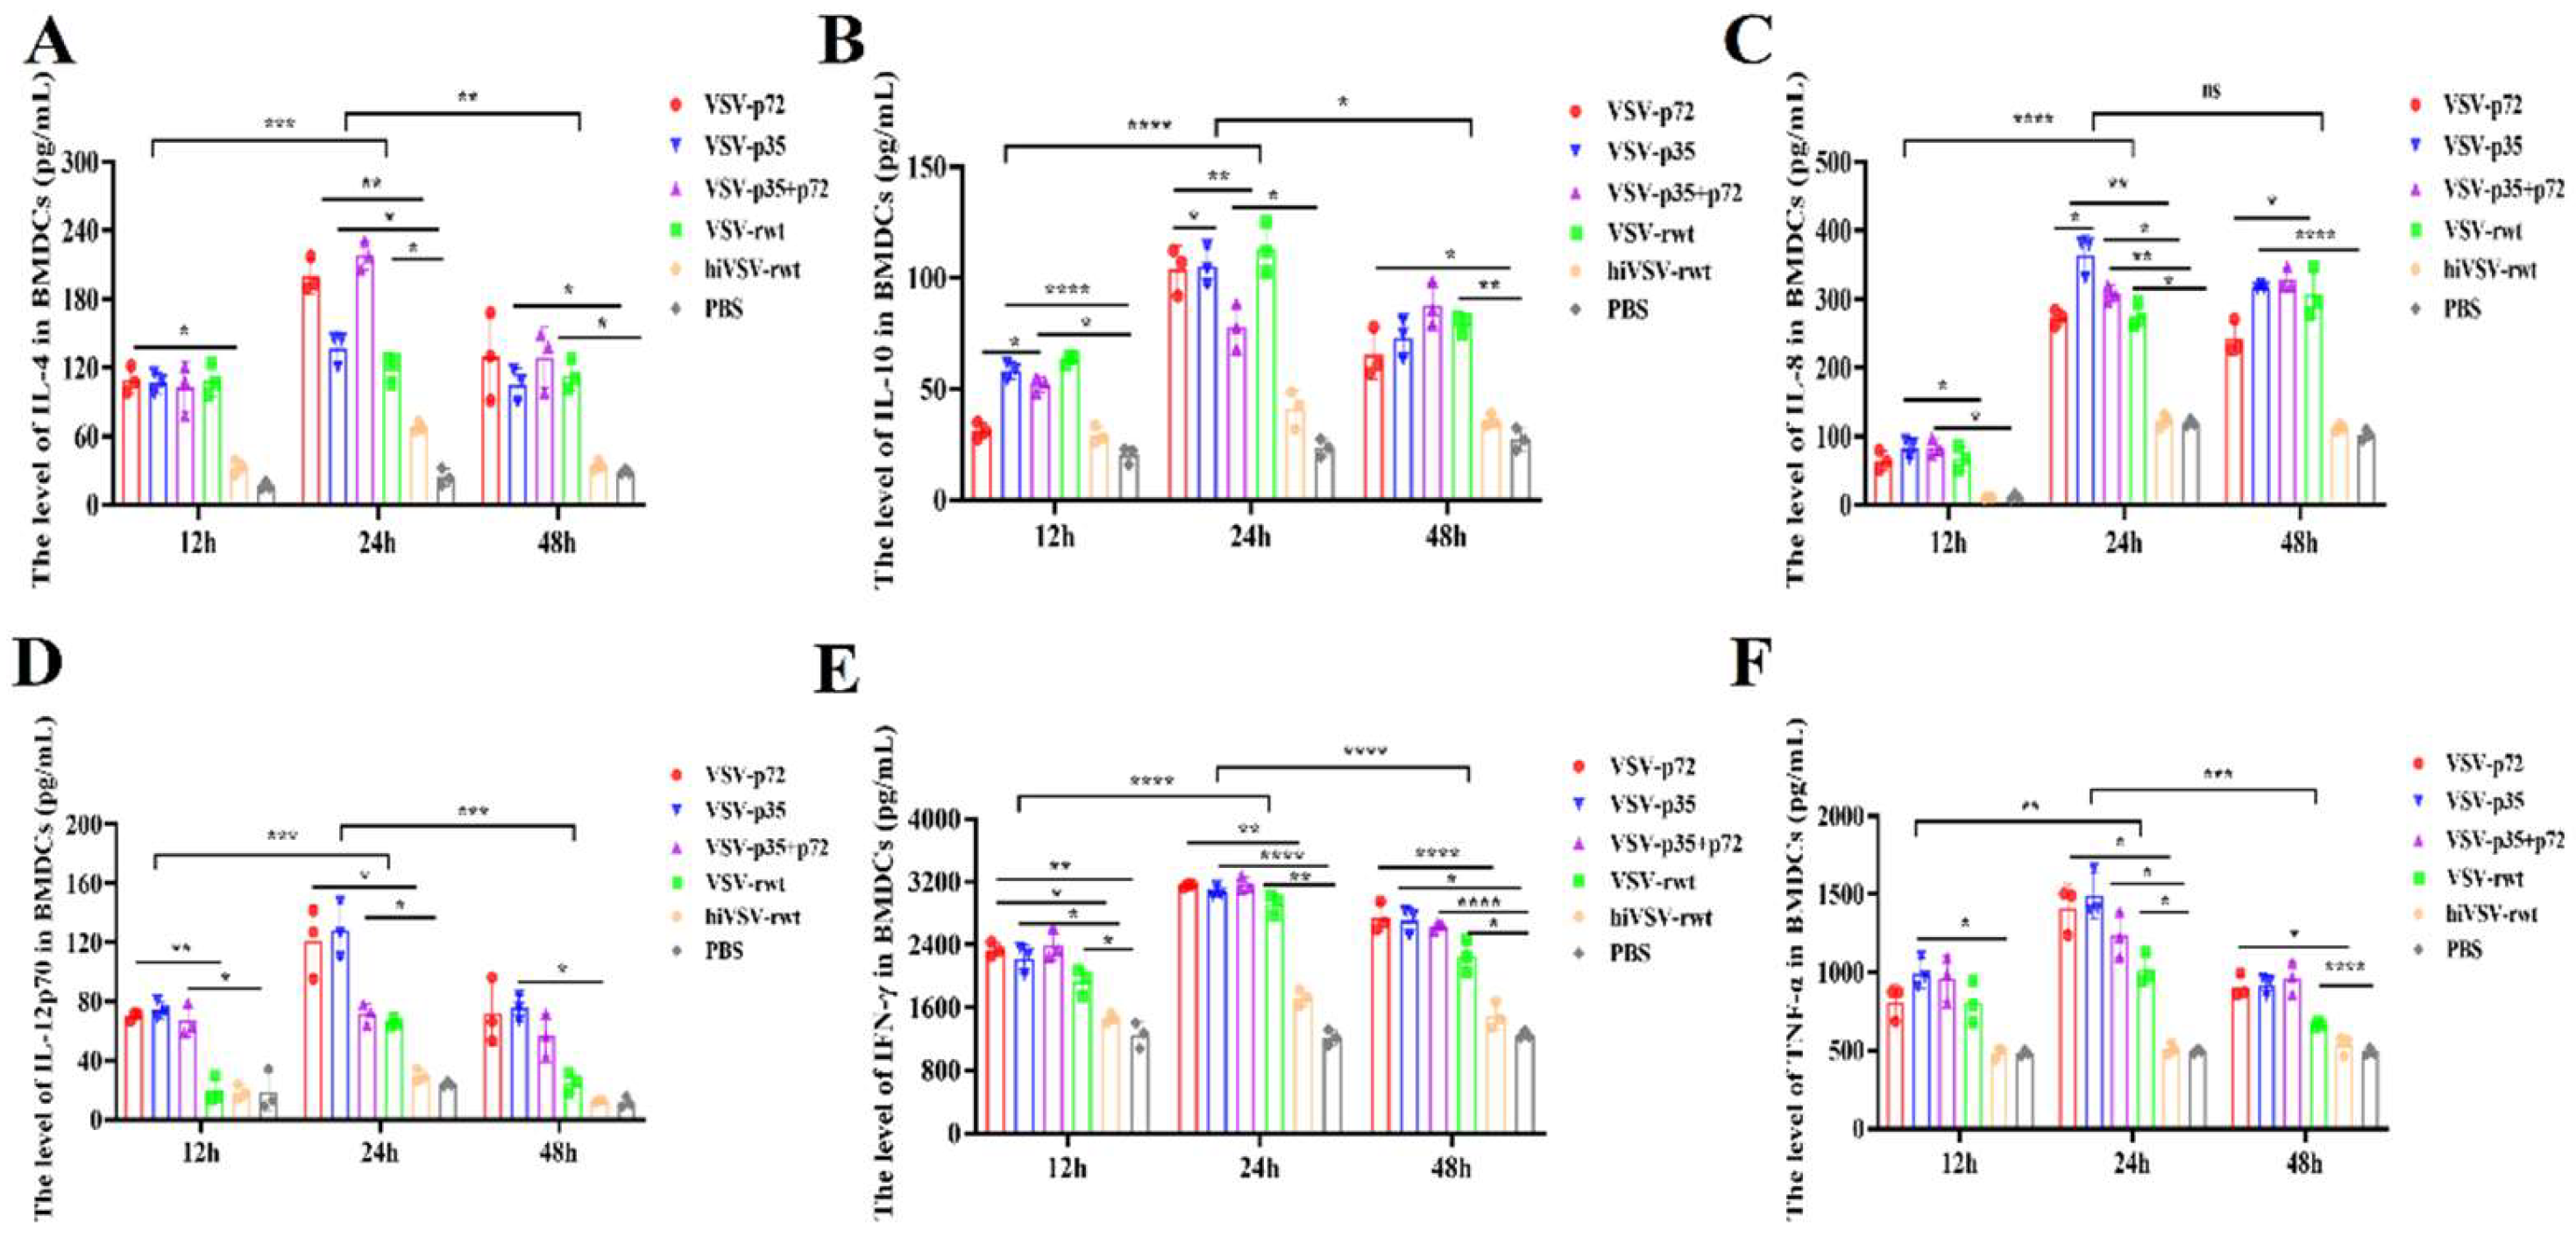
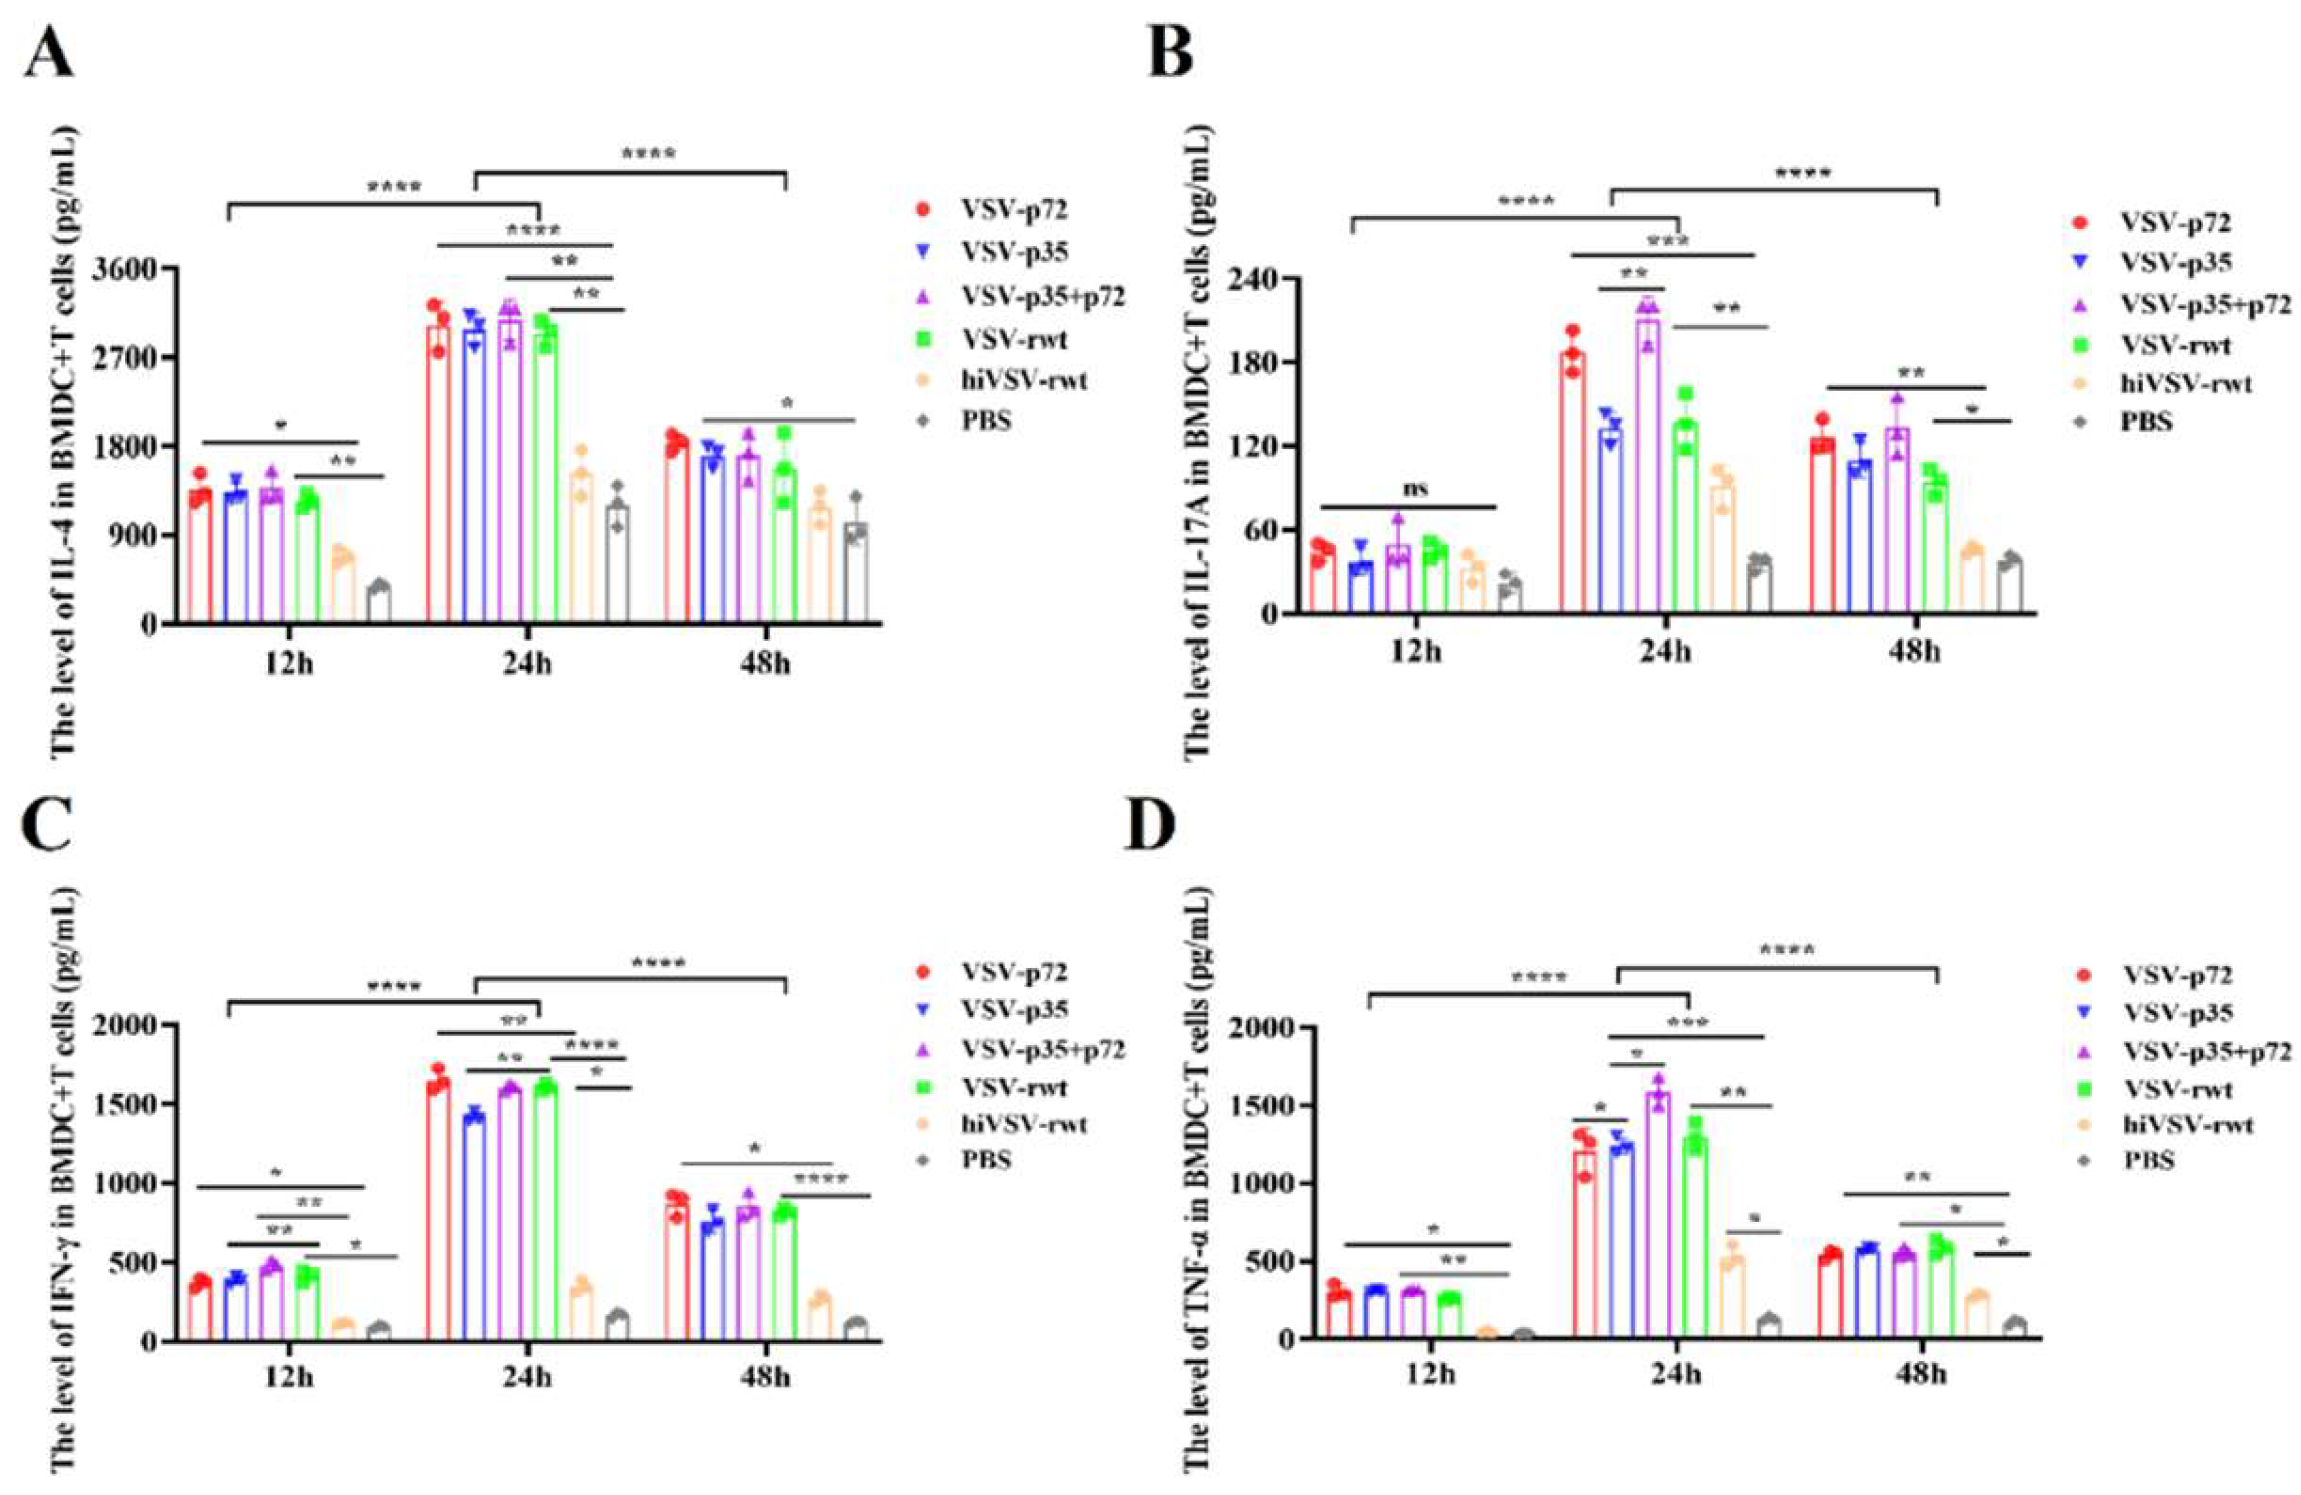
30]. The monocytes were isolated from mouse bone marrow and induced DCs by added RPMI 1640 medium containing recombinant proteins rmGM-CSF and rmIL-4 for 7 d. The results showed that cells began to cluster, grew semi adherent to the wall, and extended into the surrounding areas with spike like protrusions. The typical dendritic irregular shape was observed and DCs purity could reach at 79.44%, which was satisfied with the requirements of subsequent experiments. Recombinant VSV strain, as an ideal vaccine vector, can induce a comprehensive and efficient immune response in host and exhibit higher expression in most cell lines. Therefore, the recombinant viruses (VSV-p72, VSV-p35, and VSV-p35+p72) were used to infect DCs and explore the effects of recombinant VSV live vector viruses on inducing DCs functional changes, such as maturation, antigen presentation, and T cell polarization. The results found that recombinant viruses can infect DCs and up-regulated the expression of surface marker molecules CD40, CD80, CD86, and MHC-Ⅱ to induce DCs phenotype maturation in this study. In addition, cytokines were crucial to activate and maintain the function of effector cells [
31]. Our study found that the secretion of cytokines such as IFN-γ, IL-12p70, TNF-α in DCs treated with recombinant viruses increased significantly compared to the control groups, which indicated that the recombinant viruses promoted the secretion of cytokines, lymphocyte proliferation and activation, and further promoted the maturation of DCs function. Previous research revealed that the surface of DCs expressed the receptor molecule CCR7 related to migration. DCs with high expression of CCR7 receptors can sense the ligand chemotactic factor CCL19 secretion by draining lymph nodes and then migrated towards nearby draining lymph nodes [
32]. The microenvironment of DCs migrating to lymph nodes was simulated and found that the recombinant viruses promoted DCs migrate to subventricular space. Mature DCs migrated to nearby lymph nodes to present antigens to CD4+Th cells and guided activation and differentiation, thereby initiating an adaptive immune response. These results were consistent with previous research that the expression of surface molecules and the secretion of cytokines and chemokines increased simultaneously [
33].
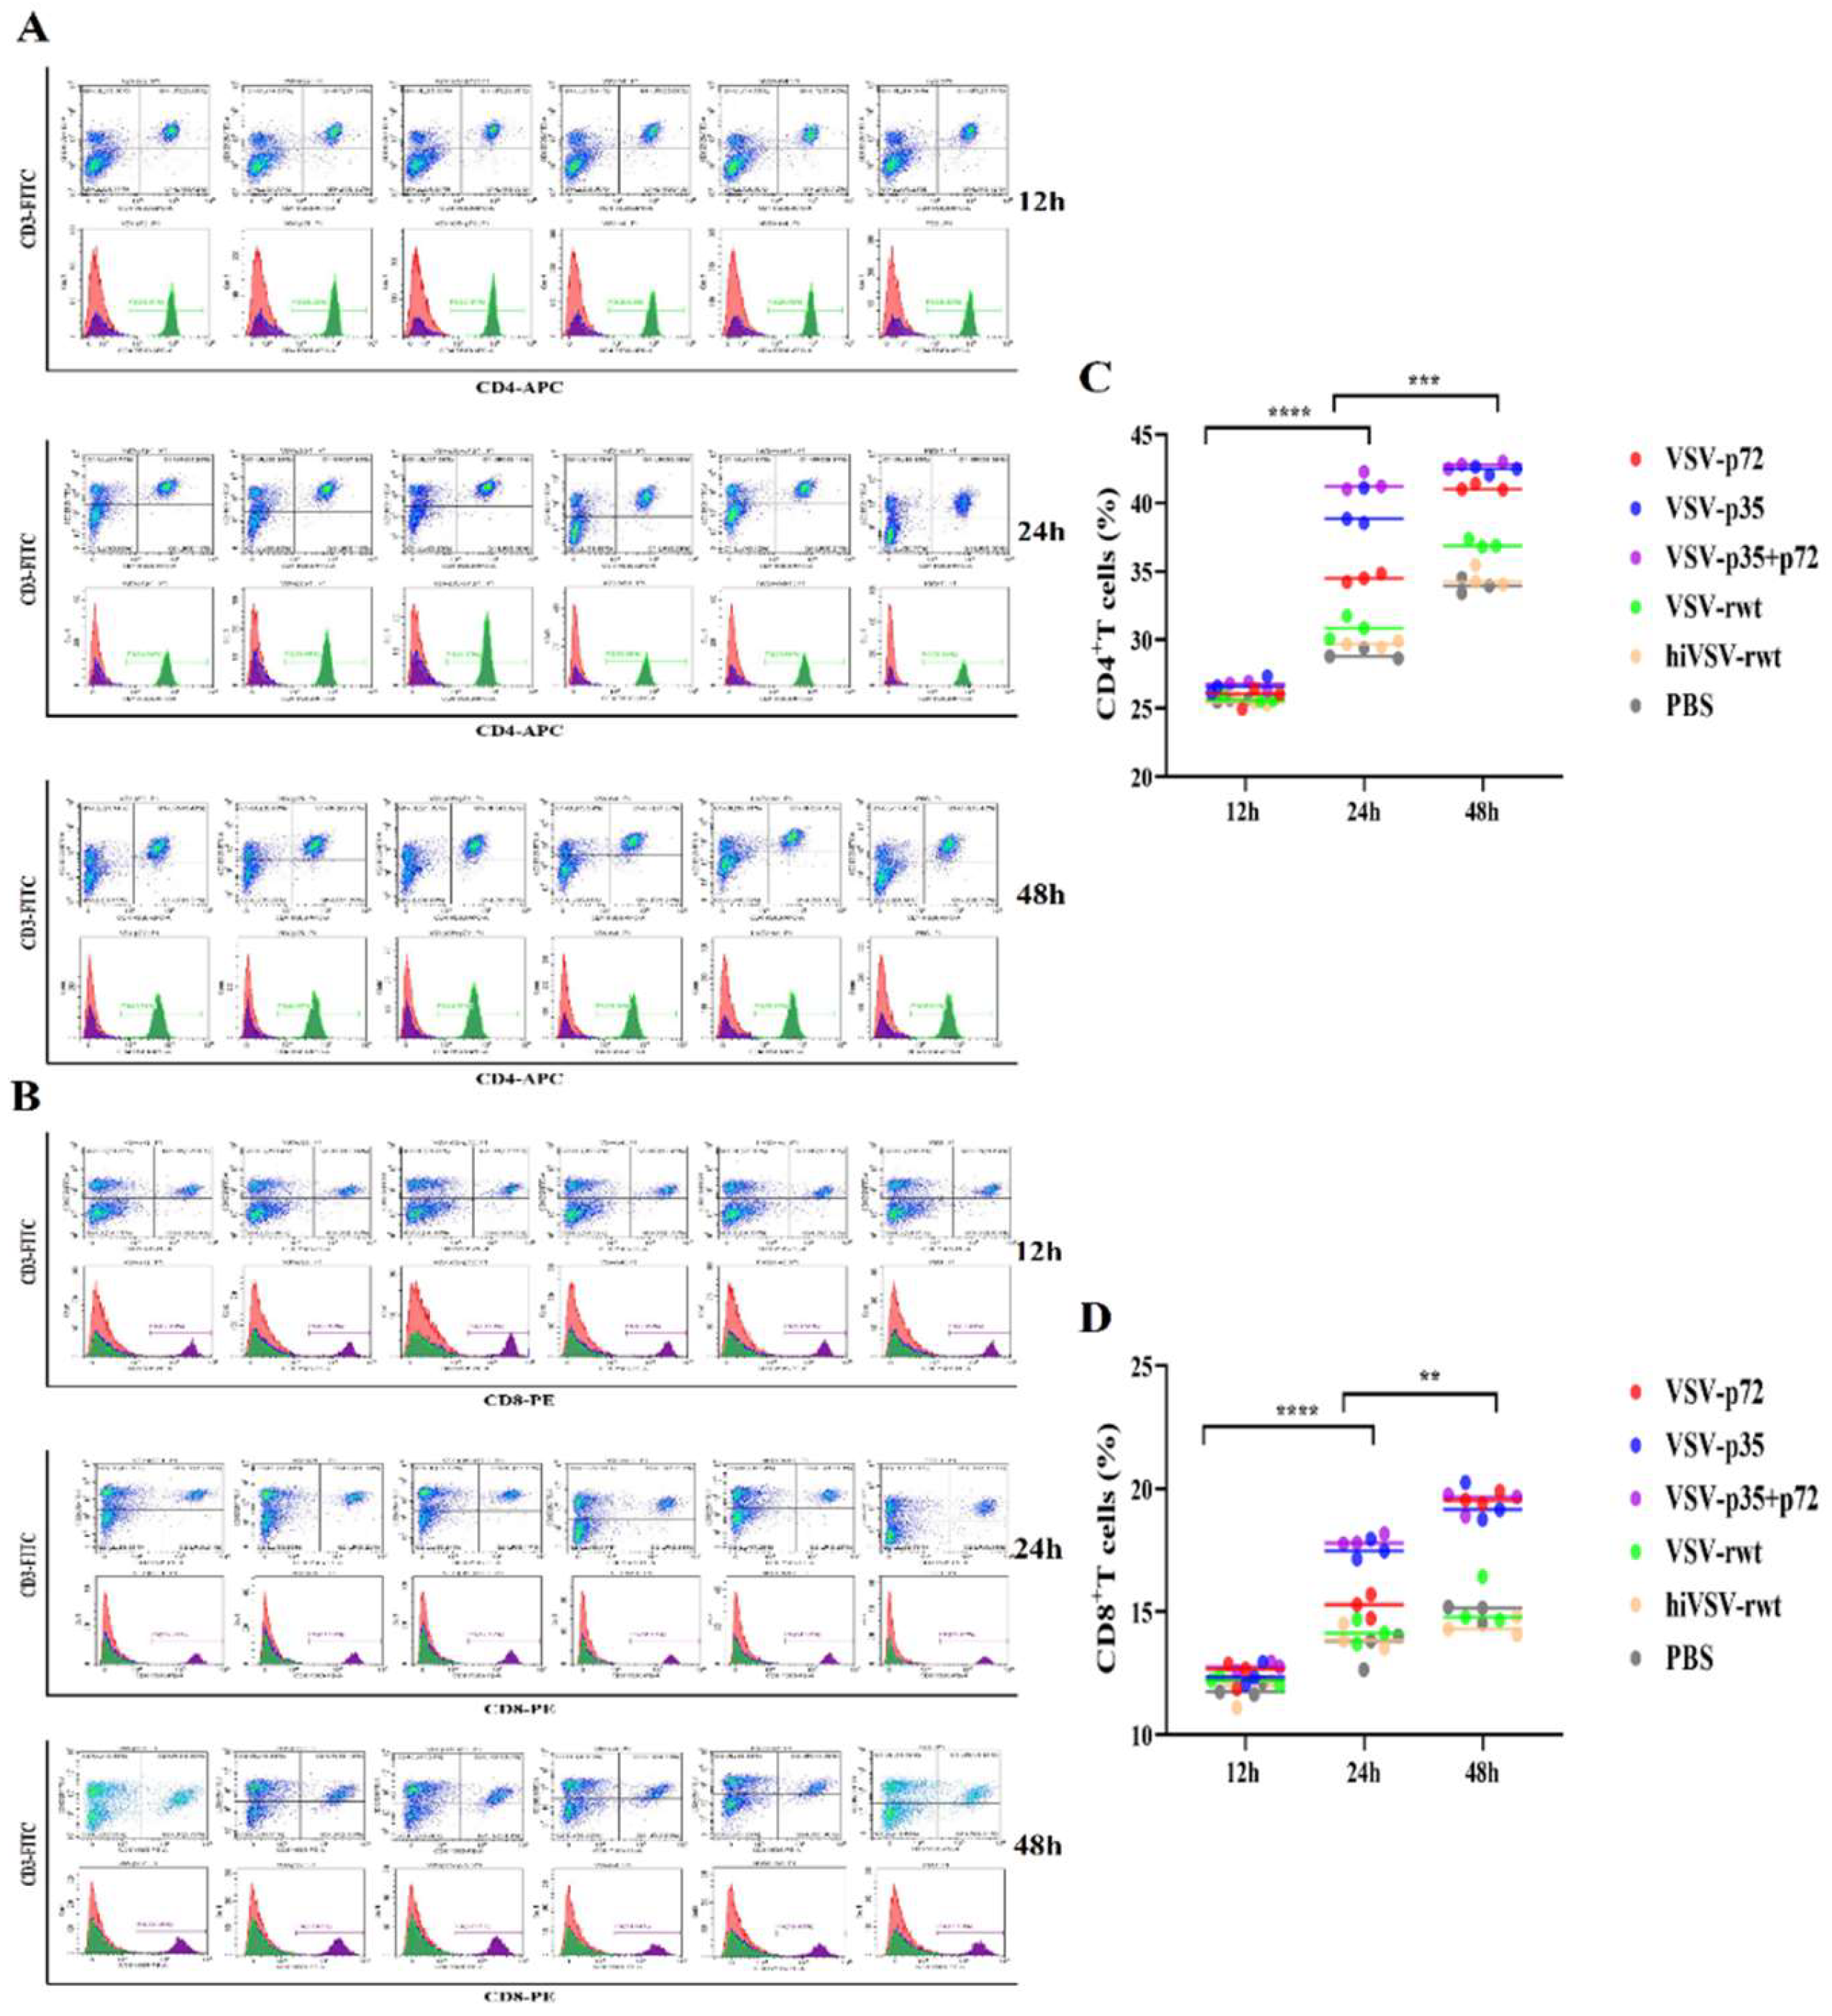
CD4
+T cell is the main surface marker that belongs to helper T cells, which can activate other types of immune cells to produce direct immune responses. When the proportion of CD4
+T cells increased, the host can quickly activate the immune response to resist pathogens once the invasion of pathogenic microorganisms was received. The proportion of CD4
+T cells gradually increased after being treated DCs with the recombinant viruses from 12 h to 48 h, indicated that the recombinant viruses activated other effector cells to participate in host immune responses. CD8
+T cell is the primary surface marker of cytotoxic T cells. The proportion of CD8
+T cells was lower than CD4
+T cells, confirmed that the ability to resist pathogens invasion on host decreased with the proliferation of virus infection. Furthermore, the immune responses were induced efficiently, which further indicated that the DCs infected with recombinant viruses activated the initial T cells. In the subtypes of T cells differentiation, Th1 cells mainly secreted IFN-γ to activate effector cells and promoted the clearance of pathogens. Th2 cells secreted IL-4 and IL-10 to inhibit the activation of phagocytes and the development function of Th1 cells [
34]. Th17 cells mainly secreted IL-17A and IL-22 to promote neutrophil aggregation, mediate inflammatory responses, and have regulatory effects on both immune and nonimmune cells [
35]. Treg cells, as a subset of CD4
+T lymphocytes that play an important role in inhibiting effector T lymphocytes and IL-10 and TGF-β, thereby inducing immune tolerance and regulating immune homeostasis on host [
36,
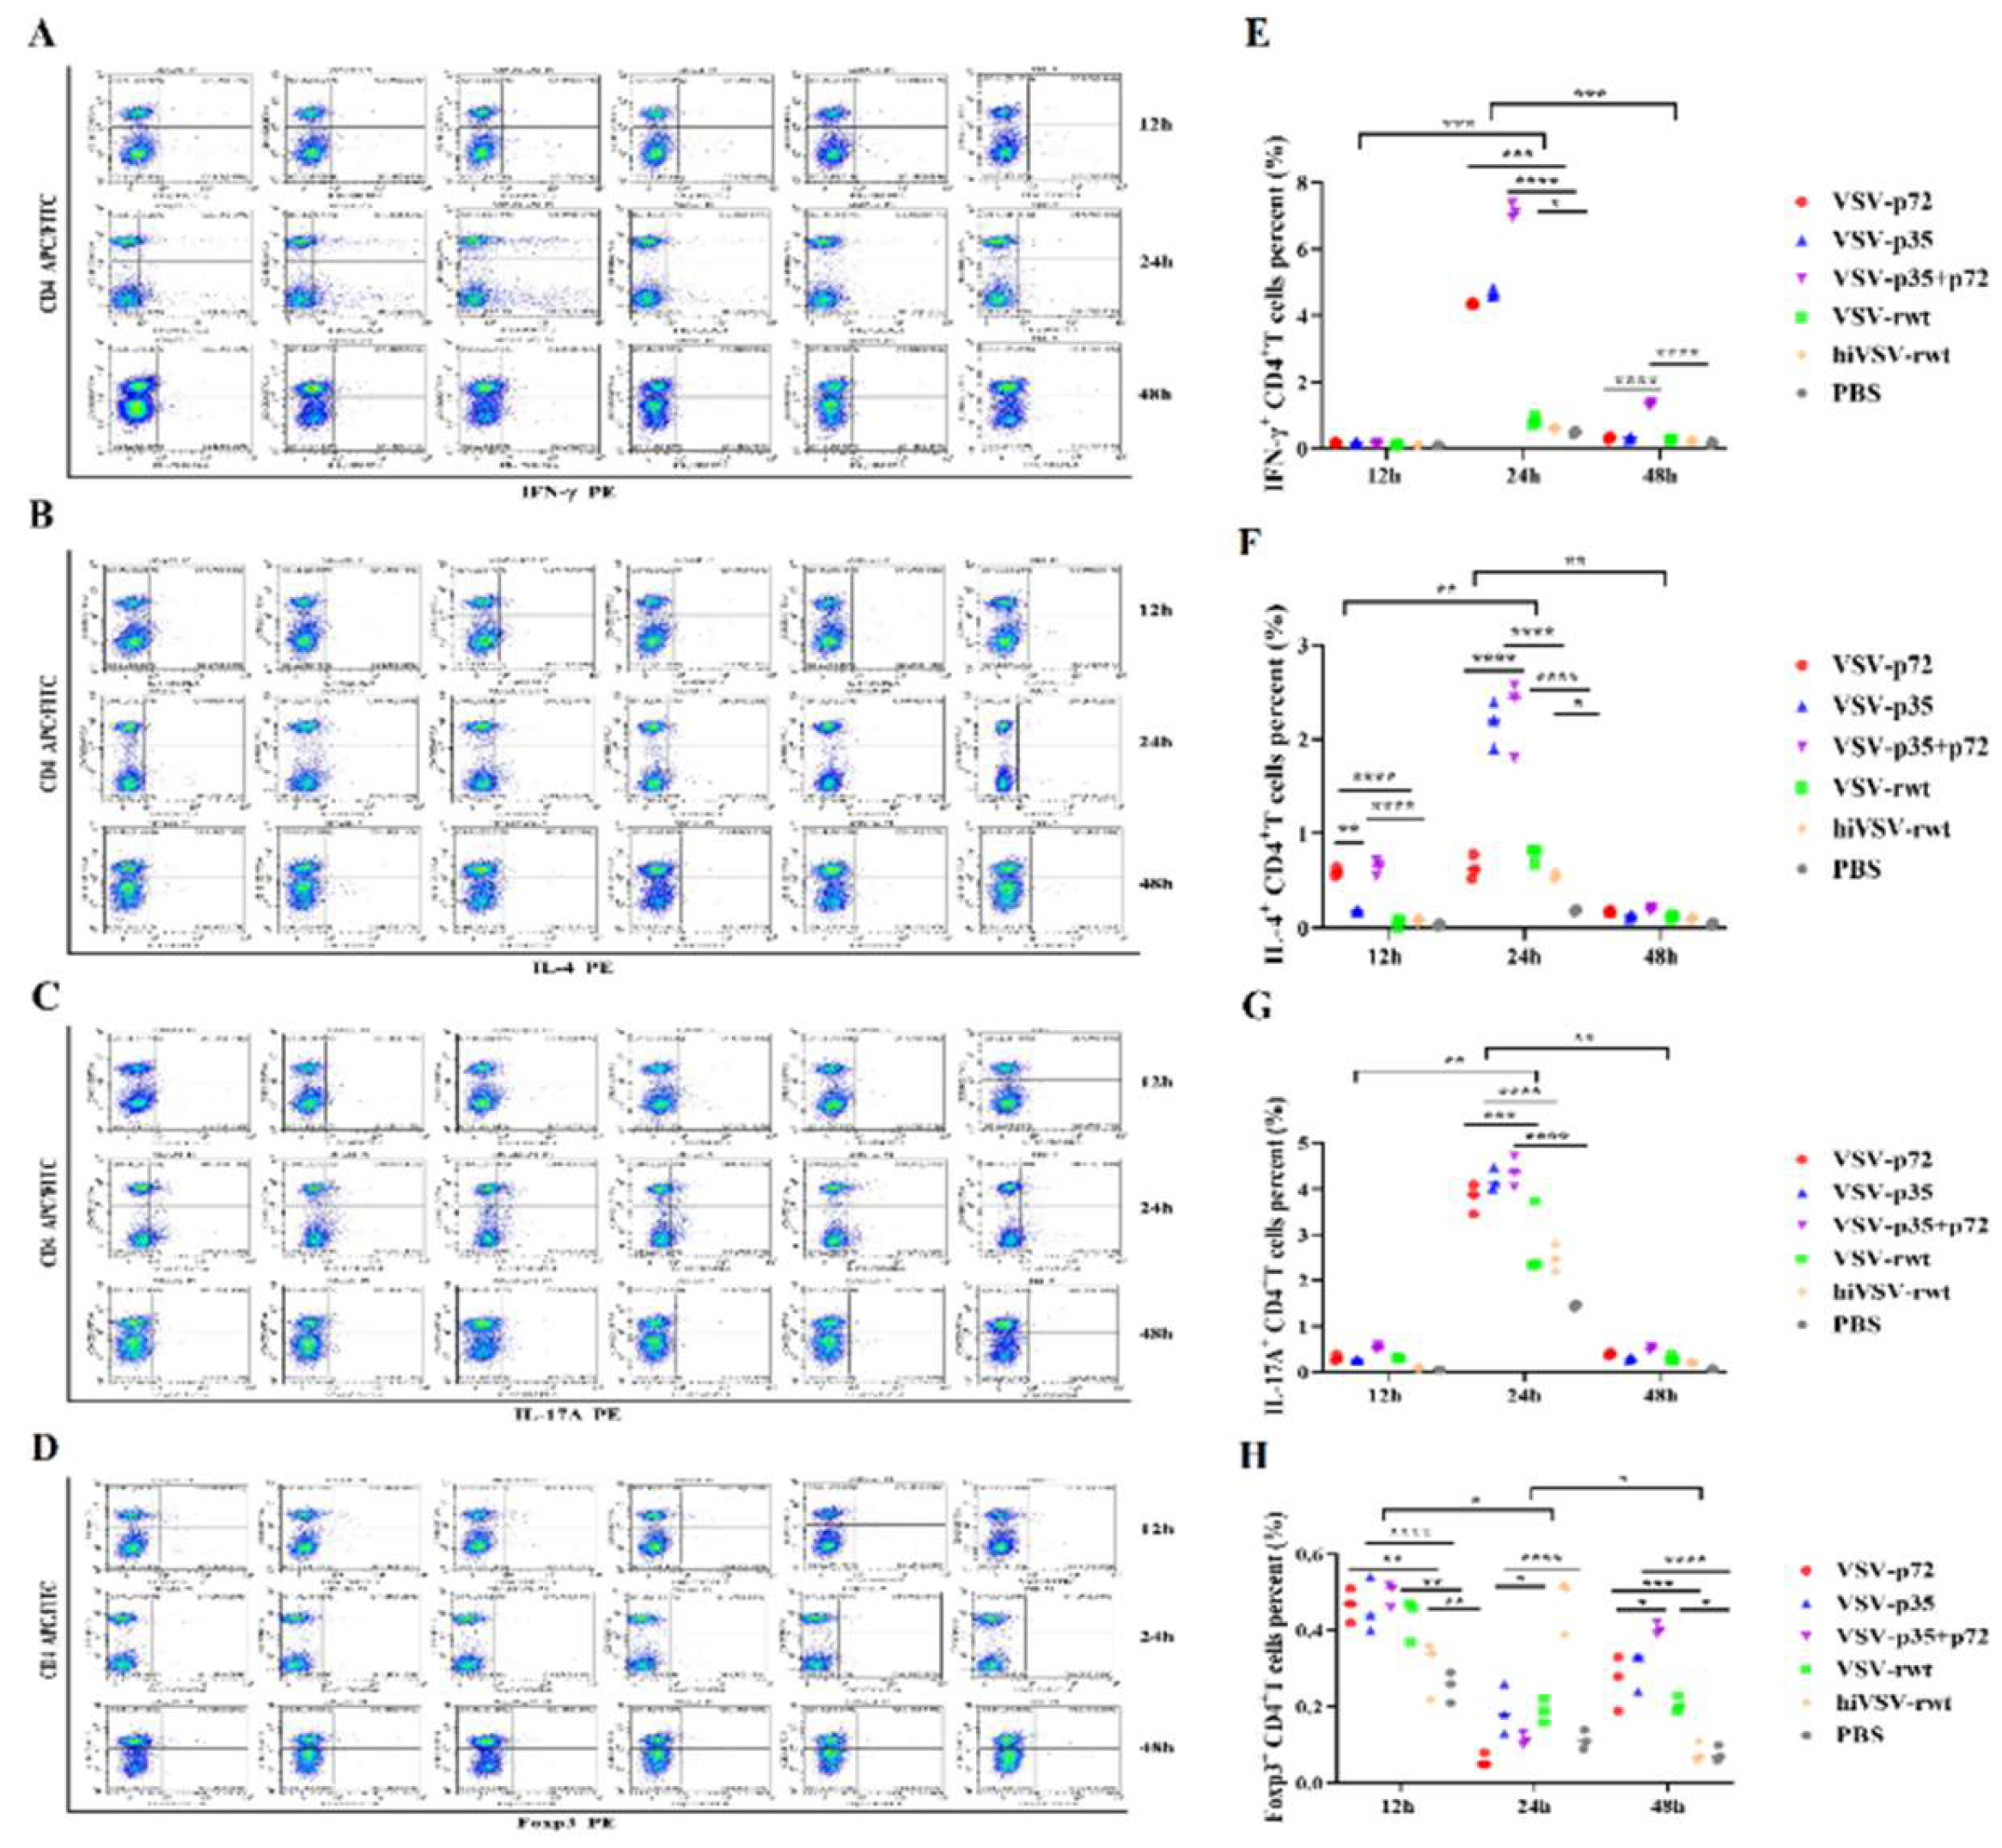
37]. The effects of recombinant viruses on the expression of cytokines and transcription factors secreted by CD4
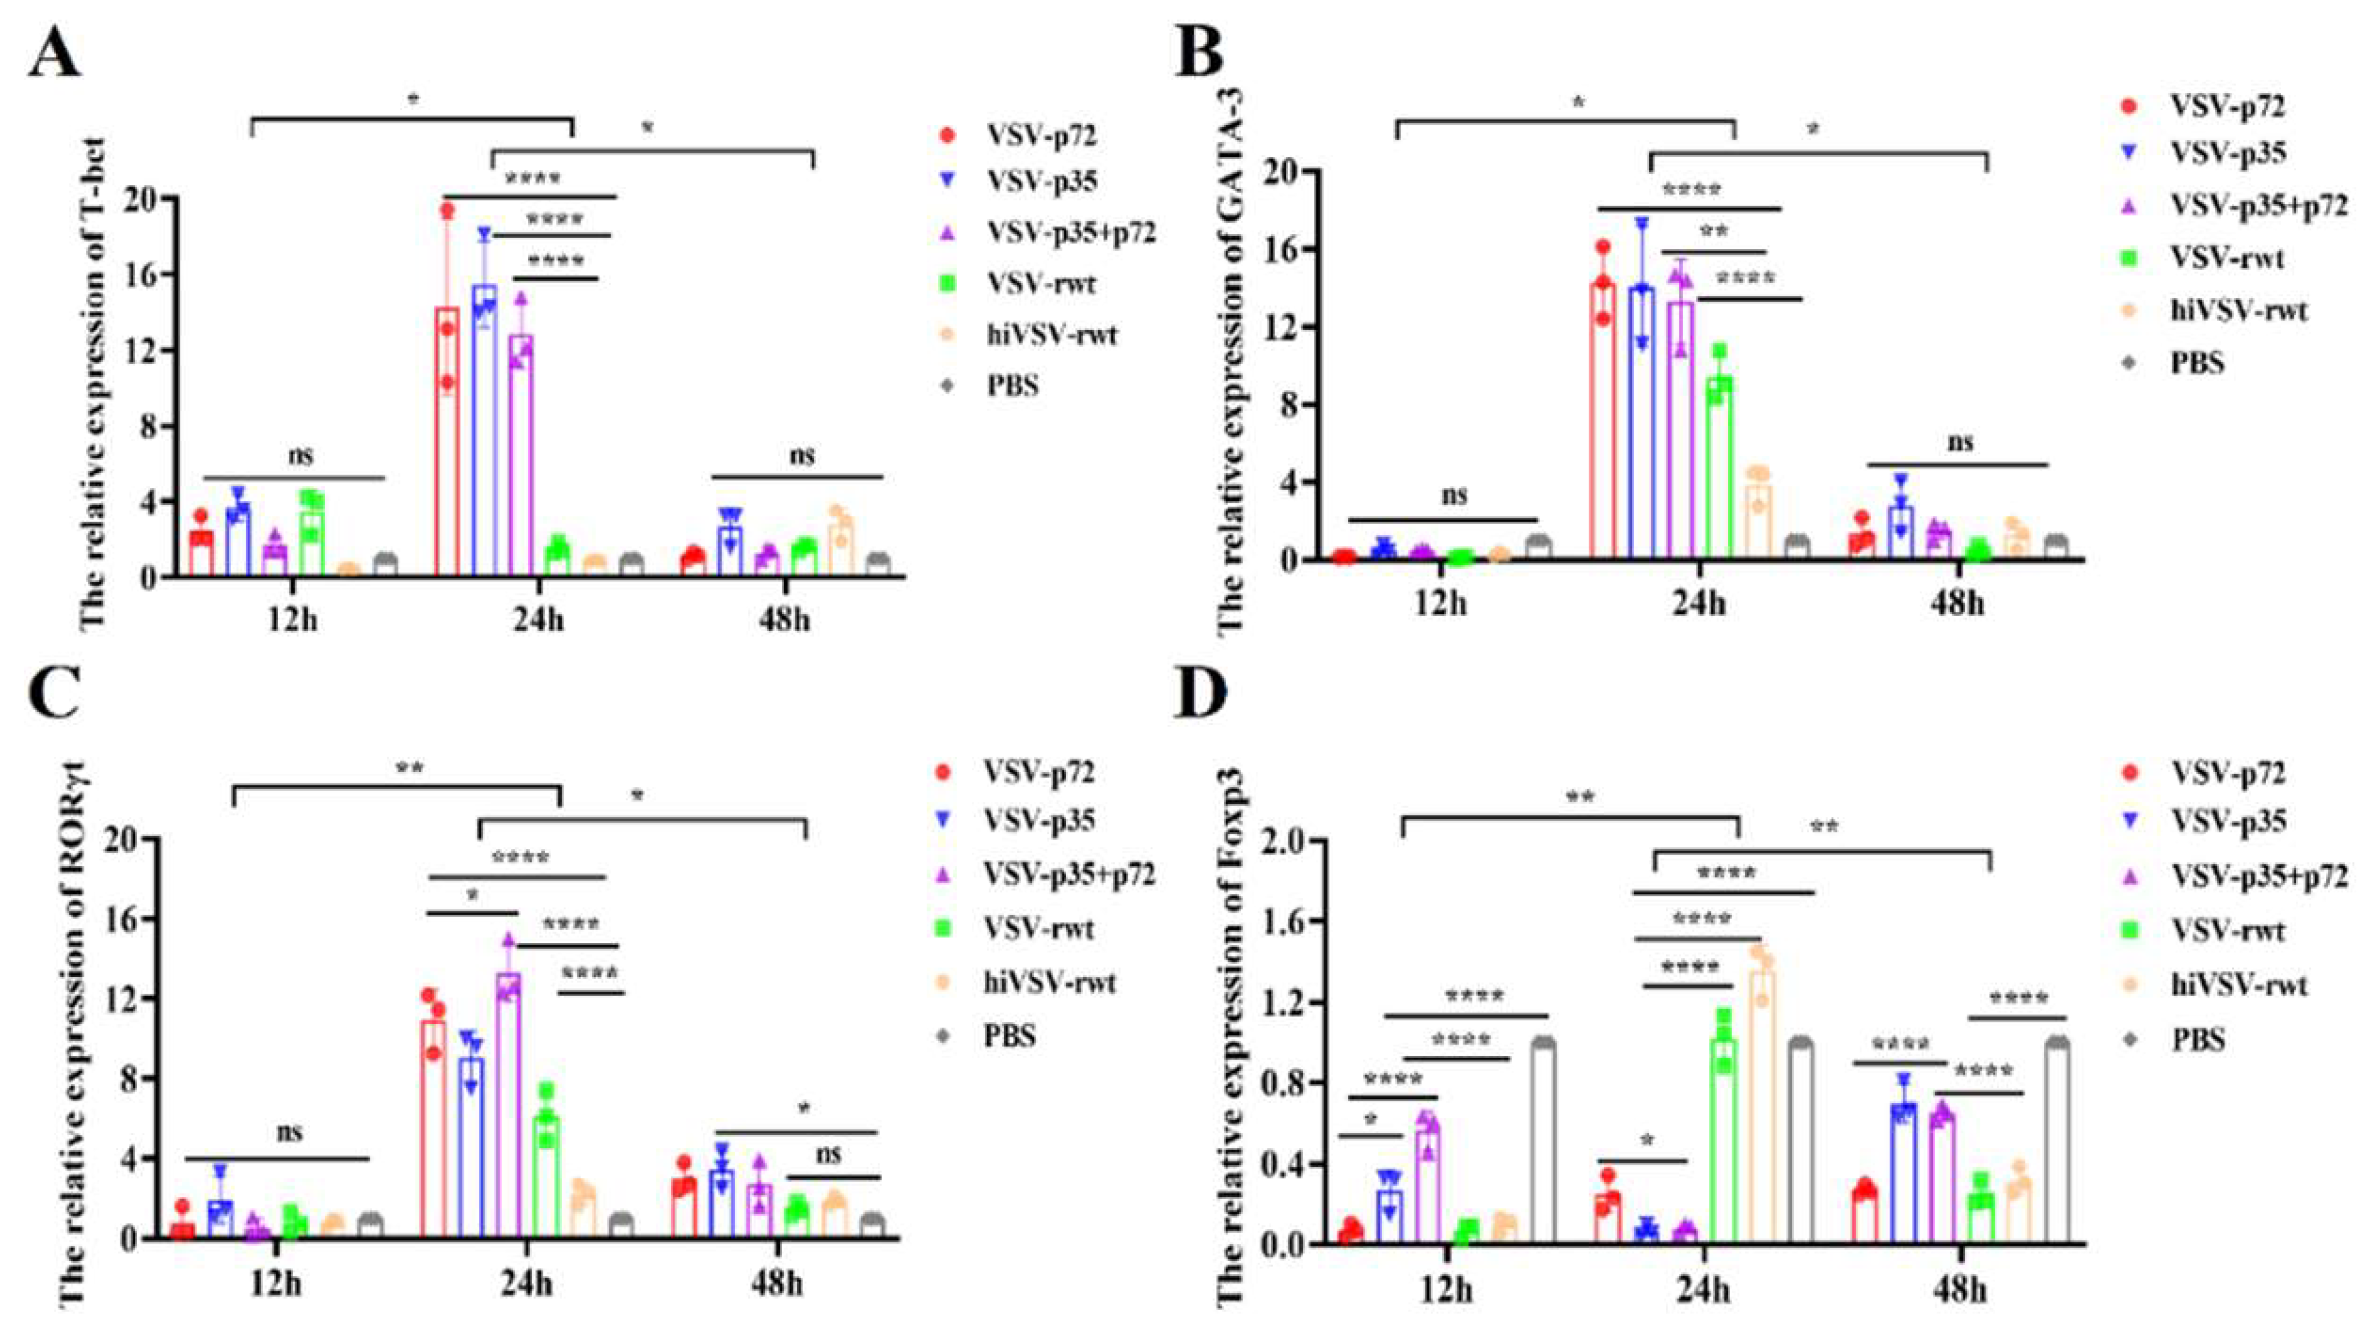
+Th cells were analyzed. The results showed that recombinant viruses stimulation significantly up-regulated the proportion of IL-4, IL-17A, IFN-γ and Th1 and Th17 cells, reduced the proportion of Foxp3 cells. The mRNA expression trend of transcription factors was consistent with the results from previous study about the proportion of Th1 and Th17 cells. The recombinant virus infection effectively activated and differentiated CD4
+Th cells, and induced powerful immune response. The expression of IL-4 secreted by Th2 cells was also up-regulated, but the up-regulation was relatively small, which may be supported by that the cytokines secreted by DCs can guide the direction of T cell subtypes differentiation in the TCRs mediated T cell activation process.
Figure 1.
Isolation and identification of BMDCs. (A) The morphologies of DCs induced from mouse bone marrow-derived monocytes in vitro under the microscope. (B, C) The expression level of surface factor CD11c of cultured DCs by flow cytometry for 7 d.
Figure 1.
Isolation and identification of BMDCs. (A) The morphologies of DCs induced from mouse bone marrow-derived monocytes in vitro under the microscope. (B, C) The expression level of surface factor CD11c of cultured DCs by flow cytometry for 7 d.
Figure 2.
Recombinant virus replication in DCs. (A) The virus copies were detected of DCs infected with 0.1MOI and 1MOI recombinant viruses by RT-qPCR assay. (B) The virus copies were detected of DCs infected with recombinant viruses for 12h, 24h, and 48h by RT-qPCR assay. (C) The expression of VSV G protein in DCs infected with recombinant viruses for 24 h.
Figure 3.
Phenotypic changes in infected DCs. (A-D) Representative dot plots depicted the percentages of surface maturation markers CD40, CD80, CD86 and MHC-Ⅱ in DCs treated with recombinant viruses (MOI = 0.1) for 24 h, respectively. (E-H) Histograms showed the percentages of surface maturation markers CD40, CD80, CD86 and MHC-Ⅱ in DCs from the different groups after being treated recombinant viruses (MOI = 0.1) at 24 h, respectively. The results were shown as the mean ± SD from three replicates of per group. *p < 0.05, **p < 0.01, ***p < 0.001, ****p < 0.0001, ns: not significant.
Figure 4.
The cytokine secretion in infected DCs. (A-F) The secretion levels of IL-4, IL-10, IL-8, IL-12p70, IFN-γ, and TNF-α in DCs treated with recombinant viruses (MOI = 0.1) for 12 h, 24 h, and 48 h, respectively. The results were shown as the mean ± SD from three replicates of per group. *p < 0.05, **p < 0.01, ***p < 0.001, ****p < 0.0001, ns: not significant.
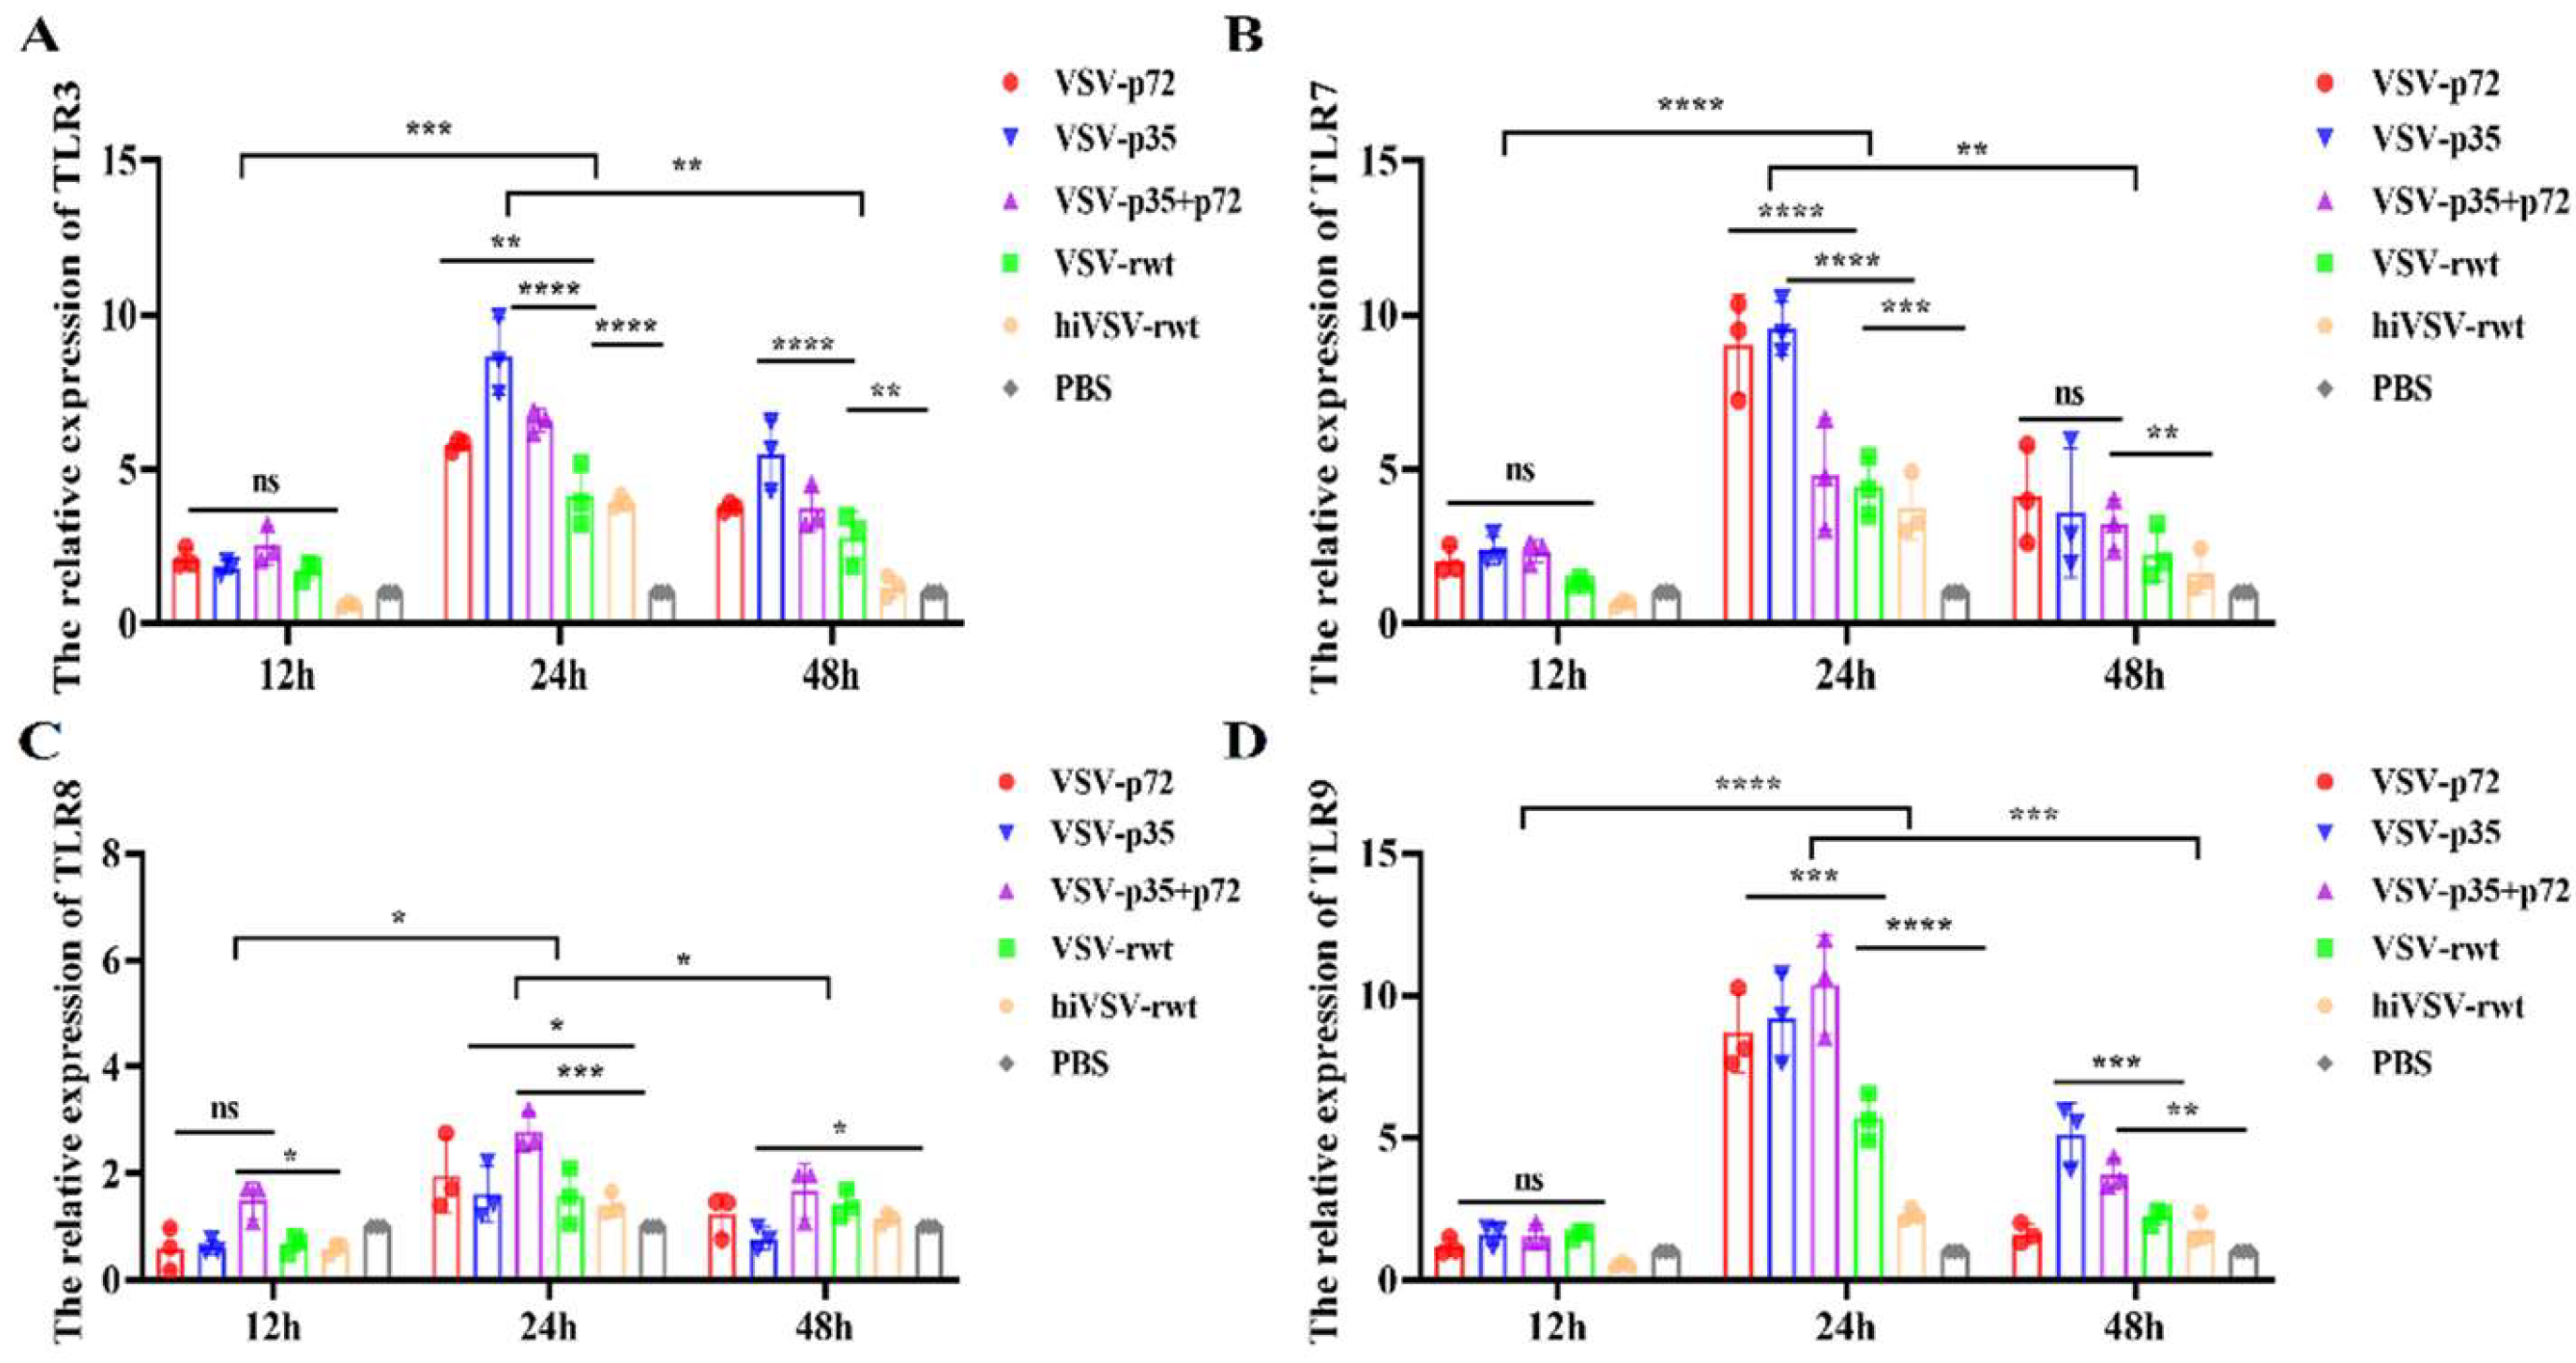
Figure 5.
TLRs expression in DCs infected with recombinant viruses. (A-D) The mRNA expression levels of TLR3, TLR7, TLR8, and TLR9 in DCs infected with recombinant viruses (MOI = 0.1) for 12 h, 24 h, and 48 h, respectively. The results were shown as the mean ± SD from three replicates of per group. *p < 0.05, **p < 0.01, ***p < 0.001, ****p < 0.0001, ns: not significant.
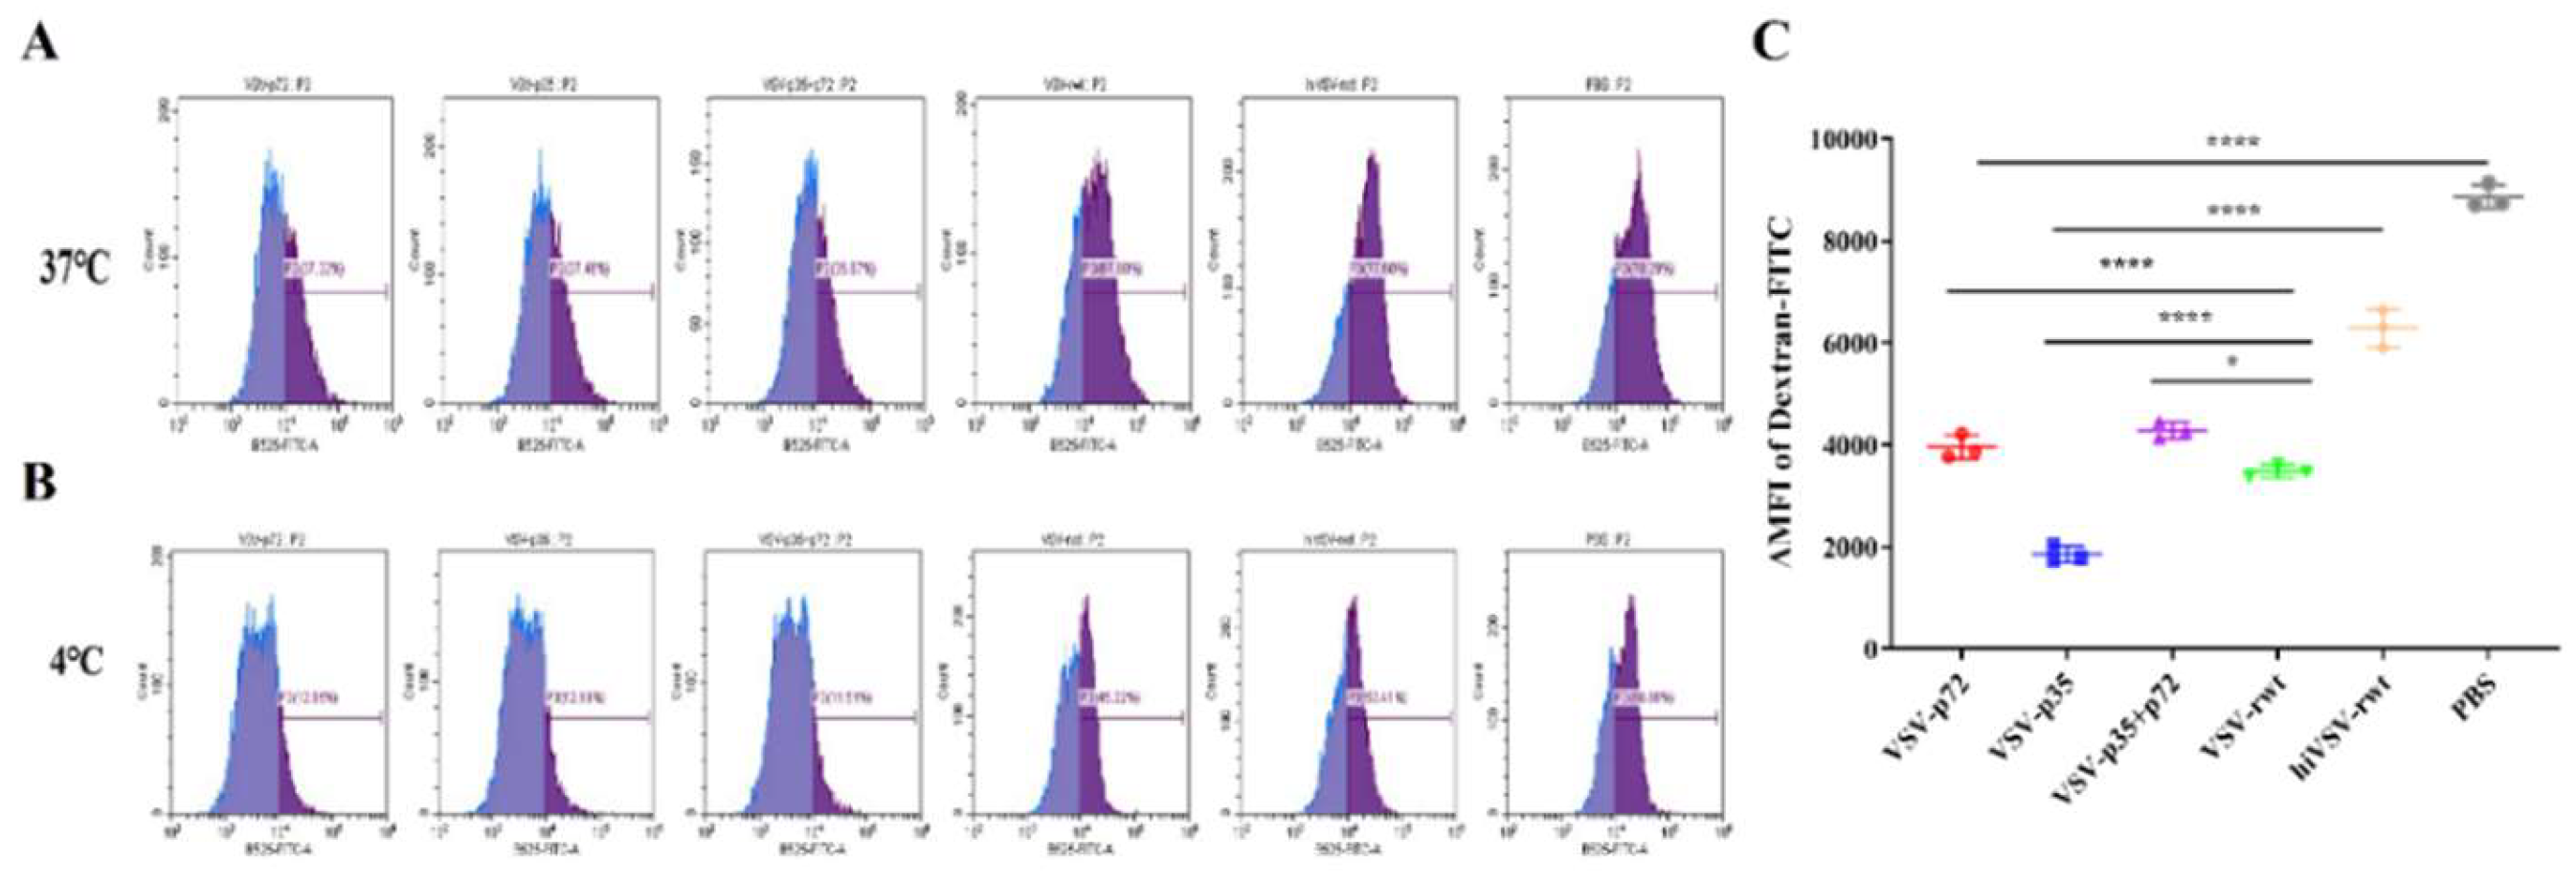
Figure 6.
The phagocytic ability in infected DCs. (A) The proportion of FITC+DCs after being stimulated with recombinant viruses (MOI = 0.1) at 37 ℃ for 24 h. (B) The proportion of FITC+DCs after being stimulated with recombinant viruses (MOI = 0.1) at 4 ℃ for 24 h. (C) The mean fluorescence intensity (△MFI) of Dextran-FITC uptake by DCs. The results were shown as the mean ± SD from three replicates of per group. *p < 0.05, **p < 0.01, ***p < 0.001, ****p < 0.0001, ns: not significant.
Figure 7.
The migration ability in infected DCs. (A) The schematic diagram of the migration of infected DCs in transwell. (B) The proportion of migratory DCs after being stimulated with recombinant viruses (MOI = 0.1) for 24 h. The results were shown as the mean ± SD from three replicates of per group. *p < 0.05, **p < 0.01, ***p < 0.001, ****p < 0.0001, ns: not significant.
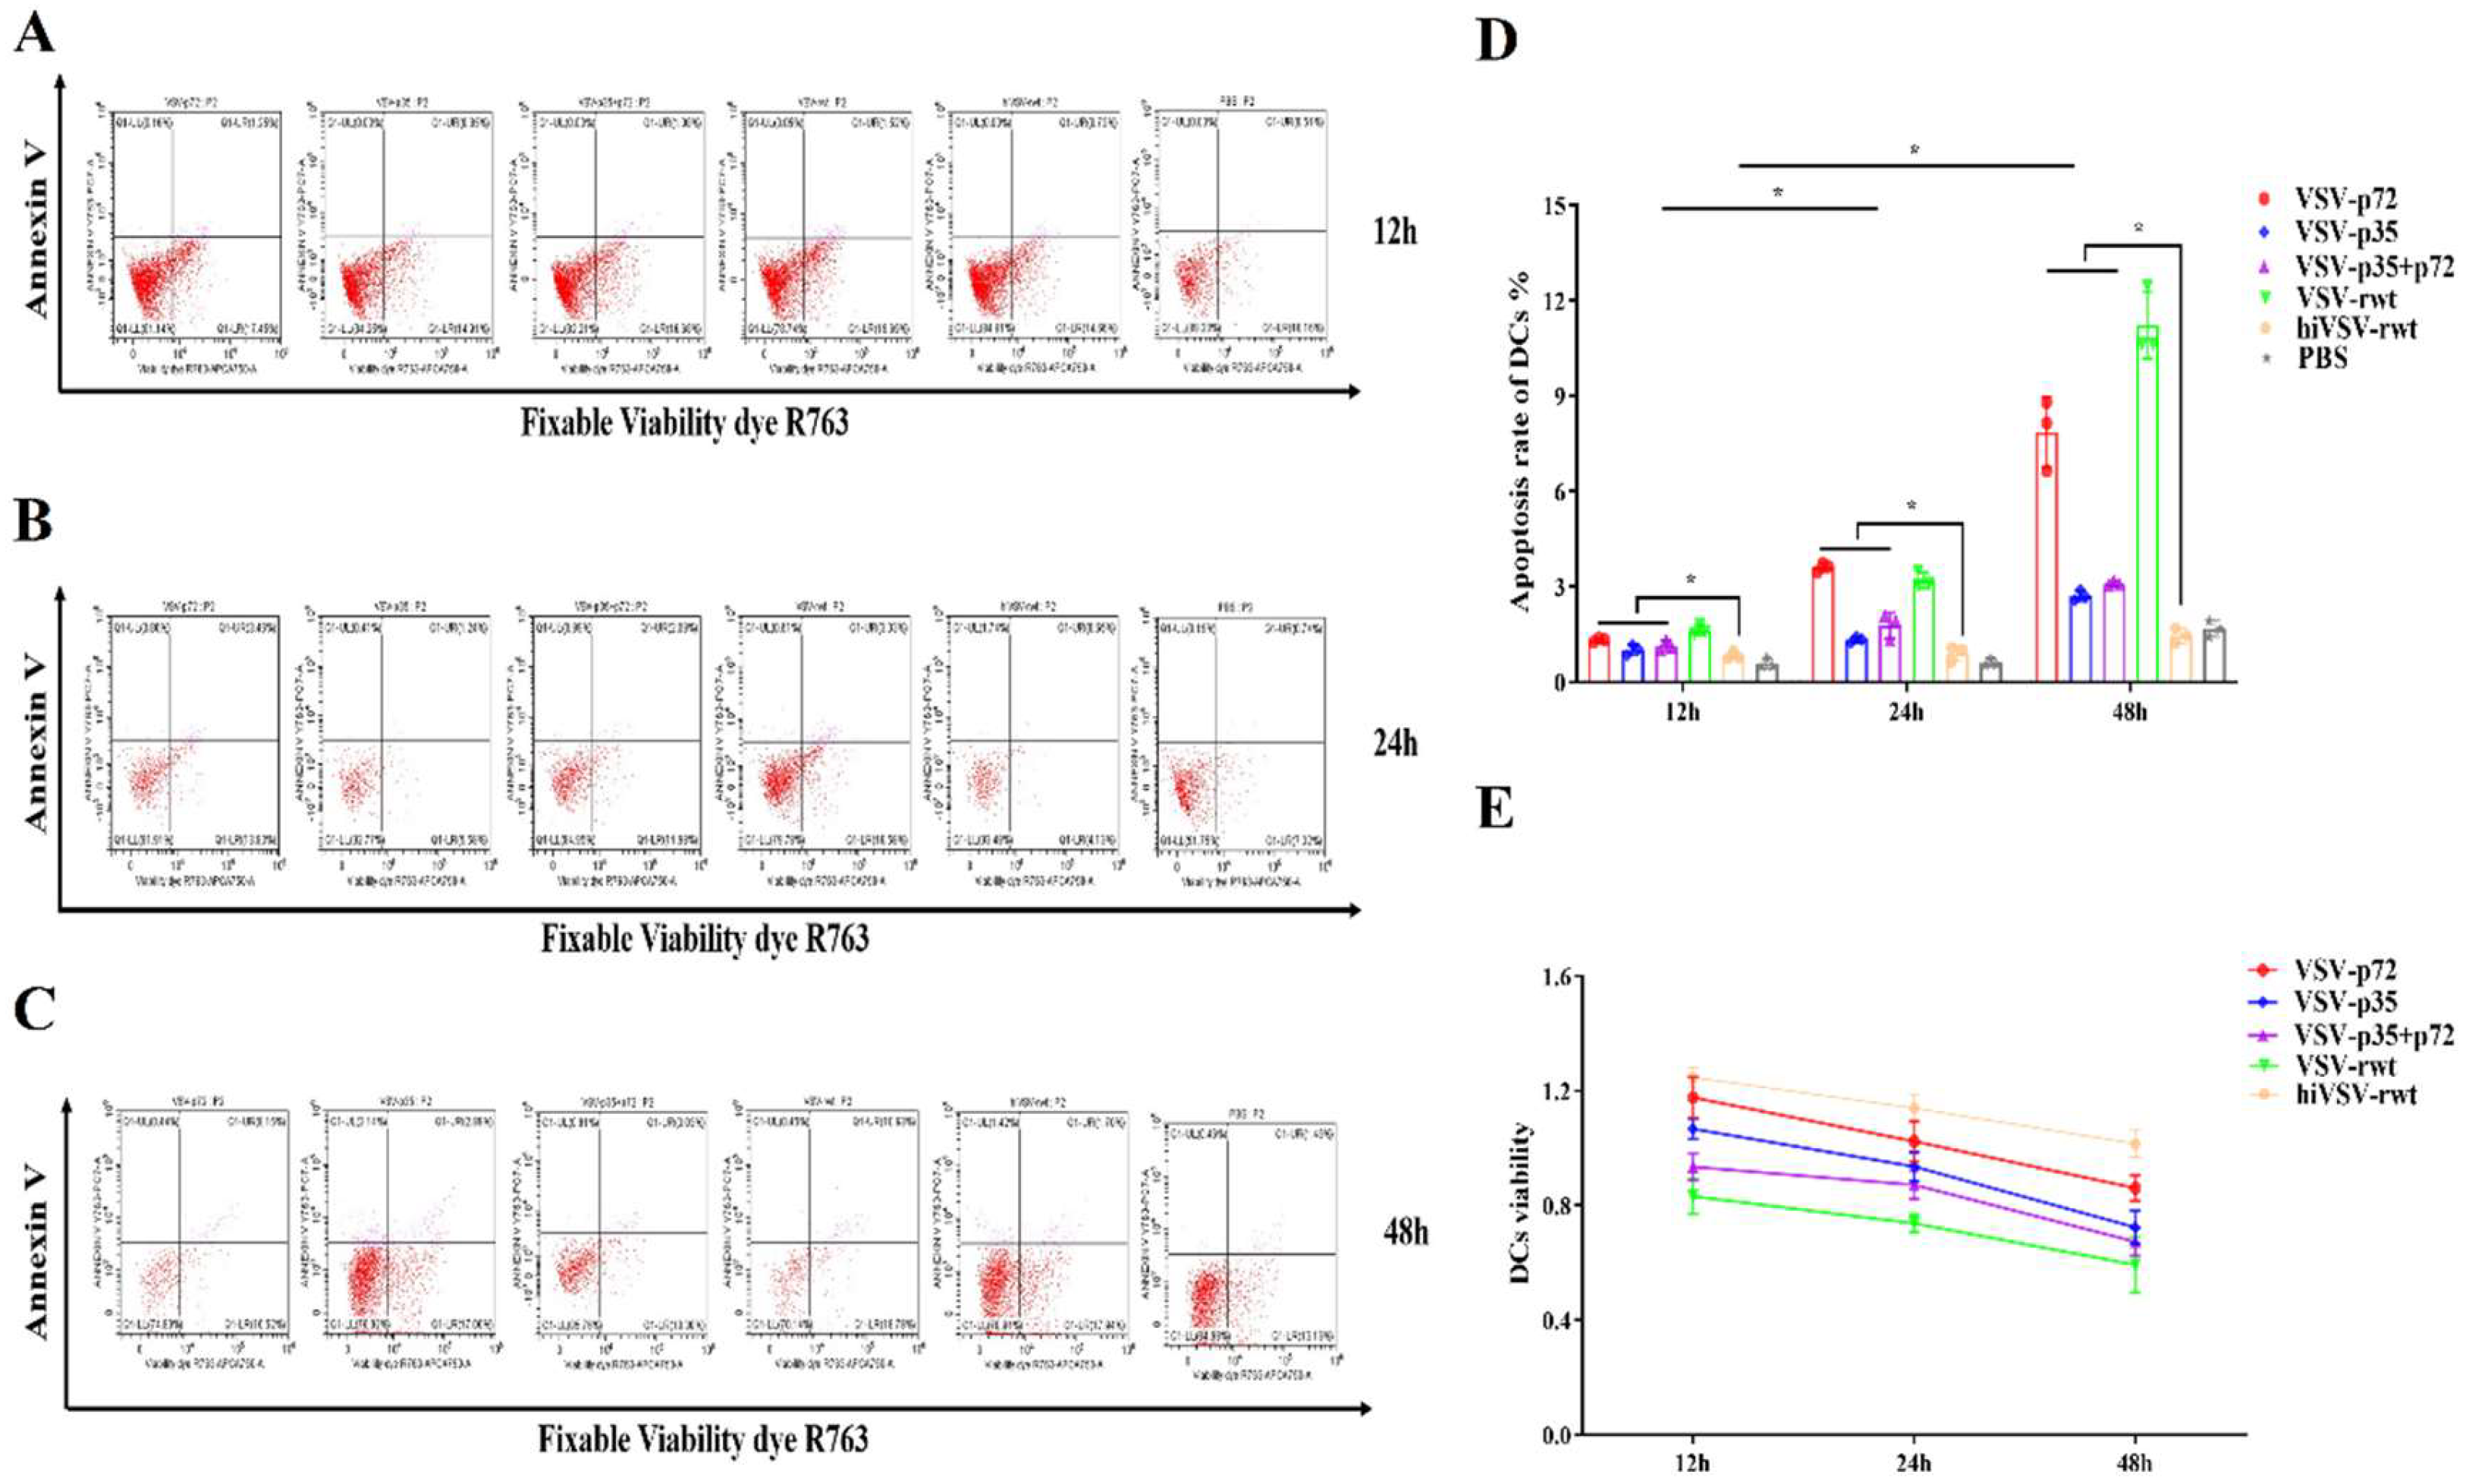
Figure 8.
The apoptosis of DCs infected with recombinant viruses. (A-C) The apoptosis rates of DCs after being stimulated with recombinant viruses (MOI = 0.1) for 12 h, 24 h, and 48 h respectively. (D) Histograms showed statistical analysis of apoptosis rates in treated DCs. (E) Cell viability of DCs after being stimulated with recombinant viruses (MOI = 0.1) for 12 h, 24 h, and 48 h respectively. The results were shown as the mean ± SD from three replicates of per group. *p < 0.05.
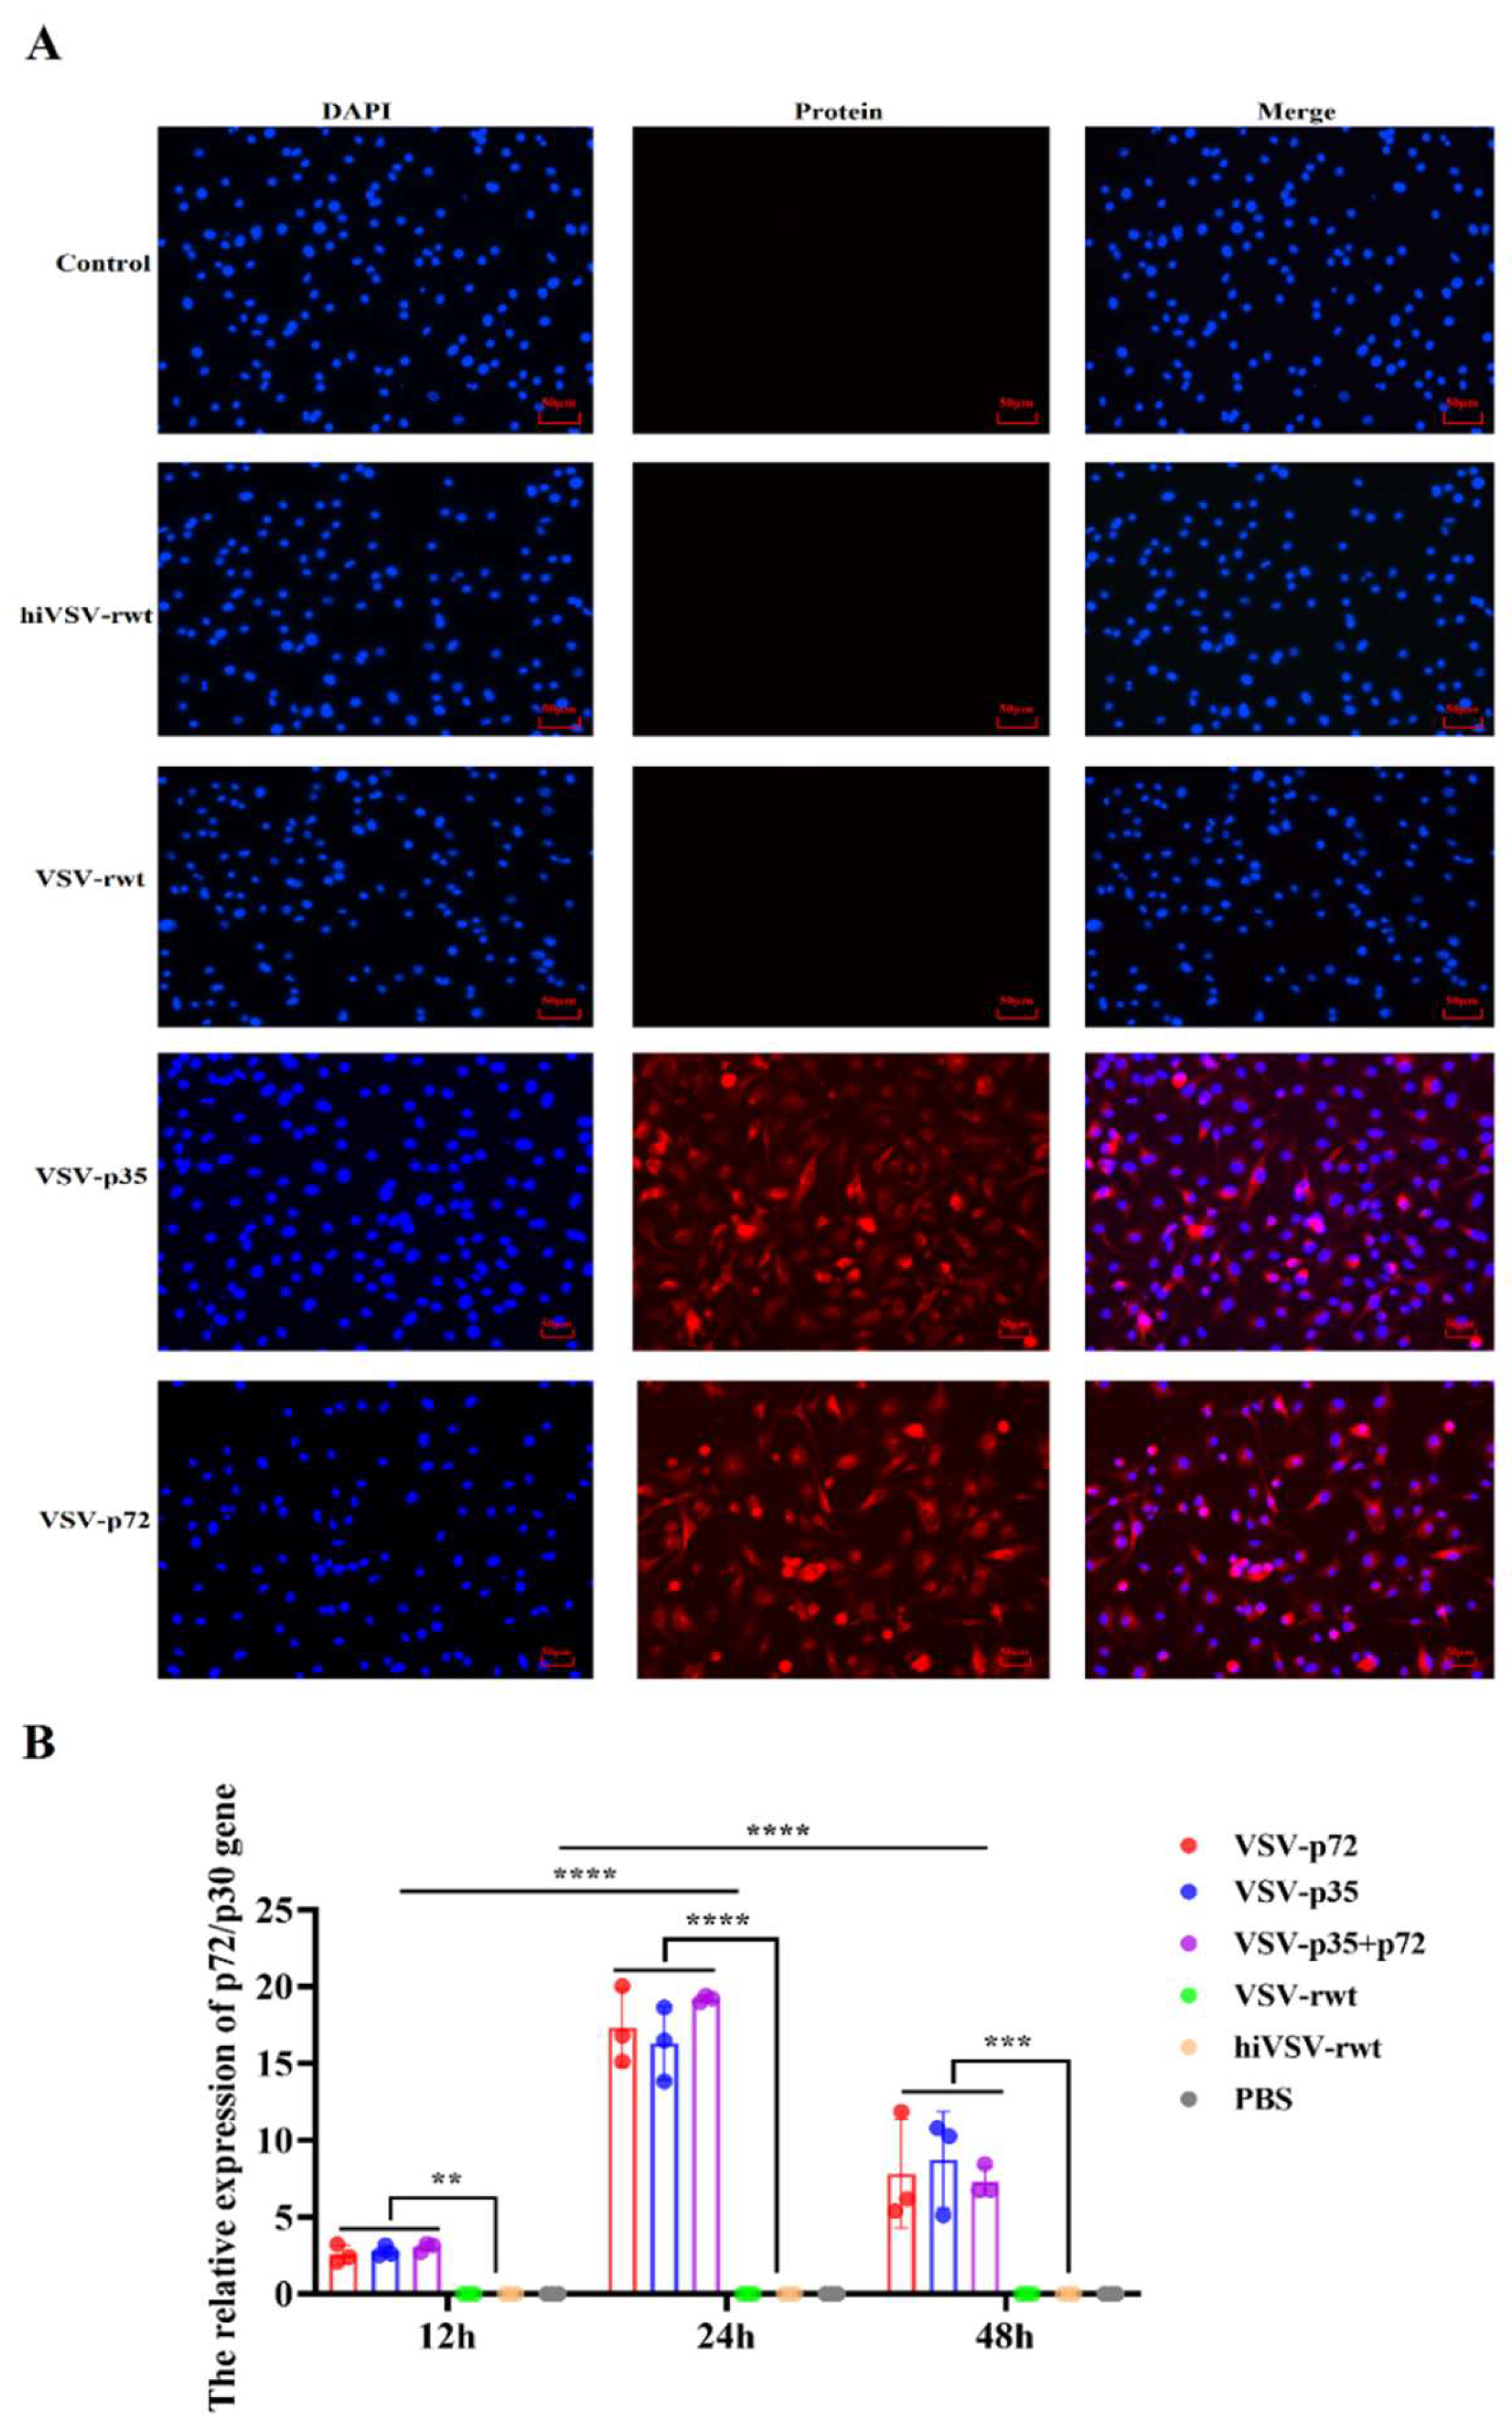
Figure 9.
The antigen presentation ability in treated DCs. (A) The expression of ASFV p72 or p30 protein was detected by IFA assay in DCs after being stimulated with recombinant viruses (MOI = 0.1) for 24 h. (B) The relative expression of p72/p30 gene in DCs after being stimulated with recombinant viruses (MOI = 0.1) for 24 h. The results were shown as the mean ± SD from three replicates of per group. **p < 0.01, ***p < 0.001, ****p < 0.0001.
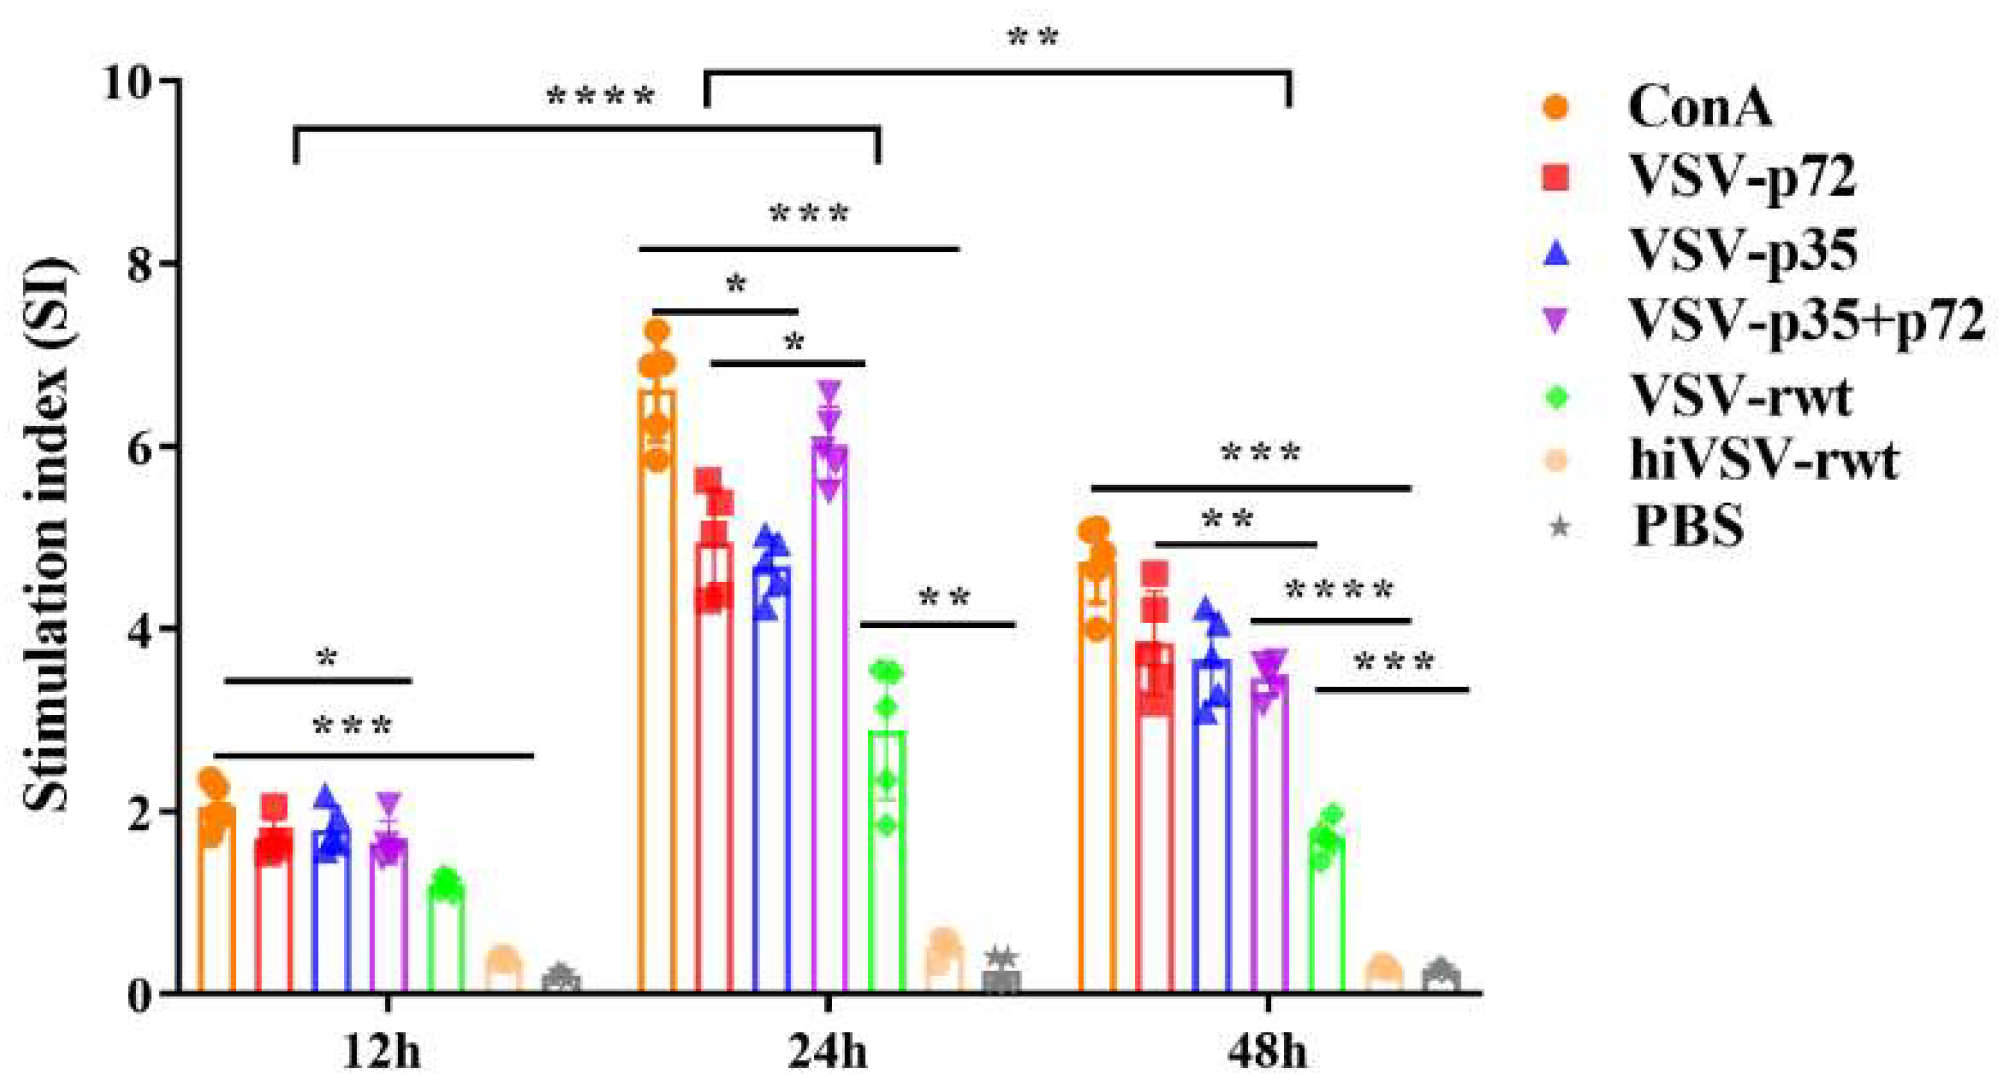
Figure 10.
The proliferation in co-culture cells. The proliferation of T cells in co-culture cells was measured by MLR assay when DCs were infected with recombinant viruses (MOI = 0.1) for 12 h, 24 h and 48 h, respectively. The results were shown as the mean ± SD from three replicates of per group. *p < 0.05, **p < 0.01, ***p < 0.001, ****p < 0.0001.
Figure 11.
The detection of cytokines in co-culture cells by ELISA. (A-D) The secretion levels of IL-4, IL-17A, IFN-γ and TNF-α were measured by ELISA assay when DCs were infected with recombinant viruses (MOI = 0.1) for 12 h, 24 h and 48 h, respectively. The results were shown as the mean ± SD from three replicates of per group. *p < 0.05, **p < 0.01, ***p < 0.001, ****p < 0.0001, ns: not significant.
Figure 12.
The activation of T lymphocytes in co-culture cells. (A, C) The proportion of CD3+CD4+T cells in co-culture cells was measured when DCs were infected with recombinant viruses (MOI = 0.1) for 12 h, 24 h and 48 h, respectively. (B, D) The proportion of CD3+CD8+T cells in co-culture cells was measured when DCs were infected with recombinant viruses (MOI = 0.1) for 12 h, 24 h and 48 h, respectively. The results were shown as the mean ± SD from three replicates of per group. **p < 0.01, ***p < 0.001, ****p < 0.0001.
Figure 13.
The polarization of CD4+T lymphocyte subsets. (A-D) The proportions of CD4+IFN-γ+, CD4+IL-4+, CD4+IL-17A+, and CD4+Foxp3+T cells in co-culture cells were measured when DCs were infected with recombinant viruses at 0.1MOI for 12 h, 24 h and 48 h, respectively. (E-H) Histograms showed statistical analysis of the proportions of CD4+IFN-γ+, CD4+IL-4+, CD4+IL-17A+, and CD4+Foxp3+T cells in co-culture cells. The results were shown as the mean ± SD from three replicates of per group. *p < 0.05, **p < 0.01, ***p < 0.001, ****p < 0.0001.
Figure 14.
The expression of CD4+T cells related transcription factors in co-culture cells. (A-D) The mRNA expression of T-bet, GATA-3, RORγt and Foxp3 was measured by RT-qPCR assay when DCs were infected with recombinant viruses at 0.1MOI for 12 h, 24 h and 48 h, respectively. The results were shown as the mean ± SD from three replicates of per group. *p < 0.05, **p < 0.01, ***p < 0.001, ****p < 0.0001, ns: not significant.
Table 1.
The sequences of primers used in this study.
Table 1.
The sequences of primers used in this study.
| Primers |
Sequences (5'- 3') |
| VSV N |
Forward: GGAATAAACATCGGGAAAG |
| Reverse: TGGTTGCCTTTGTATCTACTT |
| TLR3 |
Forward: TCGGCAACGGTTCCTTCTCC |
| Reverse: AATGCTCGCTTCAAACTCAGGTAC |
| TLR7 |
Forward: AAAGCCCTTTACCTGGATGGAAAC |
| Reverse: TCGTGATGGAGAAGATGTTGTTAGC |
| TLR8 |
Forward: GGTTATGTTGGCTGCTCTGGTTC |
| Reverse: TGGGATGTGGATGAAGTCCTGTA |
| TLR9 |
Forward: AACCTCAGCCACAACATTCTCAAG |
| Reverse: CACCTCCAACAGTAAGTCTACGAAG |
| ASFV-p72 |
Forward: CTGCTCATGGTATCAATCTTATCGA |
| Reverse: GATACCACAAGATCAGCCGT |
| ASFV-p30 |
Forward: ATCTACGCAGGACAGGGATACAC |
| Reverse: GTCGTTCTTCTCGTGGATGTTCTC |
| T-bet |
Forward: ATCACTAAGCAAGGACGGCGAATG |
| Reverse: TCCACCAAGACCACATCCACAAAC |
| GATA-3 |
Forward: TCTGGAGGAGGAACGCTAATGGG |
| Reverse: CGGGTCTGGATGCCTTCTTTCTTC |
| RORγt |
Forward: TGTCCCGAGATGCTGTCAAGTTTG |
| Reverse: TCCTGTTGCTGCTGCTGTTGC |
| Foxp3 |
Forward: AAGAATGCCATCCGCCACAACC |
| Reverse: TACGGTCCACACTGCTCCCTTC |
| β-actin |
Forward: CTGGCACCACACCTTCTACAATGAG |
| Reverse: TGGCGTGAGGGAGAGCATAGC |
