Submitted:
18 September 2024
Posted:
19 September 2024
You are already at the latest version
Abstract
Keywords:
1. Introduction
2. Materials and Methods
2.1. Study Sites and Sampling
2.2. Soil and Plant Analyses
2.3. Statistical Analyses
3. Results
3.1. Silica Accumulation in Potato Plants – Results from the Silica Amendment Experiment
3.2. Si effects on Potato Yields – Results from the Long-Term Field Experiment
4. Discussion
5. Conclusions
- (i)
- How big is the range of Si contents in potato plants considering the numerous cultivars worldwide? Recently, published data show that Si contents in potato tubers represent a difference of four orders of magnitude, for example (Table 2).
- (ii)
- Which foliar Si fertilizer formula at which dose is most effective against which disease caused by fungi or fungus-like microorganisms?
- (iii)
- How do different soil Si fertilizers (e.g., slags, fused magnesium phosphate, wollastonite, or biochar) affect soil properties in different soils under different climate conditions?
Author Contributions
Funding
Institutional Review Board Statement
Data Availability Statement
Acknowledgments
Conflicts of Interest
References
- Laruelle, G.G., V. Roubeix, A. Sferratore, B. Brodherr, D. Ciuffa, D. Conley, H. Dürr, J. Garnier, C. Lancelot, and Q. Le Thi Phuong, Anthropogenic perturbations of the silicon cycle at the global scale: Key role of the land-ocean transition. Global biogeochemical cycles, 2009. 23(4).
- Struyf, E., A. Smis, S. Van Damme, P. Meire, and D.J. Conley, The Global Biogeochemical Silicon Cycle. Silicon, 2009. 1(4): p. 207-213. [CrossRef]
- Tréguer, P.J., J.N. Sutton, M. Brzezinski, M.A. Charette, T. Devries, S. Dutkiewicz, C. Ehlert, J. Hawkings, A. Leynaert, and S.M. Liu, Reviews and syntheses: The biogeochemical cycle of silicon in the modern ocean. Biogeosciences, 2021. 18(4): p. 1269-1289.
- Carey, J.C. and R.W. Fulweiler, The terrestrial silica pump. PLoS One, 2012. 7(12): p. e52932. [CrossRef]
- Street-Perrott, F.A. and P.A. Barker, Biogenic silica: a neglected component of the coupled global continental biogeochemical cycles of carbon and silicon. Earth Surface Processes and Landforms, 2008. 33(9): p. 1436-1457. [CrossRef]
- Struyf, E. and D.J. Conley, Emerging understanding of the ecosystem silica filter. Biogeochemistry, 2012. 107: p. 9-18.
- Puppe, D., Review on protozoic silica and its role in silicon cycling. Geoderma, 2020. 365. [CrossRef]
- Hodson, M.J., The development of phytoliths in plants and its influence on their chemistry and isotopic composition. Implications for palaeoecology and archaeology. Journal of Archaeological Science, 2016. 68: p. 62-69. [CrossRef]
- Sangster, A., M. Hodson, and H. Tubb, Silicon deposition in higher plants, in Studies in plant science. 2001, Elsevier. p. 85-113.
- International Committee for Phytolith, T., International Code for Phytolith Nomenclature (ICPN) 2.0. Ann Bot, 2019. 124(2): p. 189-199. [CrossRef]
- Hodson, M.J., The Relative Importance of Cell Wall and Lumen Phytoliths in Carbon Sequestration in Soil: A Hypothesis. Frontiers in Earth Science, 2019. 7. [CrossRef]
- Hodson, M.J. and C.N. Guppy, Special issue on silicon at the root-soil interface. Plant and Soil, 2022. 477(1): p. 1-8.
- Puppe, D., D. Kaczorek, M. Stein, and J. Schaller, Silicon in Plants: Alleviation of Metal (loid) Toxicity and Consequential Perspectives for Phytoremediation. Plants, 2023. 12(13): p. 2407. [CrossRef]
- Katz, O., D. Puppe, D. Kaczorek, N.B. Prakash, and J. Schaller, Silicon in the Soil-Plant Continuum: Intricate Feedback Mechanisms within Ecosystems. Plants (Basel), 2021. 10(4). [CrossRef]
- Haynes, R.J., Significance and Role of Si in Crop Production. 2017. p. 83-166. [CrossRef]
- Puppe, D. and M. Sommer, Experiments, Uptake Mechanisms, and Functioning of Silicon Foliar Fertilization—A Review Focusing on Maize, Rice, and Wheat. 2018. p. 1-49. [CrossRef]
- Savant, N.K., G.H. Korndörfer, L.E. Datnoff, and G.H. Snyder, Silicon nutrition and sugarcane production: A review1. Journal of Plant Nutrition, 1999. 22(12): p. 1853-1903. [CrossRef]
- Haynes, R.J., A contemporary overview of silicon availability in agricultural soils. Journal of Plant Nutrition and Soil Science, 2014. 177(6): p. 831-844. [CrossRef]
- Li, Z. and B. Delvaux, Phytolith-rich biochar: A potential Si fertilizer in desilicated soils. GCB Bioenergy, 2019. 11(11): p. 1264-1282. [CrossRef]
- Gustafsson, O., M. Krusa, Z. Zencak, R.J. Sheesley, L. Granat, E. Engstrom, P. Praveen, P. Rao, C. Leck, and H. Rodhe, Brown clouds over South Asia: biomass or fossil fuel combustion? Science, 2009. 323(5913): p. 495-498.
- Puppe, D., D. Kaczorek, J. Schaller, D. Barkusky, and M. Sommer, Crop straw recycling prevents anthropogenic desilication of agricultural soil–plant systems in the temperate zone – Results from a long-term field experiment in NE Germany. Geoderma, 2021. 403. [CrossRef]
- Yang, X., Z. Song, Z. Qin, L. Wu, L. Yin, L. Van Zwieten, A. Song, X. Ran, C. Yu, and H. Wang, Phytolith-rich straw application and groundwater table management over 36 years affect the soil-plant silicon cycle of a paddy field. Plant and Soil, 2020. 454: p. 343-358.
- Hodson, M.J., P.J. White, A. Mead, and M.R. Broadley, Phylogenetic variation in the silicon composition of plants. Ann Bot, 2005. 96(6): p. 1027-46. [CrossRef]
- Crusciol, C.A., A.L. Pulz, L.B. Lemos, R.P. Soratto, and G.P. Lima, Effects of silicon and drought stress on tuber yield and leaf biochemical characteristics in potato. Crop science, 2009. 49(3): p. 949-954.
- Pilon, C., R.P. Soratto, and L.A. Moreno, Effects of soil and foliar application of soluble silicon on mineral nutrition, gas exchange, and growth of potato plants. Crop Science, 2013. 53(4): p. 1605-1614.
- Soratto, R.P., A.M. Fernandes, C. Pilon, and M.R. Souza, Phosphorus and silicon effects on growth, yield, and phosphorus forms in potato plants. Journal of Plant Nutrition, 2019. 42(3): p. 218-233. [CrossRef]
- Soltani, M., M. Kafi, A. Nezami, and H. Taghiyari, Effects of silicon application at nano and micro scales on the growth and nutrient uptake of potato minitubers (Solanum tuberosum var. Agria) in greenhouse conditions. BioNanoScience, 2018. 8: p. 218-228.
- Dorneles, A.O.S., A.S. Pereira, G. Possebom, V.M. Sasso, L.V. Rossato, and L.A. Tabaldi, Growth of potato genotypes under different silicon concentrations. Advances in Horticultural Science, 2018. 32(2): p. 289-295.
- Xue, X., T. Geng, H. Liu, W. Yang, W. Zhong, Z. Zhang, C. Zhu, and Z. Chu, Foliar application of silicon enhances resistance against Phytophthora infestans through the ET/JA-and NPR1-dependent signaling pathways in potato. Frontiers in Plant Science, 2021. 12: p. 609870.
- Vulavala, V.K., R. Elbaum, U. Yermiyahu, E. Fogelman, A. Kumar, and I. Ginzberg, Silicon fertilization of potato: expression of putative transporters and tuber skin quality. Planta, 2016. 243(1): p. 217-29. [CrossRef]
- Artyszak, A., Effect of Silicon Fertilization on Crop Yield Quantity and Quality-A Literature Review in Europe. Plants (Basel), 2018. 7(3). [CrossRef]
- Wadas, W., Nutritional value and sensory quality of new potatoes in response to silicon application. Agriculture, 2023. 13(3): p. 542.
- Wadas, W., Possibility of increasing early potato yield with foliar application of silicon. Agronomy Science, 2022. 77(2): p. 61-75.
- Nyawade, S., H.I. Gitari, N.N. Karanja, C.K. Gachene, E. Schulte-Geldermann, K. Sharma, and M.L. Parker, Enhancing climate resilience of rain-fed potato through legume intercropping and silicon application. Frontiers in Sustainable Food Systems, 2020. 4: p. 566345.
- Schaller, J., E. Scherwietes, L. Gerber, S. Vaidya, D. Kaczorek, J. Pausch, D. Barkusky, M. Sommer, and M. Hoffmann, Silica fertilization improved wheat performance and increased phosphorus concentrations during drought at the field scale. Scientific Reports, 2021. 11(1): p. 20852.
- Schaller, J., R. Macagga, D. Kaczorek, J. Augustin, D. Barkusky, M. Sommer, and M. Hoffmann, Increased wheat yield and soil C stocks after silica fertilization at the field scale. Science of The Total Environment, 2023. 887: p. 163986.
- Barkusky, D., Müncheberger Nährstoffsteigerungsversuch, V140. Ministerium für Ländliche Entwicklung, Umwelt und Verbraucherschutz, Landesamt für Verbraucherschutz, Landwirtschaft und Flurneuordnung (ed.): Dauerfeldversuche in Brandenburg und Berlin-Beiträge für eine nachhaltige landwirtschaftliche Bodenbenutzung. MLUL, Brandenburg, Germany, 2009: p. 103-109.
- WRB, World reference base (WRB) for soil resources 2014, update 2015. International soil classification system for naming soils and creating legends for soil maps. International Union of Soil Sciences (IUSS) Working Group. World Soil Resources Reports No. 106. 2015, FAO, Rome.
- Haysom, M.B.C. and L.S. Chapman, Some aspects of the calcium silicate trials at Mackay. Proc. Aust. Soc. Sugar Cane Technol., 1975. 42: p. 117-122.
- de Lima Rodrigues, L., S.H. Daroub, R.W. Rice, and G.H. Snyder, Comparison of three soil test methods for estimating plant-available silicon. Communications in soil science and plant analysis, 2003. 34(15-16): p. 2059-2071.
- Puppe, D., D. Kaczorek, C. Buhtz, and J. Schaller, The potential of sodium carbonate and Tiron extractions for the determination of silicon contents in plant samples—A method comparison using hydrofluoric acid digestion as reference. Frontiers in Environmental Science, 2023. 11: p. 1145604.
- Puppe, D., C. Buhtz, D. Kaczorek, J. Schaller, and M. Stein, Microwave plasma atomic emission spectroscopy (MP-AES)—A useful tool for the determination of silicon contents in plant samples? Frontiers in Environmental Science, 2024. 12: p. 1378922.
- Zepner, L., P. Karrasch, F. Wiemann, and L. Bernard, ClimateCharts. net–an interactive climate analysis web platform. International Journal of Digital Earth, 2021. 14(3): p. 338-356.
- Guntzer, F., C. Keller, and J.-D. Meunier, Benefits of plant silicon for crops: a review. Agronomy for Sustainable Development, 2011. 32(1): p. 201-213. [CrossRef]
- Wadas, W. and T. Kondraciuk, Effect of silicon on micronutrient content in new potato tubers. International Journal of Molecular Sciences, 2023. 24(13): p. 10578.
- Ma, J.F., K. Tamai, N. Yamaji, N. Mitani, S. Konishi, M. Katsuhara, M. Ishiguro, Y. Murata, and M. Yano, A silicon transporter in rice. Nature, 2006. 440(7084): p. 688-91. [CrossRef]
- Mitani-Ueno, N. and J.F. Ma, Linking transport system of silicon with its accumulation in different plant species. Soil Science and Plant Nutrition, 2021. 67(1): p. 10-17.
- Exley, C., G. Guerriero, and X. Lopez, How is silicic acid transported in plants? Silicon, 2020. 12(11): p. 2641-2645. [CrossRef]
- Wani, A.H., S.H. Mir, S. Kumar, M.A. Malik, S. Tyub, and I. Rashid, Silicon en route-from loam to leaf. Plant Growth Regulation, 2023. 99(3): p. 465-476.
- Deshmukh, R.K., J. Vivancos, G. Ramakrishnan, V. Guérin, G. Carpentier, H. Sonah, C. Labbé, P. Isenring, F.J. Belzile, and R.R. Bélanger, A precise spacing between the NPA domains of aquaporins is essential for silicon permeability in plants. The Plant Journal, 2015. 83(3): p. 489-500.
- Birch, P.R., G. Bryan, B. Fenton, E.M. Gilroy, I. Hein, J.T. Jones, A. Prashar, M.A. Taylor, L. Torrance, and I.K. Toth, Crops that feed the world 8: potato: are the trends of increased global production sustainable? Food Security, 2012. 4: p. 477-508.
- Thorne, S.J., P.M. Stirnberg, S.E. Hartley, and F.J.M. Maathuis, The Ability of Silicon Fertilisation to Alleviate Salinity Stress in Rice is Critically Dependent on Cultivar. Rice, 2022. 15(1): p. 8. [CrossRef]
- Hijmans, R.J., The effect of climate change on global potato production. American journal of potato research, 2003. 80: p. 271-279.
- Raymundo, R., S. Asseng, R. Robertson, A. Petsakos, G. Hoogenboom, R. Quiroz, G. Hareau, and J. Wolf, Climate change impact on global potato production. European Journal of Agronomy, 2018. 100: p. 87-98.
- Bomers, S., A. Ribarits, A. Kamptner, T. Tripolt, P. von Gehren, N. Prat, and J. Söllinger, Survey of Potato Growers’ Perception of Climate Change and Its Impacts on Potato Production in Germany, Switzerland, and Austria. Agronomy, 2024. 14(7): p. 1399.
- Porter, G.A., W.B. Bradbury, J.A. Sisson, G.B. Opena, and J.C. McBurnie, Soil management and supplemental irrigation effects on potato: I. Soil properties, tuber yield, and quality. Agronomy Journal, 1999. 91(3): p. 416-425.
- Po, E.A., S.S. Snapp, and A. Kravchenko, Potato yield variability across the landscape. Agronomy Journal, 2010. 102(3): p. 885-894.
- Cambouris, A., M. Nolin, B. Zebarth, and M. Laverdière, Soil management zones delineated by electrical conductivity to characterize spatial and temporal variations in potato yield and in soil properties. American journal of potato research, 2006. 83: p. 381-395.
- Schaller, J., A. Cramer, A. Carminati, and M. Zarebanadkouki, Biogenic amorphous silica as main driver for plant available water in soils. Scientific Reports, 2020. 10(1): p. 2424.
- Arora, R. and S.P. Khurana, Major fungal and bacterial diseases of potato and their management, in Fruit and vegetable diseases. 2004, Springer. p. 189-231.
- Yuen, J., Pathogens which threaten food security: Phytophthora infestans, the potato late blight pathogen. Food Security, 2021. 13(2): p. 247-253.
- Koch, M., M. Naumann, E. Pawelzik, A. Gransee, and H. Thiel, The importance of nutrient management for potato production Part I: Plant nutrition and yield. Potato research, 2020. 63(1): p. 97-119.
- Rosen, C.J., K.A. Kelling, J.C. Stark, and G.A. Porter, Optimizing phosphorus fertilizer management in potato production. American Journal of Potato Research, 2014. 91: p. 145-160.
- Wolfe, D.W., E. Fereres, and R.E. Voss, Growth and yield response of two potato cultivars to various levels of applied water. Irrigation Science, 1983. 3: p. 211-222.
- Vos, J. and A. Haverkort, Water availability and potato crop performance, in Potato biology and biotechnology. 2007, Elsevier. p. 333-351.


| Si Content (mg kg-1) | |||||||
|---|---|---|---|---|---|---|---|
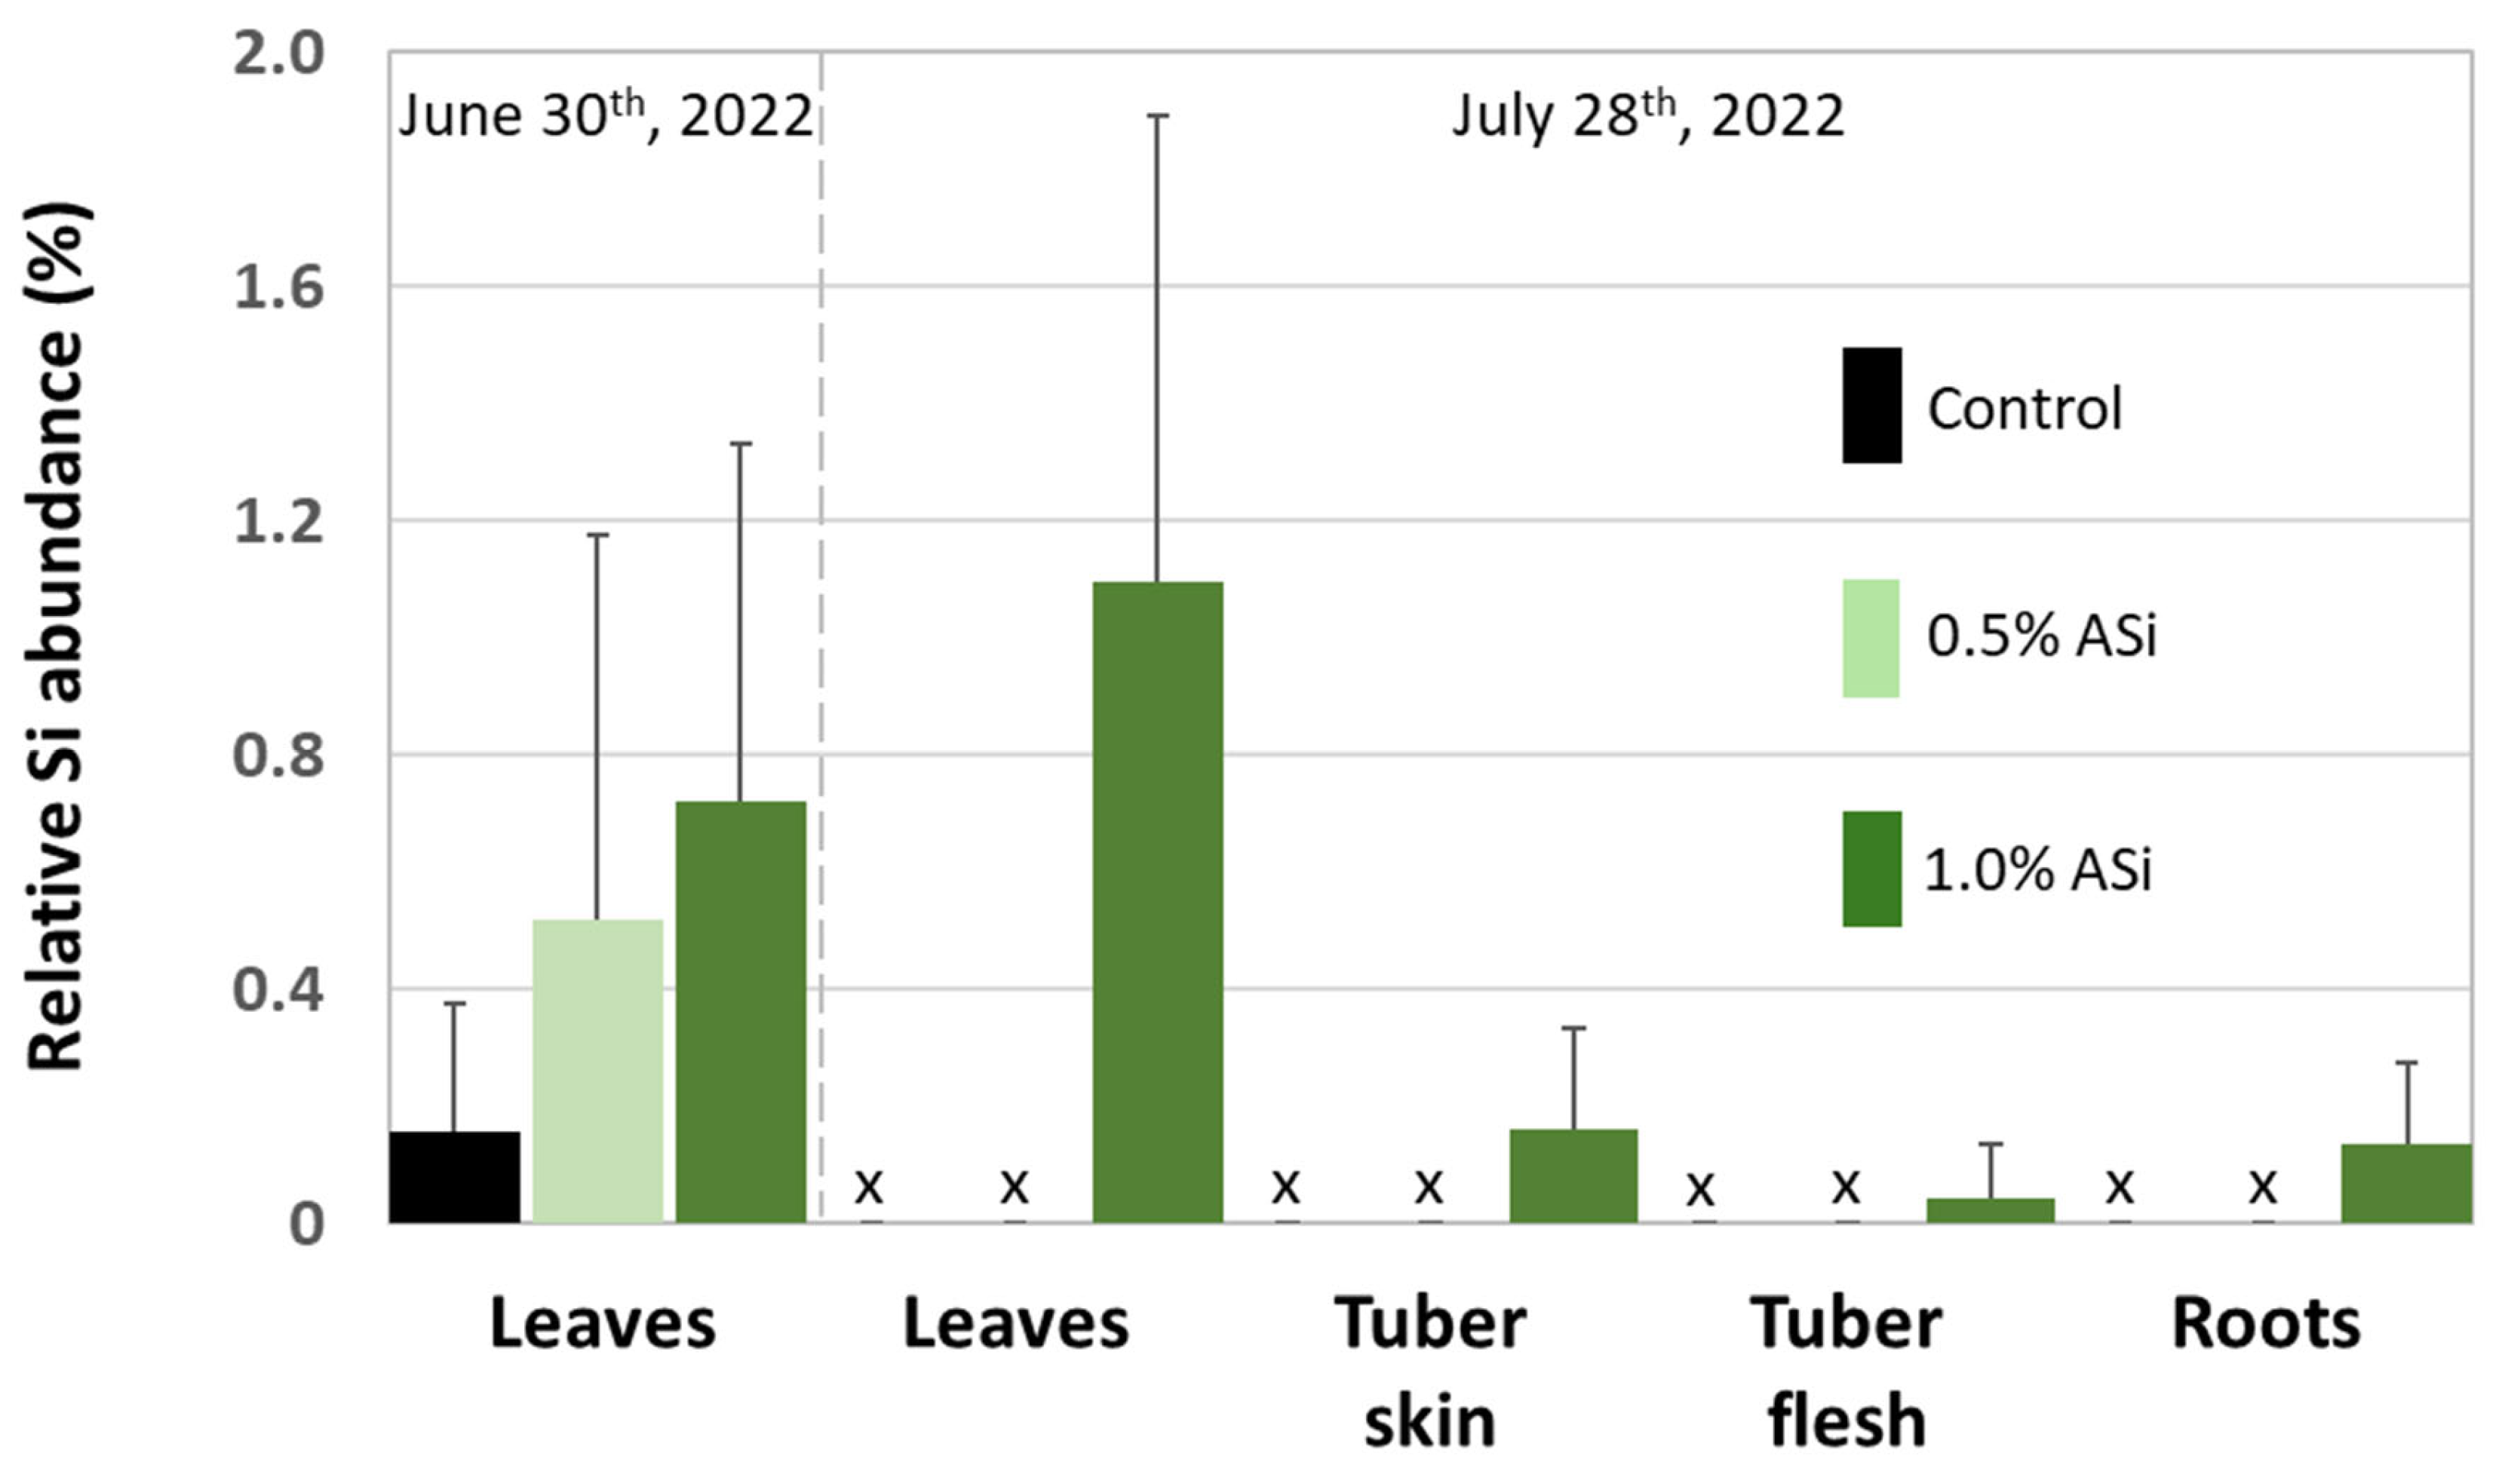
| June 30th, 2022 | July 28th, 2022 | ||||||
| Treatment | Plant Material | Mean | SD | Mean | SD | ||
| Control | Leaves | 0 | -- | 50 | 0.2 | ||
| 0.5% ASi | Leaves | 0 | -- | 646 | -- | ||
| 1.0% ASi | Leaves | 12 | 263 | 789 | -- | ||
| Control | Tuber skin | 0 | -- | 0 | -- | ||
| 0.5% ASi | Tuber skin | 0 | -- | 0 | -- | ||
| 1.0% ASi | Tuber skin | 0 | -- | 0 | -- | ||
| Control | Tuber flesh | 0 | -- | 0 | -- | ||
| 0.5% ASi | Tuber flesh | 0 | -- | 0 | -- | ||
| 1.0% ASi | Tuber flesh | 0 | -- | 0 | -- | ||
| Control | Roots | 316 | 405 | 860 | 929 | ||
| 0.5% ASi | Roots | 936 | 762 | 1669 | 2361 | ||
| 1.0% ASi | Roots | 3198 | 2081 | 2401 | 3326 | ||
| Si Content (mg kg-1 DM) | Si Contents of Control and Si Treatments Statistically Significantly Different? | ||||
|---|---|---|---|---|---|
| Potato Cultivar | Plant Material | Control | Si Treatment(s) | Reference | |
| Bintje | Leaves | 3,700-4,100 | 4,200-4,700 | yes (under drought stress) / no (without stress) | Crusciol et al. [24] |
| Agata | Leaves | 4,100 | 8,300-10,000 | yes | Pilon et al. [25] |
| Stems | 6,300 | 7,600-10,100 | yes (soil Si application) / no (foliar Si application) | ||
| Roots | 3,800 | 4,000-5,900 | yes (soil Si application) / no (foliar Si application) | ||
| Tubers | 2,000 | 2,100-2,200 | no | ||
| Winston | Leaves | 1,400-2,300 | 1,500-2,200 | no | Vulavala et al. [30] |
| Roots a | 15,600-41,300 | 17,300-34,200 | no | ||
| Tuber skin | 950-2,000 | 850-3,900 | no | ||
| Agria | Shoots + roots | 26 | 27-50 | ns | Soltani et al. [27] |
| Tubers | 37 | 40-46 | ns | ||
| Agata | Leaves | 8,300 | 8,400-8,600 | no | Soratto et al. [26] |
| Roots | 11,000 | 11,600-12,300 | no | ||
| Shoots | 8,100 | 8,300-9,600 | yes (high Si fertilization level) / no (low Si fertilization level) | ||
| Tubers | 1,200 | 2,100-2,300 | yes | ||
| Catania | Tubers | 0.2 | 0.3 | no | Wadas and Kondraciuk [45] |
| Talent | Leaves | 0-50 | 0-790 | no | This study |
| Tuber skin | 0 | 0 | no | ||
| Tuber flesh | 0 | 0 | no | ||
| Roots | 320-860 | 940-3,200 | no | ||
Disclaimer/Publisher’s Note: The statements, opinions and data contained in all publications are solely those of the individual author(s) and contributor(s) and not of MDPI and/or the editor(s). MDPI and/or the editor(s) disclaim responsibility for any injury to people or property resulting from any ideas, methods, instructions or products referred to in the content. |
© 2024 by the authors. Licensee MDPI, Basel, Switzerland. This article is an open access article distributed under the terms and conditions of the Creative Commons Attribution (CC BY) license (http://creativecommons.org/licenses/by/4.0/).


