Preprint
Article

Enhanced SAR Compression through Multi-Look Doppler Compensation and Auto-Focusing Technique

Altmetrics

Downloads

48

Views

42

Comments

0

A peer-reviewed article of this preprint also exists.

This version is not peer-reviewed

Submitted:

13 September 2024

Posted:

19 September 2024

You are already at the latest version

Alerts
Abstract
This paper presents a simple and streamlined compensation technique for improving the quality of Synthetic Aperture Radar (SAR) images based on the Range Doppler Algorithm (RDA). Incorrect Doppler estimation in space orbit, caused by unexpected radar motion errors, orbit mismatches, and other factors, can significantly degrade SAR image quality. These inaccuracies result in mismatches between the azimuth-matched filter and the received Doppler chirp signal. To address this issue, we propose a Doppler estimation method that leverages the Fractional Fourier Transform (FrFT) and cross-correlation techniques. The received signals are compared with the azimuth-matched filter based on the rotation angle in the FrFT domain, and the Doppler centroid is adjusted to achieve optimal alignment. This process ensures high correlation values and enhanced resolution in the final SAR image. The efficacy of the proposed technique is validated through experiments using real spaceborne SAR data from the practical satellite. The results demonstrate significant improvements in image quality and resolution compared to conventional algorithms, highlighting the advantages of our approach for various remote sensing applications.
Keywords: 
Subject: Engineering  -   Electrical and Electronic Engineering

1. Introduction

Synthetic aperture radar (SAR) is an advanced remote sensing technology used to monitor and analyze the Earth's surface through radar systems mounted on platforms such as satellites and aircraft [1,2,3]. Initially developed for military purposes, SAR technology was first operationalized with the launch of the SEASAT satellite in 1978. Today, synthetic aperture radar is widely employed in civilian applications, such as terrain mapping of inaccessible regions. One key advantage of SAR is the ability to synthesize a much larger antenna aperture, resulting in higher-resolution images than the physical antenna length would allow. Additionally, synthetic aperture radar operates effectively in all weather conditions due to the properties of electromagnetic waves utilized. This capability to produce high-resolution images under various conditions has driven significant research in target analysis and method development. The range-Doppler algorithm (RDA) is one of the foundational algorithms for signal processing techniques, initially developed for civilian satellite SAR operations [4]. The widespread use of RDA is due to its maturity, simplicity, efficiency, and accuracy [5]. In synthetic aperture radar signal processing with RDA, there are two main signals: the received signal, which is captured by the radar system for target information analysis, and the matched filter signal, which is generated to process the received signal [9]. Conventional techniques assume that the azimuth-matched filter is estimated perfectly as the azimuth signal in the received data, resulting in an optimal synthetic aperture radar image. However, the RDA also has limitations, particularly in scenarios with inaccurate Range Cell Migration Correction (RCMC) and the integration of azimuth frequency for secondary range compression [6]. To address these issues, various alternative algorithms have been proposed [7,8]. Moreover, in practical implementations, SAR images often degrade due to not properly estimating the azimuth-matched filter. The above issues of RDA can be caused mainly by unexpected Doppler estimation errors such as variations in radar platform velocity, terrain distortions, solar wind effects, etc. These Doppler estimation inaccuracies can significantly impair SAR image quality, leading researchers to explore various calibration methods to mitigate these issues. Although existing literature offers numerous techniques for enhancing SAR image quality [10,11], these methods are often complex, non-intuitive, and should be modified according to specific situations, making them difficult to apply in all environmental conditions. This paper introduces an efficient and streamlined compensation algorithm that is intuitive and straightforward, focusing on improving synthetic aperture radar image quality. The proposed method emphasizes correcting two critical aspects: the Doppler chirp rate and the Doppler centroid frequency. The primary issue addressed is phase distortion of the received signal, which adversely impacts synthetic aperture radar image quality through improper matched filtering. The key contribution of this paper is compensating for Doppler effects using the Fractional Fourier Transform (FrFT) and cross-correlation techniques. During the range compression stage of RDA, raw data is efficiently processed using a range-matched filter. However, accurate Doppler estimation becomes crucial during azimuth compression to prevent degradation of matched filtering. Discrepancies in chirp rates between the two signals result in residual phase errors, leading to suboptimal azimuth-matched filtering. The Fractional Fourier Transform technique provides insight into signal rates by rotating the time-frequency domain, allowing for iterative adjustments of the azimuth-matched filter's chirp rate to align with the received signal. This adjustment ensures the azimuth-matched filter has the same Doppler chirp rate with the raw signals in the azimuth direction. Incorrect Doppler centroid estimation further complicates azimuth-matched filtering due to resultant phase errors. Cross-correlation techniques can correct these errors. An inaccurate Doppler centroid estimation implies misaligned Doppler centroids in the time-frequency domain, reducing the correlation value and degrading azimuth compression results. By iteratively adjusting the Doppler centroid of the azimuth-matched filter to maximize correlation, proper signal alignment is ensured. The combined application of Fractional Fourier Transform and cross-correlation accurately estimates the chirp rate and Doppler centroid of the raw signal, thus enhancing the final SAR image quality.
This paper is structured as follows: Section II provides a theoretical background on the range-Doppler algorithm, cross-correlation, and Fractional Fourier Transform. Section III details the proposed algorithm for optimizing synthetic aperture radar images. Section IV presents experimental results using real synthetic aperture radar data and compares them with results obtained using the original algorithm. Finally, Section V concludes the paper.

2. Background Theory

2-1. Range Doppler Algorithm

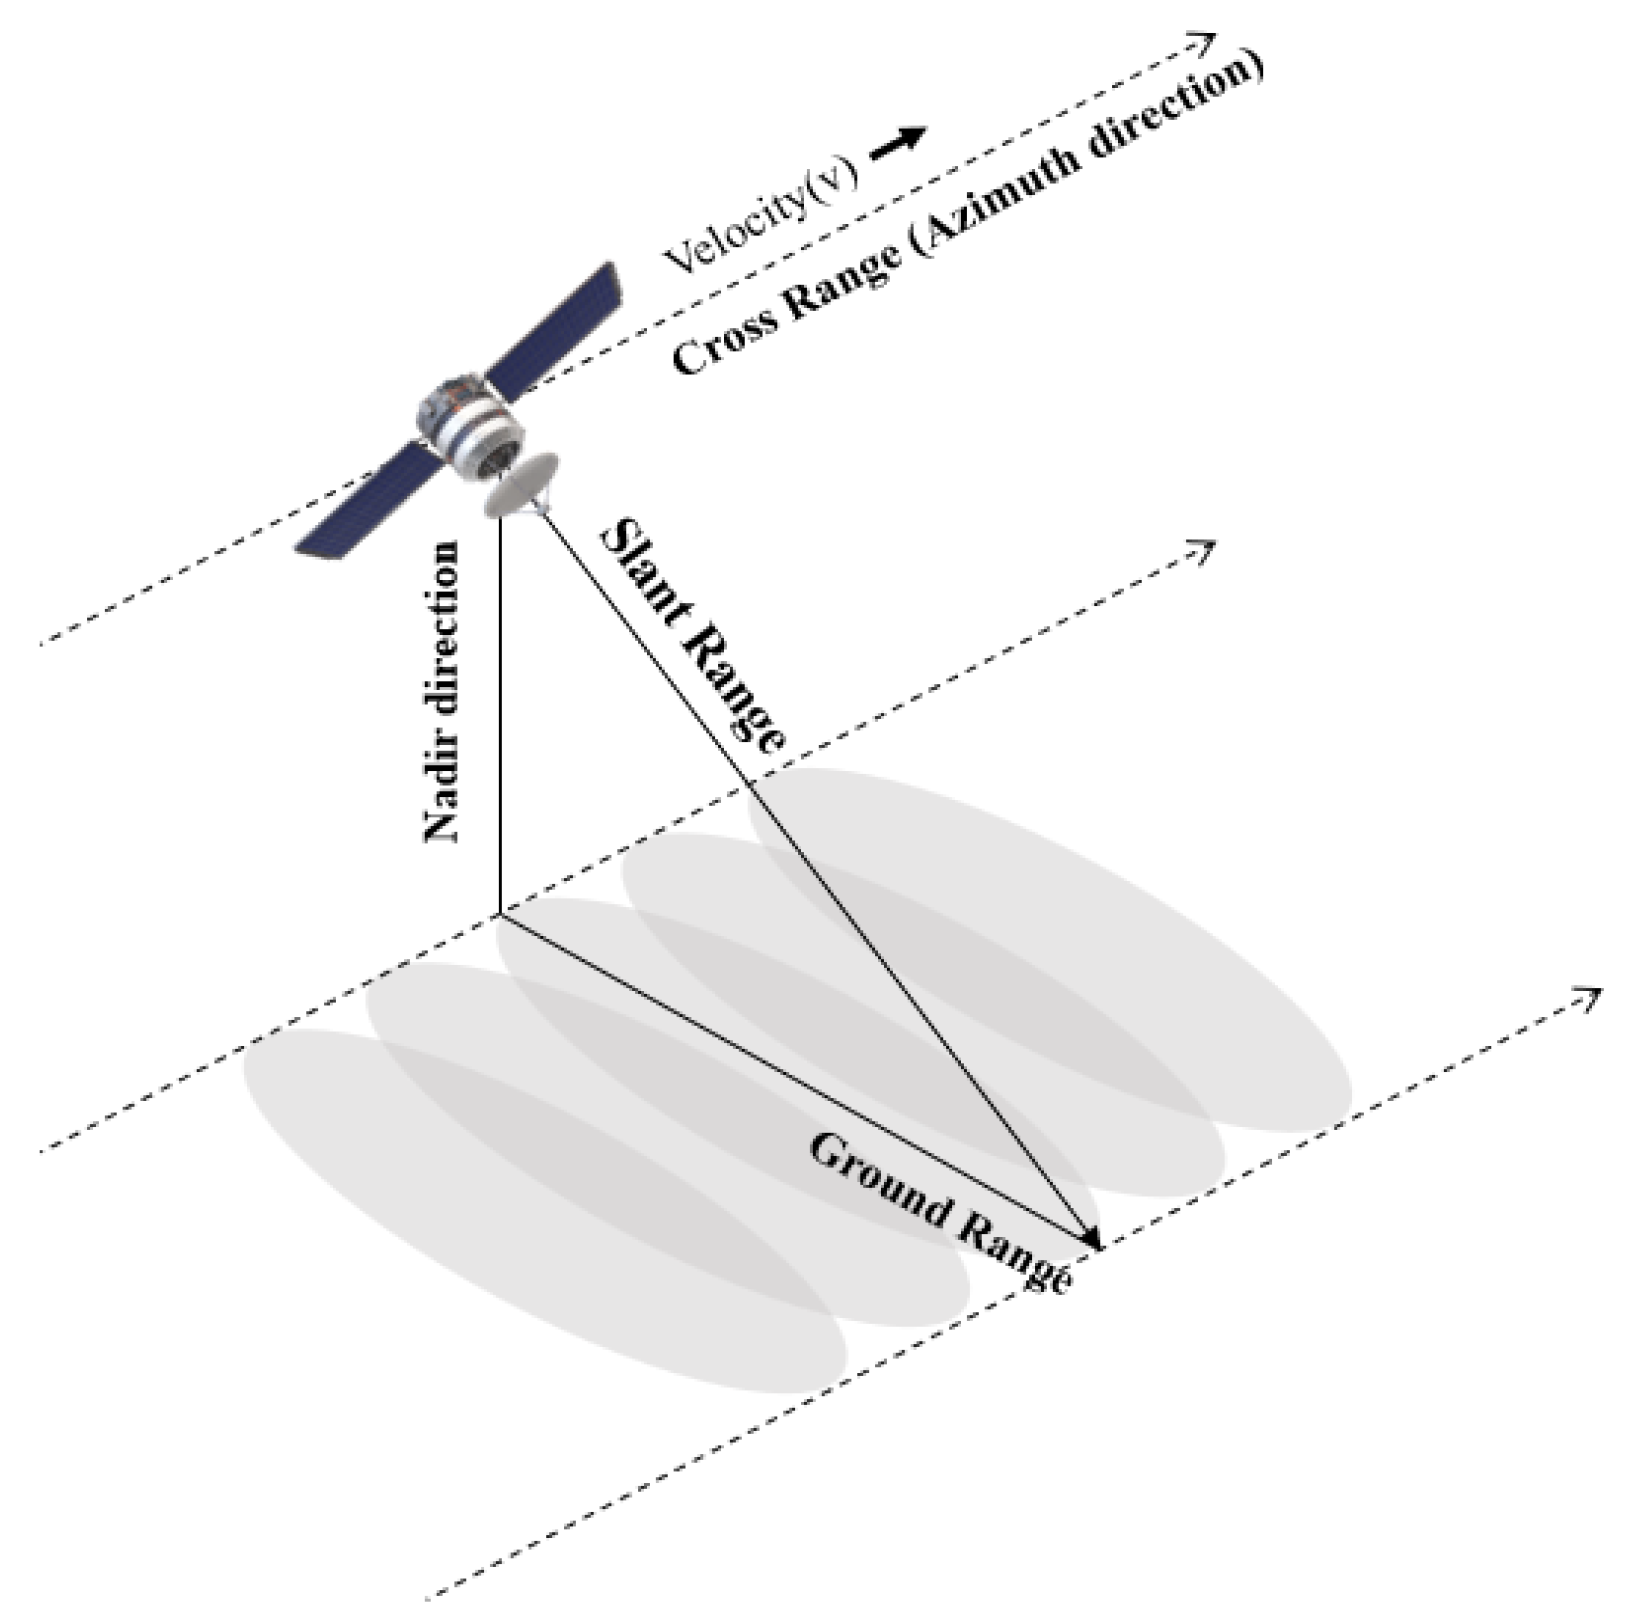
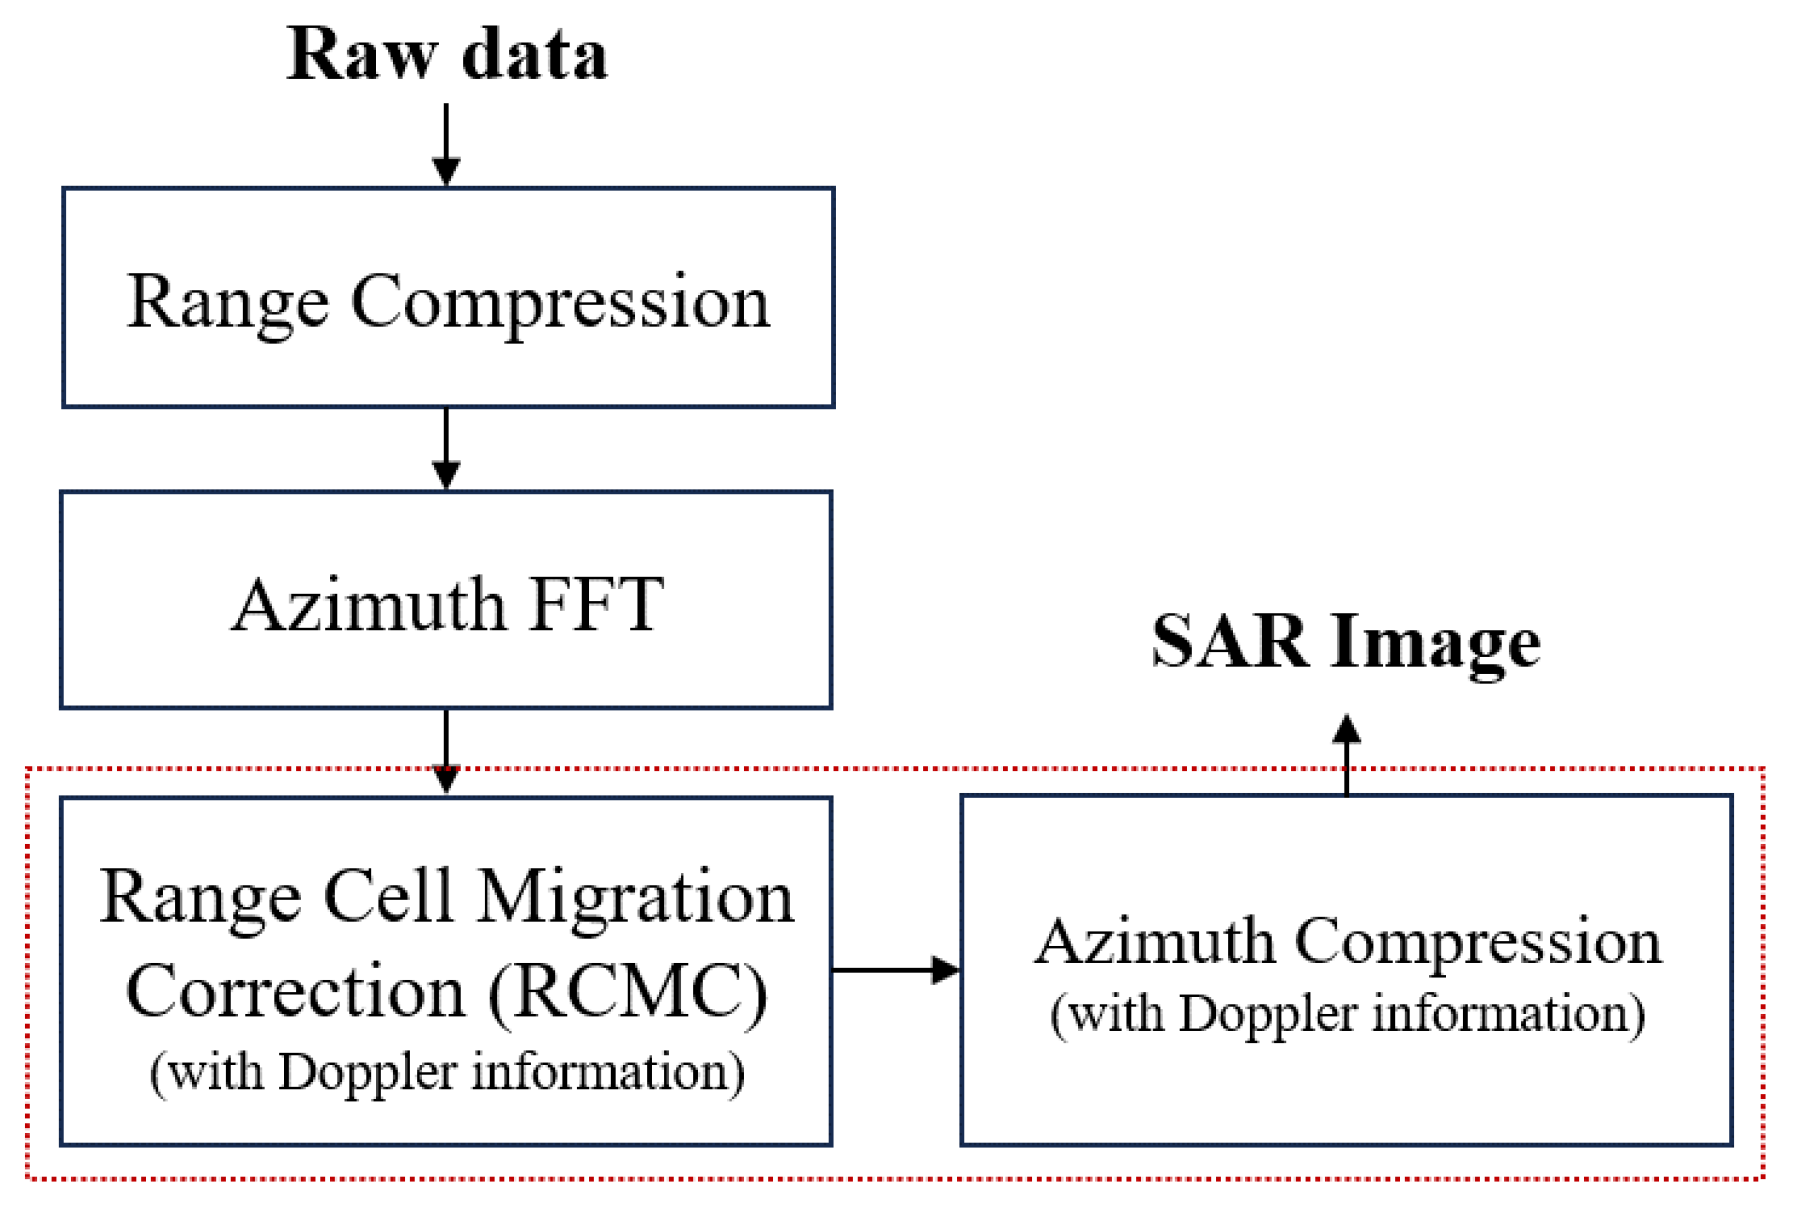
The Range Doppler Algorithm (RDA) is a prominent method for extracting synthetic aperture radar (SAR) images [10]. Among the various SAR operating modes, strip-mode is commonly employed in conjunction with the RDA in SAR systems. An illustration of strip-mode is provided in Figure 1. The RDA processes signals in both the range direction (direction of propagation) and the azimuth direction (direction of radar movement). This method is considered straightforward and user-friendly compared to other SAR processing techniques such as the Chirp Scaling Algorithm and the Omega-K algorithm. The conventional RDA is divided into three primary components: range compression, Range Cell Migration Correction (RCMC), and azimuth compression. The overall procedure of the RDA is depicted in Figure 2. In the context of SAR systems, range compression involves compressing the received echo signal to improve resolution in the range direction. The RCMC step corrects the migration of range cells caused by the relative motion between the radar platform and the target. Finally, azimuth compression enhances resolution in the azimuth direction by focusing the signal along the radar's flight path.
Definitions of raw data can vary depending on the operational characteristics of radar systems, including FMCW (Frequency Modulated Continuous Wave), chirp pulse, and de-ramping techniques. Furthermore, SAR measurements are conducted across various measurement platforms (such as strip-map mode, spotlight mode, scan mode, etc.), resulting in differences in raw data characteristics. For the purposes of this paper, raw data is specifically defined for chirp pulse radar and strip-map mode to introduce the RDA comprehensively. To introduce RDA in the paper, we specifically define raw data for chirp pulse radar:
S o τ , η = A 0 ω r τ 2 R η c ω a η η c e j 4 π f 0 R ( η ) / c e j π K r ( τ 2 R ( η ) / c ) 2
where A 0 is an amplitude of signal, f 0 is a radar center frequency, τ and η are the range and azimuth time respectively, R ( η ) is instantaneous slant range, K r is range chirp FM rate, ω r τ is range envelope, and ω a η is azimuth envelope. For target compression in range direction, the matched filter is defined as:
G f τ = r e c t ( f K T ) e j π f 2 / K
The range-compressed result signal is defined as:
S r c τ , η = A 0 p r τ 2 R ( η ) / c ω a η η c e j 4 π f 0 R ( η ) / c
where p r ( τ ) is the IFFT of the W r f τ , the range envelope in range frequency domain. The measured location of each target signal can be curved due to differences in the instantaneous slant range along the azimuth direction. Therefore, the RCMC process re-arranges the azimuth data of the same target, interpolating the range location by R 0 , where R 0 is a zero Doppler distance. It means the nearest range between the platform and the target. For the target range from the radar, the range equation can be approximated as:
R η = R 0 2 + V r 2 η 2 R 0 + V r 2 η 2 2 R 0
Furthermore, since Doppler signals are processed in the region where Doppler changes linearly, the FM rate can be defined as:
K a   2 V r 2 λ R 0
Based on (4) and (5), the range-compressed signal in the azimuth FFT domain can be shown as:
S 1 τ , f η A 0 p r τ 2 R r d f η c ω a f η f η c e j 4 π f 0 R 0 / c e j π f η 2 K a
where f η and f η c represents the azimuth frequency and the Doppler centroid frequency, respectively, and the Range Cell Migration (RCM) in the range envelope, R r d f η , can be expressed in the range Doppler domain as shown below:
R r d f η = R 0 + λ 2 R 0 f η 2 8 V r 2
We can regard this signal is a function of range variant, R 0 . The RCMC is performed by the interpolation in the range Doppler domain and the amount of RCM is re-located at R 0 .
S 2 τ , f η A 0 p r τ 2 R 0 c ω a f η f η c e j π f 0 R 0 / c e j π f η 2 K a
We can confirm that the signal is expressed in terms of R 0 and p r is independent of range envelope. After the RCMC, the matched filtering is applied to the data, S 2 τ , η , for the azimuth compression process. The azimuth-matched filter is estimated as shown below:
H a z f η = e j π f η 2 K a
To estimate an accurate azimuth-matched filter, the Doppler information (centroid frequency and frequency rate) is an important key parameter. Various environmental conditions, such as the velocity of SAR measurement, terrain distortion, solar wind, etc can generate this Doppler effect. We suggest the estimation method for the above Doppler effect in the proposed technique. After the azimuth compression, the final signal in frequency and time domain can be defined as respectively:
S a c τ , f η = A 0 p r τ 2 R 0 c ω a f η f η c e j 4 π f 0 R 0 c s a c τ , η = A 0 p r τ 2 R 0 c p a η e j 4 π f 0 R 0 c e j 2 π f η c η
where p a and p r are a sinc-like function. As a result, we can notice that the final target is positioned at τ = 2 R 0 / c and η = 0 in the range and azimuth direction, respectively.

2-2. Cross-Correlation Technique

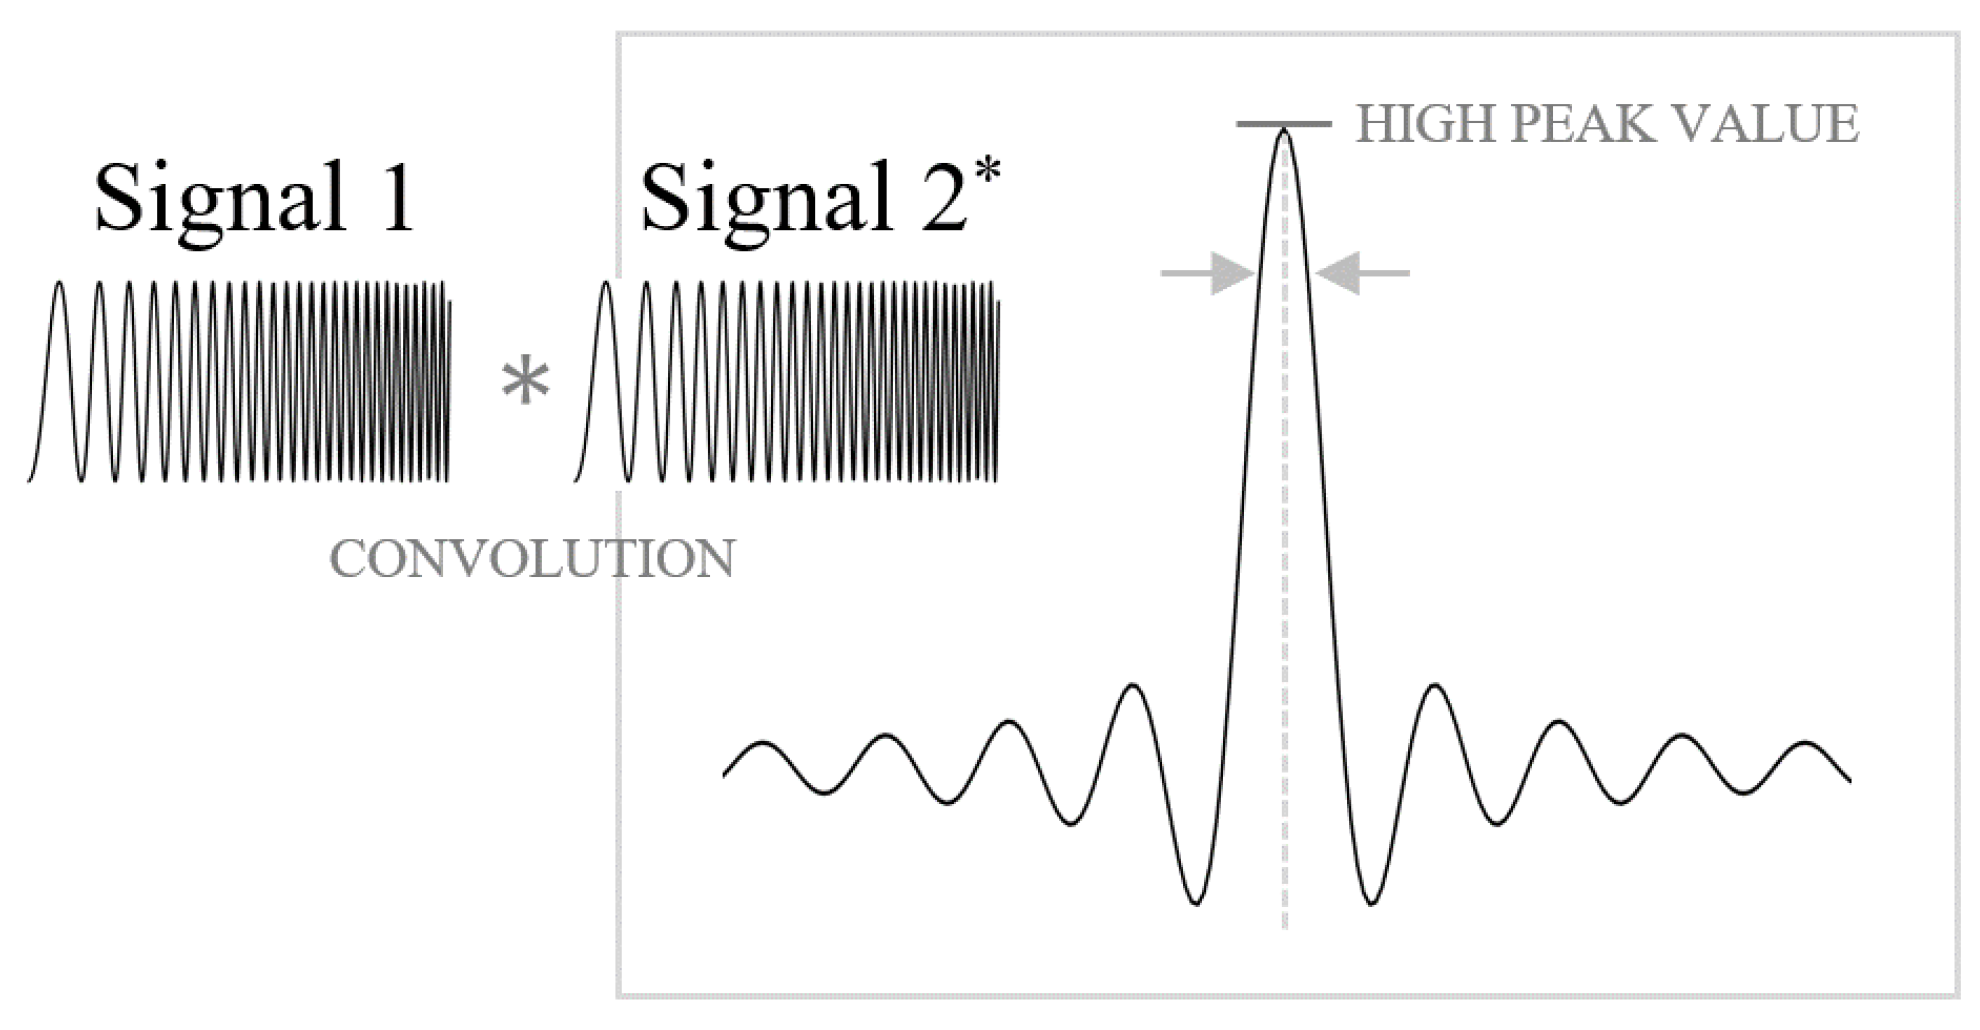
The cross-correlation method is a signal-processing technique used to measure and define the relationship between two signals [12] using the concept of convolution. As shown in Figure 3, the cross-correlation process evaluates the similarity between two chirp pulses. The higher the similarity between the two signals, the higher the expected peak value of the sinc-function. Conversely, lower similarity results in a lower peak value. Consider two identical chirp pulse functions, f τ and g τ , which undergo cross-correlation. f 01 and f 02 denote the center frequencies of f τ and g τ , respectively. The cross-correlation is defined as:
f g τ = f ( t ) g t + τ t
where g t + τ represents the time-shifted version of g t . By computing the sliding dot product of f τ and g τ , the cross-correlation value can be estimated. The primary comparative information determining the cross-correlation result is the center frequency and chirp rate of the chirp signals. The cross-correlation result, f * g τ , is presented as a sinc function. Due to the linearly increasing frequency of the chirp pulse, the peak point appears when the two functions overlap perfectly. Therefore, the intersection point between f 01 and f 02 represents the maximum value of the sinc-function, which is a characteristic property of the chirp pulse in cross-correlation. In the context of the Range Doppler Algorithm (RDA), cross-correlation operates in two dimensions: range and azimuth. The application of cross-correlation to the RDA is defined as follows [13]:
s L o o k 1 s L o o k 2 τ n , η s L o o k 1 τ n s L o o k 2 τ n , η + ω d ω
If the chirp pulse signals exhibit high similarity, the cross-correlation value approximates the ideal sinc-function in the frequency domain. This property is particularly useful for azimuth compression. In azimuth compression, the relative relationship between two separate signals—the received signal and the azimuth-matched filter—can be computed using a cross-correlation process. According to the similarity between Equations (8) and (9), the cross-correlation value in azimuth compression can be increased, enhancing the SAR image quality. By leveraging the properties of cross-correlation, specifically the alignment and similarity of chirp signals, the proposed method improves the precision of azimuth compression in SAR processing. It leads to higher quality and more accurate SAR images, which are crucial for various applications in remote sensing and terrain analysis.

2-3. Fractional Fourier Transform

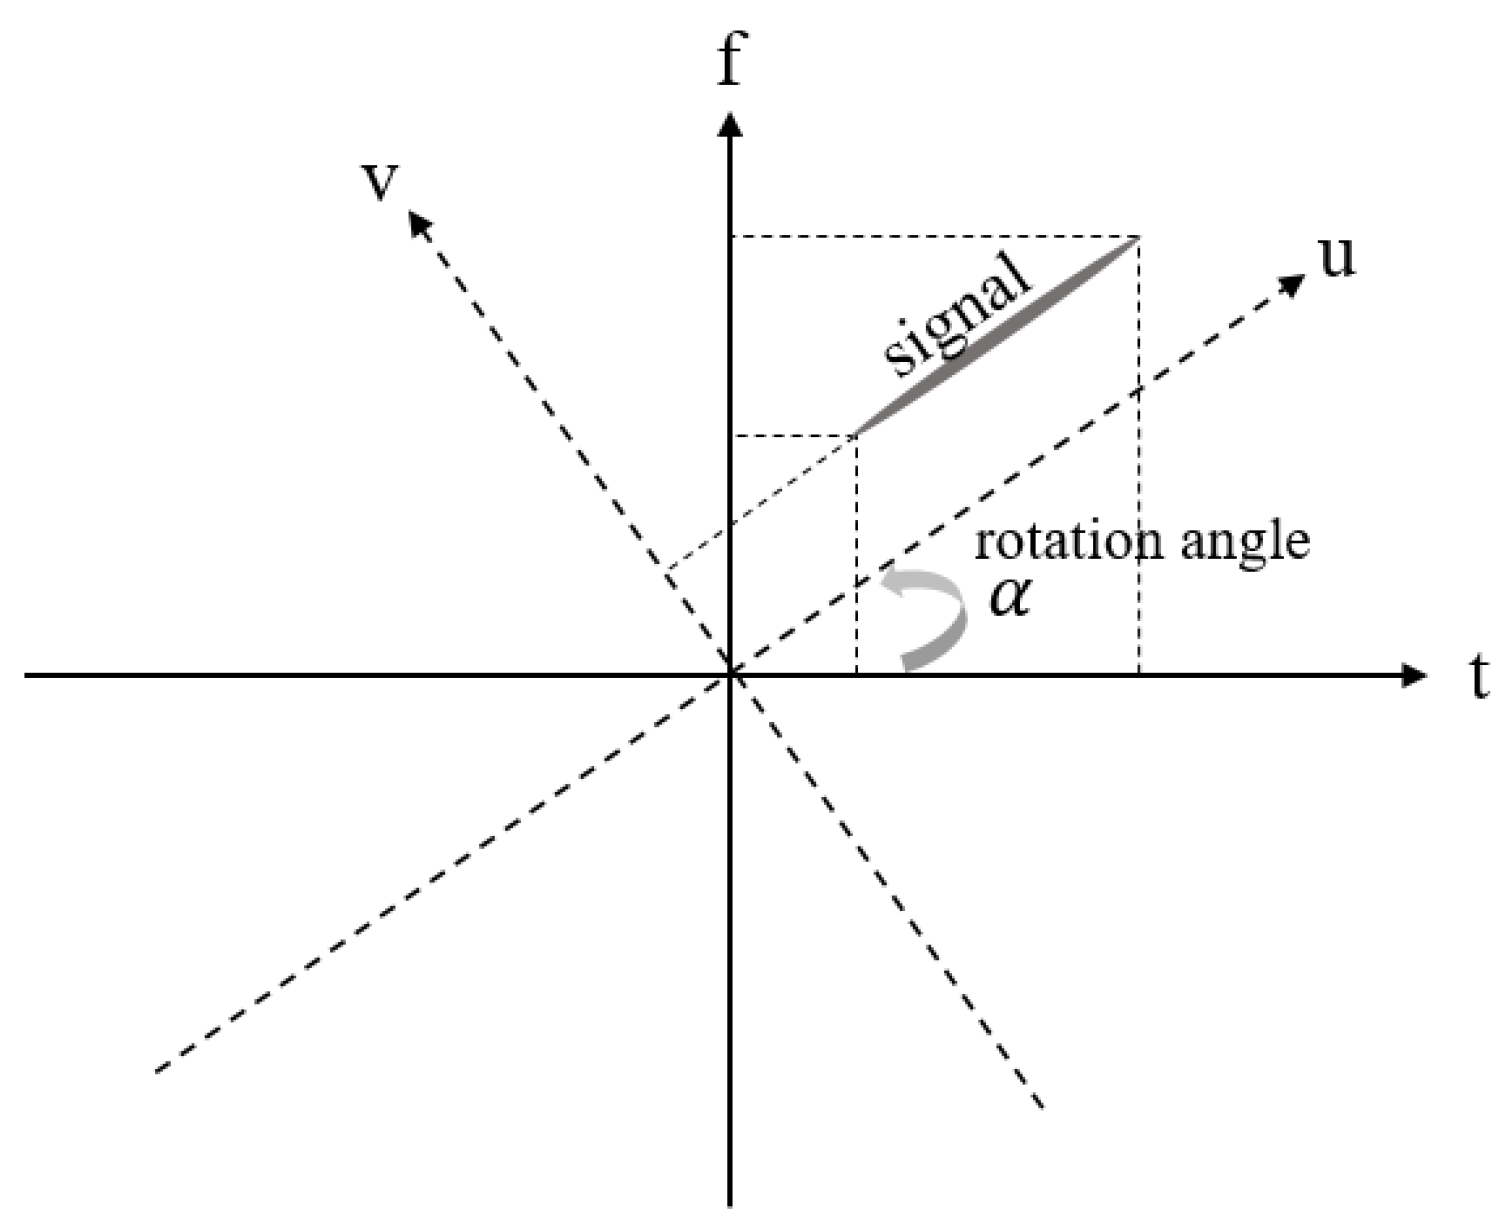
The Fractional Fourier Transform (FrFT) is a generalization of the classical Fourier transform used in time-frequency representations [14]. Figure 4 illustrates a signal x t in both the original time-frequency domain (solid line) and the rotated time-frequency domain (dashed line). As shown in Figure 4, the transformed signal in the FrFT domain exhibits varying degrees of concentration depending on the rotation angle. This variation is evidenced by the bandwidth of the signal extending across the frequency domain. The parameter ‘α’ represents the rotation angle of the time-frequency domain. Notably, the Fourier transform is a special case of the FrFT, corresponding to a counterclockwise rotation by α   = π / 2 . The FrFT can be mathematically defined as:
X α u = F r F T α x t = x t K α t , u t
The transformation kernel, K α t , u , is defined as
K α t , u = 1 j c o t α 2 π e j ( u 2 + t 2 ) 2 c o t α j u t c s c α i f α n π δ t u i f α = 2 n π δ t + u i f α = ( 2 n + 1 ) π
where δ ( t ) represents the Dirac delta function [15]. The inverse of the FrFT can be obtained by applying the FrFT with a rotation of α :
x ( t ) = F r F T α X α u = X α u K α u , t t
In addition, there are several properties of the Fractional Fourier Transform that facilitate signal processing [16]. For example, the linearity, time-shifting, and modulation properties of the FrFT are similar to those of the classical Fourier transform, but they operate within the context of fractional domains, providing enhanced flexibility for analyzing and manipulating signals. In the proposed technique, we use FrFT properties for analyzing the Doppler chirp rate of an azimuth-matched filter.
Figure 3. Cross-correlation processing between two chirp pulses (signal 1 and signal 2) and the process result (relativity).
Preprints 118195 g003
Figure 4. The time-frequency domain (t, f) and FrFT domain (u, v) rotated the time-frequency domain by rotation angle, α .
Preprints 118195 g004

3. Proposed Technique

As mentioned in the previous Section, accurate Doppler signal estimation is crucial for generating the final Synthetic Aperture Radar (SAR) image during the azimuth compression process. When the Doppler parameters, specifically the Doppler centroid ( f η c ) and chirp rate ( K a ), are mismatched with the expected azimuth matched filter, the final SAR image may be degraded by various unfocused targets. The Doppler centroid can be estimated at the point where the peak of the beam center crosses the target and is largely influenced by Doppler ambiguity. Doppler ambiguity occurs when the Doppler shift extends beyond the azimuth sampling frequency, i.e., outside the Pulse Repetition Frequency (PRF), leading to ghost targets at (n ± 1) PRF in the SAR image at n PRF. Even though phase-based Doppler compensation techniques [10] are applied, estimating accurate Doppler centroid information can be challenging.
Inaccurate estimation of Doppler chirp centroids results in aliasing effects in the final SAR image, introducing unexpected ghost targets due to the mismatched Doppler centroid frequency. The equation for S 2 τ , η with the Doppler centroid error is shown as:
S 2 τ , η A 0 p r τ 2 R 0 c ω a f η ( f η c ± f e r r o r ) e j π f 0 R 0 / c e j π f η 2 K a
We can validate the impact of the Doppler centroid through mathematical expressions. By processing the Range-Doppler Algorithm (RDA), the azimuth-compressed data for extracting the SAR image is denoted in (10). Since the Doppler effect is dominant in the azimuth direction, it remains as a trace in the Doppler centroid form and introduces Doppler frequency error in s a c τ , η in the frequency domain. The phase error effect of the Doppler centroid, e f e r r o r , is defined as:
s a c τ , η = A 0 p r τ 2 R 0 c p a η e j 4 π f 0 R 0 c e j ( 2 π f η c ± f e r r o r )
In (10), the Doppler centroid remains in the phase of s a c τ , η in the time domain. Therefore, the most ideal approach is to compensate for the nonzero Doppler centroid to prevent degradation of the SAR image by phase error. The chirp rate, which represents the change in frequency over time, is linear in the radar system discussed in this article. By (5), we can check that the FM rate is related to velocity and slant range. As these parameters are variable, the chirp rate also changes, leading to errors. The altered chirp rate can be defined as:
K a 2 ( V r ± V e r r o r ) 2 λ ( R 0 ± R e r r o r )
A chirp rate error causes inaccurate Doppler estimation, resulting in ghost targets and scattering in the SAR image, which degrade the resolution because the azimuth compression is not executed correctly. We can also validate the impact of the chirp rate through mathematical expressions. The signal before and after azimuth compression is derived in (10) and (12), respectively. By examining the phase of the S 2 τ , η and S a c τ , f η signals, we can observe the difference due to variable K a . The azimuth-matched filter, represented in (11), removes the phase component. If the chirp rate of the S 2 τ , η signal changes due to unexpected environmental conditions, the azimuth matched filter may incorrectly compensate the phase, e j π f η 2 / ( K a ± K a ) . This can be denoted as:
S 2 τ , η A 0 p r τ 2 R 0 c ω a f η f η c e j π f 0 R 0 c e j π f η 2 / ( K a ± K a )
By mismatched filtering of K a , it can remain in the final SAR image. Therefore, to accurately extract the Doppler effect from the received data, we estimate the Doppler rate using the FrFT to align the chirp rate of the matched filter with the signal and estimate the Doppler centroid using cross-correlation to adjust the Doppler centroid of the compensated azimuth-matched filter. The final proposed algorithm is illustrated in Figure 5. After Multi-Look Beat Frequency (MLBF) processing, the proposed algorithm seeks to accurately identify the Doppler chirp pulse signal. FFT type MLBF process [17] compensates for Doppler ambiguity that occurs outside the range of -PRF/2~PRF/2. Our proposed method can accurately estimate the Doppler information (Doppler rate and centroid values) of the received data. Subsequently, the algorithm can shift the corresponding Doppler chirp signal within the range of -PRF/2~PRF/2, applying the ambiguity number estimated by the MLBF process.
n f η c = n f η c + M a m b P R F
where, f η c is the Doppler centroid frequency before modifying and f η c is the Doppler frequency after modifying. M a m b is the ambiguity number estimated by MLBF process and n is the range count number. Figure 6 provides an example of the unexpected Doppler chirp signal and the azimuth-matched filter, highlighting different chirp rates and Doppler centroids due to the unexpected Doppler effect. The chirp rate can be estimated by the FrFT rotation because both are associated with the rotation angle, indicated by α and β respectively. One signal shows an increasing frequency rate over time in the time-frequency domain. By FrFT-rotating the two orthogonal axes (time axis and frequency axis), the rotation angle at which the projection value onto the frequency axis is highest can be found. The highest integral value can be considered the most accurate Doppler chirp rate, and the chirp rate can be calculated using the estimated rotation angle. [15]. However, the proposed algorithm not only find the Doppler chirp rate but also both 'range' and 'velocity', which are derived from the chirp rate at the estimated rotation angle. The chirp rate is associated with velocity (squared value) and range, which are variable parameters. Specifically, the sources of chirp rate errors are meticulously analyzed using internal parameters and subsequently applied to all other SAR processing stages. This comprehensive approach not only improves the performance of Range Cell Migration Correction (RCMC) and Azimuth Compression but also enhances the effectiveness of future error compensation algorithms. Rotate the FrFT angle based on the two variables to find the optimal chirp rate that matches the original signal. Using this characteristic, it becomes straightforward to adjust the chirp rate of the azimuth-matched filter by iteratively varying the velocity and range to match the received signal, as shown below:
H a z f η = e j π f η 2 K a ± K a , K a = 2 V 2 λ R
After estimating the parameters, the received signal and the matched filter can be aligned to have the same Doppler chirp rate, as illustrated in Figure 6-(b). Based on above results, we need to accurately estimate Doppler centroid frequency, which was previously mentioned as an important component of Doppler information. Doppler centroid frequencies in each chirp signal are defined as f η c 1 and f η c 2 , respectively. To align the Doppler centroid, we apply the cross-correlation technique to the proposed estimation method. As shown in Figure 3, the convolution result between ideal chirp pulses appears as a sinc function when perfectly matched. As shown in Figure 6-(c), to achieve the ideal value of cross-correlation, each signal should be arranged at the same Doppler centroid ( f η c = f η c 2 ) based on the chirp rate, which was matched in the previous process. The alignment ratio between each centroid can be inferred from the initial cross-correlation value of the two mismatched signals. There is a method to achieve the highest match by shifting the centroid of the matched filter, and another method to reverse-calculate the centroid value based on the cross-correlation value of the two signals. In the proposed algorithm, the optimized centroid value is estimated using an iterative method. The Doppler centroid represents the azimuth center frequency of the data, enabling us to use Equation (9) by modifying the Doppler centroid as shown below:
H a z f η = e j π ( f η ± f e r r o r ) 2 K a
When the value reaches its maximum, the algorithm terminates the iteration. The procedure for Doppler centroid estimation is shown in Figure 6-(c) to 6-(d). After completing the overall compensation processing, the raw signal and the azimuth-matched filter are optimized, as shown in Figure 6-(d). Through the proposed algorithm, an improved SAR image can be generated.

4. Experimental Results

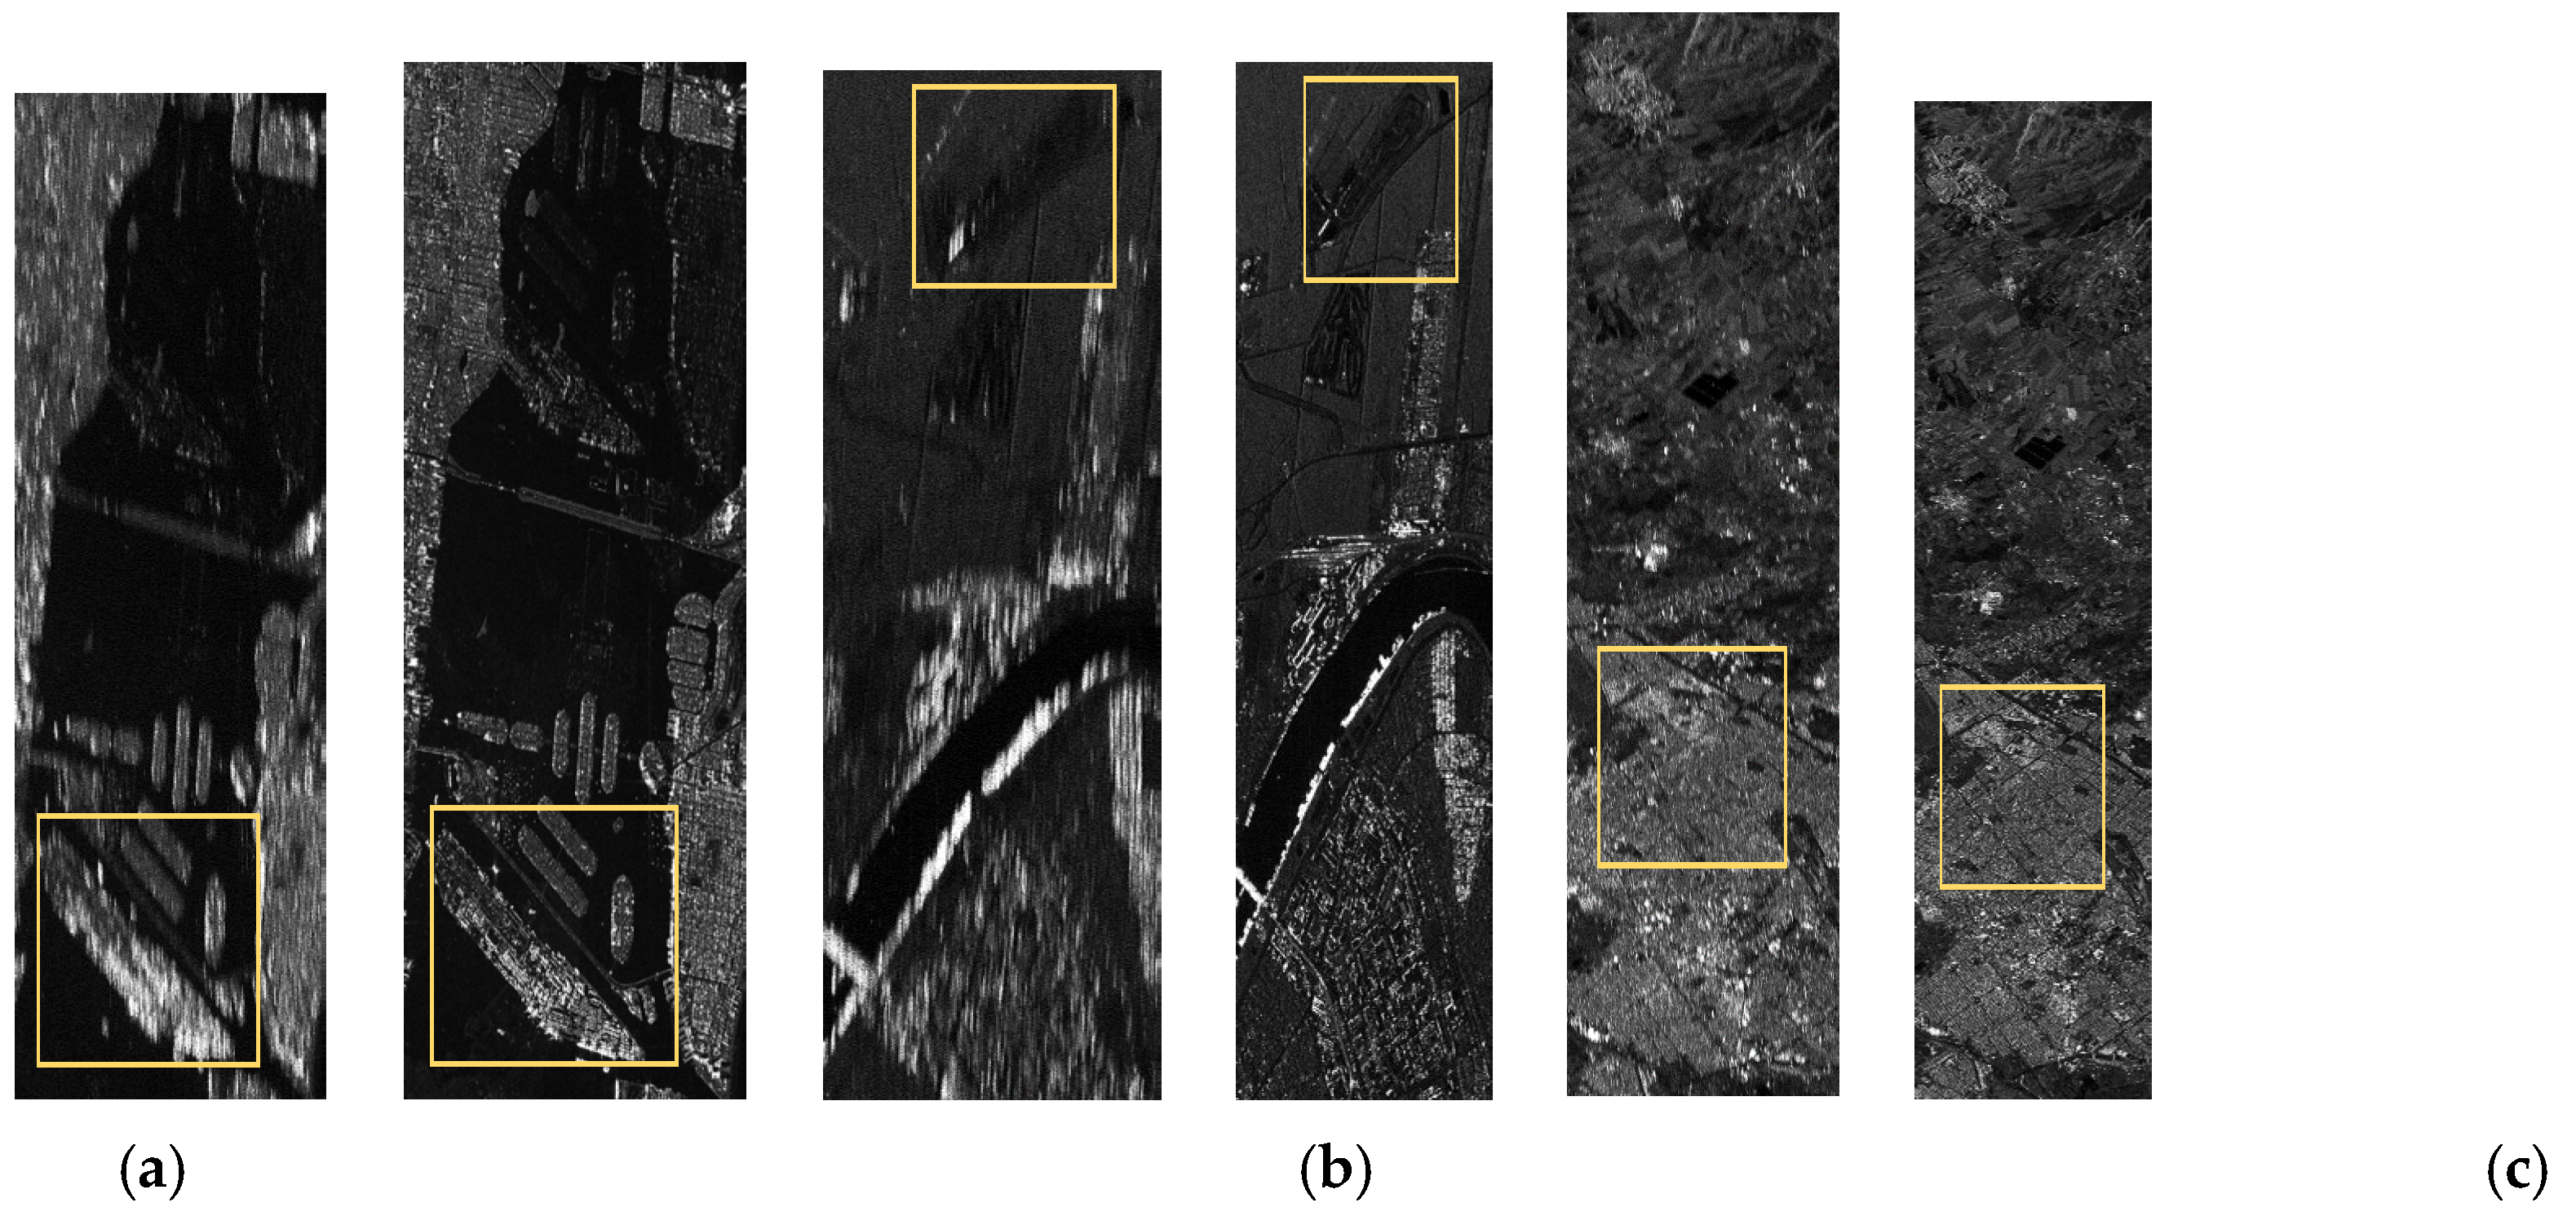
To validate the practical performance of the proposed technique, we utilized actual raw data from one of the satellites that are operating in space. The SAR system parameters are listed in Table 1. The satellite operates in the X-band frequency, and although the radar frequency of the three raw datasets is identical, the values of SAR system parameters such as duration, PRF, and bandwidth vary due to different orbital conditions depending on the monitored regions. We present comparative processed results between the conventional algorithm and the proposed algorithm, using the same raw data. The SAR image results of the proposed compensation method and the conventional method are given in Figure 7-(a), (b), and (c). The performance between the SAR images extracted by the two algorithms is significant. The SAR images produced by the conventional algorithm (left side of Figure 7) are distorted due to incorrect Doppler estimation. In contrast, the SAR images extracted using the proposed algorithm (right side of Figure 7) are clear and accurately focused.
When supporting inaccurate Doppler information, the conventional algorithm is significantly out of focus compared to that of the proposed compensation algorithm. Additionally, the expanded image highlighted by the yellow box in Figure 7 is shown in Figure 8 for a more precise comparison. We can find a clear difference in resolution between the two algorithms. From Figure 8-(a) ~ (c), the expanded SAR images, applied to the proposed technique, can be analyzed with various well-focused targets due to the high accuracy of matching between raw data and matched filter. Thus, even if the SAR system initially supports incorrect Doppler information, the proposed algorithm compensates for this by providing accurate Doppler information, resulting in a clearer and more informative SAR image. Additionally, Table 2 shows the performance of
Doppler estimation. Table 2 shows the Doppler values compensated using the proposed algorithm, derived from data with existing errors. The proposed algorithm consistently provides accurate Doppler estimation, enhancing the overall SAR image quality. These results validate the effectiveness of our technique in practical applications.

5. Conclusions

In this paper, we proposed an advanced algorithm to address the miscalculation of the Doppler chirp rate and Doppler centroid based on the Fractional Fourier Transform (FrFT) and cross-correlation techniques. Through the proposed algorithm, we effectively compensated for the Doppler effects, resulting in the extraction of high-quality Synthetic Aperture Radar (SAR) images. Our results demonstrate a significant performance with simple and streamlined methods, particularly under unexpected environmental conditions. The experimental results using actual satellite raw data validate the practicality and effectiveness of our proposed technique. The SAR images processed with our algorithm exhibited well-focused results and high accuracy compared to those processed with the conventional algorithm. This improvement is evident in the clear boundary lines and forms of targets, which are crucial for accurate terrain analysis and target identification. Our approach offers a robust solution for SAR image processing, adaptable to various platforms such as satellites, aircraft, and automobiles. In particular, SAR via aircraft provides substantial advantages in terrain reconnaissance, while SAR via automobile enhances autonomous driving capabilities. However, the iterative method employed in our algorithm for Doppler centroid estimation, though effective, can be constrained by factors such as the scene size of raw data and the step size of iteration. Future research will focus on refining these aspects to achieve even more precise Doppler centroid estimation. We anticipate that the proposed algorithm will contribute to the advancement of SAR techniques across multiple platforms, paving the way for more reliable and accurate remote sensing applications. The continued development and optimization of this algorithm will further enhance its applicability and performance, solidifying its role in the field of synthetic aperture radar.
Acknowledgment

All experimental raw data for verifying the proposed algorithm were acquired in Microwave and Antenna Laboratory (MALAB) and Satellite Technology Research Center (SaTReC) in Korea Advanced Institute of Science and Technology (KAIST). We would like to express our sincere gratitude to these institutions for providing the data, which played a crucial role in enabling the advancement of our research.

References

  1. Cusson, D.; Stewart, H. Satellite Synthetic Aperture Radar, Multispectral, and Infrared Imagery for Assessing Bridge Deformation and Structural Health—A Case Study at the Samuel de Champlain Bridge. Remote Sens. 2024.
  2. Ottinger, M.; Kuenzer, C. Spaceborne L-Band Synthetic Aperture Radar Data for Geoscientific Analyses in Coastal Land Applications: A Review. Remote Sens. 2020. [CrossRef]
  3. Kim, C.K.; Park, M.Y.; Shin, G.H.; Park, S.O. An Improved Technique for Single-Channel Video-SAR based on Fractional Fourier Transform. IEEE Trans. Aerosp. Electron. Syst. 2022, 58. [Google Scholar] [CrossRef]
  4. Bennett, J.R.; Cumming, I.G. A digital processor for the production of Seasat synthetic aperture radar imagery. Ρroc. SURGE Workshop 1979. [Google Scholar]
  5. Bamler, R. A comparison of range-Doppler and wavenumber domain SAR focusing algorithms. IEEE Trans. Geosci. Remote Sens. 1992, 30, 706–713. [Google Scholar] [CrossRef]
  6. Jin, M.Y.; Wu, C. A SAR correlation algorithm which accommodates large range migration. IEEE Trans. Geosci. Remote Sensing 1984, GE-22, 592–597. [Google Scholar]
  7. Raney, R.K.; Runge, H.; Bamler, R.; Cumming, I.G.; Wong, F.H. Precision SAR processing using chirp scaling. IEEE Trans. Geosci. Remote Sens. 1994, 32, 786–799. [Google Scholar]
  8. Cafforio, C.; Prati, C.; Rocca, F. SAR data focusing using seismic migration techniques. IEEE Trans. Aerosp. Electron. Syst. 1991, 27, 199–207. [Google Scholar] [CrossRef]
  9. Cumming, I.G.; Wong, F.H. Digital Processing of Synthetic Aperture Radar Data; Artech House: London, UK, 2005. [Google Scholar]
  10. Park, J.S.; Kim, C.K.; Park, S.O. A stretched deramping radar technique for high-resolution SAR processing in Ka-band using the extended integration time. IEEE Trans. Instrum. Meas. 2023, 72, 1–11. [Google Scholar] [CrossRef]
  11. Zhang, S.-X.; et al. Multichannel HRWS SAR imaging based on range-variant channel calibration and multi-Doppler-direction restriction ambiguity suppression. IEEE Trans. Geosci. Remote Sens. 2014, 52, 4306–4327. [Google Scholar] [CrossRef]
  12. Borsellino, A.; Poggio, T. Convolution and Correlation Algebras. Kybernetik 1973, 13, 113–122. [Google Scholar] [CrossRef]
  13. Kim, C.K.; Lee, J.S.; Chae, J.S.; Park, S.O. A Modified Stripmap SAR Processing for Vector Velocity Compensation Using the Cross-Correlation Estimation Method. J. Electromagn. Eng. Sci. 2019, 19, 159–165. [Google Scholar]
  14. Almeida, L.B. An introduction to the angular Fourier transform. Proc. 1993 IEEE Int. Conf. Acoust. Speech Signal Processing 1993.
  15. Almeida, L. The fractional Fourier transform and time-frequency representations. IEEE Trans. Signal Process. 1994, 42, 3084–3091. [Google Scholar] [CrossRef]
  16. Sejdic, E.; Djurovi, I.; Stanković, L. Fractional Fourier transform as a signal processing tool: An overview of recent developments. Signal Process. 2011, 91, 1351–1369. [Google Scholar] [CrossRef]
  17. Li, S.; Cumming, I. Improved Beat Frequency Estimation in the MLBF Doppler Ambiguity Resolver. In Proceedings of the 2005 IEEE international Geoscience and Remote Sensing Symposium, Seoul; 2005; pp. 3348–3351. [Google Scholar]
Figure 1. The strip-mode operation in spaceborne-SAR.
Preprints 118195 g001
Figure 2. Overview of the range-Doppler algorithm.
Preprints 118195 g002
Figure 5. Block scheme of the proposed algorithm.
Preprints 118195 g005
Figure 6. The procedure of processing the proposed technique in the time-frequency domain. (a) unexpected raw signal and expected matched filter, (b) Doppler rate matching in the Doppler rate estimation, (c) Doppler centroid shifting in the Doppler centroid estimation, (d) unexpected raw signal and reconstructed matched filter.
Preprints 118195 g006
Figure 7. SAR images extracted using the conventional algorithm (left) and the proposed algorithm (right) from (a) raw data I, (b) raw data II, (c) raw data III.
Preprints 118195 g007
Figure 8. The part of yellow boxes of the expanded Figure 7 (a) raw data I, (b) raw data II, (c) raw data III.
Preprints 118195 g008
Table 1. Specifications of the SAR system.
System Parameter Value
Radar frequency X-band
Radar Type Chirp Pulse Radar
Operation Mode Standard Mode (Side Looking)
Flying height Low Earth Orbit (LEO)
Table 2. The values of chirp rate and Doppler centroid processed by the conventional algorithm and the proposed algorithm from each raw data set.
The conventional algorithm The proposed algorithm
Raw data I Estimated Chirp rate 4055.6 4406.6
Estiamted Doppler centroid -448 Hz -499 Hz
Raw data II Estimated Chirp rate 4547 4860.5
Estiamted Doppler centroid 815 Hz 765 Hz
Raw data III Estimated Chirp rate 4929.2 5168.8
Estiamted Doppler centroid -828 Hz -878 Hz
Disclaimer/Publisher’s Note: The statements, opinions and data contained in all publications are solely those of the individual author(s) and contributor(s) and not of MDPI and/or the editor(s). MDPI and/or the editor(s) disclaim responsibility for any injury to people or property resulting from any ideas, methods, instructions or products referred to in the content.
Copyright: This open access article is published under a Creative Commons CC BY 4.0 license, which permit the free download, distribution, and reuse, provided that the author and preprint are cited in any reuse.
Prerpints.org logo

Preprints.org is a free preprint server supported by MDPI in Basel, Switzerland.

Subscribe

© 2024 MDPI (Basel, Switzerland) unless otherwise stated