Preprint
Article

Automatically Detected CSES Ionospheric Precursors During Aftershocks of the Wushi MS 7.1 Earthquake on 23 January 2024 in Northwest China

Altmetrics

Downloads

59

Views

25

Comments

0

A peer-reviewed article of this preprint also exists.

This version is not peer-reviewed

Submitted:

19 September 2024

Posted:

19 September 2024

You are already at the latest version

Alerts
Abstract
Launched on 2 February 2018, CSES is the first constellation in China to advance our understanding of seismo-ionospheric influence and lithosphere-atmosphere-ionosphere coupling process in electromagnetic environment during earthquake prediction practice. For this purpose, a software platform developed for automatically searching ionospheric perturbations from the CSES plasma data had been put into service immediately after the Wushi MS 7.1 earthquake occurred on 23 January 2024 to weekly detect possible precursory information before impending aftershocks. Effective ionospheric variations were successfully detected two times during more than four weeks. An ionospheric perturbation with an enhanced magnitude 38.3% was primarily detected on electron density but none on ion density on 24 January 2024 at night orbit 33175 and the corresponding variations in different parameters recorded at the same orbit presented a complex features. There irregularities possibly combined with influence both from three following strong aftershocks with magnitudes over 5.0 during 25–30, January and magnetic storm disturbance due to Kp value once up to 3.7 on 24 January. An electron perturbation with an amplitude 24.6%, as well as an ion one with 27.3%, was successfully searched automatically at the same revisiting orbit 33251 occurred on the revisiting date of 3 February 2024 in a magnetic quiet period. These two plasma variations, as well as ones on other ionospheric parameters, were characterized by highly similar properties, which increases the availability as seismic precursors. However, no obvious variations had been observed at other revisiting orbits or other orbits near the aftershock areas during this period till the occurrence of a magnitude 5.3 earthquake on 24 February and the strongest one 5.8 on 25 February, respectively, 20 days after and 1000 km away.
Keywords: 
Subject: Physical Sciences  -   Space Science

1. Introduction

The ionosphere, a well-conductive layer of Earth's upper atmosphere, exhibits complex behaviors influenced by various geophysical processes originated from the upper and the lower. On one hand, solar activities like solar flare, solar wind and solar scintillation can release a large amount of energy particles that affect directly or indirectly on the formation and features of the Earth’s ionosphere. On the other hand, the ionosphere can also be impacted from natural events and human activities, such as seismic activities, volcanoes, tsunamis, communication and so on [1,2,3,4,5]. However, as a faint factor on the ionosphere, investigating and analyzing seismo-ionospheric influences can provide critical insights into understanding the precursory signals preceding seismic activities, as well as the mechanism of lithosphere-atmosphere-ionosphere coupling (LAIC). It can also give its potential implications for earthquake prediction, a large challenging target in the world so far.
Pursuing ionospheric precursors associated with seismic activities has always been the main topic as the development of the remote sensing measurement on the Earth. Though ionospheric irregularities prior to the huge America Alaska earthquake on March 28, 1964 were reported as early as 1965[6], intensive investigations on ionospheric variations preceding seismic events gradually become more and more attractive as modern air-born satellite receivers rise, especially after the launch of the DEMETER (Detection of Electro-Magnetic Emissions Transmitted from Earthquake Regions) satellite in June 2004 in France [7]. From then on, investigations on seismo-ionospheric influence have been focused on quantitative temporal-spatial evolution features instead of simple qualitative anomaly identifications, as well as on detailed LAI coupling process. The crucial properties of the seismo-ionospheric influence mainly include occurrence time, location and corresponding varied magnitude of the precursory signals.
Parrot [8,9] have reported that variations on ionospheric parameters registered via DEMETER satellite before the real EQs increase apparently than that attained from randomly generated EQs. Utilizing different stages’ of DEMETER measurement on electrical fields, Němec et al. [10,11] and Píša et al. [12,13] have reported that statistical ionospheric influence obviously appeared 4 hours before strong EQs. Pulinets et al. [14] have presented that occurrence probability of ionospheric anomaly within 5 days is 73% for magnitude 5 EQs and 100% for magnitude 6 ones and the spatial scale of ionospheric effect for strong EQs is near 20°in longitude, as well as in latitude. A heavy research has been focused on the seismo-ionospheric influence since the Wenchuan MS 8.0 earthquake took place on May 12, 2008 in China and anomalous information has been increasingly explored at least from ionospheric parameters monitored by ground-based ionosonde, DEMETER satellite, ground-based GPS satellite, six microsatellites of FORMOSAT3/COSMIC (F3/C) and CHAMP satellite. Li et al. [15] have made a summary on these measurements and reported that ionospheric variations of amplitudes of 20–123% appeared primarily one month, mainly in two weeks and collectively within one week prior to the main event. The GPS TEC anomalies happened within a range of 20° in south-east around the epicenter area, as well as in its magnetically conjugated area [16] in space and their space sizes could extend up to 2850 km in longitude and 1650 km in latitude [17]. Akhoondzadeh et al. [18] have analyzed irregularities on DEMETER ion density and electron density and GPS TEC before four strong earthquakes (EQs) of the 2009 Samoa islands MW 8.1 EQ, the 2008 Sichuan MW 7.9 EQ, the 2009 L’Aquila MW 6.3 EQ and the 2006 Hormozgan MW 6.0 EQ during geomagnetic quiet conditions and reported that the positive and negative anomalies appear 1 to 5 days prior to these events. Further, more variation details have also been revealed: 67% for DEMETER parameters and GPS TEC before the Samoa MW 8.1 EQ; -52% and -37% for ion density and electron density, and -24% for TEC before the Sichuan MW 7.9; 47% and 15% for electron density and ion density, and 28% for TEC before the L’Aquila MW 6.3 EQ; 36% for electron density and 21.5% for TEC before the 2006 Hormozgan MW 6.0 EQ. These varied amplitudes tend to illustrate the fact that changed ionospheric amplitudes increase as the increase of the magnitudes of considered EQs.
A large number of investigations on seismo-ionospheric influence seem to reach a common sense that ionospheric information easily happen two weeks prior to the seismic events and it can be considered as short-term precursors, while unspecified location where these precursory signals tend to appear has not confirmed yet possibly due to a low space resolution and dependence of local time of satellite observations.
An automatic detection method on ionospheric perturbations with space size 20 s ≤ t ≤ 120 s around the main seismic belts in the world has been initially developed by Li and Parrot [19] and then it is improved to search ionospheric perturbations globally with the same properties as before [20,21]. Automatic detected ionospheric perturbations from the DEMETER and the CSES (China Seismo-Electromagnetic Satellite) satellites are to correlate with strong earthquakes with a magnitude equal to or more than MW 4.8 surrounding the epicenters, as well as their magnetically conjugated points within a temporal-spatial window of 1500 km and 15 days. Some results have been qualitatively attained: I the detection rate of EQs increases as the magnitude increases and the depth decreases; II the occurrence probability of seismo-ionospheric perturbations is higher in the earthquake day and then decreases gradually as the time goes; III there are disadvantageous areas like the South Atlantic Magnetic Anomaly (SAMA), where there is a high EQ detection rate but the detected perturbations are with less reliability to EQs due to small ionospheric disturbances induced by frequency E×B drift, while comparatively in low-mid latitude area in the northern hemisphere, there is a low detection rate but the detected perturbations are more reliable and their occurrence probability within one week can be up to 80%; IV the high data resolution can enhance the detection rate but cannot affect temporal evolution characteristics of seismo-ionospheric influence; V ionospheric irregularities tend to happen in the east of the epicenters and west in their conjugated points; VI the percentage of ionospheric perturbations appearing within 1000 km from the epicenters of earthquakes is 70.4% in mid-low latitude areas; VII statistically, the varied amplitudes and space sizes of ionospheric variations increase as the magnitudes of considered EQs increase.
Recently, ionospheric perturbations with a prolonged space size 20 s ≤ t ≤ 300 s (140–2,100 km if the satellite velocity 7 km/s is considered) have been detected from the plasma data measured in-situ by the CSES over three years from 1 August 2018 to 31 December 2021, as well as by the DEMETER satellite about six years [23,24]. It has been revealed that the ionospheric models can be well established via these perturbations and large-scale ionosphere structures such as the Equatorial ionization anomaly (EIA), the Weddle sea anomaly (WSA), the SAMA, etc. can be clearly described by ionospheric perturbations with large amplitudes and large space sizes [23,24] and their inner properties have also been further depicted by Li et al. [25]. Statistical work has been performed to examine the correlation between electron and ion density perturbations of the CSES satellite and strong seismic activities. A quantitative result on the temporal-spatial feature of seismo-ionospheric influence has been tentatively specified: in time, the ionospheric effect mainly appears within 5 days prior to EQs for both electron density and ion density and shifts 500–700 km from the mid-low latitude epicenters instead of right above them only for electron density but none for ion density in this point possibly due to its low availability of contaminated sensors on PAP payload one month after the CSES launch [26]. While the right amplitude and space size of a seismo-ionospheric variation has not been specified but it has been testified that perturbations with a magnitude less than 100% and a space size less than 120 s could depict well a temporal-spatial characteristics of seismo-ionospheric effect [23]. These promising results can contribute to the development of more reliable earthquake prediction methods and can be integrated into existing earthquake prediction frameworks to enhance their accuracy and with incorporating ionospheric data as a precursor signal.
The CSES satellite was successfully launched on 2 February 2018. Part data have been tentatively considered as a candidate during earthquake prediction practice to search for possible precursory signals preceding seismic activities in China since the end of April 2020. Contouring maps were primarily utilized to process plasma data measured weekly via the CSES satellite. Obvious ionospheric irregularities were successfully put forward 14 days prior to the 22 May 2021 Maduo MS 7.4 EQ, and 11 days to the 8 January 2022 Menyuan MS 6.9 EQ [27]. However, data contouring method is gradually showing its shortcomings during this work: high amplitude anomalies could cover low ones, that is, contour map cannot present all positive and negative anomalous points in the total map. Under these conditions, an automatic detection method has been alternatively put into service after the last Wushi MS7.1 earthquake occurred on 23 January 2024 and obvious plasma variations were successfully detected during its aftershocks. So, in this paper, the CSES satellite is introduced in Section 1. In Section 2, the automatic detection method and its use in data processing will be presented. The CSES ionospheric perturbations detected automatically via software during the last 25 February 2024 will be introduced in Section 3. Discussion and conclusions are provided in Section 4 and Section 5, respectively.

2. CSES Satellite

The China Seismo-Electromagnetic Satellite (CSES, also called ZH-1) was launched successfully on 2 February 2018. This satellite aims to preliminarily explore the characteristics and mechanisms of seismogenic ionospheric responses during seismic activities, based on real-time in-situ monitoring of irregularities in the state of space electromagnetic environments [28]. The CSES is a Sun-synchronous satellite orbiting at a height of 500 km with a descending node of 14:00 local time (LT) and its revisiting period is 5 days. Eight scientific payloads are onboard the CSES, an electric field detector (EFD), a search-coil magnetometer (SCM), a high precision magnetometer (HPM), a plasma analyzer package (PAP), a Langmuir probe (LAP), an energetic particle detector (HEPP), a GNSS occupation receiver (GNSS), and a three-band beacon (TBB). More details on these payloads can be referred to their corresponding literatures [29,30].
Concerning to the scientific payloads of the LAP and the PAP onboard the CSES, the LAP predominantly measures in-situ electron density and its temperature and the PAP measures ion densities (H+, He+ and O+) and their flying speeds. Two kinds of utilized data sampling working modes are employed here: survey mode with a low sampling rate and burst mode with a high rate. The former is working all around the world except areas, where the main seismic belts and China lie when the later measuring mode works. Corresponding to these working modes, data sampling rates are 1 s and 0.5 s for the LAP, and 3 s and 1.5 s for the PAP, respectively [29].

3. Automatic Detection Method

An automatic detection method has been primarily developed into software to search and identify ionospheric variations in dealing with large amounts of plasma data measured by DEMETER satellite since 2012 [19]. Investigations on relationship between automatically searched ionospheric perturbations and global strong earthquakes have been continuously conducted [20-25,31]. The software is gradually improved from functional modules to interface during this period to adjust to different data storage formats from the DEMETER to the CSES. The interface primarily established in 2012 [19] has been currently updated for ion data of the CSES as Figure 1. Here, two variable parameters have to be specified before running of the software: one is Latitude limit that usually is set to 90°, while it is set to a lower value to avoid the influence of the solar on the ionosphere sometimes. Another is Peak time limit, which shows the maximum value in minute of space scales of expected plasma perturbations and is generally specified to 2 minutes for seismogenic ionospheric influence [23]. At the same time, the minimum value of space scale is the same as before and set to 20 s to ensure their have a definite duration time to avoid pulse-like variations.
An example has been given here in an effort to present to the process of searching ionospheric perturbations for this software. The Level 2 data along the orbit 21668_1 measured by CSES on 28 December 2021 has been processed as an input file by the software and the output only does work on O+ density parameter. The finally run interface can be seen in Figure 1. It is clear from Figure 1 that two O+ perturbations (blue dots) have been accepted along this orbit.
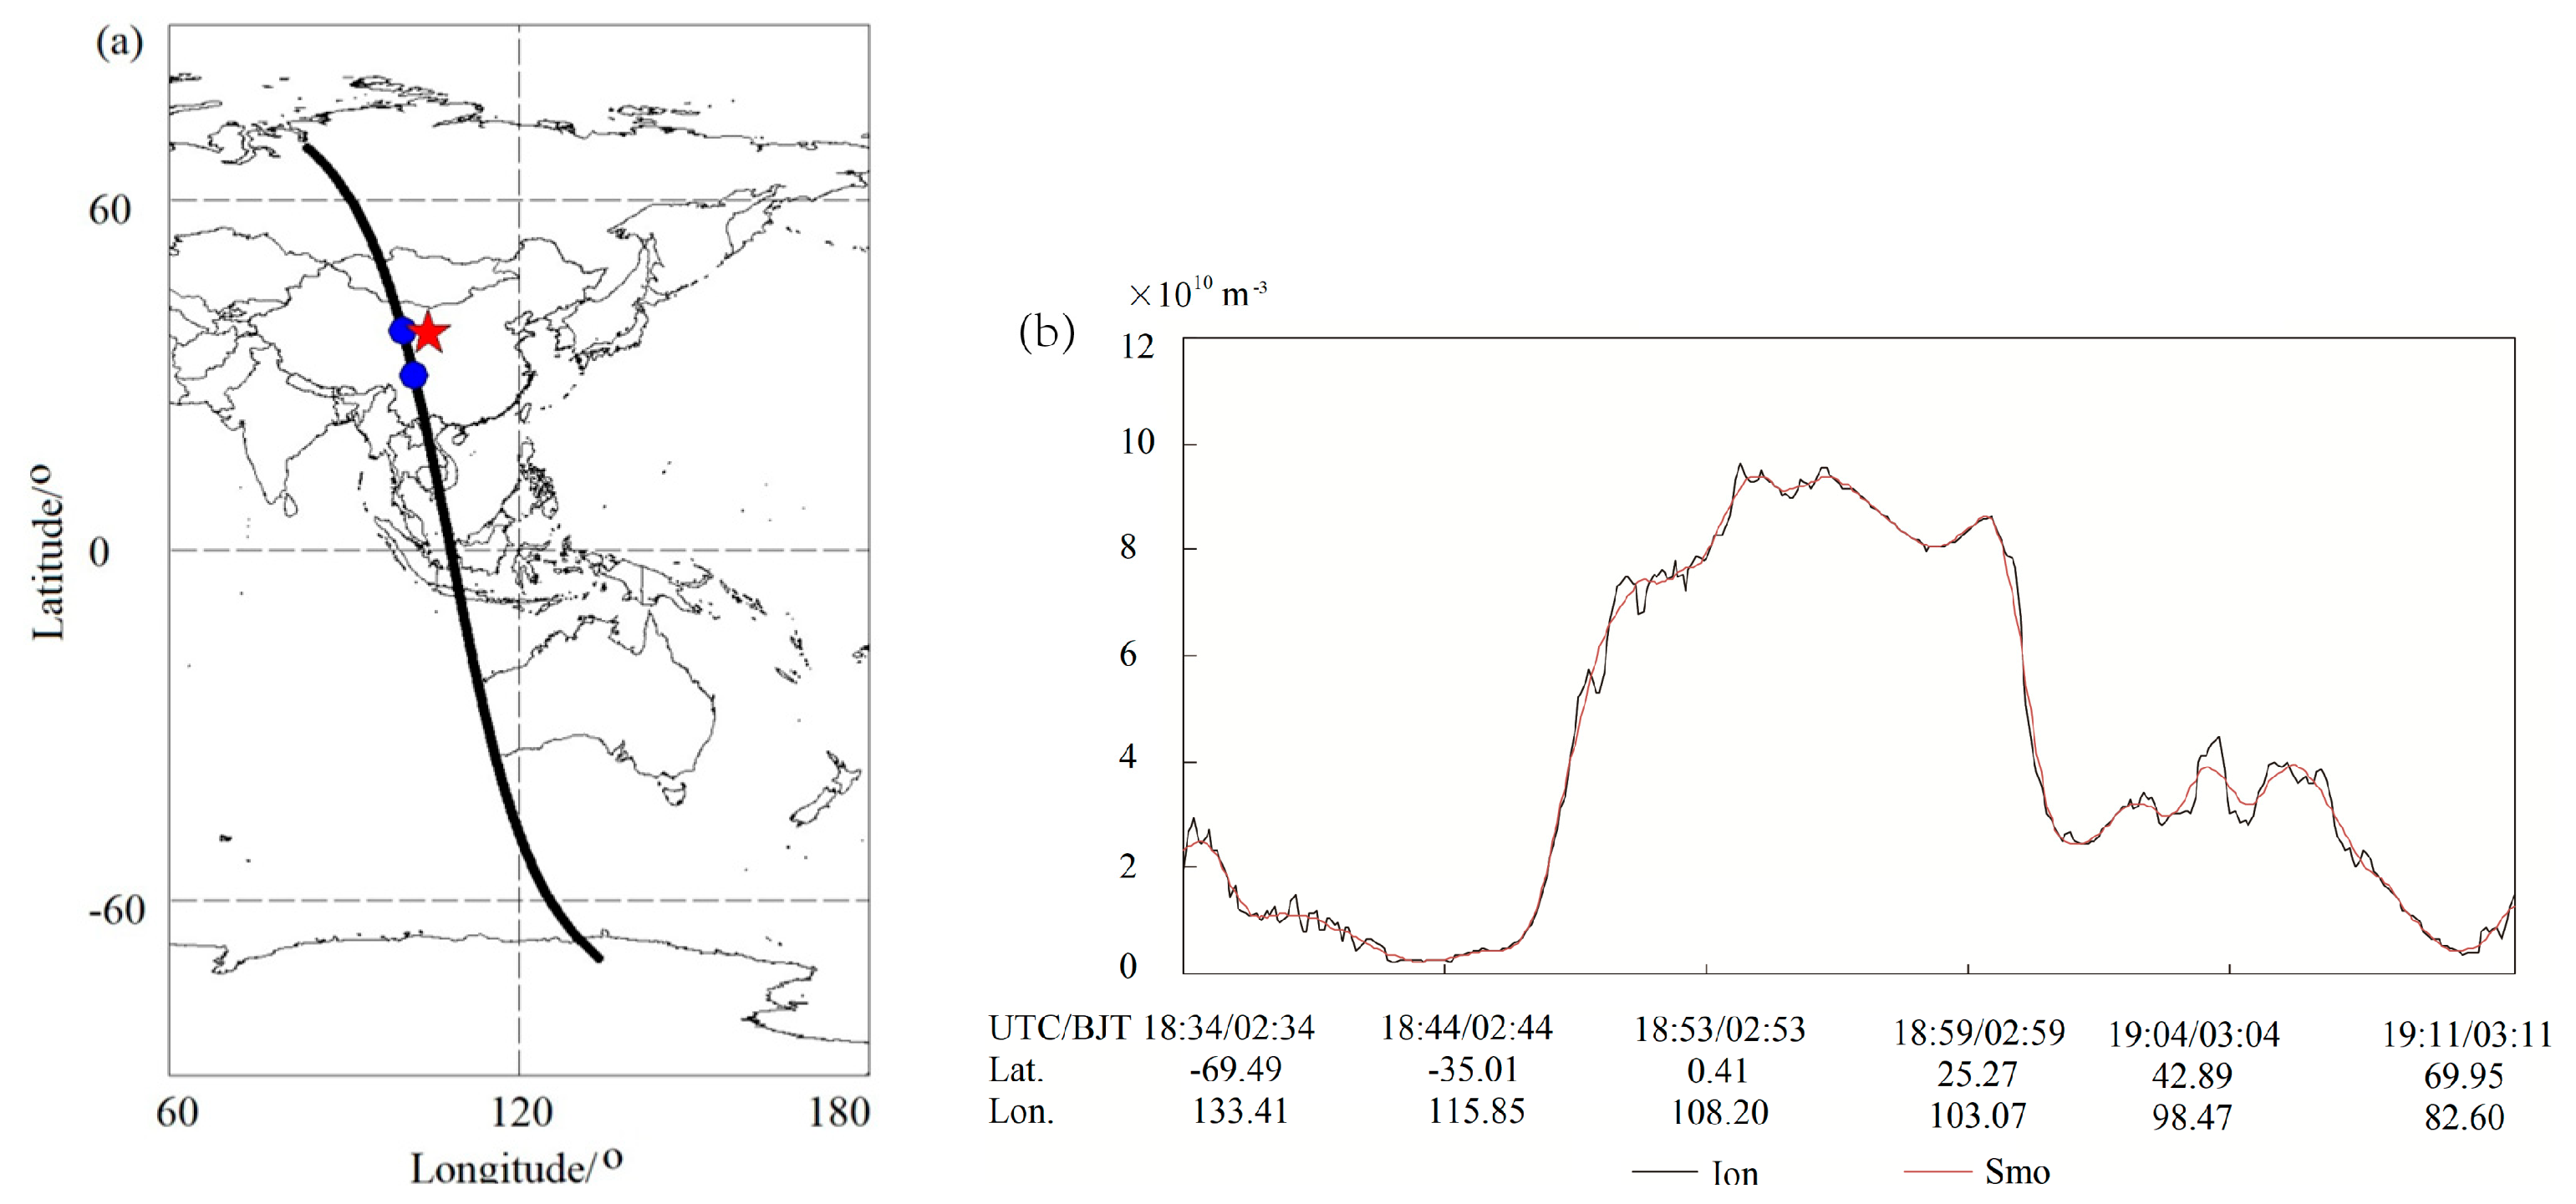
Figure 2a presents the flying line along this orbit 21668_1 (black dot line) in the map. Two blue dots stand for the same locations of searched perturbations as shown in Figure 1 and the red star is the Menyuan MS 6.9 earthquake occurred on 8 January 2022 in northwest China. The recorded O+ density along this orbit during night time is shown in Figure 2b with black line (Ion) and its smoothed data using the SAVGOL function has been lined in red (Smo), where ionospheric perturbations complying with the set parameters in Figure 1 have been searched and their corresponding information are output. Two searched perturbations are labelled with P1 and P2, respectively. It is well known that P1 near the epicentre of the 8 January 2022 Menyuan MS 6.9 earthquake had been recognized as ionospheric precursor occurred 11 days before and only 120 km away [27] and another with an amplitude of 4.1% tends to be background irregularities usually less than 10% [23].
The corresponding information of these two detected perturbations is displayed in Table 1.

4. Automatically Searched Plasma Perturbations during Aftershocks of the Wushi MS 7.1 Earthquake

An earthquake with a magnitude MS = 7.1 abruptly hit the Wushi area, Xinjiang province in northwest China at 02:09:05 CST (China Standard Time) on 23 January 2024, with an epicenter located at 41.20°N and 78.72°E and a depth of 22 km. This earthquake locates only 6 km away from a sub-fault of the Maidan fault in Tianshan seismic belt and the stress originates from the collision between the Indian plate and the Eurasian plate, generating a series of reverse fault seismic activities involving this event. A series of aftershocks successively occurred one by one and Table 1 shows aftershocks with a magnitude more than 5 till 25 February, 2024, after that, no shocks with magnitudes more than 5 happened. From Table 1, most of the aftershocks with a magnitude more than 5 occurred within 3 following days after the main shock. Only two aftershocks of a MS5.3 and a MS5.8 took place at the end of February, one month after the last strong aftershock.
The distribution of this Wushi earthquake sequence is displayed in Figure 3. The main shock occurred within the area of the Wushi county and in the north of one reverse sub-fault of the Maidan fault. All aftershocks with a magnitude more than 5 took place within 20 km from the main shock while most of them including the biggest MS 5.8 on 25 February are in Aheqi area (See Figure 3). So in the following part, only the main shock has been labeled in Figure 4 to display their relative locations with detected corresponding ionospheric perturbations.

4.1. Automatically Detected Ionospheric Perturbations

The automatic detection method was put into service immediately after this Wushi MS 7.1 event to mainly trace nighttime electron density, as well as ion (O+) densities as a comparison, weekly to monitor possible precursory signals during impending aftershocks. The electron density is considered as the main data during this period due to the contaminated sensors on PAP payload one month after the CSES launch [32], while Positive results from this payload have been reported [22,27,32]. Therefore, it is believed that the corresponding ion perturbations and electron ones are more reliable if one earthquake is detected at the same time by these two parameters [33].
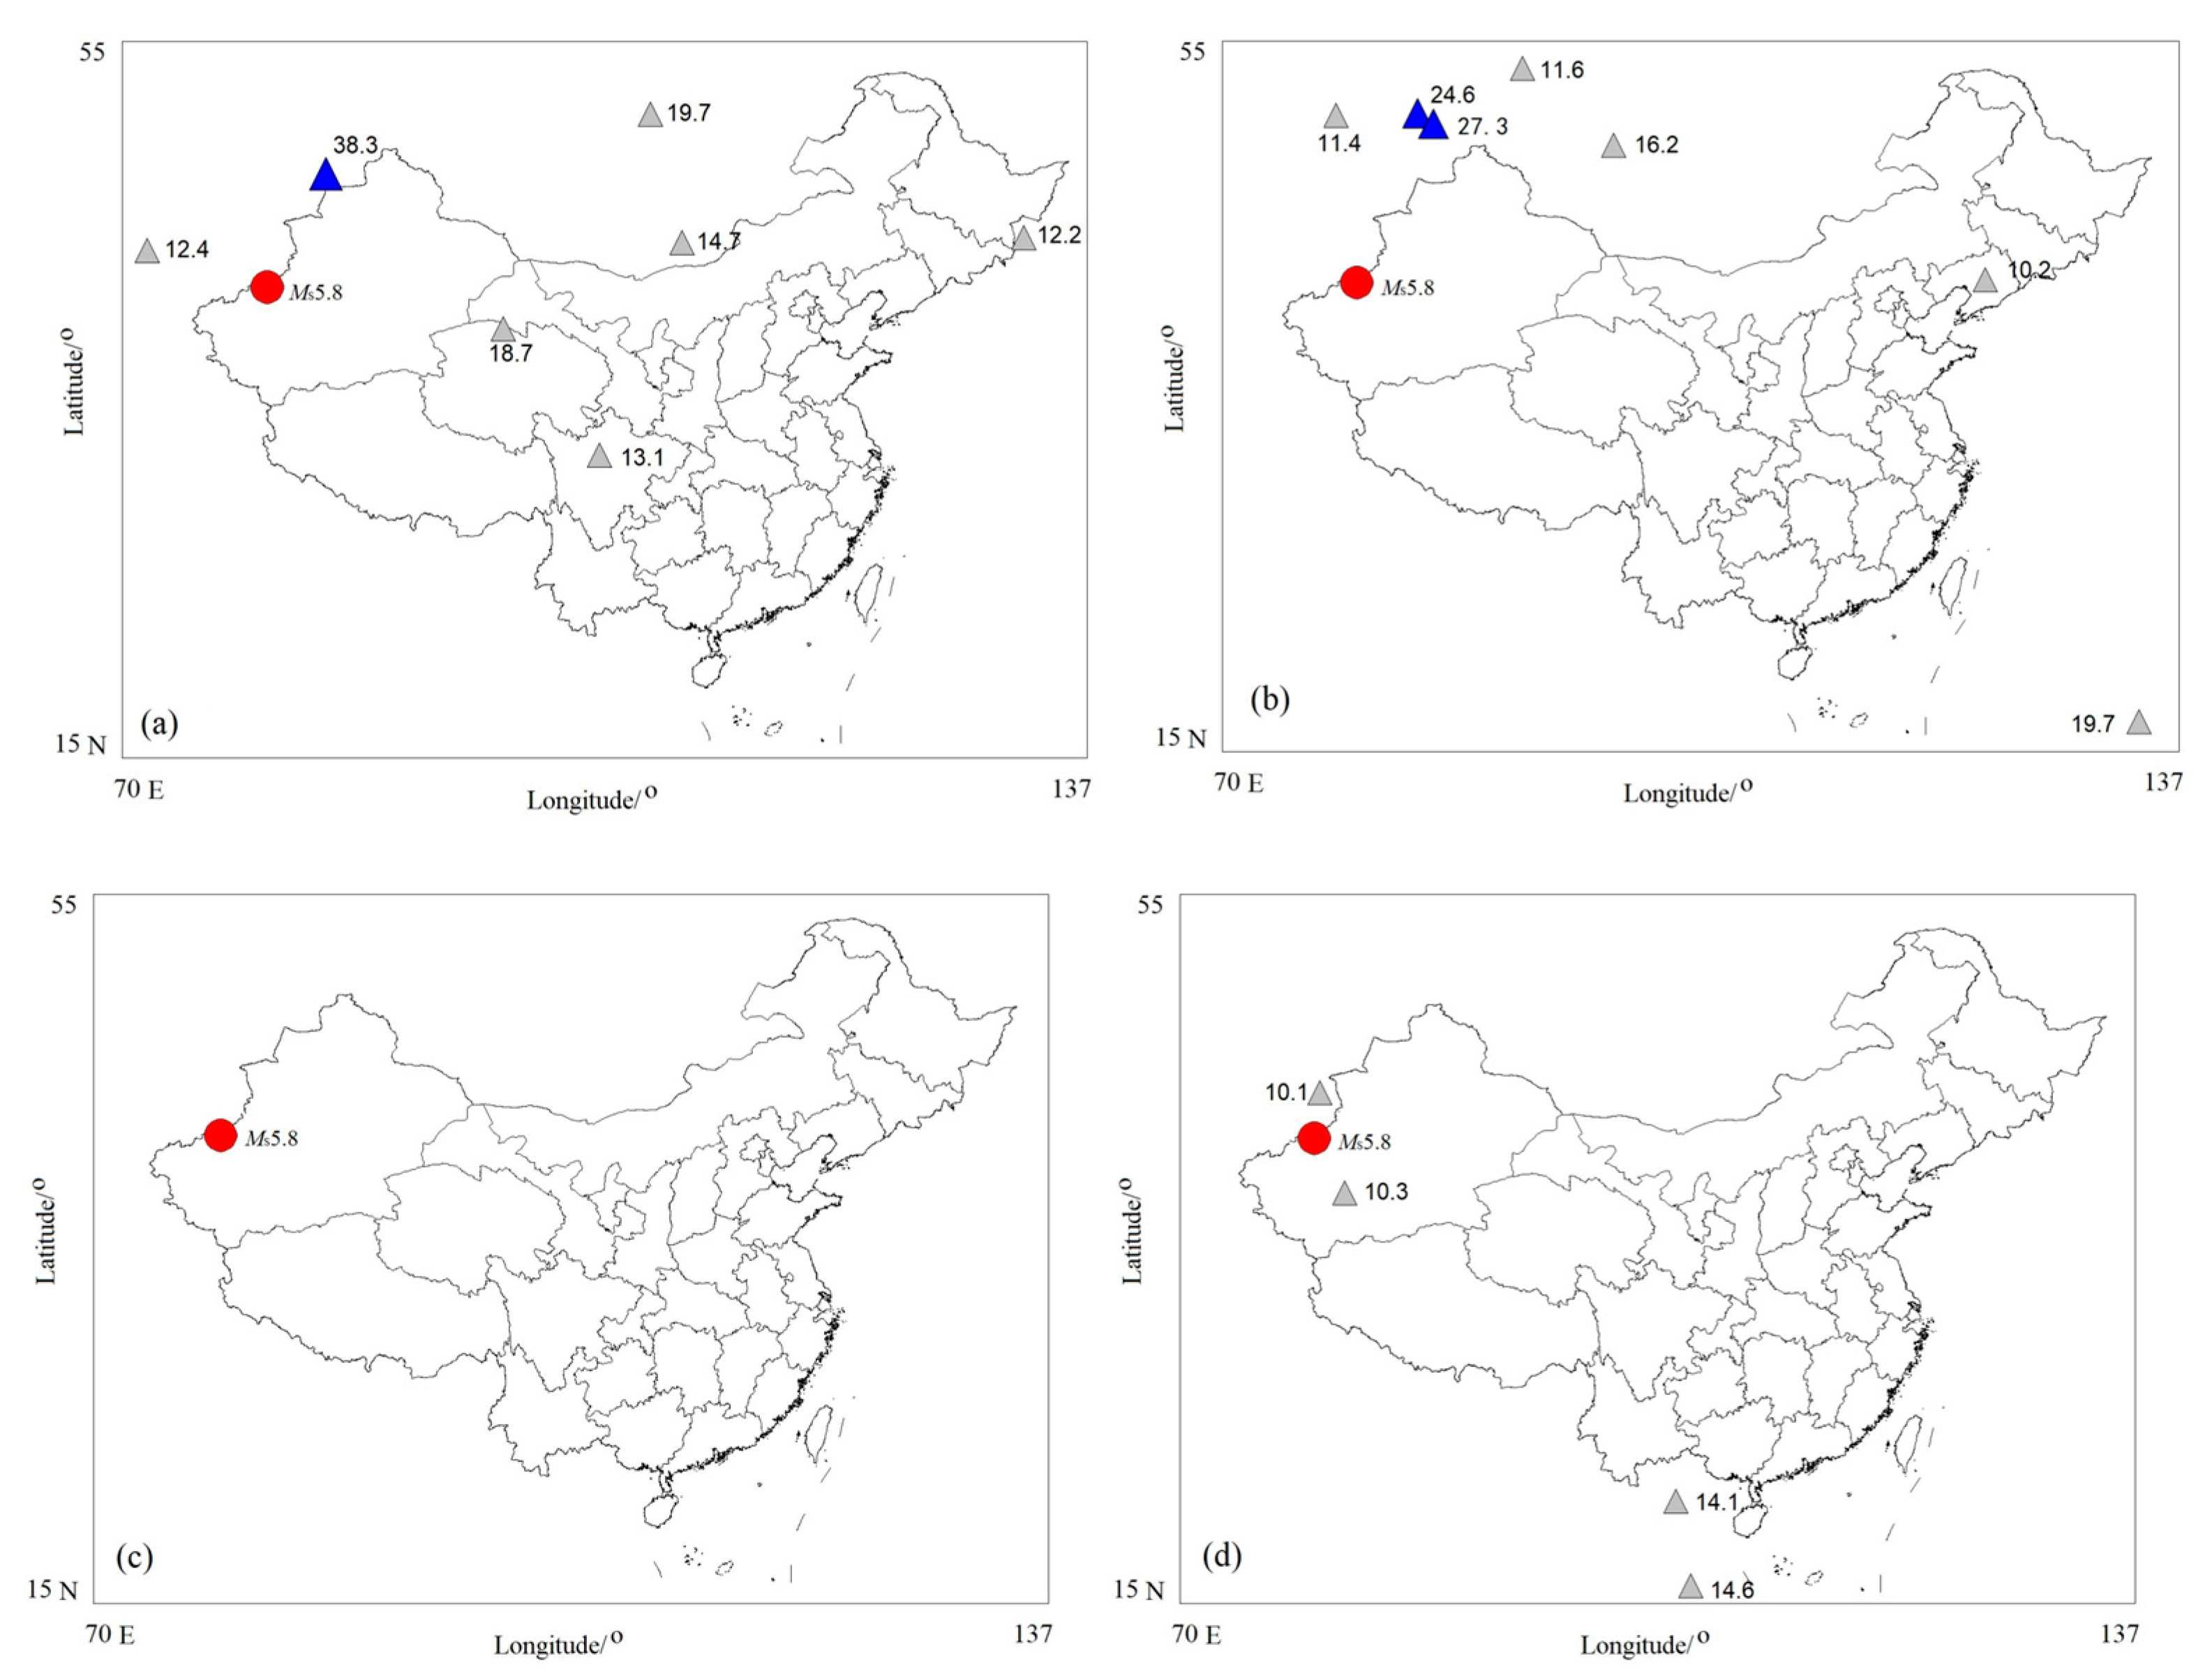
One point is, perturbations with an amplitude less than 10% are generally ignored due to their variations immerged into the background irregularities of the ionosphere [23] when this method is utilized in earthquake prediction practice. While ones with this parameter beyond 20% are visually considered more reliable during this period although it is possible that seismic activities can induce variable amplitude disturbances. Another point is that only perturbations lying in latitude range 15–55°N and longitude range 70–135°E area covering the total China are displayed in different colors of grey for ones with a amplitude of 10–20% and blue of > 20% in map weekly. Once a precursory perturbation is proposed, its effective period is two weeks unless new perturbations appear on the same revisiting orbits [27].
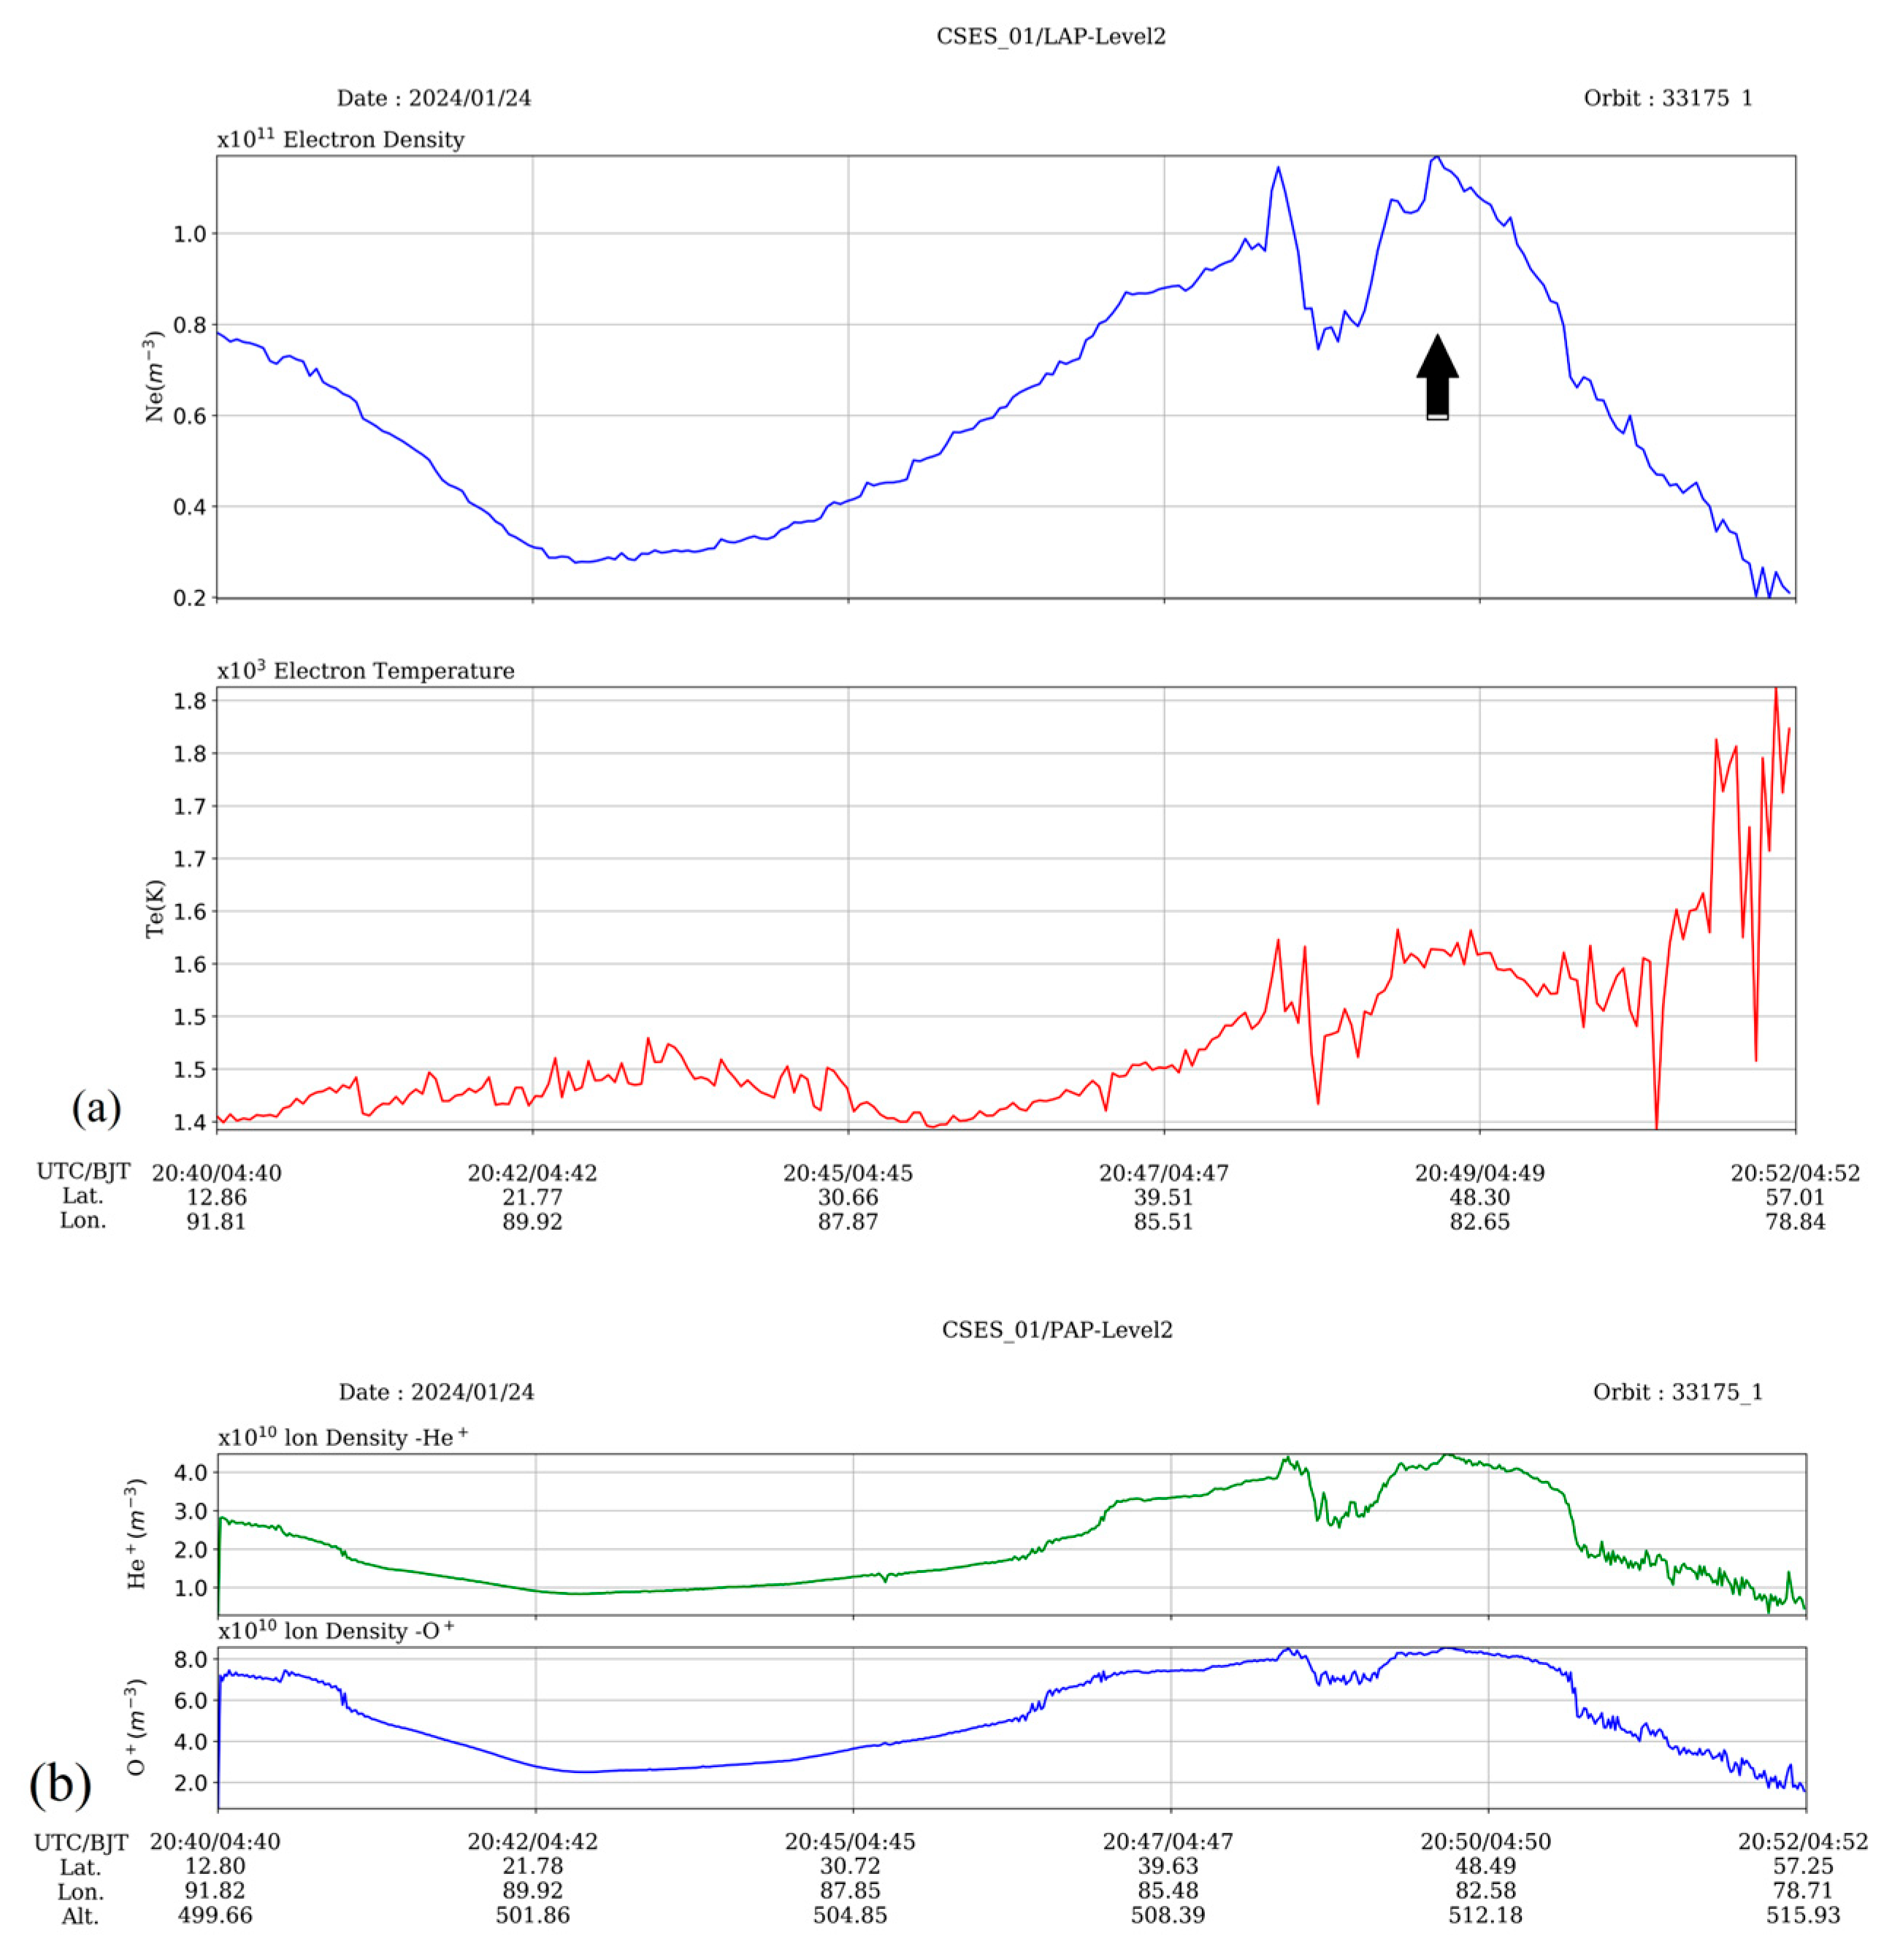
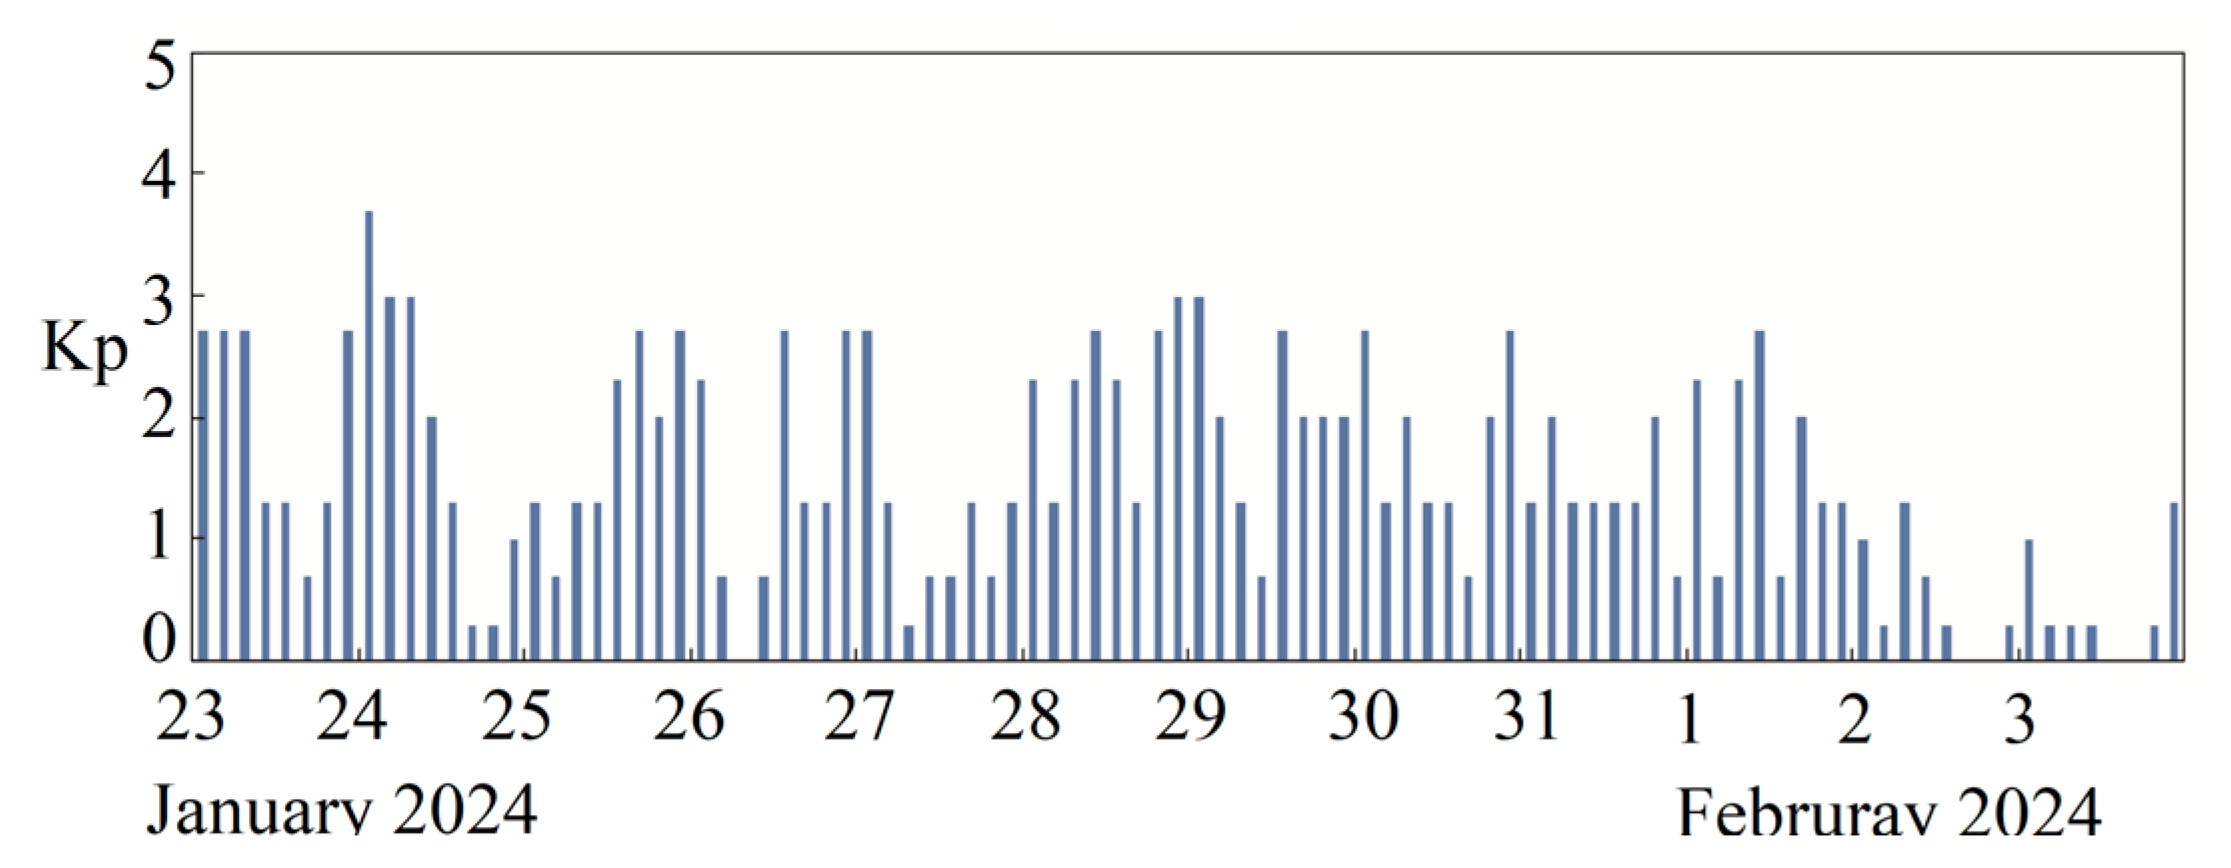
Figure 4 presents the ionospheric perturbations searched automatically via software week by week from January 24 2024 after the Wushi main shock to February 24 2024, one day prior to the biggest aftershock MS 5.8. A plasma perturbation on the electron density was firstly detected successfully during 24–30 January, 2024 and it is shown in Figure 4a with a blue triangle. Its related information has been listed in Table 2 as Pe1. From Table 2, it is obvious that this ionospheric irregularity took place on January 24, 2024 in the night orbit 33175 with an increased amplitude of 38.3%, which can be considered as a precursory variation due to its magnitude more than 20%. But no ion perturbations had been searched at the same orbit, or none at the other orbits covering considered area in this investigation. At the same time, variations of different plasma parameters like electron density, electron temperature, as well as ion densities were also examined. Pictures of these parameters output automatically from the CSES satellite data processing system are displayed in Figure 5. From the top to the bottom of Figure 5, there are fluctuations of electron density, electron temperature, He+ density and O+ density, respectively. In Figure 5, the electron perturbation detected via software and listed in Table 2 as Pe1 has been labeled with a black arrow at the top panel in Figure 5a. While, from Figure 5, all parameters are totally characterized by a synchronous variation: first decrease and then increase, but no perturbations were detected via software under the specified space size of 2 minutes. However, it is well known that contrary variations of electron density and electron temperature are generally recorded during seismic activities [18]. Furthermore, Kp index with eight three-hour averaged values each day was checked and shown in Figure 6. It is clear from Figure 6 that the Kp value on January 24 once reaches 3.7, indicating that ionospheric variations registered in the same day possibly occurred during a magnetic disturbed period. Even that, we proposed these variations as precursory signals at that time but with some uncertainty.
After that, three aftershocks with magnitudes of MS 5.2, MS 5.6 and MS 5.7 took place respectively on 25, 26 and 30 January well within two weeks after the detected electron disturbance, approximately 700 km away from the location where electron perturbation was searched on January 24.
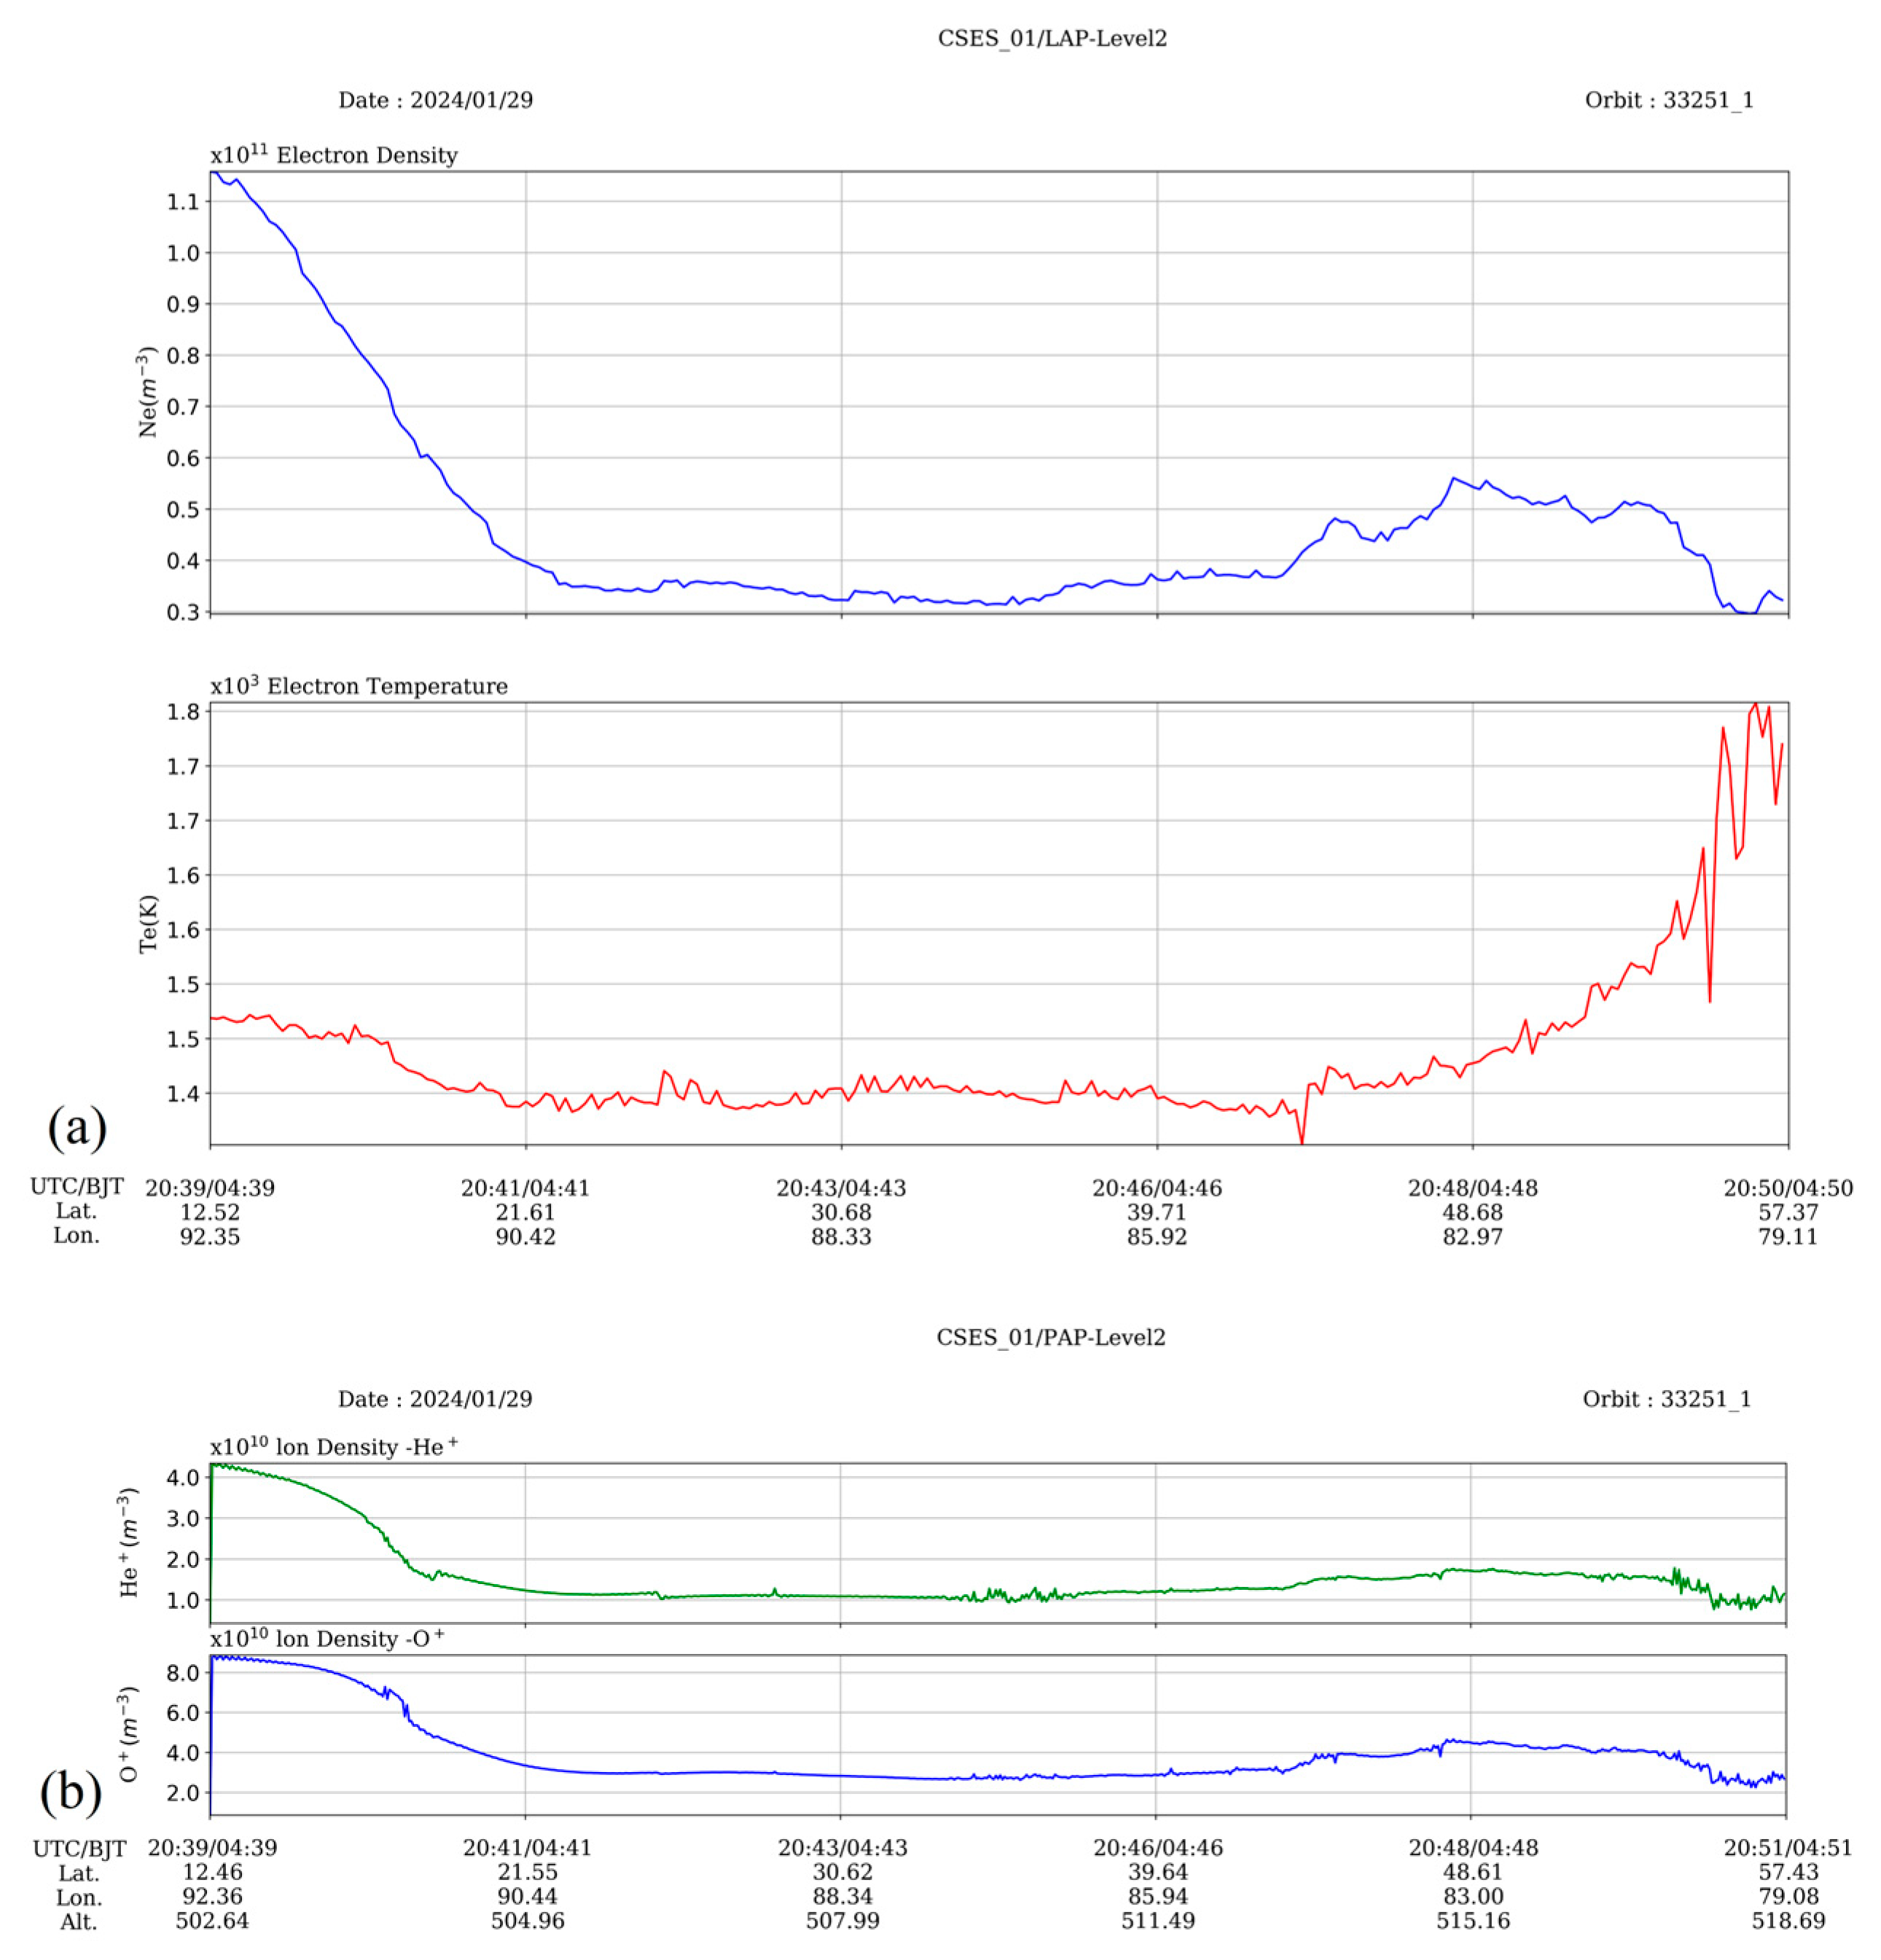
Li et al. [27] have reported that obvious CSES ionospheric variations appeared 11 days and 6 days (considering a revisiting period of 5 days for the CSES satellite) prior to the 8 January 2021 Menyuan MS 6.9 earthquake. At this time, the revisiting orbit 33251 on January 29 of 33175 on January 24 had been examined and found no electron or ion perturbations occurred on the orbit 33251. Further, the pictures for several ionospheric parameters recorded in this orbit had also been checked and they were shown in Figure 7 with the same arrangement as Figure 5. It is clear that no obvious irregularities had been found around the impending earthquakes in each parameter.
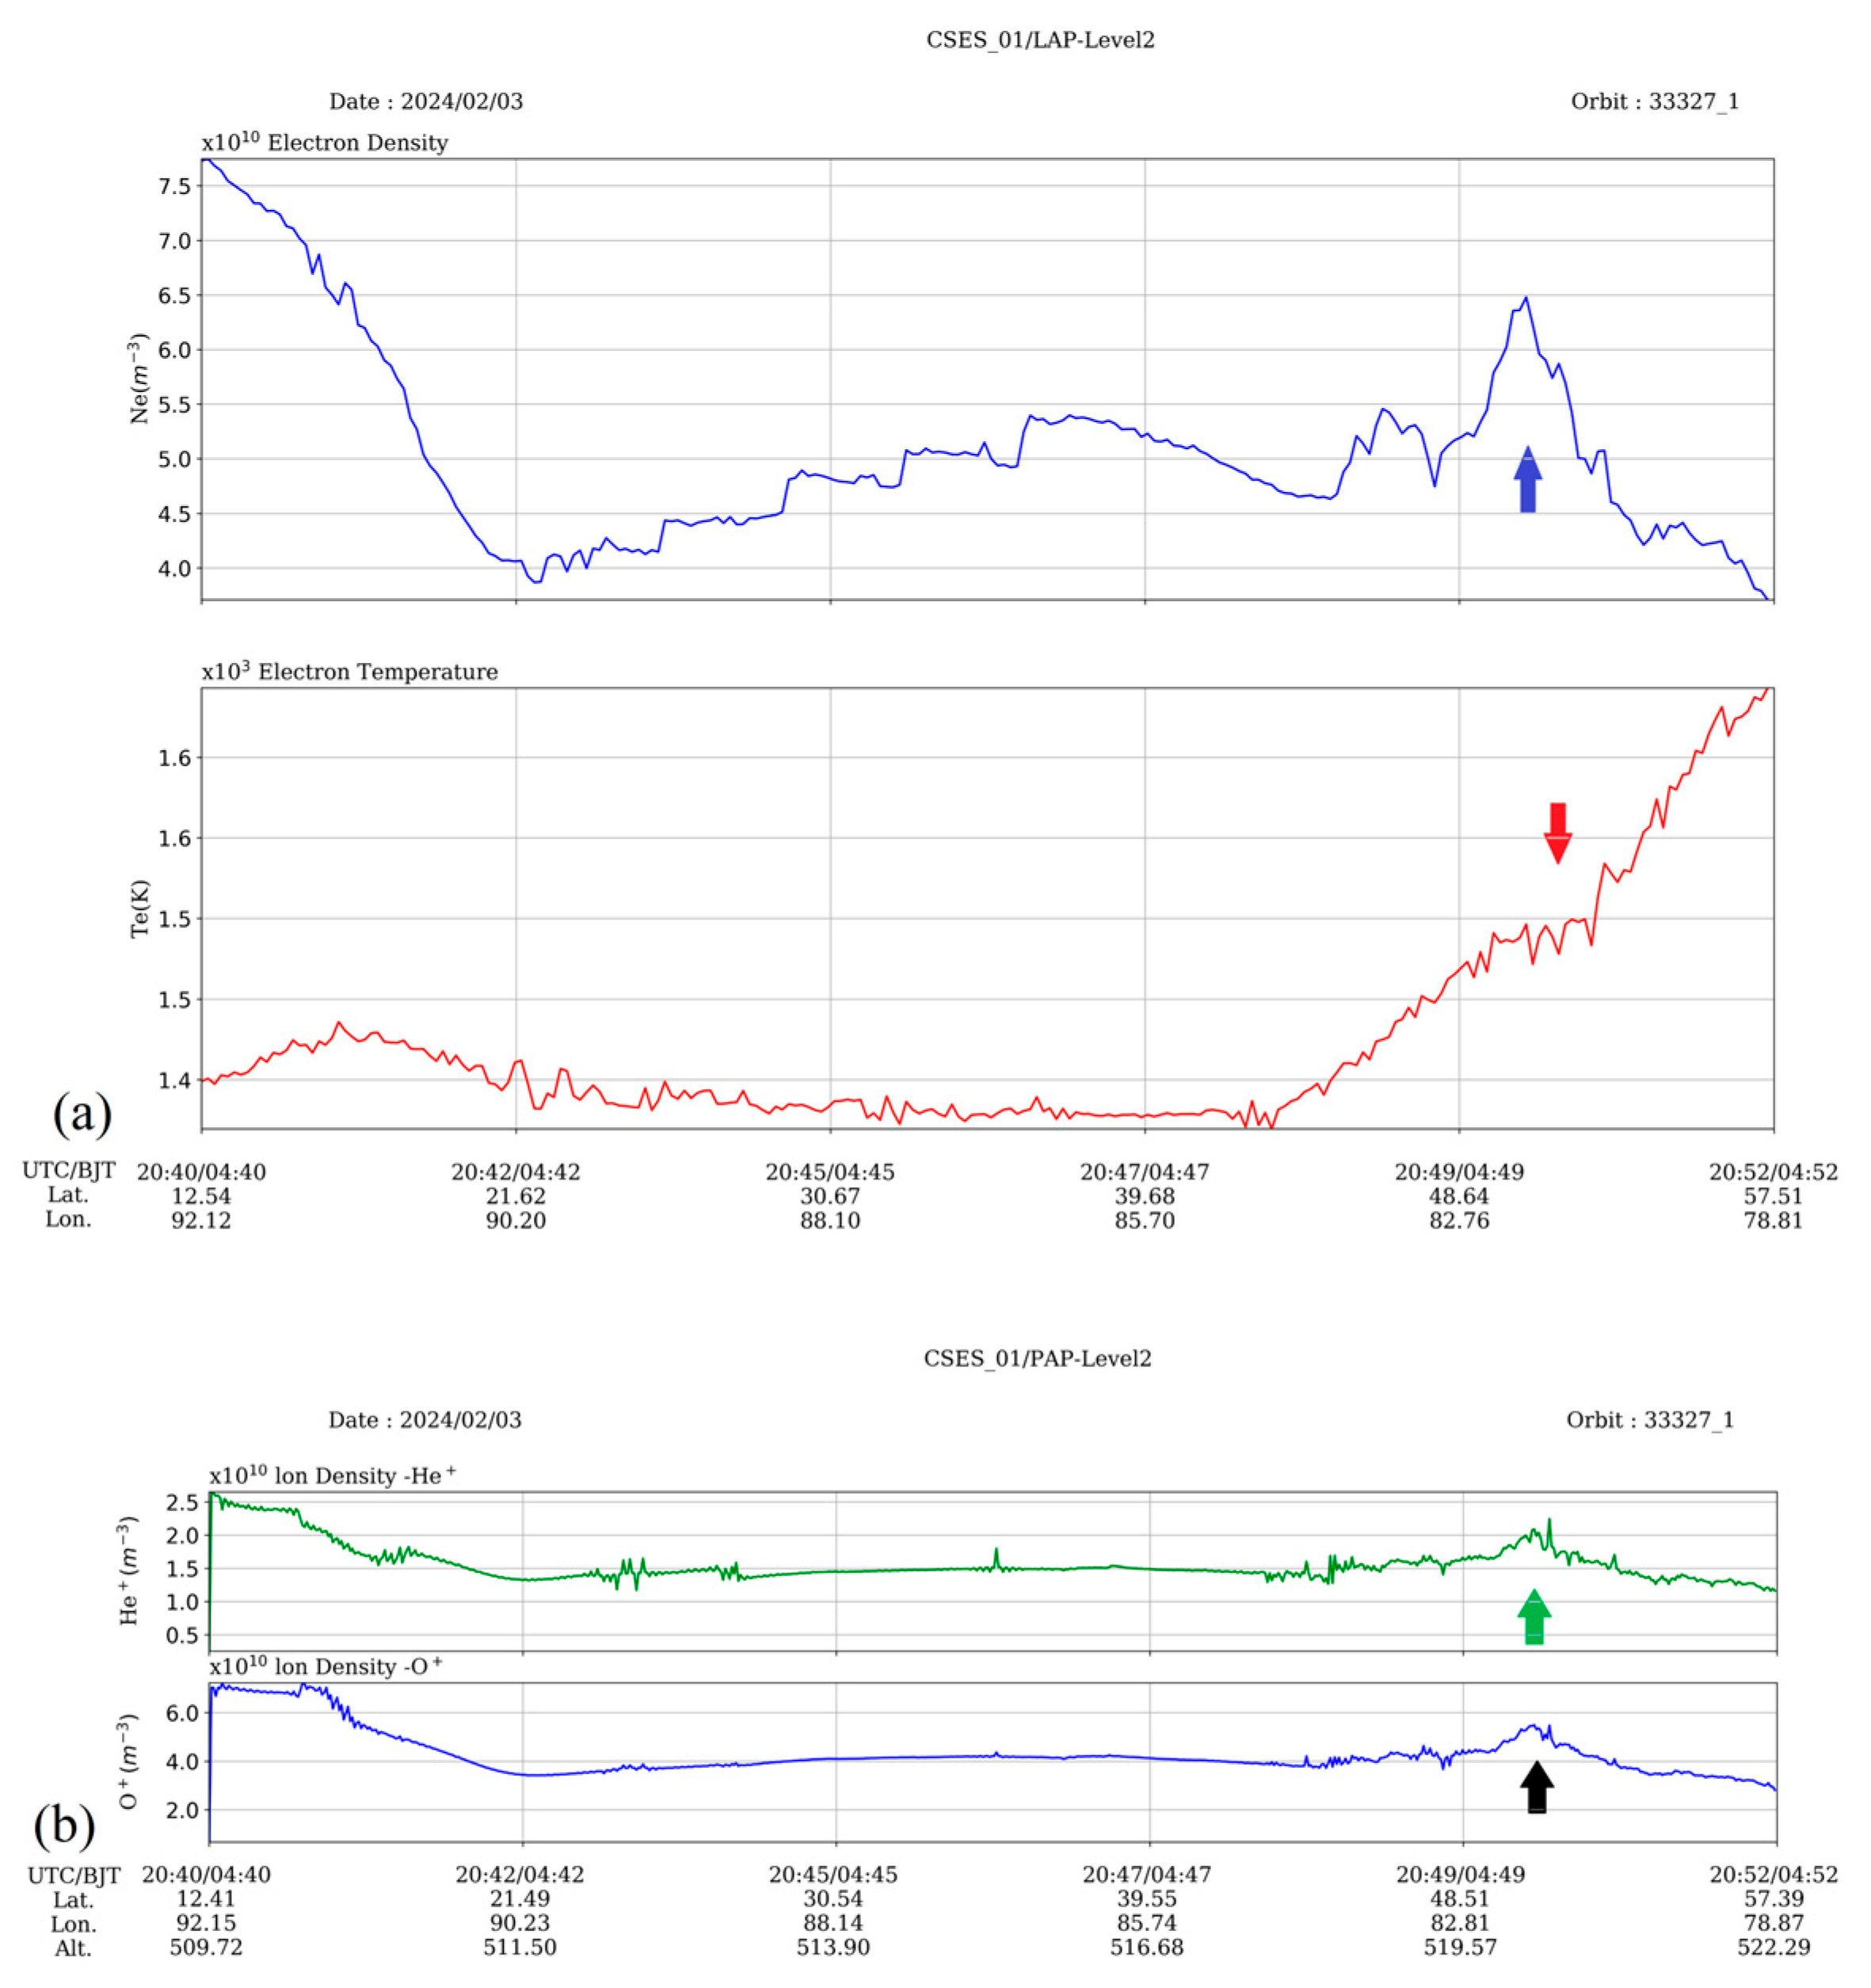
An electron perturbation and an O+ one with magnitudes over 20% were successfully detected in the next week in the period of 31 January–6 February 2024 and they have been presented with Pe2 and Pi2 in Table 2. Its relative location to the impending biggest aftershock can be seen in Figure 4b. Compared with their parameters of these two perturbations each other in Table 2, they happened on the same day of February 3 on the night orbit 33327, one revisiting orbit of 33175 where an obvious electron perturbation with an increased amplitude of 38.3% had been detected earlier. These two ionospheric perturbations occurred almost synchronously with similar locations, amplitudes of 24.6% for electron density and 27.3% for ion density and space sizes of 489 km and 510 km (See Table 2), respectively. The related pictures to different plasma components out from the CSES data processing system had been extracted and displayed in Figure 8 also with the same arrangements as Figure 5 and Figure 7. Two detected ionospheric perturbations are labelled with black arrows respectively in the top and the bottom panels of Figure 8. From Figure 8, it is obvious that almost synchronous fluctuations not only occurred in electron and O+ density data but also in electron temperature and He+ density data. Enhancements of O+ and He+ show almost the same pattern by comparing the top panel with the bottom one in Figure 8b. The most important is that the electron density and the electron temperature demonstrate a contrary varied trend: one increases and the other decreases (See Figure 8a), which is highly coincident with what have been reported before [18]. At the same time, the Kp index was also examined on the day of February 3, 2024 to avoid the influence from magnetic storms and this parameter demonstrated quite calm from Figure 6. Thus, these apparent irregularities had been considered as seismic precursors to trace continuously in the following days.
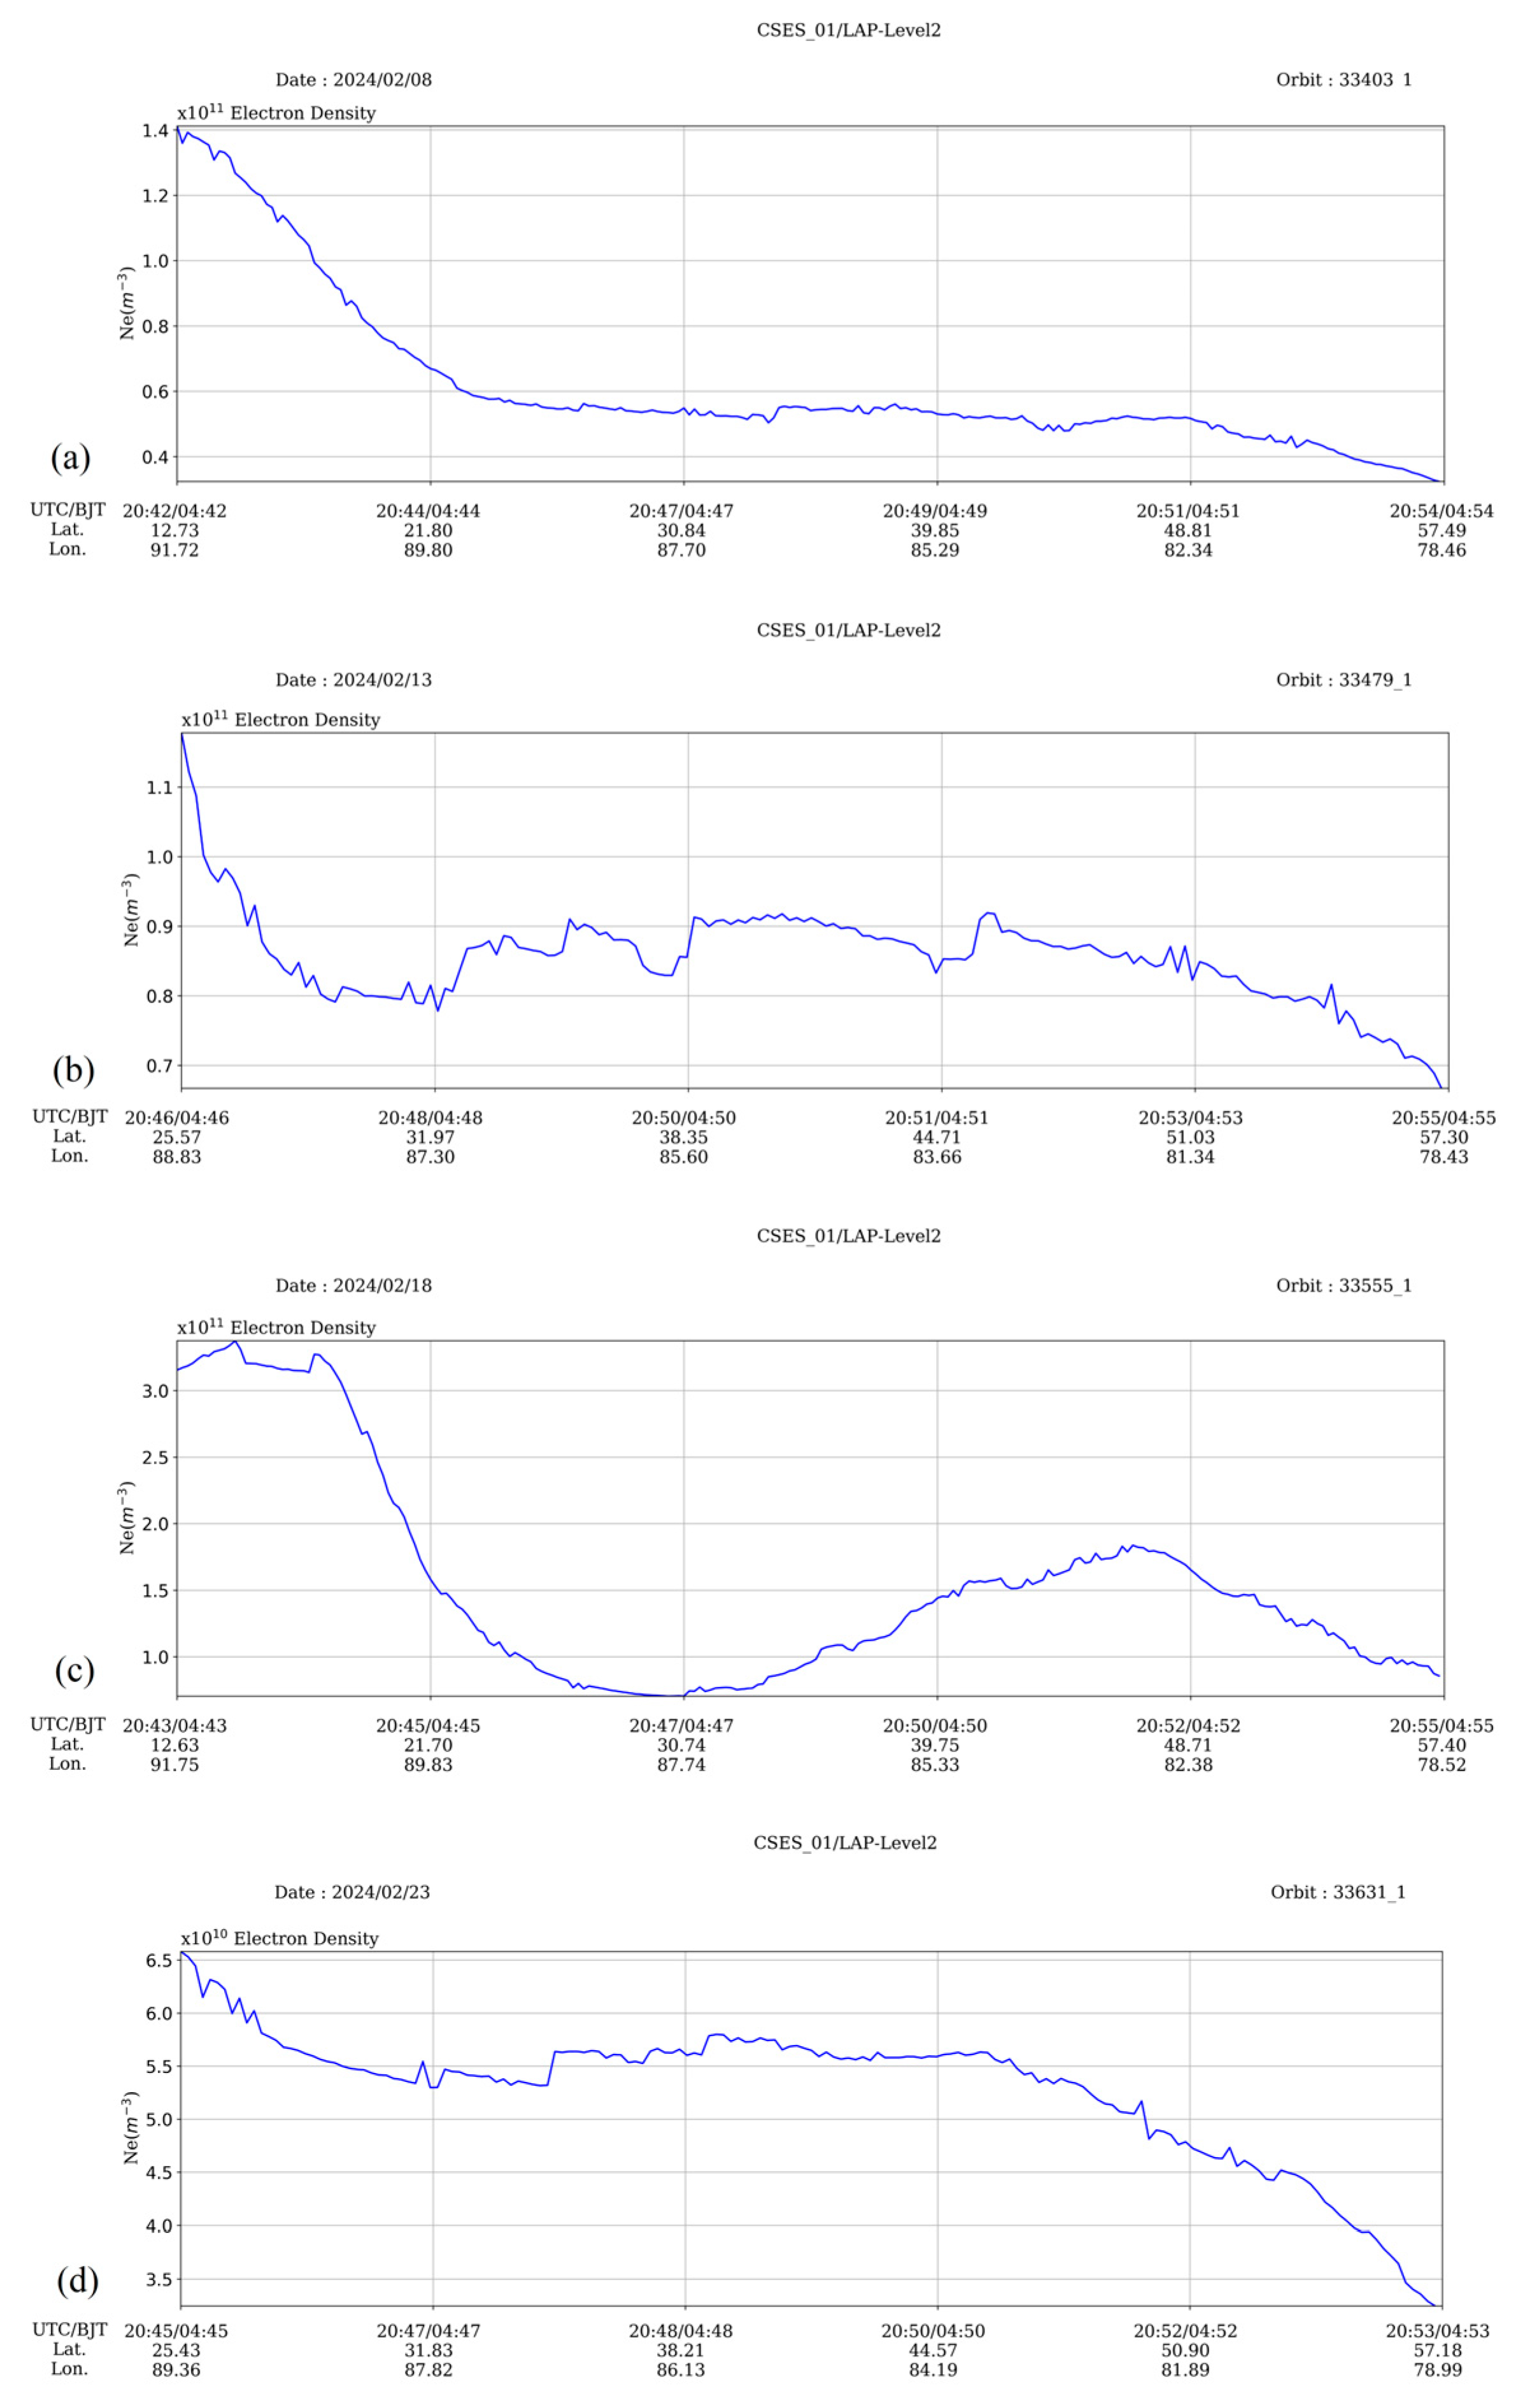
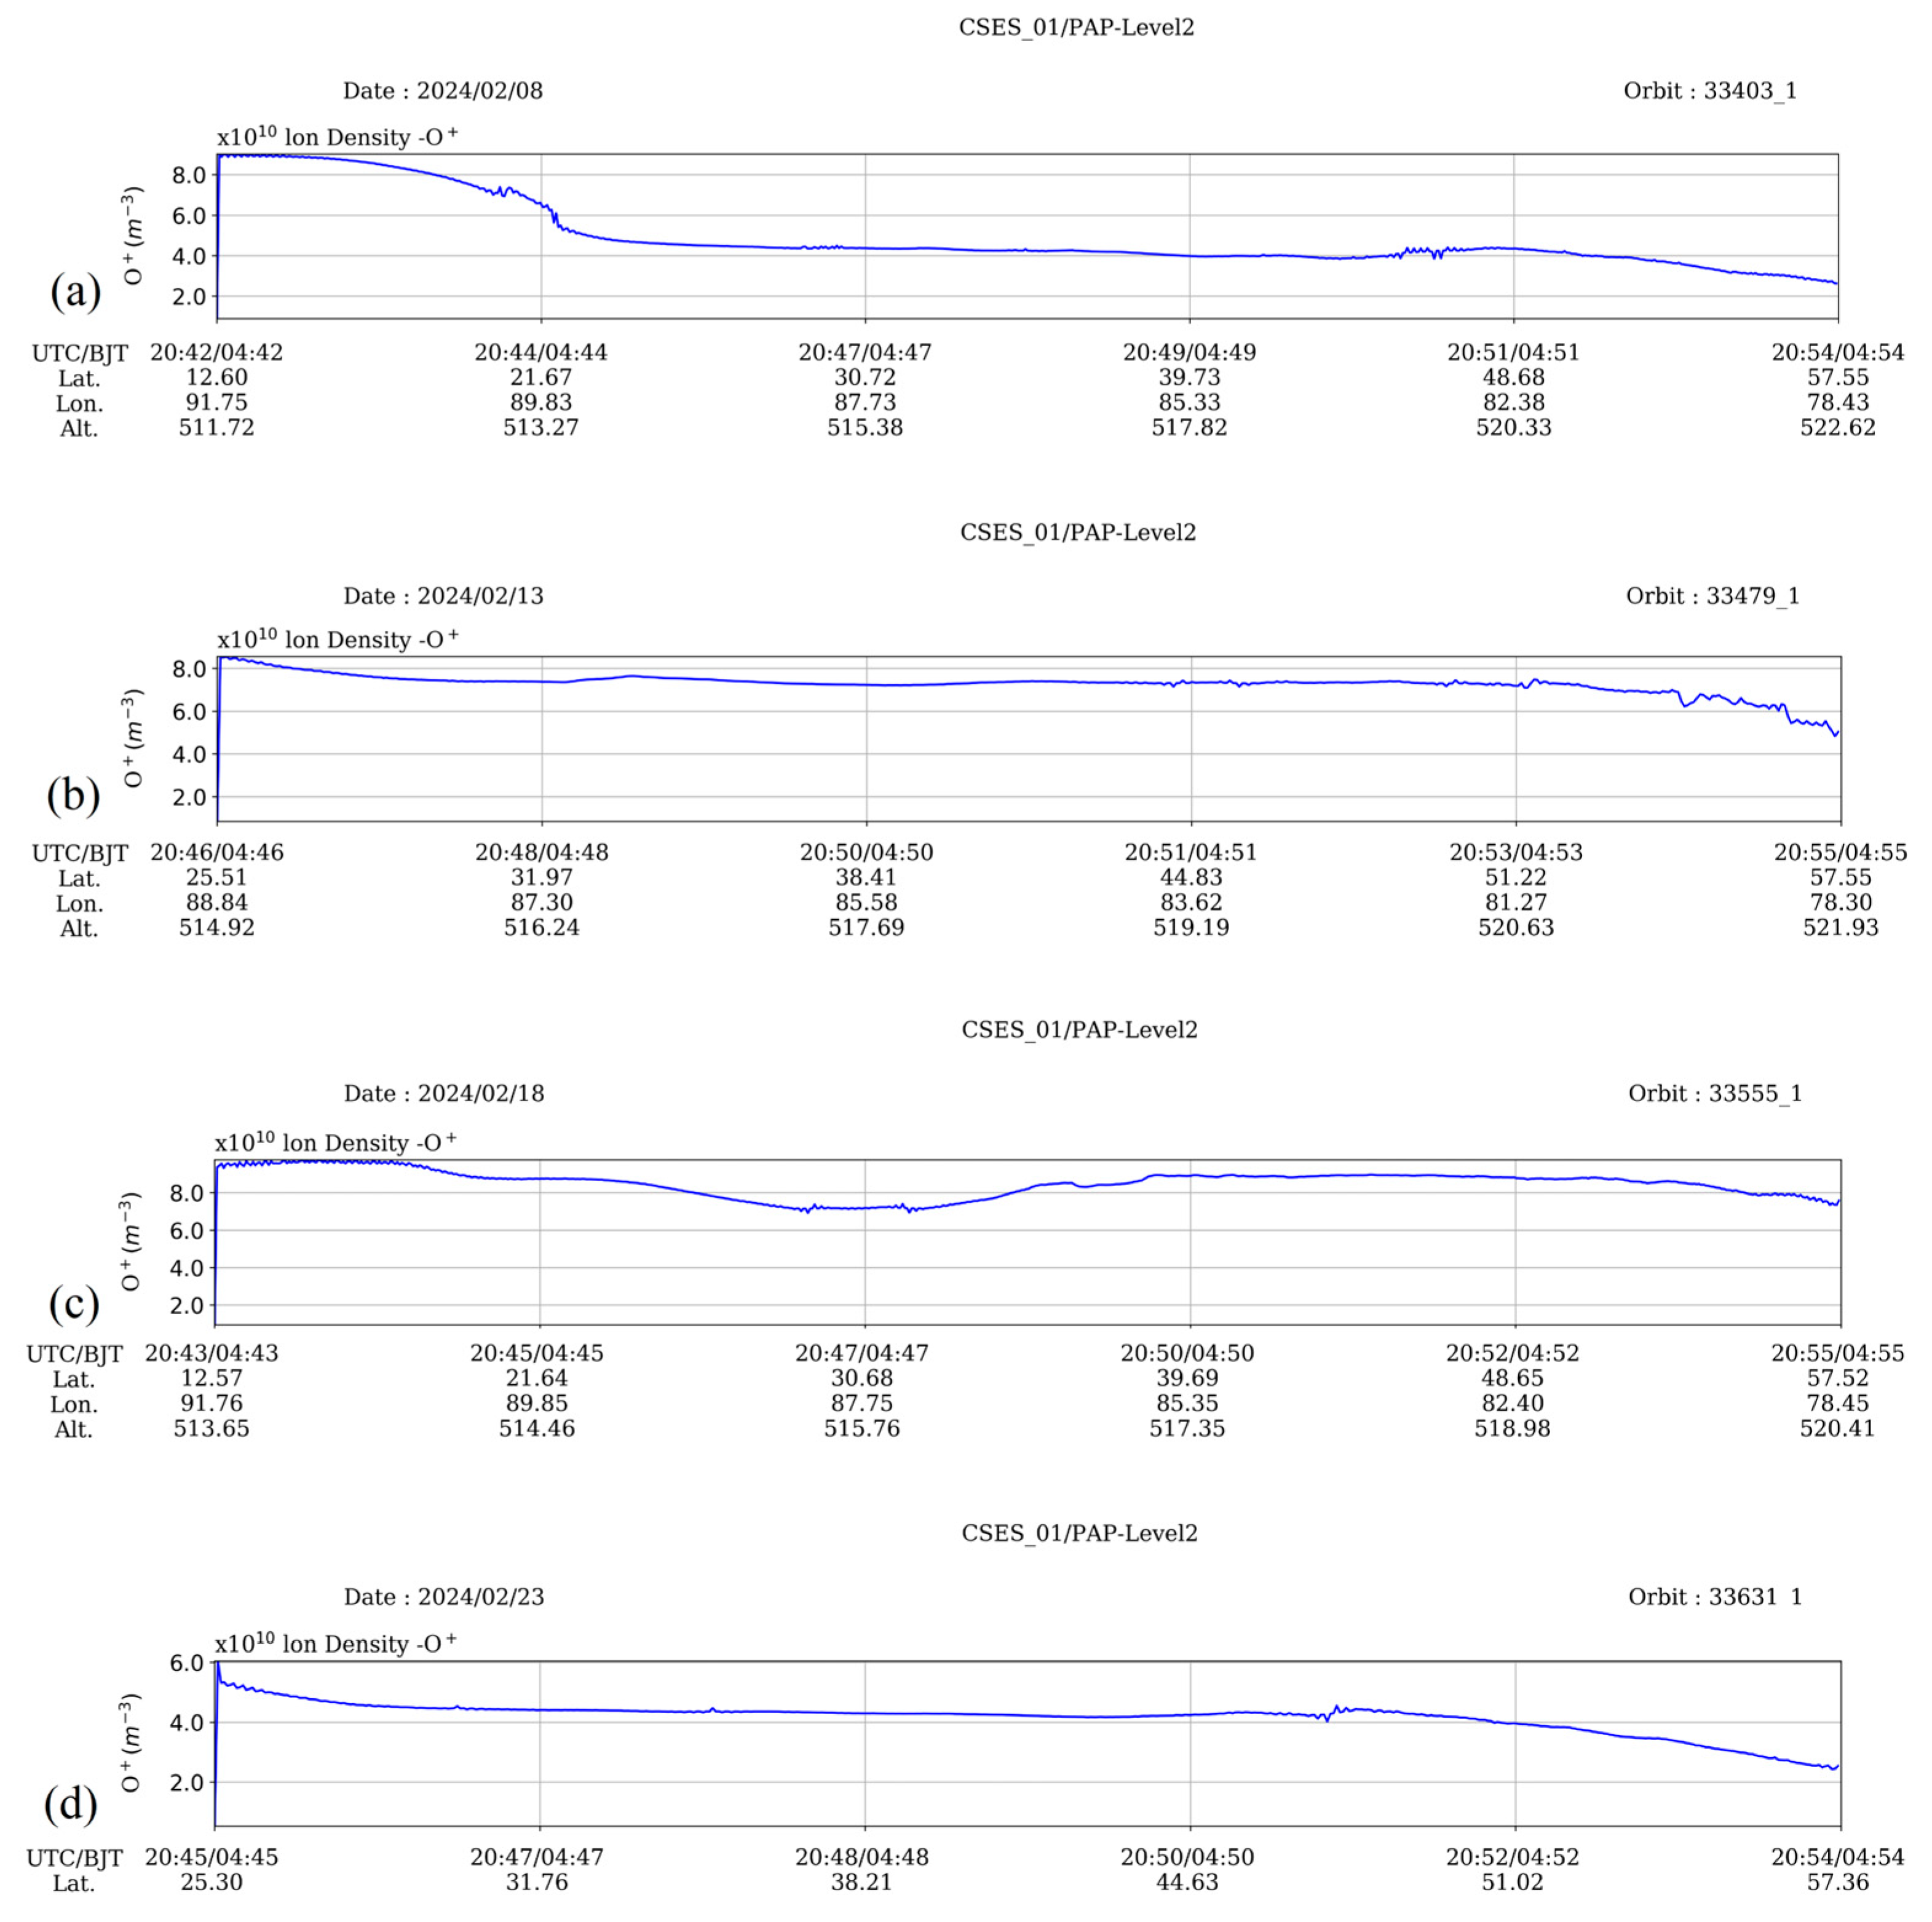
However, neither electron perturbations no ion ones with a magnitude beyond 20% had been detected in the next two weeks since February 7, 2024 (See Figure 4c, d), but corresponding fluctuations for various plasma parameters of the revisiting orbits conducted on 8, 13, 18 and 23 February had been still checked and demonstrated in Figure 9 for electron density and Figure 10 for O+ density, respectively. From Figure 9 and Figure 10, since February 8, no obvious variations either on electron density or ion density appeared in the similar locations on revisiting orbits of the 33327 orbit where strengthened ionospheric irregularities happened.
Twenty days later, two strong aftershocks with magnitude of MS 5.3 and MS 5.8 took place on 24 and 25 February 2024 with depths of 10 km and 11 km. Here, this MS 5.8 earthquake is the biggest aftershocks of the Wushi MS 7.1 event on January 23, 2024 and after that no strong events occurred. Therefore, the synchronous enhancements on various ionospheric parameters registered on February 3 were probably associated with this biggest aftershock, 1000 km away and 20 days’ delay.

4. Discussion

The CSES satellite has been ongoing for more than 6 years since it was launched in 2018 in China. More and more literatures have been reported on its achievements of data assessment and availability [34,35,36], global geomagnetic field modeling [37], investigations of ionospheric event like magnetic storms [38,39]. However, as the predominant topic of the development of this satellite to monitoring seismic activities around the world, investigations on seismogenic influence on the ionosphere have absorbed more and more attentions either on earthquake case study or statistical analysis on large amount events [22,23,26,27,40,41,42] to enhance our understanding of the physics of topside ionosphere form lithospheric events.
At the same time, the CSES satellite plasma data has tentatively been put into earthquake prediction practice since 2020 [27]. The contouring line method was utilized within the China area to process the original electron and ion densities to highlight possible information related with impending strong seismic activities. Two outstanding examples have been reported by Li et al. [27] in this period and enhanced ionospheric fluctuations were successfully observed 14 days prior to the Maduo MS 7.4 earthquake and, 11 and 6 days to the Menyuan MS 6.9 event in north-west China. However, an alternative automatic detection method used previously by Li et al. [19,20,21,22,23,24,25] to statistically investigate seismo-influence has been introduced because the contouring method is unable to display all ionospheric anomalies with different amplitudes. An example has been given in Section 2 to detect successfully two ion perturbations when the space size is specified 20–120 s and without limitations on the amplitude: one was already considered related to the Menyuan MS 6.9 by Li et al. [23,27], and the other was ignored due to its low amplitude.
At this time, after the last Wushi MS 7.1 earthquake on 23 January 2024, this automatic detection method firstly served as a tool to trace possible CSES recorded ionospheric variations before impending aftershocks. Effective ionospheric perturbations had been successfully detected two times in the following month. An electron density disturbance was detected firstly on January 24, 2024, the next day of the Wushi main shock with an amplitude of 38.3% but no perturbation was searched on ion density at the same orbit. However, obvious corresponding variations were registered on several plasma parameters of electron density and electron temperature, as well as O+ and He+ densities when we examined their processed pictures (See Figure 4 and Figure 5). While Kp index shows these irregularities occurred in a weak magnetic disturbed period (Figure 6) which can induce positive and negative fluctuations on the ionosphere [24,43]. So, it is possible that these variations indicate a common effect from the solar activities and the impending three strong aftershocks during 25–30 January in Wushi aftershock zone. Nothing occurred on its next revisiting date of January 29, 2024 (See Figure 7).
Then, perturbations either on electron density or on ion density had been detected automatically via software on the same revisiting orbit of 33327 on February 3, 2024 and they were characterized by almost synchronous described parameters shown in Table 2, which were also supported by the similar variation properties of different ionospheric components displayed in Figure 8, as well as the contrary variations on electron density and electron temperature. All these features seem more available as seismo-precursors. Concerning to this point, Li et al. [23,27] have reported ideal examples of similar variation forms of various ionospheric parameters on the same orbit before the Maduo MS 7.4 earthquake, as well as the Menyuan MS 6.9 earthquake, while the forms are probably different in the same revisiting orbits occurred in different dates (Refer to Figure 10 and Figure 11 in Li et al.[27]) due to ionospheric dynamics as time. Another point is that, it is possible that variations on the same revisiting orbits in different dates are not continuous, even the date is more near to the event than others, which can also be testified in Li et al. [27] concerning to the Maduo event. Thus, it is not surprised that we found not sign of ionospheric irregularities in the following two weeks (See Figure 9 and Figure 10). At the same time, no strong seismic event occurred during around these anomalies appearing on February 3 during this period.
Two strong earthquakes with magnitudes of MS 5.3 and MS 5.8 occurred sequentially on February 24 and 25, 2004, 20 days after the appearance of the last outstanding ionospheric variations and 1000 km away in south-west. Ruzhin et al. [44] have reported that the spatial distribution of the TEC (total electron content) is determined by the joint effect of the heating of the ionospheric by the electric current and the plasma drift in the electric field of this current and the extra electric field due to charged aerosols can induces a redistribution of the TEC anomalies lying in different sides of the magnetic meridian that pass through the earthquake epicentre. The statistical results on relationship between the CSES perturbations and strong mid-low latitude earthquakes conducted by Li et al. [23] have shown that the seismo-ionospheric influence appear mainly in 5 days before and shift 500–700 km from epicentres instead of right above them but we also note a concentration of this influence at 1000 km even at 1500 km. These results are highly coincident with the physical model of seismogenic current propagating along magnetic lines that the seismo-ionospheric influence is usually above the epicentre when an earthquake occur in auroral or high latitude areas due to the vertical magnetic lines and a shift from the epicentre in mid-low latitude area due to an un-ignored horizontal component of the magnetic lines. It is also reported that seismo-ionospheric influence are under control from other factors, such as solar activities, not mention the inner properties of the earthquake like magnitude, focal mechanism, focal depth, etc [Li et al., 2018, 2023 ]. Li et al. [15] have performed a statistical work on the temporal evolution of ionospheric influence of the China Wenchuan MS 8.0 and found the ionospheric anomalies appeared earlier one month, mainly two weeks and collectively one week before. Yang et al. [42] have presented that the power spectrum density anomaly on ELF electric field measured by the CSES satellite happened one month prior to the 2021 Maduo MS 7.3 earthquake. Zhang et al. [40] have reported that the ionospheric and atmospheric disturbances occur and accelerate 50 days and 15 days before the 2022 China Luding MS 6.8 earthquake.
Theoretically, ionospheric reaction can be expected for an earthquake with a magnitude larger than 4.6 [14]. It is possible that this MS 5.8 earthquake generates these ionospheric variations beyond 20% even in a distance of 1000 km. Except for that, this strongest aftershock occurred in Aheqi area instead of in Wushi area (Figure 3). There is a fact that cannot be ignored: the main damage lies in Aheqi county even that the epicentre of the Wushi MS 7.1 earthquake lies in Wushi county. On one hand, Aheqi county is well within 5 km away from the seismic fault while the distance is about 25 km for Wushi county in the light of the reversion results of INSAR measurement. On the other hand, the rupture in the south-west of the main shock is closer to the Earth’s surface according to the reversion results of the source rupture (https://yjgl.luohe.gov.cn/index.php?c=show&id=3957). These processes can also accelerate ionospheric variations prior to this biggest aftershock.
However, to confirm the right location and the magnitude of the impending event in the light of detected ionospheric perturbations is still difficult in earthquake prediction practise, not mention that the automatic detection method cannot reveal all ionospheric perturbations associated with seismic activities under these two limitations of >20% amplitude and 20–120 s space size. So, on one hand, the temporal-spatial evolution features of seismo-ionospheric influence need to further reconfirm by employing longer satellite measurements like SWARM and more seismic events in different locations. On the other hand, to integrate ground-based observing data analysis with satellite Earth observations is still an effective way to enhance our understanding the physical mechanism of seismo-ionospheric influence and lithosphere-atmosphere-ionosphere process. It is necessary to improve the automatic detection method and define more reasonable parameters to perform a long run earthquake prediction practise as well.

5. Conclusions

In this methodological driven paper, a successful tracing process of automatic detected CSES precursors before part strong aftershocks of the Wushi MS 7.1 earthquake has been depicted in detail.
As an effective tool to search automatically ionospheric perturbations with a various space size to construct a relationship between these plasma disturbances and seismic activities, the automatic detection method had been employed immediately after the Wushi MS7.1 earthquake on 23 January 2024 in northwest China to trace possible CSES electron and ion variations prior to aftershocks weekly. In this time, the software is specified with a space size of 20–120 s but still without a limitation on amplitude. While only perturbations with an enhanced magnitude more than 10% have been displayed in the Chinese map and that more than 20% are considered possible candidates for impending events with a consideration of background irregularities of the ionosphere.
A strengthened electron fluctuation with magnitude 38.3% was detected primarily on the next day of the Wushi main shock in the first week during 24–30 January, 2024, but failed to search corresponding ionospheric variations on ion density at the same night orbit 33175 (Table 3). This electron disturbance locates about 800 km in the north east orientation of the Wushi aftershock area (Figure 4a). We examined plasma pictures output from the CSES data processing system and found that complex fluctuations occurred on different parameters of LAP and PAP payloads, subject to a simultaneous decrease and then an apparent increase (Figure 5) near preparation zone of the forward events. Moreover, Kp index was also checked on the same day and the corresponding values indicated a weak disturbed period when these variations took place, which increases the probability that the variations were of low availability. Therefore, it is not easy to specify the ionospheric influence caused by the following three aftershocks with magnitudes over 5.0 during 25–30 January (See Table 2 and Figure 3). The data of the following revisiting orbit 33251 on 29 January 2024 presented no such fluctuations as in orbit 33175 (See Figure 5).
In the next week in a period from 31 January to February 6, 2024, an electron perturbation with a magnitude 24.6%, as well as an ion one with 27.3%, was successfully searched and located in the map in Figure 4b and their parameters were shown in Table 3. These two perturbations were characterized by, on one hand, locating at the same night revisiting orbit 33327 on the revisiting date 3 February as what happened on 24 January, and similar parameters describing their properties, which are also distinguished visually from fluctuations of electron density, electron temperature, O+ and He+ densities along the orbit 33327 in Figure 6, on the other hand. Furthermore, the contrary variation trends between the electron density and the electron temperature highlight the availability of these variations as seismic precursors reported before. However, no similar variations had been found at the same revisiting orbits and other orbits near the aftershock areas during the next two weeks till the occurrence of the strongest aftershock of MS5.8 on 25 February 2024, 20 days after and 1000 km away.

Author Contributions

Conceptualization, writing—original draft preparation, review and editing, M.L.; validation and visualization, H.Y., and T. L.; investigation and funding acquisition, M.L. All authors have read and agreed to the published version of the manuscript.

Funding

This work was supported by the Special Expenses for Basic Scientific Research under grant no. CEAIEF20240202 and the National Natural Science Foundation of China (NSFC) under grant no. 42474118.

Data Availability Statement

CSES plasma density data utilized here are available at www.leos.ac.cn:10021.

Acknowledgments

This work was supported by the CSES mission, a project funded by the China National Space Administration (CNSA) and the China Earthquake Administration (CEA). It is based on observations with the plasma analyzer LAP and PAP embarked on CSES.

Conflicts of Interest

The authors declare that the research was conducted in the absence of any commercial or financial relationships that could be construed as potential conflicts of interest.

References

  1. Dautermann, T.; Calais, E.; Lognonné, P.; and Mattioli, G. S. Lithosphere-atmosphere-ionosphere coupling after the 2003 explosive eruption of the Soufriere Hills Volcano, Montserrat. Geophys. J. Int. 2009, 179, 1537–1546. [Google Scholar] [CrossRef]
  2. Liu, J.Y.; Chen, Y.I.; Chen, C.H.; Hattori, K. Temporal and spatial precursors in the ionospheric global positioning system (GPS) total electron content observed before the 26 December 2004 M9.3 Sumatra–Andaman Earthquake. J. Geophys. Res. 2010, 115, A09312. [Google Scholar] [CrossRef]
  3. Kakinami, Y.; Kamogawa, M.; Tanioka, Y.; Watanabe, S.; Gusman, A.R.; Liu, J.Y.; Watanabe, Y.; Mogi, T. Tsunamigenic ionospheric hole. Geophys. Res. Lett. 2012, 39, L00G27. [Google Scholar] [CrossRef]
  4. Chapagain, N. Ionosphere and its Influence in Communication Systems. Symmetry 2016. [Google Scholar]
  5. Chen, C.H.; Sun, Y.Y.; Lin, K.; Liu, J.; Wang, Y.; Gao, Y.; Zhang, D.; Xu, R.; Chen, C. The LAI coupling associated with the M6 Luxian earthquake in China on 16 September 2021. Atmosphere 2021, 12, 1621. [Google Scholar] [CrossRef]
  6. Davies, K.; Baker, D.M. Ionospheric effects observed around the time of the Alaskan earthquake of March 28, 1964. J. Geophys. Res. 1965, 70, 2251–2253. [Google Scholar] [CrossRef]
  7. Parrot, M.; Berthelier, J.J.; Lebreton, J.P.; Sauvaud, J.A.; Santolík, O.; Blecki, J. Examples of unusual ionospheric observations made by the DEMETER satellite over seismic regions. Physics and Chemistry of the Earth 2006, 31, 486–495. [Google Scholar] [CrossRef]
  8. Parrot, M. Statistical analysis of the ion density measured by the satellite DEMETER in relation with the seismic activity. Earthquake Science 2011, 24(6), 513–521. [Google Scholar] [CrossRef]
  9. Parrot, M. Statistical analysis of automatically detected ion density variations recorded by DEMETER and their relation to seismic activity. Annales de Geophysique 2012, 55(1), 149–155. [Google Scholar] [CrossRef]
  10. Němec, F.; Santolík, O.; Parrot, M. Decrease of intensity of ELF/VLF waves observed in the upper ionosphere close to earthquakes: A statistical study. Journal of Geophysical Research 2009, 114, A04303. [Google Scholar] [CrossRef]
  11. Němec, F.; Santolík, O.; Parrot, M.; Berthelier, J.J. Spacecraft observations of electromagnetic perturbations connected with seismic activity. Geophysical Research Letters 2008, 35, L05109. [Google Scholar] [CrossRef]
  12. Píša, D.; Němec, F.; Parrot, M.; Santolík, O. Attenuation of electromagnetic waves at the frequency ~1.7 kHz in the upper ionosphere observed by the DEMETER satellite in the vicinity of earthquakes. Annales de Geophysique 2012, 55(1), 157–163. [Google Scholar] [CrossRef]
  13. Píša, D.; Němec, F.; Santolík, O.; Parrot, M.; Rycroft, M. Additional attenuation of natural VLF electromagnetic waves observed by the DEMETER spacecraft resulting from preseismic activity. Journal of Geophysical Research: Space Physics 2013, 118, 5286–5295. [Google Scholar] [CrossRef]
  14. Pulinets, S.A.; Legen, A.D.; Gaivoronskaya, T.V.; Depuev, V.K. Main phenomenological features of ionospheric precursors of strong earthquakes. Journal of Atmospheric and Solar - Terrestrial Physics 2003, 65, 1337–1347. [Google Scholar] [CrossRef]
  15. Li, M.; Lu, J.; Zhang, X.; Shen, X. Indications of ground-based electromagnetic observations to a possible lithosphere–atmosphere–ionosphere electromagnetic coupling before the 12 May 2008 Wenchuan MS 8.0 earthquake. Atmosphere 2019, 10(7), 355. [Google Scholar] [CrossRef]
  16. Yu, T.; Mao, T.; Wang, Y.G.; Wang, J.S. Study of the ionospheric anomaly before the Wenchuan earthquake. Chinese Science Bulletin 2009, 54(6), 1086–1092, CNKI:SUN:JXTW.0.2009-06-026(in Chinese with English abstract). [Google Scholar] [CrossRef]
  17. Liu, J.Y.; Chen, Y.I.; Chen, C.H.; Liu, C.Y.; Chen, C.Y.; Nishihashi, M.; Li, J.Z.; Xia, Y.Q.; Oyama, K.I.; Hattori, K.; Lin, C.H. Seismoionospheric GPS total electron content anomalies observed before the 12 May 2008 MW7.9 Wenchuan earthquake. Journal of Geophysical Research 2009, 114, A04320. [Google Scholar] [CrossRef]
  18. Akhoondzadeh, M.; Parrot, M.; Saradjian, M.R. Electron and ion density variations before strong earthquakes (M > 6.0) using DEMETER and GPS data. Natural Hazards and Earth System Sciences 2010, 10(1), 7–18. [CrossRef]
  19. Li, M.; Parrot, M. “Real time analysis” of the ion density measured by the satellite DEMETER in relation with the seismic activity. Natural Hazards and Earth System Sciences 2012, 12(9), 2957–2963. [Google Scholar] [CrossRef]
  20. Li, M.; Parrot, M. Statistical analysis of an ionospheric parameter as a base for earthquake prediction. Journal of Geophysical Research: Space Physics 2013, 118, 3731–3739. [Google Scholar] [CrossRef]
  21. Li, M.; Parrot, M. Statistical analysis of the ionospheric ion density recorded by DEMETER in the epicenter areas of earthquakes as well as in their magnetically conjugate point areas. Advances in Space Research 2018, 61, 974–984. [Google Scholar] [CrossRef]
  22. Li, M.; Shen, X.; Parrot, M.; Zhang, X.; Zhang, Y.; Yu, C.; Yan, R.; Liu, D.; Lu, H.; Guo, F.; Huang, J. Primary joint statistical seismic influence on ionospheric parameters recorded by the CSES and DEMETER satellites. Journal of Geophysical Research: Space Physics 2020, 125, e2020JA028116. [Google Scholar] [CrossRef]
  23. Li, M.; Jiang, X.; Li, J.; Zhang, Y.; Shen, X. Temporal-spatial characteristics of seismo-ionospheric influence observed by the CSES satellite. Adv. Space Res. 2024, 73, 607–623. [Google Scholar] [CrossRef]
  24. Li, M.; Yan, H.; Zhang, Y. Topside ionospheric structures determined via automatically detected DEMETER ion perturbations during a geomagnetically quiet period. Geosciences 2024, 14, 33. [Google Scholar] [CrossRef]
  25. Li, M.; Yan, H.; Zhang, Y. Inner properties of seasonal topside ionospheric structures determined via DEMETER ion perturbations. Reviews of Geophysics and Planetary Physics 2024, 55(5), 595–608. [Google Scholar] [CrossRef]
  26. Liu, D.; Zeren, Z.; Shen, X.; Zhao, S.; Yan, R.; Wang, X.; Liu, C.; Guan, Y.; Zhu, X.; Miao, Y.; Yang, D.; Huang, H.; Guo, F. Typical ionospheric disturbances revealed by the plasma analyzer package onboard the China Seismo-Electromagnetic Satellite. Adv. Space Res. 2021, 68, 3796–3805. [Google Scholar] [CrossRef]
  27. Li, M.; Wang, H.; Liu, J.; Shen, X. Two large earthquakes registered by the CSES satellite during its earthquake prediction practice in China. Atmos. 2022, 13, 751. [Google Scholar] [CrossRef]
  28. Huang, J.P.; Lei, J.G.; Li, S.X.; Zeren, Z.M.; Li, C.; Zhu, X.H.; Yu, W.H. The Electric Field Detector (EFD) onboard the ZH-1 satellite and first observational results. Earth Planet. Phys. 2018, 2(6), 469–478. [Google Scholar] [CrossRef]
  29. Yan, R.; Shen, X.H.; Huang, J.P.; Wang, Q.; Chu, W.; Liu, D.P.; Yang, Y.Y.; Lu, H.X.; Xu, S. Examples of unusual ionospheric observations by the CSES prior to earthquakes. Earth Planet. Phys. 2018, 2(6), 515–526. [Google Scholar] [CrossRef]
  30. Shen, X.; Zhang, X.; Yuan, S.; Wang, L.; Cao, J.; Huang, J.; Zhu, X.; Piergiorgio, P.; Dai, J.P. The state-of-the-art of the China Seismo-Electromagnetic Satellite mission. Sci. China Technol. Sci. 2018, 61(5), 634–642. [Google Scholar] [CrossRef]
  31. Parrot, M.; Li, M. Statistical analysis of the ionospheric density recorded by the satellite during seismic activity. In Pre-Earthquake Processes: A Multidisciplinary Approach to Earthquake Prediction Studies, AGU Monograph by Ouzounov, D., S. Pulinets, M. C. Kafatos, P. Taylor, Eds., Wiley: New York, NY, USA 2018, pp.319–328.
  32. Liu, D.; Zeren, Z.; Shen, X.; Zhao, S.; Yan, R.; Wang, X.; Liu, C.; Guan, Y.; Zhu, X.; Miao, Y.; Yang, D.; Huang, H.; Guo, F. Typical ionospheric disturbances revealed by the plasma analyzer package onboard the China Seismo-Electromagnetic Satellite. Adv. Space Res. 2021, 68, 3796–3805. [Google Scholar] [CrossRef]
  33. Li, M.; Yang, Z.; Song, J.; Zhang, Y.; Jiang, X.; Shen, X. Statistical Seismo-Ionospheric Influence with the Focal Mechanism under Consideration. Atmosphere 2023, 14, 455. [Google Scholar] [CrossRef]
  34. Liu, J.; Guan, Y.; Zhang, X.; Shen, X. The data comparison of electron density between CSES and DEMETER satellite, Swarm constellation and IRI model. Earth Space Sci. 2021, 8, e2020EA001475. [Google Scholar] [CrossRef]
  35. Yan, R.; Zhima, Z.; Xiong, C.; Shen, X.; Huang, J.; Guan, Y.; Zhu, X.; Liu, C. Comparison of Electron Density and Temperature from the CSES Satellite with other Space-Borne and Ground-Based Observations. J. Geophys. Res. Space Phys. 2019, 125, e2019JA027747. [Google Scholar] [CrossRef]
  36. Zhima, Z.; Hu, Y.; Shen, X.; Chu, W.; Guo, F. Storm-time features of the ionospheric ELF/VLF waves and energetic electron fluxes revealed by the China Seismo-Electromagnetic Satellite. Appl. Sci. 2021, 11, 2617. [Google Scholar] [CrossRef]
  37. Yang, Y.; Hulot, G.; Vigneron, P.; Shen, X.; Zhima, Z.; Zhou, B.; Magnes,W.; Olsen, N.; Toffner-Clausen, L.; Huang, J.; Zhang, X.; Yuan, S.; Wang, L.; Cheng, B.; Pollinger, A.; Lammegger, R.; Dai, J.; Lin, J.; Guo, F.; Yu, J.; Wang, J.; Wu, Y.; Zhao, X.; Zhu, X. The CSES global geomagnetic field model (CGGM): An IGRF-type global geomagnetic field model based on data from the China Seismo-Electromagnetic Satellite. Earth Planets Space 2021, 73, 45. [CrossRef]
  38. Spogli, L.; Sabbagh, D.; Regi, M.; Cesaroni, C.; Perrone, L.; Alfonsi, L.; Mauro, D.D.; Lepidi, S.; Campuzano, S.A.; Marchetti, D.; De Santis, A.; Malagnini, A.; Scotto, C.; Cianchini, G.; Shen, X.; Piscini, A.; Ippolito, A. Ionospheric response over Brazil to the August 2018 geomagnetic storm as probed by CSES-01 and Swarm satellites and by local groundbased observations. J. Geophys. Res. Space Phys. 2021, 126, e2020JA028368. [Google Scholar] [CrossRef]
  39. Gou, X.; Li, L.; Zhang, Y.; Zhou, B.; Feng, Y.; Cheng, B.; Raita, T.; Liu, J.; Zhima, Z.; Shen, X. Ionospheric Pc1 waves during a storm recovery phase observed by the China Seismo-Electromagnetic Satellite. Ann. Geophys. 2020, 38, 775–787. [Google Scholar] [CrossRef]
  40. Zhang, X.; De Santis, A.; Liu, J.; Campuzano, S.A.; Yang, N.; Cianchini, G.; Ouyang, X.; D’Arcangelo, S.; Yang, M.; De Caro, M.; et al. Li, X.; Fidani, C.; Liu, H.; Orlando, M.; Nie, L.; Perrone , L.; Piscini, A.; Dong , L.; Sabbagh, D.; Soldani , M.; Xiong, P. Pre-Earthquake Oscillating and Accelerating Patterns in the Lithosphere–Atmosphere–Ionosphere Coupling (LAIC) before the 2022 Luding (China) MS6.8 Earthquake. Remote Sens. 2024, 16, 2381. [CrossRef]
  41. De Santis, A.; Marchetti, D.; Perrone, L.; Campuzano, S.A.; Cianchini, G.; Cesaroni, C.; DiMauro, D.; Orlando, M.; Piscini, A.; Sabbagh, D.; Soldani, M.; Spogli, L.; Zhima, Z.; Shen, X. Statistical correlation analysis of strong earthquakes and ionospheric electron density anomalies as observed by CSES-01. IL Nuovo Cimento 44 C 2021, 119, 1–4. [Google Scholar] [CrossRef]
  42. Yang, M.; Zhang, X.; Zhong, M.; Guo, Y.; Qian, G.; Liu, J.; Yuan, C.; Li, Z.; Wang, S.; Zhai, L.; et al. Spatio-temporal evolution of electric field, magnetic field and thermal infrared remote sensing associated with the 2021 MW7.3 Maduo earthquake in China. Atmosphere 2024, 15, 770. [Google Scholar] [CrossRef]
  43. Xiong, C.; Lühr, H.; Yamazaki, Y. An opposite response of the low-latitude ionosphere at Asian and American sectors during storm recovery phases: Drivers from below or above. J. Geophys. Res. Space Phys. 2019, 124, 6266–6280. [Google Scholar] [CrossRef]
  44. Ruzhin, YuYa; Sorokin, V.M.; Yashchenko, A.K.; Physical mechanism of ionospheric total electron content perturbations over a seismoactive region. Geomag. Aeron. 2014, 54 (3), 337–346. [CrossRef]
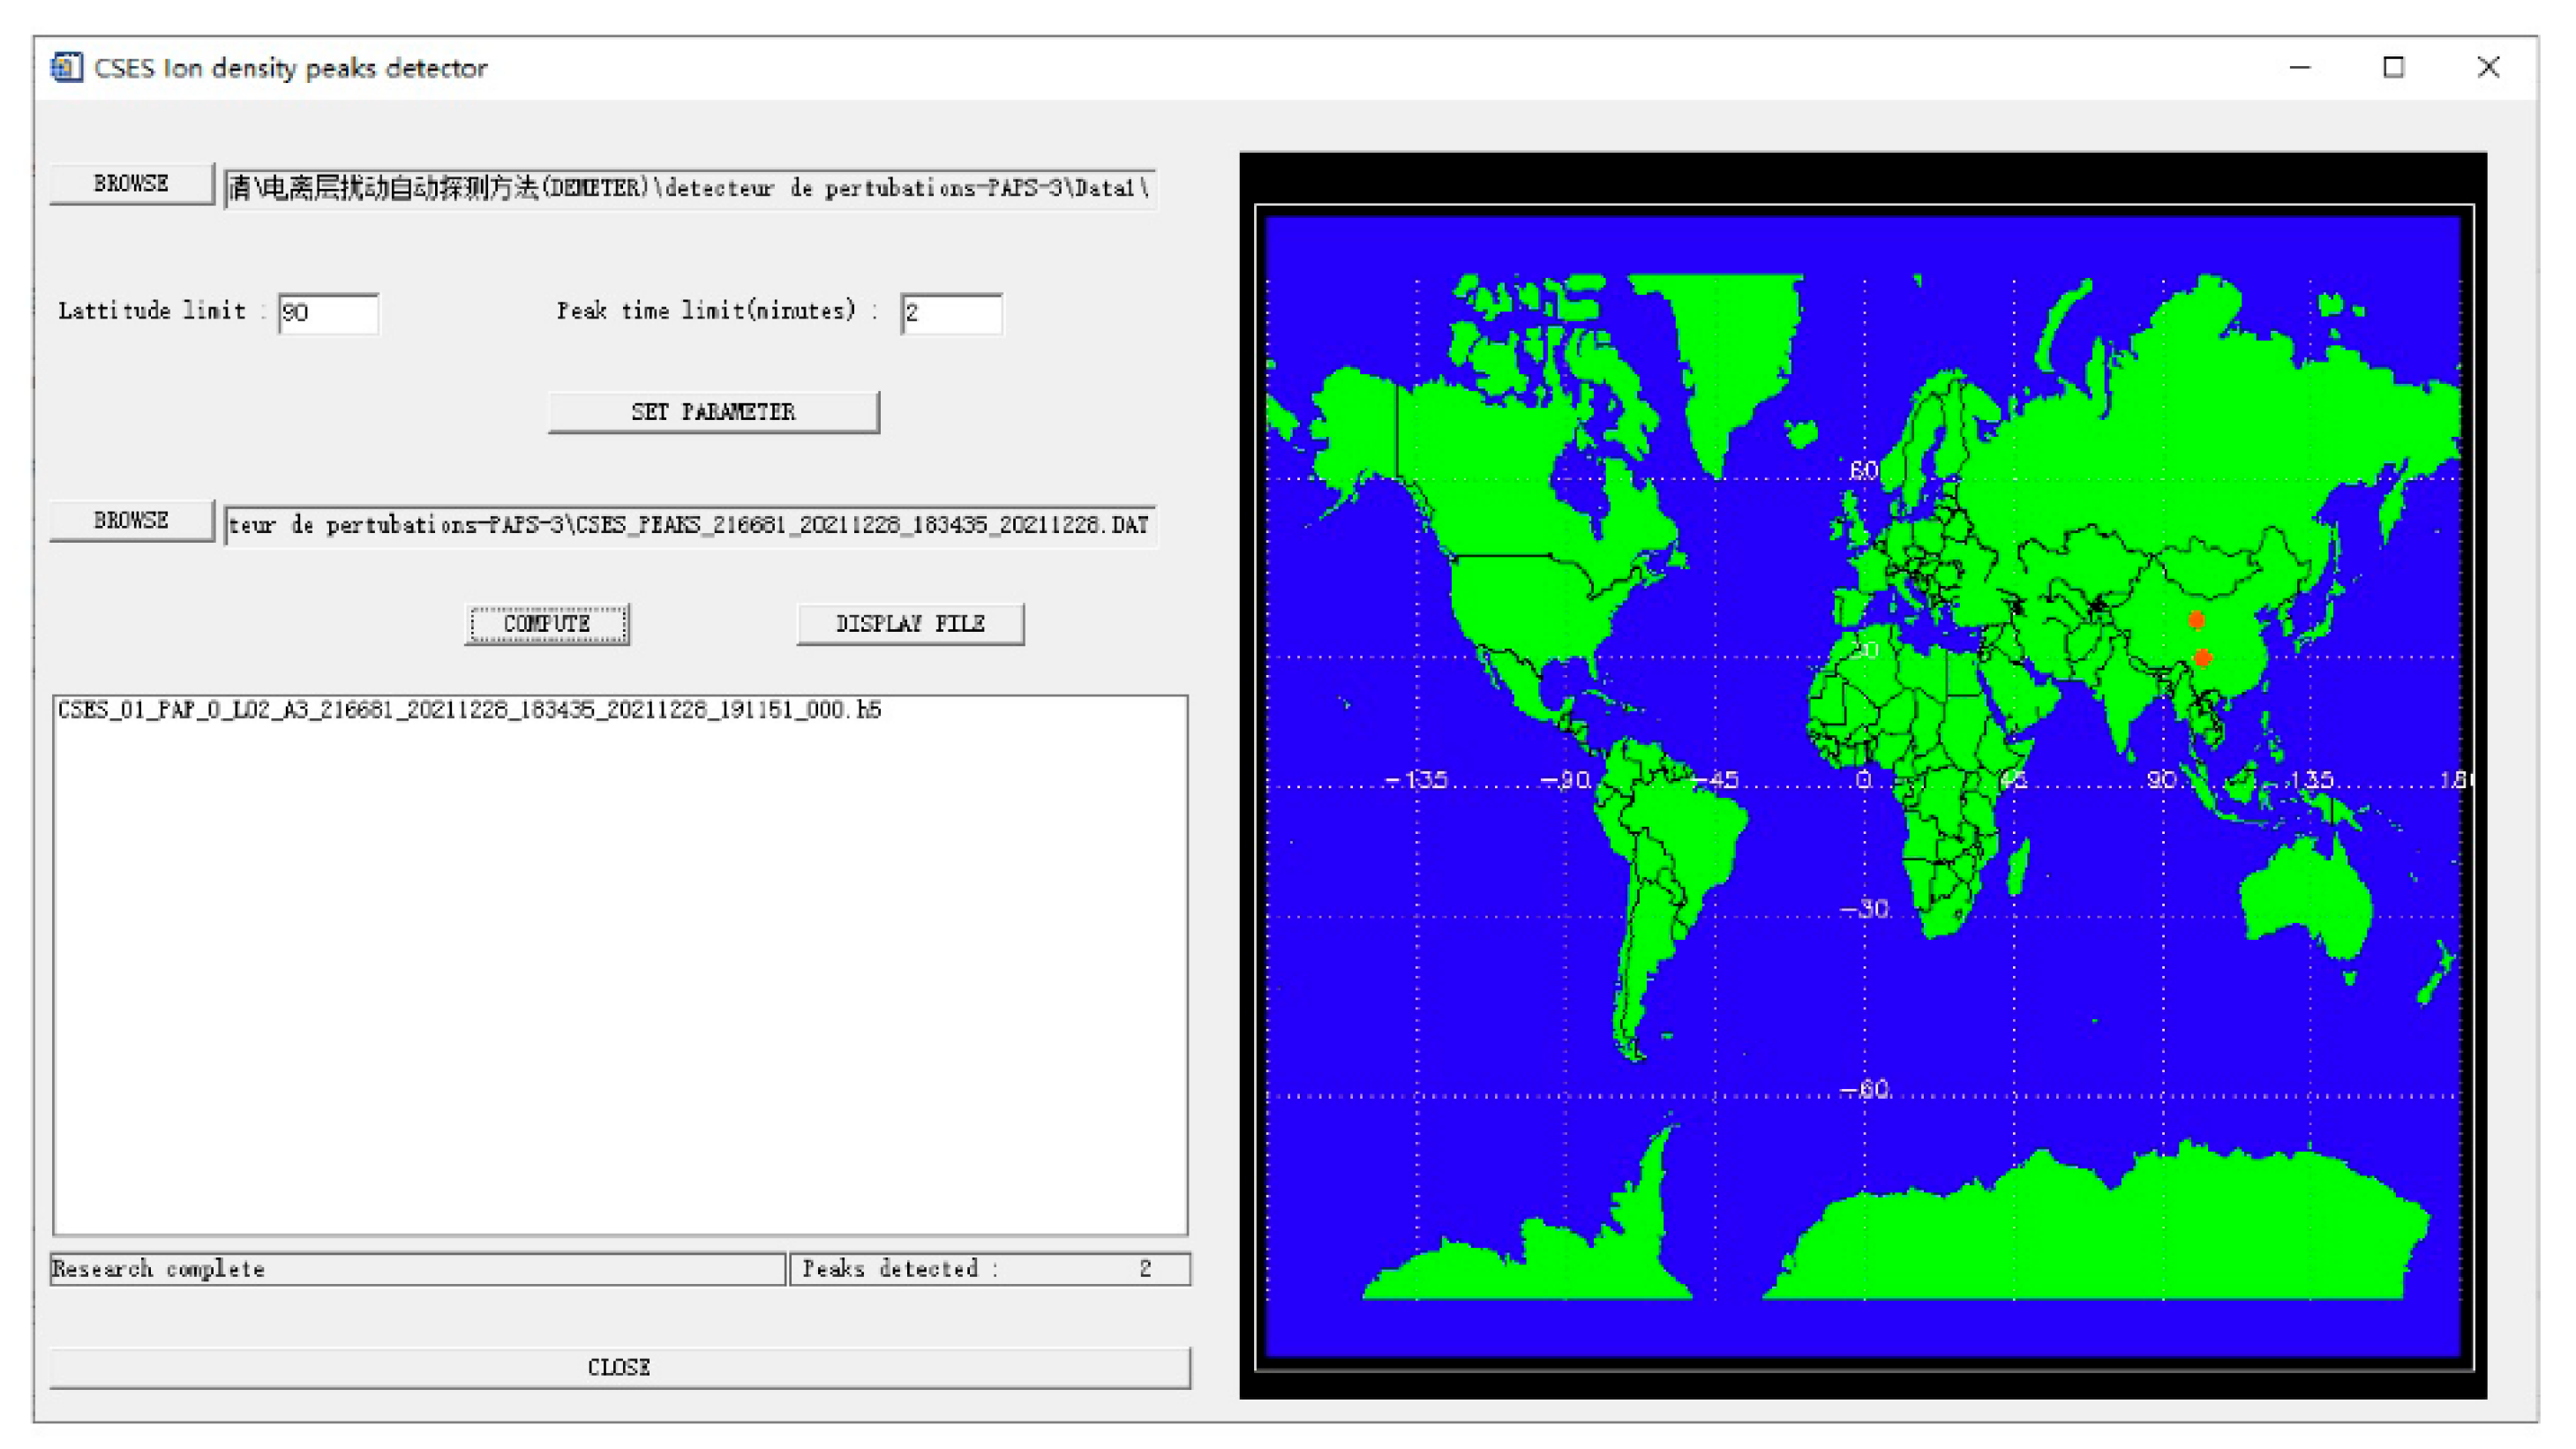
Figure 1. Interface of the automatic detection method software.
Preprints 118648 g001
Figure 2. (a) Location of the flight path (orbit 21668_1) conducted by the CSES on 28 December, 2021. The red star denotes the 8 January 2022 Menyuan MS 6.9 earthquake in northwest China. Two blue dots represent the peak positions of (b) two ionospheric perturbations P1 and P2 detected via the software in smoothed ion data (red line) along the CSES orbit 21668 at night. The black line stands for Level 2 ion data measured along the same orbit.
Preprints 118648 g002
Figure 3. Distribution of the Wushi MS 7.1 earthquake sequence with a magnitude equal to or more than 5.0. Red solid lines stand for sub-faults of the Maidan fault and black dot lines for county boundaries. Black and red dots stand for earthquakes occurred before and after the ionospheric had been automatically detected since 24 January 2024.
Preprints 118648 g003
Figure 4. Weekly distribution of electron perturbations detected automatically by the software prior to the biggest aftershock the Wushi MS 7.1 earthquake on January 23, 2024. Grey triangles denote ionospheric perturbations with a magnitude 10%–20% and blue ones for magnitudes exceeding 20%. Red dot stands for the location of the biggest aftershock MS5.8 of the Wushi earthquake sequence. (a) During 24–30 January, 2024; (b) During 31 January–6 February, 2024; (c) During 7–13 February, 2024; (d) During 14–24 February, 2024.
Preprints 118648 g004
Figure 5. Variations of the ionospheric parameters along the night orbit 33175 on January 24, 2024. (a) Electron density (top line) and electron temperature (bottom line). (b) He+ density (top line) and O+ density (bottom line). The electron density perturbation searched via software is denoted by a black arrow.
Preprints 118648 g005
Figure 6. Kp variations during January 23–February 3, 2024.
Preprints 118648 g006
Figure 7. Variations of the ionospheric parameters along the night orbit 33175. (a) Electron density (top line) and electron temperature (bottom line). (b) He+ density (top line) and O+ density (bottom line).
Preprints 118648 g007
Figure 8. Variations of the ionospheric parameters along the night orbit 33327 on February 3, 2024. (a) Electron density (top line) and electron temperature (bottom line). (b) He+ density (top line) and O+ density (bottom line). Automatically detected positive electron and O+ perturbations are denoted by black arrows. The negative irregularity on electron temperature is labeled by a red arrow and the enhancement on He+ by a green arrow.
Preprints 118648 g008
Figure 9. Fluctuations on electron density recorded by the CSES satellite on night revisiting orbits (a) 33403 on February 8, (b) 33479 on February 13, (c) 33555 on February 18, and (d) 33631 on February 23, 2024.
Preprints 118648 g009
Figure 10. Fluctuations on O+ density recorded by the CSES satellite on night revisiting orbits (a) 33403 on February 8, (b) 33479 on February 13, (c) 33555 on February 18, and (d) 33631 on February 23, 2024.
Preprints 118648 g010
Table 1. Information of two ion perturbations detected by the software along the CSES orbit of 21668 at night.
P1           P2    
Date (y m d) 2021 11 28 2021 12 28
Time (h m s ms) 19 3 11 404 19 1 11 404
Orbit
Suborb
21668
1
21668
1
Latitude (°) 37.6597 30.1204
Longitude (°) 99.9981 101.940
BkgdIon (cm-3) 32710.7 30500.9
Amplitude (cm-3) 42544.1 31740.9
Trend Increase Increase
Percent (%) 30.1 4.1
Time_width (m s ms) 1  48  0 1  18  0
Extension (km) 769 557
Table 2. Information of the 23 January 2024 Wushi MS 7.1 earthquake and its aftershocks with a magnitude more than 5.0.
Time/yyyymmdd hh-mm-ss Latitude/° Longitude/° Magnitude/MS Depth/km
20240123 02-09-05
20240123 02-42-33
20240123 03-36-46
20240123 07-19-25
20240123 09-18-41
20240124 04-38-12
20240125 06-21-48
20240126 04-01-28
20240130 06-27-40
20240224 06-58-55
20240225 12-14-59
41.26
41.33
41.11
41.21
41.19
41.06
41.08
41.29
41.15
41.12
41.15
78.63
78.70
78.66
78.71
78.84
78.65
78.55
78.83
78.67
78.54
78.41
7.1
5.2
5.3
5.2
5.2
5.7
5.2
5.6
5.7
5.3
5.8
22
14
20
15
10
10
15
18
10
10
11
Table 3. Information of night ionospheric perturbations detected via software during January 24–February 24, 2024.
Pe1      Pe2      Pi2  
Date (y m d) 2024 1 24 2024 2 3 2024 2 3
Time (h m s ms) 20 49 48 975 20 50 28 465 20 50 26 464
Orbit
Suborb
33175
1
33327
1
33327
1
Latitude (°) 47.7407 50.4960 50.3701
Longitude (°) 82.8527 82.0411 82.0913
BkgdIon (×106cm-3) 82726.0 51063.0 42276.4
Amplitude(×106cm-3) 114377.0 63603.4 53827.6
Trend Increase Increase Increase
Percent (%) 38.3 24.6 27.3
Time_width (m s ms) 1  30  0 1  9  0 1  12  7
Extension (km) 639 489 510
Disclaimer/Publisher’s Note: The statements, opinions and data contained in all publications are solely those of the individual author(s) and contributor(s) and not of MDPI and/or the editor(s). MDPI and/or the editor(s) disclaim responsibility for any injury to people or property resulting from any ideas, methods, instructions or products referred to in the content.
Copyright: This open access article is published under a Creative Commons CC BY 4.0 license, which permit the free download, distribution, and reuse, provided that the author and preprint are cited in any reuse.
Prerpints.org logo

Preprints.org is a free preprint server supported by MDPI in Basel, Switzerland.

Subscribe

© 2024 MDPI (Basel, Switzerland) unless otherwise stated