Preprint
Article

Optimal Sizing, Energy Balance, Load Management and Performance Analysis of a Hybrid Renewable Energy System

Altmetrics

Downloads

75

Views

41

Comments

0

A peer-reviewed article of this preprint also exists.

Submitted:

18 September 2024

Posted:

20 September 2024

You are already at the latest version

Alerts
Abstract
This work utilizes the particle swarm optimization (PSO) for the optimal sizing of a solar – wind – battery hybrid renewable energy system (HRES) for a rural community in Rivers State, Nigeria (Okorobo-Ile Town). The objective is to minimize the total economic cost (TEC), the total annual system cost (TAC) and the levelized cost of energy (LCOE). A two – step approach is used. The algorithm first determines the optimal number of solar panels and wind turbines. Based on the results obtained in the first step, the optimal number of batteries and inverters is computed. The overall results obtained is then compared with results from the NGSA-II and hybrid GA – PSO optimization algorithm. An energy management system monitors the energy balance and ensures the load management is adequate using the battery state of charge as a control strategy. Results obtained showed that the optimal configuration consist of solar panels (154), wind turbine (3), inverter (136) and batteries (29). This results in a minimized TEC, TAC and LCOE of 476, 731USD, 301, 947USD and 0.011USD/kWh respectively. The optimal configuration when simulated under various climatic scenarios was able to meet the energy needs of the community irrespective of ambient condition.
Keywords: 
Subject: Engineering  -   Electrical and Electronic Engineering

1. Introduction

The global energy landscape is undergoing a significant transformation driven by the main goal of reducing greenhouse gas emissions and ensuring energy security. A promising solution to this is the deployment of Hybrid Renewable Energy Systems (HRES). These systems combine multiple sources of renewable energy, such as solar, wind, and hydro, to provide a reliable and sustainable power supply.
As of September 2023, Nigeria’s electricity production reached 8,415 GWh [1]. However, the country’s national electricity grid has been unstable, with more than 200 collapses in the last nine years, often leading to widespread blackouts with the national rate of electricity access been just 58% [1]. The extension of the grid to rural areas is often unfeasible due to factors such as challenging terrains, remote locations, high supply costs, low consumption rates, low household incomes, poor road infrastructure, and scattered consumer settlements. As a result, many rural inhabitants depend on alternative sources like diesel generators for their electricity needs. However, this solution comes with its own set of problems, including noise pollution, greenhouse gas emissions, and high maintenance and fuel costs. In response to increasing environmental concerns, there is a push for the Nigerian electrical power industry to turn to cleaner sources for electricity generation. These sources, which include wind, solar, biomass, small hydro, and geothermal, are locally available, environmentally friendly, free, and unlimited. However, the intermittent nature of RE sources, which often necessitates system oversizing and the use of large energy storage devices, can lead to substantial investment costs.
In terms of HRES sizing, numerous studies have been conducted over the years. Agajie et al. [2] investigated the optimal design and mathematical modeling of a hybrid solar PV–biogas generator system with energy storage. Their study focused on multi-objective function cases to enhance the system’s economic viability, reliability, and environmental impact. Adewuyi et al. [3] explored a multi-objective mix generation planning approach considering utility-scale solar PV systems and voltage stability, specifically for Nigeria highlighting the importance of integrating solar PV to improve voltage stability and overall system reliability. Al-Masri et al. [4] developed an optimal energy management strategy for a hybrid photovoltaic-biogas energy system using multi-objective grey wolf optimization. They aim to optimize the system’s performance and cost-effectiveness. Xu et al. [5] proposed an improved optimal sizing method for wind-solar-battery hybrid power systems focusing on enhancing the reliability and efficiency of hybrid systems through better sizing strategies. Al-Masri et al. [6] examined the impact of different photovoltaic models on the design of a combined solar array and pumped hydro storage system with the aim of optimizing the system’s performance and cost-effectiveness. Nguyen et al. [7] investigated multi-objective decision-making and optimal sizing of a hybrid renewable energy system for a wastewater treatment plant. Emphasizing the importance of optimal sizing for system efficiency. Tian and Seifi [8] conducted reliability analysis of a hybrid energy system providing insights into the factors that affect system reliability and performance. Upadhyay and Sharma [9] developed a hybrid energy system with cycle charging strategy using particle swarm optimization for a remote area in India highlighting the benefits of hybrid systems in remote areas. Ma et al. [10] modeled and optimized a pumped storage-based standalone photovoltaic power generation system with the aim of enhancing the system’s economic and technical performance. These studies utilize conventional strategies like analytical, numerical, iterative, and probabilistic methods. Artificial Intelligence techniques like Grey Wolf Optimization (GWO), PSO, Cuckoo Search Algorithm (CSA), GA, Ant Colony Optimization (ACO), and Artificial Bee Colony (ABC) has also been explored. For instance, Al-Masri et al. [11] explored optimal allocation of a hybrid photovoltaic-biogas energy system using multi-objective feasibility-enhanced particle swarm algorithm. They focus on improving system reliability and cost-effectiveness. Sultan et al. [12] introduced an improved artificial ecosystem optimization algorithm for the optimal configuration of a hybrid PV/WT/FC energy system. It aims to enhance system performance and efficiency. Ukoima et al. [13] presented a modified multi-objective particle swarm optimization (m-MOPSO) for the optimal sizing of a solar-wind-battery hybrid renewable energy system with a focus on improving the system’s efficiency and reliability. Diab et al. [14] explored the sizing of a hybrid solar/wind/hydroelectric pumped storage energy system in Egypt using different meta-heuristic techniques with the aim of enhancing system performance and cost-effectiveness. Alotaibi et al. [15] designed a smart strategy for sizing a hybrid renewable energy system to supply remote loads in Saudi Arabia focusing on optimizing system performance and cost-effectiveness. Iturki and Awawad [16] minimized costs of a standalone hybrid wind/PV/biomass/pump-hydro storage-based energy system with the aim of enhancing the system performance and reduce cost. Centibas et al. [17] optimized an autonomous AC microgrid for commercial loads using the Harris Hawks Optimization algorithm for improved systems efficiency and reliabiity. Bukar et al. [18] investigated optimal sizing of an autonomous photovoltaic/wind/battery/diesel generator microgrid using the Grasshopper optimization algorithm. The study addresses efficient system configurations. Diab et al. [19] explored different optimization algorithms for sizing a stand-alone hybrid microgrid with PV, wind, diesel, and battery storage components. They aim to minimize the cost of energy while enhancing system reliability and efficiency. Arasteh et al. [20] focused on optimal allocation of photovoltaic/wind energy systems within a distribution network using metaheuristic algorithms. They aim to minimize active losses, enhance voltage profiles, and reduce power purchase costs. Suresh et al. [21] proposed an enhanced multi-objective particle swarm optimization algorithm for the optimal utilization of hybrid renewable energy systems with the aim of minimizing the cost of energy and the loss of power supply probability. Furthermore, hybrid methods like GA-PSO, Simulated Annealing-Tabulated Search, and GA-ABC is also the focus of reent studies. For example, Fadli and Purwoharjono [22] investigated optimal sizing of a PV/diesel/battery hybrid microgrid using a multi-objective bat algorithm. Shi et al. [23] addressed size optimization of stand-alone PV/wind/diesel hybrid power generation systems. Javed and Ma [24] conducted a techno-economic assessment of a hybrid solar-wind-battery system using a GA-ABC algorithm focussing on optimizing system performance and cost-effectiveness. Emad et al. [25] explored the techno-economic design of a hybrid PV/wind system with battery energy storage for a remote area. Hatata et al. [26] proposed an optimization method for sizing a solar/wind/battery hybrid power system based on the artificial immune system with a focus on improving system performance and cost-effectiveness. Askarzadeh and Coelho [27] introduced a novel framework for optimizing grid-independent hybrid renewable energy systems, focusing on a case study in Iran. Li et al. [28] presents the optimal design and techno-economic analysis of a solar-wind-biomass off-grid hybrid power system for remote rural electrification in West China. They aim to improve system reliability and cost-effectiveness. Goswami et al. [29] developed a grid-connected solar-wind hybrid system with reduced levelized tariff for a remote island in India. Utilization of computer software like HOMER, Transient System Simulation Tool and General Algebraic Modeling System is also in the lime light. Aziz et al. [30] investigated optimal sizing of standalone hybrid energy systems for rural electrification in Iraq. They considered sensitivity analysis to enhance system performance and reliability. Kumar and Channi [31] designed a PV-biomass off-grid hybrid renewable energy system (HRES) for rural electrification. They analyzed techno-economic and environmental aspects of the proposed system. Hashem et al. [32] explored optimal placement and sizing of wind turbine generators and superconducting magnetic energy storages in a distribution system. They aimed to improve system efficiency and reliability. Duchaud et al. [33] investigated multi-objective particle swarm optimization for sizing a renewable hybrid power plant with storage. They addressed factors such as cost, reliability, and environmental impact. Rezk et al. [34] sized a stand-alone hybrid PV-fuel cell-battery system for desalinating seawater at Saudi NEOM City. They considered energy sustainability and water production. Donado et al. [35] developed HYRES, a multi-objective optimization tool for configuring renewable hybrid energy systems. They explored various energy sources and system configurations. Generally, these studies typically use a variety of indicators to evaluate HRES performance. These indicators can be economic (Levelized cost of energy, net present cost, total annualized cost, reliability-based (Loss of power supply probability (LPSP) and loss of load probability), environmental (like life cycle assessment, life cycle emission and carbon footprint of energy), or social (social acceptance, job creation index, human development index).
From the reviewed literatures, despite Rivers State, Nigeria’s significant potential for renewable energy, there is a noticeable lack of literature on its HRES analysis. To the best of the authors’ knowledge, this is the sole study that suggests an optimal combination of HRES using optimization techniques for the region. Most of the research papers focused solely on system sizing or energy control. A successful energy management system must be combined with a suitable sizing method. The aim of this study is to develop a comprehensive approach to the operation of HRES, integrating optimal sizing, energy balance, load management, and control strategy. The optimal sizing of HRES is crucial to ensure that the system can meet the energy demand at the lowest possible cost. Energy balance involves managing the supply and demand of energy within the system, ensuring that energy production matches consumption. Load management strategies are used to control and optimize the operation of the HRES, improving its efficiency and reliability. Finally, the control strategy is essential for the stable and efficient operation of the HRES, managing the interaction between different energy sources and the load. Optimal sizing, energy balance, load management and control are separate but interconnected facets of the same Hybrid Renewable Energy System (HRES). A system that is optimally sized but lacks energy balance, load management and control will not operate efficiently. Optimal sizing aims to minimize implementation costs and ensure energy affordability, while optimal control aims to minimize operational costs and ensure energy availability.
Our optimal sizing model identifies the least costly structure of the HRES system. The model is then combined with an Energy Management System (EMS) algorithm that guarantees optimal energy scheduling during the system operation. The combination of these two systems will result in a mutual model that guarantees energy reliance at the lowest possible cost. This study employs PSO to achieve this. It is a widely recognized optimization algorithm that stands out due to its numerous benefits compared to other similar algorithms. Its advantages encompass its simplicity, the fact that it doesn’t require derivatives, its use of a limited number of parameters which eases the tuning process, its ability to be easily parallelized, and its insensitivity to scaling, meaning that the performance of PSO remains largely unaffected by the scaling of design variables. The performance of the PSO is then compared with results obtained from the hybrid GA-PSO, NGSA-II, and proprietary derivative free optimization algorithms.

2. Materials and Methods

Matlab 2020a and HOMER was used in running of the simulations. Firstly, the PSO was used to find the optimal number of solar panels and wind turbines. The results obtained is then used to compute the number of batteries and inverters required. The overall results are then compared with results obtained from the hybrid GA – PSO and NGSA-II. Finally, the optimal configurations is then simulated under various weather conditions to see the general performance under varying conditions. The research framework is shown in Figure 1.

2.1. Description of Okorobo-Ile Town and Load Profile

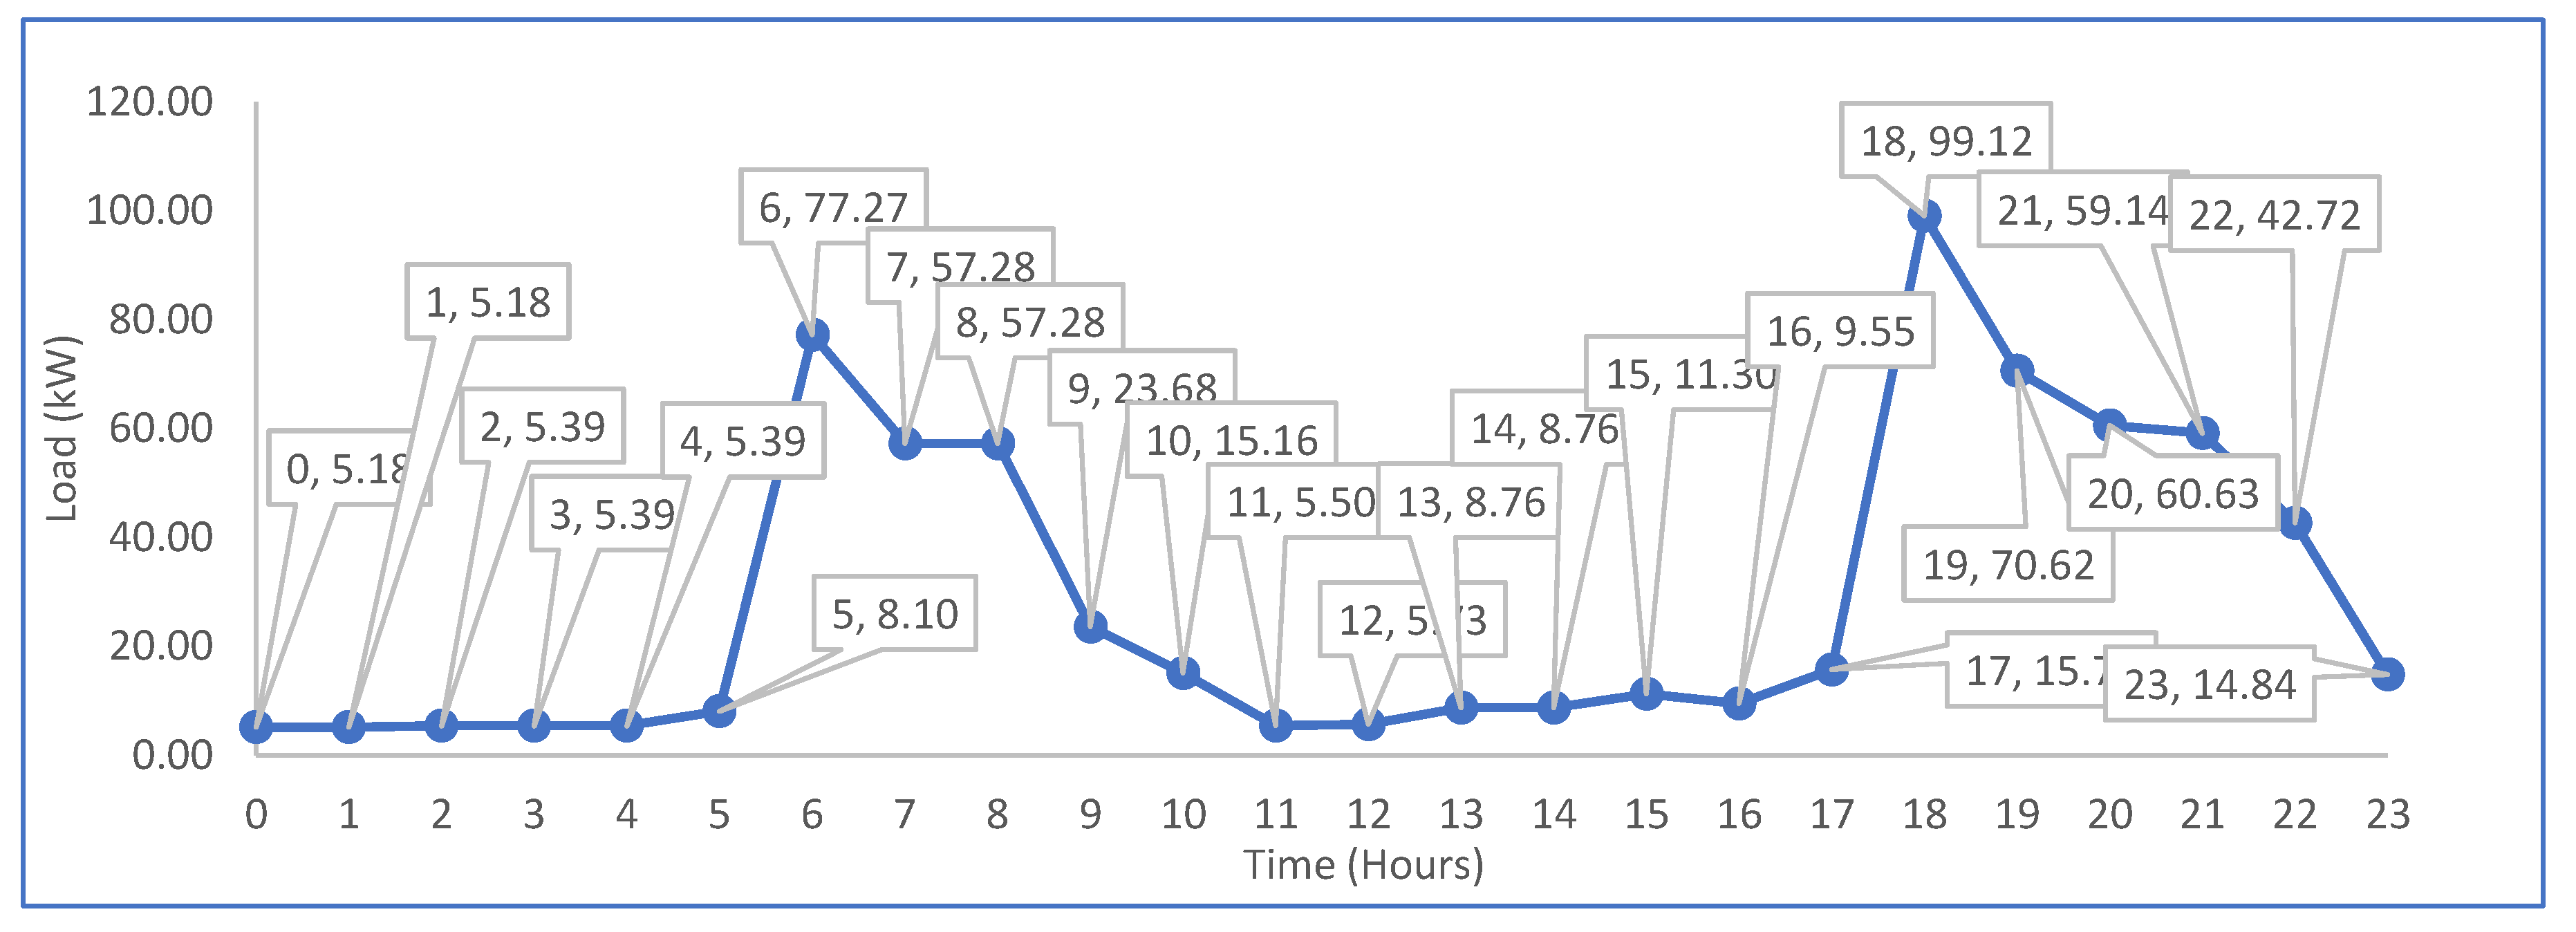
Okorobo-Ile town is a remote settlement in South – South, Nigeria. It is located at the boundary between Rivers and Akwa-Ibom State. The village is home to approximately 6700 residents, encompassing around 600 households, and includes community centers such as schools, churches, and a town hall. The majority of the villagers depart their homes in the morning and return in the evening. The community’s total daily energy demand (TED) is 656.36kWh, with a peak load of 99.12kW and a total daily load of 678kW [36]. A detailed technical analysis of this community’s load demand and profile can be found in [36]. Figure 2 shows the load profile of the community.

2.2. Resource Data

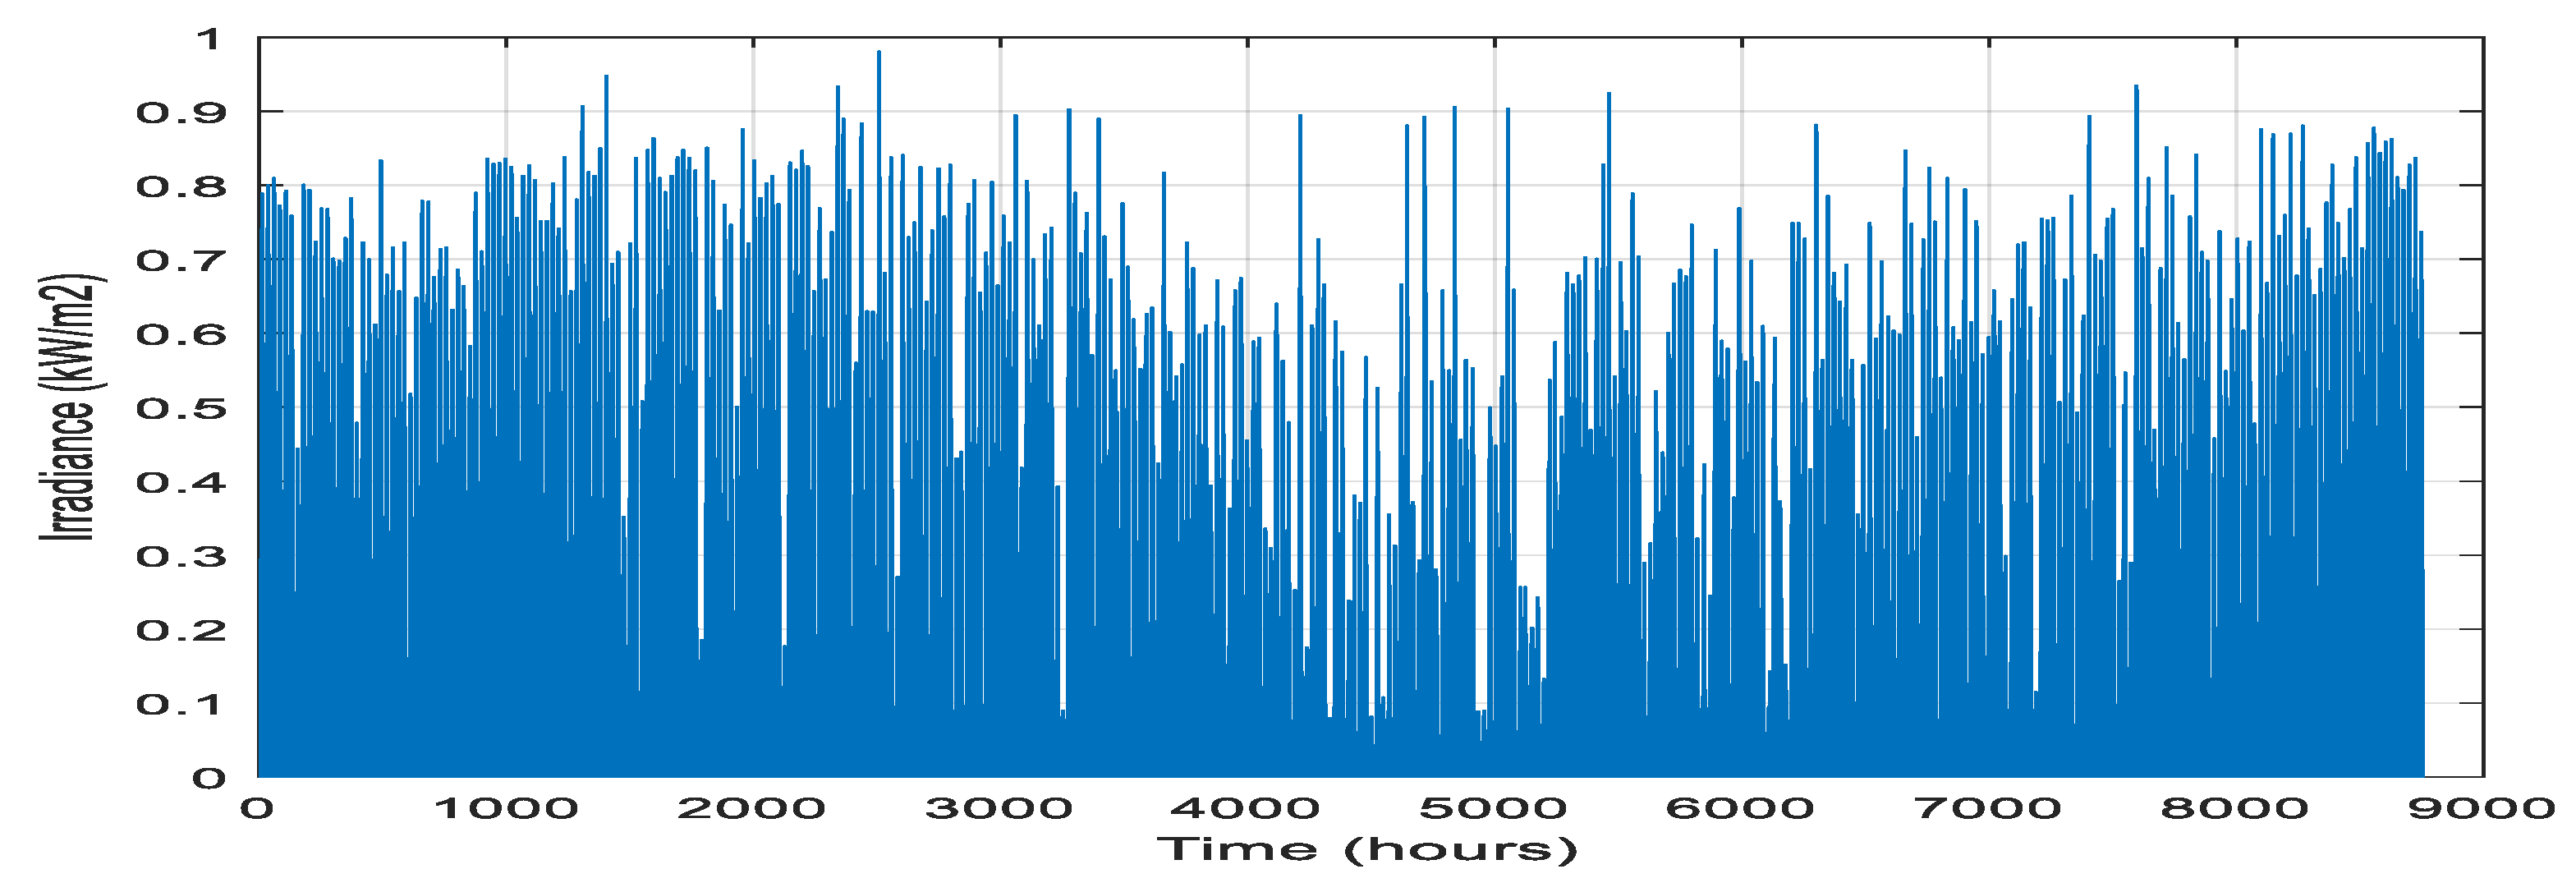
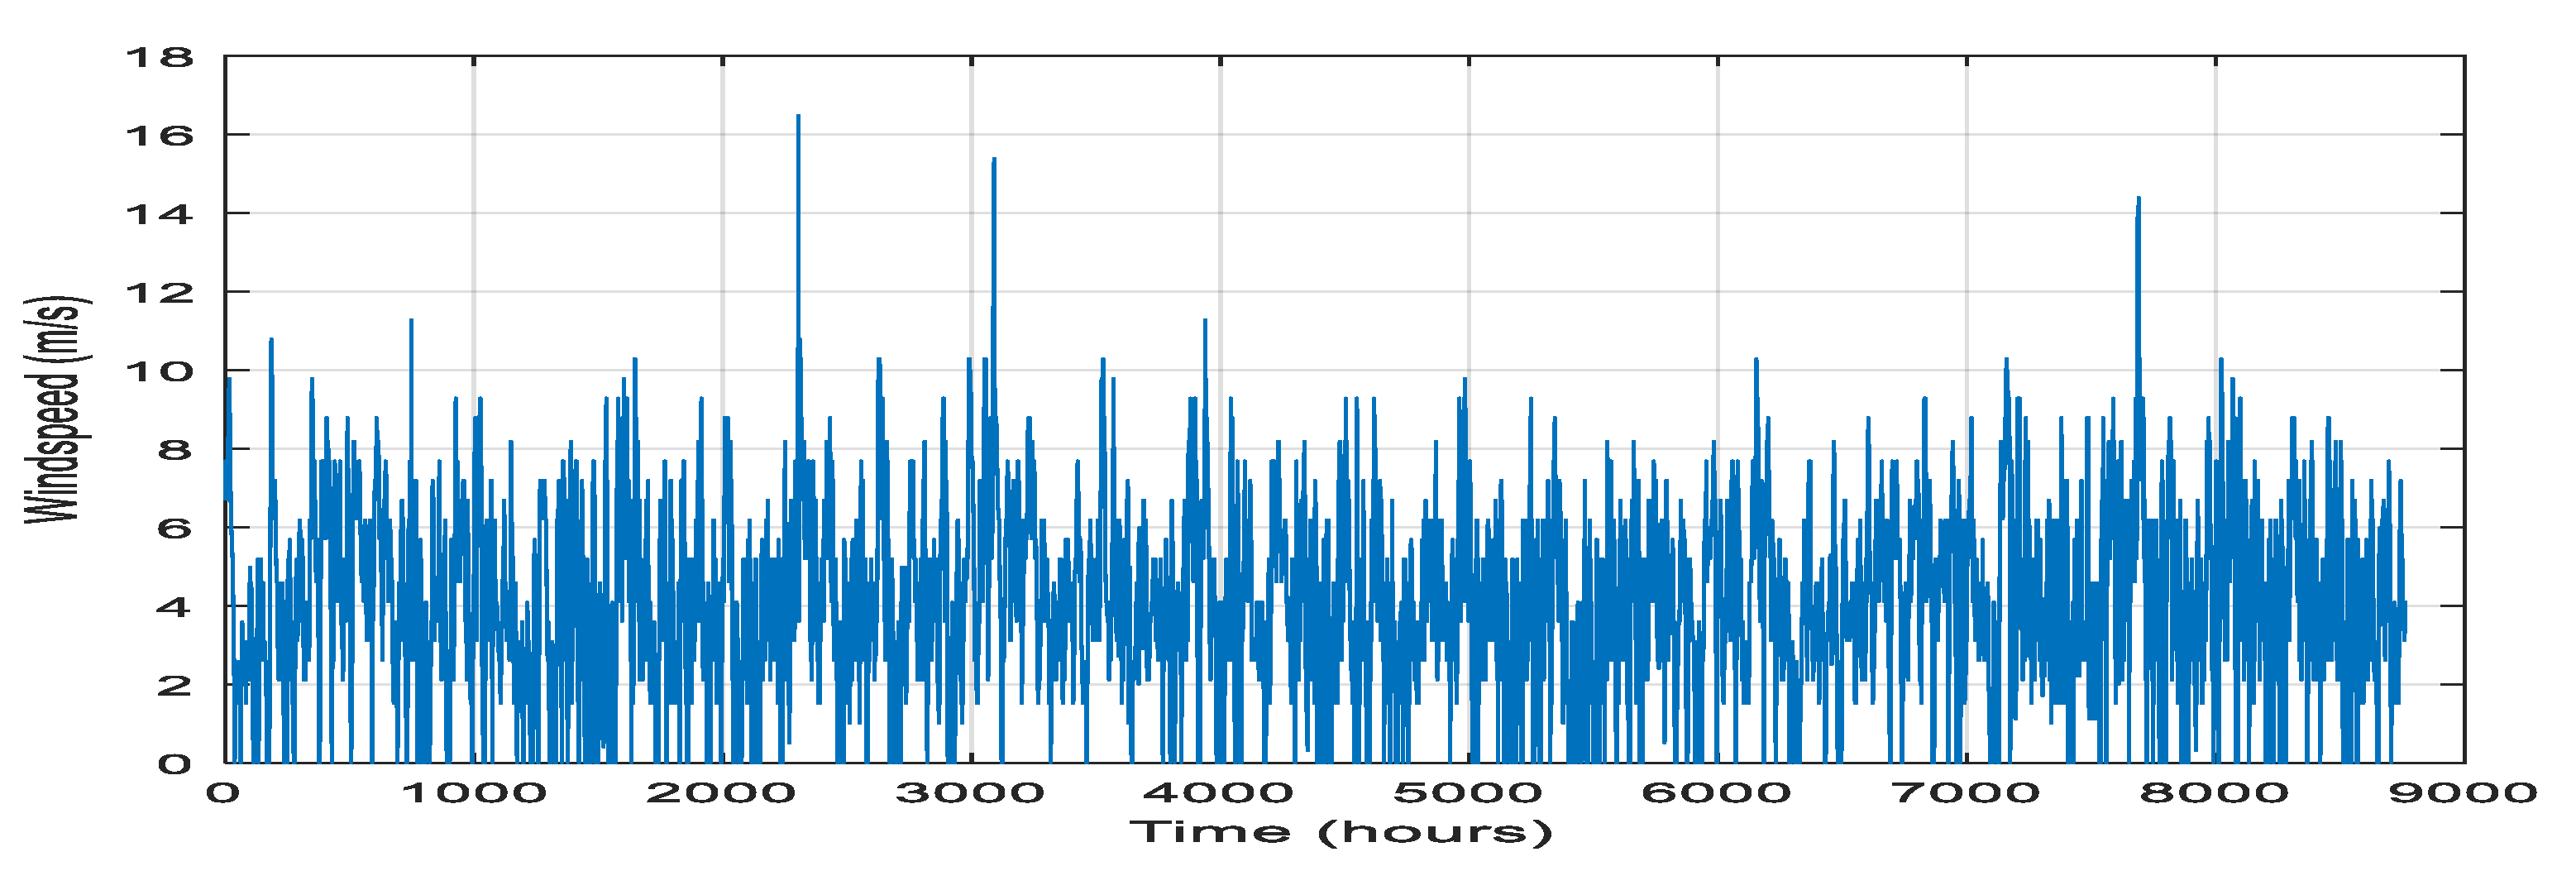
The site solar data was obtained from NASA solar energy radiation database as shown in Figure 3. The wind speed data was obtained from hourly measurement from January 2020 – January 2023) using the UNI-T Bluetooth digital anemometer installed at a 10m height. Figure 4 shows a plot of the sites’ recorded average wind speed over the four years.

2.3. Mathematical model of the HRES

2.3.1. PV panels

The hourly output power of a PV module is defined as [37,38]:
P p v ( t ) = G t   x   A   x   η
G(t) is the hourly site solar irradiance as seen in Figure 1, A is the area of the panel (1m2) and η is the solar panel efficiency (20%). In this study, we assumed that the PV modules have a maximum power point tracking (MPPT) system and ignored the temperature effects. If x(1) is the number of PV modules to be optimized, the total PV power is given as follows:
P p v = x 1 P p v

2.3.2. Wind Turbine

Several formulas exist for the power output of a wind turbine. In this study, we use the formula:
P w v = 0 v v c   &   v v f P r   x   v 3 v c 3 v r 3 v c 3 v c v v r P r v r v v f
v is the wind speed at the wind turbines hub. Vc is the cut-in speed. Vr is the rated speed and Vf is the cutoff speed. In this study, the rating of the wind turbine is 25kW, the rated speed is 3m/s and cut-in speed is 2m/s. Converting the measured wind speed at a given height to the turbine hub speed is carried out using the power law.
v = v m e a s u r e   x   h h u b h m e a s u r e α
α represents the exponent law coefficient.
α varies with season, nature of terrain, time of the day, elevation, temperature, wind speed, and various thermal and mechanical mixing parameters. When there is no specific site data, α is usually taken as 0.14 and for windy locations, α is 0.25.
If x(2) is the number of wind turbines to be optimized, the total wind power is given as follows:
P w = x 2 P w

2.3.3. Number of Inverters

In this study, the computation of the number of inverters is based primarily be based on the peak load. This is because the inverter must be able to handle the highest power demand that the system will experience at any given time to avoid overloading. To account for potential future expansion of the system, this study incorporates a small margin above the calculated peak load to ensure reliability. The following steps is used by the algorithm to compute the number of inverters.
Determine the HRES peak power
Determine the peak load from the load profile.
Compare peak load from load profile and peak power generated from the HRES. The maximum is the peak_power.
Add a safety margin of 23% for reliability and future load expansion.
Assuming a rating of 1kW of one inverter and an efficiency of 95%, then the number of inverter, x(3) is given as:
x 3 = p e a k _ p o w e r i n v e r t e r   r a t i n g   x   i n v e r t e r   e f f i c i e n c y

2.3.4. Number of Batteries

The energy produced by the HRES can directly power the community’s needs during production hours and excess energy can be stored in the batteries for use when the renewable sources are not producing energy (e.g., at night or during periods of low wind).
The following steps is used by the algorithm to compute the number of inverters.
Determine the daily energy generated by the HRES
Energy storage required = daily energy demand – daily energy generated
Add a safety margin of 23% for reliabili2ty and future load expansion.
Assuming a rating of one battery is 72kW, dod is 80%, inverter efficiency is 90%, battery efficiency is 0.85, safety factor 23%, then the number of batteries, x(4) is given as:
x 4 = d a i l y e n e r g y d e m a n d d a i l y e n e r g y g e n e r a t e d s a f e t y   f a c t o r   x   D o D   x   b a t t e r y   c a p a c i t y x   b a t t e r y   e f f i c i e n c y   x   i n v e r t e r   e f f i c i e n c y

2.4. Optimization Problem Formulation

2.4.1. Decision Variables

In this study, the considered decision variables are:
Number of PV panels – x(1)
Number of wind turbines – x(2)
Number of inverters – x(3)
Number of batteries – x(4)

2.4.2. Objective Function

In this study, the aim is to minimize the total economic cost (TEC) of the HRES.
TEC(x(1),x(2),x(3),x(4)) = TAC+ TC + I_C – SV
TAC is the total annual cost and is given by:
TAC = C_C + C_OM + C_R
C_C is the annualized capital cost and is given by:
C _ C = I C x C R F
IC is the total initial cost given by:
IC = x(1). Capital cost per solar panel + x(2). Capital cost per wind turbine + x(3). Capital cost per inverter + x(4). Capital cost per battery.
CRF is the capital recovery factor given by:
C R F = d i s c o u n t r a t e x ( 1 + d i s c o u n t r a t e ) p r o j e c t l i f e ( 1 + d i s c o u n t r a t e ) p r o j e c t l i f e 1
C_OM is the operation and maintenance cost. The annual operation and maintenance cost does not include the capital recovery factor. It is generally considered a fixed cost associated with the operation and maintenance of the system and is given by:
C_OM = x(1). Operation maintenance cost per solar panel + x(2). Operation maintenance cost per wind turbine + x(3). Operation and maintenance cost per inverter + x(4). Operation maintenance cost per battery
C_R is the annualized replacement cost and is given by:
C _ R = R C x C R F
RC = x(1). Replacement cost per solar panel + x(2). replacement cost per wind turbine + x(3). replacement_cost_inverter + x(4). replacement cost per battery
C R F = d i s c o u n t r a t e x ( 1 + d i s c o u n t r a t e ) p r o j e c t l i f e 2 ( 1 + d i s c o u n t r a t e ) p r o j e c t l i f e 2 1
Equation (14) assumes the project components need to be replaced halfway through the project life.
TC is the annualized tax cost is given as:
TC = tax rate . (IC - SV)
A tax rate of 30% is used in this study.
The salvage value SV at the end of the project life is given as:
S V = 0.2   x   I C ( 1 + d i s c o u n t r a t e ) p r o j e c t l i f e
Equation (16) assumes that salvage value is 20% of component cost
I_C is the annual insurance cost and is given as:
I_C = insurance rate . IC
An insurance rate of 5% is used in this study

2.4.3. Constraint

The constraint used in this study is given below:
The first constraint is: Xkmin ≤ Xk ≤ Xkmax, k ϵ [PV panels, wind turbines]
Xk = integer, k ϵ [PV panels, wind turbines]
This constraint specifies the minimum and maximum limits for the number of solar panels and wind turbines to reduce land use expenditures. In this study, the maximum limit for the solar panels and wind turbines was set at 165 and 3 respectively. The lower limit for the solar panels and wind turbines was set at: 50 and 0 respectively.
The second constraint is given as: Daily power generated ≥ daily load profile

2.4.4. Technique for Optimization

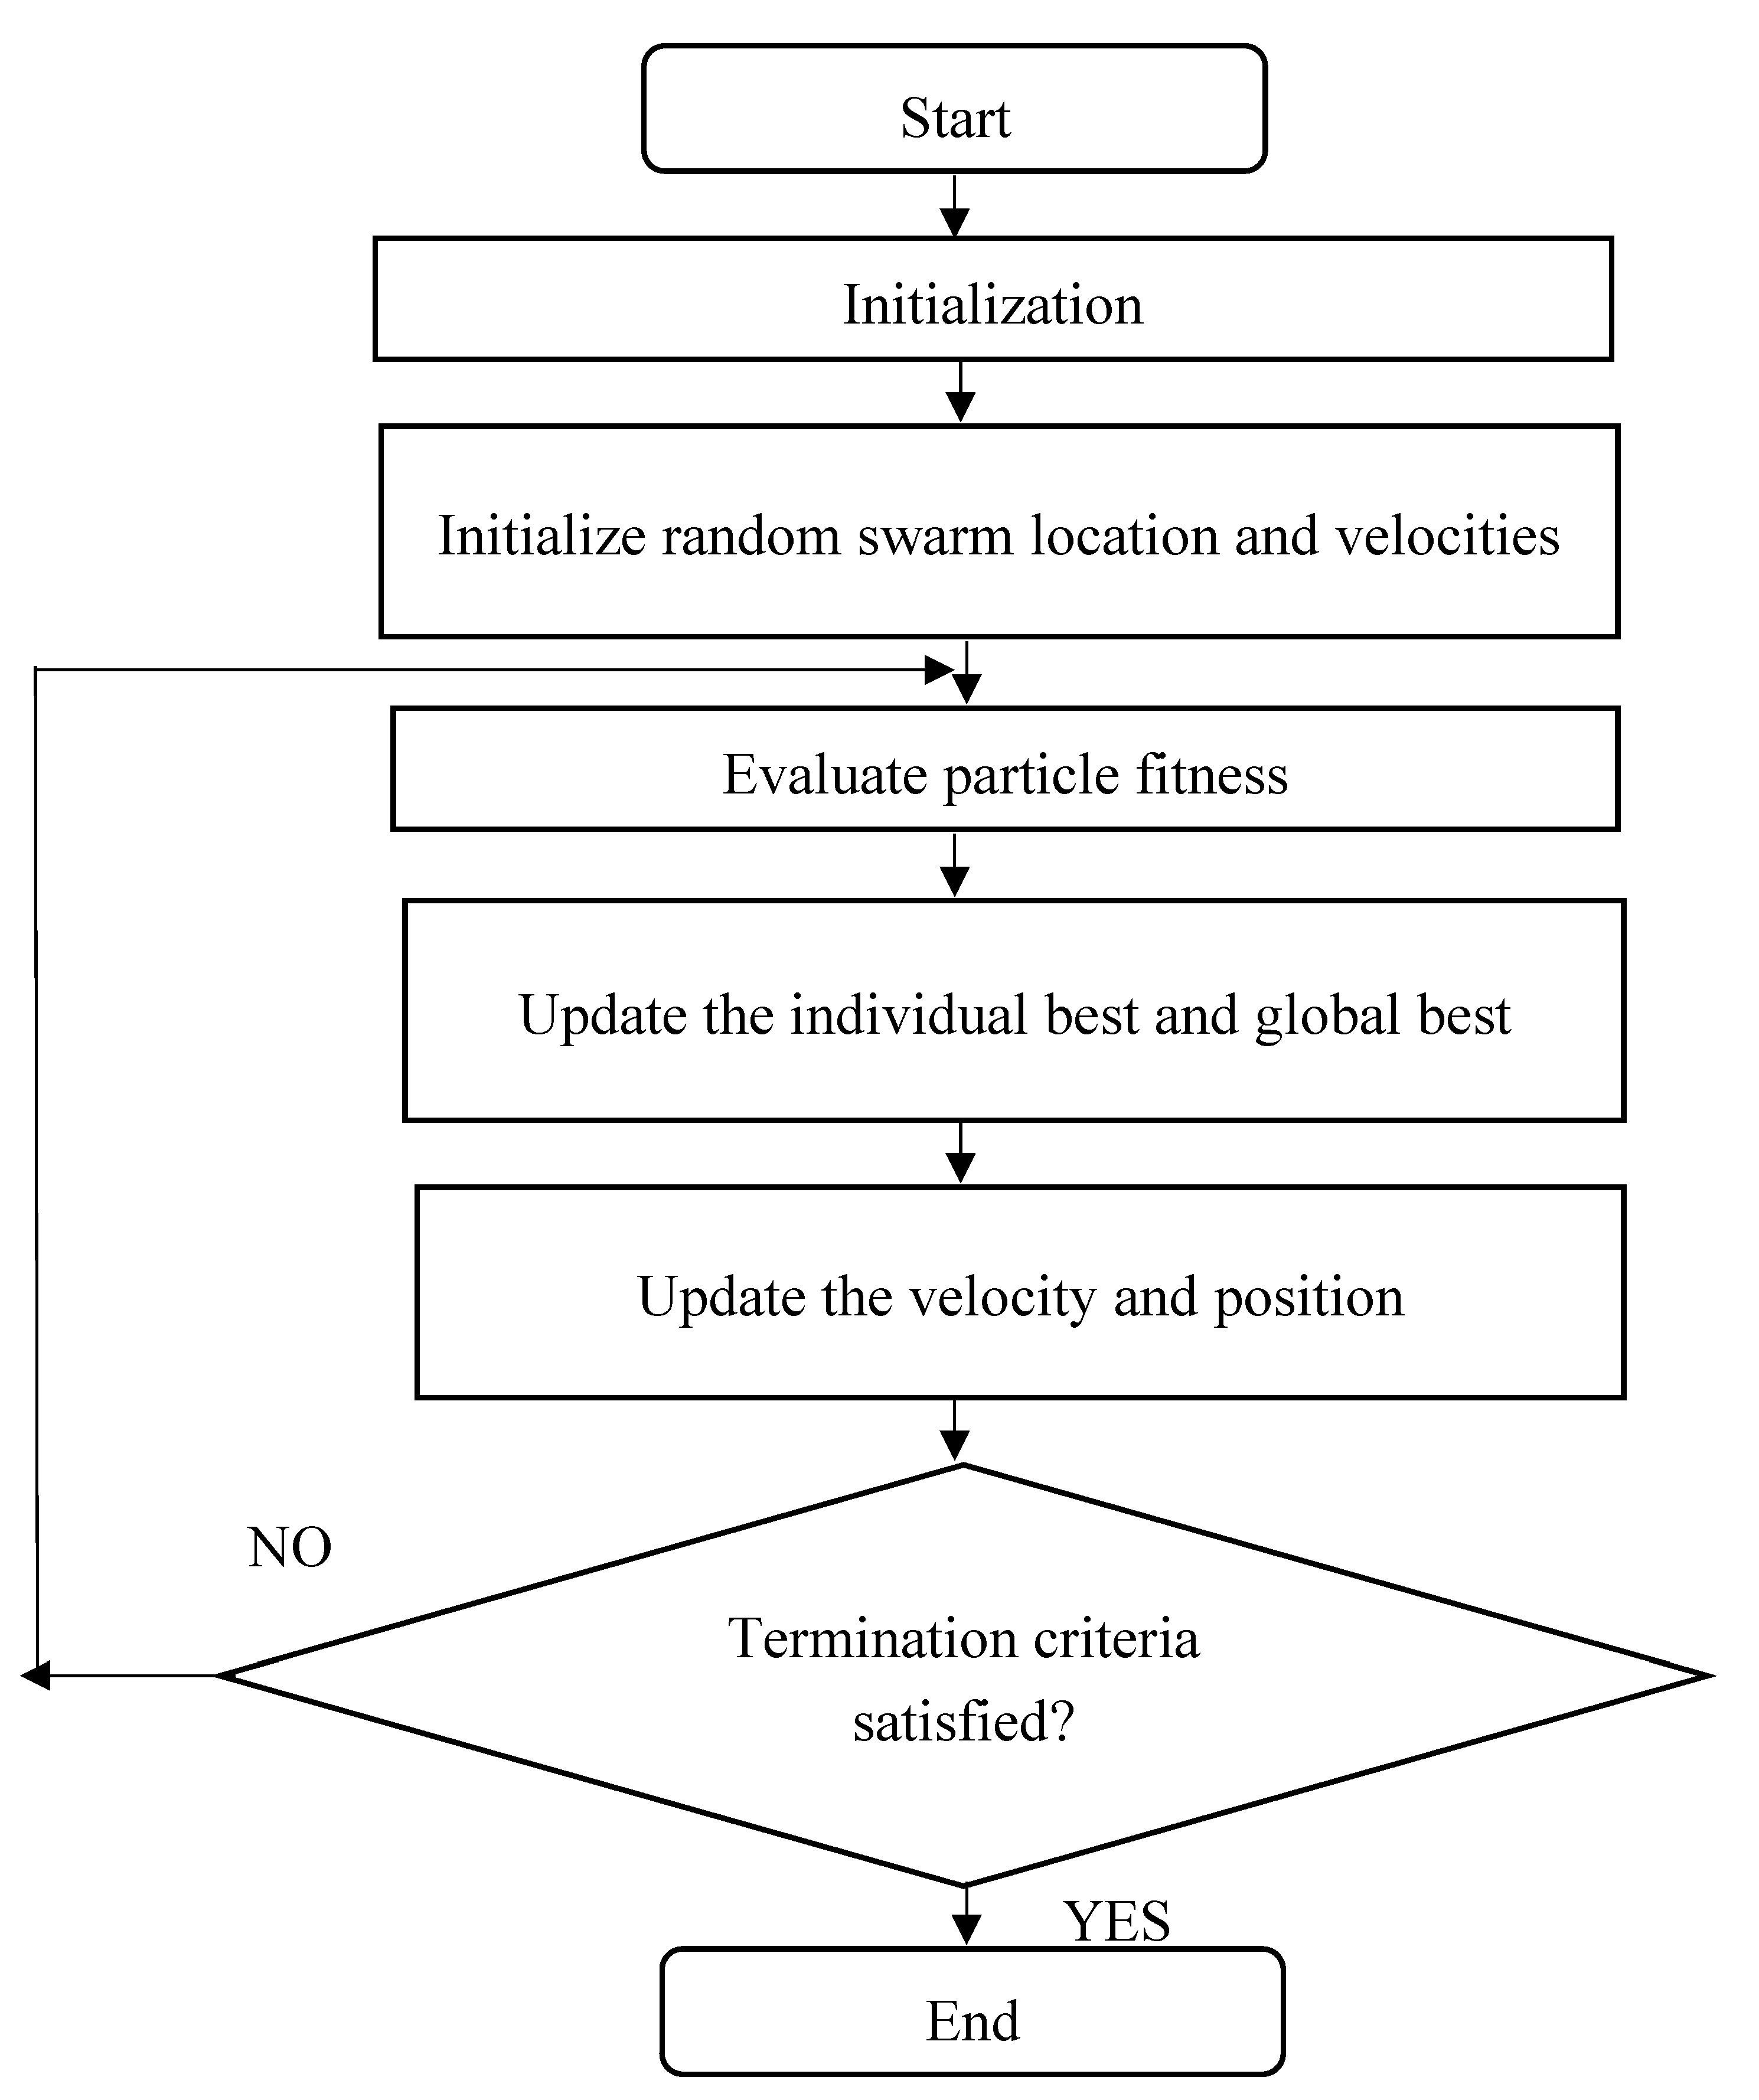
This study uses the Particle Swarm Optimization (PSO) which is an algorithm inspired by the social behavior of species like birds or fish that move in groups to reach a shared objective. It’s an algorithm that falls under the domain of swarm intelligence, which is a subset of artificial intelligence. In the context of PSO, a swarm of particles, each symbolizing a potential solution, explores the solution space of a problem to identify the most optimal solution. The movement of each particle is dictated by its own best known position and is also steered towards the best known positions in the search-space, which are updated as other particles discover better positions. This heuristic method is designed to guide the swarm towards the most optimal solutions. This is shown in Figure 5. The result of the optimization technique is then compared with the hybrid GA – PSO, NGSA-II and the propriety derivative free algorithm used in HOMER. The hybrid GA-PSO algorithm essentially combines the strengths of both genetic algorithm (GA) and PSO. By feeding the GA with data obtained from the PSO, the GA is given a good starting point, which can help it avoid local optima and improve its search process.

2.5. Energy Balance, Control and Load Management

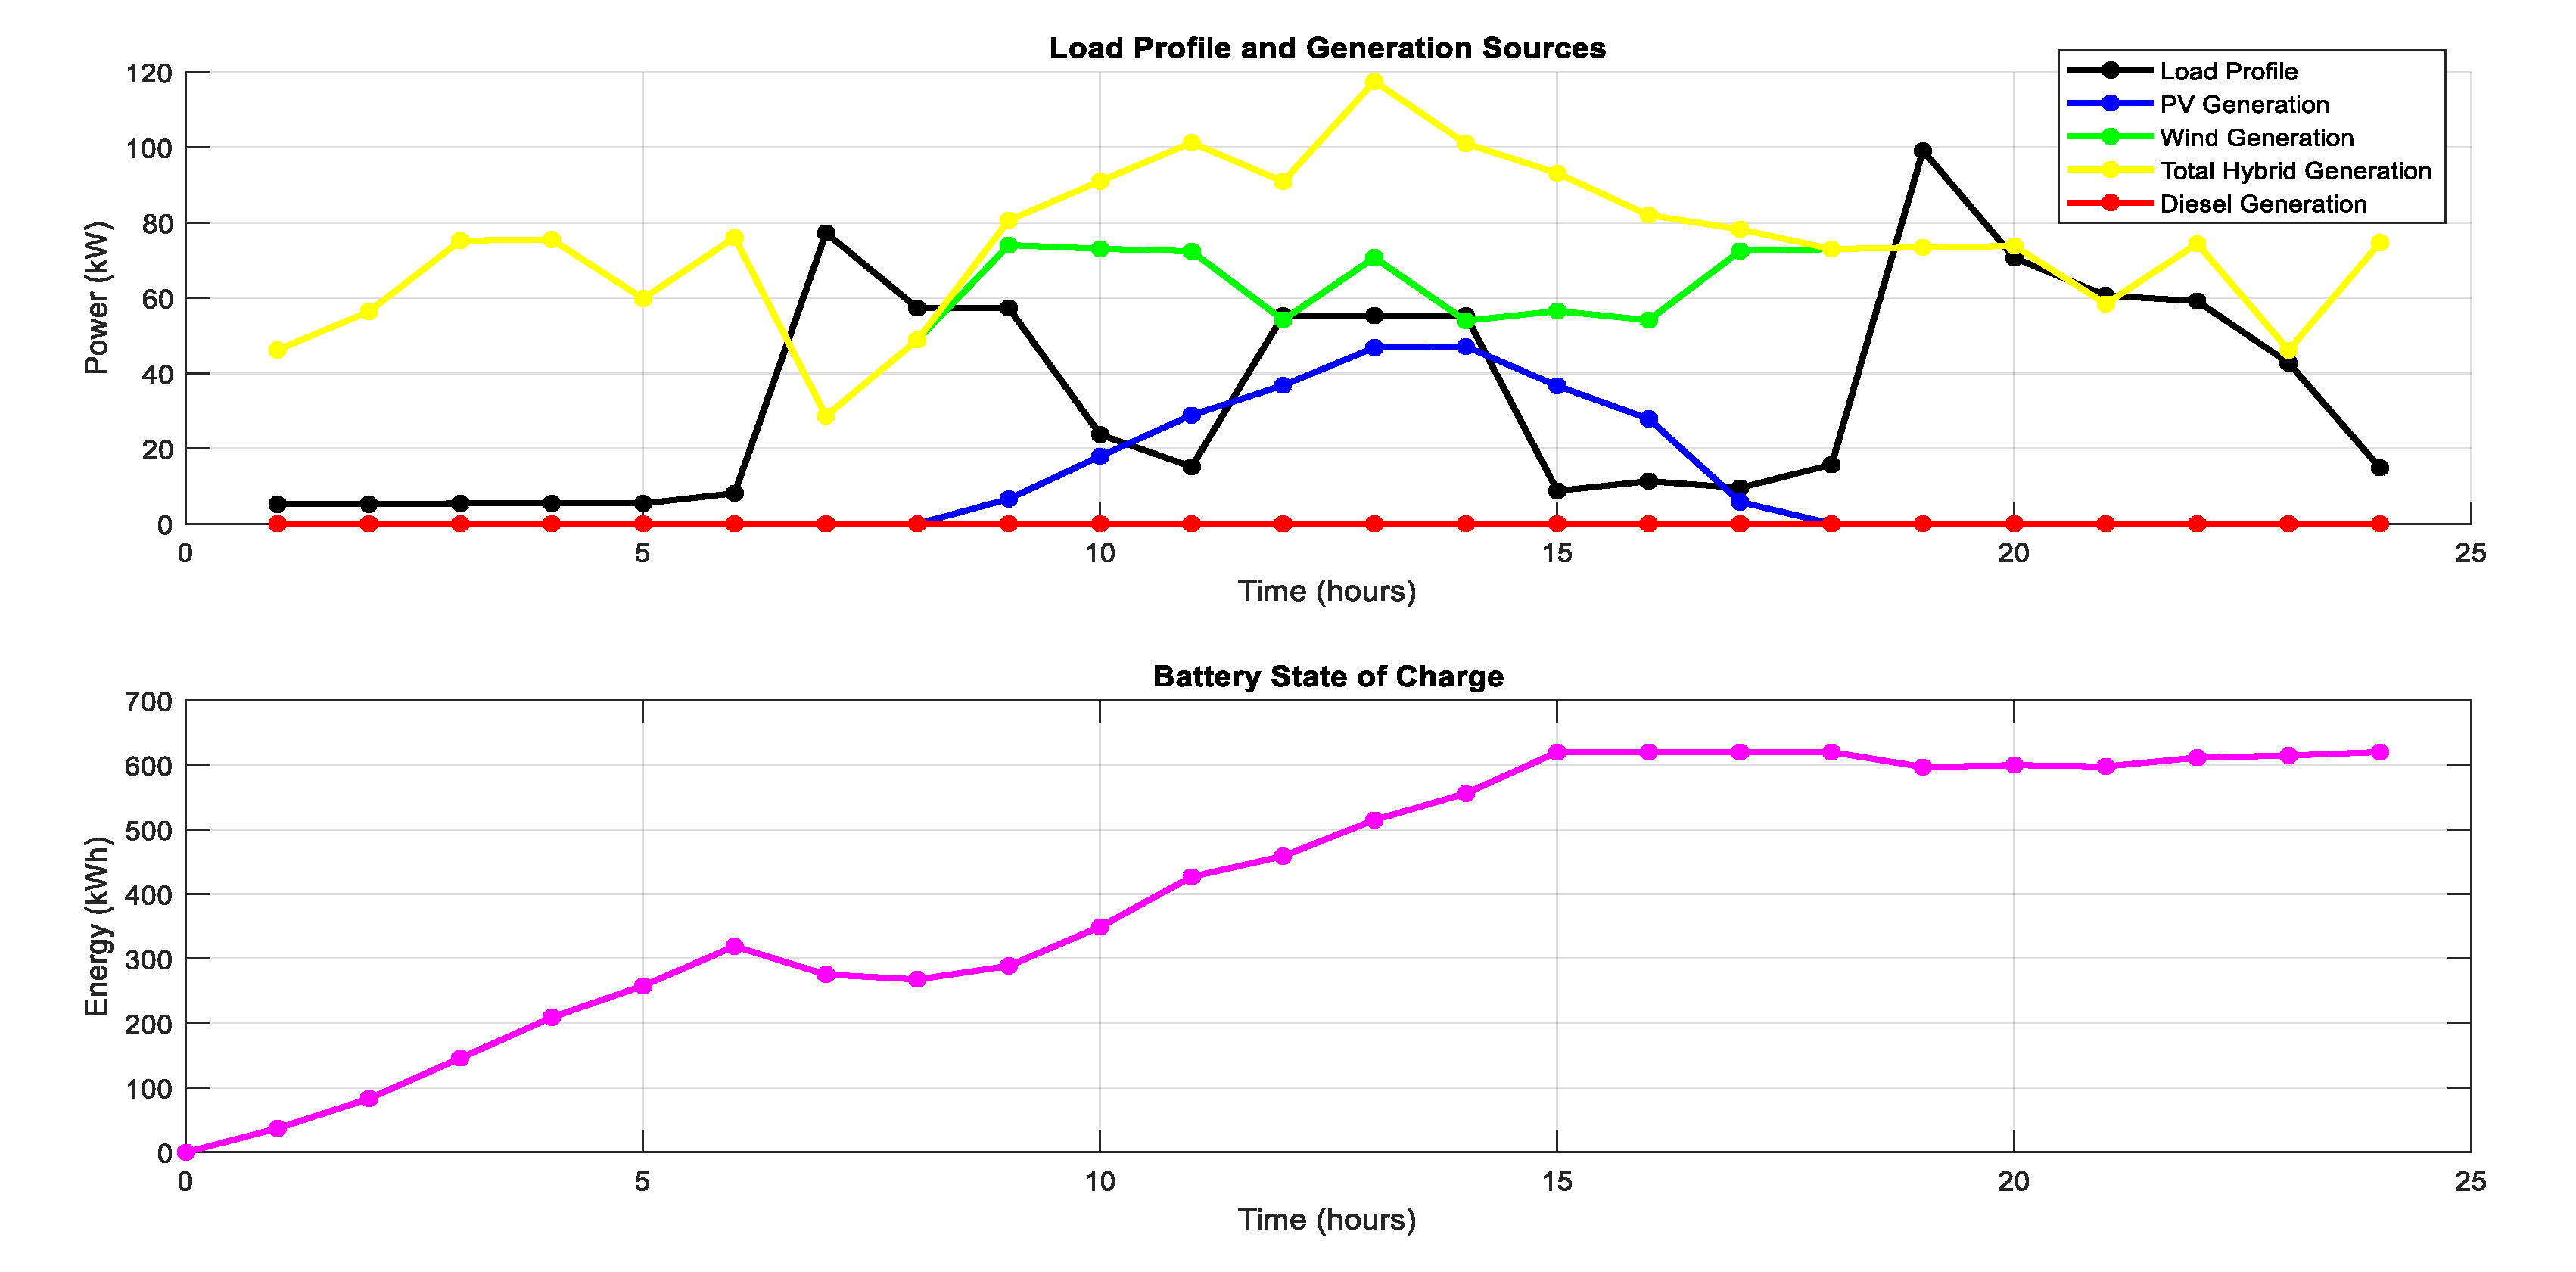
For energy balance, the algorithm calculates the energy balance at each time step by subtracting the load (energy demand) from the total DC power generated by the wind and solar sources. This balance determines whether there is excess or insufficient generation. If there’s excess generation, the surplus energy is stored in the battery. If there’s insufficient generation, energy is drawn from the battery. This process ensures that the energy produced matches the energy consumed, thus maintaining a balance. The battery state of charge control part of the algorithm monitors the state of charge (SOC) of the battery based on the energy balance. If there’s excess generation, the battery is charged up to its capacity. If there’s insufficient generation, the battery is discharged but not below a minimum SOC. This control mechanism ensures the battery is used optimally, prolonging its life and ensuring it can provide power when needed. In the load management section, If there’s still a remaining load after accounting for the total DC power and the battery, the diesel generator is used. The amount of generation from the diesel generator is controlled to meet the remaining load, but within the generator’s capacity and minimum load. This ensures that the load is met at all times. The diesel generator was included in the algorithm to see if it is possibly needed. The diesel generator control, controls the diesel generator’s operation to prevent rapid changes in its output. This is done by limiting the ramp rate, which is the change in generation from one time step to the next. This control mechanism can prevent potential damage to the generator due to rapid changes in load.
The energy balance, control and load management is achieved with the following steps
  • Calculate total DC power: This is calculated by adding the power output from the WT and PV panels.
  • Calculate the energy balance (E_b): This is calculated by subtracting the load profile (the energy demand at time i) from the total DC power.
  • Update battery state of charge (SOC): Depending on the energy balance, the battery SOC is updated as follows:
If there is excess generation (Energy_balance > 0), the energy is stored in the battery. The amount of energy stored is limited by the battery’s power rating and charging efficiency. The SOC is also limited to the battery’s capacity.
If there is insufficient generation (Energy_balance < 0), energy is drawn from the battery. The amount of energy drawn is limited by the battery’s power rating and discharging efficiency. The SOC is also limited to a minimum SOC.
If the energy balance is zero, the battery SOC remains unchanged.
4.
Calculate remaining load: The remaining load is calculated by subtracting the total DC power and the change in battery SOC from the load profile.
5.
Possible diesel generator operation: If there is a remaining load, the diesel generator is used. The amount of generation is limited by the generator’s capacity and its minimum load. The generator’s ramp rate is also taken into account to limit the change in generation from one time step to the next.

2.6. Technical Specifications for Optimization

The optimization algorithm minimizes the TAC while ensuring that the solution is adequate in meeting the community’s energy demand. The type of HRES, their rating and pricing are taken into consideration in the process of selection. The technical specification is shown in Table 1.

3. Results and Discussion

3.1. Result from Particle Swarm Optimization

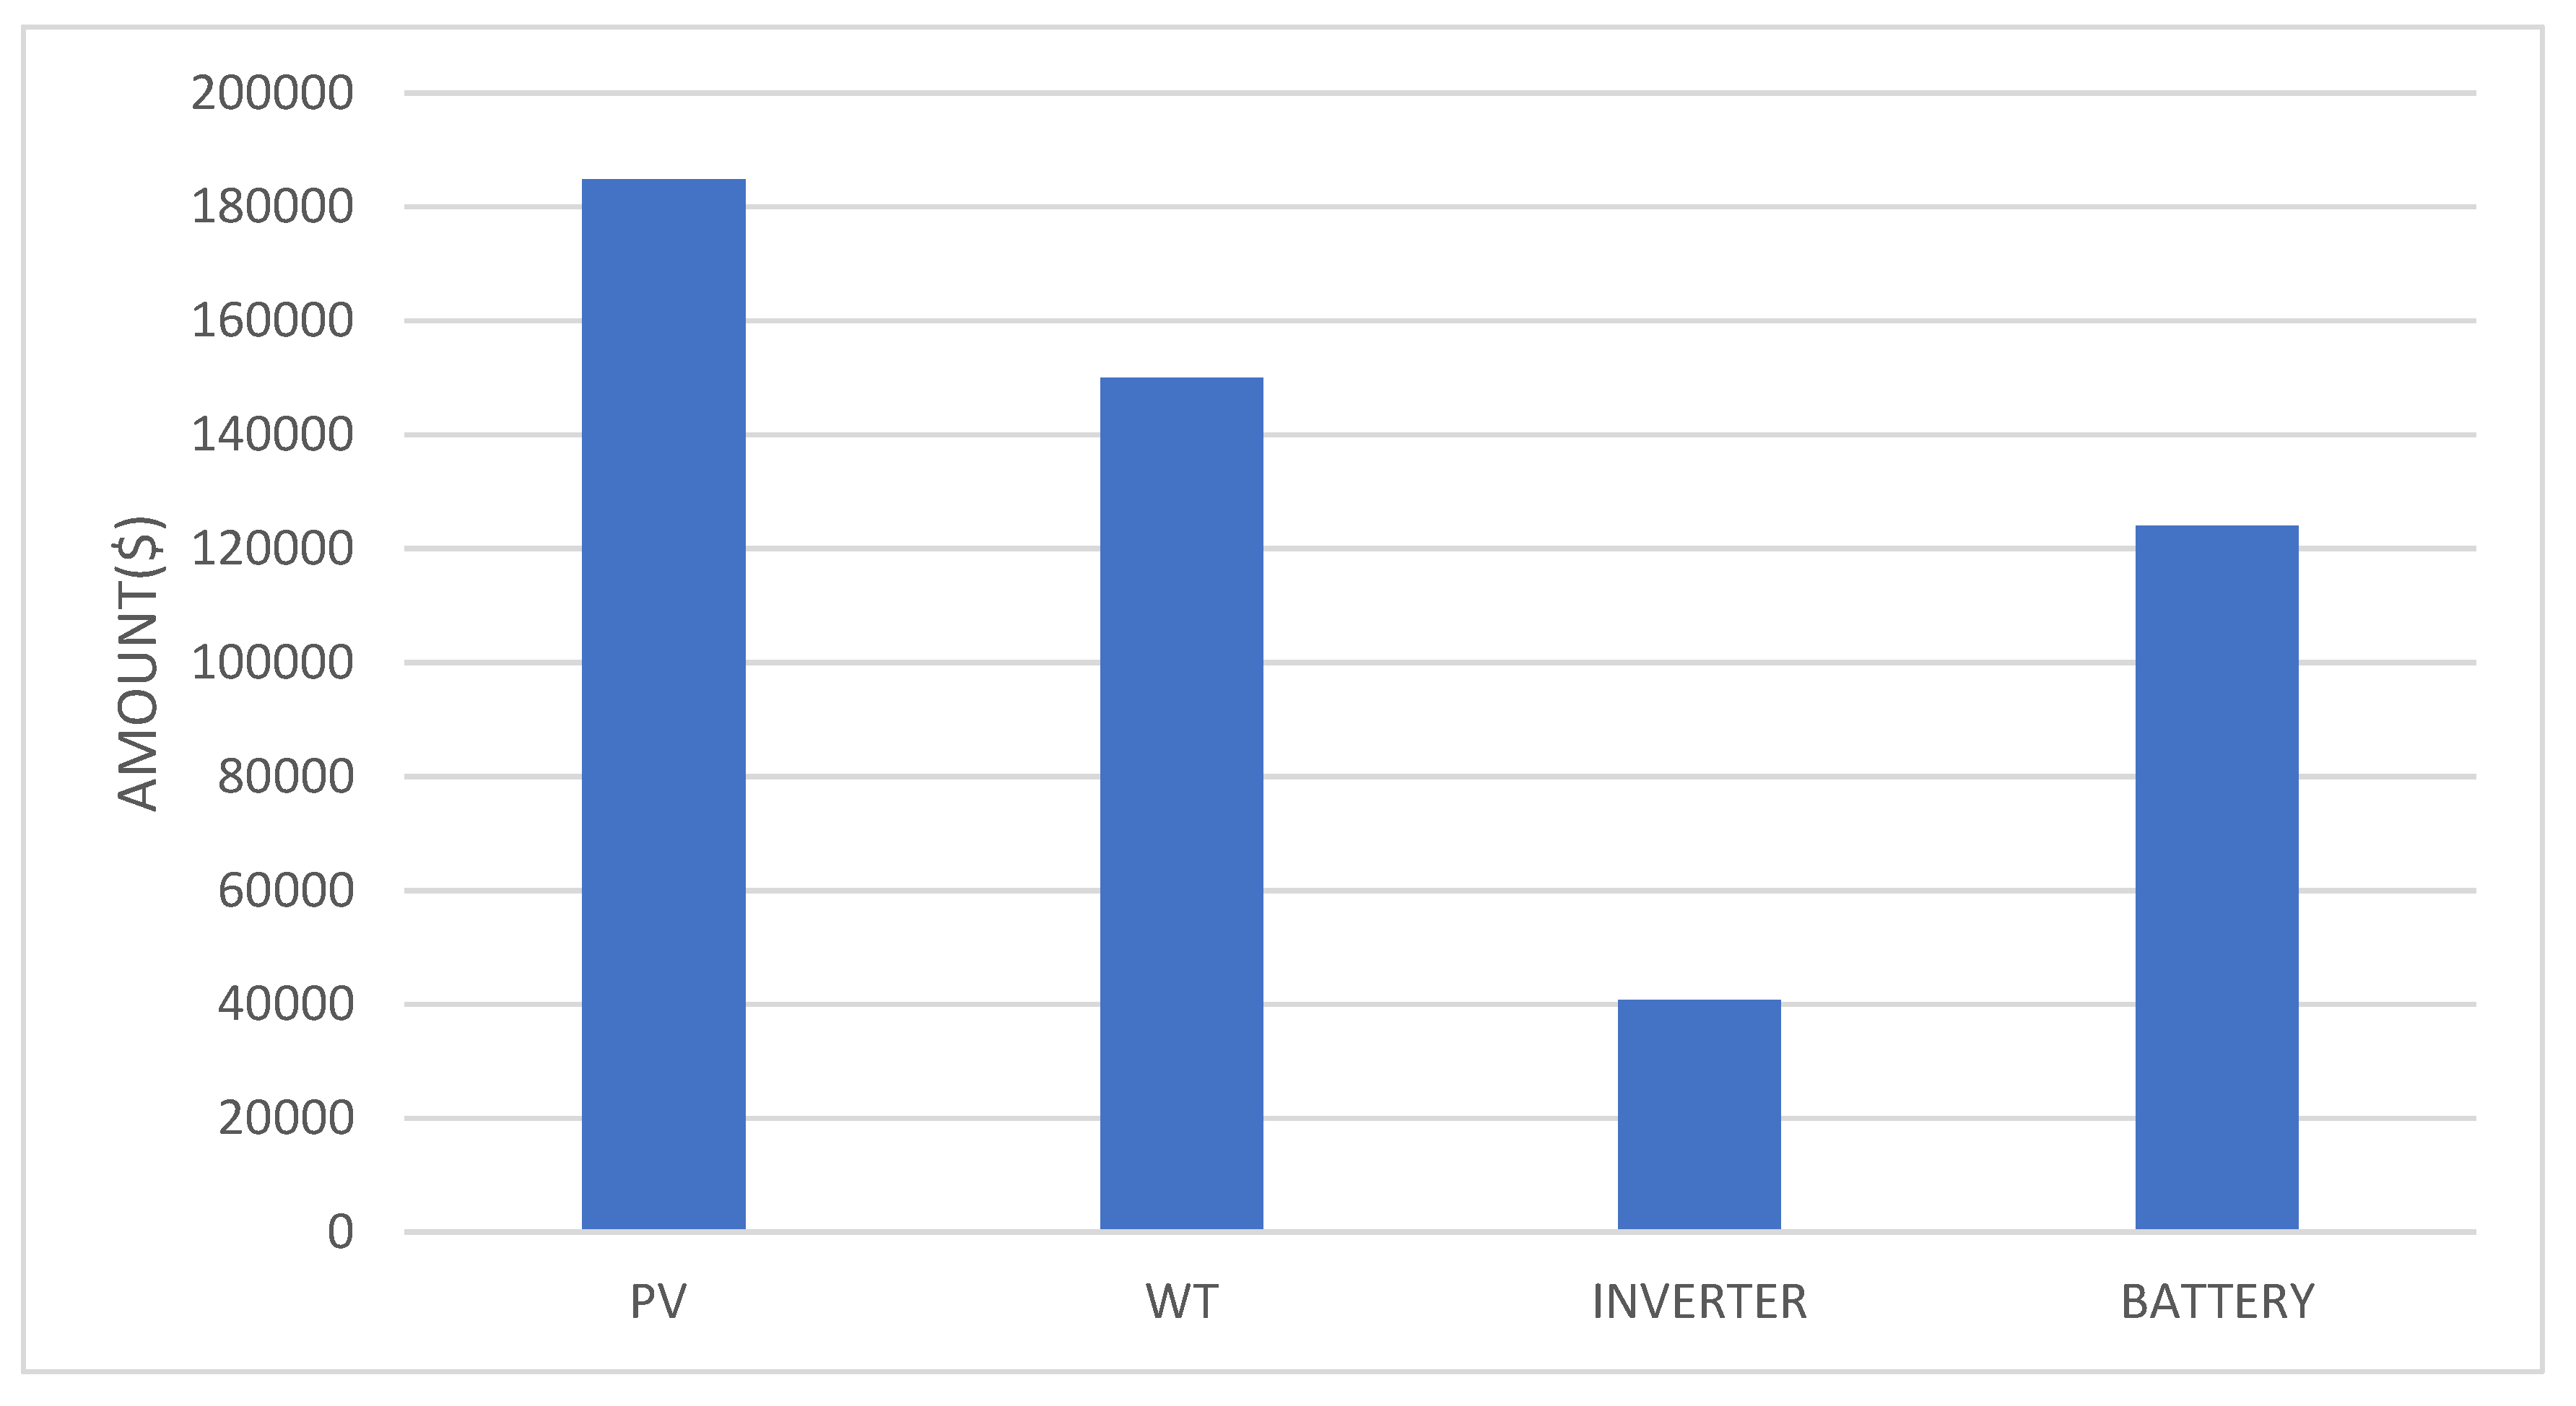
The optimal configuration is composed of 154 PV modules, 3 wind turbines, 136 inverters and 31 batteries. Figure 6 shows the power generated from the optimal configuration. The annual electrical energy produced by the system was 42.17MWh of which 41.974MWh are solar PV, and 196.59kWh from wind turbine. The minimized total economic cost (TEC) and the total annual cost are 476, 731USD and 301, 947USD respectively. This results in a LCOE of 0.011USD/kWh. Other cost associated with the TEC was 174784USD. The total operation and maintenance cost, total replacement cost and total capital cost of the optimal system were found to be 219, 772 USD, 446, 300USD and 341, 630USD, respectively. Figure 7 shows the optimized fitness function and Figure 8 shows a breakdown of the capital cost. The PV and wind turbine represented 37% and 30% of the capital cost of the system respectively. The number of wind turbine was limited to a maximum of three (3) in the algorithm as a result of its high cost. Therefore, solar PV and wind turbines are the critical components in the stand-alone HRES for the region. The battery bank’s cost makes up 25% of the total capital cost, while the inverter cost accounts for about 8%.

3.2. Result from Hybrid GA – PSO

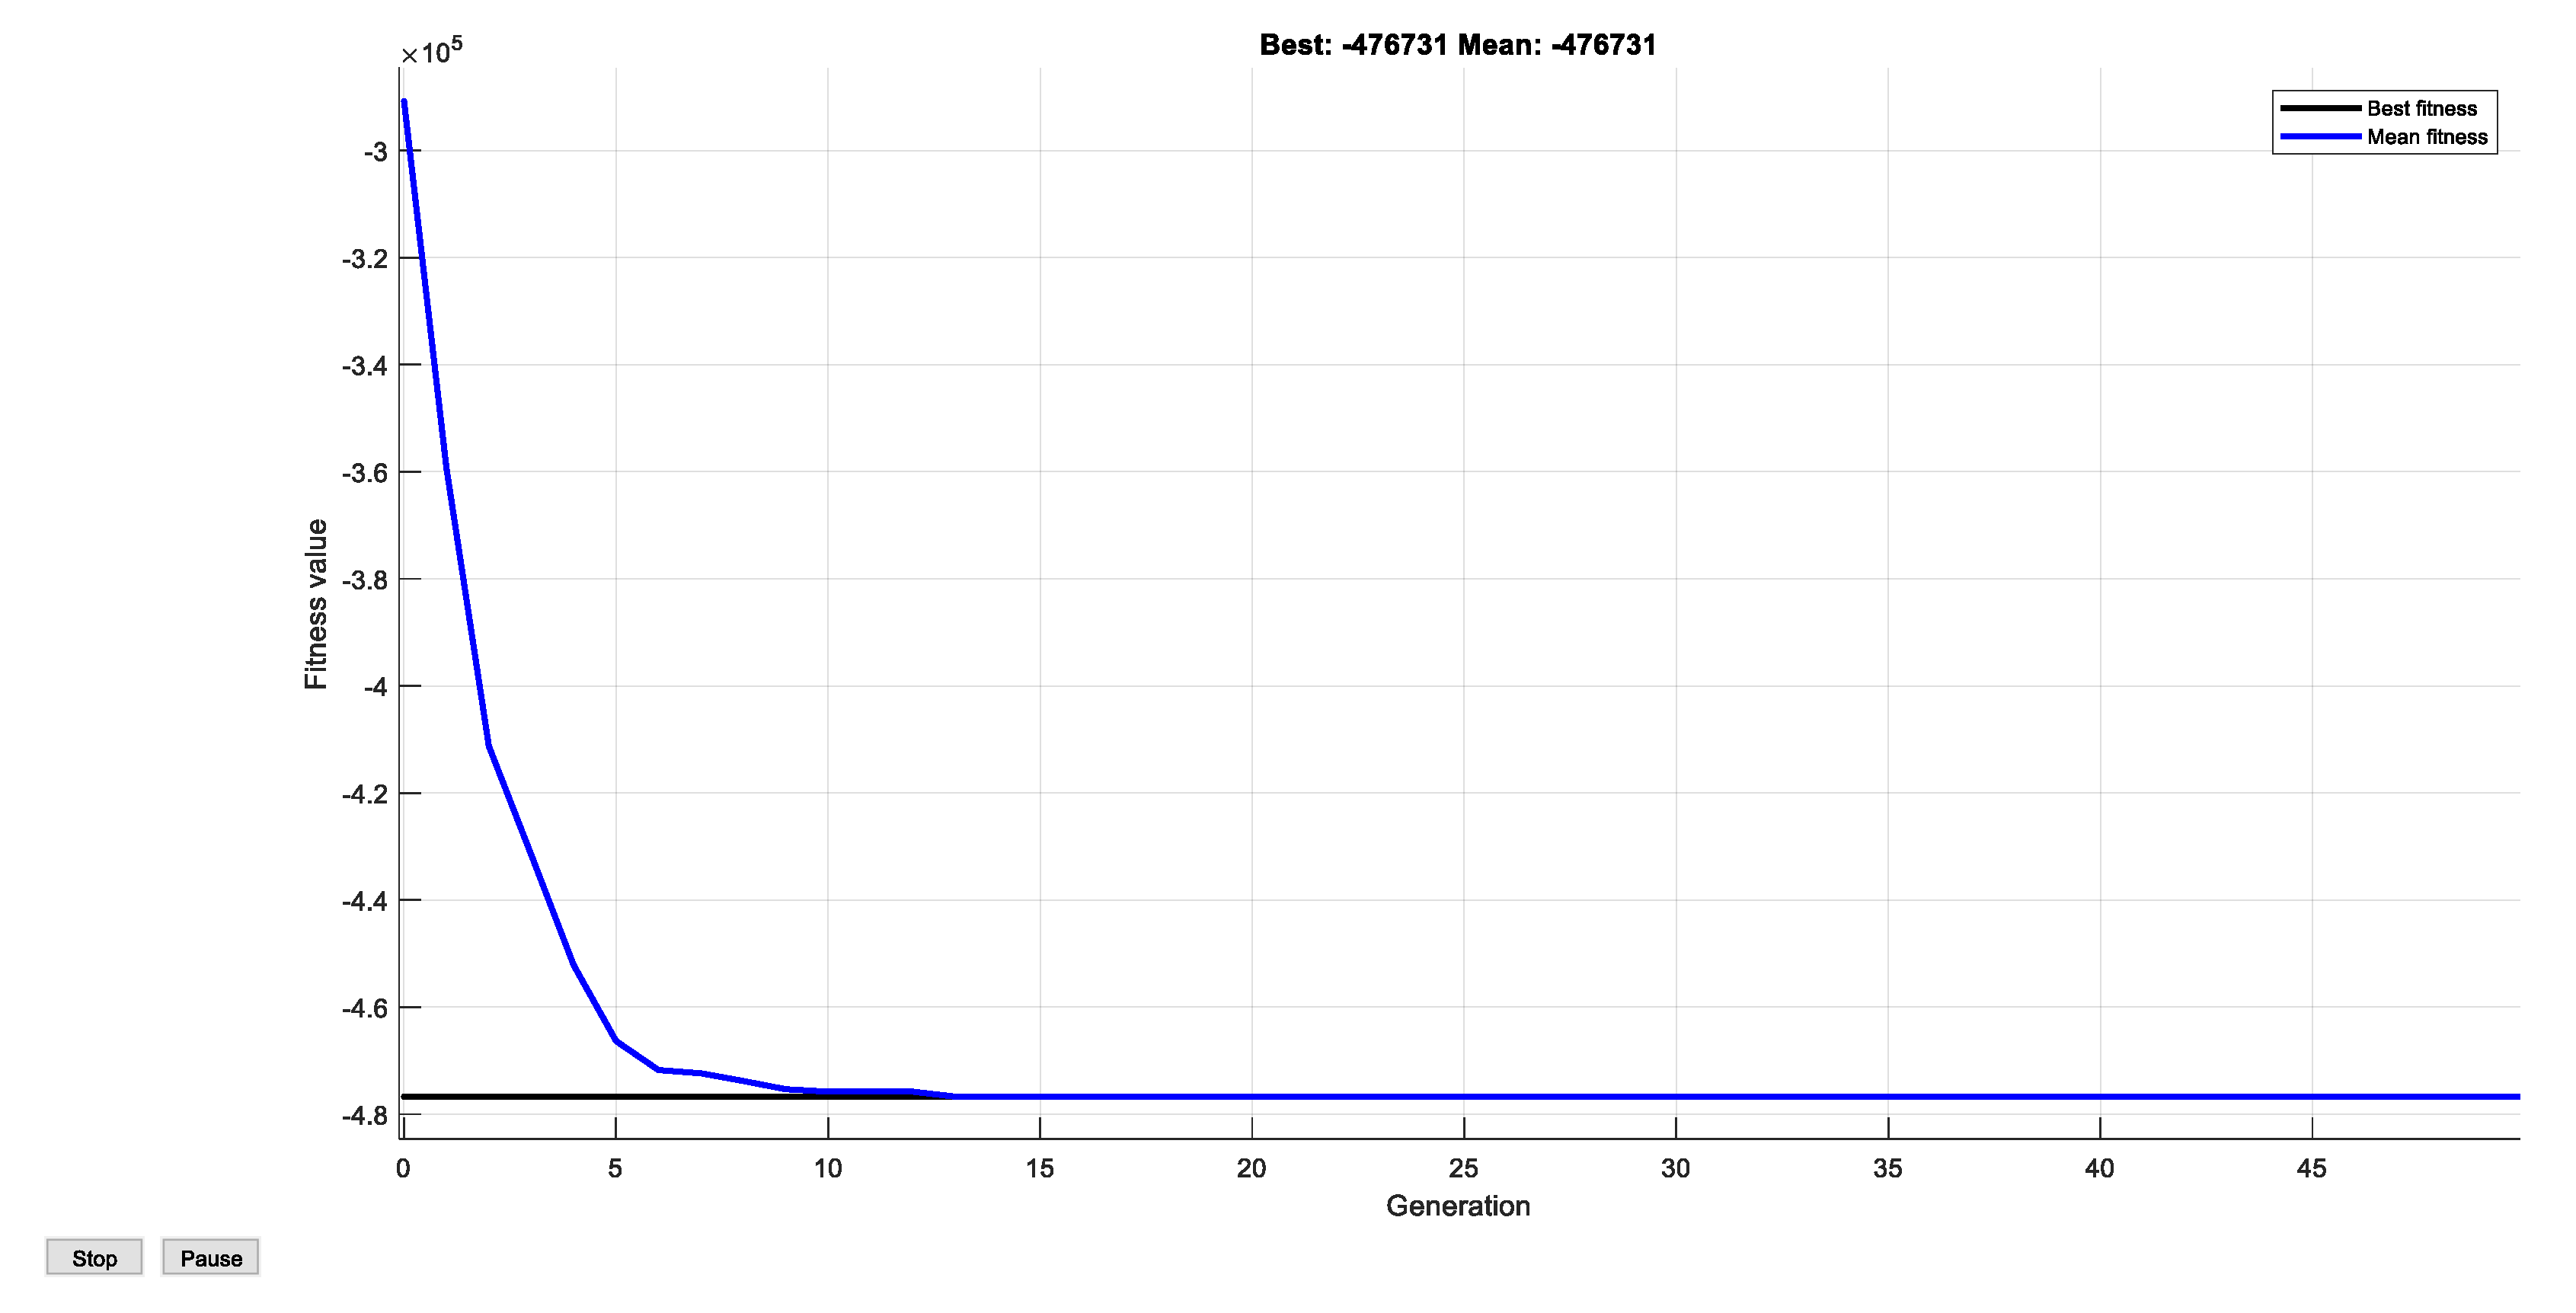
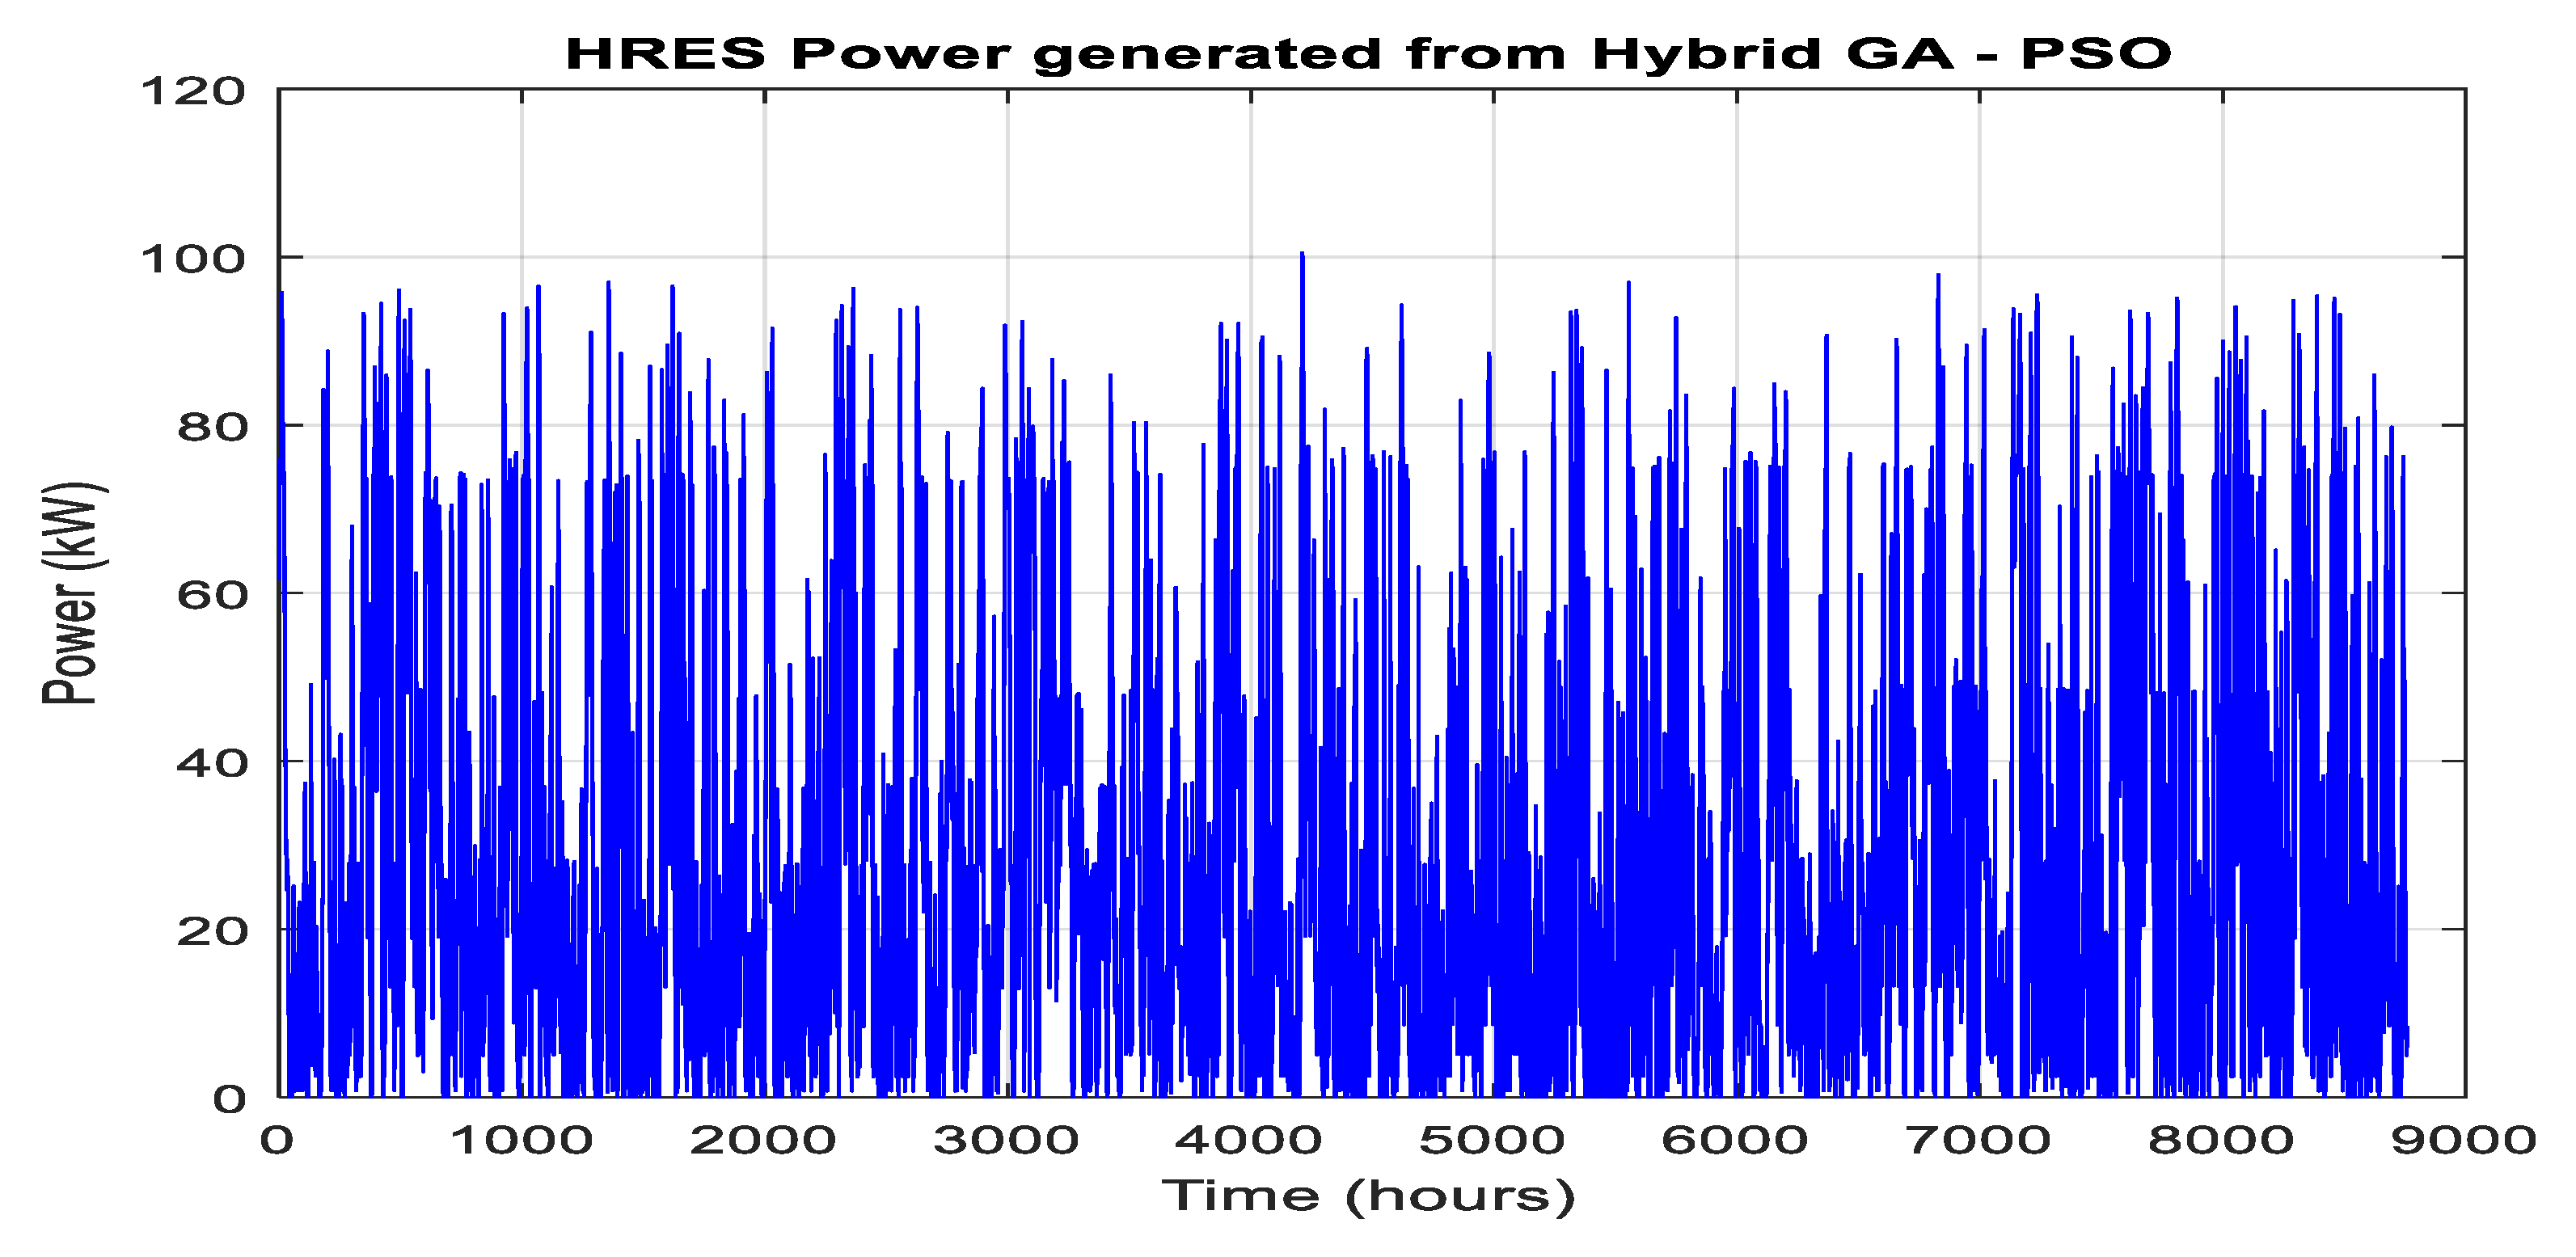
For the Particle Swarm Optimization (PSO) algorithm, a swarm size of 4 and a maximum of 50 iterations was used. The best solution from PSO is used as the initial population for the GA. The Genetic Algorithm uses a population size of 20 and a maximum of 50 generations. After running the simulation, result as shown in Figure 9 indicates that after the 5th generation, the TAC value plateaus, indicating that further generations did not significantly improve the solution, and the optimal number of solar panels, wind turbines, inverters, and batteries that minimizes the TAC was found early. The final solution is the same as result obtained from the PSO algorithm. This result validates the results obtained from the PSO. The power generated is shown in Figure 10.

3.3. Result from NGSA- II

The multiobjective GAII uses a population size of 4 and a maximum of 150 generations. The simulation result indicates that 151, 3, 122 and 31 is an optimal size representing the number of solar panels, wind turbines, inverters and batteries respectively. The TEC, TAC and LCOE are 469,200USD, 297, 100 USD and 0.007USD/kWh respectively. The result is shown in Figure 11. The annual electricity produced by the system was 41.79MWh. This implies this configuration has a deficit power of 0.38MWh in comparison with result obtained from the PSO and GA-PSO. In terms of the TEC, TAC and LCOE, there is a corresponding reduction of 7531USD, 4847USD and 0.004USD/kWh respectively in the multiobjective GA result when compared with the other two algorithms.

3.4. Result from HOMER

Homer utilizes two distinct optimization algorithms. The first, a grid search algorithm, performs simulations of all potential system configurations as determined by the search space. The more recent optimizer in Homer uses a unique algorithm that doesn’t require derivatives to pinpoint the most cost-effective system. Homer then gives a configuration list sorted by their net present cost (NPC) which is also referred to as the life-cycle cost.
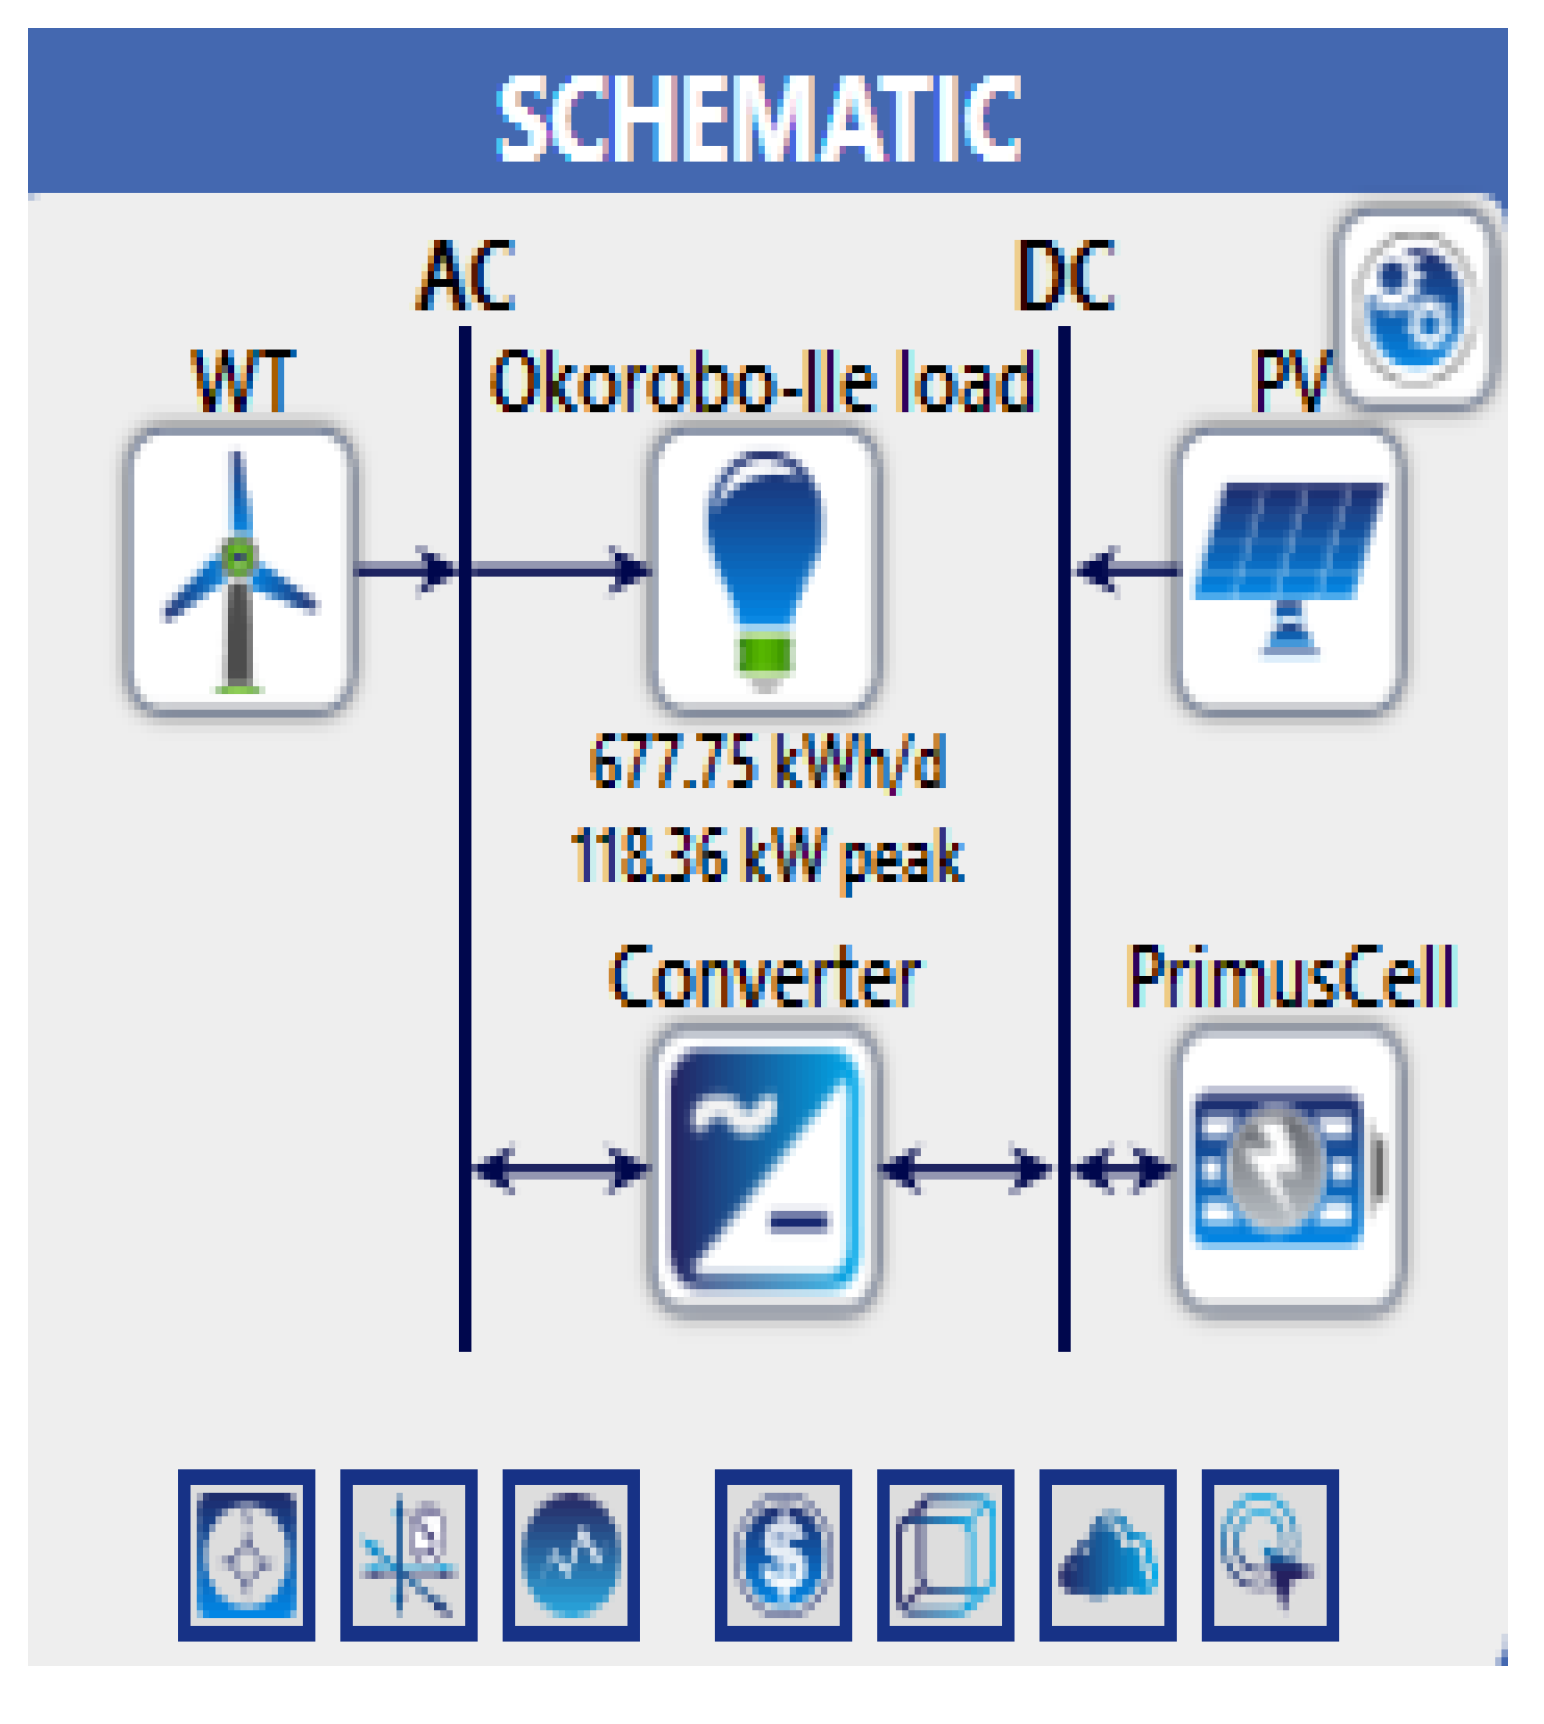
Figure 12 shows the homer model for optimization. The winning solution consists of 166kW PV panels (Generic flat plate PV), 3 wind turbines (Eocycle EO25 Class III), 29 batteries (20kW-72kWh Primus Power Energy Cell) and 123kW converter.
A summary of the optimal sizes is presented in Table 2. The table shows that each algorithm provides slightly different solutions, balancing costs and energy production differently. Particle Swarm Optimization (PSO) and the hybrid GA - PSO yield similar optimal configurations, while Non-dominated Sorting Genetic Algorithm II (NGSA-II) suggests slightly different component sizes. HOMER software recommends a larger PV panel capacity. Cost-wise, NGSA-II achieves the lowest total cost, while HOMER’s solution is costlier but provides higher energy capacity. Balancing costs and performance is crucial in designing an efficient HRES. The trade-offs are:
Cost Considerations: Lower costs are desirable, as they lead to better financial feasibility and quicker return on investment. However, excessively minimizing costs may compromise system reliability, energy production, and overall effectiveness.
Performance Considerations: High energy production and reliability are essential for meeting demand and achieving sustainability goals. Overemphasizing performance might lead to an expensive system that isn’t financially viable.
Given the available options, NGSA-II provides a good balance between cost and performance, with a competitive LCOE and reasonable total cost. HOMER’s solution has high performance but comes at a significantly higher cost. The solution from the NGSA-II configuration is chosen due to its cost-effectiveness while maintaining satisfactory performance.

3.4. Performance Evaluation of Solution under Various Ambient Conditions

This section presents the performance analysis of the energy balancing and load management. Three weather conditions are used to appraise the analysis – average, poor and good weather conditions. Analysis was carried out on four specific hours of the day – 06:00hours (typical time when most residents start the day), 12:00 hours (typical office hour), 18:00 hours (typical time when all residents are back home) and 21:00 hours (typical time for sleeping). The simulation uses a PV array of 151 solar panels, 3 wind turbines and an array of 31 batteries.
CASE 1: Average Weather Condition
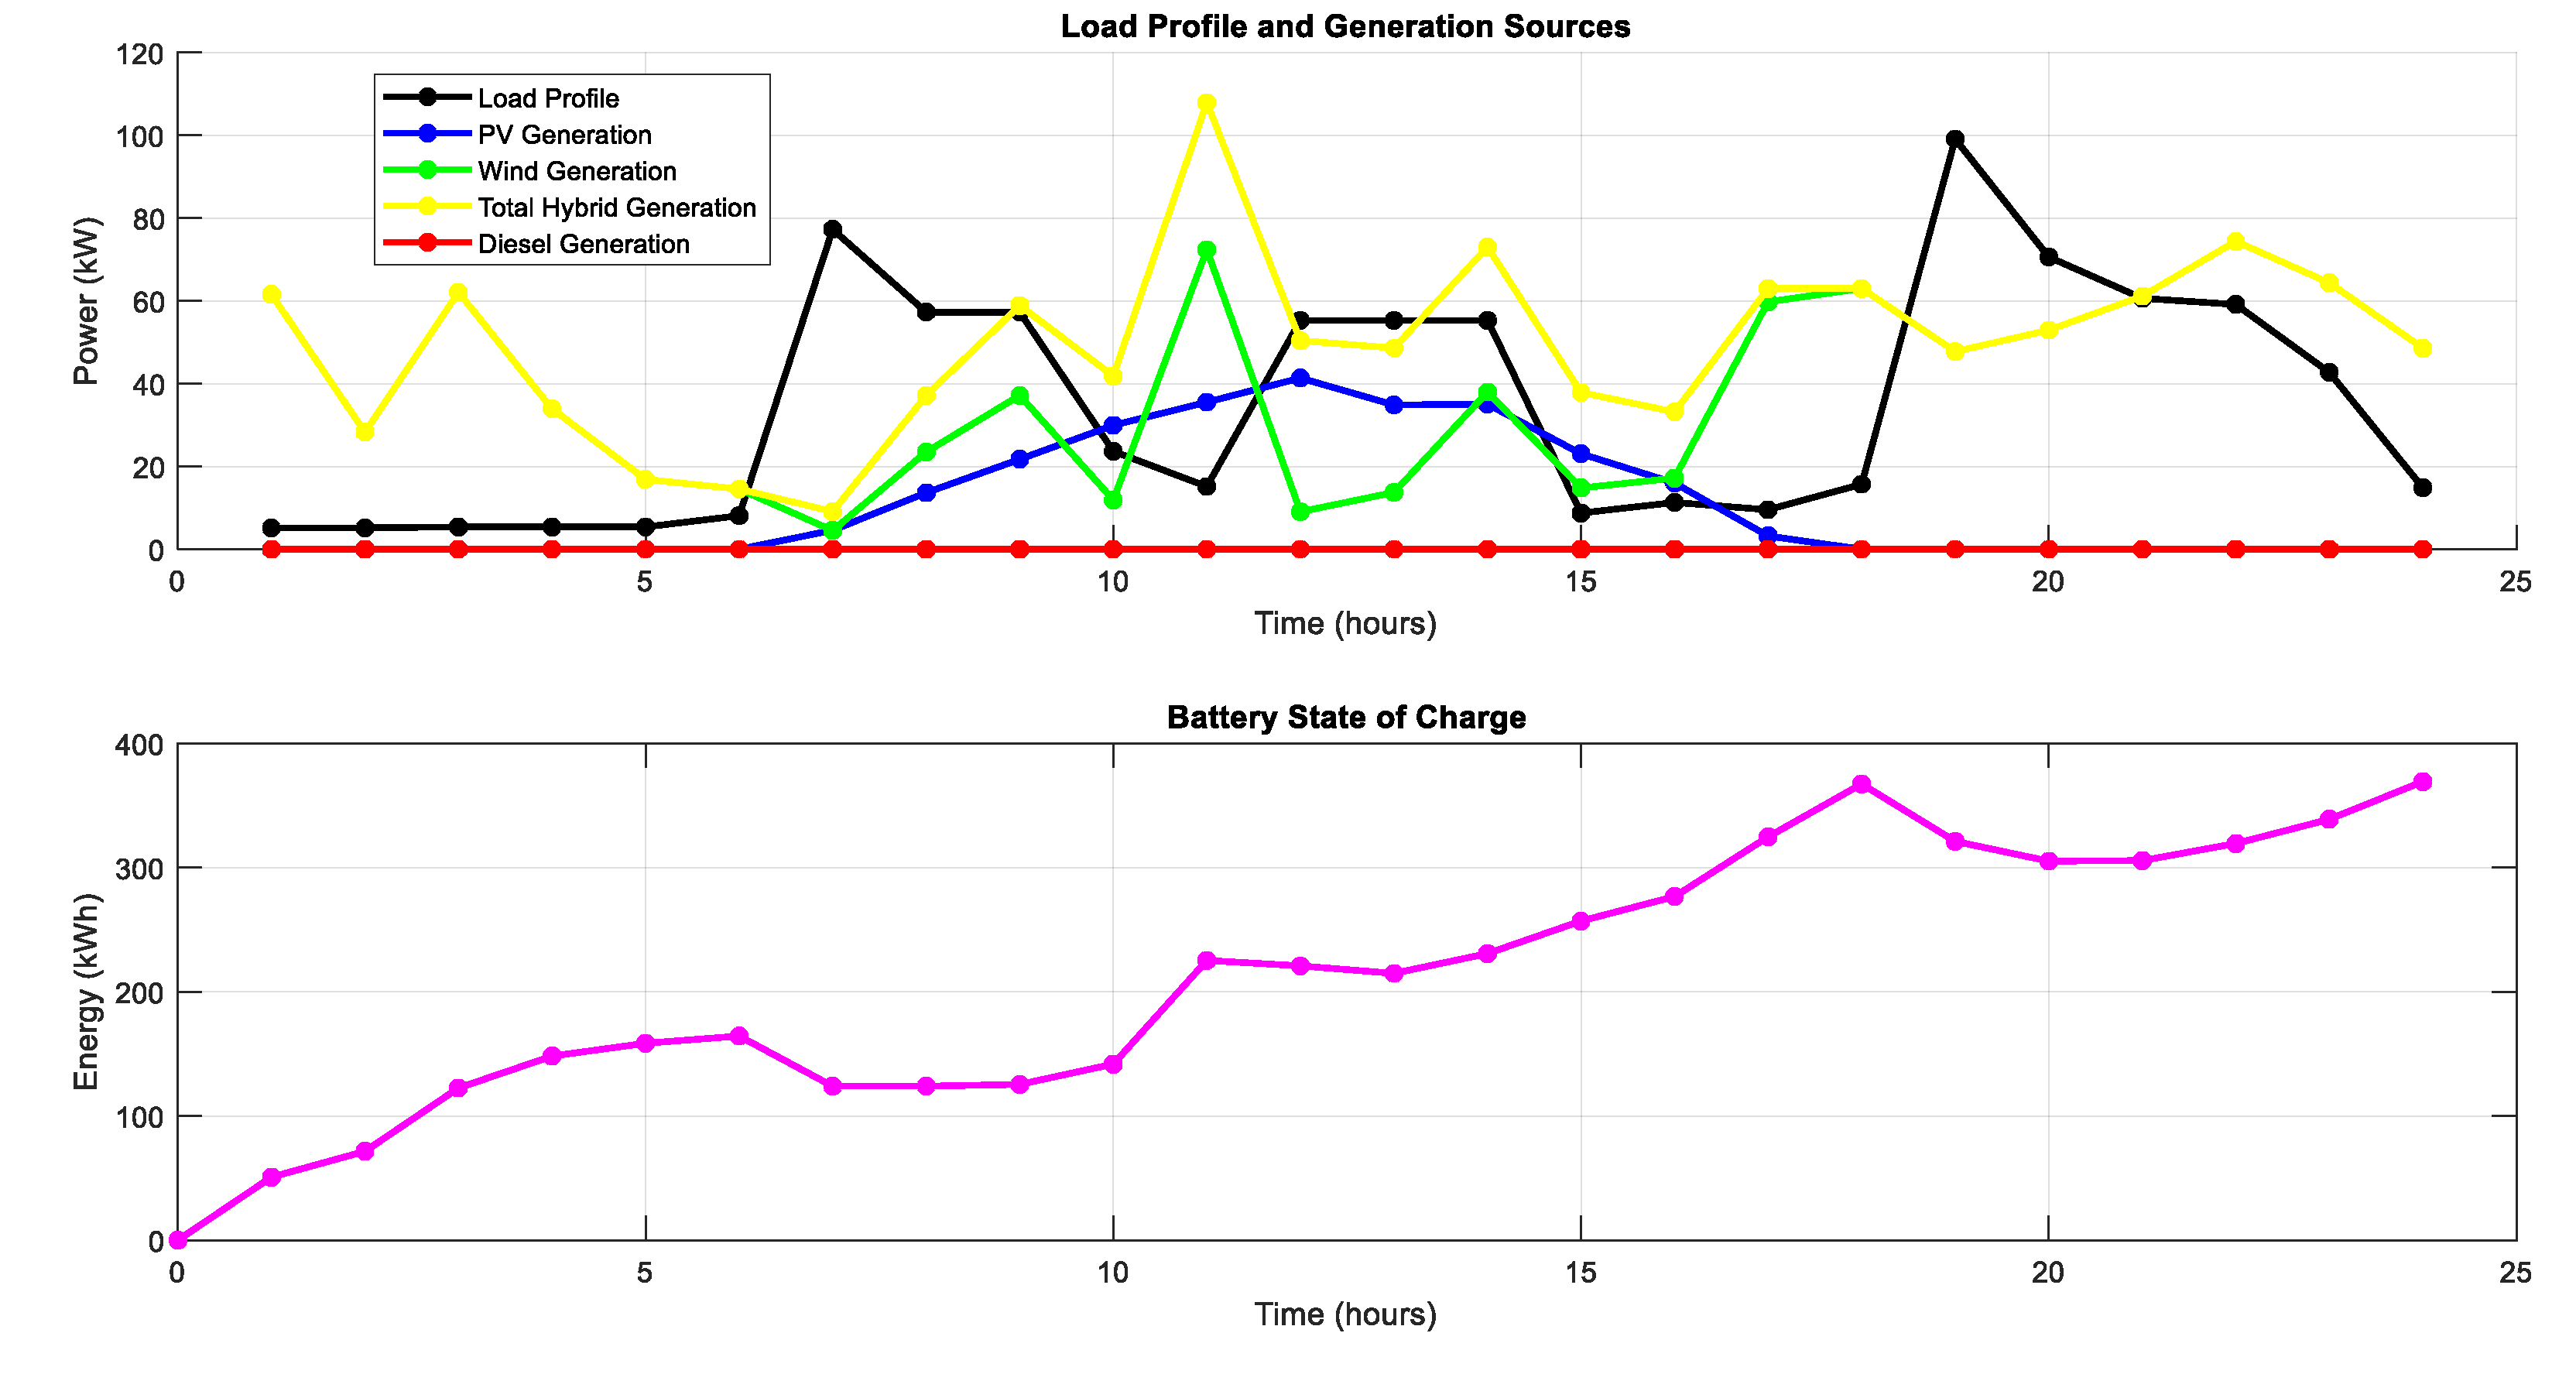
Figure 13 shows a plot of a typical average weather condition. From Figure 14, it is observed that:
At 6 hours: The load is 77.27 kW, and the battery’s state of charge is 124 kWh. The battery is discharging to meet the load demand as the PV and wind generation are insufficient.
At 12 hours: The load is 55.3 kW. Both PV and wind generation are inadequate to meet the load, so the battery, with a state of charge of 214.9 kWh, is discharging to cover the demand.
At 18 hours: The load is 99.1 kW. PV generation is 0 kW, wind generation is 47.77 kW, and the battery’s state of charge decreases from 367.4 kWh to 321.2 kWh as it discharges to meet the load.
At 21 hours: The load is 59.14 kW. PV generation remains at 0 kW, wind generation is 74.4 kW, and the battery’s state of charge increases from 305.7 kWh to 319.5 kWh, indicating that the wind generation is sufficient to meet the load without discharging the battery.
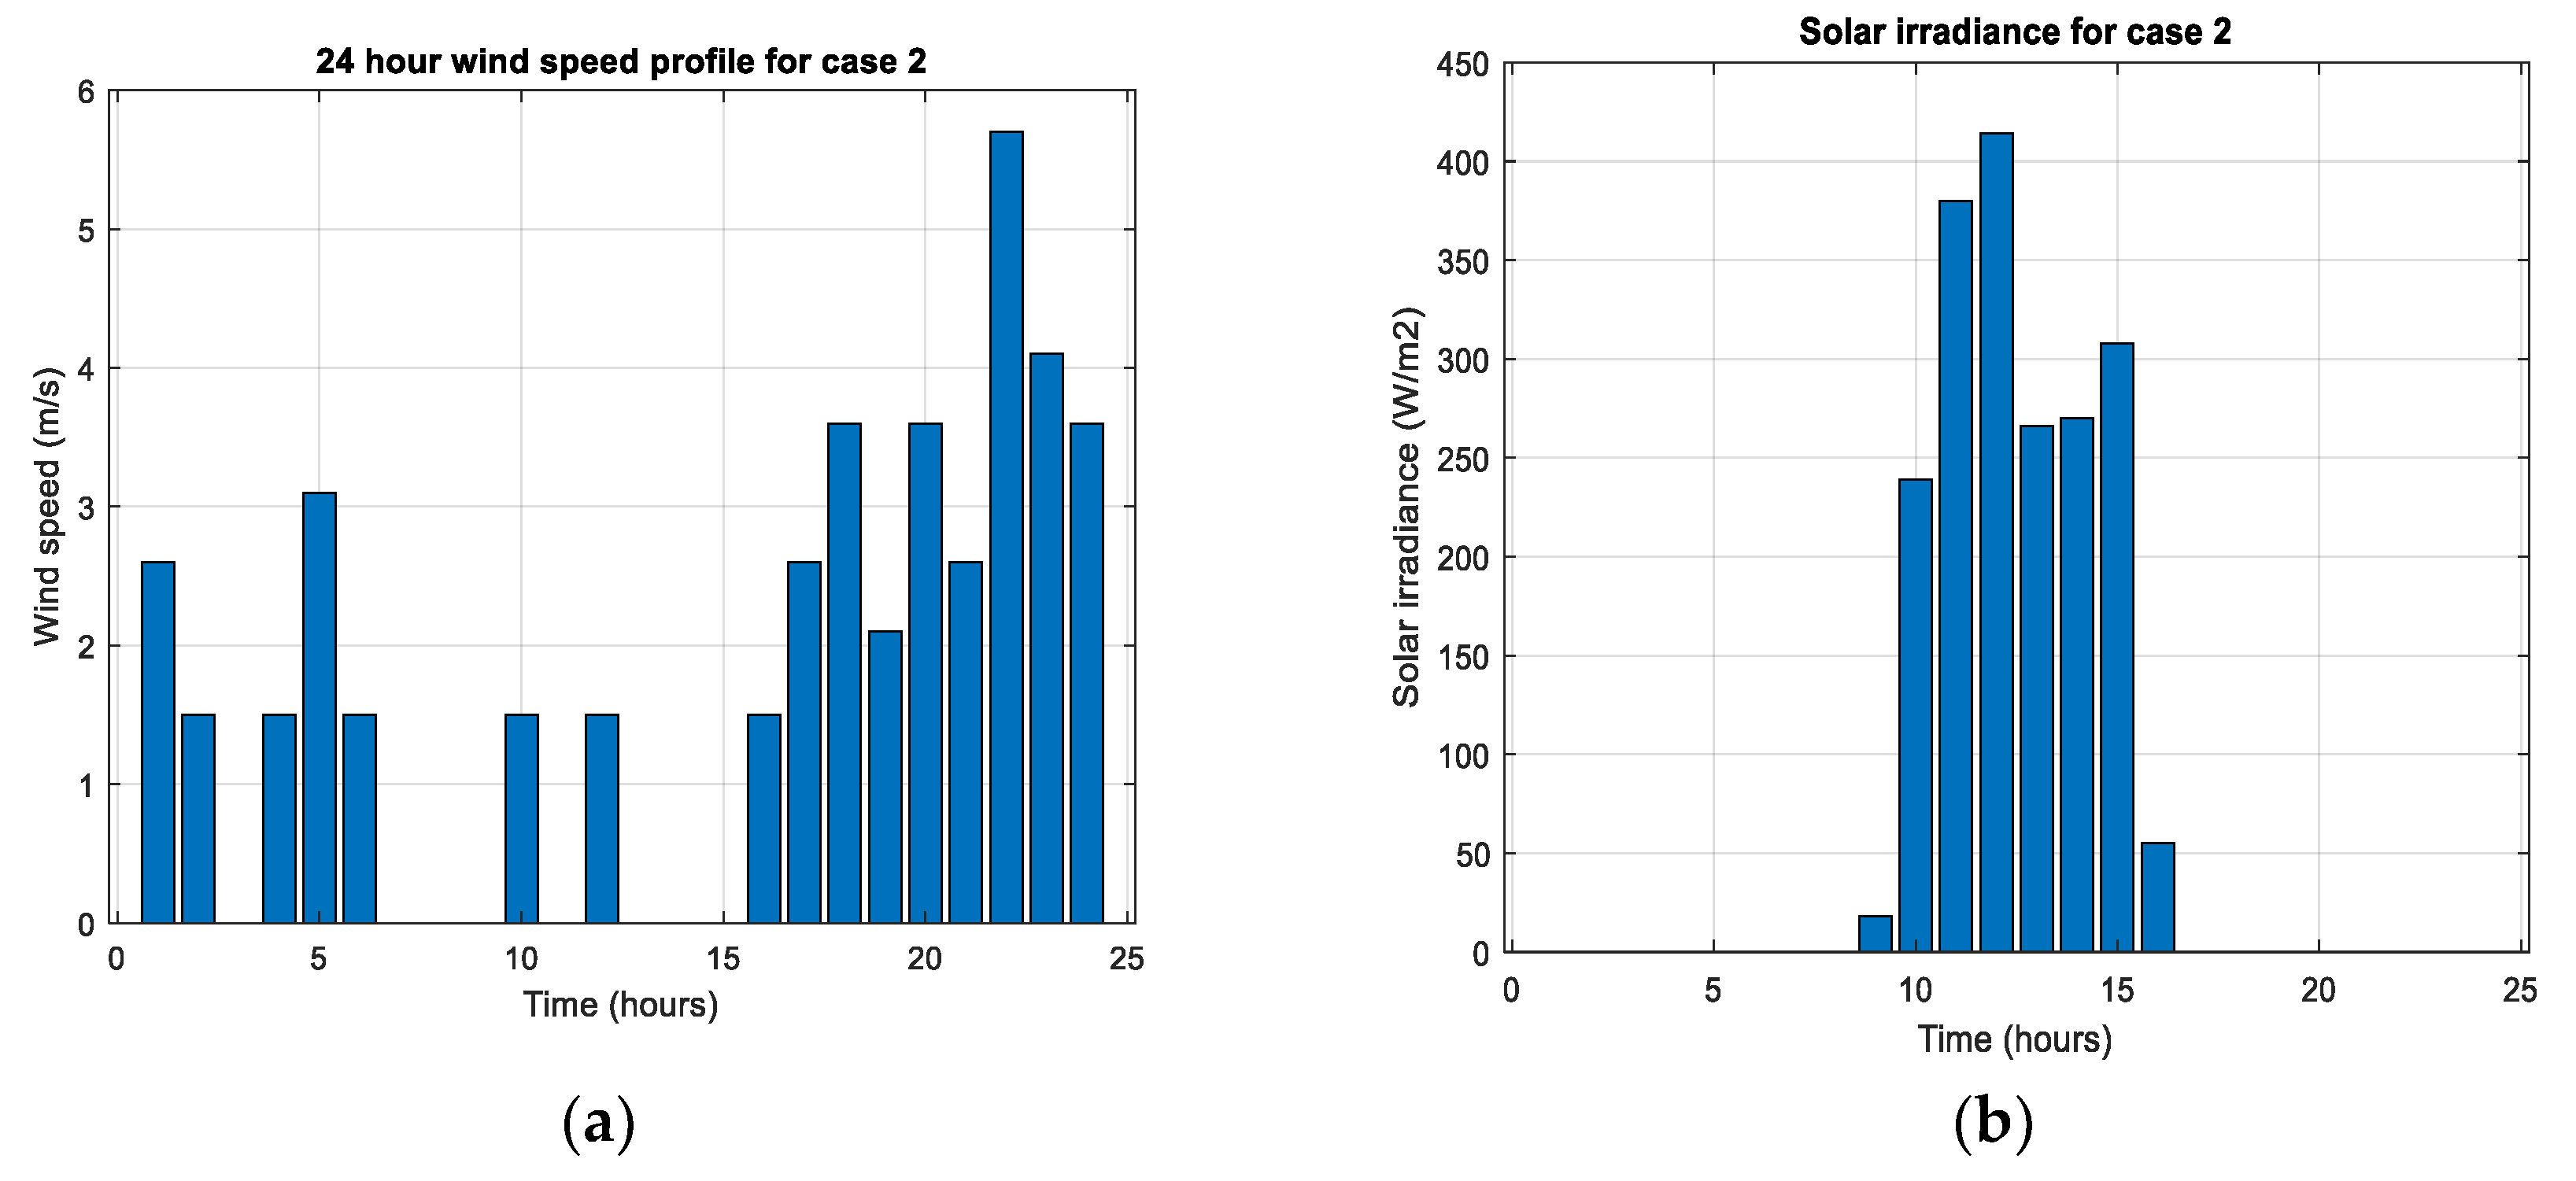
CASE 2: Poor Weather Condition
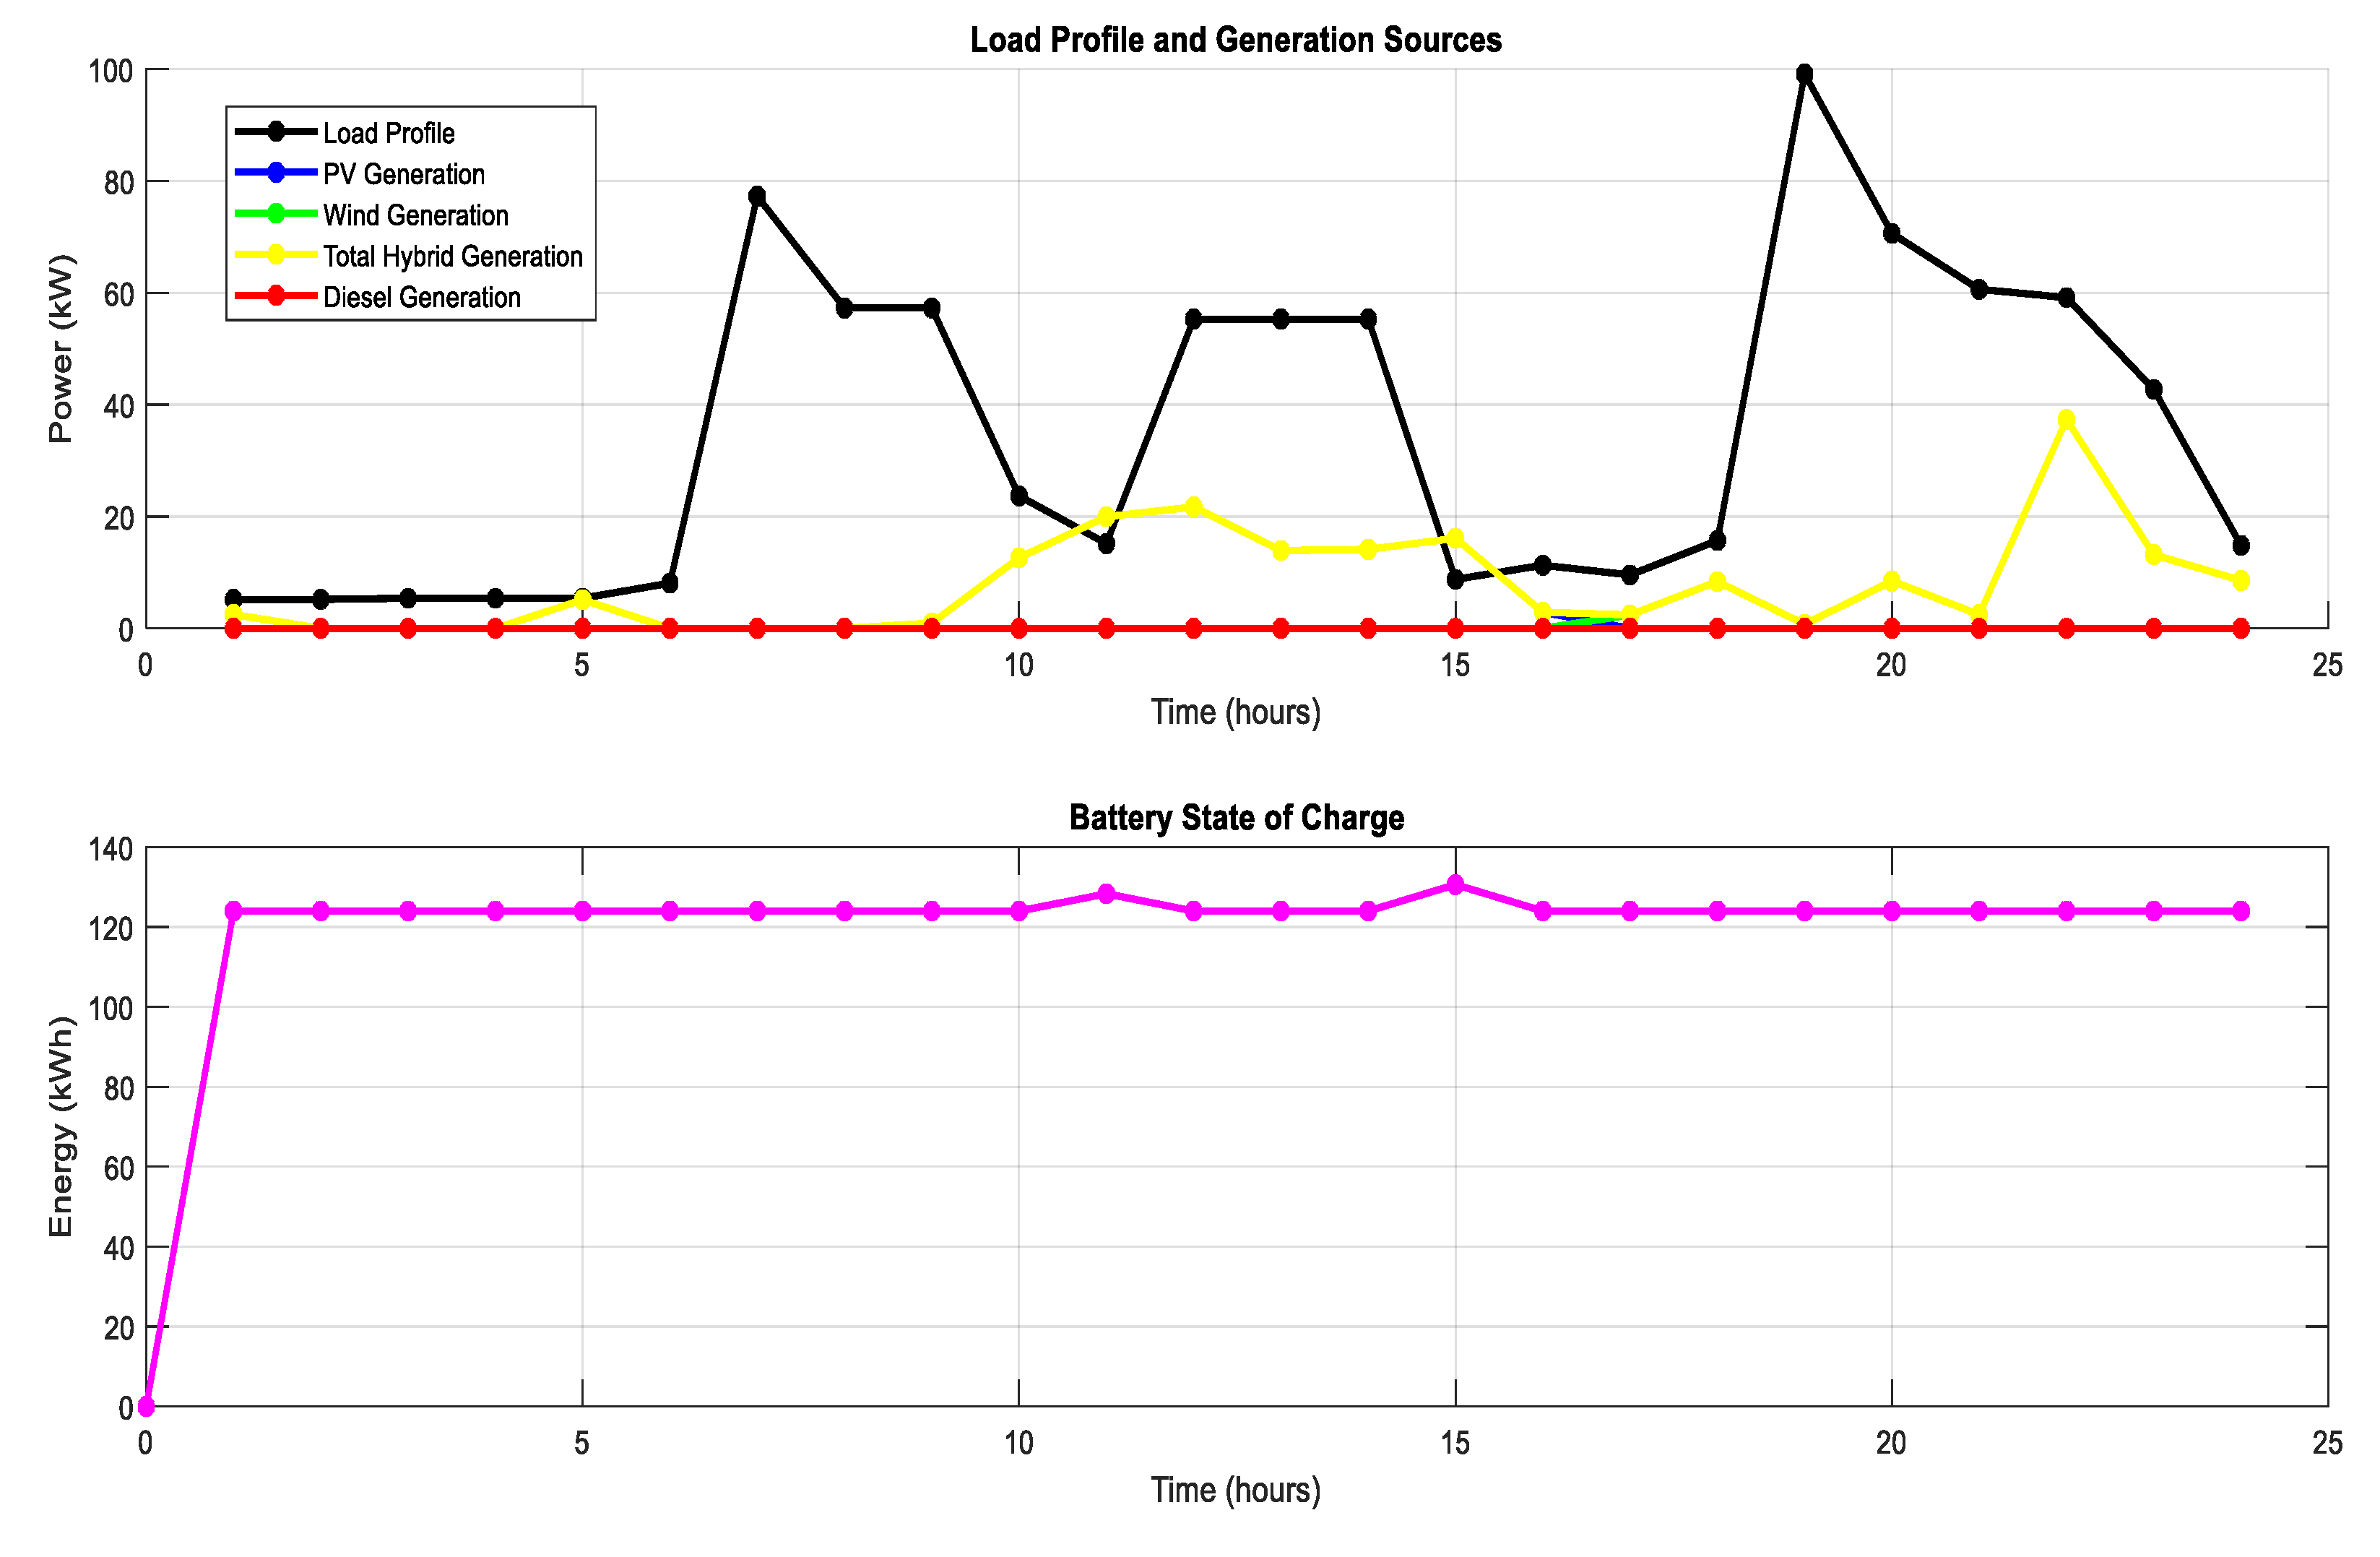
Figure 15 shows a plot of a typical poor weather condition. From Figure 16, it was observed that:
At 6 hours: The PV and wind generation are minimal, with the battery’s state of charge at 124 kWh, indicating a high discharge rate during this period.
At 12 hours: The load demand exceeds the PV and wind generation, and the battery’s state of charge remains at 124 kWh, showing that the battery is discharging to meet the load.
At 18 and 21 hours: The battery’s state of charge stays at 124 kWh, suggesting it continues to discharge to meet the load demand.
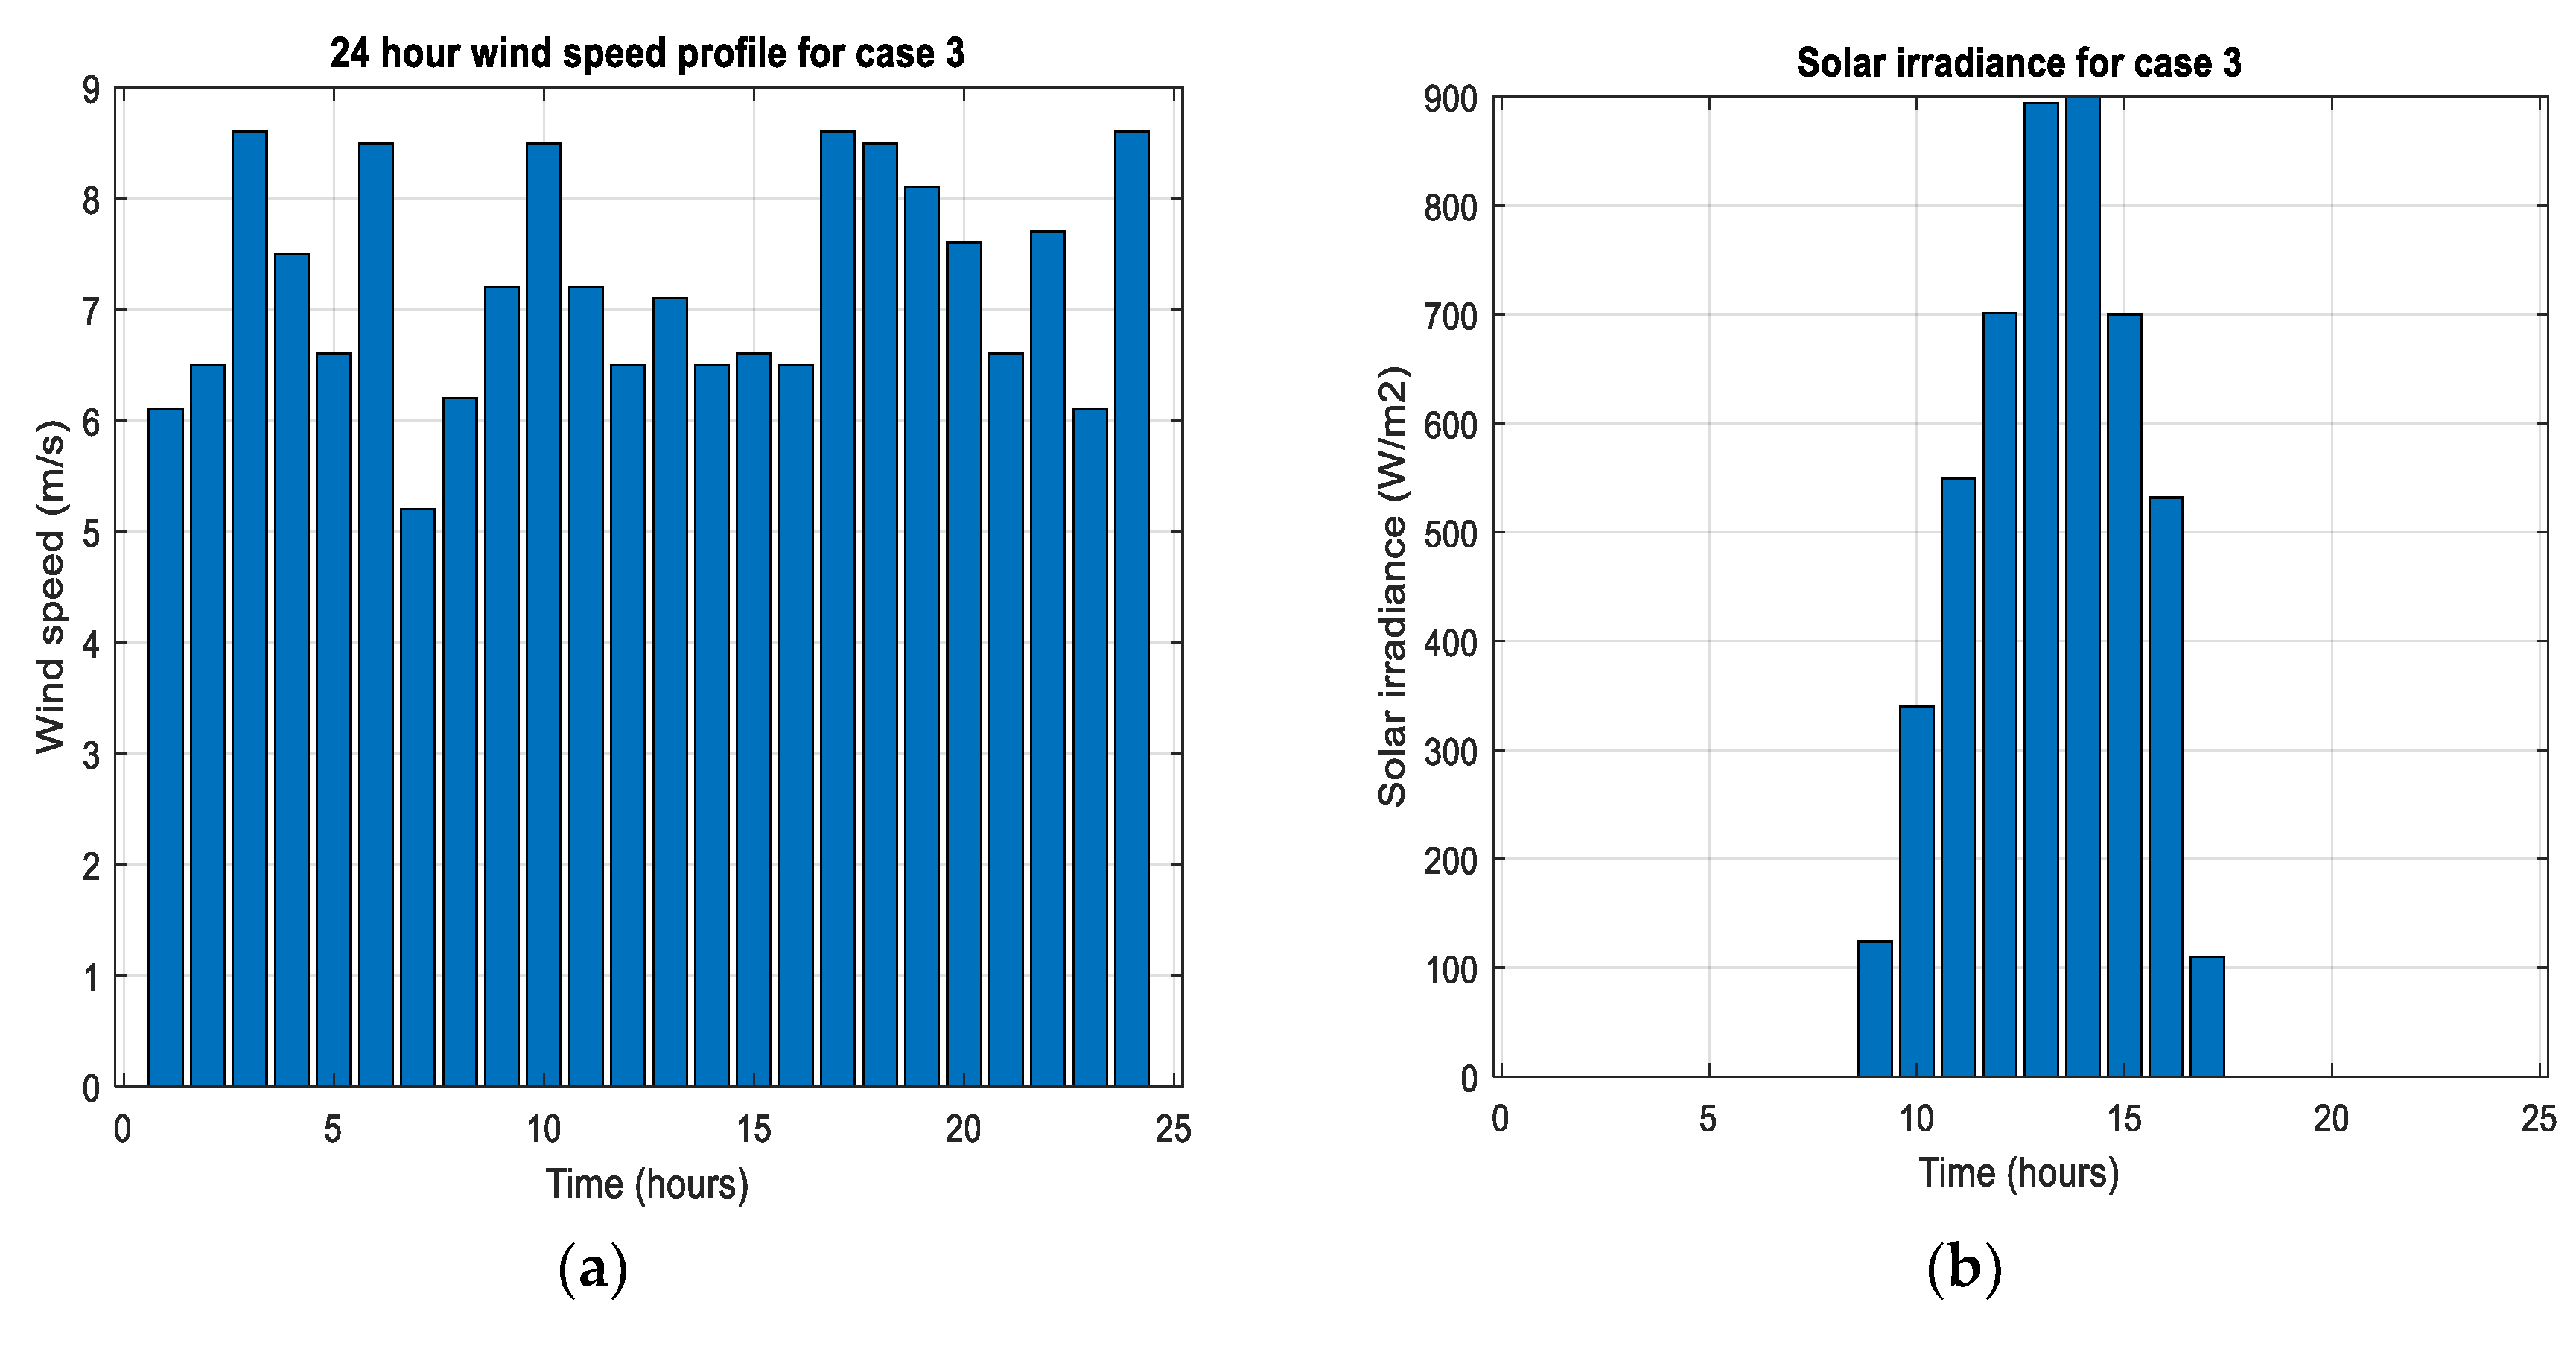
CASE 3: Ideal Weather Condition
Figure 17 shows a plot of a typical good weather condition. From Figure 18, it was observed that:
At 6 hours: The PV and wind generation is 28.64 kW, which is insufficient to meet the load demand of 77.1 kW. The battery’s state of charge decreases from 319.1 kWh to 275.3 kWh, indicating that the battery is discharging to meet the load.
At 12 hours: There is excess generation from the hybrid renewable energy system (HRES), causing the battery’s state of charge to increase from 458.8 kWh to 514.8 kWh as it continues to charge.
At 18 hours: The PV and wind generation cannot meet the load demand, and the battery’s state of charge drops slightly from 620 kWh to 596.9 kWh, indicating it is discharging to meet the load.
At 21 hours: The wind generation is sufficient to meet the load demand, and the battery’s state of charge rises from 597.7 kWh to 611.5 kWh, showing that the battery is not discharging as the load is being met by the wind generation.
Analyzing the battery’s state of charge across three different weather scenarios reveals the following insights:
  • Case 1: The battery’s state of charge varies between 124 kWh and 367.4 kWh, demonstrating that the system can handle the load demand under typical weather conditions.
  • Case 2: The battery’s state of charge remains mostly stable at 124 kWh, indicating a high discharge rate due to insufficient PV and wind generation. This suggests that the HRES struggles to meet the load demand during poor weather, heavily relying on the battery.
  • Case 3: The battery’s state of charge ranges from 257.3 kWh to 620 kWh. It discharges when the PV and wind generation fall short of the load demand but stays fully charged when there is surplus generation from the HRES. This shows that the system effectively manages the load demand under favorable weather conditions, with the battery providing necessary backup.
Overall, this indicates that the energy management system efficiently monitors and regulates the battery’s state of charge under varying weather conditions.

4. Conclusions

In this paper, a two-step methodology was used to optimize and analyze a solar – wind – battery hybrid energy system to meet the power demand of Okorobo-Ile town in Rivers State, Nigeria using PSO/hybrid GA-PSO/NGSA-II. The optimization results clearly showed that the optimized system which consists of 151kW PV facility, 3 no. 25kW wind turbines, 122 no. 1kW inverter and 31 no. 20kWh battery is adequate to meet the energy demand of the community. The performance of the hybrid renewable energy system varied significantly under different weather conditions. In good weather conditions, both PV and wind generation can meet the power demand for most of the day, and the excess power is stored in the battery. In poor weather conditions, the battery has to discharge more frequently to meet the power demand. This analysis highlights the importance of weather conditions in the performance of hybrid renewable energy systems. It also underscores the need for efficient energy storage systems to ensure a reliable power supply under varying weather conditions.

Author Contributions

Conceptualization, K.N.U.; methodology, K.N.U.; software, K.N.U.; validation, O.P.I.; formal analysis, K.N.U.; investigation, K.N.U; resources, K.N.U.; data curation, K.N.U.; writing—original draft preparation, K.N.U.; writing—review and editing, K.N.U., O.O.I., A.U.B., and D.I.E.; visualization, K.N.U., O.O.I., A.U.B., and D.I.E. All authors have read and agreed to the published version of the manuscript.

Data Availability Statement

Data is available on request.

Conflicts of Interest

The authors declare no conflict of interest.

References

  1. Nigeria Electricity Production. Accessed March 14, 2024. https://www.ceicdata.com/en/indicator/nigeria/electricity-production.
  2. Agajie, T.F.; Fopah-Lele, A.; Amoussou, I.; Ali, A.; Khan, B.; Tanyi, E. Optimal Design and Mathematical Modeling of Hybrid Solar PV–Biogas Generator with Energy Storage Power Generation System in Multi-Objective Function Cases. Sustainability 2023, 15, 8264. [Google Scholar] [CrossRef]
  3. Adewuyi, O.B.; Shigenobu, R.; Senjyu, T.; Lotfy, M.; Howlader, A.M. Multiobjective mix generation planning considering utility-scale solar PV system and voltage stability: Nigerian case study. Electr. Power Syst. Res. 2019, 168, 269–282. [Google Scholar] [CrossRef]
  4. Al-Masri, H.M.; Al-Sharqi, A.A. Technical design and optimal energy management of a hybrid photovoltaic biogas energy system using multi-objective grey wolf optimisation. IET Renew. Power Gener. 2020, 14, 2765–2778. [Google Scholar] [CrossRef]
  5. Xu, L.; Ruan, X.; Mao, C.; Zhang, B.; Luo, Y. An improved optimal sizing method for wind-solar-battery hybrid power system. IEEE Trans. Sustain. Energy 2013, 4, 774–785. [Google Scholar]
  6. Al-Masri, H.M.K.; Magableh, S.; Abuelrub, A.; Saadeh, O.; Ehsani, M. Impact of Different Photovoltaic Models on the Design of a Combined Solar Array and Pumped Hydro Storage System. Appl. Sci. 2020, 10, 3650. [Google Scholar] [CrossRef]
  7. Nguyen, H.T.; Safder, U.; Nguyen, X.; Yoo, C. Multi-objective decision-making and optimal sizing of a hybrid renewable energy system to meet the dynamic energy demands of a wastewater treatment plant. Energy 2020, 191, 116570. [Google Scholar] [CrossRef]
  8. Tian, Z.; Seifi, A.A. Reliability Analysis of Hybrid Energy System. Int. J. Reliab. Qual. Saf. Eng. 2014, 21, 1450011. [Google Scholar] [CrossRef]
  9. Upadhyay, S.; Sharma, M.P. Development of hybrid energy system with cycle charging strategy using particle swarm optimization for a remote area in India. Renew. Energy 2015, 77, 586–598. [Google Scholar] [CrossRef]
  10. Ma, T.; Yang, H.; Lu, L.; Peng, J. Pumped storage-based standalone photovoltaic power generation system: Modeling and techno-economic optimization. Appl. Energy 2015, 137, 649–659. [Google Scholar] [CrossRef]
  11. Al-Masri, H.M.; Al-Sharqi, A.; Magableh, S.; Al-Shetwi, A.; Abdolrasol, M.; Ustun, T.S. Optimal Allocation of a Hybrid Photovoltaic Biogas Energy System Using Multi-Objective Feasibility Enhanced Particle Swarm Algorithm. Sustainability 2022, 14, 685. [Google Scholar] [CrossRef]
  12. Sultan, H.M.; Menesy, A.; Kamel, S.; Korashy, A.; Almohaimeed, S.; Abdel-Akher, M. An improved artificial ecosystem optimization algorithm for optimal configuration of a hybrid PV/WT/FC energy system. Alex. Eng. J. 2021, 60, 1001–1025. [Google Scholar] [CrossRef]
  13. Ukoima, K. N., Okoro, O. I. Obi, P. I., Akuru, U. B., Davidson, E. A modified multiobjective particle swarm optimization (m-mopso) for optimal sizing of a solar – wind – battery hybrid renewable energy system. Solar compass (2024). [CrossRef]
  14. Diab, A.A.Z.; Sultan, H.; Kuznetsov, O.N. Optimal sizing of hybrid solar/wind/hydroelectric pumped storage energy system in Egypt based on different meta-heuristic techniques. Environ. Sci. Pollut. Res. 2020, 27, 32318–32340. [Google Scholar] [CrossRef] [PubMed]
  15. Alotaibi, M.A.; Eltamaly, A.M. A Smart Strategy for Sizing of Hybrid Renewable Energy System to Supply Remote Loads in Saudi Arabia. Energies 2021, 14, 7069. [Google Scholar] [CrossRef]
  16. lturki, F.A.; Awwad, E.M. Sizing and cost minimization of standalone hybrid wt/pv/biomass/pump-hydro storage-based energy systems. Energies 2021, 14, 489. [Google Scholar] [CrossRef]
  17. Çetinbaş, İ.; Tamyürek, B.; Demirtaş, M. Sizing optimization and design of an autonomous AC microgrid for commercial loads using Harris Hawks Optimization algorithm. Energy Convers. Manag. 2021, 245, 114562. [Google Scholar] [CrossRef]
  18. Bukar, A.L.; Tan, C.; Lau, K.Y. Optimal sizing of an autonomous photovoltaic/wind/battery/diesel generator microgrid using grasshopper optimization algorithm. Sol. Energy 2019, 188, 685–696. [Google Scholar] [CrossRef]
  19. Diab, A.A.Z.; Sultan, H.; Mohamed, I.; Kuznetsov, O.; Do, T.D. Application of Different Optimization Algorithms for Optimal Sizing of PV/Wind/Diesel/Battery Storage Stand-Alone Hybrid Microgrid. IEEE Access 2019, 7, 119223–119245. [Google Scholar] [CrossRef]
  20. Arasteh, A.; Alemi, P.; Beiraghi, M. Optimal allocation of photovoltaic/wind energy system in distribution network using metaheuristic algorithm. Appl. Soft Comput. 2021, 109, 107594. [Google Scholar] [CrossRef]
  21. Suresh, M.; Meenakumari, R.; Panchal, H.; Priya, V.; El Agouz, E.; Israr, M. An enhanced multiobjective particle swarm optimisation algorithm for optimum utilisation of hybrid renewable energy systems. Int. J. Ambient Energy 2022, 43, 2540–2548. [Google Scholar] [CrossRef]
  22. Fadli, D.; Purwoharjono, H. Optimal sizing of PV/Diesel/battery hybrid micro-grid system using multi-objective bat algorithm. Int. J. Eng. Sci. 2019, 8, 6–14. [Google Scholar]
  23. Shi, B.; Wu, W.; Yan, L. Size optimization of stand-alone PV/wind/diesel hybrid power generation systems. J. Taiwan Inst. Chem. Eng. 2017, 73, 93–101. [Google Scholar] [CrossRef]
  24. Javed, M.S.; Ma, T. Techno-economic assessment of a hybrid solar-wind-battery system with genetic algorithm. Energy Procedia 2019, 158, 6384–6392. [Google Scholar] [CrossRef]
  25. Emad, D.; El-Hameed, M.; El-Fergany, A.A. Optimal techno-economic design of hybrid PV/wind system comprising battery energy storage: Case study for a remote area. Energy Convers. Manag. 2021, 249, 114847. [Google Scholar] [CrossRef]
  26. Hatata, A.Y.; Osman, G.; Aladl, M.M. An optimization method for sizing a solar/wind/battery hybrid power system based on the artificial immune system. Sustain. Energy Technol. Assess. 2018, 27, 83–93. [Google Scholar] [CrossRef]
  27. Askarzadeh, A.; Coelho, L.S. A novel framework for optimization of a grid independent hybrid renewable energy system: A case study of Iran. Sol. Energy 2015, 112, 383–396. [Google Scholar] [CrossRef]
  28. Li, J.; Liu, P.; Li, Z. Optimal design and techno-economic analysis of a solar-wind-biomass off-grid hybrid power system for remote rural electrification: A case study of west China. Energy 2020, 208, 118387. [Google Scholar] [CrossRef]
  29. Goswami, A.; Sadhu, P.; Sadhu, P.K. Development of a grid connected solar-wind hybrid system with reduction in levelized tariff for a remote island in India. J. Sol. Energy Eng. 2020, 142, 044501. [Google Scholar] [CrossRef]
  30. Aziz, A.S.; Tajuddin, M.; Adzman, M.; Azmi, A.; Ramli, M.A. Optimization and sensitivity analysis of standalone hybrid energy systems for rural electrification: A case study of Iraq. Renew. Energy 2019, 138, 775–792. [Google Scholar] [CrossRef]
  31. Kumar, R.; Channi, H.K. A PV-Biomass off-grid hybrid renewable energy system (HRES) for rural electrification: Design, optimization and techno-economic-environmental analysis. J. Clean. Prod. 2022, 349, 131347. [Google Scholar] [CrossRef]
  32. Hashem, M.; Abdel-Salam, M.; El-Mohandes, M.T.; Nayel, M.; Ebeed, M. Optimal placement and sizing of wind turbine generators and superconducting magnetic energy storages in a distribution system. J. Energy Storage 2021, 38, 102497. [Google Scholar] [CrossRef]
  33. Duchaud, J.-L.; Notton, G.; Darras, C.; Voyant, C. Multi-Objective Particle Swarm optimal sizing of a renewable hybrid power plant with storage. Renew Energy 2018, 131, 1156–1167. [Google Scholar] [CrossRef]
  34. Rezk, H.; Alghassab, M.; Ziedan, H.A. An Optimal Sizing of Stand-Alone Hybrid PV-Fuel Cell-Battery to Desalinate Seawater at Saudi NEOM City. Processes 2020, 8, 382. [Google Scholar] [CrossRef]
  35. Donado, K.; Navarro, L.; Pardo, M. HYRES: A Multi-Objective Optimization Tool for Proper Configuration of Renewable Hybrid Energy Systems. Energies 2019, 13, 26. [Google Scholar] [CrossRef]
  36. Ukoima, K. N., Owolabi, A. B., Yakub, A. O., Same, N. N., Suh, D., Huh, J. Analysis of a Solar Hybrid Electricity Generation System for a Rural Community in River State, Nigeria Energies 6 (3431) 1 – 16. [CrossRef]
  37. Dong, W.; Li, Y.; Xiang, J. Optimal sizing of a stand-alone hybrid power system based on battery/hydrogen with an improved ant colony optimization. Energies 2016, 9, 785. [Google Scholar] [CrossRef]
  38. Ukoima, K. N., Efughu, D., Azubuike, O. C., Akpiri, B. F. Investigating the Optimal Photovoltaic (Pv) Tilt Angle Using the Photovoltaic Geographic Information System (PVGIS). Nigerian Journal of Technology (NIJOTECH), 43(1) (2024) 101-11. [CrossRef]
  39. Ukoima, K. N., Okoro, O. I., Akuru, U. B., Davidson, E. Technical, economic and environmental assessment and optimization of four hybrid renewable energy models for rural electrification. Solar compass (2024). [CrossRef]
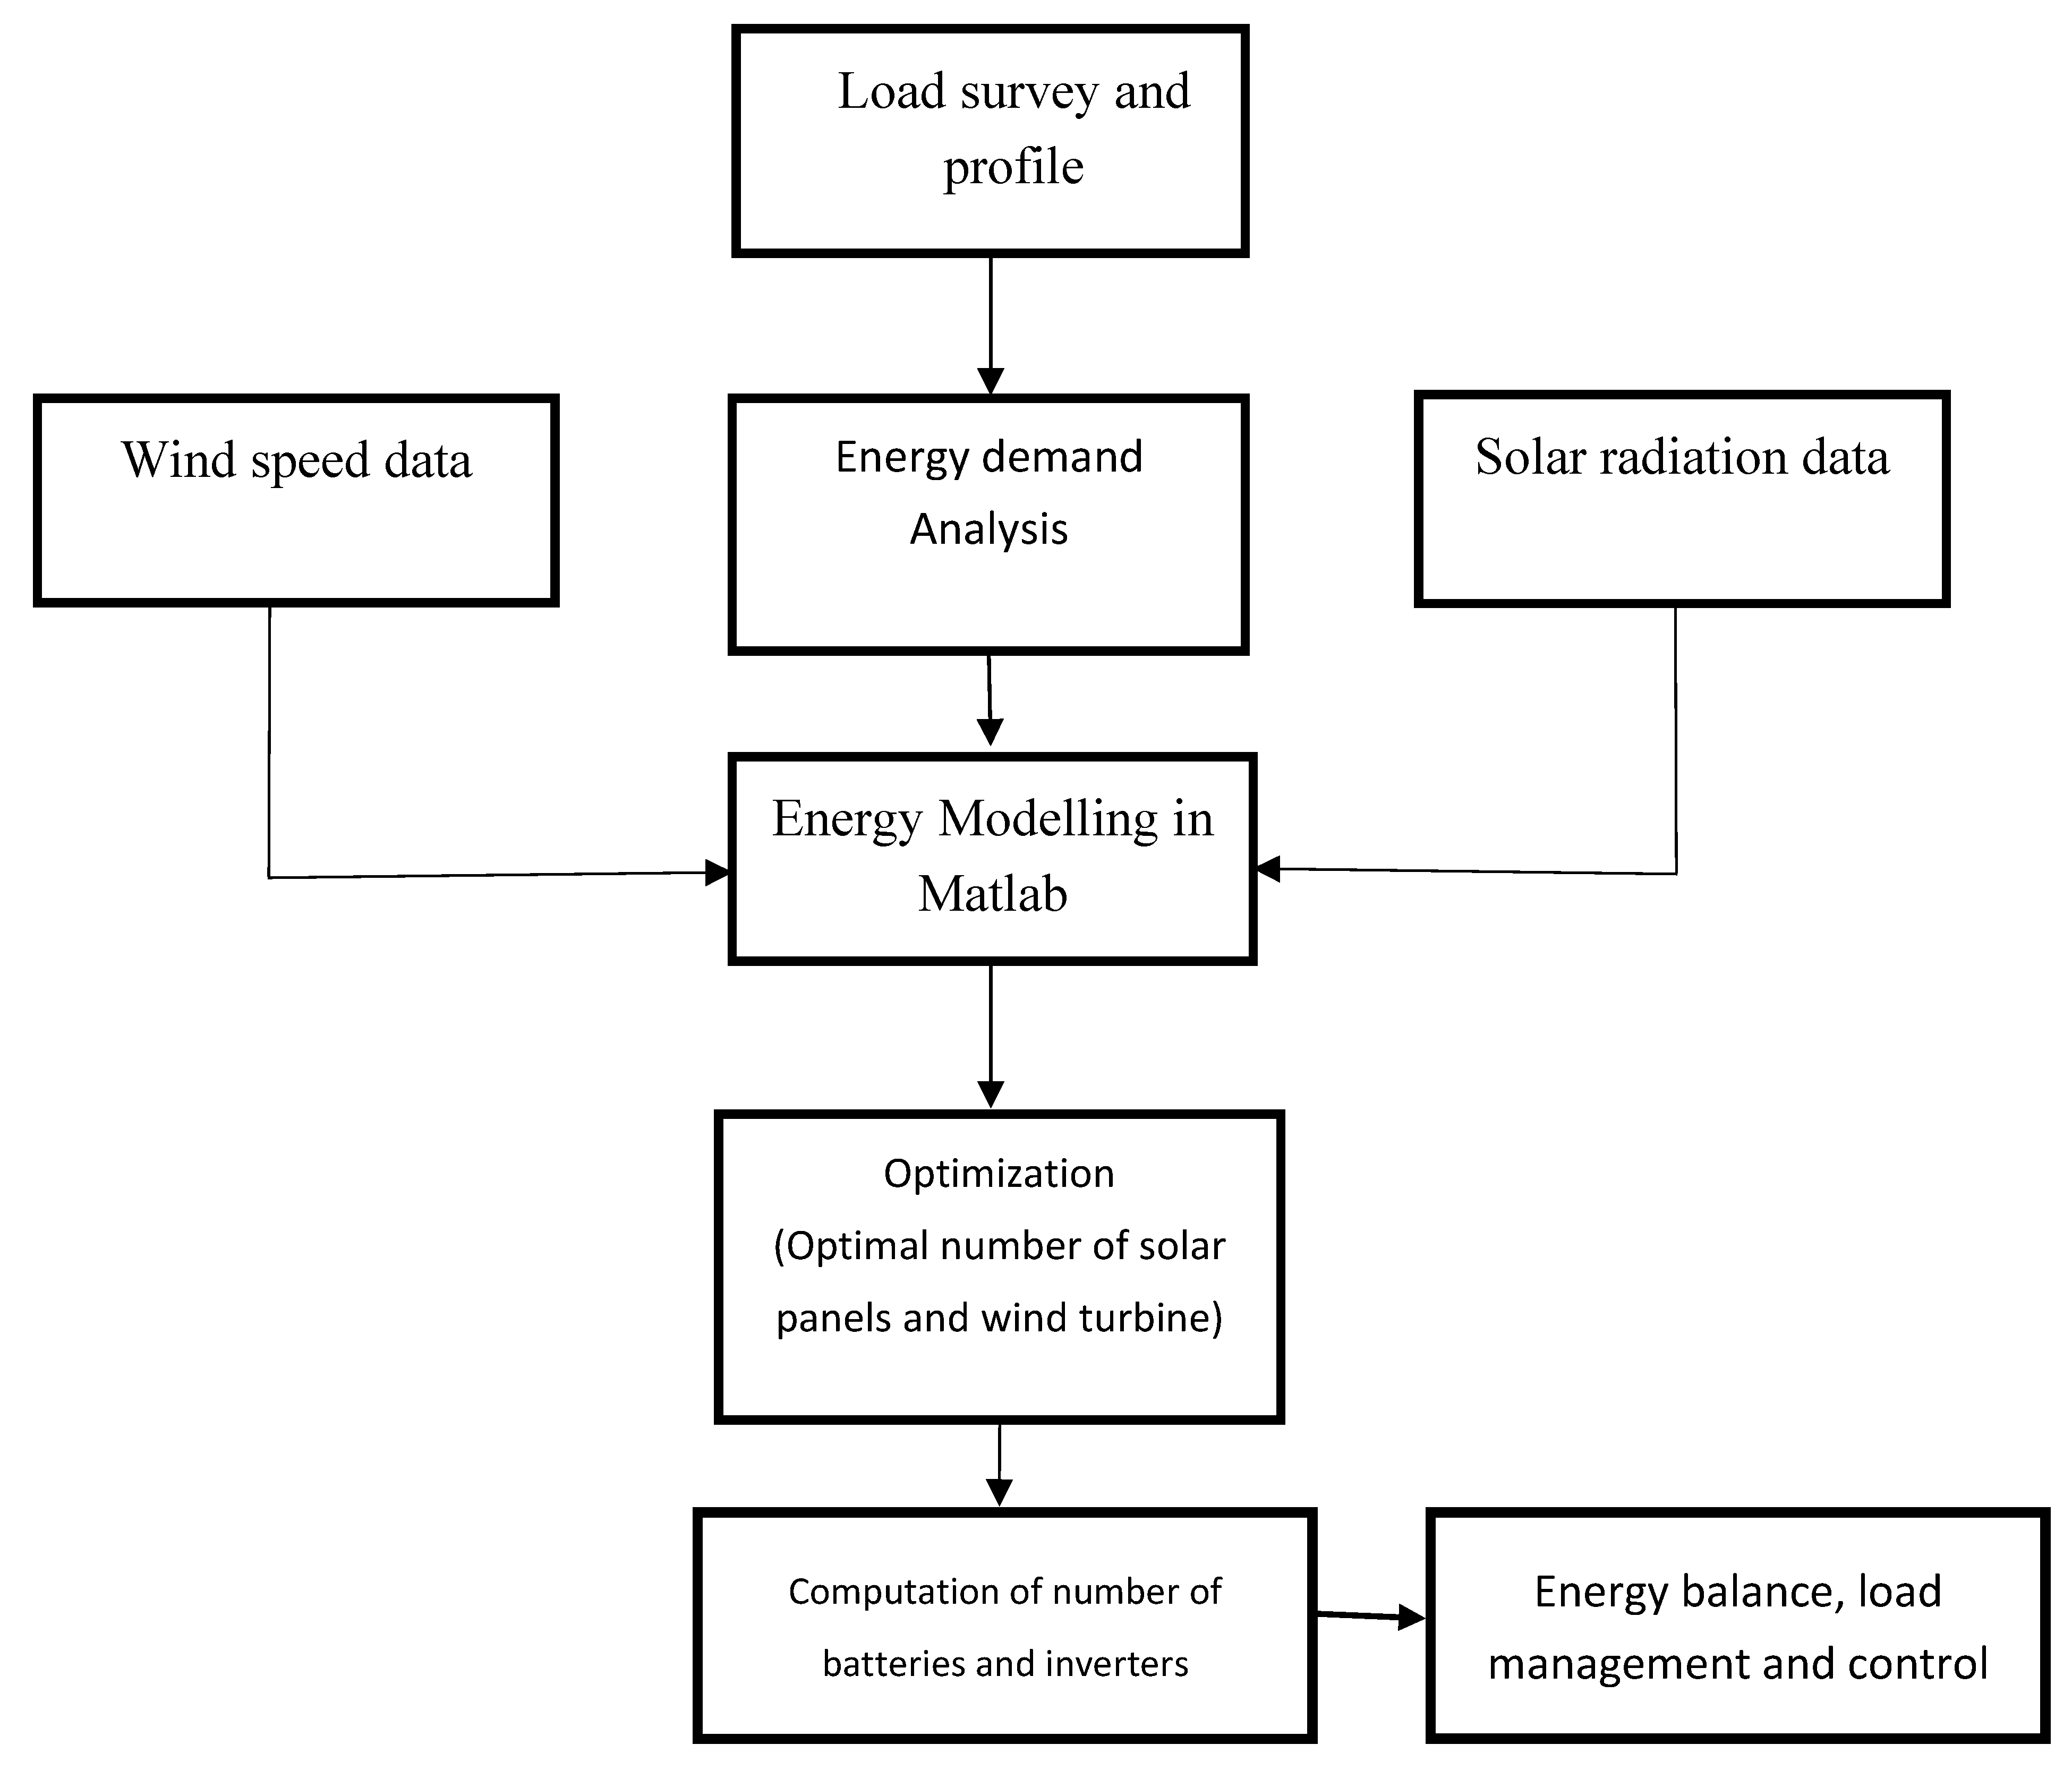
Figure 1. Research framework.
Preprints 118531 g001
Figure 2. Detailed load profile of Okorobo-Ile town [36,39].
Preprints 118531 g002
Figure 3. Solar irradiance hourly profile.
Preprints 118531 g003
Figure 4. wind speed hourly profile at 10m height.
Preprints 118531 g004
Figure 5. Flow chart of the PSO optimization process.
Preprints 118531 g005
Figure 6. Power generated from the HRES.
Preprints 118531 g006
Figure 7. Optimized fitness function from PSO.
Preprints 118531 g007
Figure 8. Breakdown of capital cost.
Preprints 118531 g008
Figure 9. Optimized fitness function from GA-PSO.
Preprints 118531 g009
Figure 10. Power generated from the HRES for GA-PSO.
Preprints 118531 g010
Figure 11. Pareto front from multiobjective GA.
Preprints 118531 g011
Figure 12. Homer model.
Preprints 118531 g012
Figure 13. Average weather condition (a) Wind speed at 10m height (b) Solar irradiance.
Preprints 118531 g013
Figure 14. Case 1 performance.
Preprints 118531 g014
Figure 15. Poor weather condition (a) Wind speed at 10m height (b) Solar irradiance.
Preprints 118531 g015
Figure 16. Case 2 performance.
Preprints 118531 g016
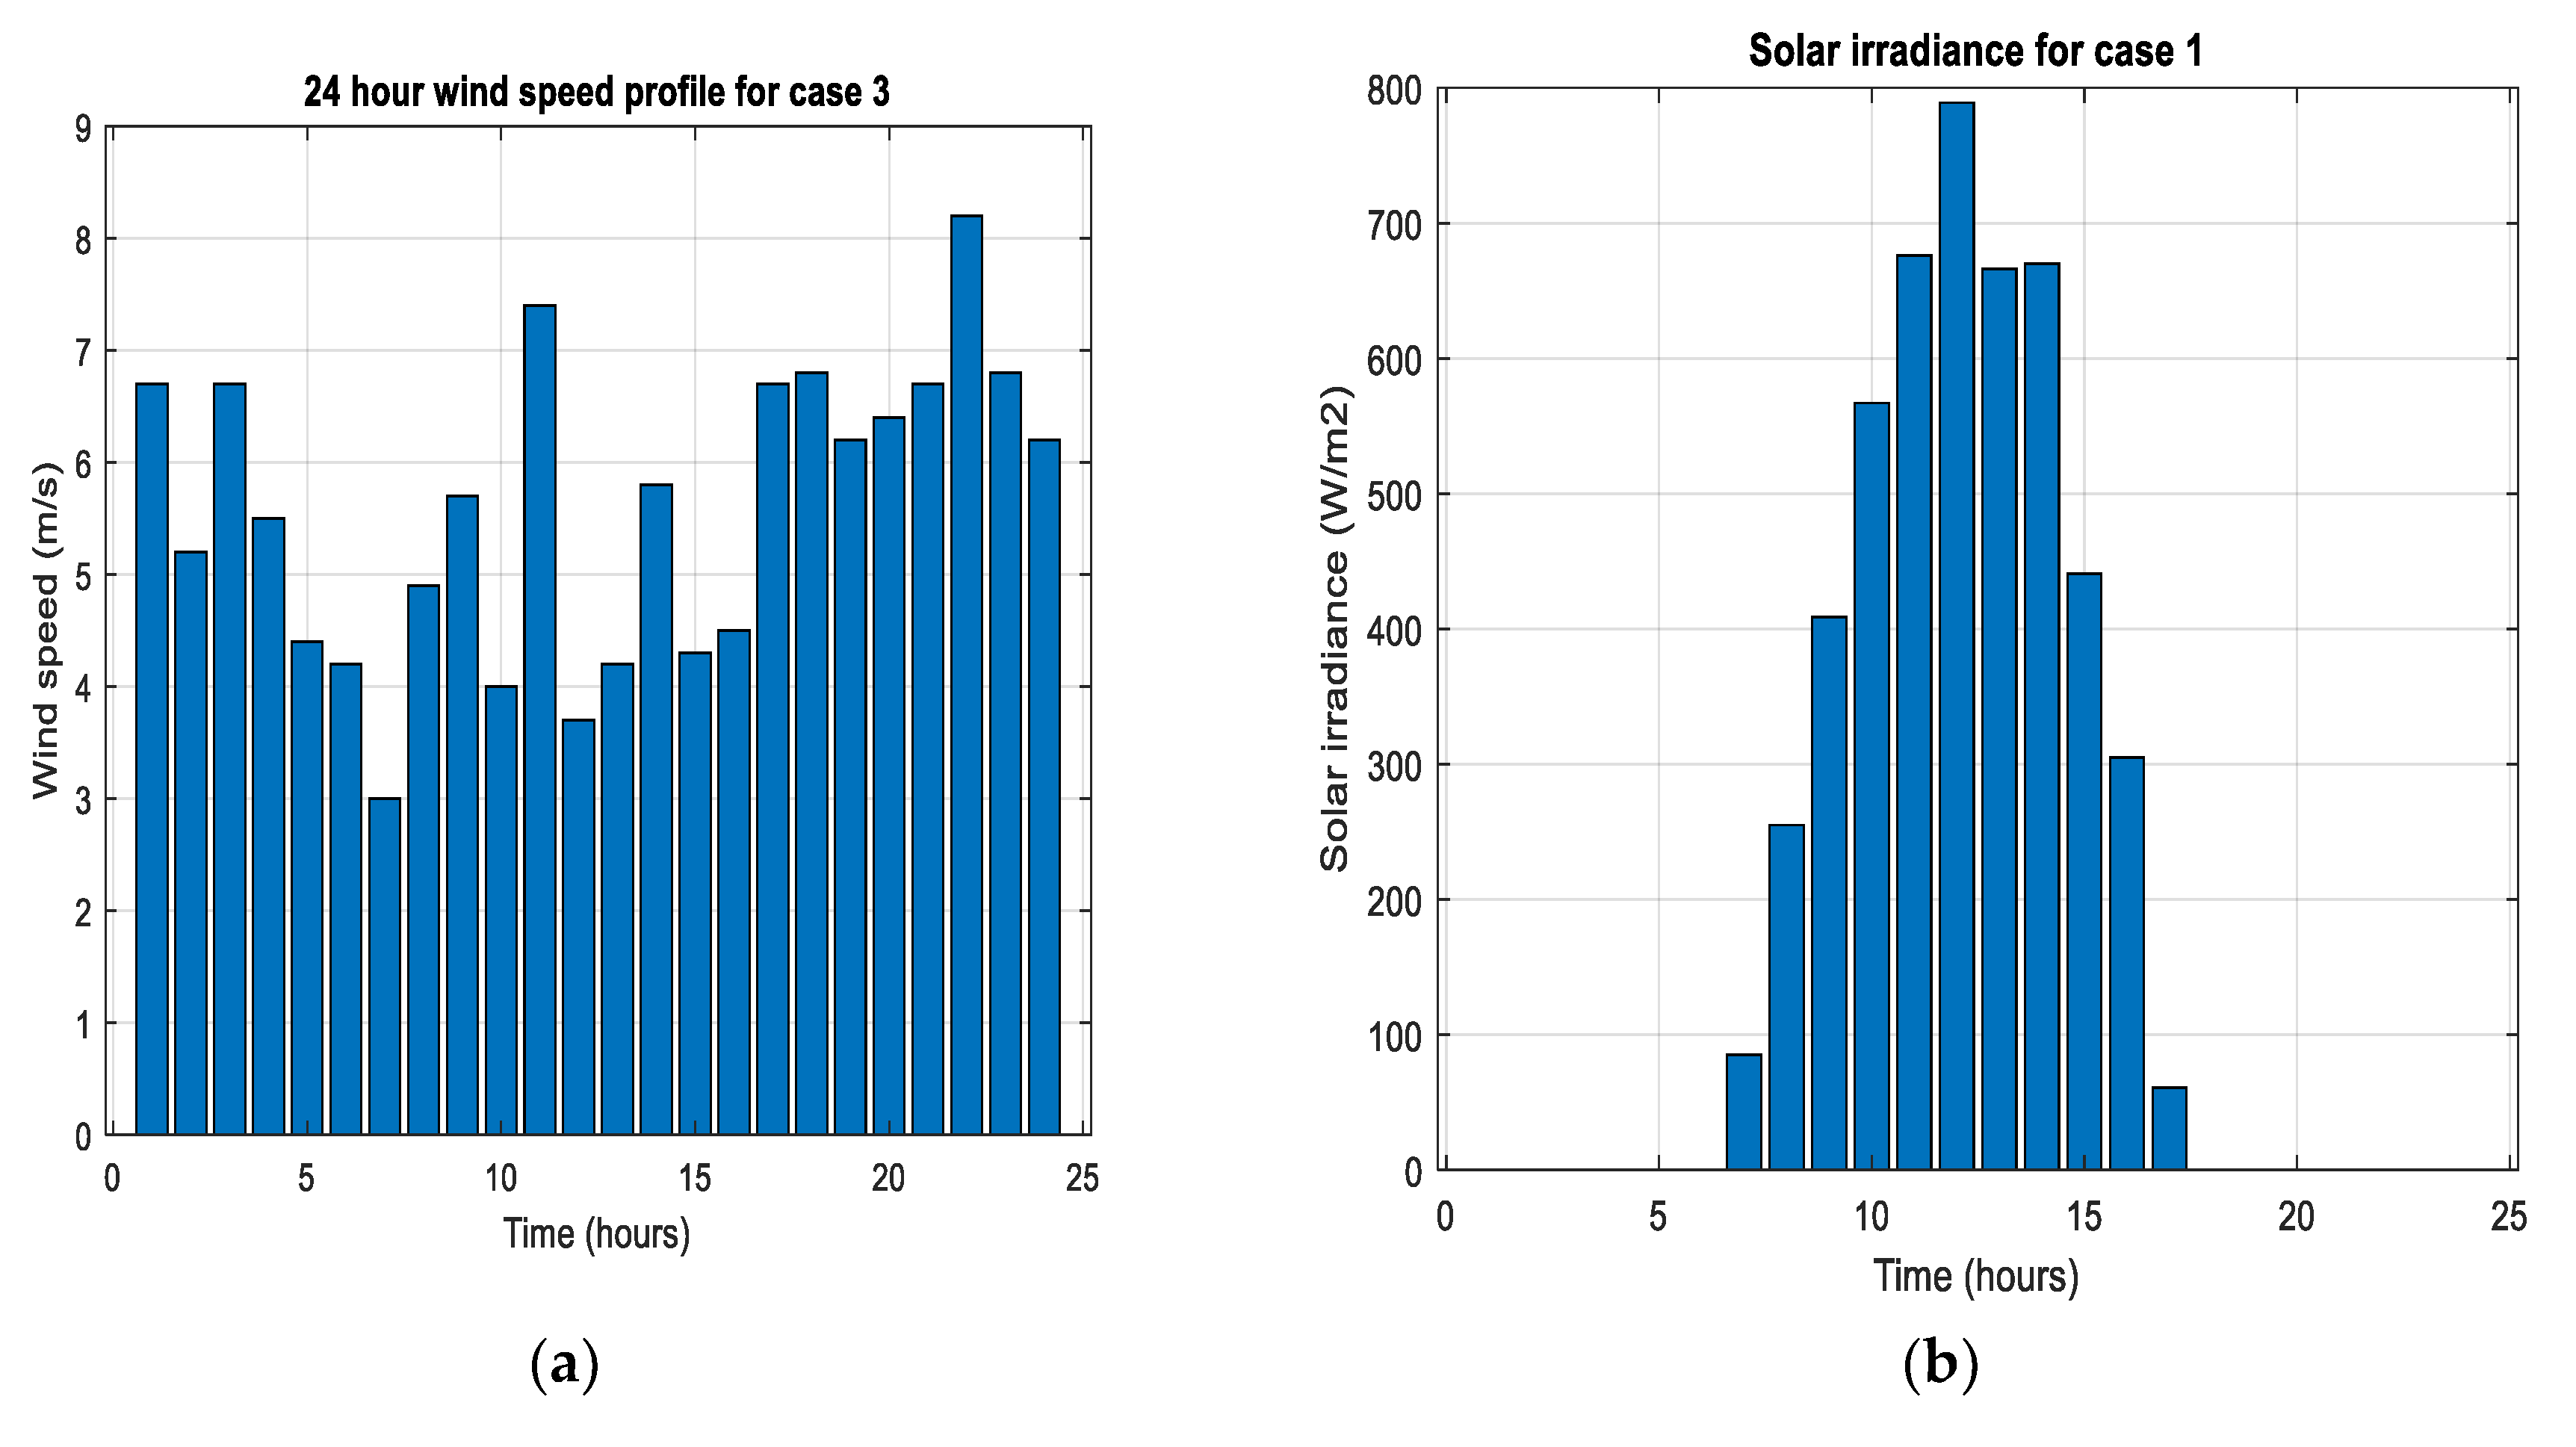
Figure 17. Good weather condition (a) Wind speed at 10m height (b) Solar irradiance.
Preprints 118531 g017
Figure 18. Case 3 performance.
Preprints 118531 g018
Table 1. Technical specifications for optimization.
Solar Panel           Specification
Max power           1kW
Dimension           1.8 × 1.0 m
Panel efficiency           19.3%
Panel temperature coefficient           -0.005/ oC
Initial cost (IC)           1200USD/kW
O & M cost           10USD/kW
Replacement cost           1000USD/kW
Life span           20 years
Wind turbine
Rated power           25kW
Cutin speed           5m/s
Rated speed           12m/s
Cutoff speed           25m/s
Initial cost           5000USD/kW
O & M cost           500USD/kW
Replacement cost           5000USD/kW
Life span           20 years
Inverter
Rating           1kW
Efficiency           95%
Battery
Rating           72kWh
Depth of Discharge (DoD)           80%
Efficiency           85%
Economic
Inflation rate           40%
Discount rate           30%
Tax rate           30%
Insurance rate           5%
Salvage           20% of IC
Table 2. Summary of optimal sizes.
Algorithmn PV Panels Wind Turbines Inverters Batteries TEC/NPC(USD) LCOE (USD/kWh)
PSO 154 3 136 31 $476,731(TEC) $0.01
GA-PSO 154 3 136 31 $476,731(TEC) $0.01
NGSA-II 151 3 122 31 $469,200(TEC) 0.007
HOMER
(Proprietary Derivative-free)
166 3 123 29 $615,664.95(NPC) $0.16
Disclaimer/Publisher’s Note: The statements, opinions and data contained in all publications are solely those of the individual author(s) and contributor(s) and not of MDPI and/or the editor(s). MDPI and/or the editor(s) disclaim responsibility for any injury to people or property resulting from any ideas, methods, instructions or products referred to in the content.
Copyright: This open access article is published under a Creative Commons CC BY 4.0 license, which permit the free download, distribution, and reuse, provided that the author and preprint are cited in any reuse.
Prerpints.org logo

Preprints.org is a free preprint server supported by MDPI in Basel, Switzerland.

Subscribe

© 2024 MDPI (Basel, Switzerland) unless otherwise stated