Preprint
Article

The Detection and Classification of Scaphoid Fracture in Radiograph by Using the Convolutional Neural Network

Altmetrics

Downloads

49

Views

31

Comments

0

A peer-reviewed article of this preprint also exists.

Submitted:

19 September 2024

Posted:

19 September 2024

You are already at the latest version

Alerts
Abstract
Objective: Scaphoid fractures, particularly occult and non-displaced fractures, are difficult to detect using traditional X-ray methods due to their subtle appearance and variability in bone density. The study proposes a two-stage CNN approach to detect and classify scaphoid fractures using anterior-posterior (AP) and lateral (LA) X-ray views for more accurate diagnosis. Methods: The study emphasizes the use of multi-view X-ray images (AP and LA views) to improve fracture detection and classification. The multi-view fusion module helps integrate information from both views to enhance detection accuracy, particularly for occult fractures that may not be visible in a single view. The proposed method includes two stages that are stage 1: Detect the scaphoid bone using Faster R-CNN and Feature Pyramid Network (FPN) for region proposal and small object detection. The detection accuracy for scaphoid localization is 100% with Intersection over Union (IoU) scores of 0.8662 for AP views and 0.8478 for LA views. And stage 2: Perform fracture classification using a ResNet backbone and FPN combined with a multi-view fusion module to combine features from both AP and LA views. This stage achieves a classification accuracy of 89.94%, recall of 87.33%, and precision of 90.36%. Results: The proposed model performs well in both scaphoid bone detection and fracture classification. The multi-view fusion approach significantly improves recall and accuracy in detecting fractures compared to single-view approaches. In scaphoid detection, both AP and LA views achieved 100% detection accuracy. In fracture detection, using multi-view fusion, the accuracy for AP views reached 87.16%, and for LA views, it reached 83.83%. Conclusion: The multi-view fusion model effectively improves the detection of scaphoid fractures, particularly in cases of occult and non-displaced fractures. The model provides a reliable, automated approach to assist clinicians in detecting and diagnosing scaphoid fractures more efficiently.
Keywords: 
Subject: Engineering  -   Bioengineering

1. Introduction

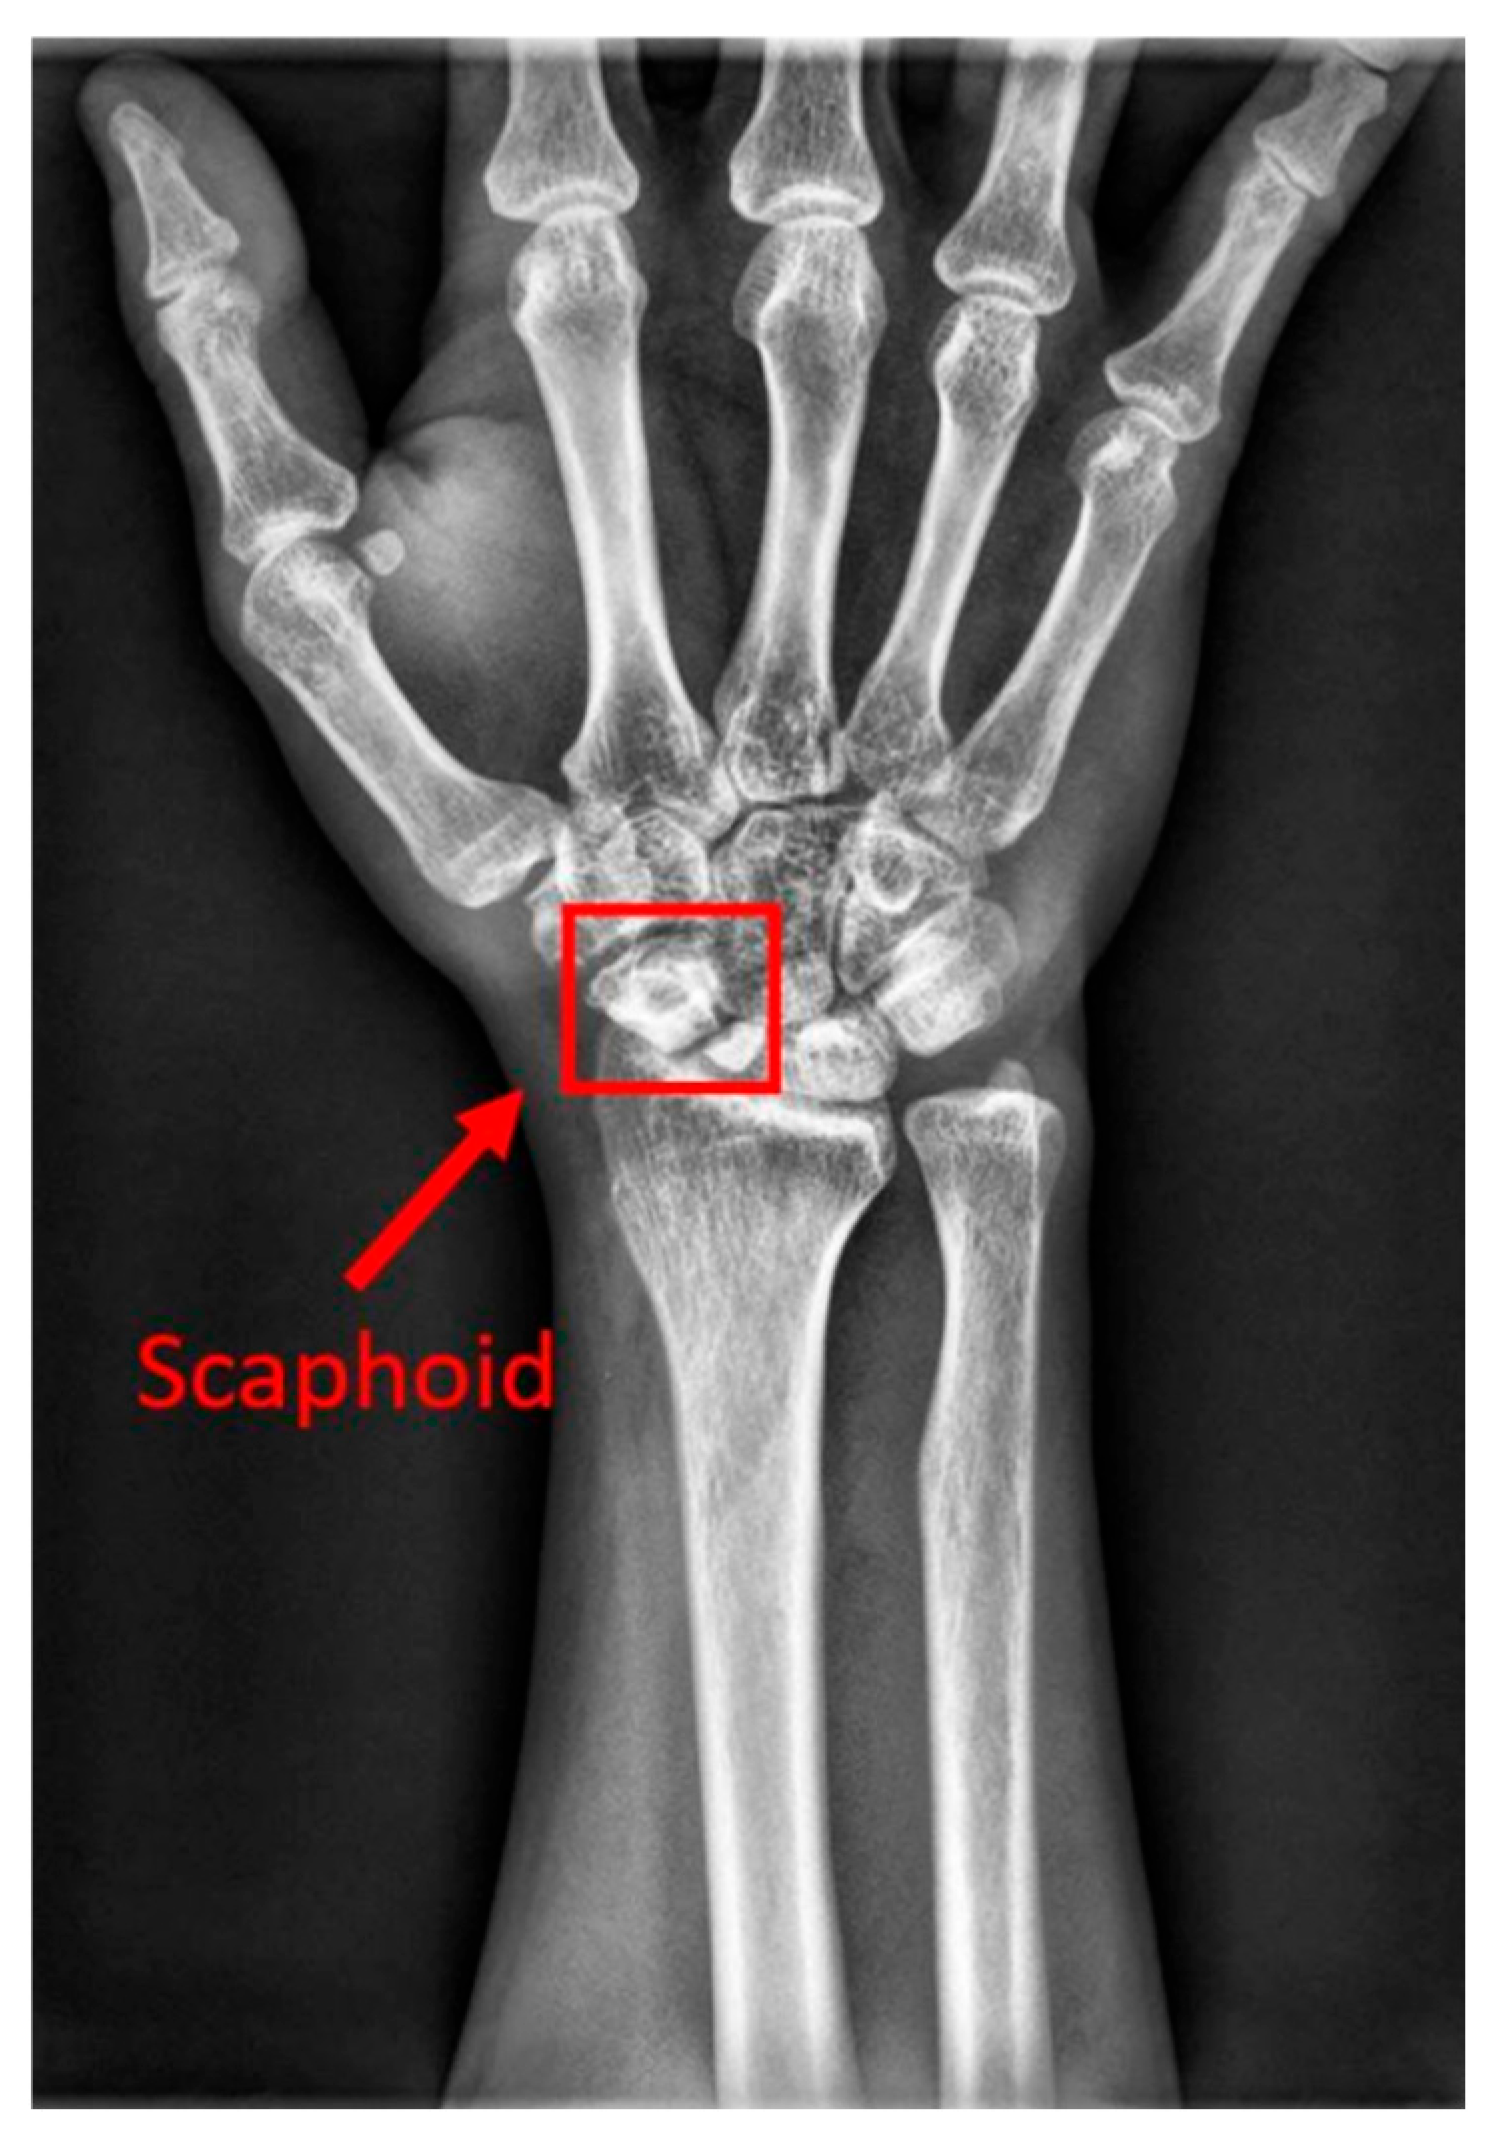
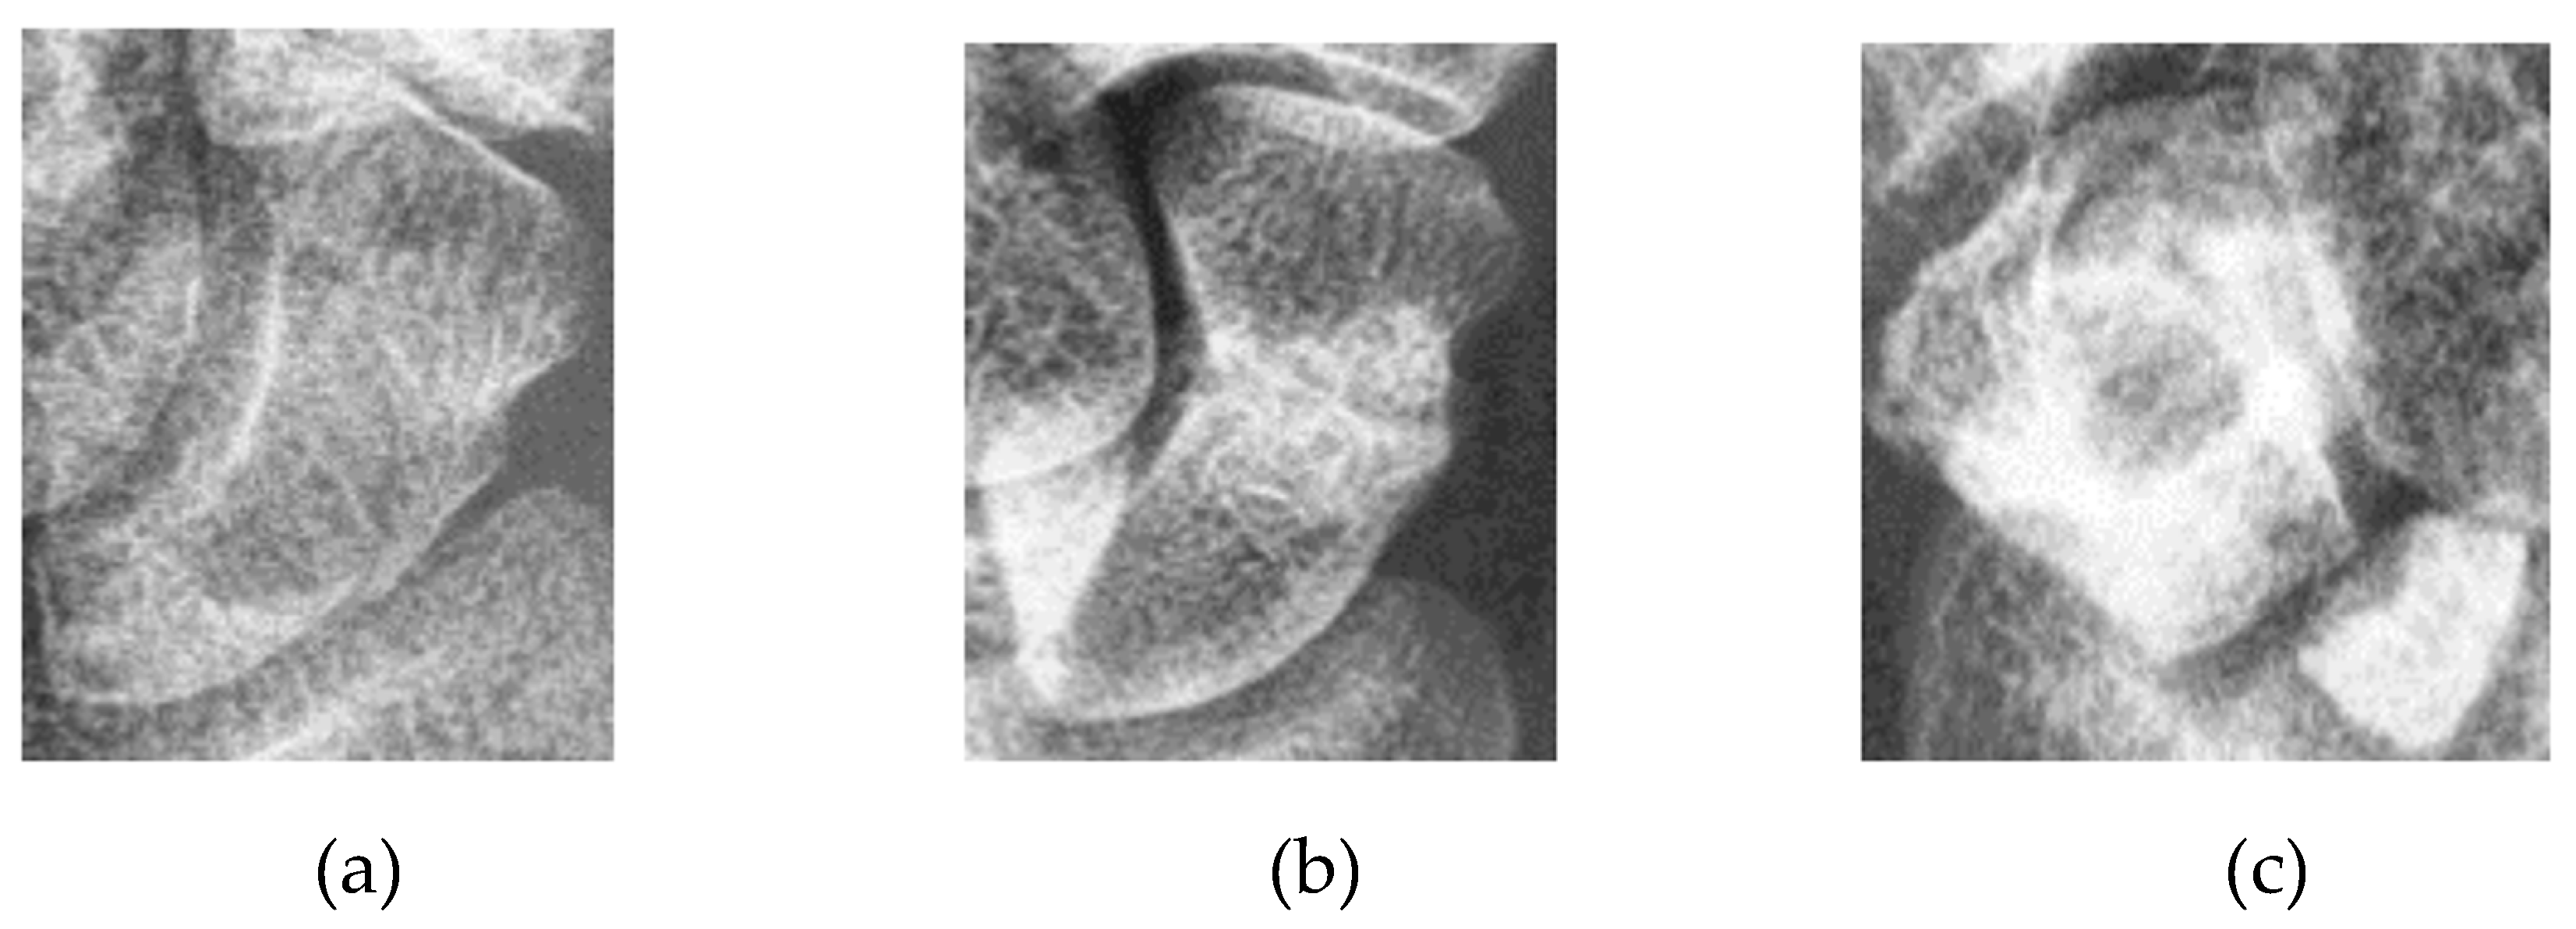
The human wrist consists of eight carpal bones, with the scaphoid bone being the largest. Located under the thumb and near the arm, as indicated by the red box in Figure 1, the scaphoid is prone to injury due to its location. It can fracture not only from severe accidents but also from falls where one braces themselves with the wrist or during athletic activities. A scaphoid fracture may not always cause severe pain; symptoms can be mild, leading individuals to believe they have merely sprained their wrist and that it will heal without medical intervention. Scaphoid fractures account for 2% to 7% of all fractures and 60-70% of carpal bone fractures. General treatment often involves screw fixation surgery due to its short operation time and good recovery outcomes. However, accurate localization of both the scaphoid and the fracture site is essential for implanting the screw at the optimal angle. Physicians typically use X-rays for diagnosis, but since X-rays are two-dimensional projections of a three-dimensional object, the scaphoid bone may overlap and not be fully visible in the two-dimensional image. This is particularly problematic for non-displaced fractures, which can be challenging to detect with the naked eye and are termed occult fractures, as shown in Figure 2.
Brian Gibney estimated the occurrence rate of occult fractures to be approximately 7-21% [1]. In addition to occult fractures, varying bone density among patients can complicate diagnosis. To address this, doctors often use both the anterior-posterior (AP) view and lateral (LA) view for diagnostic purposes. The AP view shows the scaphoid bone’s front and back, while the LA view provides side information. Combining these views can offer a more comprehensive basis for assessment. If discomfort persists after treatment, further observation with tools like Computed Tomography (CT) or Magnetic Resonance Imaging (MRI) may be used for a more detailed diagnosis or surgical planning. However, such equipment is very expensive, highlighting the importance of improving diagnostic accuracy with X-ray images.
Recent advancements in convolutional neural networks (CNNs) have led to significant success in detection and classification tasks within computer vision. Various models have been proposed, including one-stage detection models like YOLO [2], RetinaNet [3], and FCOS [4], as well as two-stage detection models such as Faster R-CNN [5] and Cascade R-CNN [6], and classification models like ResNet [7], DenseNet [8], and EfficientNet [9]. These models are widely used due to their ability to learn automatically and efficiently, offering advantages over traditional image processing methods. This study utilizes a deep learning object detection algorithm to develop a computer-assisted diagnostic system for scaphoid fractures. The system includes two components: first, it locates the scaphoid bone in X-ray images of the wrist from the anterior-posterior view, and second, it detects fracture areas in both anterior-posterior and lateral views.
Object detection algorithms focus on extracting important regions for further analysis. One-stage detectors can quickly produce results but may sacrifice some precision, while two-stage detectors offer higher precision at the cost of increased computation time. One-stage methods predict object classes and deviations from dense anchor boxes or points in a single step, which is fast and less hardware-intensive due to fewer parameters. One-stage methods include anchor-based approaches like SSD [10] and YOLO [2] and Foveabox [11]. These methods face challenges due to the imbalance between positive and negative samples, leading to the development of loss functions such as Focal Loss [3] to address this issue. Despite their lower precision compared to two-stage methods, their speed makes them suitable for certain tasks.
Two-stage methods, such as those in the R-CNN family (e.g., R-CNN [12], Faster R-CNN [5], and Mask R-CNN [13]), first propose regions of interest using a Region Proposal Network (RPN) before performing more precise detection in the second stage. These methods provide higher detection accuracy due to the initial selection of candidate areas but require more computational resources.
In response to the success of CNNs in computer vision, computer-assisted diagnostic systems for fracture detection have emerged. These systems can be categorized into two main types: those that simply classify the presence of a fracture and those that use additional information for more accurate detection or classification. For instance, Yadav et al. used a feature extractor followed by a fully connected layer to classify fracture images [14]. Raisuddin et al. used landmark detection and SE ResNet50 for feature extraction and classification [16]. Alfred Yoon employed two Efficient-B3 models to re-classify images flagged as normal by the first model [17]. These methods, however, often fall short in pinpointing the exact fracture location, relying on gradient-weighted class activation maps [18] which can be imprecise.
Other approaches incorporate additional information for fracture detection. Lindsey et al. used an encoding-decoding architecture to locate fractures by generating a mask of the fracture area [19]. Chen et al. leveraged symmetry by flipping pelvic images and using a Siamese encoding structure to create a heatmap of fracture locations [20]. Lee et al. combined X-rays with semantic information to classify fractures [21]. These methods highlight the need for multi-source information to improve detection accuracy but face challenges such as sample imbalance and variability in image quality and annotations.
In previous research, we developed a method for scaphoid fracture detection from anterior-posterior views, achieving classification results with 82.9% accuracy, 73.50% recall, and 89.8% precision, and detection results with 85.3% accuracy, 78.9% recall, and 89.4% precision [22]. Although precision was high, there was room for improvement in accuracy and recall. This study aims to enhance these metrics by incorporating lateral views into a multi-view fusion approach for improved classification and detection.
Several studies on multi-view classification have shown that combining multiple views can enhance model performance [23,24,25]. For example, Shaoliang Peng et al. used frontal, lateral, and posterior-anterior chest X-ray images combined through different CNN models for pneumonia classification [26]. Hassan Nasir Khan et al. utilized four views of breast X-ray images and merged features for breast cancer diagnosis [27]. Yanhan Li et al. employed a Siamese network to combine lung ultrasound images with biomedical indicators for COVID-19 detection [28].
In multi-view detection tasks, Yue Wang et al. encoded images from various views using ResNet and FPN, converting them from 2D to 3D space for refined object queries [29]. Guojun Wang combined color and point cloud images from different views, using attention mechanisms to fuse features and predict 3D bounding boxes [30].
Clinical systems often use multiple X-ray views for diagnosing scaphoid fractures, combining frontal, lateral, and anterior-posterior views to simulate the clinical diagnostic process. This study develops two models: the first uses Faster R-CNN for scaphoid bone localization, reducing computation costs, and the second identifies fracture regions from multiple views, combining features to enhance classification performance.
The main contributions of this article are as follows:
1. A clinically inspired model utilizing multi-view X-ray information is developed for scaphoid fracture classification and localization, improving diagnostic efficiency.
2. The multi-view fusion method enables 2D space detection without 3D transformation, facilitating training with cost-effective X-ray images and addressing challenges in single-view detection.
3. The proposed method achieves high classification performance with 89.94% accuracy, 87.33% recall, and 90.36% precision, with improved recall rates in both frontal and lateral view detectors due to multi-view fusion.

2. Database and Methods

2.1. Database

The experimental material for this study was collected from National Cheng Kung Hospital and consists of 180 sets of anterior-posterior and lateral X-ray images of the arm. These images were annotated by two clinical physicians from the Department of Orthopedics. The annotations include identifying the presence of fractures and marking their locations. Fractures marked in the annotations were confirmed through surgery, and their locations were noted using the annotation program developed for this study. Both anterior-posterior and lateral views were annotated, with annotations being angle-specific. This approach is necessary because fractures or cracks have specific directions, and using a horizontal bounding box might cover non-fracture areas as well. Consequently, directed bounding boxes were used to accurately mark fracture locations. Annotating both views allows for cross-referencing, enabling doctors to highlight previously inconspicuous areas. This process, simulated during model training, enhances the detection of occult and non-displaced fractures.
The proposed method and model performance were evaluated using 5-fold cross-validation. The training dataset typically includes about 140 entries, comprising 60 sets of fracture images and 80 sets of normal images. The validation dataset contains approximately 35 entries, including 15 sets of fracture images and 20 sets of normal images. Cross-validation ensures that all data is utilized for both training and validation, reducing potential data bias from random distribution and providing a more robust evaluation of the method and model.

2.2. Methods

The main objective of this article is to locate the scaphoid bone in X-ray images and assist doctors in determining whether it is fractured, as well as in identifying the fracture area. Displaced fractures are typically easy to detect in X-ray images, allowing doctors to quickly diagnose them. In contrast, non-displaced and occult fractures are more challenging to identify due to X-ray projection shadowing and variations in bone density among patients. Additionally, discrepancies in interpretation between radiologists and orthopedic surgeons are common. For fractures not visible in the anterior-posterior view, doctors must examine the scaphoid bone for discontinuities, making the diagnosis time-consuming and demanding a thorough understanding of the scaphoid.
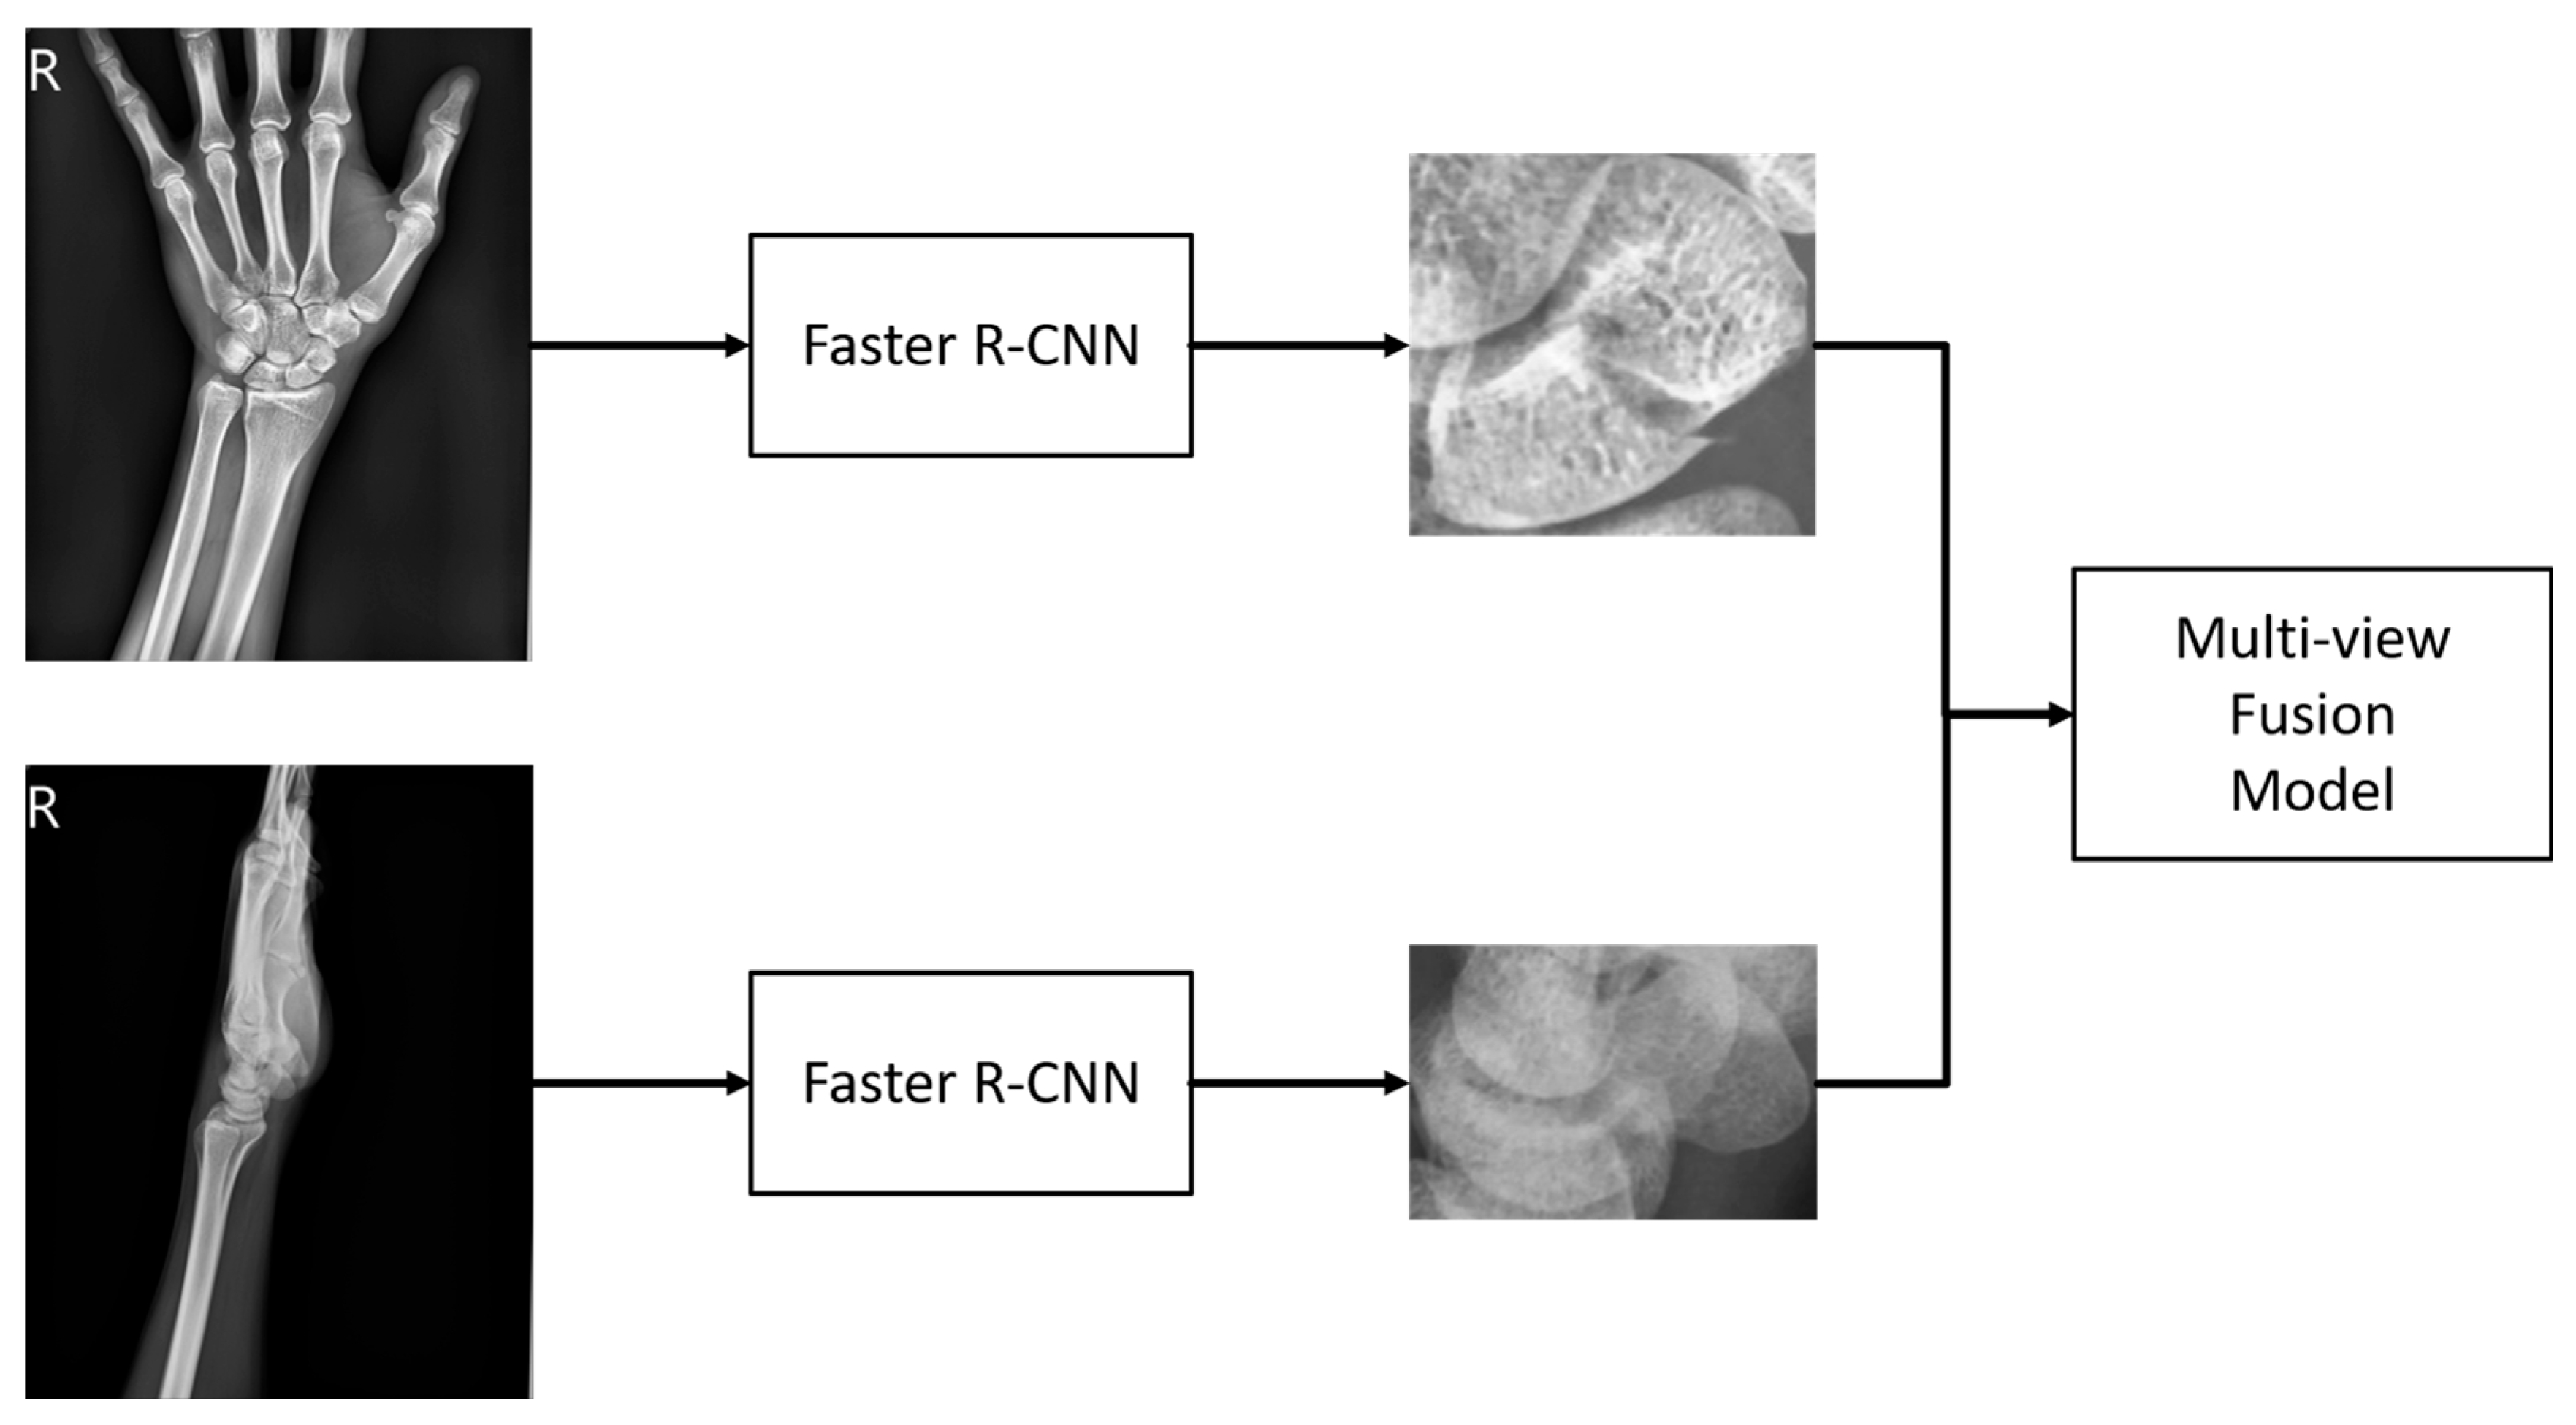
Our model is designed to improve upon traditional diagnostic methods by integrating both anterior-posterior and lateral views of X-ray images. This approach provides additional side information often overlooked in standard assessments. The first stage of the model uses Faster R-CNN to extract the scaphoid bone from both views of the arm X-ray image. These extracted regions are then processed in the second stage using a multi-view fusion model developed in this study. This model separately analyzes fracture areas from both views and fuses the features to enhance discriminative capability. The fused features are used to assess whether the scaphoid bone is fractured, and the classification scores help refine the detection of fracture areas for greater accuracy. An overview of the system is illustrated in Figure 3.
Figure 3 provides a schematic of the system’s workflow. Initially, wrist X-ray images from two perspectives are collected. These images are processed to detect the scaphoid bone region, a critical component of the wrist. Once the scaphoid region is identified, the multi-view fusion model evaluates images from both perspectives to classify and locate fractures. This fusion approach aims to enhance the accuracy and reliability of fracture detection.

2.2.1. Scaphoid Bone Area Detection

As mentioned earlier, the first stage aims to extract the scaphoid bone from the entire wrist X-ray image. For this purpose, we use the Faster R-CNN model combined with a Feature Pyramid Network (FPN). Faster R-CNN is a renowned two-stage detector that incorporates a Region Proposal Network (RPN), which enhances the speed of the detector by replacing the traditional algorithmic approach used in the initial stage. The Feature Pyramid Network improves the utilization of feature maps at various scales, addressing the issue that deeper networks might lose small objects.
In our research, if the first stage fails to accurately locate the scaphoid bone, subsequent fracture detection cannot proceed effectively. Therefore, we employ the two-stage Faster R-CNN model with FPN at this stage, despite its slightly slower processing time, due to its improved accuracy. Unlike the original Faster R-CNN model, which uses a single-level feature map to generate candidate boxes, the FPN integrates feature maps from multiple levels. This approach helps retain small objects that might otherwise be lost during pooling, thereby enhancing detection performance for small and medium-sized objects.
Considering that a typical wrist X-ray image measures approximately 2000 × 1600 pixels and the scaphoid bone region is around 150 × 150 pixels, the scaphoid falls into the category of small and medium-sized objects. To address this, we use the Feature Pyramid Network (FPN) which upsamples and enlarges deep features to match the size of previous layers, then integrates them using a convolutional layer. Specifically, after incorporating the FPN, a 1×1 convolutional layer adjusts the channel number to 256, and deep features are upsampled and combined with the previous layer’s features. A final 3×3 convolutional layer refines the feature map. This multi-layer approach, with varied anchor box sizes and aspect ratios, enhances overall detection performance.
Additionally, the Faster R-CNN model in this study uses RoI Align to generate feature maps of consistent dimensions for different proposals. RoI Align addresses the limitations of RoI Pooling by avoiding rounding issues associated with dividing regions into smaller blocks. Instead, RoI Align performs bilinear interpolation on these blocks, yielding more accurate feature maps and improving detection results.
To handle multiple bounding boxes that may overlap, Non-Maximum Suppression (NMS) is applied to retain the most accurate boxes. NMS starts by selecting the bounding box with the highest score and storing the remaining boxes in an output list. It then calculates the Intersection over Union (IoU) between the selected box and the remaining boxes. If the IoU exceeds a predefined threshold, the overlapping box is removed from the list. This process repeats until only the boxes with the highest scores remain, effectively representing the detected objects.

2.2.2. Fracture Classification and Detection

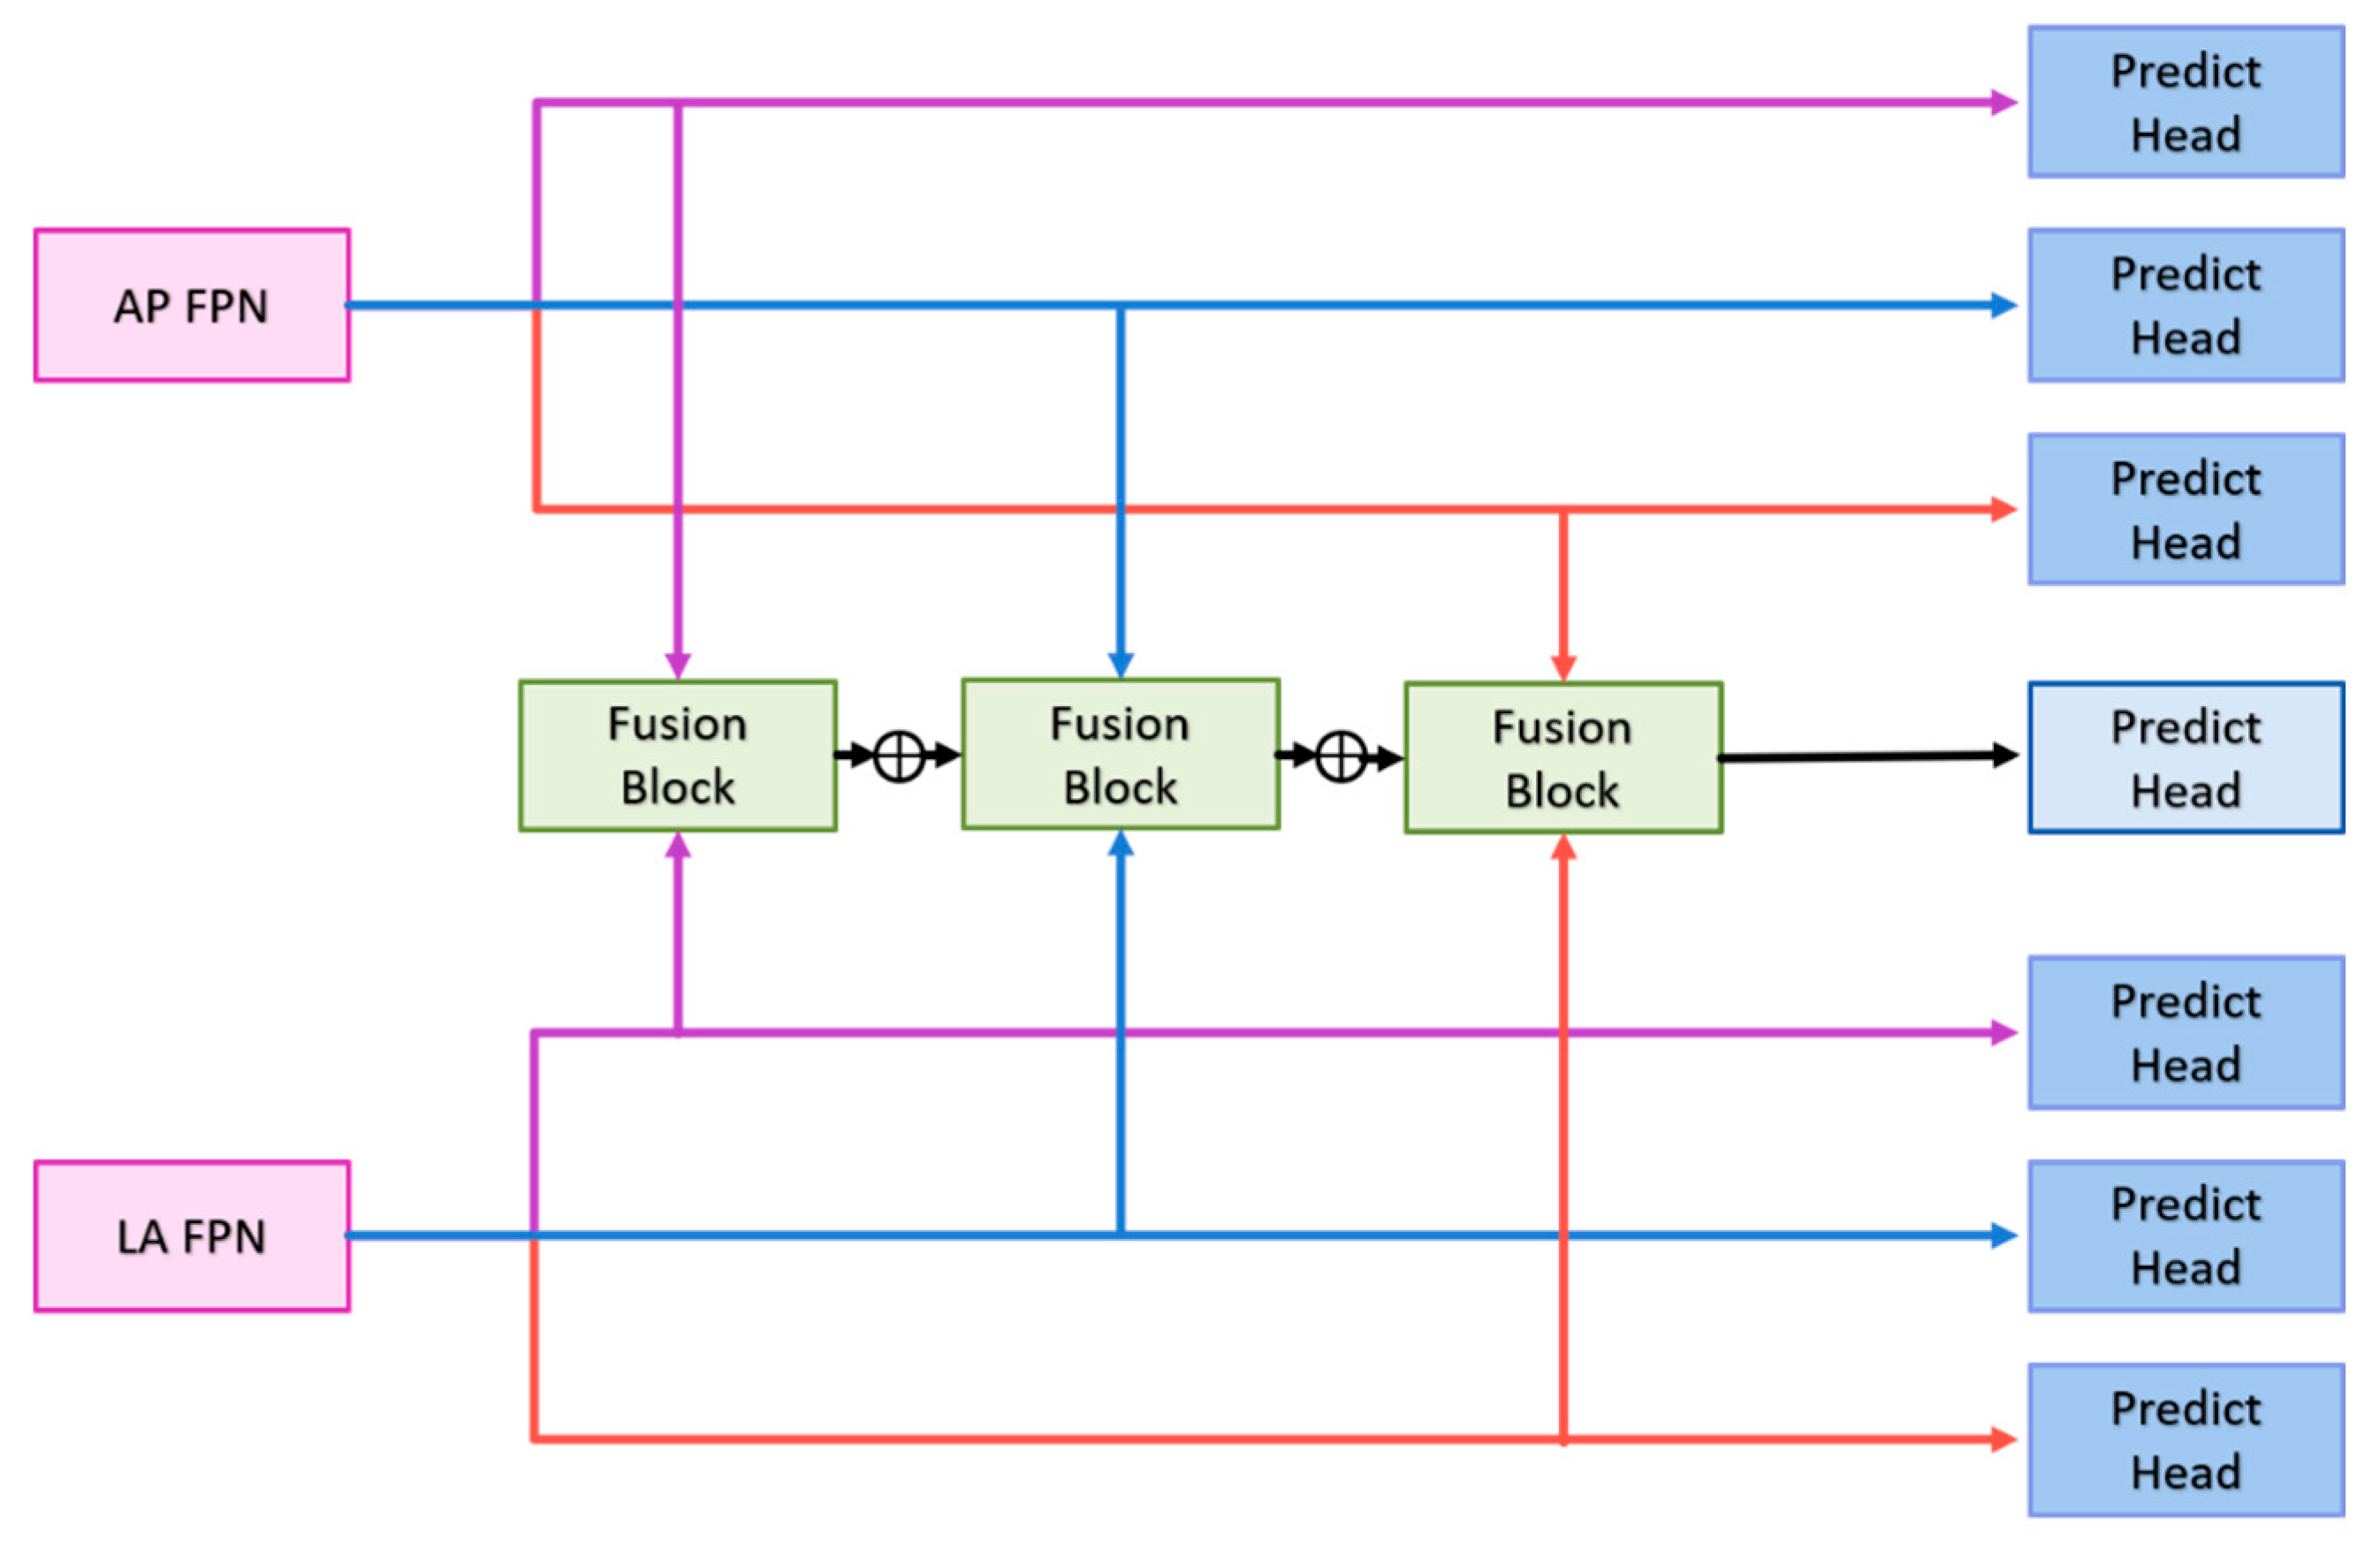
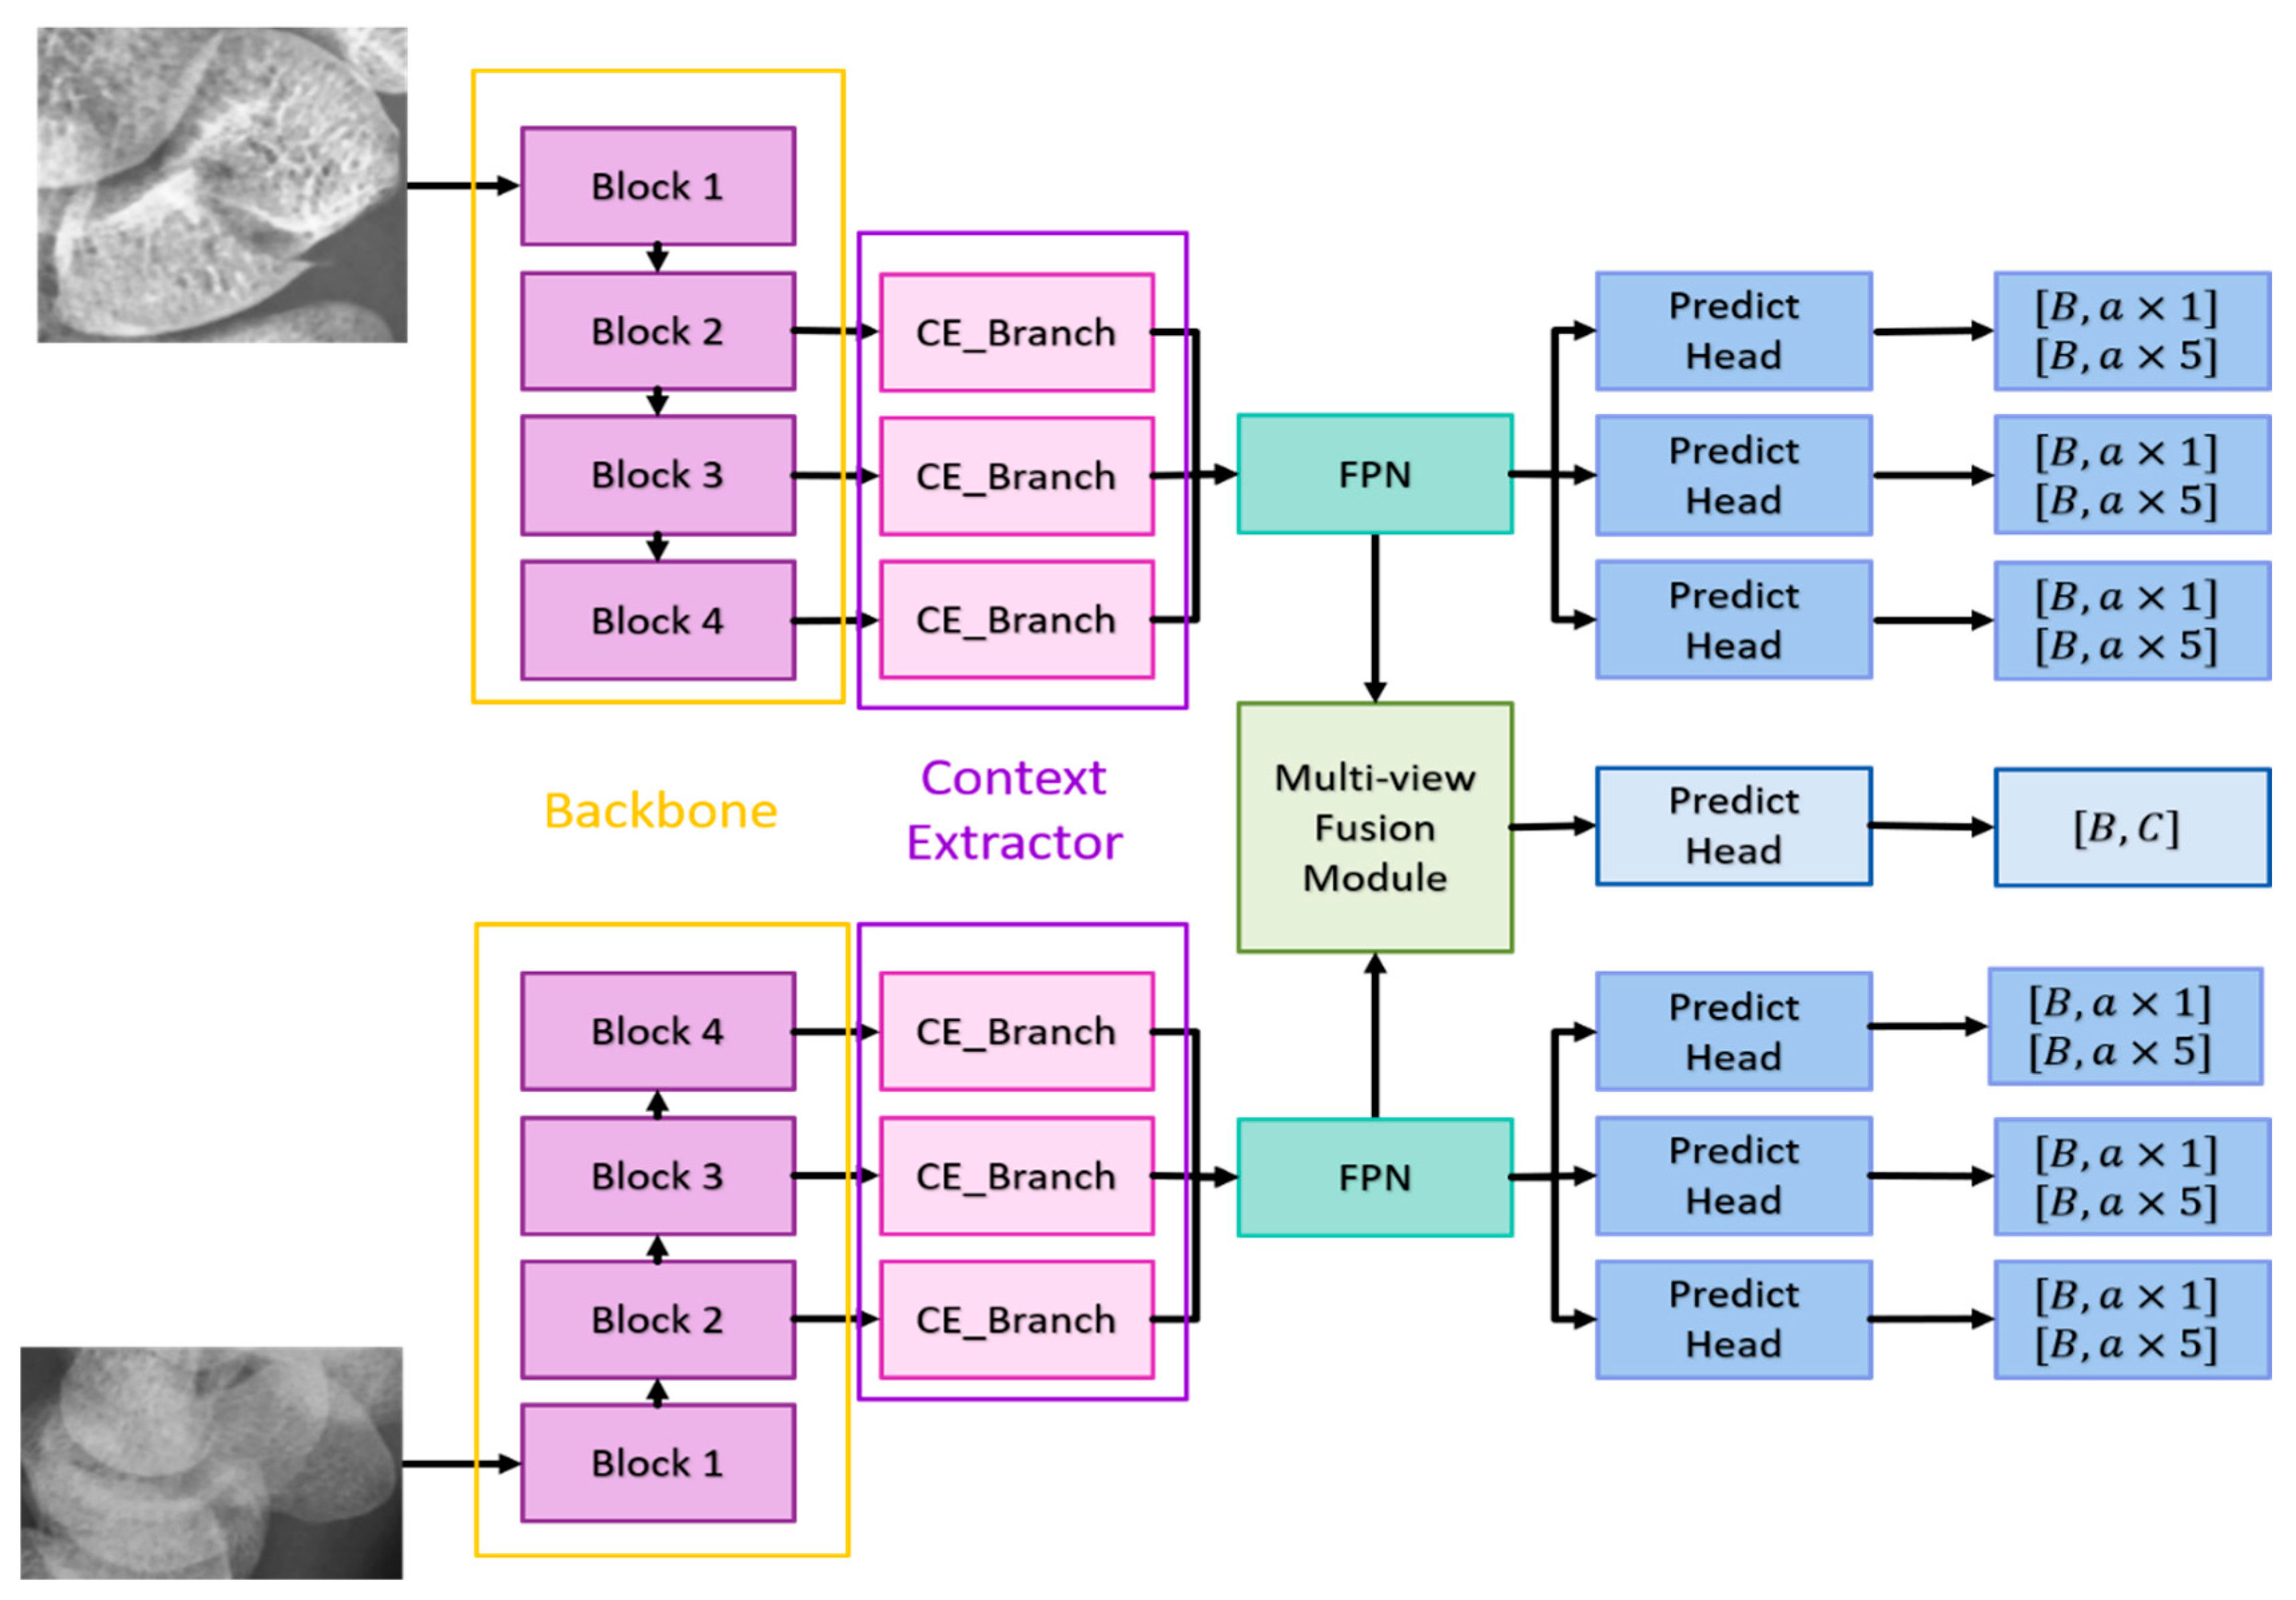
The following sections will detail the multi-view fusion model proposed in this article. Multi-view image techniques have shown promise in enhancing classification capabilities, particularly in clinical settings where accurately locating fractures is crucial. Effective fusion of multi-view data is essential to improving fracture detection beyond what can be achieved with 2D projection images alone. The model presented consists of four key components: the backbone network, the context extractor, the Feature Pyramid Network (FPN), and the multi-view fusion module, as illustrated in Figure 4.
Backbone Network: The anterior-posterior (AP) and lateral (LA) views are first processed through the backbone network to extract features. The backbone network must have a sufficiently large receptive field to capture meaningful features. Deeper networks like ResNet, which use residual connections to mitigate issues like gradient vanishing, are ideal. ResNet-152 was found to be the most effective in our experiments among ResNet-50, ResNet-101, and ResNet-152. It provides deep, high-quality features, with the last three blocks of ResNet-152 feeding into the context extractors.
Context Extractor: To address the challenge of detecting occult or non-displaced fractures, which can be camouflaged due to lighting or bone density variations, the context extractor expands the receptive field without pooling, using dilated convolutions. This approach, as demonstrated by Mei et al. [34], helps in extracting rich semantic features across a broader context. The context extractor is designed with four branches (as shown in Figure 5):
Each context extractor contains four context extraction branches, as shown in Figure 5. First, the 1 × 1 convolution compresses the number of channels to 1 / 4 of the original and then uses the k i × k i convolution and the 3 × 3 dilated convolution with a dilation rate of r i to extract context-aware features; where i represents the context extraction branch of i t h ;   k i 1,3 , 5,7 , r i 1,2 , 4,8 . Each convolutional layer is followed by a set of batch normalization layers and a ReLU. The output of i t h is added with the output of i + 1 t h to stack the different ranges of receptive fields together. Finally, the outputs of the four context extraction branches are concatenated together and use 1 × 1 convolution to integrate all features. Such a design enables the context extractor to obtain a wide range of rich perceptual features, enabling the model to have contextual reasoning capabilities and to see finer differences in feature maps.
Feature Pyramid Network (FPN): The FPN enhances the feature maps extracted from different scales by combining deep and shallow features, improving detection of small and medium-sized objects like the scaphoid bone.
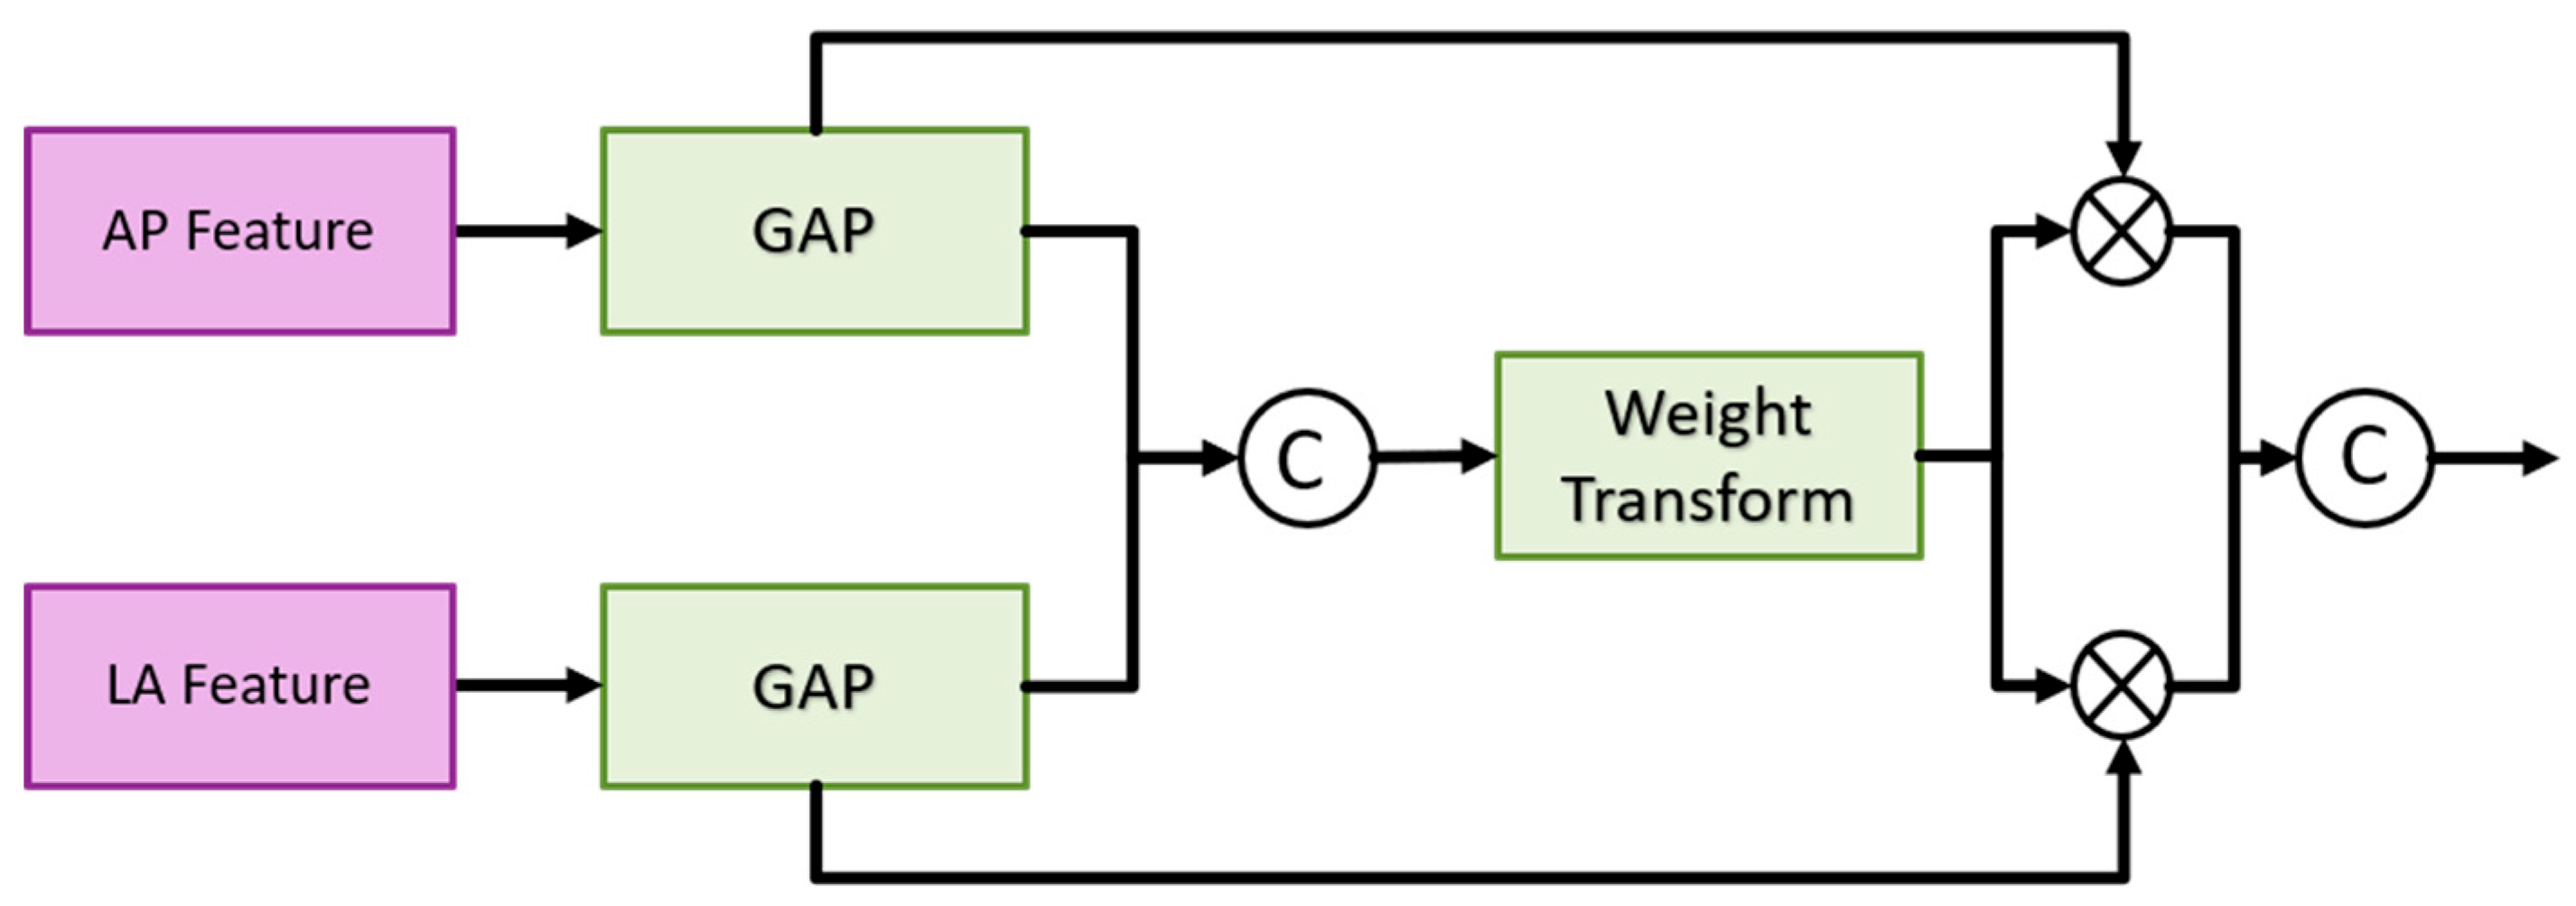
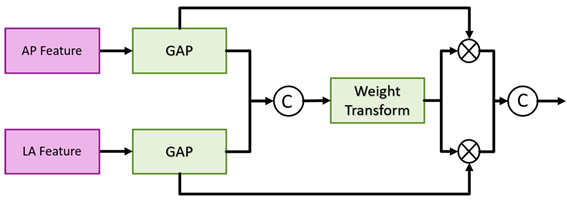
Multi-View Fusion Module: After feature extraction and context enhancement, the FPN outputs from the AP and LA views are fed into the multi-view fusion module. This module integrates features from both views to enhance fracture classification and detection accuracy. The multi-view fusion module uses the FPN features from the AP views and LA views for fusion, and the feature maps of the corresponding layers are input into the fusion block, as shown in Figure 6. The fusion block first performs global average pooling on the feature maps of the two views and outputs [B, C, 1, 1] to flatten the feature maps and concatenate them. Then the weight transform designed calculates the common important information of the two views, and then multiply this weight back to the respective views. Finally, the features of the two views are concatenated together for the final classification. The goal is to find as much of the fractured scaphoid region as possible, we add the output of i t h to the output of i + 1 t h , where i represents the ith fusion block. First use the global average pooling layer to flatten and concatenate the corresponding feature pyramid layers of two different views, then use the weight transform layer to calculate the common information of different views, and finally multiply the weights back to the features of different views and concatenate them.
Preprints 118654 i001
Figure 6. Multi-view fusion module architecture.
Preprints 118654 g006
Algorithm:
1) Feature Extraction: Both AP and LA views are processed through the backbone network to extract initial features.
2) Contextual Information: The context extractor refines these features by expanding the receptive field and integrating contextual information.
3) Feature Fusion: The FPN combines features from multiple scales to improve detection performance.
4) Final Classification and Detection: The multi-view fusion module combines features from both views to classify fractures and re-evaluate detection boxes for precise localization.
The model aims to improve the accuracy of fracture detection, particularly for occult and non-displaced fractures, by leveraging comprehensive multi-view information and advanced feature extraction techniques.
Most of the detection methods, regardless of one-stage or two-stage methods, only use a single scale for prediction. However. in order to extract better features, the depth of the model is often very deep that the loss of information on small objects. FPN can well combine the deep and shallow information, so that the feature map of each scale can be better used, and greatly improve the detection results of small objects. The ground-truth of the fractures in this article also belong to small objects, so a FPN is added after the context extractor. The structure here is the same as Faster R-CNN. First, the 1 × 1 convolution layer is used to adjust the number of channels of the input feature map to 256 , and then the i t h feature map is upsampled and added with i 1 t h feature maps, and finally the information is integrated through a 3 × 3 convolution.
Figure 7. Fusion block architecture in the multi-view fusion module.
Preprints 118654 g007
Weight transform is mainly used to combine information from AP views and LA views. It is too rough to classify the features directly after merging as mentioned above. In general, the importance of the AP view is higher than that of the LA view. Therefore, classification after direct concatenation may cause all the weights to be pulled away by the AP views and results in the loss of the features of the LA views. Therefore, we design a weight transform, which combines the features of the AP views and the LA views, calculates the common important information of the two views, and then multiplies them back to their respective views. In this way, the information of the LA views is preserved and avoided its weight being completely discarded. Equations (1) and (2) show the module construction by different feature map APi and LPi of scale i.
M u l t i v i e w F u s i o n M o d u l e = i = 0 l C ( A P i × W i , L A i × W i )
W i = S i g m o i d ( L ( R e L U L C G A P A P i , G A P L A i ) )
where l represents the number of layers of the feature pyramid; L represents the fully connection layer; C represents the concatenation, and the number of channels output by the two fully connected layers is 1 / 2 of the number of input channels.
The architecture of the detection branch in the second stage is a fully convolutional network. The classification of the detection branch and the prediction head of the detection is the same that consists of 3 × 3 convolutional layers, batch normalization layer, ReLU, and 3 × 3 convolutional layers. The number of output channels of the classification branch is A × C , and the number of channels of the detection branch is A × 5 . A and C represent the number of anchor boxes and categories, respectively, and 5 represents ( x , y , w , h , θ ) , representing the center point coordinates, width, high, and angle of the prediction box [22]. Each layer of the FPN has its prediction head, and finally, the results of each layer are merged to unify match with ground-truth and calculate the loss. The multi-view fusion classification branch consists of a fully connected layer, ReLU and a fully connected layer. The first fully connection layer input the refined features by the multi-view fusion module, and the output channel is half of the number of inputs. The output of the second fully connection layer is 2, indicating the probability of fracture and non-fracture.
To pass information to fracture detection in two different views through this classification branch, the classification results are re-scored the prediction boxes in the final prediction stage. In the most perfect case, both the classification score and the predicted box score will be close to 1, so when both branch predictions are at their highest, the sum is 2 and the smallest is 0. We take 0.5 as the threshold of the classification branch to keep the classification score greater than or equal to the threshold and set the classification score to 0 if it is smaller than the threshold. The purpose of this is to give priority to the classification results. Because the classification branch is directly using the multi-view feature, it can better distinguish whether the scaphoid is fractured or not. The formula of rescore is shown as Equation (3).
R e s c o r e = T h r e s h o l d S c o r e c l s , 0.5 + S c o r e d e t
The model in the second stage consists of three parts, namely the detector for AP views, the detector for LA views, and the classifier for multi-view fusion. The following will describe their loss functions respectively. The detector part is similar to Faster R-CNN, but regression an additional angle. First encode the ground truth box ( x , y , w , y , θ ) and prediction box ( x , y , w , h , θ ) as v = ( t x , t y , t w , t h , t θ ) and v = ( t x , t t , t w , t h , t θ ) , anchor box is expressed as x a , y a , w a , h a , θ a . v and v are defined as Equations (4) and (5):
t x = x x a w a , t y = y y a h a t w = l o g w w a , t h = l o g ( h h a ) t θ = 4 θ π
t x = x x a w a , t y = y y a h a t w = l o g w w a , t h = l o g ( h h a ) t θ = t a n h ( θ )
And use the S m o o t h L 1 loss to regress the positive samples, the S m o o t h L 1 loss is defined in Equation (6):
L r e g = 1 N p o s 1 N p o s S m o o t h L 1 ( v i v i )
The classification prediction head of the detection branch uses the Binary Cross Entropy loss as Equations (7) and (8):
L c l s = 1 N p o s i = 1 N B C E ( y i , p i )
B C E y , p = l o g p i f y = 1 l o g 1 p i f y = 0
Since the number of negative samples is much larger than that of positive samples, we divide the number of positive samples rather than the total number of samples to take the average, which can avoid the classifier from being affected by too many negative samples and can better solve the problem of sample imbalance. problems to improve the effectiveness of training. W h e r e N represents the number of total samples, and N p o s represents the number of positive samples. The loss function of multi-view fusion classification is the same as that of Faster R-CNN, and both use the Cross Entropy loss. The total loss is defined as Equation (9):
L = L A P c l s + L A P r e g + L L A c l s + L L A r e g + L m u l t i v i e w _ c l s

2.3. Training and Testing Database

This study is conducted in collaboration with National Cheng Kung University Hospital and utilizes a dataset of 180 wrist X-ray images, including both anterior-posterior (AP) and lateral (LA) views. The labels for these images include information on whether a fracture is present and the specific location of the fracture. All fractures identified in the dataset were confirmed through surgery, and their locations were accurately marked. The provided labeling program allows simultaneous annotation of both AP and LA views. Given that fractures can be oriented, traditional horizontal bounding boxes might cover non-fracture regions. To address this, oriented bounding boxes were used for labeling fractures. This approach allows for more precise annotation, as it better accommodates the orientation of fractures. Simultaneous labeling from two different views offers the advantage of cross-referencing, enabling doctors to annotate difficult-to-detect areas more effectively. This comprehensive labeling enhances the model’s ability to identify subtle differences, improving its detection of occult and non-displaced fractures.
The performance of the proposed method was assessed using five-fold cross-validation. In this approach, the dataset was divided into five subsets. Each subset served as a testing set while the remaining four subsets were used for training. Specifically, the training dataset consisted of approximately 140 images, including 60 images of fractures and 80 normal images, while the testing dataset comprised about 35 images, including 15 fracture images and 20 normal images, as illustrated in Figure 8. This cross-validation technique ensures that all data are utilized for both training and testing, helping to mitigate potential biases introduced by random data distribution. It provides a robust evaluation of the proposed method and model by ensuring that each data point is used in both training and testing phases, thereby improving the reliability of the performance metrics.

2.4. Metrics

The system setup includes Ubuntu 20.4, an Intel(R) Core(TM) i7-10700k CPU @ 3.80GHz, and an NVIDIA RTX 3090 graphics card. The deep learning framework employed is PyTorch 1.9.0. For scaphoid bone detection, the images are resized to 1400x1200 pixels, considering the aspect ratio and the average dimensions of arm X-ray images. Contrast Limited Adaptive Histogram Equalization (CLAHE) is used to improve contrast and highlight image details. The training involves 5000 iterations with a batch size of 1. The initial learning rate is 0.001, and Stochastic Gradient Descent (SGD) is the chosen optimizer, with a weight decay of 0.0001 and a momentum of 0.9. Data augmentation includes random horizontal flipping and random contrast adjustment. Additionally, to accommodate varying contrast levels observed in the images provided by doctors, random contrast adjustment is used during training to enhance adaptability.
In the second stage of fracture detection and classification, the images are resized to 256x256 pixels, and CLAHE is applied again for contrast adjustment. The entire training process consists of 1,500 iterations with a batch size of 12. The initial learning rate is set to 0.0001, and the optimizer used is Adam with a weight decay of 0.0001. The training process also includes random horizontal flipping and random contrast adjustment for data augmentation. The designed anchor boxes have aspect ratios of 1, 1.15, 2, 2.25, and 3, and scales of 1, 21/5, 22/5, 23/5, and 24/5, with sizes of 9×9, 4×4, and 1×1 pixels.
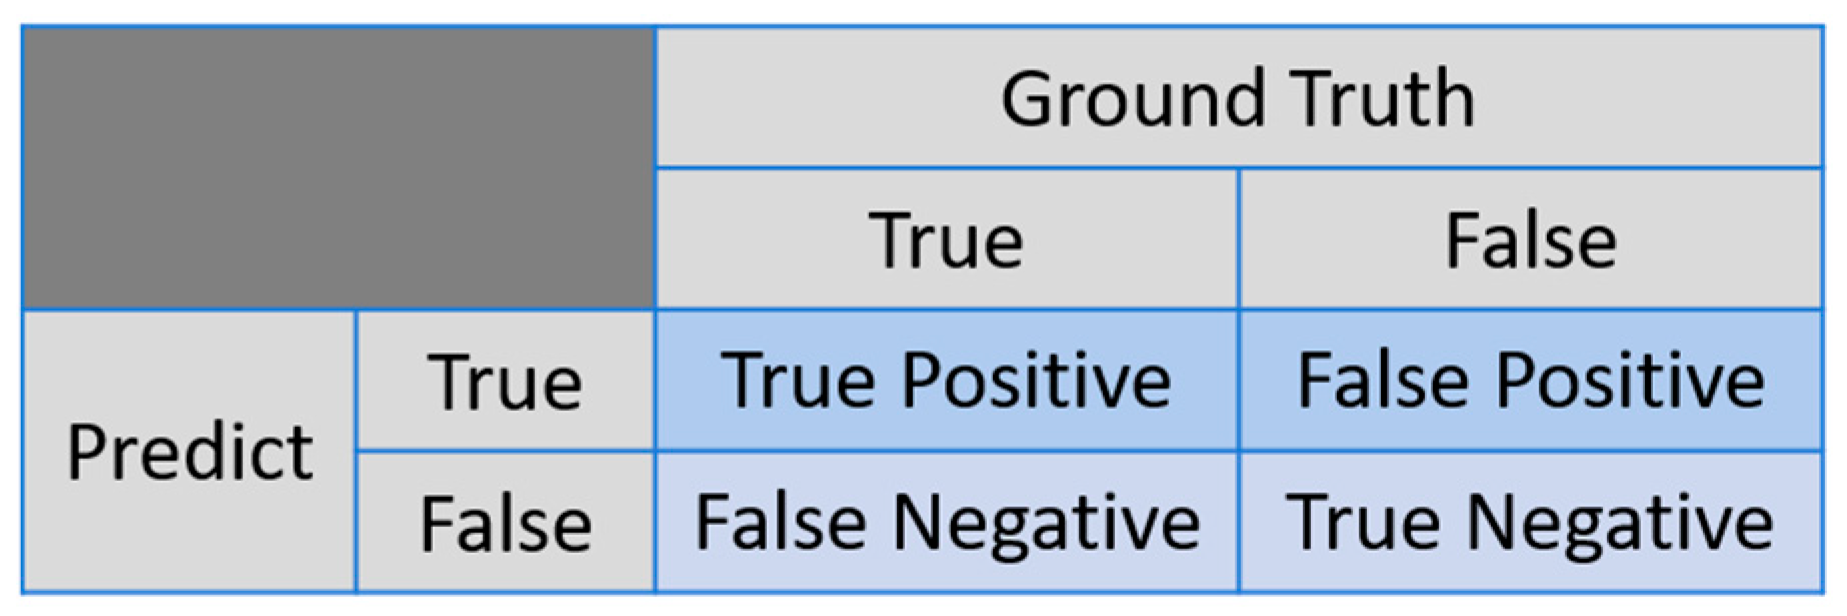
In the classification task, we evaluate the results using a confusion matrix, which is a matrix with the x-axis representing the ground truth and the y-axis representing the model predictions. The matrix is divided into True Positive (TP), False Positive (FP), True Negative (TN), and False Negative (FN) categories based on the actual and predicted outcomes. The confusion matix can be shown in Figure 9. We use traditional evaluation metrics to assess the results, which include Accuracy, Recall and Precision. These metrics are defined as follows:
A c c u r a c y = T P + F N T P + F P + T N + F N
R e c a l l = T P T P + F N
P r e c i s i o n = T P T P + F P
I o U = A B A B
Accuracy represents the overall proportion of correct predictions. Recall (also known as Sensitivity or the True Positive Rate) is the ratio of patients correctly predicted by the model to the total number of actual patients. Precision is the ratio of patients correctly predicted by the model to all instances predicted as patients. Specificity (or the True Negative Rate) indicates the proportion of non-patients correctly identified by the model. IoU (Intersection over Union) measures the overlap ratio between the ground-truth box and the predicted box.
In the first stage of scaphoid detection, we evaluate using accuracy, recall, precision, and IoU. In the second stage, fracture detection is assessed using the same four metrics as in the first stage. For classification, we use five metrics: accuracy, recall, precision, sensitivity, and specificity.

3. Results

Table 1 shows the results of scaphoid detection, indicating that Faster R-CNN outperforms YOLOv4. Although YOLOv4, a one-stage method, also yields good results with a recall of 97.50% and an accuracy of 100.0%, the two-stage Faster R-CNN method achieves superior performance in the scaphoid bone detection task, with both recall and precision at 100%.
Ablation experiments are conducted to evaluate the model proposed in this study, focusing on single AP view versus multi-view comparisons, the utility of the context extractor, and the effectiveness of the re-scoring strategy. The experimental procedure is incrementally stacked in three stages - 1)Single-View and Multi-View Comparisons: This initial experiment does not include context extractors or re-scoring strategies. 2) Context Extractor Utility: The second experiment compares the utility of the context extractor in a multi-view setup. This experiment shows improved performance compared to the first, but does not include the re-scoring strategy. 3) Re-Scoring Strategy: The third experiment evaluates the re-scoring strategy in conjunction with the multi-view context extractor, demonstrating better performance than the second experiment.
As noted earlier, relying solely on AP views for fracture detection and classification overlooks lateral information, which can make it challenging to detect certain fractures in X-ray images, such as non-displaced or occult fractures. In this subsection, we validate the second-stage fracture detection and classification by comparing single-view and multi-view approaches. The model structure for single AP view is similar to that for multi-view, with the primary difference being whether the classification branch utilizes the multi-view fusion module. The single AP view model uses Global Average Pooling (GAP) to flatten and combine features from different layers via Feature Pyramid Networks (FPN).
Although the accuracy of the classification branch did not change significantly, precision decreased by 12.25%, while recall increased by 14.41% shown as Table 2. This suggests that using multi-view approaches results in more balanced recall and precision, indicating overall better performance. When using a single AP view, the model tends to classify most scaphoid cases as normal, resulting in higher precision but lower recall. In contrast, the multi-view approach achieves better accuracy and significantly improved recall, allowing the model to better identify less apparent scaphoid fractures.
Table 3 shows that the fracture detection results of using the AP view, LA view and multi-view. Although precision of multi-view methods is reduced by 7.15%, accuracy and recall are improved by 4.44% and 17.75%, respectively. These results indicate that the model is better at distinguishing non-displaced or occult fractures. For the LA view, the fracture detection branch shows improvements across all three metrics: accuracy increased by 4.56%, recall by 0.7%, and precision by 3.15%. As demonstrated by the results in the tables, the multi-view approach consistently outperforms the single AP view, whether for classification or fracture detection.
As mentioned earlier, doctors diagnose fractures by examining the continuity of the scaphoid edge. This requires comprehensive information about the entire scaphoid bone. To address this, we introduced context extractors to help the model capture more detailed information. Table 4 displays the performance of the context extractor. The experimental results indicate that adding the context extractor improves the performance of each model branch, as it allows for the extraction of more complete global features through dilated convolutions of varying sizes. This enhancement helps the model better account for variations in lighting, shadows, or bone densities.
Table 5 display the results of scaphoid detection in the AP and LA views during the first stage by using Faster RCnn. The table show that scaphoid detection achieves 100% accuracy in both views, with a high enough IoU even when the LA view is occluded. This demonstrates that the two-stage detector performs well, and even small objects can be detected effectively when combined with the FPN.
Table 6 and Table 7 present the results of the final five-fold cross-validation for the second-stage fracture classification using both the original single AP view and the multi-view fusion model. The accuracy of the classification branch increased by 2.25%, and the recall rate improved significantly by 12.07%. While the increase in accuracy is modest, the model now correctly identifies a larger number of fractured scaphoid bones that were previously classified as normal, leading to a substantial improvement in recall.
Table 6 and Table 7 indicate that accuracy for the two views improved by 6.16% and 14.07%, respectively. Recall improved by 26.58% and 21.23%, while precision for the LA view increased by 11.24%, and precision for the AP view decreased by 12.61%. These results suggest that information transfer between views through the classification branch gradient is effective. Despite a decrease in precision for AP views, the significant improvement in recall highlights the model’s enhanced ability to detect fracture areas.
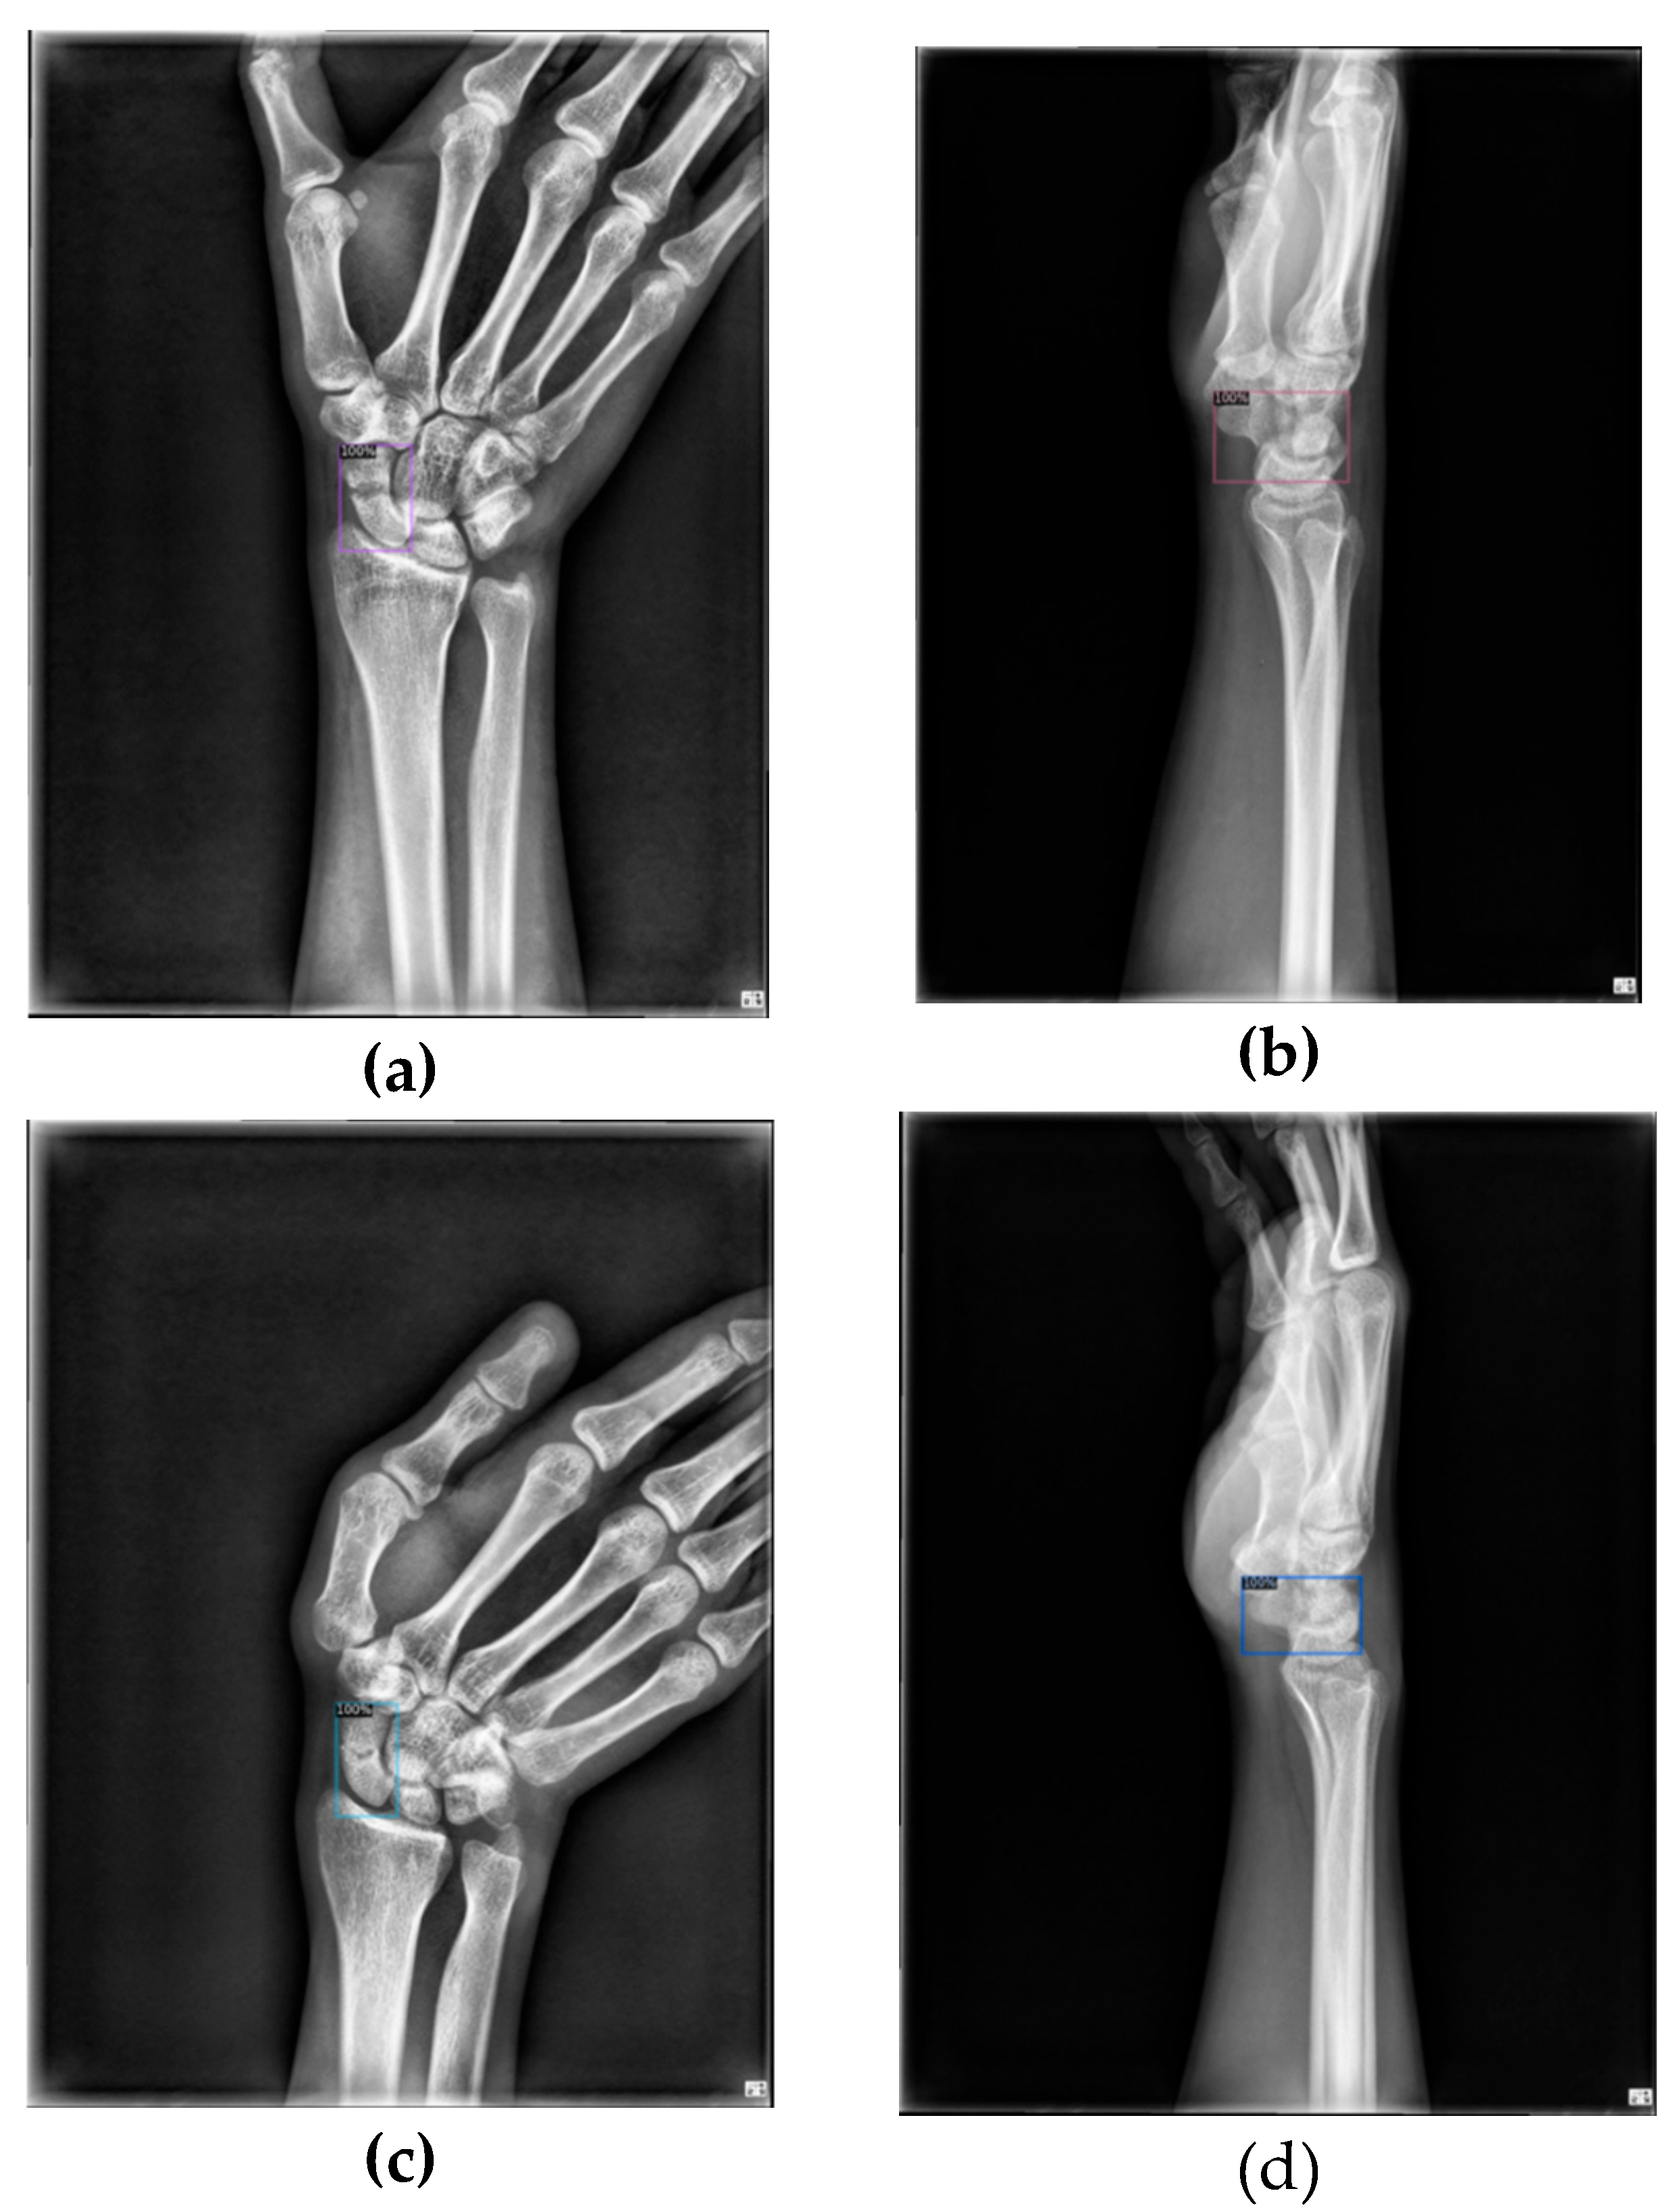
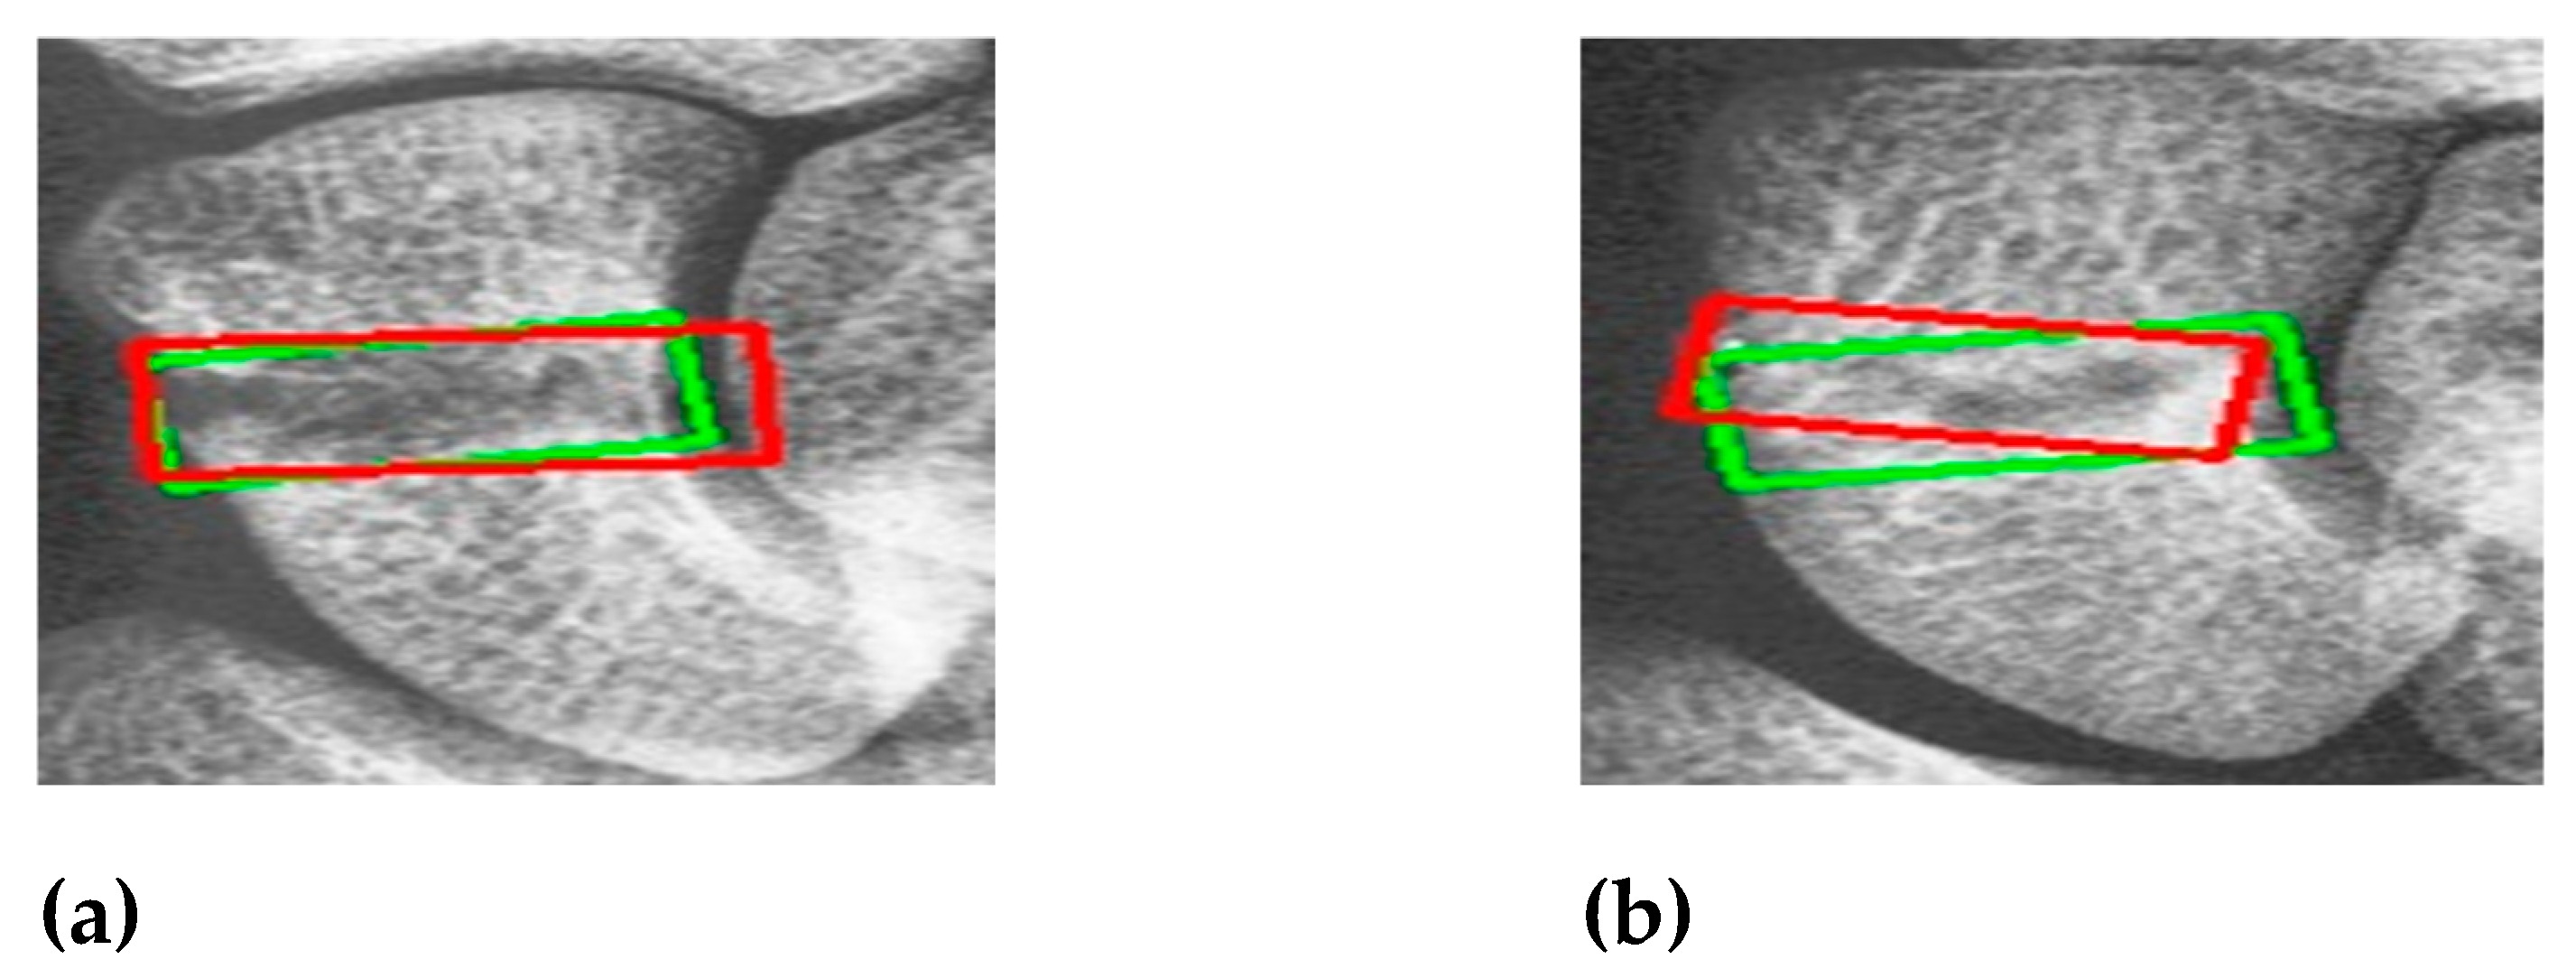
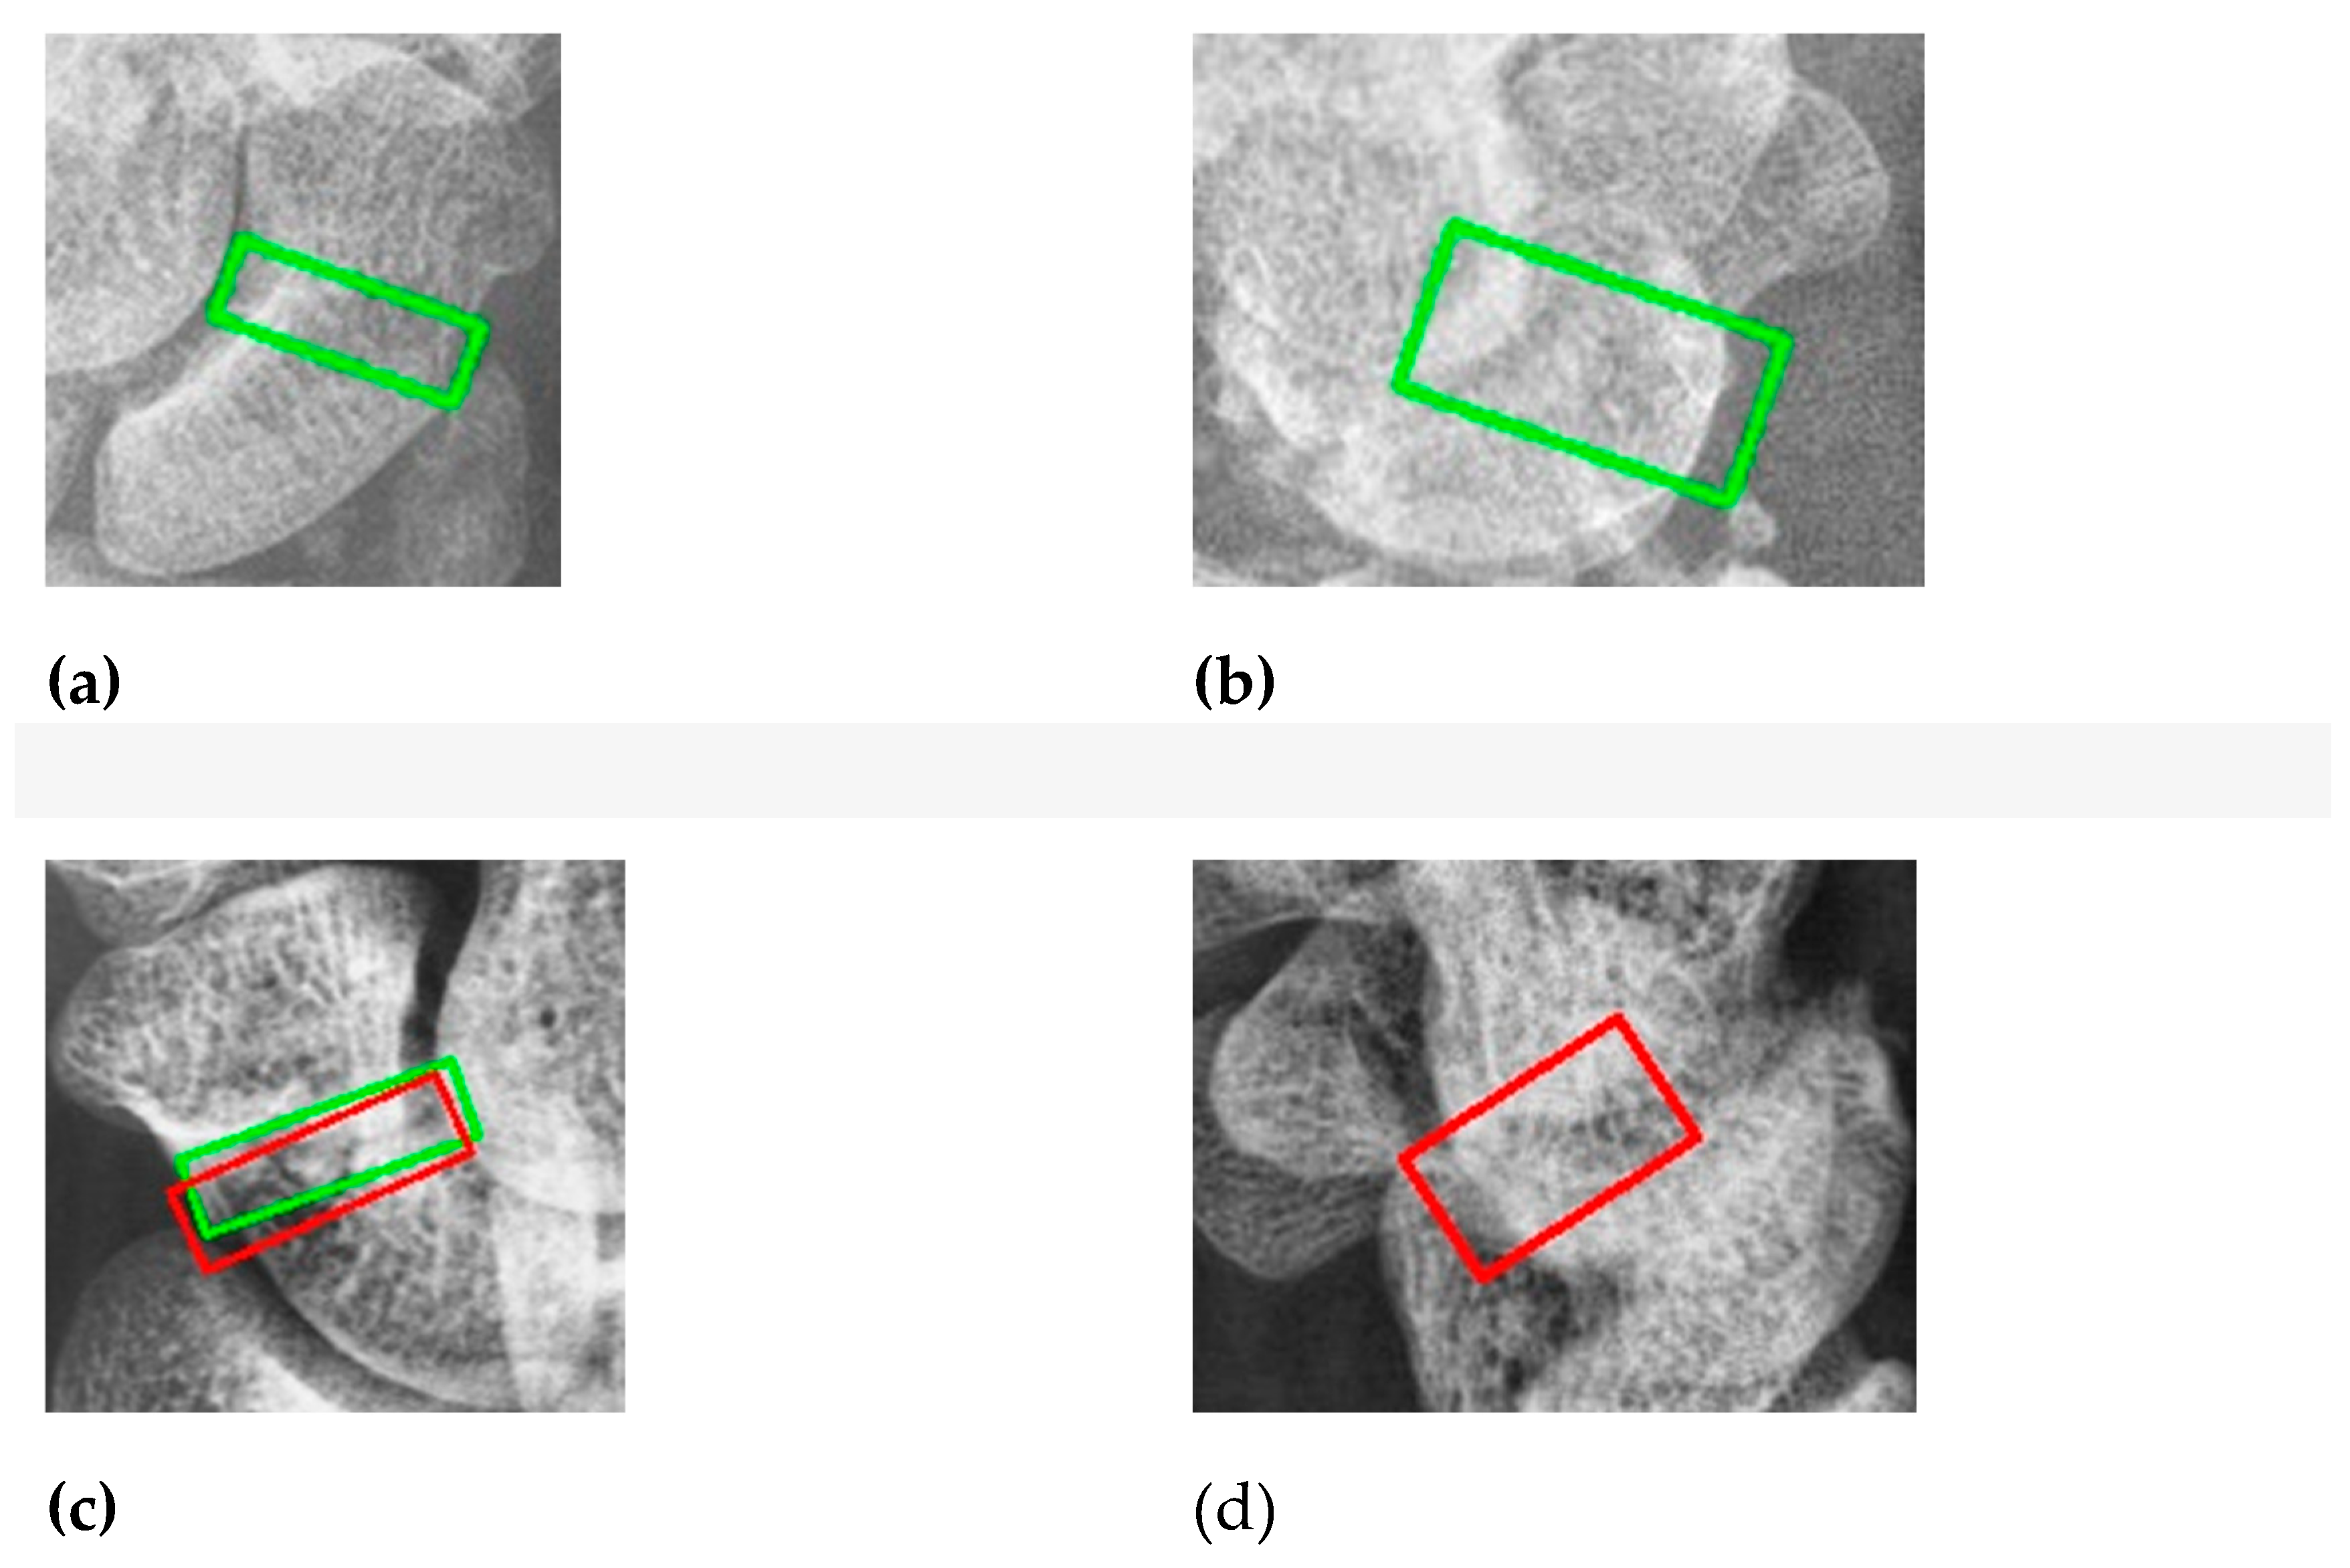
Figure 10 shows the results of scaphoid fracture detection. In the figure, the red area represents the ground-truth box labeled by the doctor, while the green area shows the result predicted by the model. Figure 11 provides an example of a more obvious fracture, whereas Figure 12 illustrates an example of an occult fracture. These examples highlight the challenges in diagnosing scaphoid fractures, as occult fractures are difficult to distinguish with the naked eye. The AP views demonstrate a relatively high IoU, while the LA views also accurately locate the fracture area. This combined approach is effective in drawing the doctor’s attention to the area, enabling quicker identification of the fracture location.

4. Discussion

The article proposes a multi-view-based method for the classification and detection of scaphoid fractures. In this chapter, we address some limitations and ideas encountered during the experiments.
One challenge is the method used for labeling fractures. As mentioned earlier, fractures are confirmed by surgery, and labeled areas are identified using images from two different views simultaneously. This method may include fractured areas visible in only one view and not detectable in another. Despite this, the model learns the correspondence between views during training, enabling it to identify subtle differences between occult fractures and normal scaphoid bones. Consequently, the multi-view fusion model proposed in this study significantly improves the recall rate in both the fracture classification and detection branches.
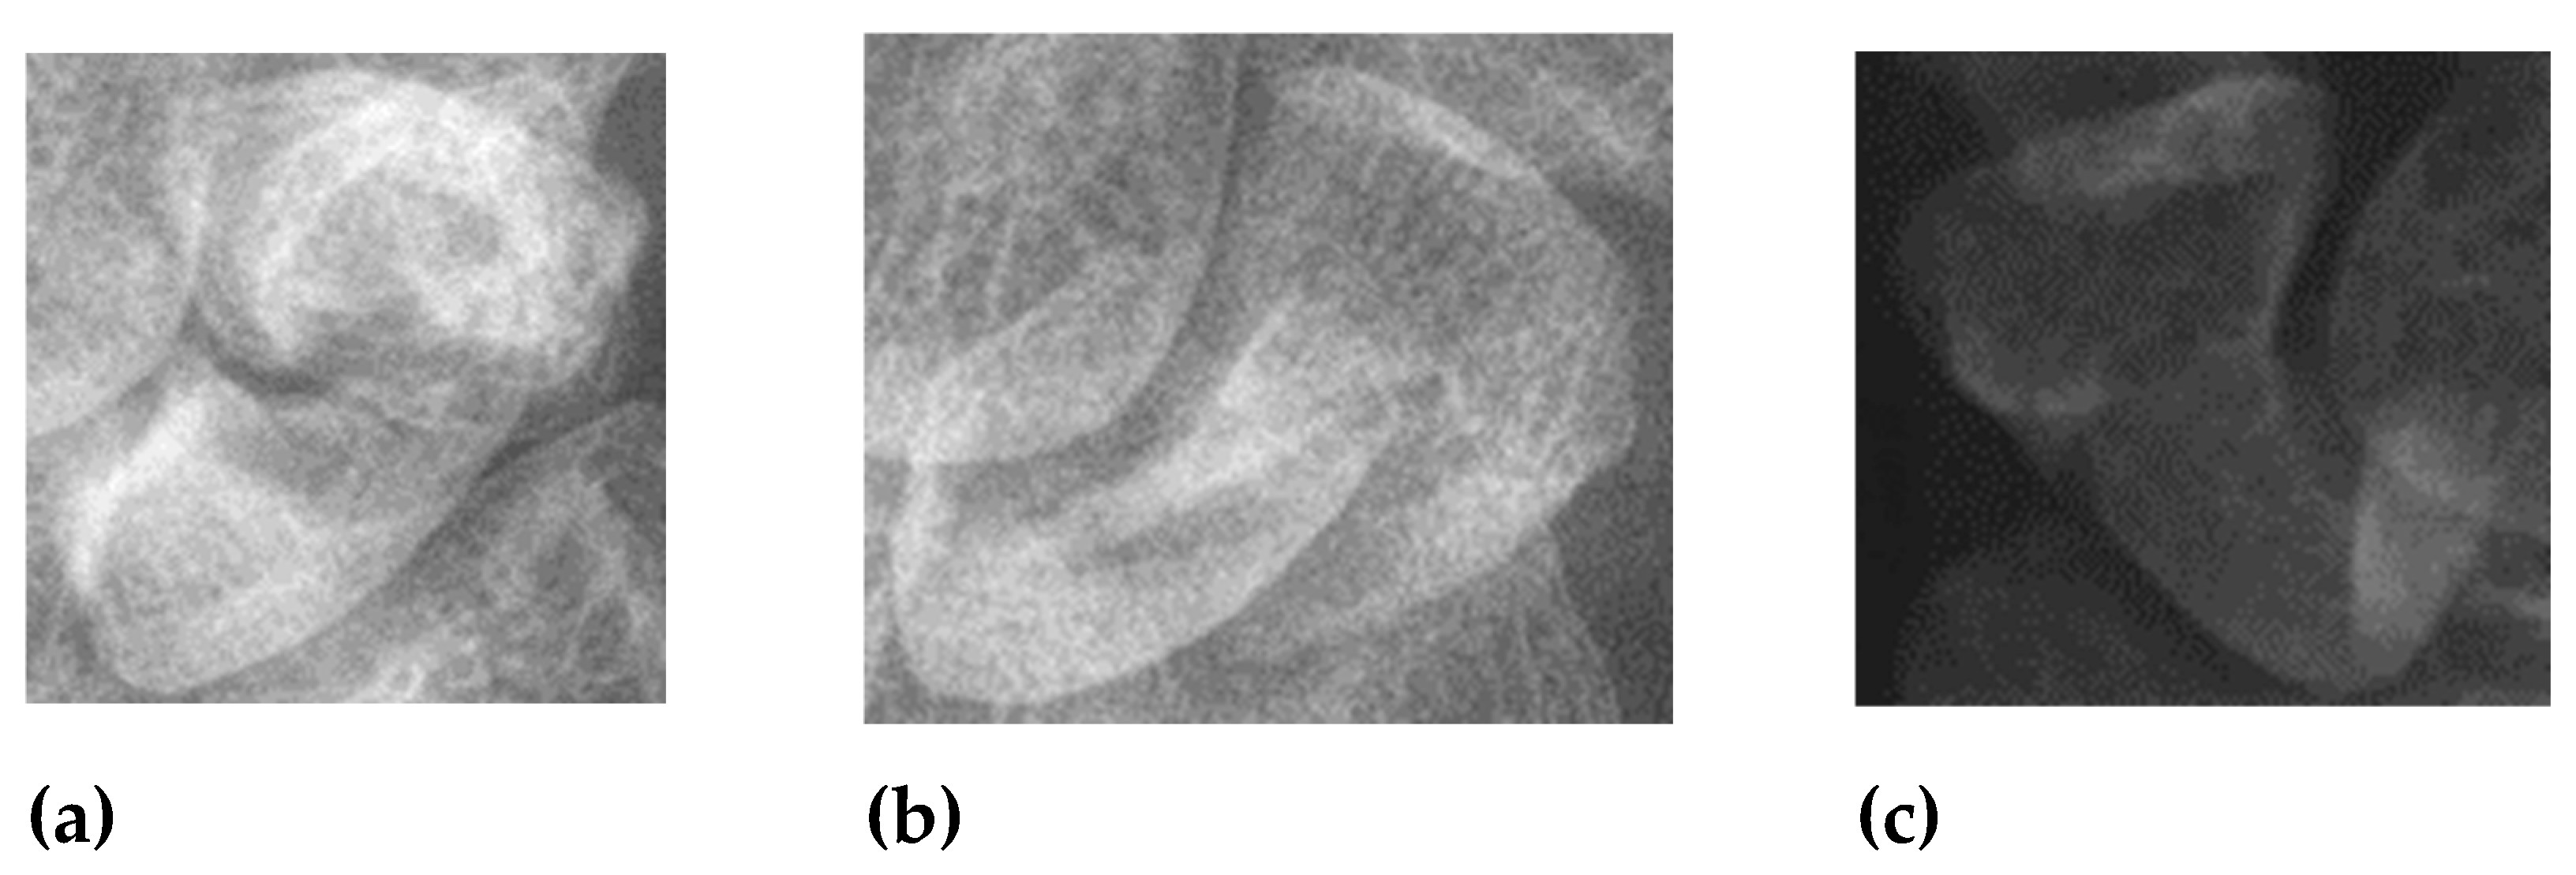
Another issue is the quality of X-ray images. Although all images are from the same hospital, variations in shooting parameters and environmental conditions affect image quality. Some images suffer from poor detail, contrast, or improper film darkness. Variations in the distance between the arm and the sensor lead to differences in scaphoid bone slice size and resolution after resizing. Additionally, severe fractures, bone changes over time, and imaging artifacts from arthritis can complicate the training process. High-quality images are challenging to obtain due to these variances in patient conditions and imaging practices. Figure 13 illustrates examples of poor-quality images.
Study [17] mentions eight conditions that lead to image rejection, such as unclear ground truth or contradictory radiologic diagnoses. In our dataset, images were annotated by an orthopedic surgeon but not reviewed by a radiologist, which may include images of patients or non-patients with similar characteristics, complicating the training process.
Figure 14 shows examples of prediction errors. The first row displays a false positive where a non-patient is mistakenly classified as having a fracture due to similar characteristics. The second row shows a patient where the LA view resembles a normal scaphoid, resulting in no identifiable fracture area. Expanding the dataset could mitigate these issues.
Our study reveals that the classification branch outperforms the fracture detection branch in terms of performance. This is expected as the classification branch utilizes features from both views, while object detection is inherently more challenging. We aimed to enhance the detection branch using information from the classification branch by incorporating classification scores into the detection process. Despite these adjustments, a performance gap remains because classification scores lack spatial information crucial for detection tasks.
To address this, we experimented with the attention mechanism to extract important spatial features, multiplying them with classification scores to obtain spatial weights and enhance feature maps. Additionally, we added a prediction heat map branch to capture important spatial regions. However, these methods primarily accelerated model convergence during training and did not significantly improve performance in testing, likely due to overfitting from the small dataset.

5. Conclusions

In this article, we propose a high-performance automated scaphoid fracture diagnosis system that integrates information from both AP and LA views. The system provides an image-level classification to determine if the scaphoid is fractured and identifies the fracture location in both views. We enhance the detection network for both views by incorporating a multi-view classification branch that merges features from both views. During training, this fusion indirectly transfers information between views, improving the performance of both the classification branch and fracture detection results. This approach, particularly in terms of recall, allows the model to more confidently identify fracture locations by supplementing information from the other view. In the feature extraction stage, we introduce a context extractor with a broad receptive field. This module captures global information, enhancing the model’s understanding of the entire scaphoid bone and making it easier to detect subtle differences in similar environments. Experimental results show improved performance with this module. Additionally, we propose a multi-view feature fusion module akin to the Feature Pyramid Network (FPN). This module combines features from two views, aligning them according to their corresponding layers and adding them layer by layer. We use a simple weight transform to balance the information between views and prevent information dilution. In the prediction stage, a re-scoring strategy is applied by incorporating the classification score into the anchor box score. This approach aims to identify potential fracture areas more effectively, especially in regions that may indicate occult fractures. The automated scaphoid fracture detection system demonstrates strong performance, assisting doctors in diagnosing scaphoid fractures more efficiently. It not only classifies whether the scaphoid is fractured but also provides insights into the likely fracture areas from both views. Despite the good performance achieved in this study, information from different views is still passed indirectly. As discussed earlier, multi-view techniques in medicine are typically used for classification tasks or 3D reconstruction, not direct detection. While our approach significantly improves recall, it does not substantially enhance overall accuracy due to the indirect nature of information transfer.

Acknowledgments

The authors thank the National Science Techology Council, ROC (project numbered: 111-2221-E-006 -233 -MY3 and 113-2218-E-006 -022) for supporting this work, which was clinically reviewed under Institutional Review Board No. B-ER-110-528.

References

  1. Gibney, B., et al., Incorporating cone-beam CT into the diagnostic algorithm for suspected radiocarpal fractures: a new standard of care? American Journal of Roentgenology, 2019. 213(5): p. 1117-1123. [CrossRef]
  2. Bochkovskiy, A., C.-Y. Wang, and H.-Y.M. Liao, Yolov4: Optimal speed and accuracy of object detection. arXiv preprint arXiv:2004.10934, 2020.
  3. Lin, T.-Y., et al. Focal loss for dense object detection. in Proceedings of the IEEE international conference on computer vision. 2017.
  4. Tian, Z., et al. Fcos: Fully convolutional one-stage object detection. in Proceedings of the IEEE/CVF international conference on computer vision. 2019.
  5. Ren, S., et al., Faster r-cnn: Towards real-time object detection with region proposal networks. Advances in neural information processing systems, 2015. 28.
  6. Cai, Z. and N. Vasconcelos. Cascade r-cnn: Delving into high quality object detection. in Proceedings of the IEEE conference on computer vision and pattern recognition. 2018.
  7. He, K., et al. Deep residual learning for image recognition. in Proceedings of the IEEE conference on computer vision and pattern recognition. 2016.
  8. Huang, G., et al. Densely connected convolutional networks. in Proceedings of the IEEE conference on computer vision and pattern recognition. 2017.
  9. Tan, M. and Q. Le. Efficientnet: Rethinking model scaling for convolutional neural networks. in International conference on machine learning. 2019. PMLR.
  10. Liu, W., et al. Ssd: Single shot multibox detector. in European conference on computer vision. 2016. Springer.
  11. Kong, T., et al., Foveabox: Beyound anchor-based object detection. IEEE Transactions on Image Processing, 2020. 29: p. 7389-7398. [CrossRef]
  12. Qian, Y., et al. R-CNN Object Detection Inference With Deep Learning Accelerator. in 2018 IEEE/CIC International Conference on Communications in China (ICCC Workshops). 2018. IEEE.
  13. He, K., et al. Mask r-cnn. in Proceedings of the IEEE international conference on computer vision. 2017.
  14. Yadav, D. and S. Rathor. Bone fracture detection and classification using deep learning approach. in 2020 International Conference on Power Electronics & IoT Applications in Renewable Energy and its Control (PARC). 2020. IEEE.
  15. Raisuddin, A.M., et al., Critical evaluation of deep neural networks for wrist fracture detection. Scientific projects, 2021. 11(1): p. 1-11.
  16. Hu, J., L. Shen, and G. Sun. Squeeze-and-excitation networks. in Proceedings of the IEEE conference on computer vision and pattern recognition. 2018.
  17. Yoon, A.P., et al., Development and validation of a deep learning model using convolutional neural networks to identify scaphoid fractures in radiographs. JAMA network open, 2021. 4(5): p. e216096-e216096. [CrossRef]
  18. Selvaraju, R.R., et al. Grad-cam: Visual explanations from deep networks via gradient-based localization. in Proceedings of the IEEE international conference on computer vision. 2017.
  19. Lindsey, R., et al., Deep neural network improves fracture detection by clinicians. Proceedings of the National Academy of Sciences, 2018. 115(45): p. 11591-11596.
  20. Chen, H., et al. Anatomy-aware siamese network: Exploiting semantic asymmetry for accurate pelvic fracture detection in x-ray images. in European Conference on Computer Vision. 2020. Springer.
  21. Lee, C., et al., Classification of femur fracture in pelvic X-ray images using meta-learned deep neural network. Scientific projects, 2020. 10(1): p. 1-12.
  22. Tai-HuaYang, Ming-Huwi Horng, Rong-Shiang Li and Yung-Nien Sun. Scaphoid Fracture Detection by Using Convolutional Neural Network, Diagnostics 2022, 12(4), 895. [CrossRef]
  23. Luo, K., et al. Attention-aware multi-view stereo. in Proceedings of the IEEE/CVF Conference on Computer Vision and Pattern Recognition. 2020.
  24. Lin, T.-Y., et al. Microsoft coco: Common objects in context. in European conference on computer vision. 2014. Springer.
  25. Yu, F. and V. Koltun, Multi-scale context aggregation by dilated convolutions. arXiv preprint arXiv:1511.07122, 2015.
  26. Peng, S., et al. Multi-View Weighted Feature Fusion Using CNN for Pneumonia Detection on Chest X-Rays. in 2020 IEEE International Conference on E-health Networking, Application & Services (HEALTHCOM). 2021. IEEE.
  27. Khan, H.N., et al., Multi-view feature fusion based four views model for mammogram classification using convolutional neural network. IEEE Access, 2019. 7: p. 165724-165733. [CrossRef]
  28. Li, Y., et al., Automated Multi-View Multi-Modal Assessment of COVID-19 Patients Using Reciprocal Attention and Biomedical Transform. Frontiers in public health, 2022. 10.
  29. Wang, Y., et al. Detr3d: 3d object detection from multi-view images via 3d-to-2d queries. in Conference on Robot Learning. 2022. PMLR.
  30. Wang, G., et al., Multi-view adaptive fusion network for 3d object detection. arXiv preprint arXiv:2011.00652, 2020.
Figure 1. The location of the scaphoid bone. The scaphoid bone is within the red box.
Preprints 118654 g001
Figure 2. Scaphoid bone fractures under different conditions that are (a) Occult fracture; (b) Non-displaced fracture (hairline crack); (c) Displaced fracture.
Preprints 118654 g002
Figure 3. System Overview.
Preprints 118654 g003
Figure 4. Overview of the multi-view fusion model.
Preprints 118654 g004
Figure 5. Context Extraction.
Preprints 118654 g005
Figure 8. Experimental data set.
Preprints 118654 g008
Figure 9. Confusion Matrix.
Preprints 118654 g009
Figure 10. Scaphoid detection visualization. (a), (b) and (c), (d) represent the AP and LA views of the same patient, respectively. The first row is the ground truths, and the second row is predicted result.
Preprints 118654 g010
Figure 11. Fracture detection visualization. (a) and (b) the scaphoid bone slices. The red box is the true answer, and the green box is the predicted result.
Preprints 118654 g011
Figure 12. Occult fracture detection visualization. (a) and (b) the scaphoid bone slices. The red box is the true answer, and the green box is the predicted result.
Preprints 118654 g012
Figure 13. Poor quality image. (a) Light and shadow problems (b) Too severe displaced fractures. (c) Image with poor contrast.
Preprints 118654 g013
Figure 14. An example of false positive and false negative.
Preprints 118654 g014
Table 1. Results of the one-stage and two-stage detection methods for scaphoid detection.
Method Recall Precision
YOLO V4 97.50% 100.0%
Faster RCNN* 100.0% 100.0%
Table 2. Comparison of single AP view and multi-view on classification branch.
Method Accuracy Recall Precision Sensitivity Specificity
Single AP view 87.69% 75.26% 96.92% 75.26% 98.00%
Multi-view 87.65% 89.67% 84.67% 89.67% 86.00%
Table 3. Comparison of single-view and multi-view on detection branch.
Branch Method IoU Accuracy Recall Precision
AP Single AP view 0.5637 81.00% 58.25% 98.00%
Multi-view 0.5509 85.44% 76.00% 90.85%
LA Single LA view 0.4466 69.76% 56.06% 77.50%
Multi-view 0.4697 74.32% 56.76% 80.65%
Table 3. Scaphoid detection results in AP and LA views.
Method IoU Accuracy Recall Precision
AP 0.8662 100.0% 100.0% 100.0%
Average 0.8478 100.0% 100.0% 100.0%
Table 4. Results of context extractor on three branches in multi-view. (X: no used; V:used).
Branch CE IoU Accuracy Recall Precision
Classification X 87.65% 89.36% 84.67%
V 89.94% 87.33% 90.36%
AP Detection X 0.5509 85.44% 76.00% 90.85%
V 0.5109 86.57% 82.25% 87.45%
LA Detection X 0.4697 74.32% 56.76% 80.65%
V 0.4276 79.89% 64.44% 88.19%
Table 6. Results of five-fold cross-validation of fracture classification on initial single-view and multi-view fusion models. (S: single AP view, M: Multi-view).
Fold Method Accuracy Recall Precision Sensitivity Specificity
Fold 1 S 91.67% 81.25% 100.0% 81.25% 100.0%
Mi 91.67% 87.50% 93.33% 87.50% 95.00%
Fold 2 S 91.67% 81.25% 100.0% 81.25% 100.0%
M 94.44% 87.50% 100.0% 87.50% 100.0%
Fold 3 S 91.67% 84.21% 100.0% 84.21% 100.0%
M 86.11% 93.75% 78.95% 93.75% 80.00%
Fold 4 S 80.56% 56.25% 100.0% 56.25% 100.0%
M 88.89% 81.25% 92.86% 81.25% 95.00%
Fold 5 S 82.86% 73.33% 84.62% 73.33% 90.00%
M 88.57% 86.67% 86.67% 86.67% 92.00%
Average S 87.69% 75.26% 96.92% 75.26% 98.00%
M 89.94% 87.33% 90.36% 87.33% 92.00%
Table 7. Results of five-fold cross-validation of fracture detection of AP view on initial single-view and multi-view fusion models. (S: single AP view, M: Multi-view).
Fold Method IoU Accuracy Recall Precision
Fo1d 1 S 0.6037 86.11% 68.75% 100.0%
M 0.5608 88.89% 93.75% 83.33%
Fold2 S 0.5315 80.56% 56.25% 100.0%
M 0.5657 88.89% 87.50% 87.50%
Fold 3 S 0.5231 77.78% 50.00% 100.0%
M 0.4941 86.11% 87.50% 77.78%
Fold 4 S 0.6248 80.56% 56.25% 100.0%
M 0.5994 83.33% 68.75% 91.67%
Fold 5 S 0.5353 80.00% 60.00% 90.00%
M 0.5219 88.57% 86.67% 86.67%
Average S 0.5637 81.00% 58.25% 98.00%
M 0.5784 87.16% 84.83% 85.39%
Disclaimer/Publisher’s Note: The statements, opinions and data contained in all publications are solely those of the individual author(s) and contributor(s) and not of MDPI and/or the editor(s). MDPI and/or the editor(s) disclaim responsibility for any injury to people or property resulting from any ideas, methods, instructions or products referred to in the content.
Copyright: This open access article is published under a Creative Commons CC BY 4.0 license, which permit the free download, distribution, and reuse, provided that the author and preprint are cited in any reuse.
Prerpints.org logo

Preprints.org is a free preprint server supported by MDPI in Basel, Switzerland.

Subscribe

© 2024 MDPI (Basel, Switzerland) unless otherwise stated