1. Introduction
Prediabetes represents a significant medical and public health concern and is characterized by impaired fasting glucose and/or impaired glucose tolerance[
1], but not to the degree that is diagnostic of type-2 diabetes. Statistics reveal that over 98 million American adults, more than one-third of the population, are affected by prediabetes[
2]. Prediabetes predisposes individuals to an elevated risk of developing type 2 diabetes, as well as cardiovascular complications such as heart disease and stroke[
2]. Notably, over 80% of individuals with prediabetes are unaware of their condition[
2] which could put them at greater risk of progression and related complications. The annual rate of progression from prediabetes to type 2 diabetes is estimated to be around 5-10%[
3]. The remaining lifetime risk of progressing from prediabetes to overt diabetes at age 45 is reported as high as 57.5% for individuals meeting the American Diabetes Association (ADA) criteria for prediabetes[
4]. Early identification and management of prediabetes are crucial to reduce the risk of progressing to type 2 diabetes and associated complications. Lifestyle changes, particularly those focused on diet and physical activity, are among the most effective interventions for better blood glucose control and prevention of related complications[
5,
6,
7,
8,
9]; however, overly restrictive dietary recommendations are often not sustainable in the long term. It has been reported that only a small fraction of patients with diabetes follow dietary recommendations by a dietitian[
10,
11]. Factors such as calorie restrictions, lack of dietary education, and inability to afford a healthful diet are important factors affecting adherence to dietary recommendations[
12,
13,
14,
15].
Currently, the main focus of dietary interventions for individuals who are overweight or obese and are at risk of chronic diseases such as diabetes is weight loss, typically achieved through low-calorie and/or low-carbohydrate diets. Although these approaches have been proven to be effective in the short term[
16], they are often not sustainable due to various limitations such as stress, physical discomfort, emotional problems, and the psychological effects of dieting, including depression and anxiety[
17,
18].
Studies using continuous glucose monitoring (CGM) in healthy individuals have shown significant inter-individual variability in postprandial blood glucose responses to the same foods[
19,
20]. Given the heterogeneity of metabolic responses among individuals, recommendations for dietary modifications should be designed based on each individual’s biological needs and personal preferences to lessen the burden of significant changes in nutritional habits. Personalized dietary interventions can enhance adherence and long-term success in managing blood glucose levels and reducing the risk of progressing to type 2 diabetes in at-risk populations. To maximize the impact of dietary interventions, integrating CGM can be pivotal. CGM provides real-time feedback on how foods influence blood glucose levels, empowering patients with actionable insights and consequently reducing anxiety. A randomized controlled trial by Anh et al. showed that non-contact dietary coaching, combined with CGM, improved behavioral skills and health outcomes in adults with prediabetes or diabetes[
21]. Moreover, it has been shown that a personalized dietary intervention approach combined with CGM can promote better adherence to dietary recommendations[
22].
This study aimed to examine the effects of adding CGM to individualized nutrition therapy (INT) on indices of blood glucose control in individuals with prediabetes who were overweight or obese.
2. Materials and Methods
2.1. Study Design
This study was a randomized clinical trial to examine the clinical efficacy of INT combined with CGM for blood glucose management in individuals with prediabetes who were overweight/obese. The study was registered in ClinicalTrials.gov (NCT05161897) and the protocol was approved by the George Mason University Institutional Review Board (IRB). All participants completed written informed consent before the start of the study. Inclusion criteria were non-pregnant/non-lactating individuals between ages 45 - 65 years from any race or ethnicity who had a baseline hemoglobin A1c of 5.7% to 6.4% and a BMI between 25 and 39.9 kg/m2. Exclusions were active cancer, thyroid, kidney, liver, and pancreatic diseases, heavy cigarette smokers (≥ 25 cigarettes a day), consumers of more than 12 alcoholic drinks/week on average, those with major dietary restrictions that could potentially limit the ability to deliver effective dietary interventions, participating in any weight loss or dietary program/taking prescribed appetite suppressants, or participating in another investigational study concurrently.
2.1.1. Pre-Screening Telephone Interview
Individuals who inquired about the study were given a brief overview of the study and, if interested, pre-screened by telephone to determine eligibility before scheduling their informed consent and in-person visits.
2.1.2. Screening/Baseline
During the screening visit, participants’ HbA1c and anthropometric measurements were obtained. If they were eligible for the study, they were asked to complete a medical and medication history questionnaire. Participants were then randomized into treatment (n=15) or control groups (n=15). All participants were asked to continue with their typical dietary intake during the first 10 days of the study. Both groups were also instructed to record their dietary intake throughout the study using a food diary form. Participants were provided with a CGM to be used for assessing continuous glucose concentrations and glycemic variability throughout the study. They were then scheduled for a second clinic visit 10 days later to complete study measurements, replace their CGM, and receive individualized dietary recommendations from a dietitian. During this visit, participants were given dietary recommendations tailored to their energy requirements for weight maintenance, with a recommended macronutrient distribution of 50% carbohydrates, 20% protein, and 30% fat, constituting a moderate carbohydrate diet[
23]. The rationale for choosing this diet was that the aforementioned percentage of macronutrients has been shown to be effective in improving blood glucose and cardiovascular disease risk factors[
23]. Both groups were also provided with guidance on the distribution of carbohydrate servings throughout the day and were educated about preferred carbohydrate choices[
24]. No recommendations were made related to a change in physical activity. All participants received a new CGM and dietary recommendations and were given an opportunity to seek clarification and ask questions about their prescribed diets. Additionally, the treatment group was able to observe their blood glucose levels in real time via their cell phones. They also had the opportunity to review their food diary with the dietitian and compare it with the recorded data from the CGM. The recorded information from the CGM was also used by the dietitian to set personal goals for improving blood glucose control in the treatment group. While reviewing CGM recorded data, foods that resulted in a blood glucose measure of more than 140 mg/dl were flagged as undesirable foods that needed to be consumed less frequently or in a lower amount. In contrast, both the dietitian and control group participants were blinded to the CGM recordings until the end of the study; thus, the CGM data was not included in nutrition education for the control group. All participants were followed up for 30 days, with visits every 10 days for CGM replacement and study measurements. During these visits, both groups also had the opportunity to ask questions and receive dietary recommendations from the dietitian.
2.2. Study Measurements
Finger Stick Blood (at screening): to confirm the eligibility of participants, finger stick blood collection was performed at the screening visit to measure HbA1C at the point of care using an Abbott AFINION 2 Portable Analyzer (Abbott Laboratories, IL).
2.2.1. Anthropometric Measurements (at Baseline and Every 10 Days until the End of the Study)
Height without shoes was measured using a wall-mounted stadiometer, weight was measured using a digital scale (Health o meter® Professional Scales, McCook, IL, USA), and BMI was calculated by the formula BMI = weight (kg) / [height (m)2).
2.2.2. Food Diary (at Baseline and Every 10 Days until the End of the Study)
All participants were provided with a food diary form and were asked to record all foods and beverages consumed during each day of the study. They were instructed to include detailed information about the name and amount of ingredients for each food item, the time of consumption, and the method of preparation.
2.2.3. Continuous Glucose Monitoring (at Baseline and Every 10 Days until the End of the Study)
A CGM device was inserted into the periumbilical region of the abdomen, following the manufacturer's instructions, to collect and assess 24-hour glucose concentrations and variability during the study. Participants wore the device for 10 days and then returned to the clinic for CGM replacement. Data recorded on the CGM was downloaded using a CGM reader and the following measurements were used for analysis.
GMI approximates the laboratory HbA1c level expected based on average blood glucose levels measured using CGM data. The formula to calculate GMI is:
GMI (%) = 3.31+0.02392×[mean glucose in mg/dl] [
25].
Glycemic variability is considered a contributing factor to the risk of long-term diabetes-related complications and in the short term, it is associated with episodes of hypoglycemia and hyperglycemia[
26,
27]. The %CV is calculated as the standard deviation (SD) of measured glucose values observed during using CGM, divided by the mean of measured glucose values in the same observation period multiplied by 100 [
28].
Since our participants had prediabetes, we assessed the effects of our intervention on blood glucose concentration using two different approaches: one based on the recommendations for patients with diabetes and another based on blood glucose ranges for individuals with normoglycemia.
In our first model, we used recommendations for blood glucose control for patients with diabetes from the American Diabetes Association[
29]; therefore, blood glucose concentrations above 250 mg/dl were defined as the very high range, 180 to 250 mg/dl as high, and 70 to 180 mg/dl as TIR. In the second model, blood glucose concentrations above 200 mg/dl were defined as the very high range, 140 to 200 mg/dl as high, and 70 to 140 mg/dl as TIR.
2.3. Statistical Analysis
Data analysis was performed using Statistical Package for the Social Sciences (SPSS) version 29.0 (SPSS, Inc., Chicago, IL, USA), with a significance threshold set at p < 0.05 for all tests. Descriptive statistics were performed to evaluate population characteristics, and an Analysis of Variance (ANOVA) table was used to assess the distribution of covariates between the groups. If there was a significant difference in the distribution of a potential confounding variable between the groups, the variable was included as a covariate in the model to minimize its potential effects on outcome measures. General Linear Model with repeated measures test was used to evaluate changes in indices of blood glucose control throughout the study, both within and between groups.
3. Results
At baseline, the mean± SD for age was 55 ± 6 years, and for body mass index (BMI) was 31.1±4.1kg/m
2. The distribution of potential covariates was evaluated, and no significant differences were observed for sex, ethnicity, BMI, and hemoglobin A1c (HbA1c) between groups; however, the average age of participants was significantly higher in the treatment group compared to the control group. Therefore, age was included as a covariate in the models. Given the established relationship between BMI and blood glucose control, BMI was also included as a covariate in the models to account for its potential confounding effects. The baseline characteristics of participants in each group are reported in
Table 1.
3.1. Average Blood Glucose Levels
In the treatment group, the average blood glucose significantly decreased from 129.1±4.3 to 121.6±4.9 mg/dl (p<0.05). The average blood glucose went from 131.1±4.7 to 129.5±5.3 mg/dl in the control group; however, these changes were not statistically significant.
3.2. Glucose Management Indicator (GMI)
The treatment group significantly lowered their GMI from 6.4% to 6.2% during the study (p=0.02); the average GMI remained the same (6.4%) in the control group.
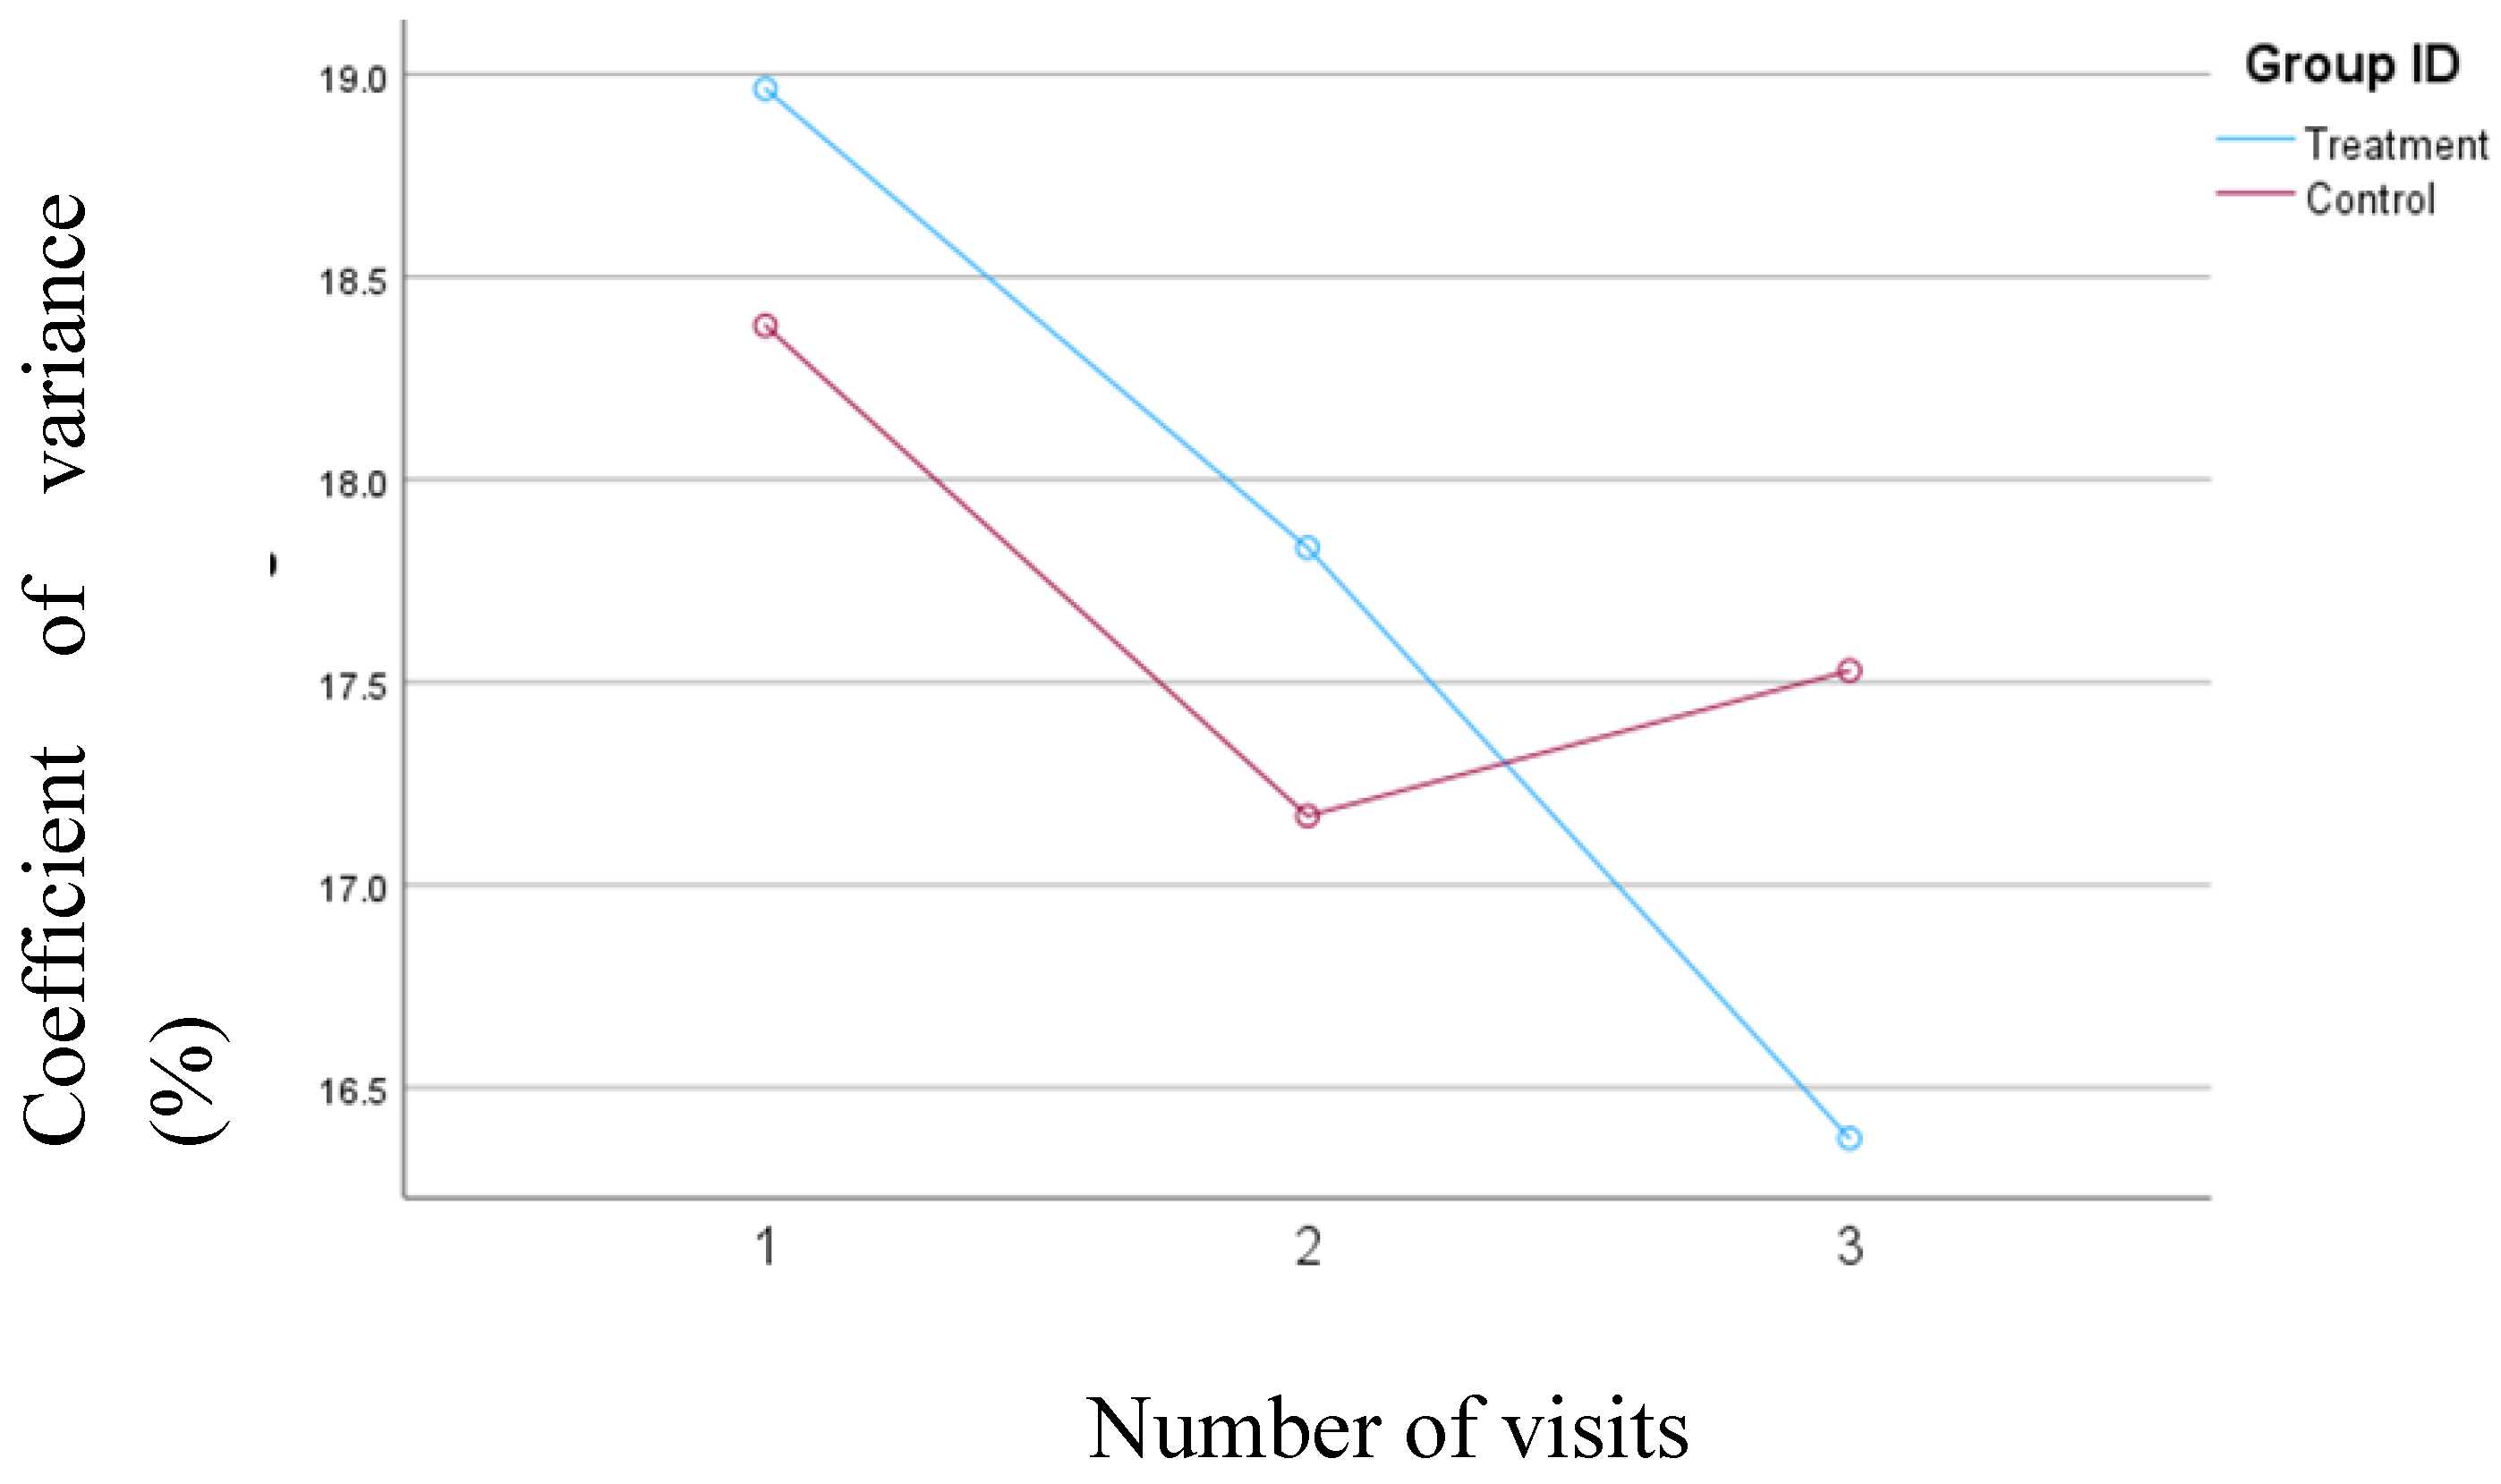
3.3. Percent Coefficient of Variation (%CV) for Blood Glucose Levels
A consistent and significant reduction was observed in %CV from the baseline (mean change= 2.6%,
p= 0.01) for the treatment group; however, the changes in %CV were not statistically significant for the control group. The mean changes in the %CV for both groups have been depicted in
Figure 1.
3.4. Percentage of Time Spent in the Very High Blood Glucose Ranges
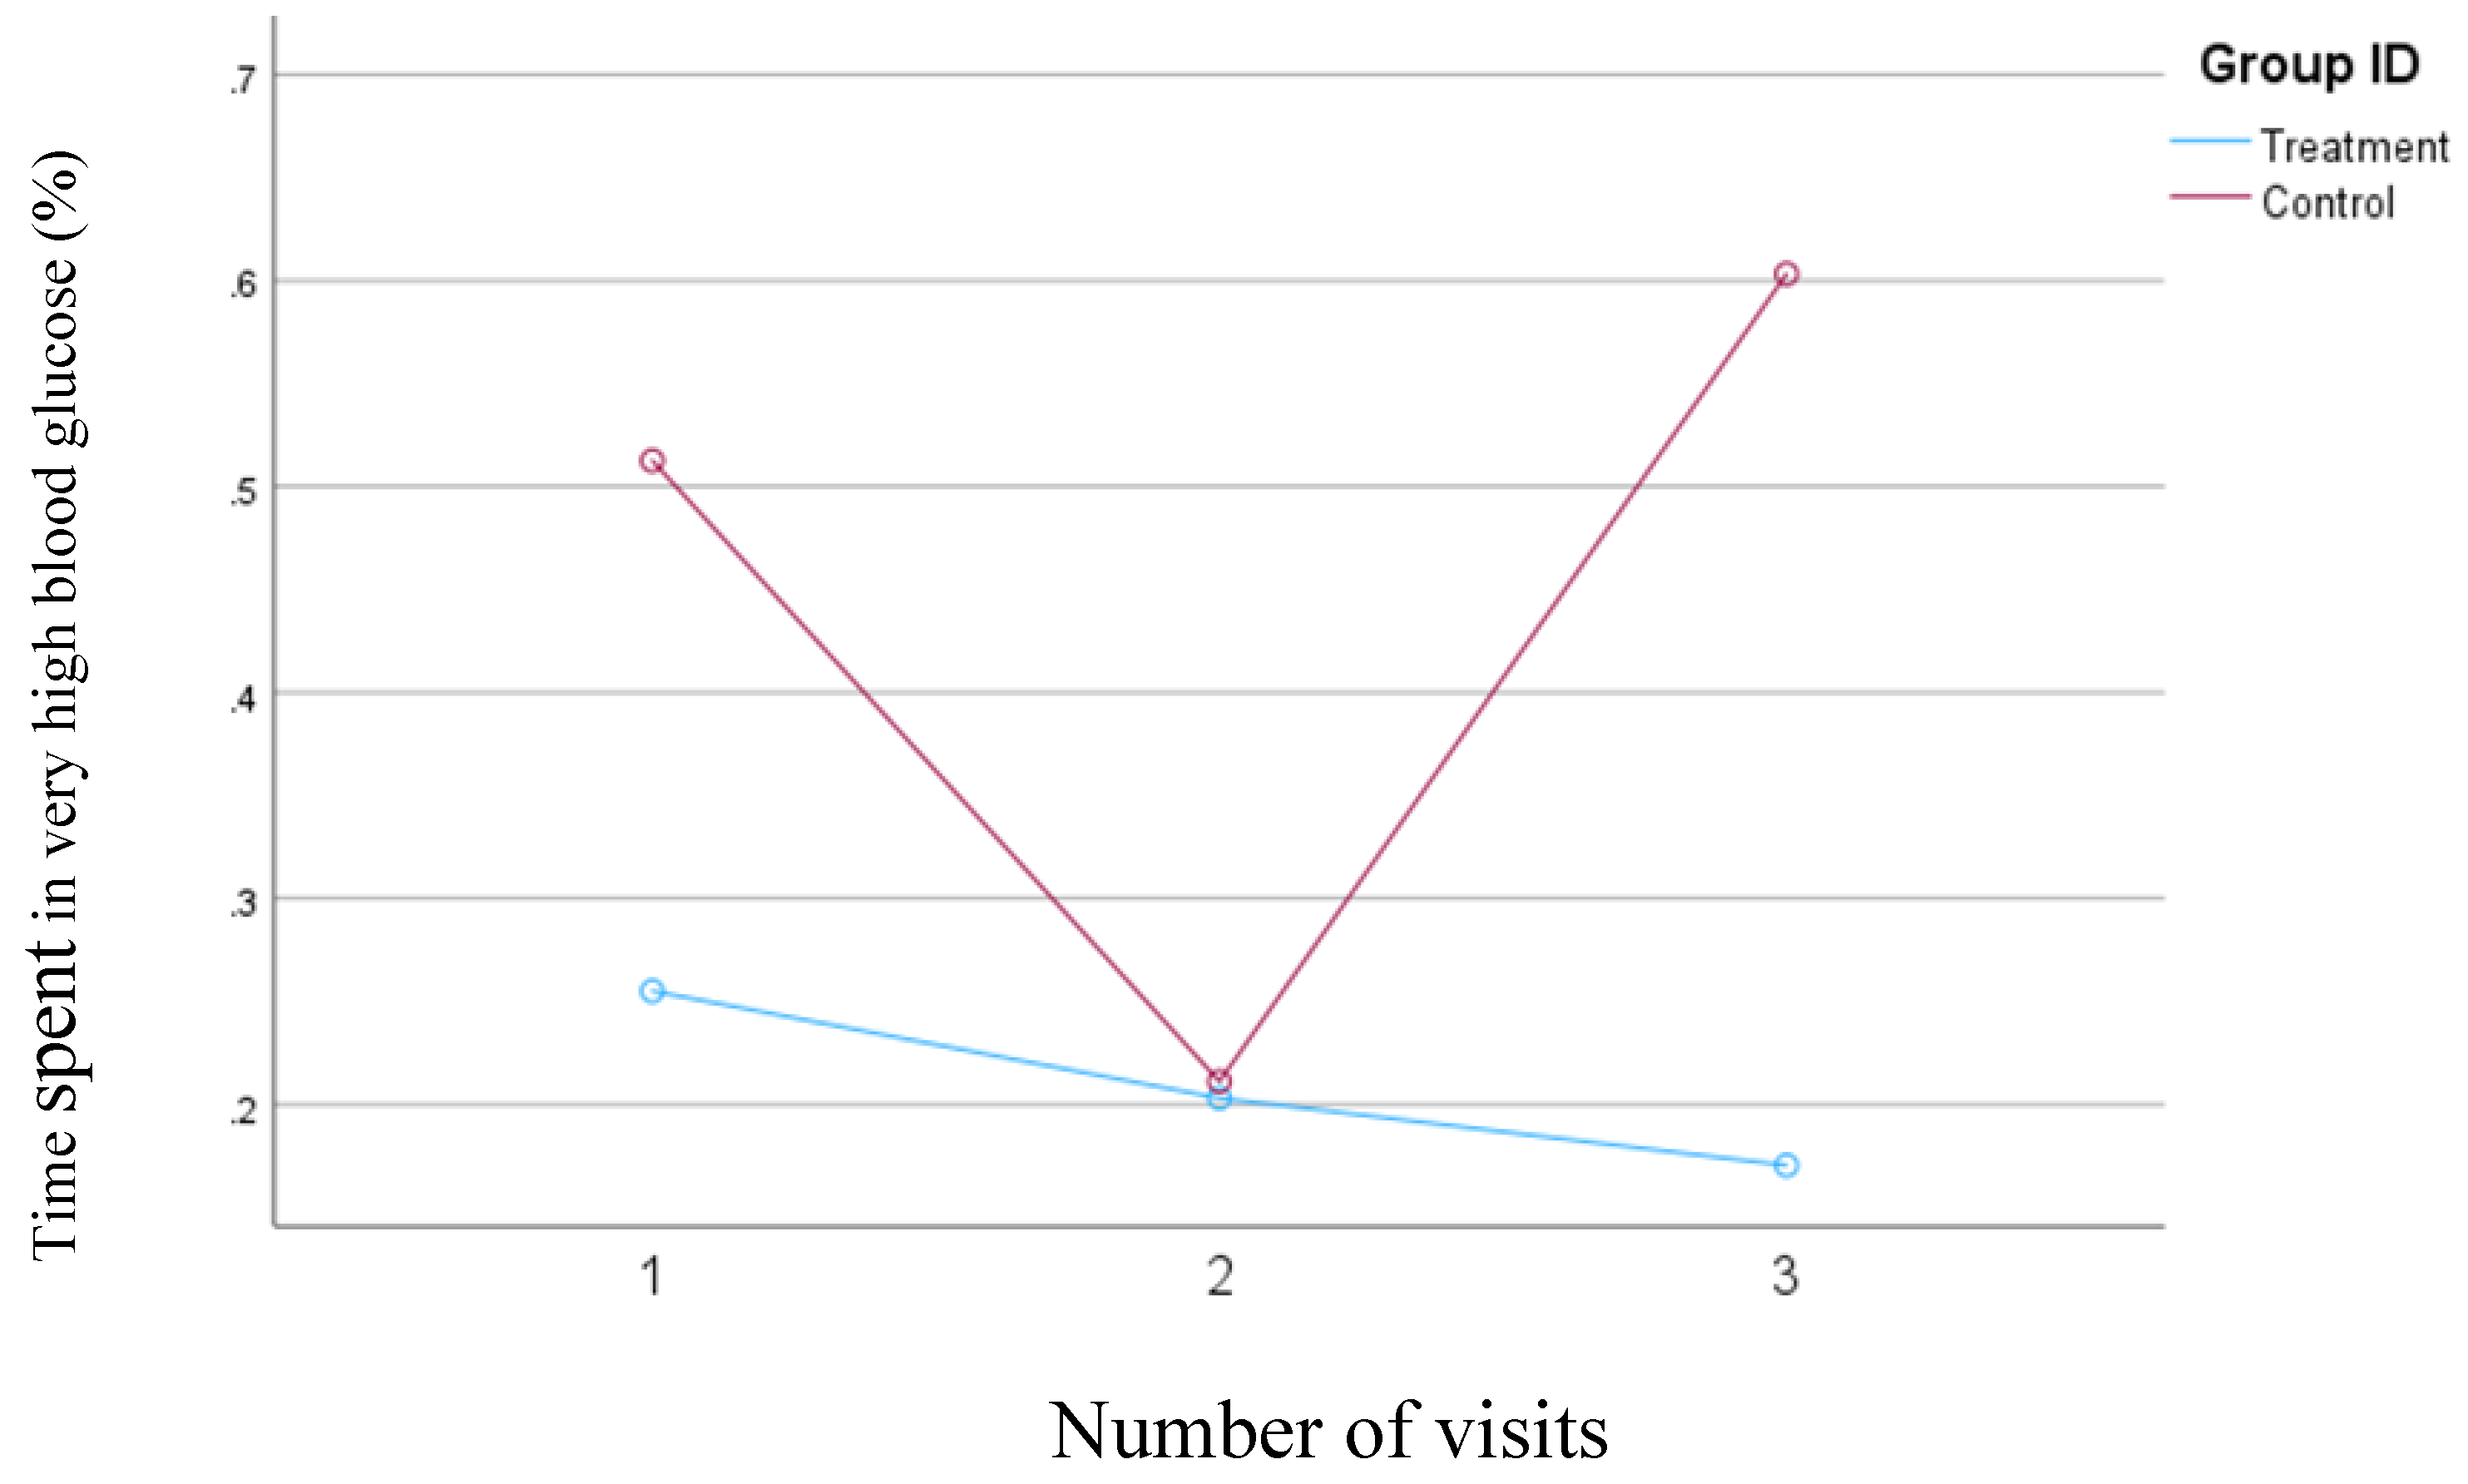
Based on the results of the first model, which defined blood glucose concentrations above 250 mg/dl as very high, the treatment group consistently reduced the percentage of time spent in the very high blood glucose range from 0.25% to 0.17%. In contrast, in the control group, the percentage of time spent in the very high blood glucose range decreased from 0.51% at visit one to 0.21% at visit two but then increased from 0.21% at visit two to 0.60% at visit three. The changes in the percentage of time spent in the very high blood glucose range were not statistically significant either within or between the groups. However, the reduction was consistent in the treatment group, while the control group showed variability during the study.
Figure 2 illustrates the changes in the percentage of time spent with blood glucose levels exceeding 250 mg/dl for both groups.
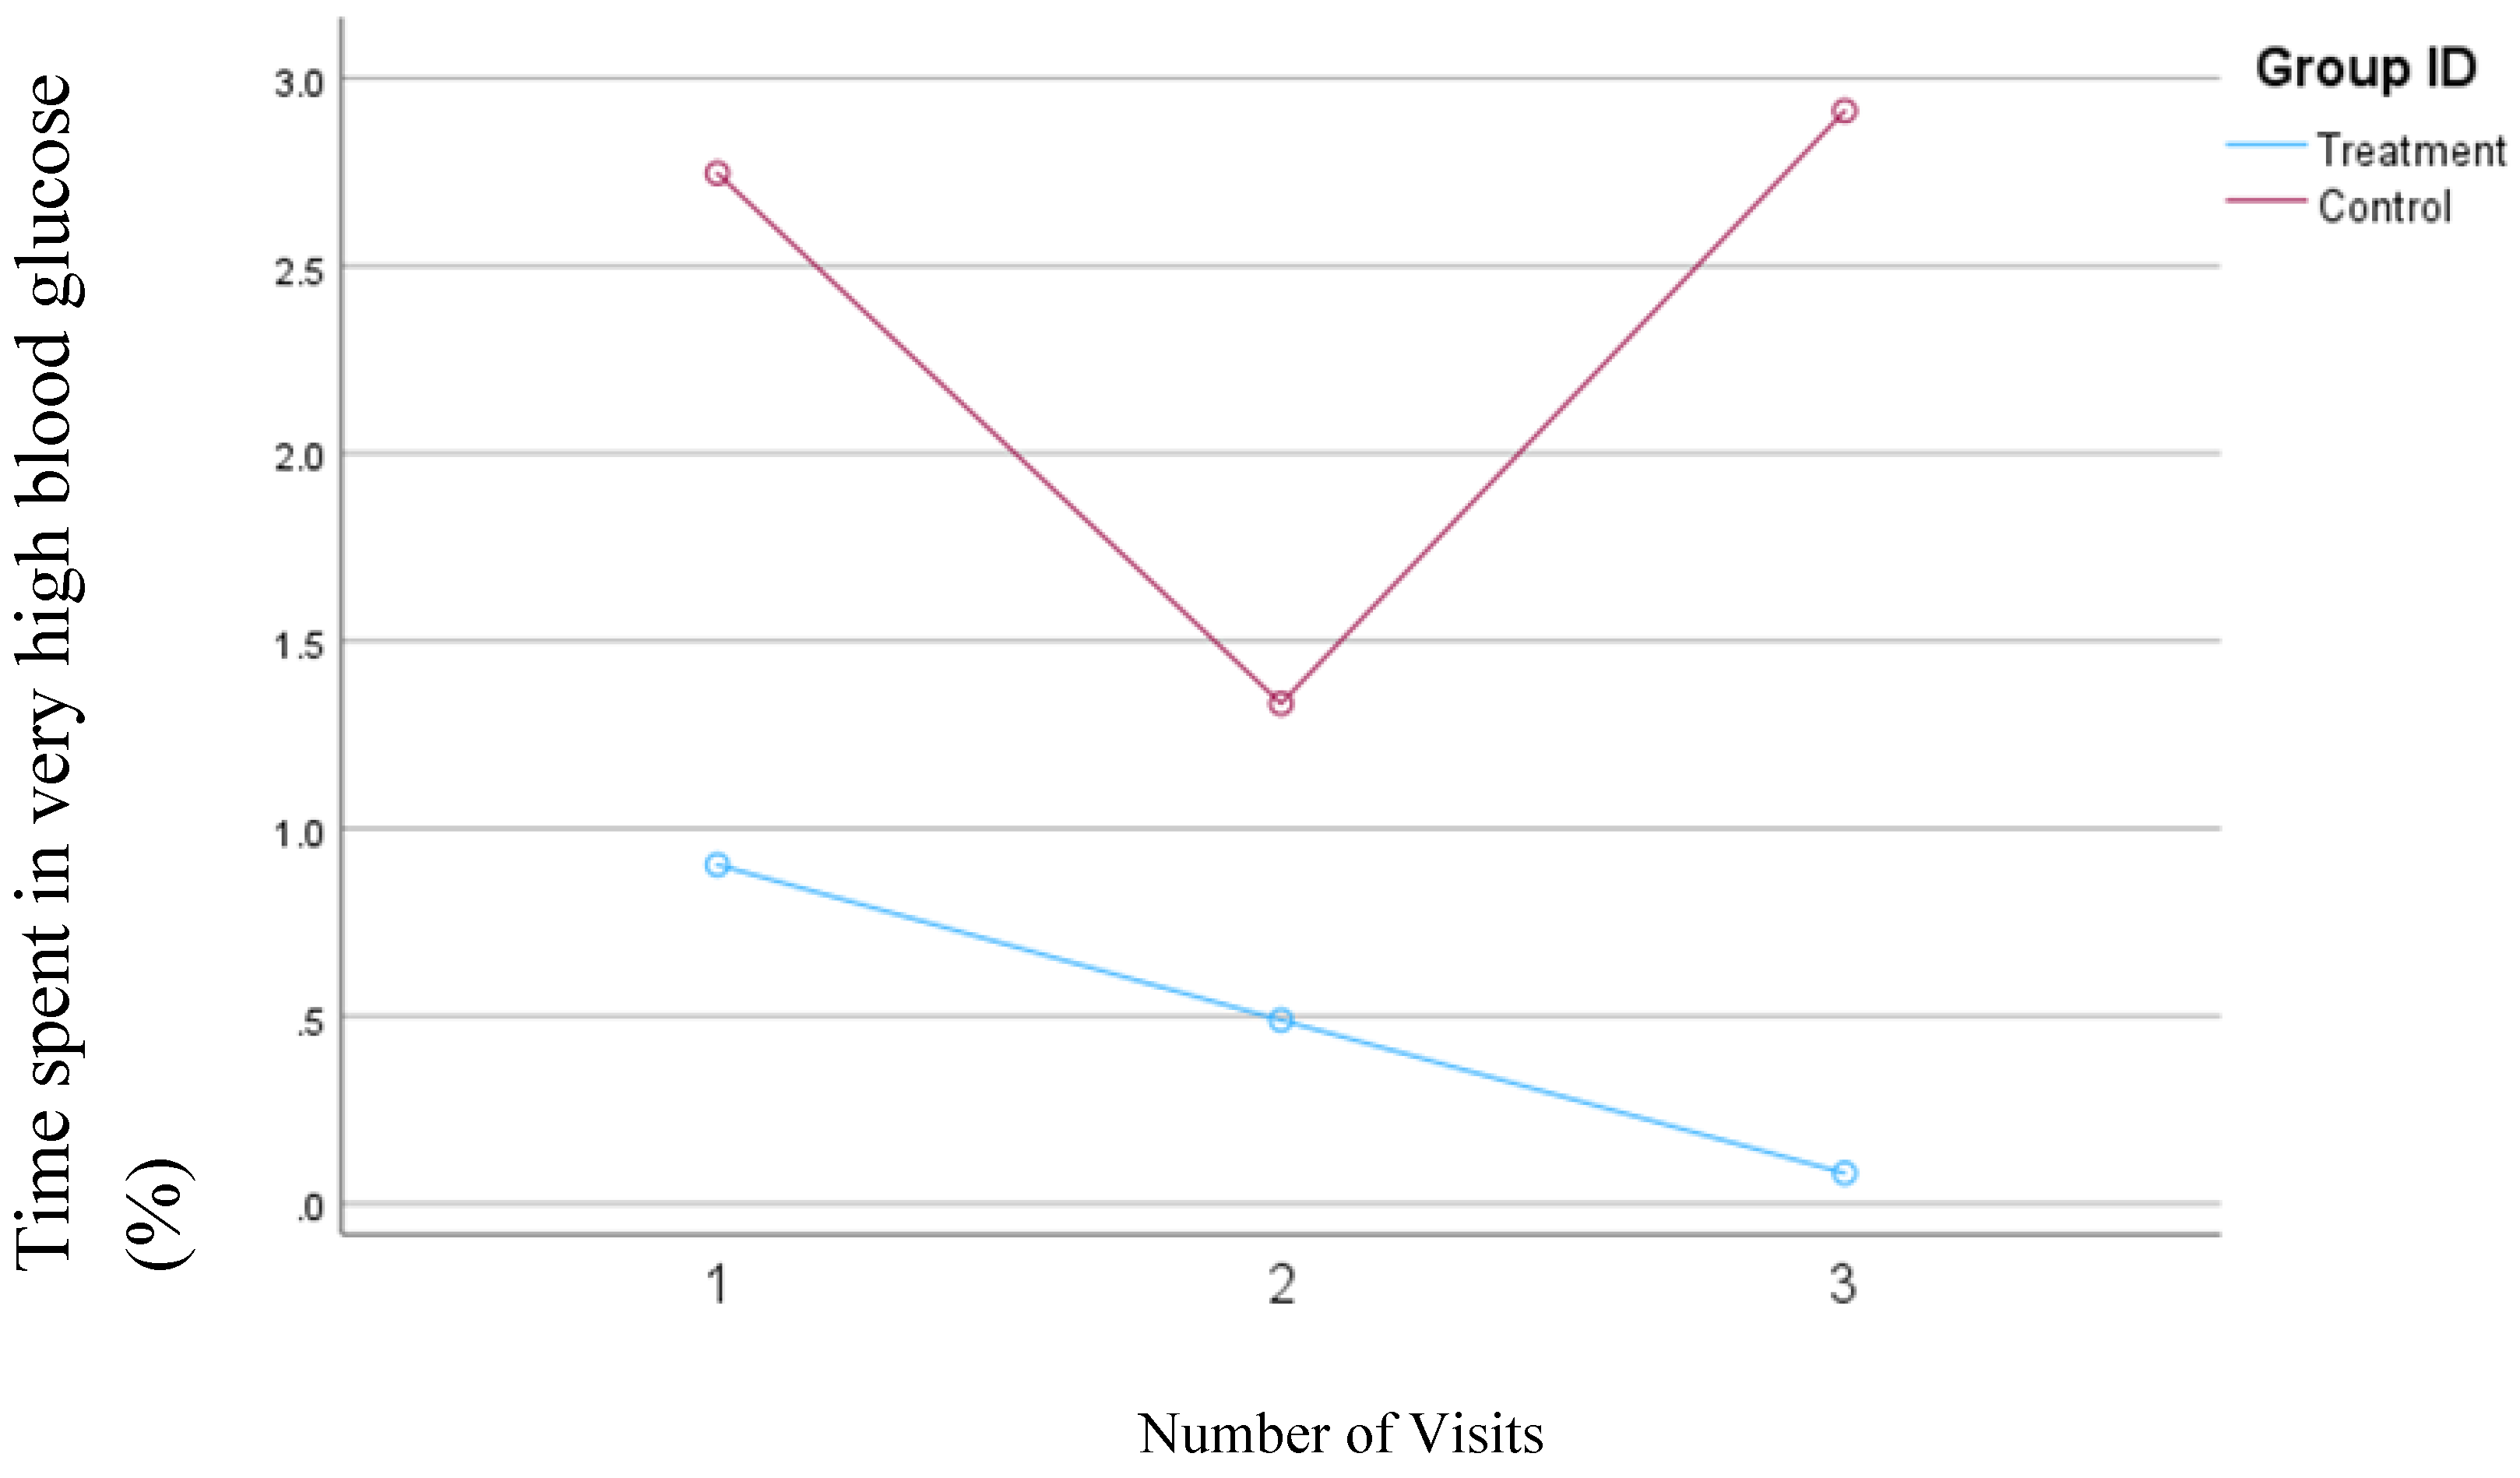
In the second model, in which the blood glucose concentrations >200 mg/dl were defined as very high, the average time spent in the very high range decreased from 0.9% to 0.08% (
p=0.04) in the treatment group. In contrast, in the control group, the percentage of time spent in the very high range decreased from 2.7 mg/dl to 1.3 mg/dl between visits one and two, but this percentage subsequently increased to 2.9% by the third visit. Although none of the changes in the control group were statistically significant, these changes are clinically relevant.
Figure 3 presents the changes in the average percentage of time that blood glucose levels exceeded 200 mg/dl in both groups.
3.5. Percentage of Time Spent in the High Blood Glucose Ranges
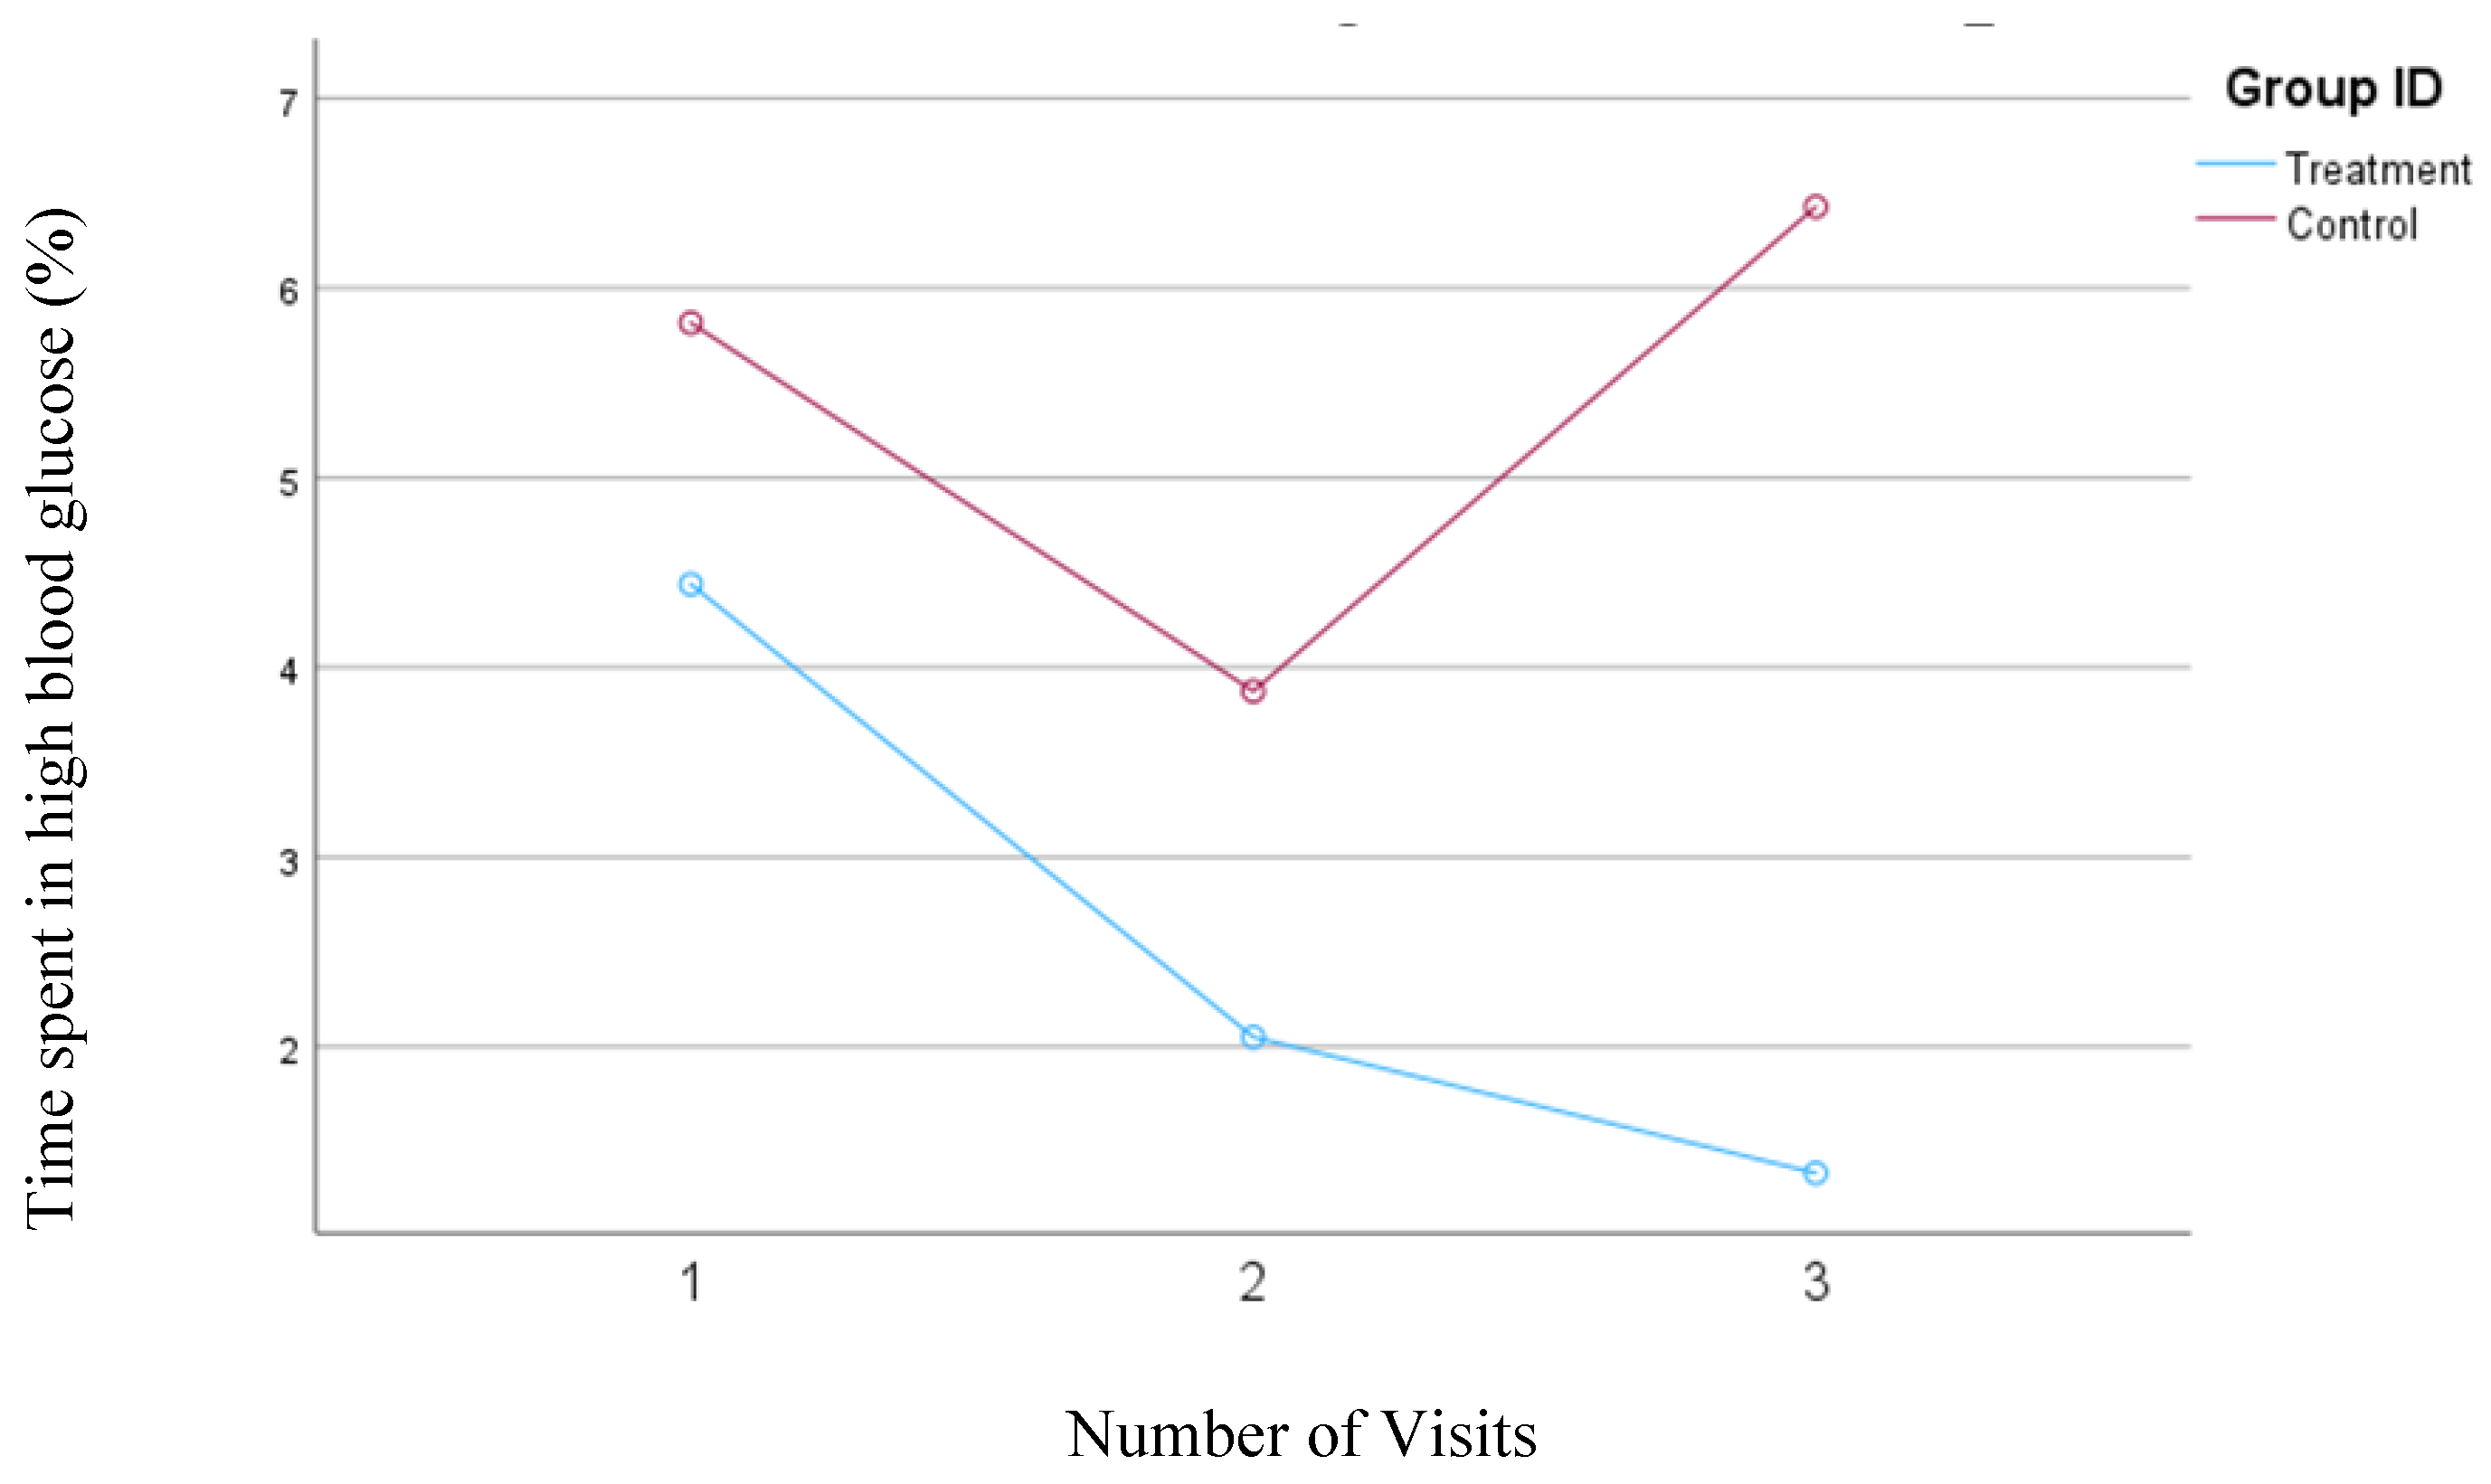
In the first model, where blood glucose levels between 180 and 250 mg/dl were defined as a high blood glucose range, a consistent and significant (
p=0.005) decrease from 4.4% to 1.3% was observed in the treatment group. In the control group, the percentage of time spent in the high blood glucose range initially decreased from 5.8% to 3.9% between the first and second visits but then rose to 6.4% by the third visit; however, none of these changes were statistically significant. The changes in the percentage of time spent in the high blood glucose range for both groups are shown in
Figure 4.
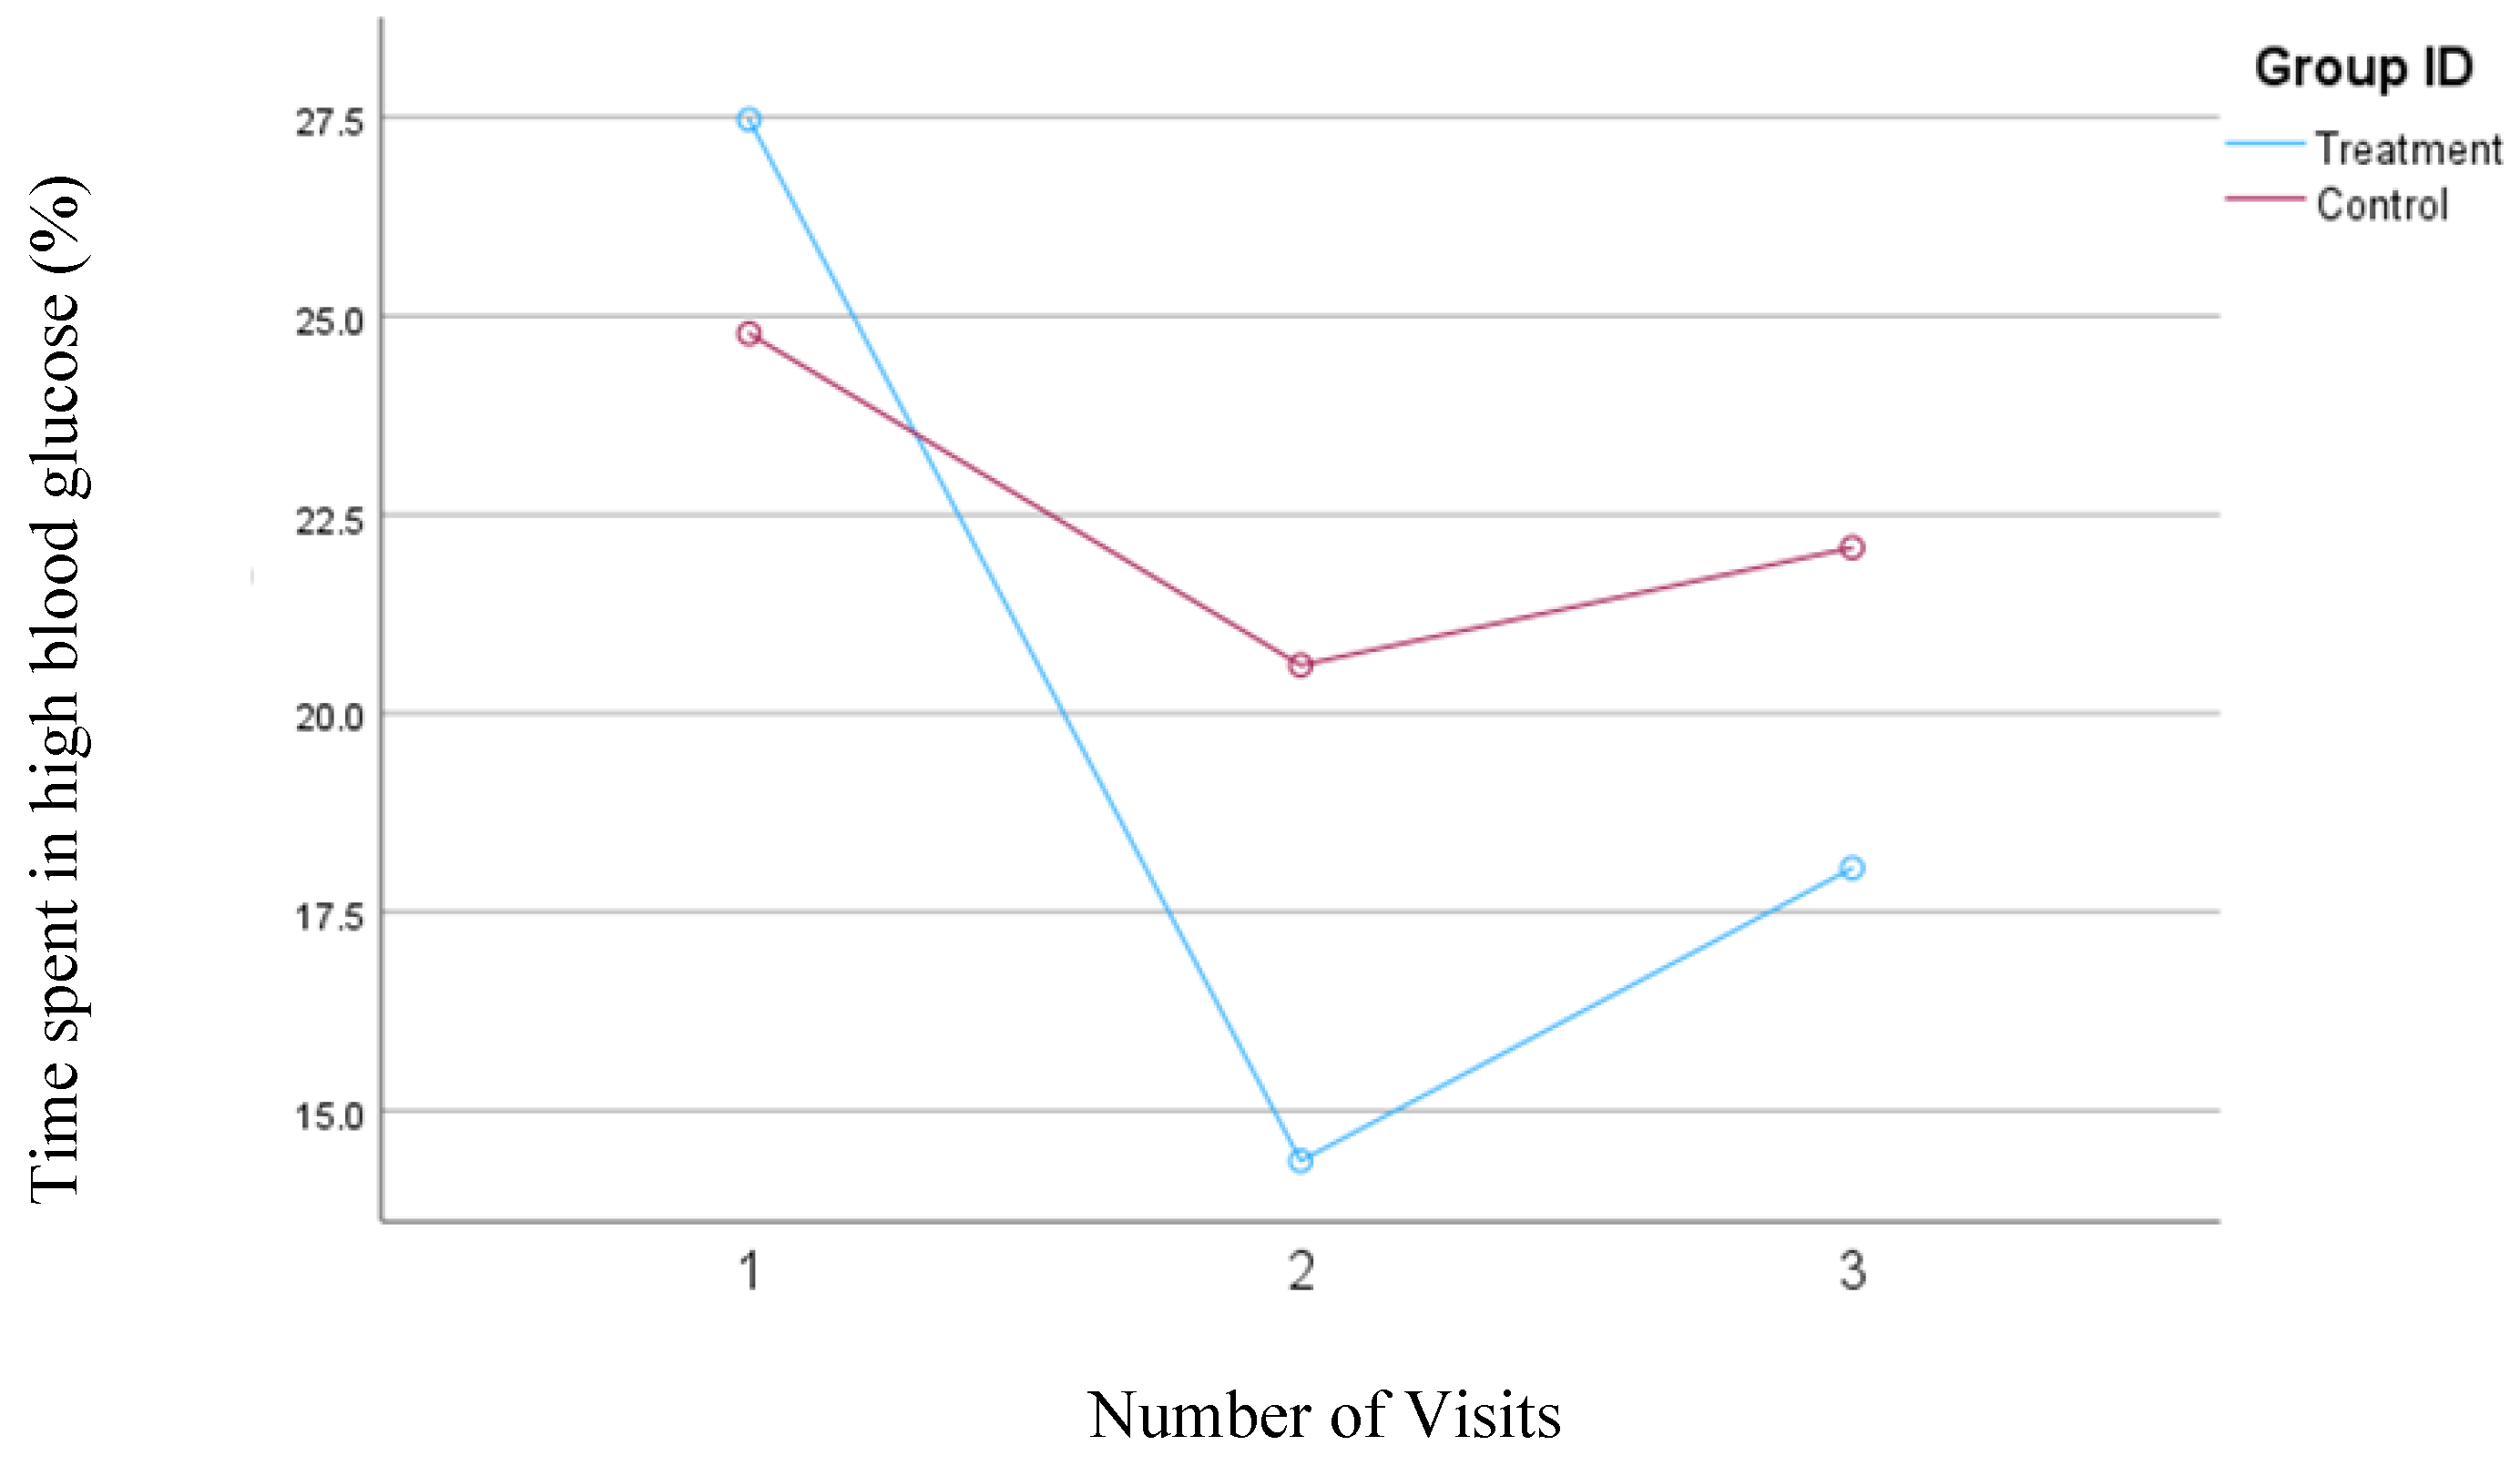
In the second model, where high blood glucose levels were defined as concentrations between 140 and 200 mg/dl, the treatment group demonstrated a significant reduction in the percentage of time spent in this high glucose range from visit one to visit two (from 27.5% to 14.37%; p=0.004). However, there was a slight, nonsignificant increase to 18.1% from visit two to visit three. Conversely, the control group also showed a decrease in the percentage of time spent in the high blood glucose range from visit one (24.8%) to visit two (20.6%) but experienced a subsequent increase to 22.1% from visit two to visit three. Despite a slight increase in the percent time spent in high blood glucose from visit two to three in the treatment group, the overall interaction between time and intervention remained significant for the treatment group (
p=0.04) during the study, whereas it was not significant for the control group.
Figure 5 depicts the mean changes in the percentage of time spent in the high blood glucose range for the treatment and control group.
3.6. Percentage of Time Spent in Target Blood Glucose Ranges: Time in Range (TIR)
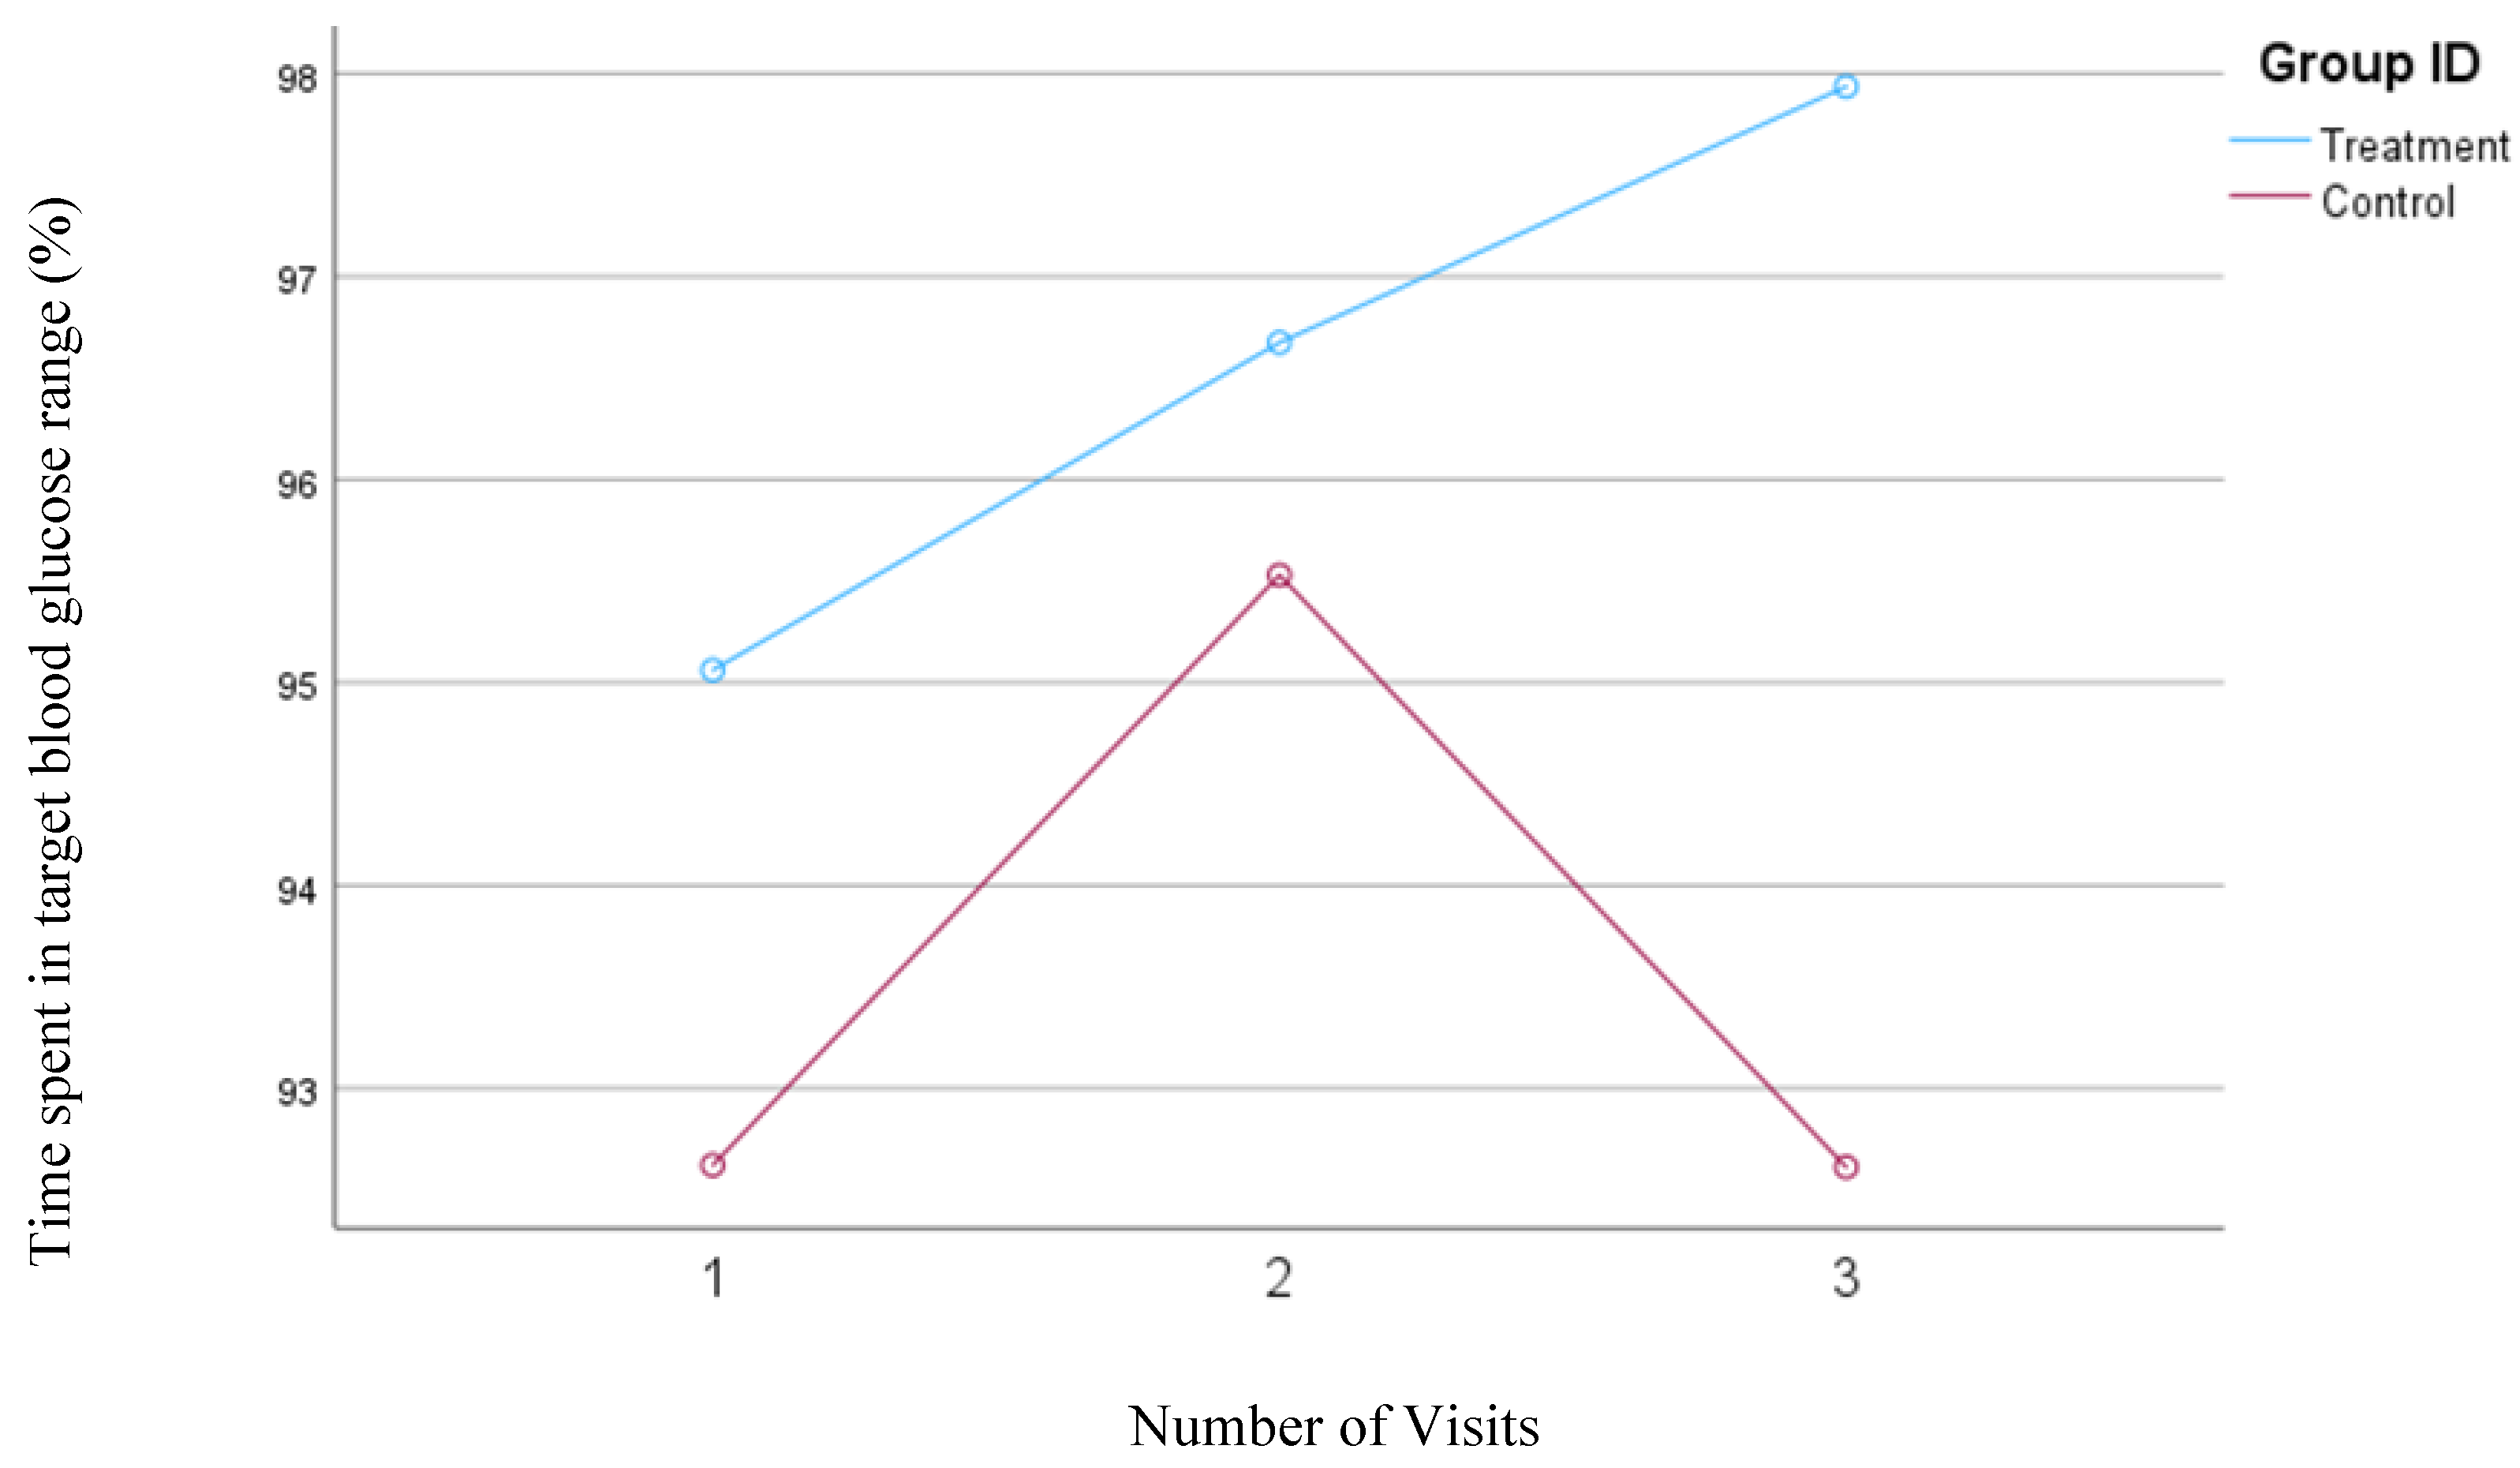
In our first model, the time in range was defined as the percentage of time that the blood glucose concentrations remained between 70 and 180 mg/dl. Participants in the treatment group showed a significant increase in the TIR from 95.1% to 97.9% (
P=0.02) but no significant changes were observed in the TIR (93.0%) for the control group.
Figure 6 shows the changes in the time spent in the TIR for both groups based on Model 1.
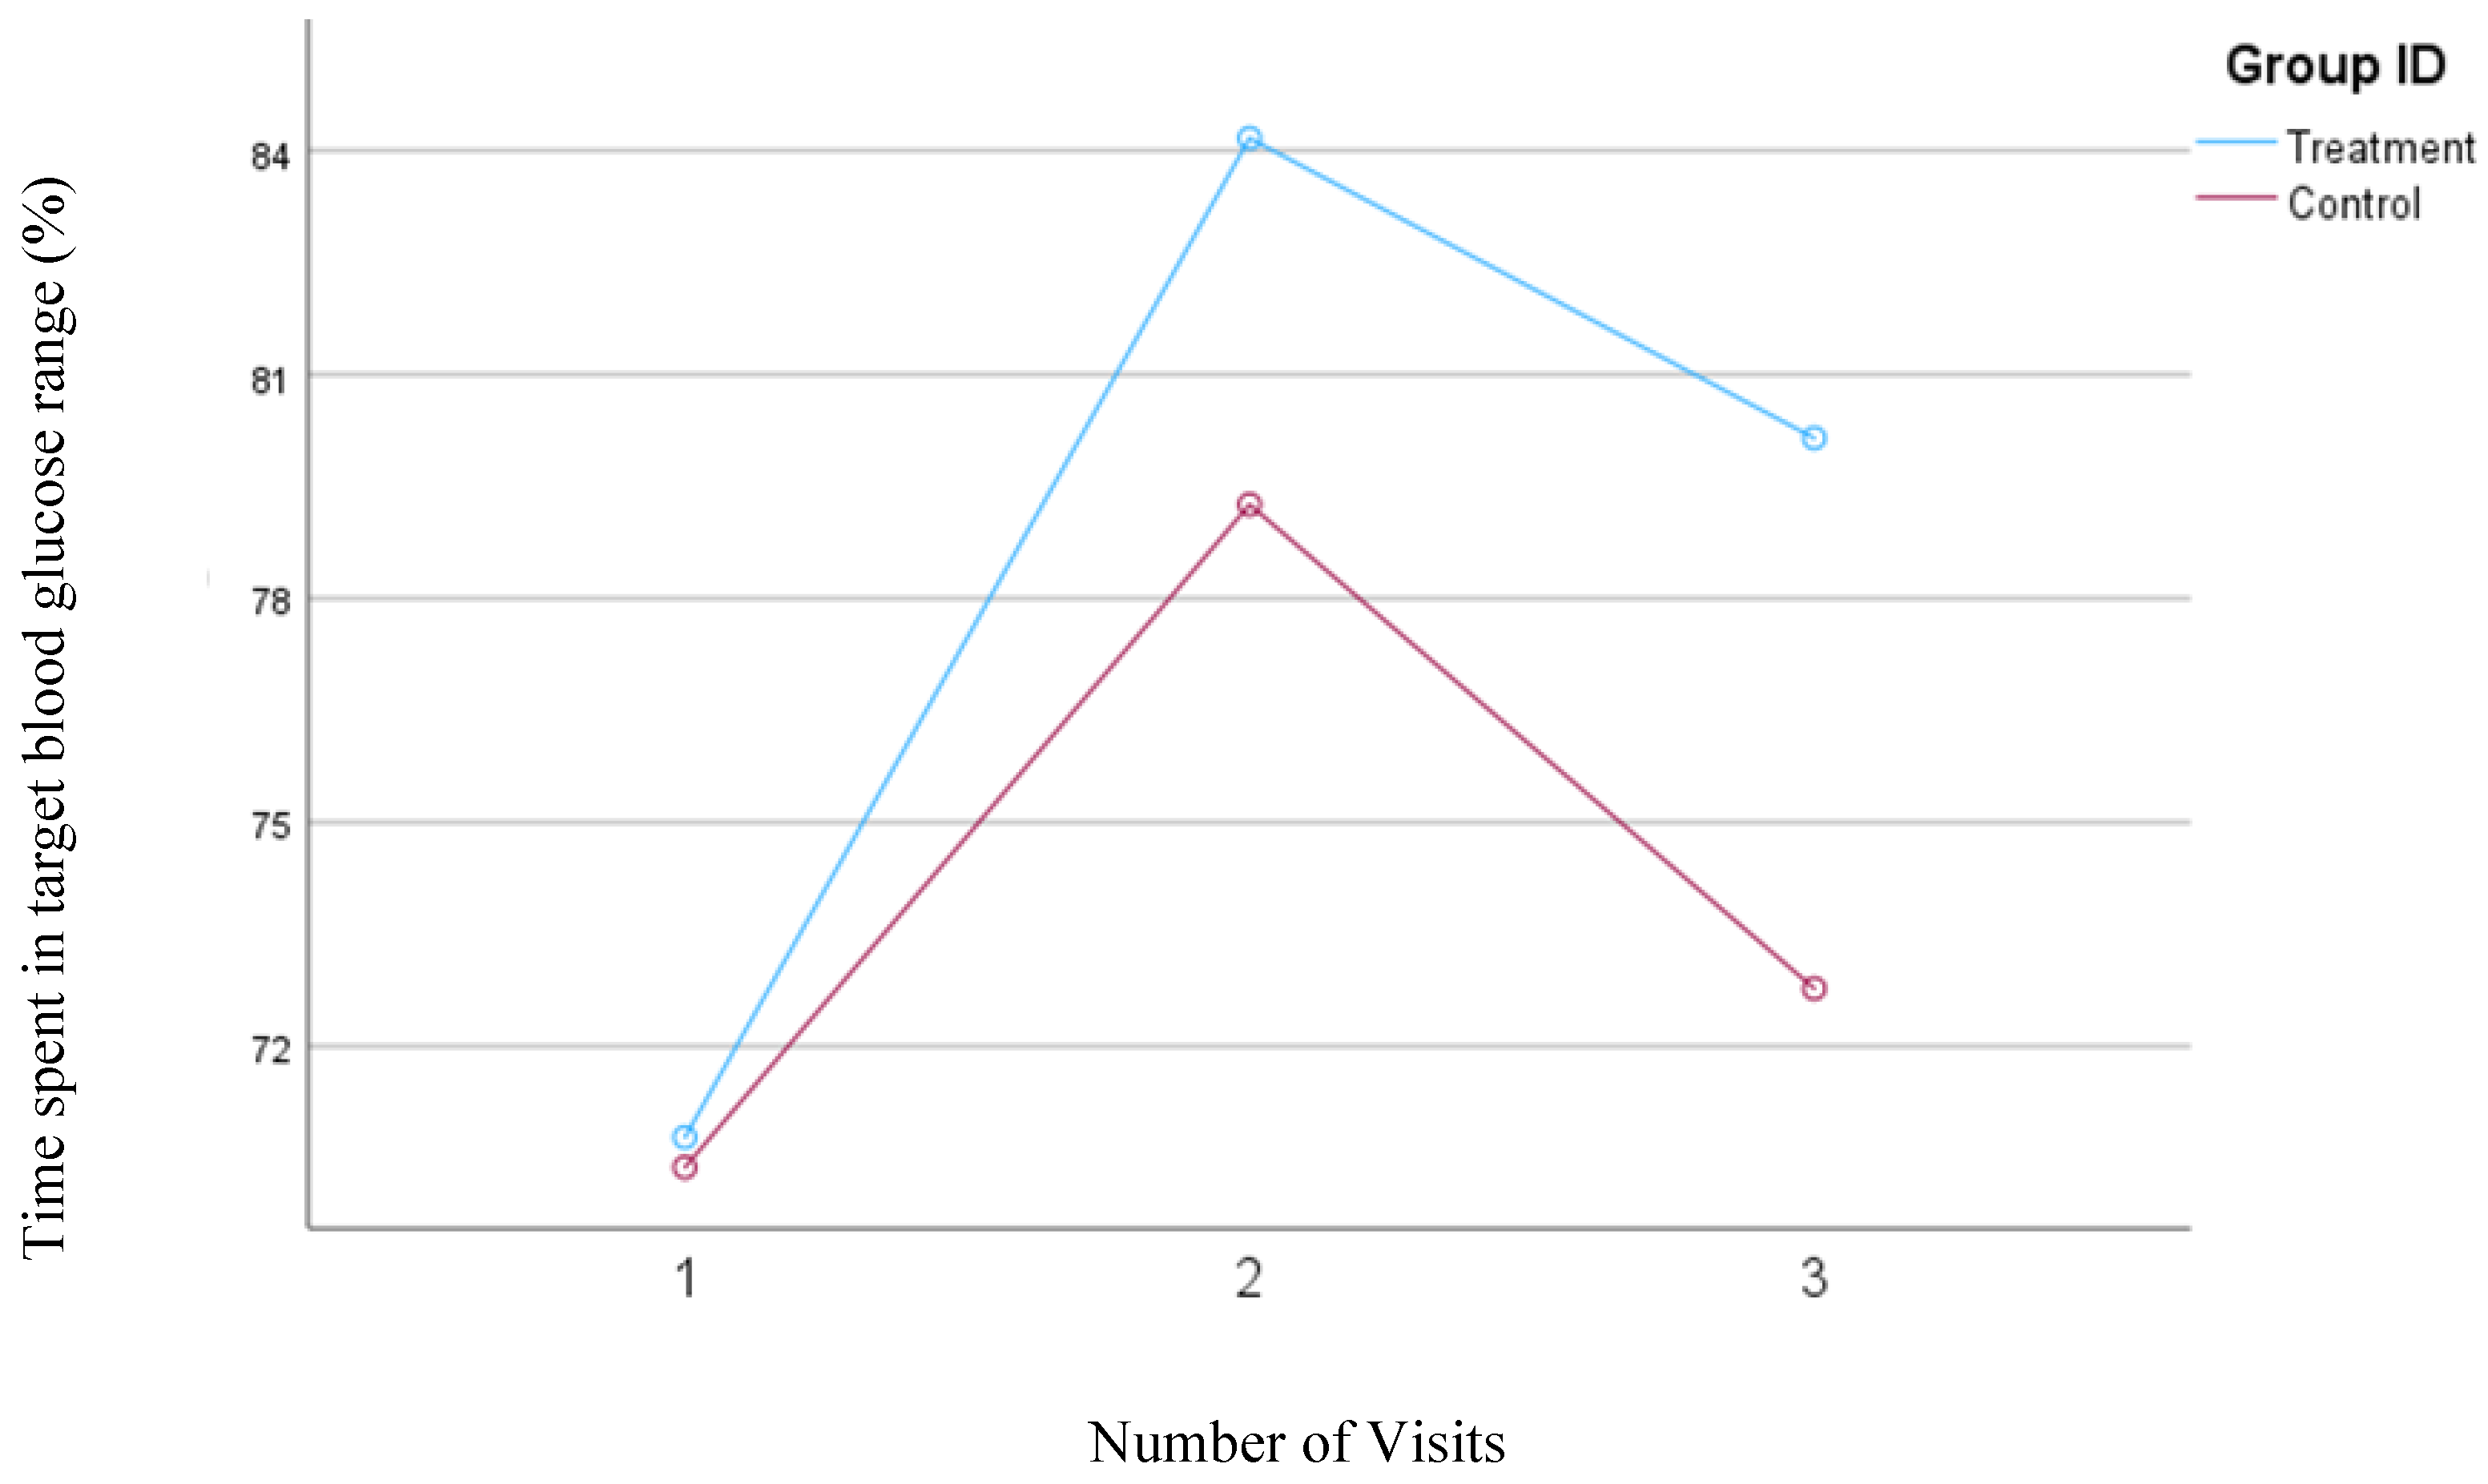
When the time spent in the blood glucose concentrations between 70 to 140 mg/dl was considered for TIR, in the second model, the treatment group tended to significantly increase their TIR from 70.8% to 80.1% (P= 0.05); however, no significant changes were observed in the control group (70.4% to 72.8%).
Figure 7.
Mean changes in the percentage of time spent in the target blood glucose range (70-140 mg/dl, Model 2) during the 30-day follow-up period. The treatment group, which received individualized nutrition therapy and had real-time access to continuous glucose monitoring (CGM), is compared to the control group, which was blinded to CGM results.
3.7. Changes in Percentage of Time Spent in Low Blood Glucose Range
The blood glucose concentration between 54 and 70 mg/dl was considered a low blood glucose concentration. No significant changes in the average time spent in the low blood glucose range were observed for the treatment or the control group.
3.8. Changes in Percentage of Time Spent in Very Low Blood Glucose Range
The concentration of blood glucose less than 54 mg/dl was considered as very low blood glucose. Only five participants in the treatment group and six in the control group experienced very low blood glucose during the study. No significant changes in the percentage of time spent in the very low blood glucose range were observed in the treatment or the control group.
4. Discussion
We found that adding CGM to INT enhanced the effects of the dietary intervention on blood glucose management in these overweight or obese individuals with prediabetes. We previously demonstrated that the ability to see the impact of dietary intake on blood glucose in real-time enhanced compliance and improved dietary intake and body composition in this population[
22], potentially explaining the observed results on improving continuous glucose indices. These results are aligned with a study by Ben-Yacov[
30] which indicated that using a personalized postprandial-targeting diet combined with CGM improved glycemic control more significantly than the Mediterranean diet measured as time spent at blood glucose levels above 140 mg/dl and HbA1c.
Utilizing CGMs to assess the effectiveness of our dietary counseling provided us with important information about GMI, CV, TIR, and the percent time spent in high, very high, low, and very low ranges of blood glucose, important factors to consider when seeking to optimize blood glucose control. It has been found that TIR is a strong predictive measure for long-term complications of diabetes, particularly microvascular complications[
31]. Furthermore, reduced time at high and very high blood glucose levels in patients with diabetes is related to reduced albuminuria, severity of diabetic retinopathy, and prevalence of peripheral neuropathy and cardiac autonomic neuropathy[
32]. Currently, there are no recommendations for TIR for individuals with prediabetes; however, suggested TIR for patients with diabetes is to keep the blood glucose in the range of 70 to 180 mg/dl for >70% of the day, below 70 mg/dl for <4%, below 54 mg/dl for <1% of the day, and minimizing time above 180 mg/dl [
33,
34]. For individuals without diabetes, normal blood glucose levels after a meal should peak below 140 mg/dl[
35]. In this study, we employed two different models: one based on recommendations for patients with diabetes and the other on normal blood glucose ranges, to evaluate the effects of our intervention more comprehensively. In both models, significant improvements were observed in the average blood glucose levels and TIR in the treatment but not in the control group. Although the reduction in time spent in the very high blood glucose range (>250 mg/dl) did not reach statistical significance in either group in Model 1, the treatment group consistently showed a decrease throughout the study. In contrast, the control group exhibited a numerical reduction from visit one to visit two, but this measure increased from visit two to visit three. It is important to note that changes in very high blood glucose levels are clinically significant, even in the absence of statistical significance, given the known adverse effects of levels exceeding 250 mg/dl on the body[
29,
36,
37]. The changes in the high blood glucose followed a similar trend in Model 1, with a significant >3% decrease in the treatment group (
p=0.005) but no significant decrease from visit one to two and an increase from visit two to three in the control group. These results suggest that using CGM concurrent with dietary intervention could help with sustainability of the intervention.
In Model 2, the control group followed a trend similar to that found using Model 1 for changes in time spent in the high blood glucose range and TIR. However, the treatment group experienced a slight increase in time spent in high blood glucose (>140 mg/dl) and a decrease in TIR (blood glucose between 140 and 180 mg/dl) from visit two to visit three. This may be attributed to the short duration of the study, as several participants expressed interest in testing the effects of foods not typically part of their diet, knowing they would not have the opportunity after the final session. Of note, the personalized nutrition therapy and access to real-time CGM feedback helped participants control portion sizes, preventing blood glucose concentrations from exceeding 180 mg/dl as evidenced in Model 1. It is well documented that microvascular complications like retinopathy, neuropathy, and nephropathy, as well as macrovascular complications like cardiovascular disease and kidney disease, can manifest during the prediabetes stage, before progression to overt diabetes[
38,
39,
40]. Therefore, the observed reductions in time spent in the very high and high blood glucose ranges and significant improvements in TIR, CV, and blood glucose concentrations in the treatment group suggest a significant potential for preventing the onset of related complications in this population. Longer-duration clinical trials should be conducted to assess the sustainability of similar interventions.
Fluctuations in blood glucose levels are an important risk factor for the development and progression of various microvascular (nephropathy, retinopathy, neuropathy) and macrovascular (cardiovascular disease, stroke) complications as well as cognitive decline and gray matter atrophy in the brain, which could potentially increase the risk of dementia in patients with diabetes[
41,
42,
43]. Maintaining stable blood glucose levels appears crucial to mitigate these risks. Our results showed a significant reduction in CV% in the treatment group, but not in the control group. This confirms that the blood glucose became more stable when the dietary intervention was combined with the use of CGM.
We were not able to assess the effects of our intervention on HbA1c due to the 3-month average erythrocyte circulation time, but we were able to assess the GMI, which could give us estimated HbA1c values[
44]. A significant reduction in GMI was observed in the treatment group, but not in the control group, which potentially suggests a decrease in HbA1c and future diabetes-related complications[
25,
45]. However, we could not find any study to confirm the relationship between GMI and diabetes-related complications. Future studies should be done to clarify the relationship between GMI and HbA1c, as well as how changes in GMI could relate to the risk of diabetes-related complications.
Our findings highlight that combining CGM with INT was both feasible and effective in improving blood glucose control in individuals with prediabetes who were overweight or obese, even in the absence of a weight-loss diet. This approach could offer an alternative method for better blood glucose management in individuals at high risk of chronic diseases like type 2 diabetes who struggle to achieve or maintain weight loss goals.
To our knowledge, this is the first study conducted to evaluate the effects of INT combined with CGM in individuals with prediabetes who were overweight or obese. The study does have some limitations, including a small sample size and a short duration of follow-up. Additionally, the effects of changes in various indicators of blood glucose control measured by CGM in individuals with prediabetes have not been extensively studied, which limits our ability to predict the potential effects of our intervention on the prevention or delay of type 2 diabetes and related complications. Further clinical trials with longer durations and larger populations are needed to confirm our findings.
5. Conclusions
Adding CGM to personalized nutrition therapy positively affects blood glucose control in overweight or obese individuals with prediabetes.
Author Contributions
Conceptualization, R.B.; methodology, R.B.; software, R.B.; validation, R.B. and L.J.C.; formal analysis, R.B.; investigation, R.B.; resources, R.B.; data curation, R.B.; writing—original draft preparation, R.B.; writing—R.B. and L.J.C.; visualization, R.B.; supervision, R.B.; project administration, R.B.; funding acquisition, R.B. All authors have read and agreed to the published version of the manuscript.
Funding
This research received no external funding.
Institutional Review Board Statement
The study was conducted in accordance with the Declaration of Helsinki, and approved by the Institutional Review Board of George Mason University (IRBNet ID: 1825534-1, 12 October 2021).
Informed Consent Statement
Informed consent was obtained from all subjects involved in the study.
Data Availability Statement
The raw data supporting the conclusions of this article will be made available by the authors upon request.
Acknowledgments
We sincerely thank Toqa Elashry and Evelynne Chi Lam Lee for their diligent work in data cleaning. We are also deeply grateful to our participants for their invaluable contributions. This research was supported by funding from the George Mason University College of Public Health, and we greatly appreciate their support.
Conflicts of Interest
The authors declare no conflicts of interest.
References
- Buysschaert, M.; Bergman, M. Definition of Prediabetes. Med Clin North Am 2011, 95, 289–297, vii. [Google Scholar] [CrossRef] [PubMed]
- CDC Prediabetes - Your Chance to Prevent Type 2 Diabetes. Available online: http://bit.ly/2hMpYrt (accessed on 1 September 2021).
- The Diabetes Prevention Program (DPP). Diabetes Care 2002, 25, 2165–2171. [CrossRef] [PubMed]
- Herpt, T.T.W. van; Ligthart, S.; Leening, M.J.G.; Hoek, M. van; Lieverse, A.G.; Ikram, M.A.; Sijbrands, E.J.G.; Dehghan, A.; Kavousi, M. Lifetime Risk to Progress from Pre-Diabetes to Type 2 Diabetes among Women and Men: Comparison between American Diabetes Association and World Health Organization Diagnostic Criteria. BMJ Open Diabetes Research and Care 2020, 8, e001529. [Google Scholar] [CrossRef]
- Basiri, R. Effects of Nutrition Supplementation and Education on Wound Healing in Patients with Diabetic Foot Ulcer. 2019.
- Basiri, R.; Spicer, M.; Levenson, C.; Ledermann, T.; Akhavan, N.; Arjmandi, B. Improving Dietary Intake of Essential Nutrients Can Ameliorate Inflammation in Patients with Diabetic Foot Ulcers. Nutrients 2022, 14, 2393. [Google Scholar] [CrossRef]
- Basiri, R.; Spicer, M.T.; Ledermann, T.; Arjmandi, B.H. Effects of Nutrition Intervention on Blood Glucose, Body Composition, and Phase Angle in Obese and Overweight Patients with Diabetic Foot Ulcers. Nutrients 2022, 14, 3564. [Google Scholar] [CrossRef]
- Basiri, R.; Seidu, B.; Cheskin, L.J. Key Nutrients for Optimal Blood Glucose Control and Mental Health in Individuals with Diabetes: A Review of the Evidence. Nutrients 2023, 15, 3929. [Google Scholar] [CrossRef]
- Basiri, R.; Spicer, M.; Munoz, J.; Arjmandi, B. Nutritional Intervention Improves the Dietary Intake of Essential Micronutrients in Patients with Diabetic Foot Ulcers. Curr Dev Nutr 2020, 4, 8. [Google Scholar] [CrossRef]
- McElfish, P.A.; Bridges, M.D.; Hudson, J.S.; Purvis, R.S.; Bursac, Z.; Kohler, P.O.; Goulden, P.A. Family Model of Diabetes Education with a Pacific Islander Community. Diabetes Educ 2015, 41, 706–715. [Google Scholar] [CrossRef] [PubMed]
- Jaworski, M.; Panczyk, M.; Cedro, M.; Kucharska, A. Adherence to Dietary Recommendations in Diabetes Mellitus: Disease Acceptance as a Potential Mediator. PPA 2018, 12, 163–174. [Google Scholar] [CrossRef]
- Mohammed, A.S.; Adem, F.; Tadiwos, Y.; Woldekidan, N.A.; Degu, A. Level of Adherence to the Dietary Recommendation and Glycemic Control Among Patients with Type 2 Diabetes Mellitus in Eastern Ethiopia: A Cross-Sectional Study. DMSO 2020, 13, 2605–2612. [Google Scholar] [CrossRef]
- Adherence to Dietary Recommendation and Its Associated Factors among People with Type 2 Diabetes: A Cross-Sectional Study in Nepal - PMC. Available online: https://www.ncbi.nlm.nih.gov/pmc/articles/PMC9616656/ (accessed on 18 June 2024).
- Cruwys, T.; Norwood, R.; Chachay, V.S.; Ntontis, E.; Sheffield, J. “An Important Part of Who I Am”: The Predictors of Dietary Adherence among Weight-Loss, Vegetarian, Vegan, Paleo, and Gluten-Free Dietary Groups. Nutrients 2020, 12, 970. [Google Scholar] [CrossRef] [PubMed]
- Moreira, E.A.M.; Most, M.; Howard, J.; Ravussin, E. Dietary Adherence to Long-Term Controlled Feeding in a Calorie-Restriction Study in Overweight Men and Women. Nutr Clin Pract 2011, 26, 309–315. [Google Scholar] [CrossRef] [PubMed]
- El Ghoch, M.; Calugi, S.; Dalle Grave, R. The Effects of Low-Carbohydrate Diets on Psychosocial Outcomes in Obesity/Overweight: A Systematic Review of Randomized, Controlled Studies. Nutrients 2016, 8, 402. [Google Scholar] [CrossRef] [PubMed]
- Thomas, S.L.; Hyde, J.; Karunaratne, A.; Kausman, R.; Komesaroff, P.A. “They All Work...When You Stick to Them”: A Qualitative Investigation of Dieting, Weight Loss, and Physical Exercise, in Obese Individuals. Nutrition Journal 2008, 7, 34. [Google Scholar] [CrossRef]
- Basiri, R.; Seidu, B.; Rudich, M. Exploring the Interrelationships between Diabetes, Nutrition, Anxiety, and Depression: Implications for Treatment and Prevention Strategies. Nutrients 2023, 15, 4226. [Google Scholar] [CrossRef]
- Chen, R.; Chen, G. Personalized Nutrition for People with Diabetes and at Risk of Diabetes Has Begun. Journal of Future Foods 2022, 2, 193–202. [Google Scholar] [CrossRef]
- Zeevi, D.; Korem, T.; Zmora, N.; Israeli, D.; Rothschild, D.; Weinberger, A.; Ben-Yacov, O.; Lador, D.; Avnit-Sagi, T.; Lotan-Pompan, M.; et al. Personalized Nutrition by Prediction of Glycemic Responses. Cell 2015, 163, 1079–1094. [Google Scholar] [CrossRef]
- Ahn, Y.-C.; Kim, Y.S.; Kim, B.; Ryu, J.M.; Kim, M.S.; Kang, M.; Park, J. Effectiveness of Non-Contact Dietary Coaching in Adults with Diabetes or Prediabetes Using a Continuous Glucose Monitoring Device: A Randomized Controlled Trial. Healthcare 2023, 11, 252. [Google Scholar] [CrossRef]
- Basiri, R.; Cheskin, L.J. Personalized Nutrition Therapy without Weight Loss Counseling Produces Weight Loss in Individuals with Prediabetes Who Are Overweight/Obese: A Randomized Controlled Trial. Nutrients 2024, 16, 2218. [Google Scholar] [CrossRef]
- Wheeler, M.L.; Dunbar, S.A.; Jaacks, L.M.; Karmally, W.; Mayer-Davis, E.J.; Wylie-Rosett, J.; Yancy, W.S. Macronutrients, Food Groups, and Eating Patterns in the Management of Diabetes: A Systematic Review of the Literature, 2010. Diabetes Care 2012, 35, 434–445. [Google Scholar] [CrossRef]
- CDC Diabetes and Carbs. Available online: https://www.cdc.gov/diabetes/managing/eat-well/diabetes-and-carbohydrates.html (accessed on 24 September 2021).
- Bergenstal, R.M.; Beck, R.W.; Close, K.L.; Grunberger, G.; Sacks, D.B.; Kowalski, A.; Brown, A.S.; Heinemann, L.; Aleppo, G.; Ryan, D.B.; et al. Glucose Management Indicator (GMI): A New Term for Estimating A1C From Continuous Glucose Monitoring. Diabetes Care 2018, 41, 2275–2280. [Google Scholar] [CrossRef] [PubMed]
- El-Laboudi, A.H.; Godsland, I.F.; Johnston, D.G.; Oliver, N.S. Measures of Glycemic Variability in Type 1 Diabetes and the Effect of Real-Time Continuous Glucose Monitoring. Diabetes Technol Ther 2016, 18, 806–812. [Google Scholar] [CrossRef] [PubMed]
- Gorst, C.; Kwok, C.S.; Aslam, S.; Buchan, I.; Kontopantelis, E.; Myint, P.K.; Heatlie, G.; Loke, Y.; Rutter, M.K.; Mamas, M.A. Long-Term Glycemic Variability and Risk of Adverse Outcomes: A Systematic Review and Meta-Analysis. Diabetes Care 2015, 38, 2354–2369. [Google Scholar] [CrossRef] [PubMed]
- Castañeda, J.; Arrieta, A.; van den Heuvel, T.; Cohen, O. The Significance of Coefficient of Variation as a Measure of Hypoglycaemia Risk and Glycaemic Control in Real World Users of the Automated Insulin Delivery MiniMed 780G System. Diabetes, Obesity and Metabolism 2023, 25, 2545–2552. [Google Scholar] [CrossRef]
- Battelino, T.; Danne, T.; Bergenstal, R.M.; Amiel, S.A.; Beck, R.; Biester, T.; Bosi, E.; Buckingham, B.A.; Cefalu, W.T.; Close, K.L.; et al. Clinical Targets for Continuous Glucose Monitoring Data Interpretation: Recommendations From the International Consensus on Time in Range. Diabetes Care 2019, 42, 1593–1603. [Google Scholar] [CrossRef] [PubMed]
- Ben-Yacov, O.; Godneva, A.; Rein, M.; Shilo, S.; Kolobkov, D.; Koren, N.; Cohen Dolev, N.; Travinsky Shmul, T.; Wolf, B.C.; Kosower, N.; et al. Personalized Postprandial Glucose Response–Targeting Diet Versus Mediterranean Diet for Glycemic Control in Prediabetes. Diabetes Care 2021, 44, 1980–1991. [Google Scholar] [CrossRef]
- Beck, R.W.; Bergenstal, R.M.; Riddlesworth, T.D.; Kollman, C.; Li, Z.; Brown, A.S.; Close, K.L. Validation of Time in Range as an Outcome Measure for Diabetes Clinical Trials. Diabetes Care 2018, 42, 400–405. [Google Scholar] [CrossRef]
- Raj, R.; Mishra, R.; Jha, N.; Joshi, V.; Correa, R.; Kern, P.A. Time in Range, as Measured by Continuous Glucose Monitor, as a Predictor of Microvascular Complications in Type 2 Diabetes: A Systematic Review. BMJ Open Diabetes Research and Care 2022, 10, e002573. [Google Scholar] [CrossRef]
- Mohan, V.; Joshi, S.; Mithal, A.; Kesavadev, J.; Unnikrishnan, A.G.; Saboo, B.; Kumar, P.; Chawla, M.; Bhograj, A.; Kovil, R. Expert Consensus Recommendations on Time in Range for Monitoring Glucose Levels in People with Diabetes: An Indian Perspective. Diabetes Ther 2023, 14, 237–249. [Google Scholar] [CrossRef]
- Standards of Medical Care in Diabetes—2022 Abridged for Primary Care Providers. Clin Diabetes 2022, 40, 10–38. [CrossRef]
- Jarvis, P.R.E.; Cardin, J.L.; Nisevich-Bede, P.M.; McCarter, J.P. Continuous Glucose Monitoring in a Healthy Population: Understanding the Post-Prandial Glycemic Response in Individuals without Diabetes Mellitus. Metabolism - Clinical and Experimental 2023, 146. [Google Scholar] [CrossRef] [PubMed]
- Gosmanov, A.R.; Gosmanova, E.O.; Kitabchi, A.E. Hyperglycemic Crises: Diabetic Ketoacidosis and Hyperglycemic Hyperosmolar State. In Endotext; Feingold, K.R., Anawalt, B., Blackman, M.R., Boyce, A., Chrousos, G., Corpas, E., de Herder, W.W., Dhatariya, K., Dungan, K., Hofland, J., Kalra, S., Kaltsas, G., Kapoor, N., Koch, C., Kopp, P., Korbonits, M., Kovacs, C.S., Kuohung, W., Laferrère, B., Levy, M., McGee, E.A., McLachlan, R., New, M., Purnell, J., Sahay, R., Shah, A.S., Singer, F., Sperling, M.A., Stratakis, C.A., Trence, D.L., Wilson, D.P., Eds.; MDText.com, Inc.: South Dartmouth (MA), 2000.
- Davies, M.J.; Aroda, V.R.; Collins, B.S.; Gabbay, R.A.; Green, J.; Maruthur, N.M.; Rosas, S.E.; Del Prato, S.; Mathieu, C.; Mingrone, G.; et al. Management of Hyperglycemia in Type 2 Diabetes, 2022. A Consensus Report by the American Diabetes Association (ADA) and the European Association for the Study of Diabetes (EASD). Diabetes Care 2022, 45, 2753–2786. [Google Scholar] [CrossRef] [PubMed]
- Cai, X.; Zhang, Y.; Li, M.; Wu, J.H.; Mai, L.; Li, J.; Yang, Y.; Hu, Y.; Huang, Y. Association between Prediabetes and Risk of All Cause Mortality and Cardiovascular Disease: Updated Meta-Analysis. BMJ 2020, 370, m2297. [Google Scholar] [CrossRef]
- Schlesinger, S.; Neuenschwander, M.; Barbaresko, J.; Lang, A.; Maalmi, H.; Rathmann, W.; Roden, M.; Herder, C. Prediabetes and Risk of Mortality, Diabetes-Related Complications and Comorbidities: Umbrella Review of Meta-Analyses of Prospective Studies. Diabetologia 2022, 65, 275–285. [Google Scholar] [CrossRef]
- Brannick, B.; Wynn, A.; Dagogo-Jack, S. Prediabetes as a Toxic Environment for the Initiation of Microvascular and Macrovascular Complications. Exp Biol Med (Maywood) 2016, 241, 1323–1331. [Google Scholar] [CrossRef]
- Zhang, Z.-Y.; Miao, L.-F.; Qian, L.-L.; Wang, N.; Qi, M.-M.; Zhang, Y.-M.; Dang, S.-P.; Wu, Y.; Wang, R.-X. Molecular Mechanisms of Glucose Fluctuations on Diabetic Complications. Front Endocrinol (Lausanne) 2019, 10, 640. [Google Scholar] [CrossRef]
- Torimoto, K.; Okada, Y.; Mori, H.; Tanaka, Y. Relationship between Fluctuations in Glucose Levels Measured by Continuous Glucose Monitoring and Vascular Endothelial Dysfunction in Type 2 Diabetes Mellitus. Cardiovascular Diabetology 2013, 12, 1. [Google Scholar] [CrossRef] [PubMed]
- Zhang, X.; Xu, X.; Jiao, X.; Wu, J.; Zhou, S.; Lv, X. The Effects of Glucose Fluctuation on the Severity of Coronary Artery Disease in Type 2 Diabetes Mellitus. J Diabetes Res 2013, 2013, 576916. [Google Scholar] [CrossRef]
- Gomez-Peralta, F.; Choudhary, P.; Cosson, E.; Irace, C.; Rami-Merhar, B.; Seibold, A. Understanding the Clinical Implications of Differences between Glucose Management Indicator and Glycated Haemoglobin. Diabetes, Obesity and Metabolism 2022, 24, 599–608. [Google Scholar] [CrossRef]
- Fang, M.; Wang, D.; Rooney, M.R.; Echouffo-Tcheugui, J.B.; Coresh, J.; Aurora, R.N.; Punjabi, N.M.; Selvin, E. Performance of the Glucose Management Indicator (GMI) in Type 2 Diabetes. Clin Chem 2023, 69, 422–428. [Google Scholar] [CrossRef]
|
Disclaimer/Publisher’s Note: The statements, opinions and data contained in all publications are solely those of the individual author(s) and contributor(s) and not of MDPI and/or the editor(s). MDPI and/or the editor(s) disclaim responsibility for any injury to people or property resulting from any ideas, methods, instructions or products referred to in the content. |
© 2024 by the authors. Licensee MDPI, Basel, Switzerland. This article is an open access article distributed under the terms and conditions of the Creative Commons Attribution (CC BY) license (http://creativecommons.org/licenses/by/4.0/).
