Preprint
Article

Influence of the Weaving Method (Plain, Twill, Satin) on the Hydrodynamic Behavior of Filtration Membranes Based on Banana Pseudostem Fibres (Musa balbisiana)

Altmetrics

Downloads

45

Views

31

Comments

0

Submitted:

20 September 2024

Posted:

20 September 2024

You are already at the latest version

Alerts
Abstract
The way in which a filtration membrane is woven influences its lifespan and purification performance. This study explores the impact of the weaving method on the hydrodynamic sta-bility of a membrane made from banana pseudotrunk fibres. After extraction, the yarns were characterised. Three membranes were obtained using different weaving methods (plain, twill and satin), and the hydrodynamic study was used to determine the surface density, porosity, per-meability and membrane resistance. Filtration tests were carried out on a suspension of 30 NTU, and the yarn obtained had a twist number of 10, a diameter of 0.75 mm and a tex of 168. The surface density and the percentage of surface voids for the three membranes, plain, twill and satin, were 8.82 g/m2 and 50%, 12.54 g/m2 and 30% and finally 15.77 g/m2 and 12.54%. The uni membrane showed the best permeability, i.e. 5.60.10-10m2, but lower particle retention with a residual turbidity of 12 NTU, compared with the twill and satin membranes, which have per-meability values of 5.31.10-10m2 and 4.80.10-10m2 and 9 and 7 NTU.The twill membrane appears to be the most suitable for filtration.
Keywords: 
Subject: Engineering  -   Chemical Engineering

1. Introduction

Membranes separation processes play a crucial role in many separation applications ranging from waste water treatment to drinking water and the filtration of particles in food suspensions [1]. These membranes are made from synthetic polymer materials of varying compositions. The diversity of their chemical compositions give them excellent properties (rigidity, flexibility or elasticity, mechanical and chemical resistance). This is why their annual production has risen from 1.5 million tonnes in 1950 to more than 350 million tonnes today and it is still growing steadily after use, synthetic polymers are released into the environment causing major environmental problems [2,3]. At the end of their useful life, these filters are discarded in the natural environment. Ingestion of the fragments causes internal injuries or blocks digestion, increasing morbidity and mortality in living creatures. It is estimated worldwide, around half of all sea turtles have ingested these polymers, although the exact proportion is not known [4]. The small size of microplastics facilitates their passage through gastrointestinal membranes and their distribution in tissues and organs resulting in the induction of oxidative stress, genome instability, disruption of the endocrine system, reproductive abnormalities, embryo toxicity and trans-generational toxicity [5,6]. Nowadays, the widespread awareness of ecological and socio-economic imperatives, the search for sustainable green technologies, the growing problem of waste, environmental legislative standards and the depletion of fossil resources have led scientific research to focus on the development of membranes based on natural fibers [7,8,9]. Natural membranes such as cotton, coconuts, flax and hemp offer many advantages in the field of water treatment. They are biodegradable, renewable and require less energy to produce [10]. What's more, their molecular structure gives them a high affinity for certain pollutants such as heavy metals, oils and dyes [11,12]. But setting up a natural membrane requires prior study as with weaving. Several weaving modes influence the hydrodynamics and efficiency of a natural membrane depending on its nature [13,14,15,16,17,18]. The weaving mode can be twill, satin or plain and the choice of a weaving mode will depend on the hydrodynamic behaviour and filtration performance of the membrane. Hence the interest of this work is to choose the best weave that gives the best hydrodynamic and filtration behaviour for woven membranes from banana pseudo-stem fibers.

2. Materials and Methods

2.1. Banana Pseudo-Stem

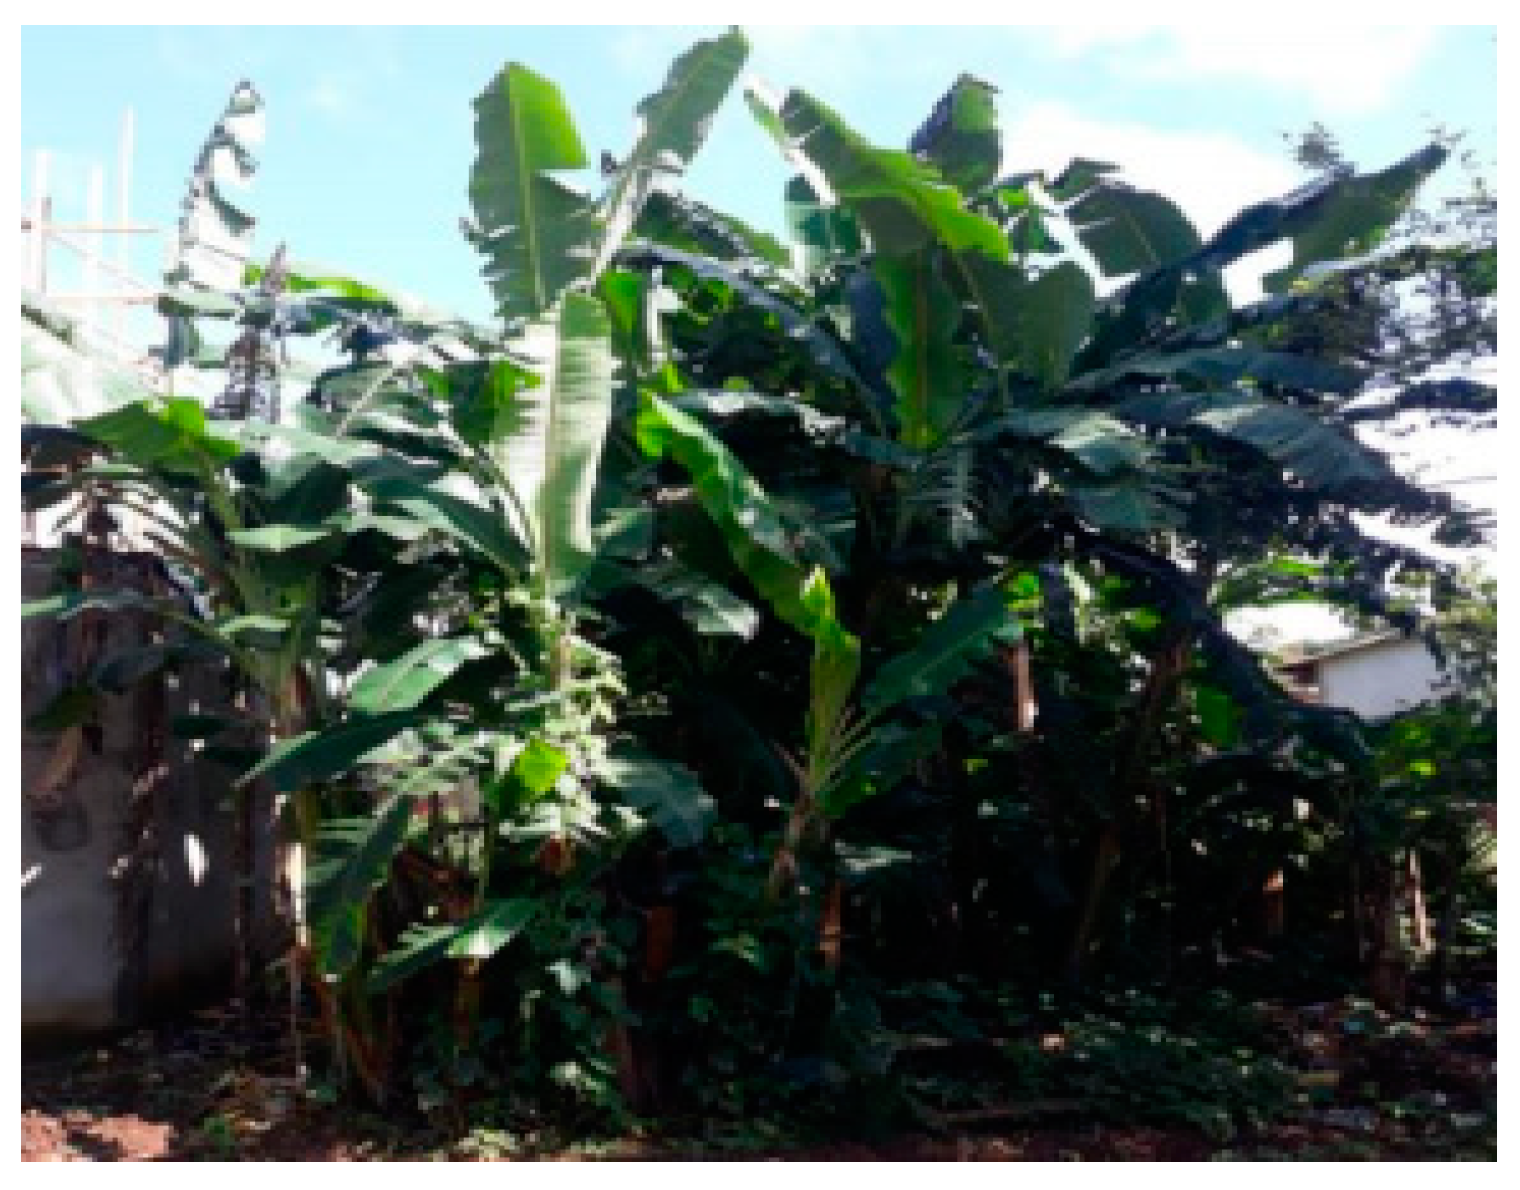
The banana pseudo-stem (Figure 1) used in this study comes from banana trees in a field in Ngaoundere (Cameroon) at coordinate points 7.422080 N and 13.544220 E (Figure 2). It is approximately 1m long, 30cm in diameter and belongs to the Musaceae family.

2.2. Filtration Pilot

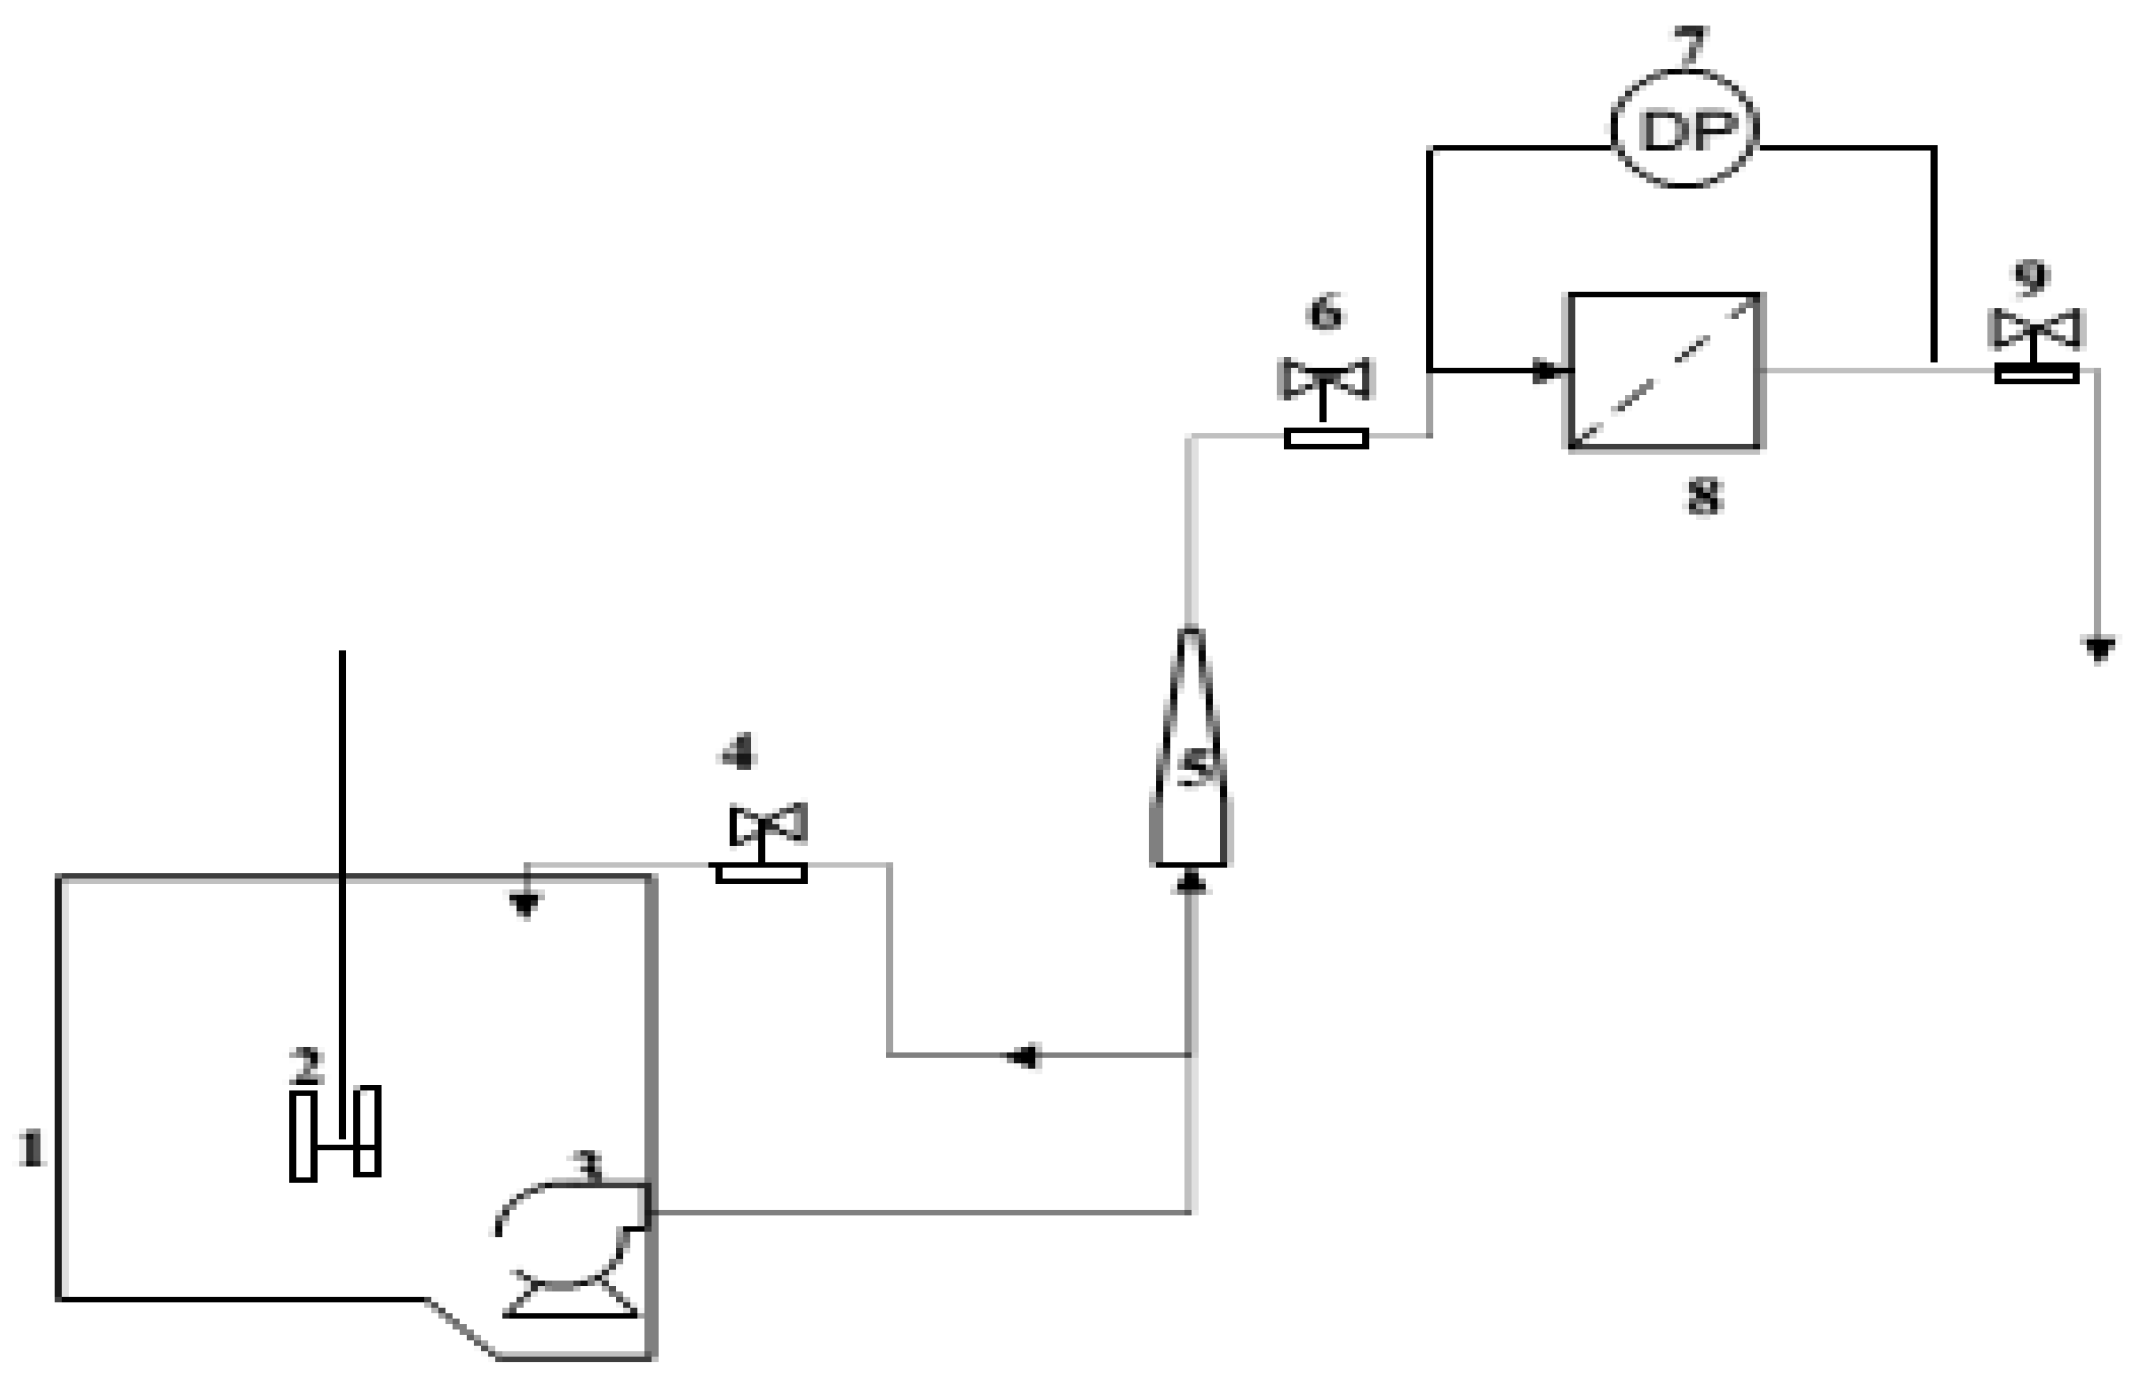
In order to carry out this study, we set up a filtration test pilot. Figure 3 shows the set up of the filtration test pilot.
The operation of this pilot starts with a stirring tank, where a pump draws the solution towards the filtration module via a flow meter. A digital manometer is fitted to the filtration module to measure the transmembrane pressure (TMP).

2.3. Preparation of the Concentration Suspension

The laterite was sampled at Ngaoundere third in the locality of Gada Mbidou at the following geographical coordinates 7.4167420 North and 13.5547060 South according to the AFNOR NF P94-202 1995 standard and the preparation of the suspension was carried out according to the method of [19].

2.4. Extraction of Banana Fibers

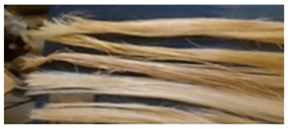
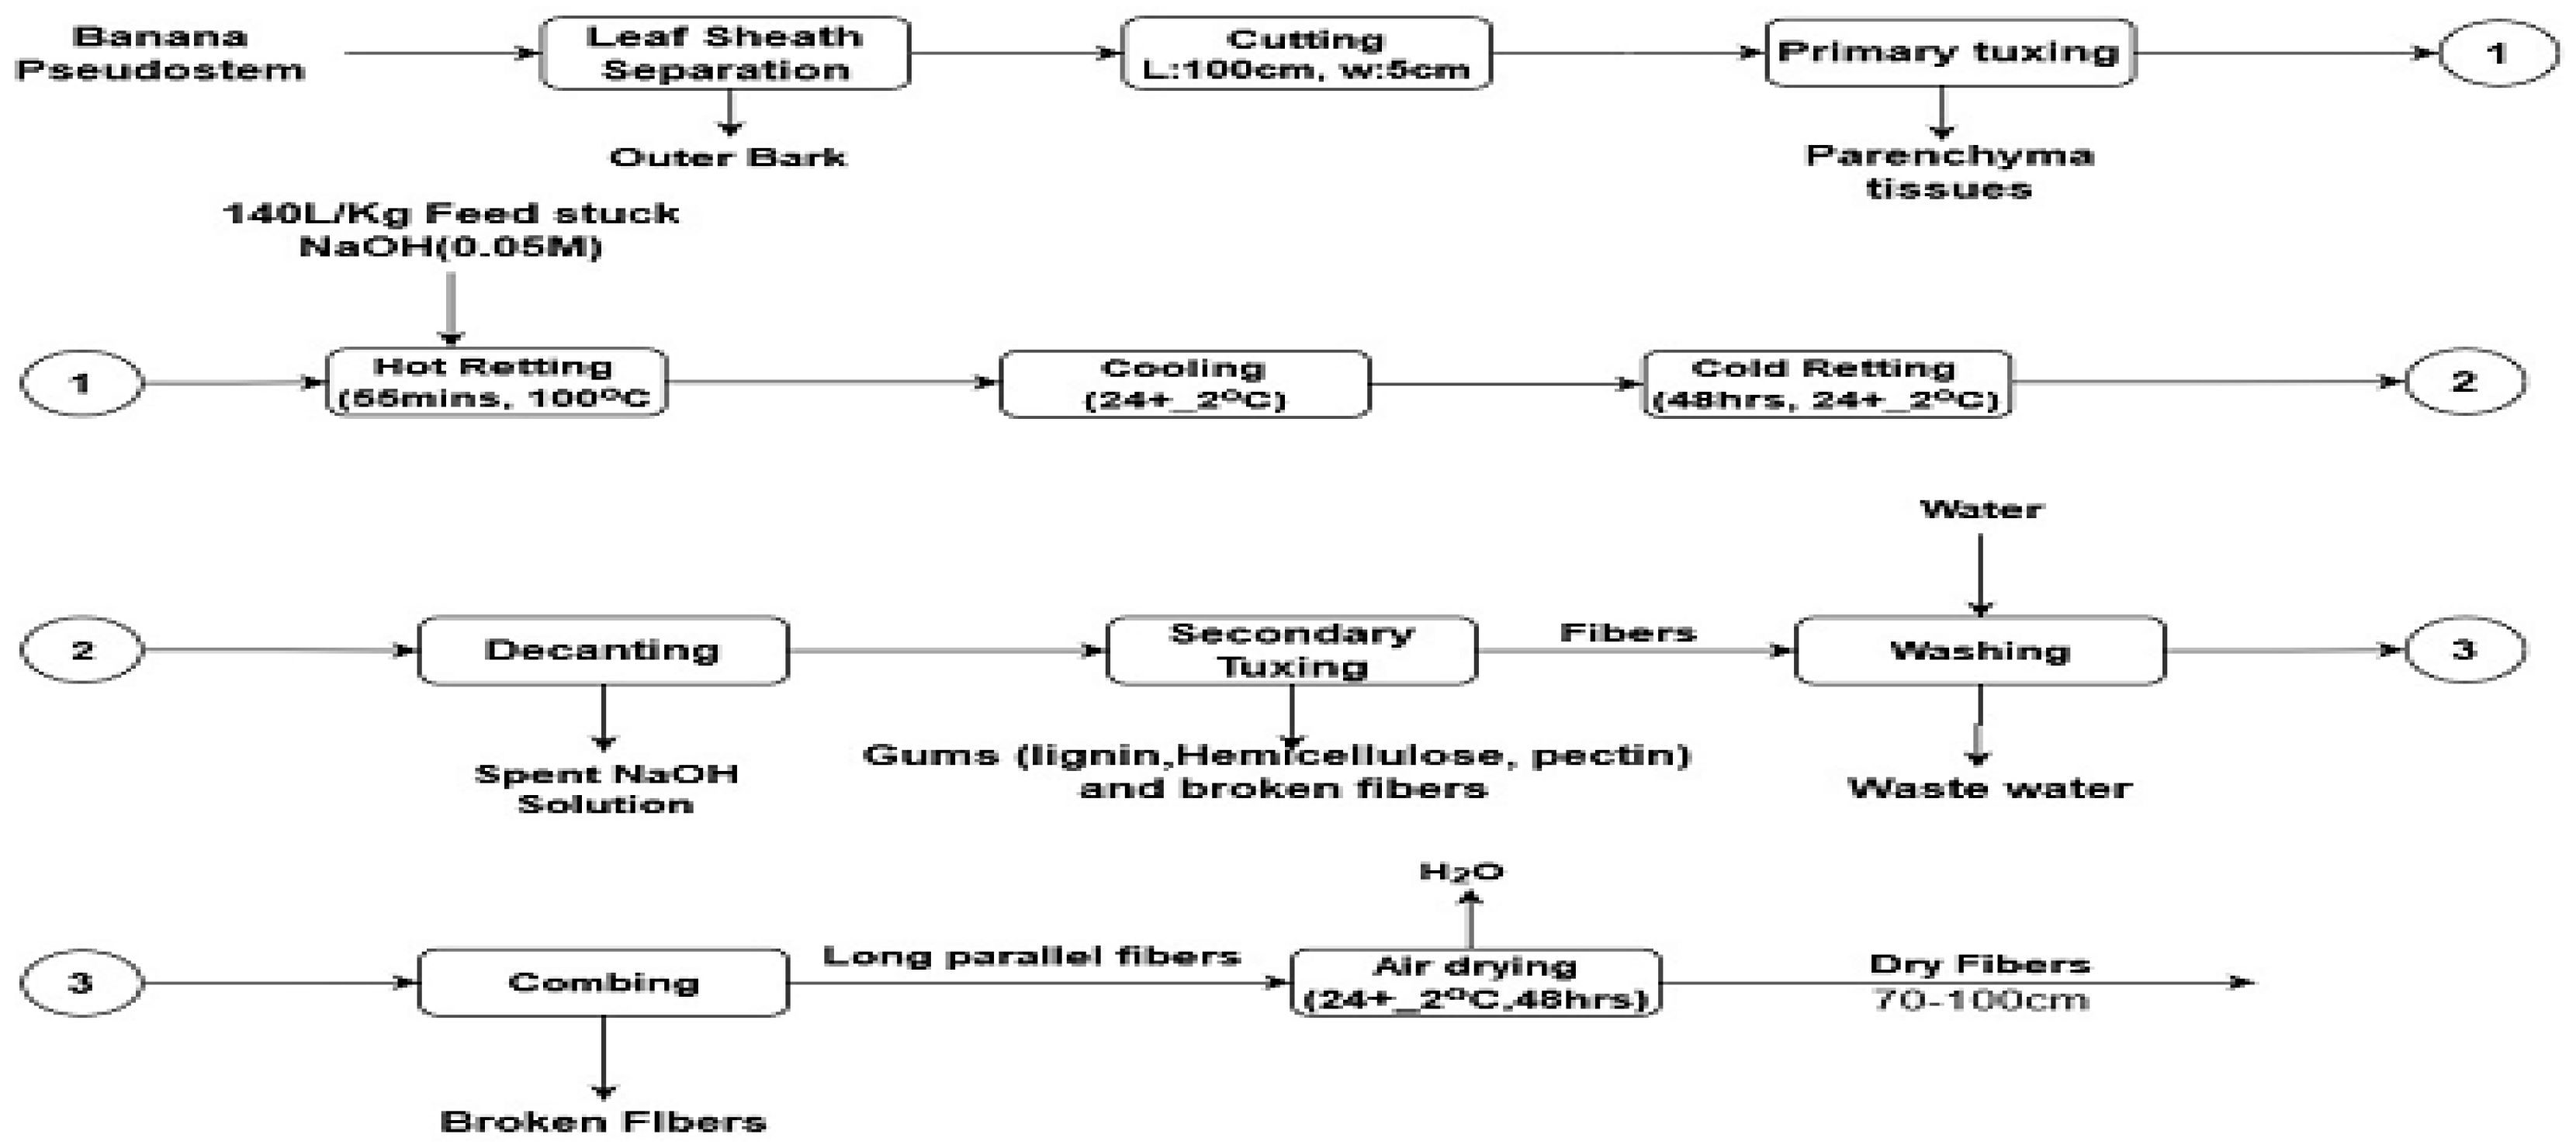
Banana fiber is extracted using the modified method of [20]. The aim is to obtain fibers of good length as shown in Figure 4.

2.5. Characterisation (Density, Cellulose Content and Breaking Strength) of Untreated and Treated Fibers

The cellulose content of the fibres was determined using the ISO 6865 method, density according to standard (NF T 51-003) and ASTM D570 was used to measure the absorbed water content (swelling test). The manual method of pulling fibers at different weights was used to obtain rapid measurements of breaking strength. Assuming that the woven fibers have a cylindrical geometry, we set a height of 3.5cm and a diameter of 1mm.

2.6. Banana Fiber Yarn Production and Characterisation

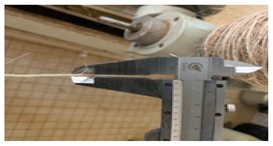
The spinning operation was carried out in the ''S'' direction (clockwise), on a number of 10 turns, the diameter of the yarn over its entire length was monitored using the calliper inorder to produce yarns with uniform diameters.

2.6.1. Fineness

Fineness is one of the characteristics of fibres and is measured in Tex. A unit of linear mass equal to 1 gram of fiber per kilometre of length. This expression can also be used to evaluate the fineness of the fibre or yarn in tex [21].
T e x = 590,6 . W . l L . w
where : W is the Fiber mass, L is the fiber length, l is the unit of sample length (840yards or 768.096m) and w is the unit of mass of the sample (453.6g).

2.6.2. Porosity

The porosity of the yarn (equation 3) depends on the number of spinning operations carried out during the manufacture of the yarn, as well as the diameter of the yarn. This influences the pressure and therefore reduces the filtration efficiency [22] (Kanade et al., 2016). Considering the density of the fibre which is 1.03 g/cm3 [23]. The value of fiber packing (ϕ) is given by the expression of [24]. This value of ϕ is calculated using equation 2.
= 3.37 * 10 3 * T e x ^ 2 [ D * ρ s ] ^ 2
The value of packing and porosity are inversely related such that, a high value of packing leads to low porosity and can therefore be given by the following expression:
Porosity=1−∅

2.7. Manufacture and Characterisation of the Membrane
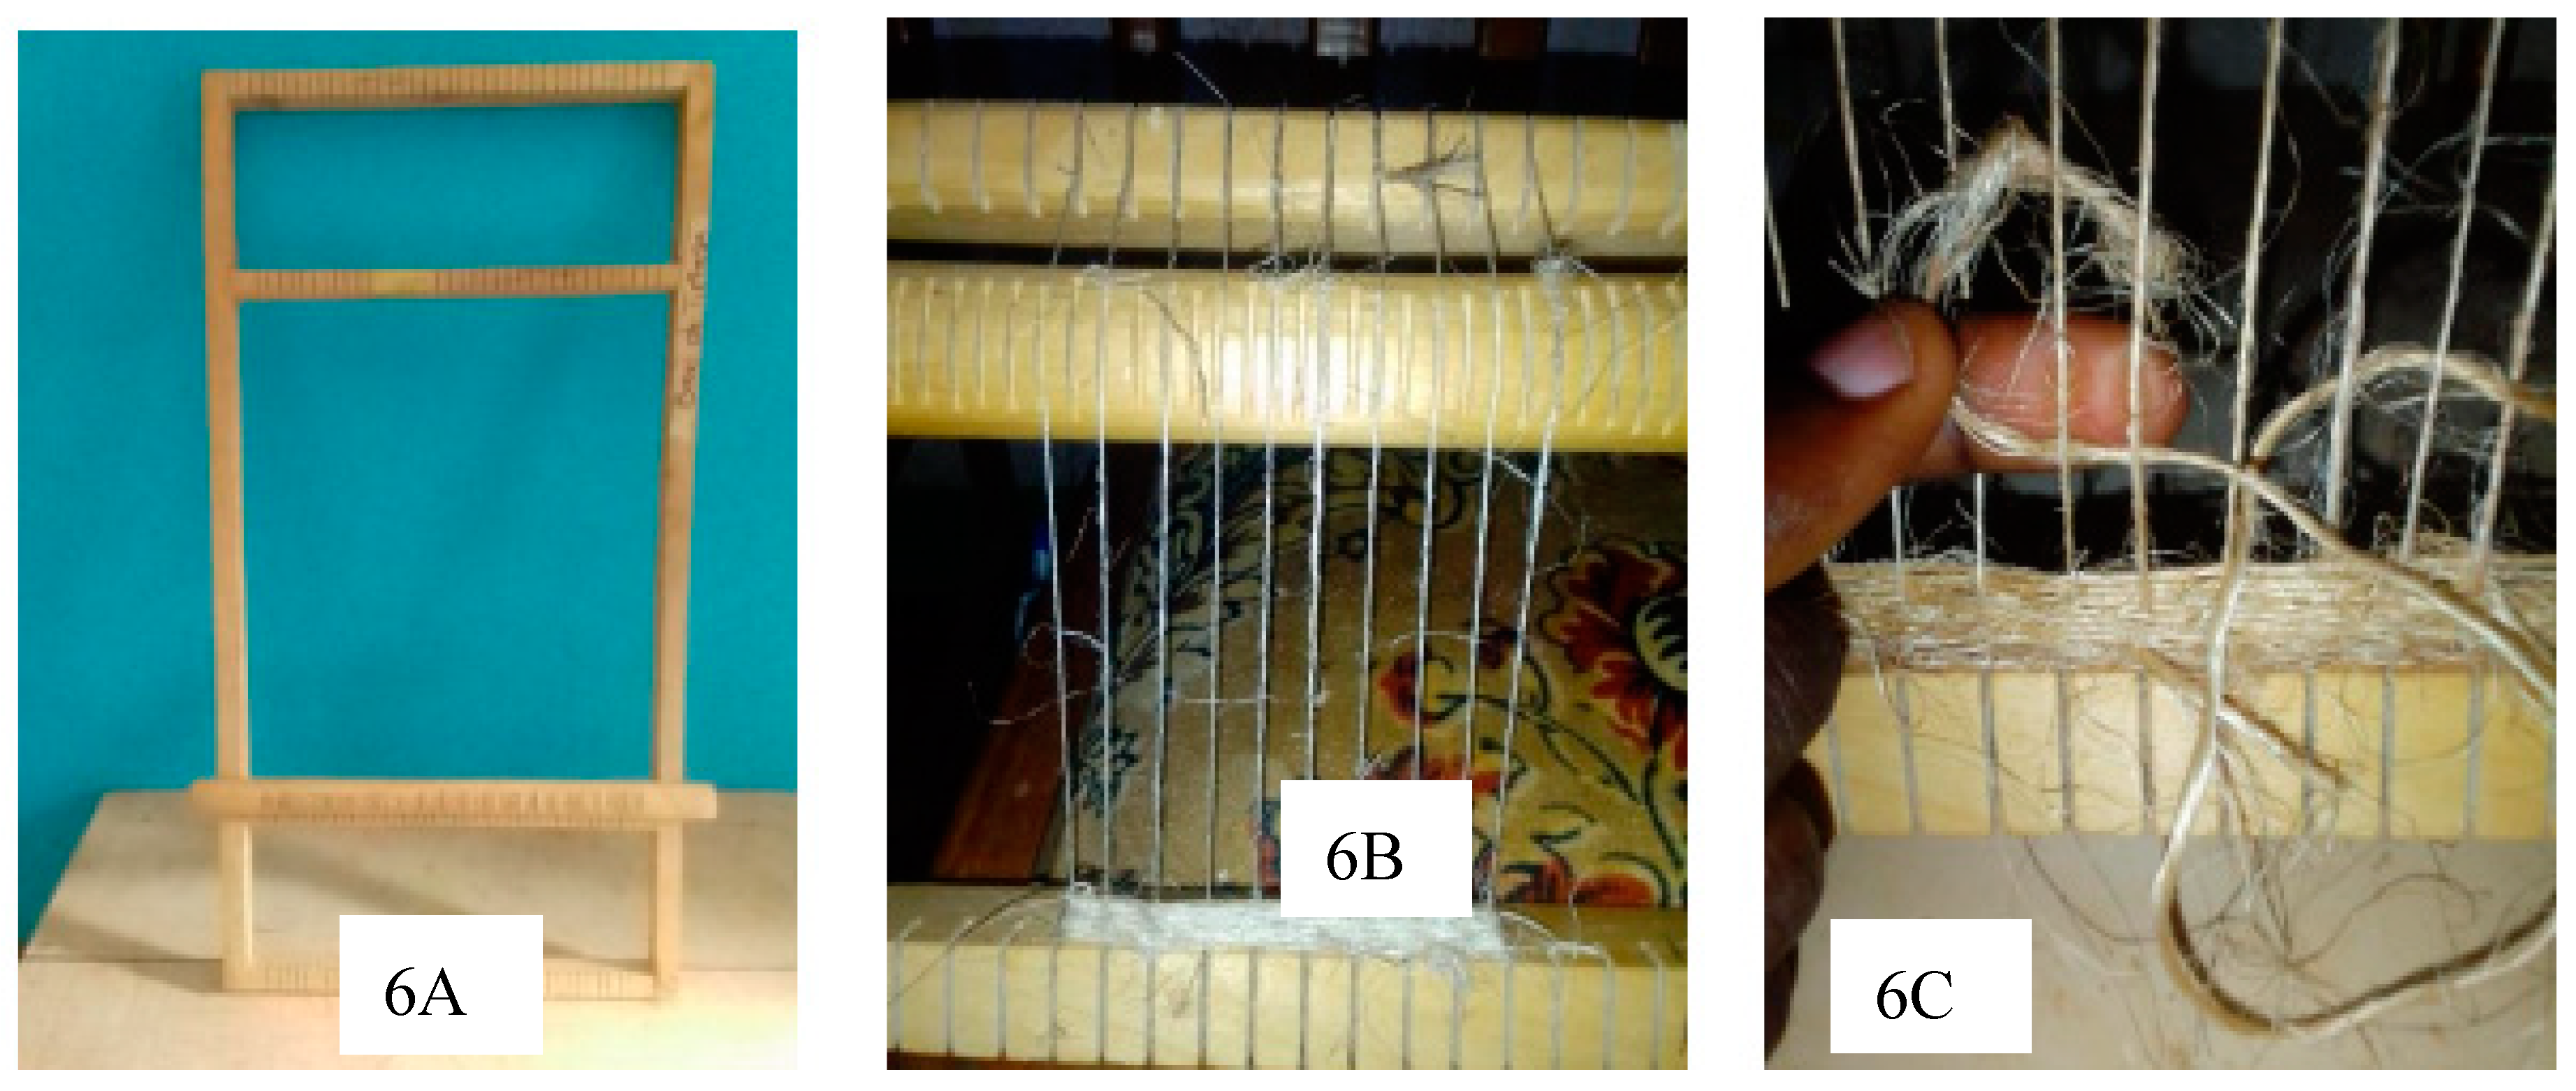
In order to produce a flat filter element, a weaving loom (Figure 6A) was used. This loom has 3 zones allowing the desired surfaces to be produced, a smaller zone (792cm2), a medium zone (3480cm2) and a larger zone of 4800cm2. The loom was then armed with banana fibre yarns (Figure 6B) as warp and weft yarns in order to produce plain, twill and satin weaves (Figure 6C).
Figure 5. Stages in the production of woven membranes from banana pseudo-stem fibres (loom (6A), warp, weft yarn (6B) and weaving (6C).
Preprints 118786 g005

2.7.1. Surface Density of the Membrane

The surface density of a membrane refers to the number of threads used in the design of a fabric per unit area. In filtration, the density of a woven filter element is a characteristic that can influence its permeability and is a factor to be taken into consideration when choosing a filter element. Its expression (equation 4) according to [25] is as follows:
D s ( g / m 2 ) = M a s s e o f f i l t e r m e d i a F i l t e r m e d i a s u r f a c e a r e a

2.7.2. Membrane Porosity

With Ds the surface mass of the membrane (g/m²), e its thickness (m) and ρ f the density of the fibers (g/m3). The expression for the porosity of the membrane according to [1] is as follows:
ε = 1 D s e . ρ f

2.7.3. Experimental Determination of Membrane Permeability and Resistance

These tests were carried out using osmosis water, as this is free from clogging materials. When the system was set up, the membrane was immersed in the distilled water contained in the housing. After running the system for 1 hour, increasing filtration flows were imposed and the transmembrane pressure (TMP) was measured using an electronic manometer (KELLER MANNO 200 Model LEO 2, USA). Knowing the physico-chemical properties of the water (in particular the viscosity at the temperature of the test bath), the application of Darcy's generalised law in a filtering medium (equation 6) enabled us to determine the membrane permeability [26,27]. The specific resistance R is simply deduced from the equation (equation 7) and is the inverse of the permeability. Its expression is represented by equation (equation 8).
J = T M P η R ;
J = Q f S ;
R = 1 η L p .
J: Permeate flux (m3.m-2.s-1), Qf: Permeate flow rate (m3.s-1), Lp: Membrane permeability to solvent (m-2), S: Membrane surface area (m2), TMP: Transmembrane pressure (Pa), n: Permeate viscosity (Pa s), R: Membrane resistance (m-1).

2.8. Conducting Pilot Tests

These tests were conducted with a 300 NTU suspension at a constant pressure of 0.1 bars and in a laminar flow regime. The permeability values for the different membranes were calculated using Darcy's equation [1,26].
Q = β . ( P ) μ f . e
With : β the coefficient of permeability in m2 , ∆P the pressure drop in Pa , Q the volume flow rate in L/min , μf the dynamic viscosity of the fluid in Pa.s , e the membrane thickness in m.

2.9. Particle Size Distribution of Sludge (Cut-off Threshold)

The particle size distribution in water was determined using a MASTERSIZER (HYDRO 2000SM) laser granulometer from MALVERN Instruments (UK). It is used to obtain the particle size distribution of a sample (<100μm) in the form of a frequency curve. All particles illuminated by a laser beam diffract light in all directions with an intensity distribution that depends on their size.

2.10. Clogging Power Evaluation Parameter

The resistance αC and the specific resistance α were calculated from the experimental data and equation 10 [28].
Preprints 118786 i001
where: t is the time in s, V is the volume filtered m3, S is the membrane surface area in m²,α is the specific resistance of the deposit in m.kg-1 and C is the membrane concentration in kg.m-3.

3. Results and Discussion

3.1. Fibers Characteristics

Table 1 shows that the water content is 17.76 (%), which is higher than the values found by [29,30,31], who obtained a water content (%) of 10-11% with an average length of 2cm. The length of the fibers obtained was 85.45cm. This difference can be explained by the extraction procedure: [31] used biological extraction, while [23] used soda extraction followed by sun drying. Here, the fibers were stored in an air chamber. This results in a relatively high water content. According to [20], fibers that are too dry lead to breakage and fibre loss during combing. It should be noted that the higher the moisture content of the fibre, the higher the pith content and the more likely it is to be attacked by bacteria [3,32]. For this reason, the process modified by [20] proved to be the most suitable for producing fibres suitable for the production of woven filter media. The swelling test was 81.51% demonstrating the hydrophilic nature of banana fiber, a feature sought after by most filter media designers in order to minimise the resistance to the passage of water through the filter media which is greater when the fiber is hydrophobic.
Table 1. Fibers characteristics.
Characteristics Valors Preprints 118786 i002
Extraction yield (%) 5,90
Water content (%) 17.76
Fiber length (cm) 85.45
Swelling (%) 81,51

3.2. Wire Characteristics

Table 2 shows that the yarn has a length of 0.75mm in diameter, the maximum torsion supported by the fibres is 10, beyond which the yarn breaks and the yarn obtained at the end of the process has a fineness of 168 Tex with a porosity of 0.5. These values are typical of the yarns used to manufacture natural membranes. This confirms the importance of the extraction method. In fact, this technology is used in the production of smooth filaments creating an effective porous yarn for deep retention and microfiltration membranes [20,29,33].

3.3. Characteristics of the Filter Media

Three basic types of weave were used (plain, twill and satin). Table 3 shows the characteristics of these membranes after production.
Table 3 shows that characteristics such as mass, number of warp interlacings and surface density of the media are a function of the different types of weave. The difference between the plain-twill media is 2.63g/m2 and that between the twill-satin media is 2.28g/m2. From these observations, it follows that the twill weave in terms of retention is closer to the satin media, whereas the difference in porosity between the plain-twill membranes is 0.14, whereas the difference between the twill-satin membrane is 0.08. From this observation, we can conclude that there is not a very significant difference in porosity between the twill and satin membranes [33]. Compared to filter media used in filtration such as polypropylene, these different types of weave offer very good efficiency [22]. However, the specific filtration efficiency depends on the material such as banana pseudo-stem fibers which have a larger diameter which results to larger pore sizes, compared with polypropylene fibers whose diameter can be controlled during the manufacturing process, such as weaving and calendering, to produce effective membranes, particularly for capturing smaller particles [34].

3.4. Membrane Permeability and Resistance
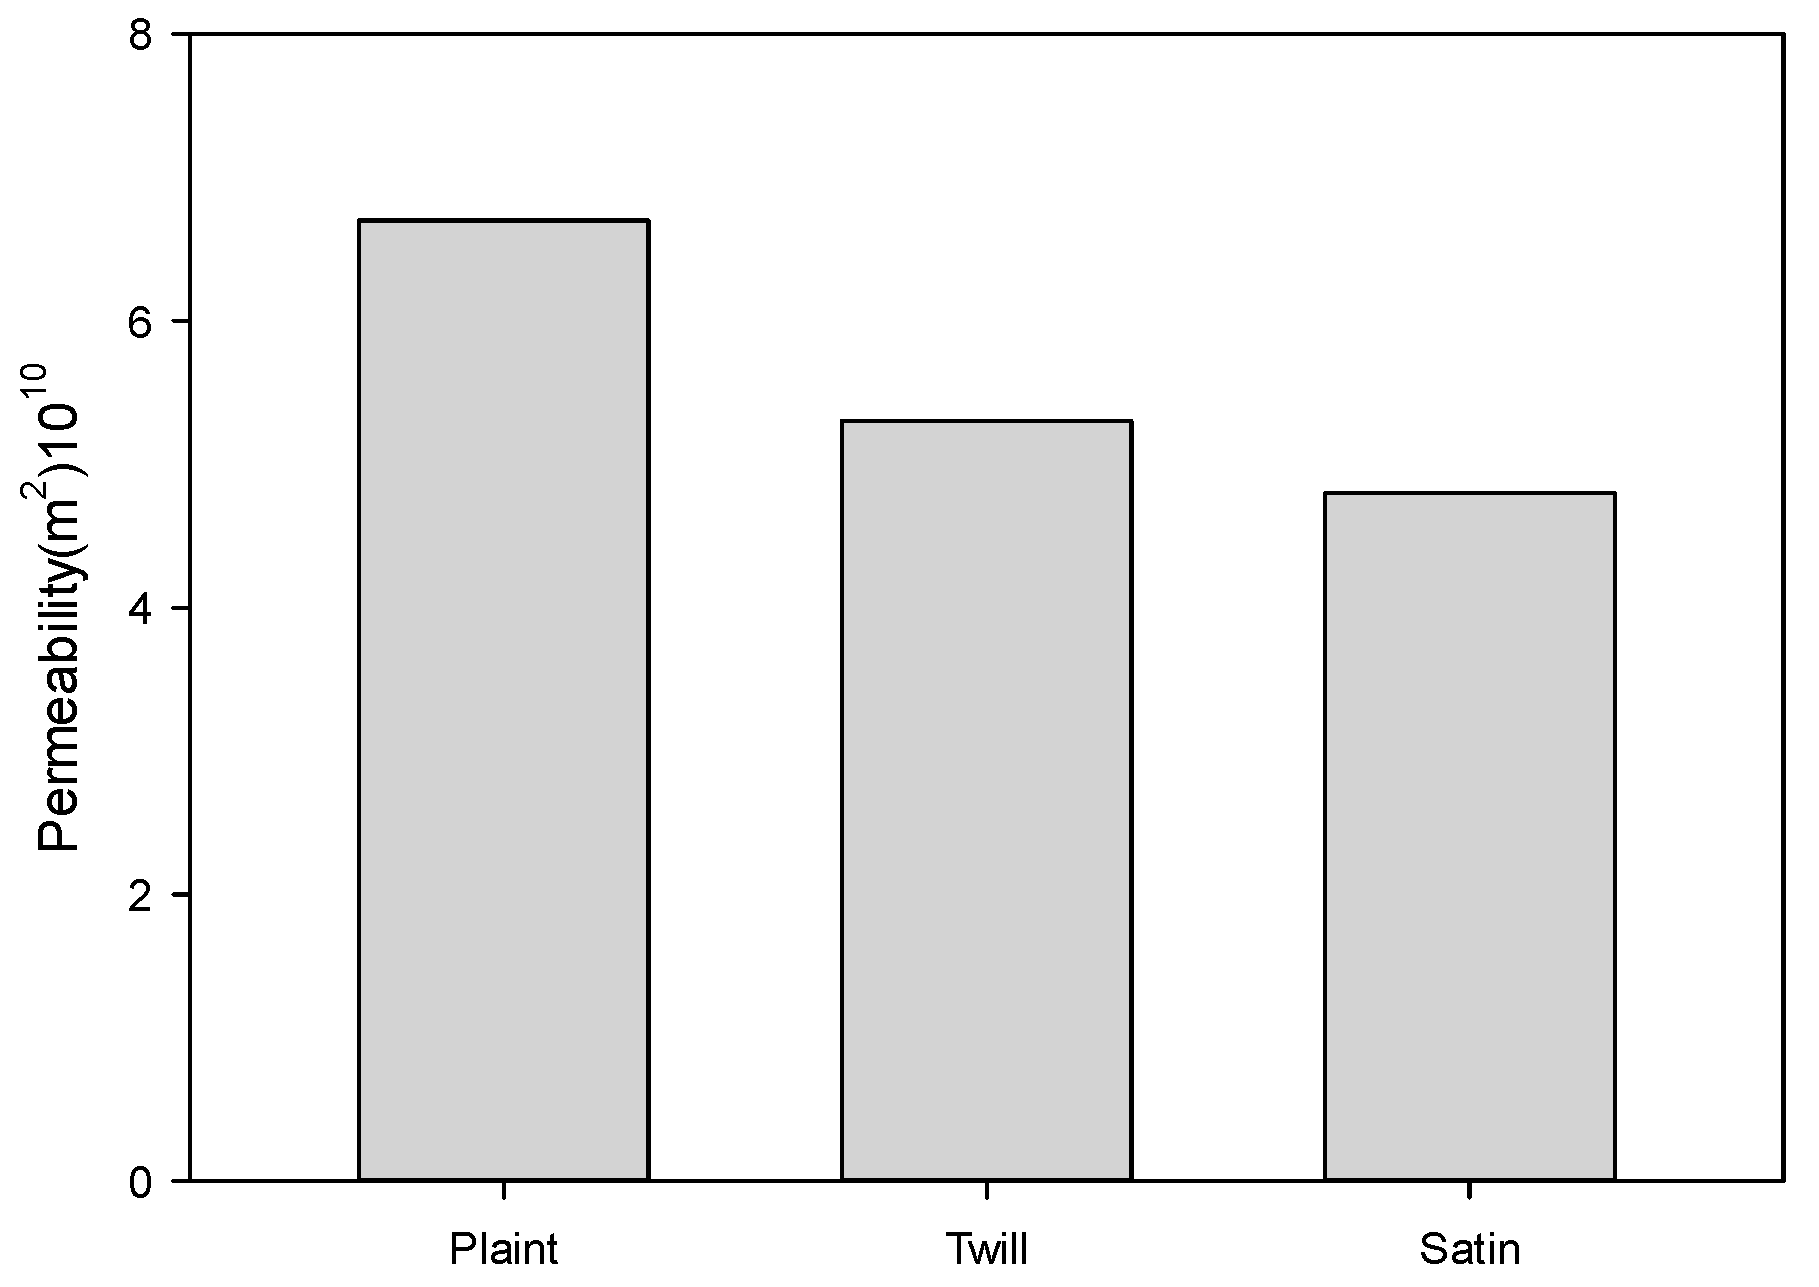
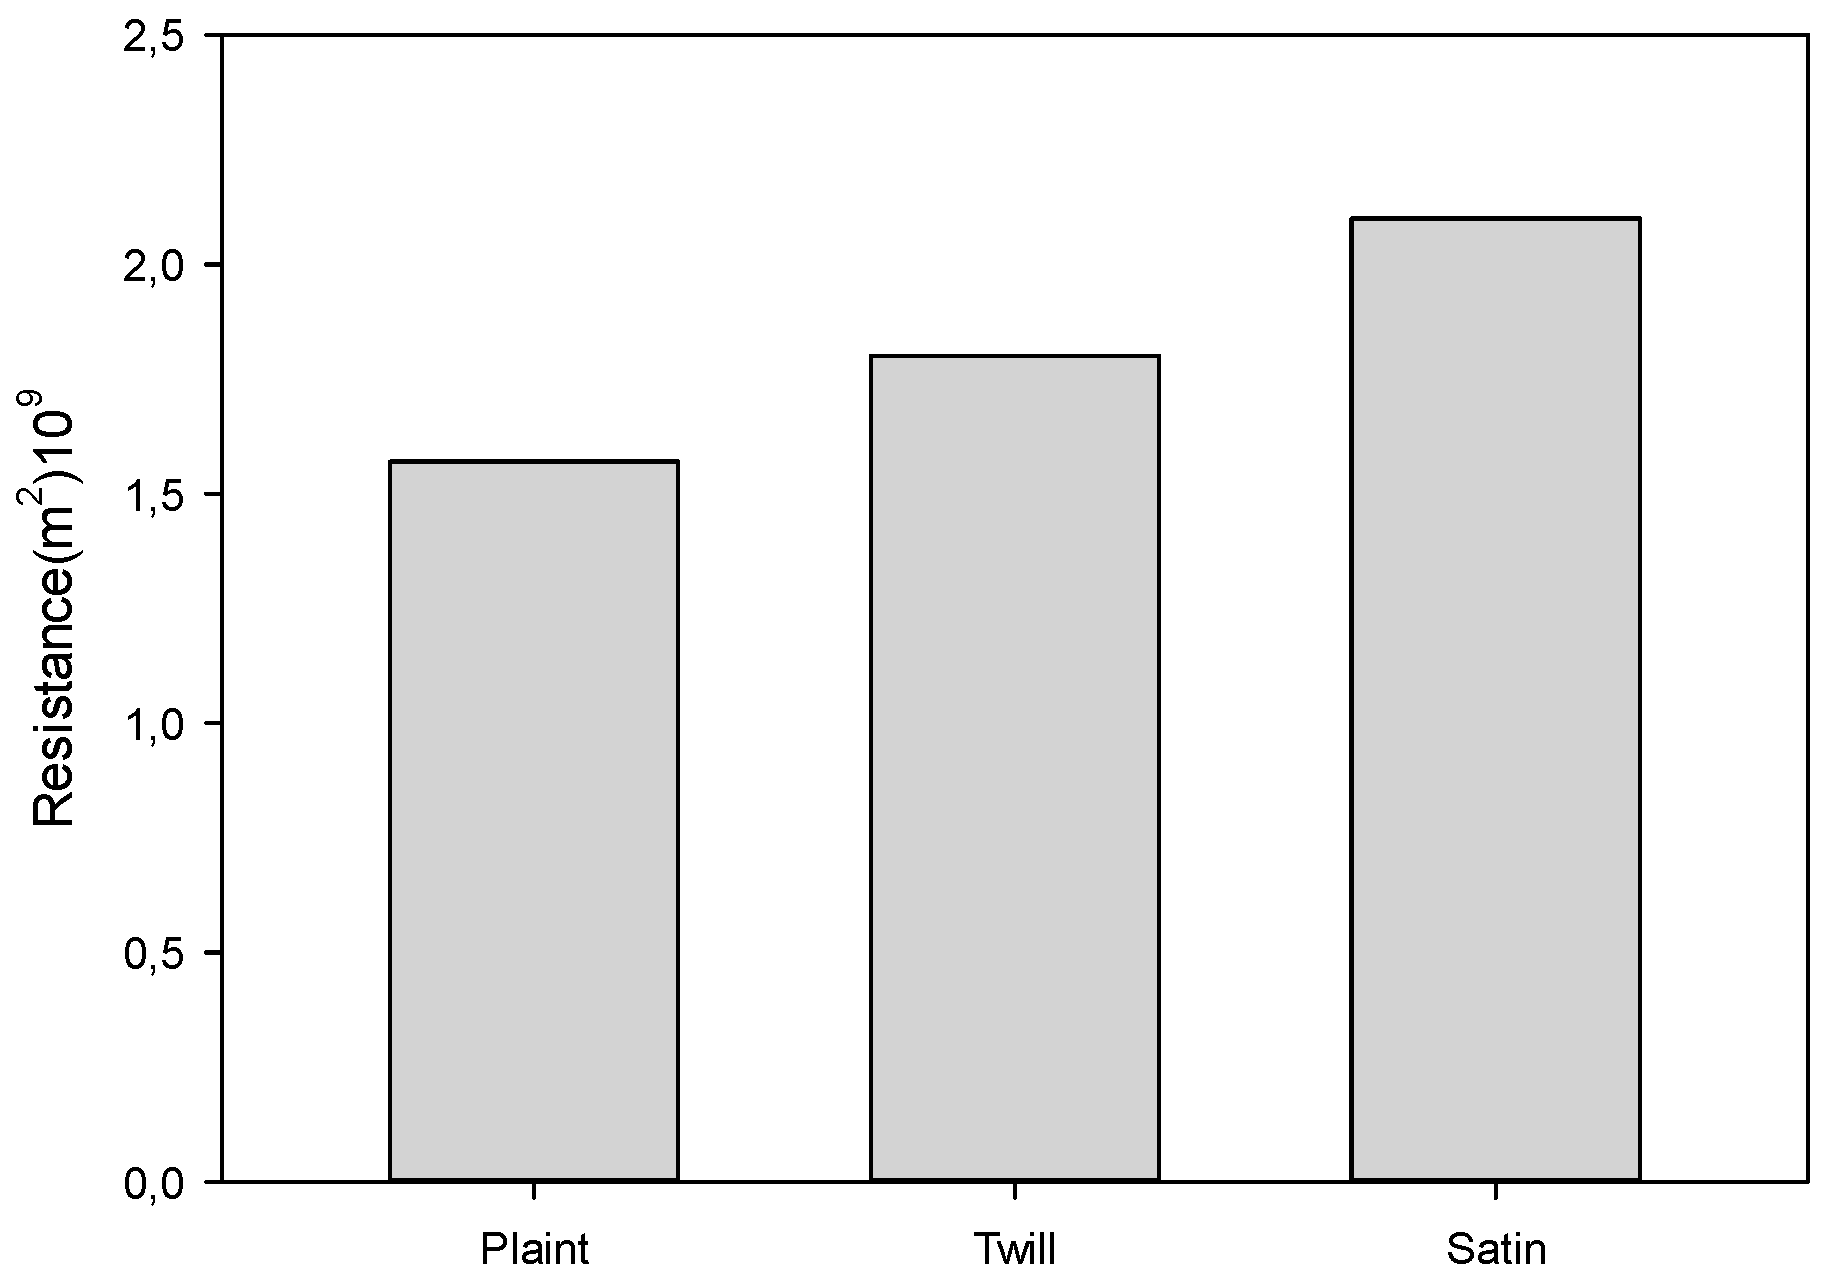
Figure 6 shows that the plain, twill and white satin weaves give us permeabilities of 5.60.10-10 m2 , 5.31.10-10 , 4.81.10-10m2 . By evaluating the standard deviation of permeability between the membranes, we can see that there is a difference of 2.05.10-11m2 for the plain and twill weave, and 3.53.10-11 m2 for the twill and satin weave. We can therefore deduce that the twill weave gives us a membrane with a permeability of 2.05.10-11m2 close to that of the plain membrane. This result is in line with the findings of [18], who studied the permeation rate of water through woven membranes and concluded that the type of weave influences the thickness of the membrane, which in turn has an effect on the permeation rate of the membrane. By observing the difference in porosity, the twill membrane is closer to the satin membrane and we can conclude from this observation that this type of weave allows for tighter meshes and gives the hydrophilic nature of the fibres. This facilitates the flow of fluid within the membrane with a resistance value of 1.8.109m-2. Figure 7 on the other hand, shows the histogram of flow resistance as a function of weave type. It can be seen from this histogram that the type of weave affects resistance and the weave with the greatest resistance is the satin type. This can be explained by the fact that interweaving the threads by overlapping them makes the latter denser, which increases resistance to the passage of water through the membrane. This difference can also be explained by the thickness of the woven membranes [35].
Figure 6. Permeability as a function of weave type.
Preprints 118786 g006
Figure 7. Influence of weaving method on strength.
Preprints 118786 g007

3.5. Evaluation of the Flow Generated as a Function of the Pressure Drop

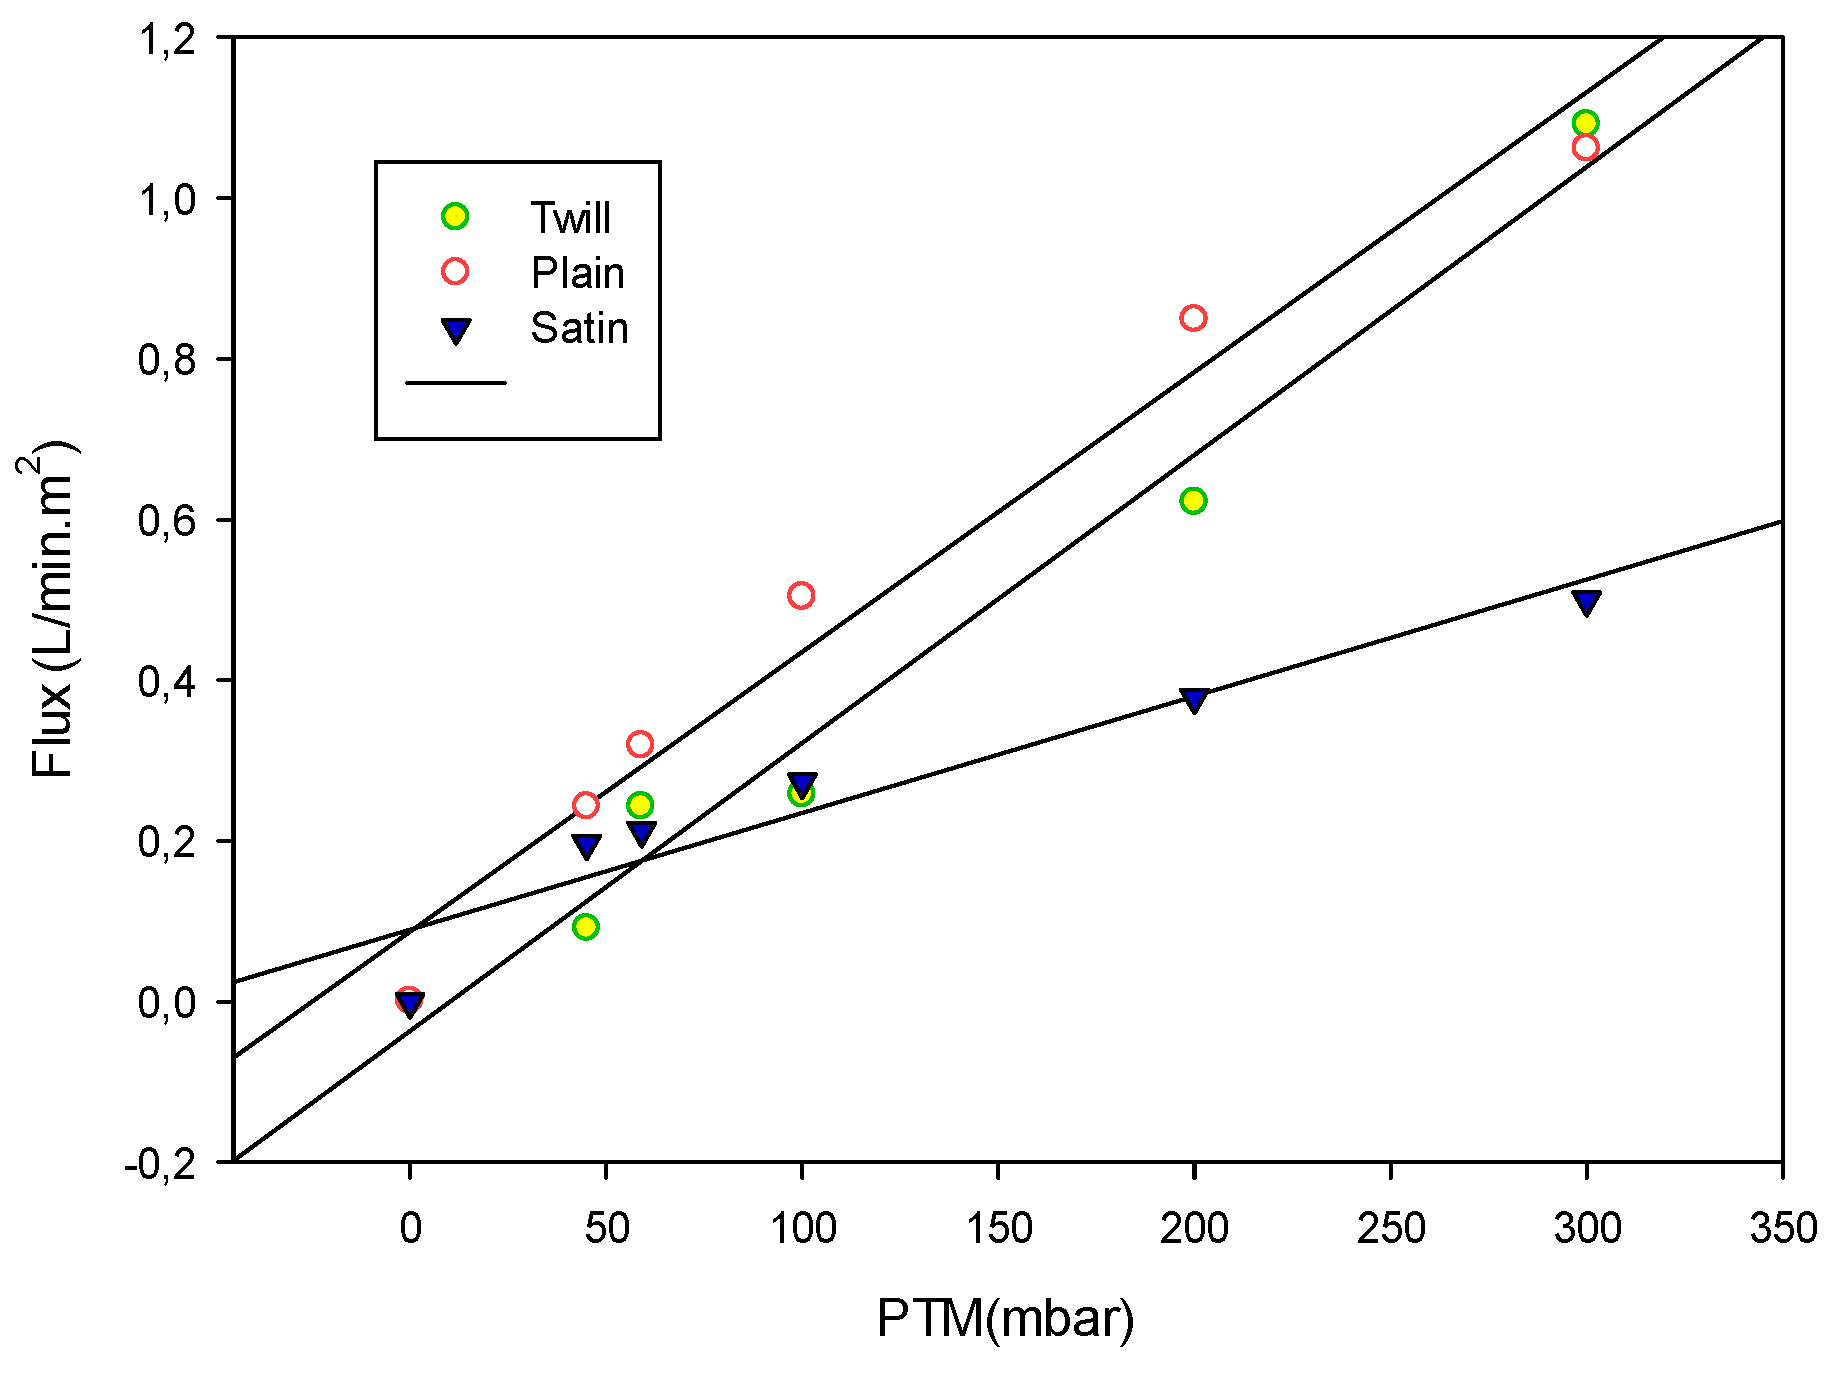
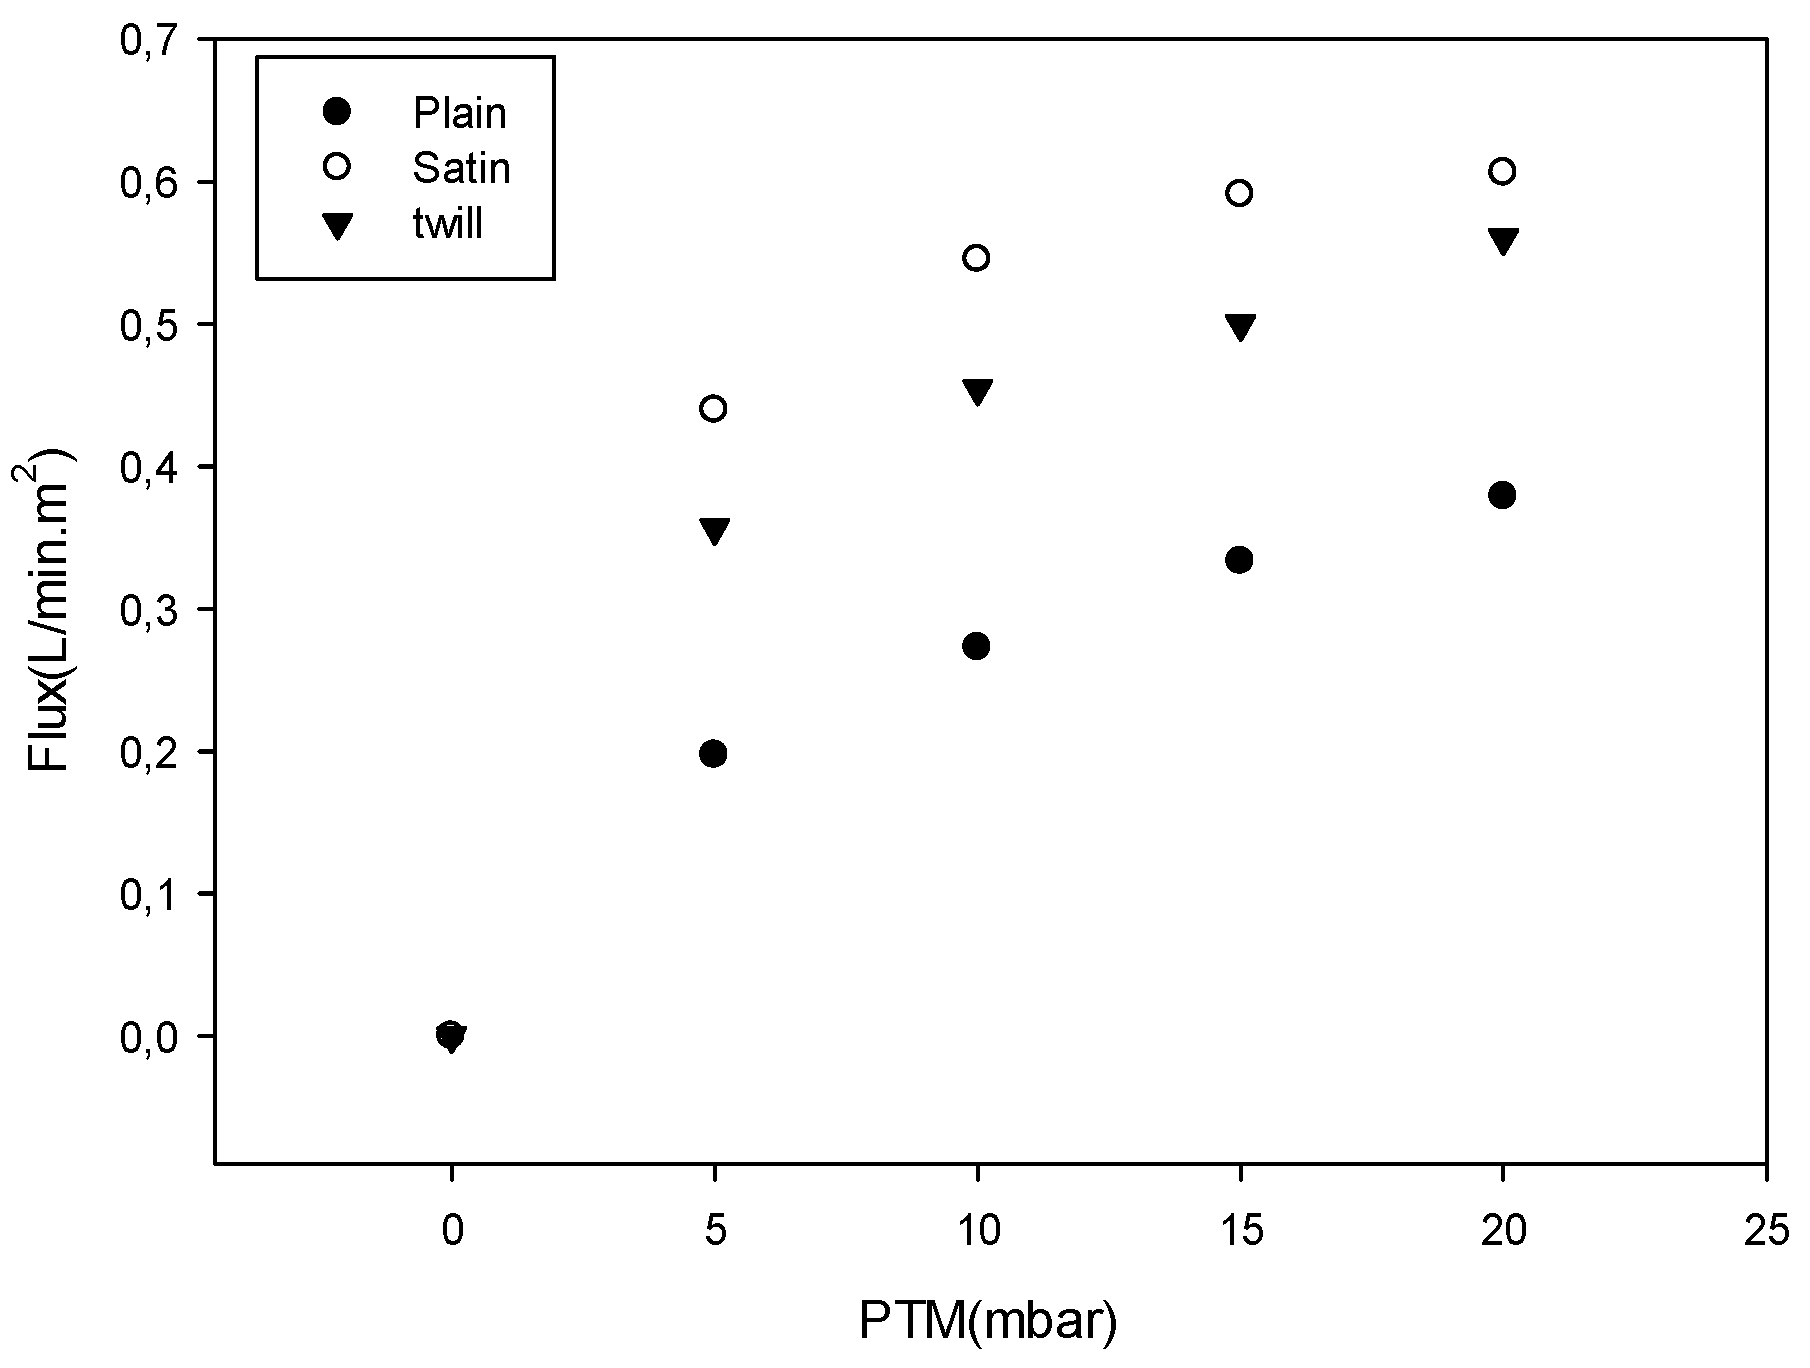
The curves in Figure 8 and Figure 9 show an increase in flux whatever the membrane and operating conditions. However, in Figure 8 this evolution is linear showing that our curves obey Darcy's law [21]. The blank transmembrane pressure (TMP) as a function of the flow generated for each of the filter media shows for a maximum value of TMP (300mbar), flow values of 0.75L/min for the unit membrane, 0.59 L/min for the twill membrane and 0.33 L/min for the satin membrane. The observed flux values can be explained by the resistance and permeability histograms presented above, given the manufacturing variability, the low flux obtained by satin weave is due to the high resistance observed in Figure 6. For the membranes obtained by twill and plain weaves, the maximum value of linear flux generated is much higher than the flux obtained by the satin membrane. This can be explained by the fact that satin weave makes it possible to obtain membranes with a low porosity (0.18) as shown in Table 3. On the other hand, in Figure 9, under filtration test conditions, the flux does not follow Darcy's law. The drop in flux as a function of the type of weave is proportionally linked to the porosity values of the membranes due to the fact that the particles in suspension have more or less the size of the pores in each membrane. It should also be noted that the less porous the filter media, the greater the speed at which the cake is formed, which is observed in the case of satin-finish membranes. In conclusion, PTM is caused by the combination of two resistances to flow present under operating conditions such as the resistance of the membrane and that of the cake formed.

3.6. Effect of Weaving Method on Turbidity

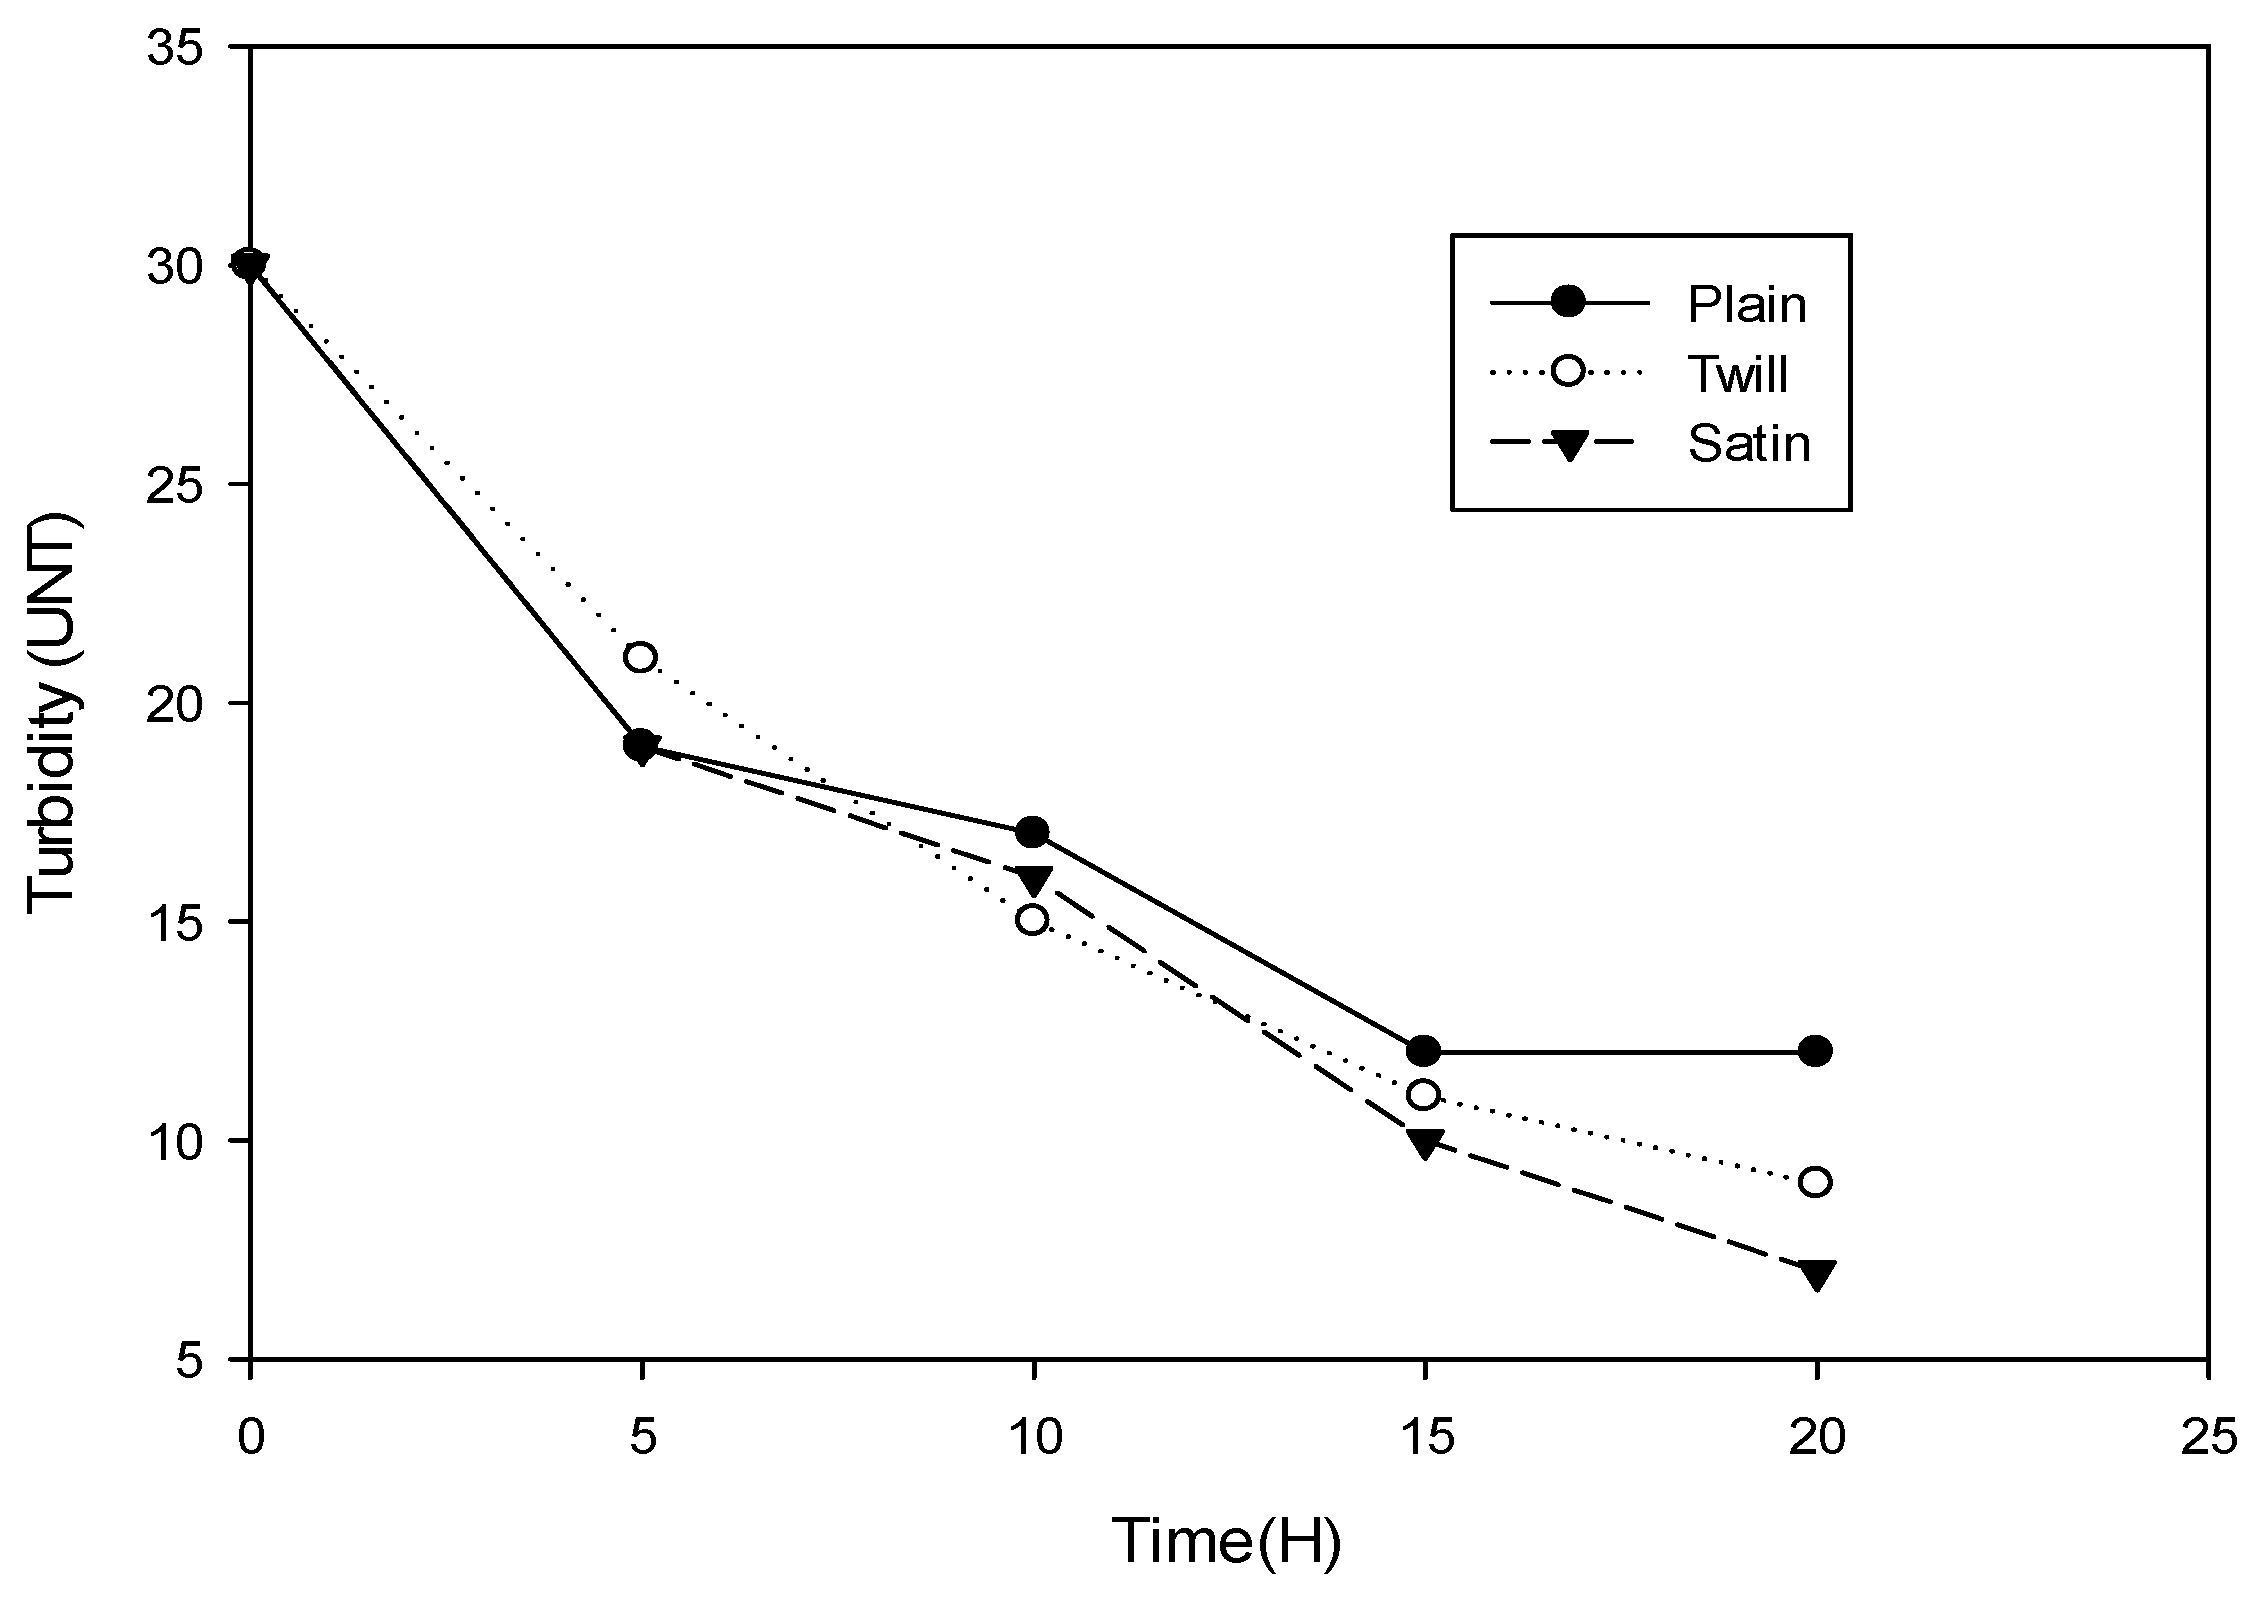
Figure 10 shows the variation in turbidity as a function of the type of woven media.
These observations show that for the three types of membrane, turbidity decreases as a function of time from an initial value of 30 NTU to final values of 12 NTU for plain weaves, 9 NTU for the twill membrane and 7 NTU for the satin membrane. 70.33% turbidity abatement for the plain media, 82.33% for the twill media and 84.33% for the satin media. By grouping together the graphs showing the effect of the weaving method on turbidity and the graph showing the change in head loss as a function of time for the 3 weaving methods. It can be seen that for a reduction of 70.33% for plain weaving over 15 hours of operation, this generates a head loss of 144mbar, this generates a pressure drop of 144mbar, for an abatement of 82.33% for the twill weave, the pressure drop generated is 171 mbar and for an abatement of 84.33% the pressure drop for the twill weave is 198mbar. The difference between the plain-twill media is 12% abatement and 27mbar pressure drop difference. For the twill-satin weaves the abatement difference is 14% and 54mbar pressure drop difference. Finally for the uni-satin weave, the abatement difference is 2% with a pressure drop difference of 27mbar. The most likely media for use in filtration is twill media. The above information shows the advantages of using these membranes. Turbidity reduction by these membranes is directly linked to their porosity which is 0.5, 0.3 and 0.18 for plain, twill and satin membranes respectively. The head loss behaviour is a function of the total flow resistance of each membrane.

3.7. Cut-off Threshold for Different Membranes

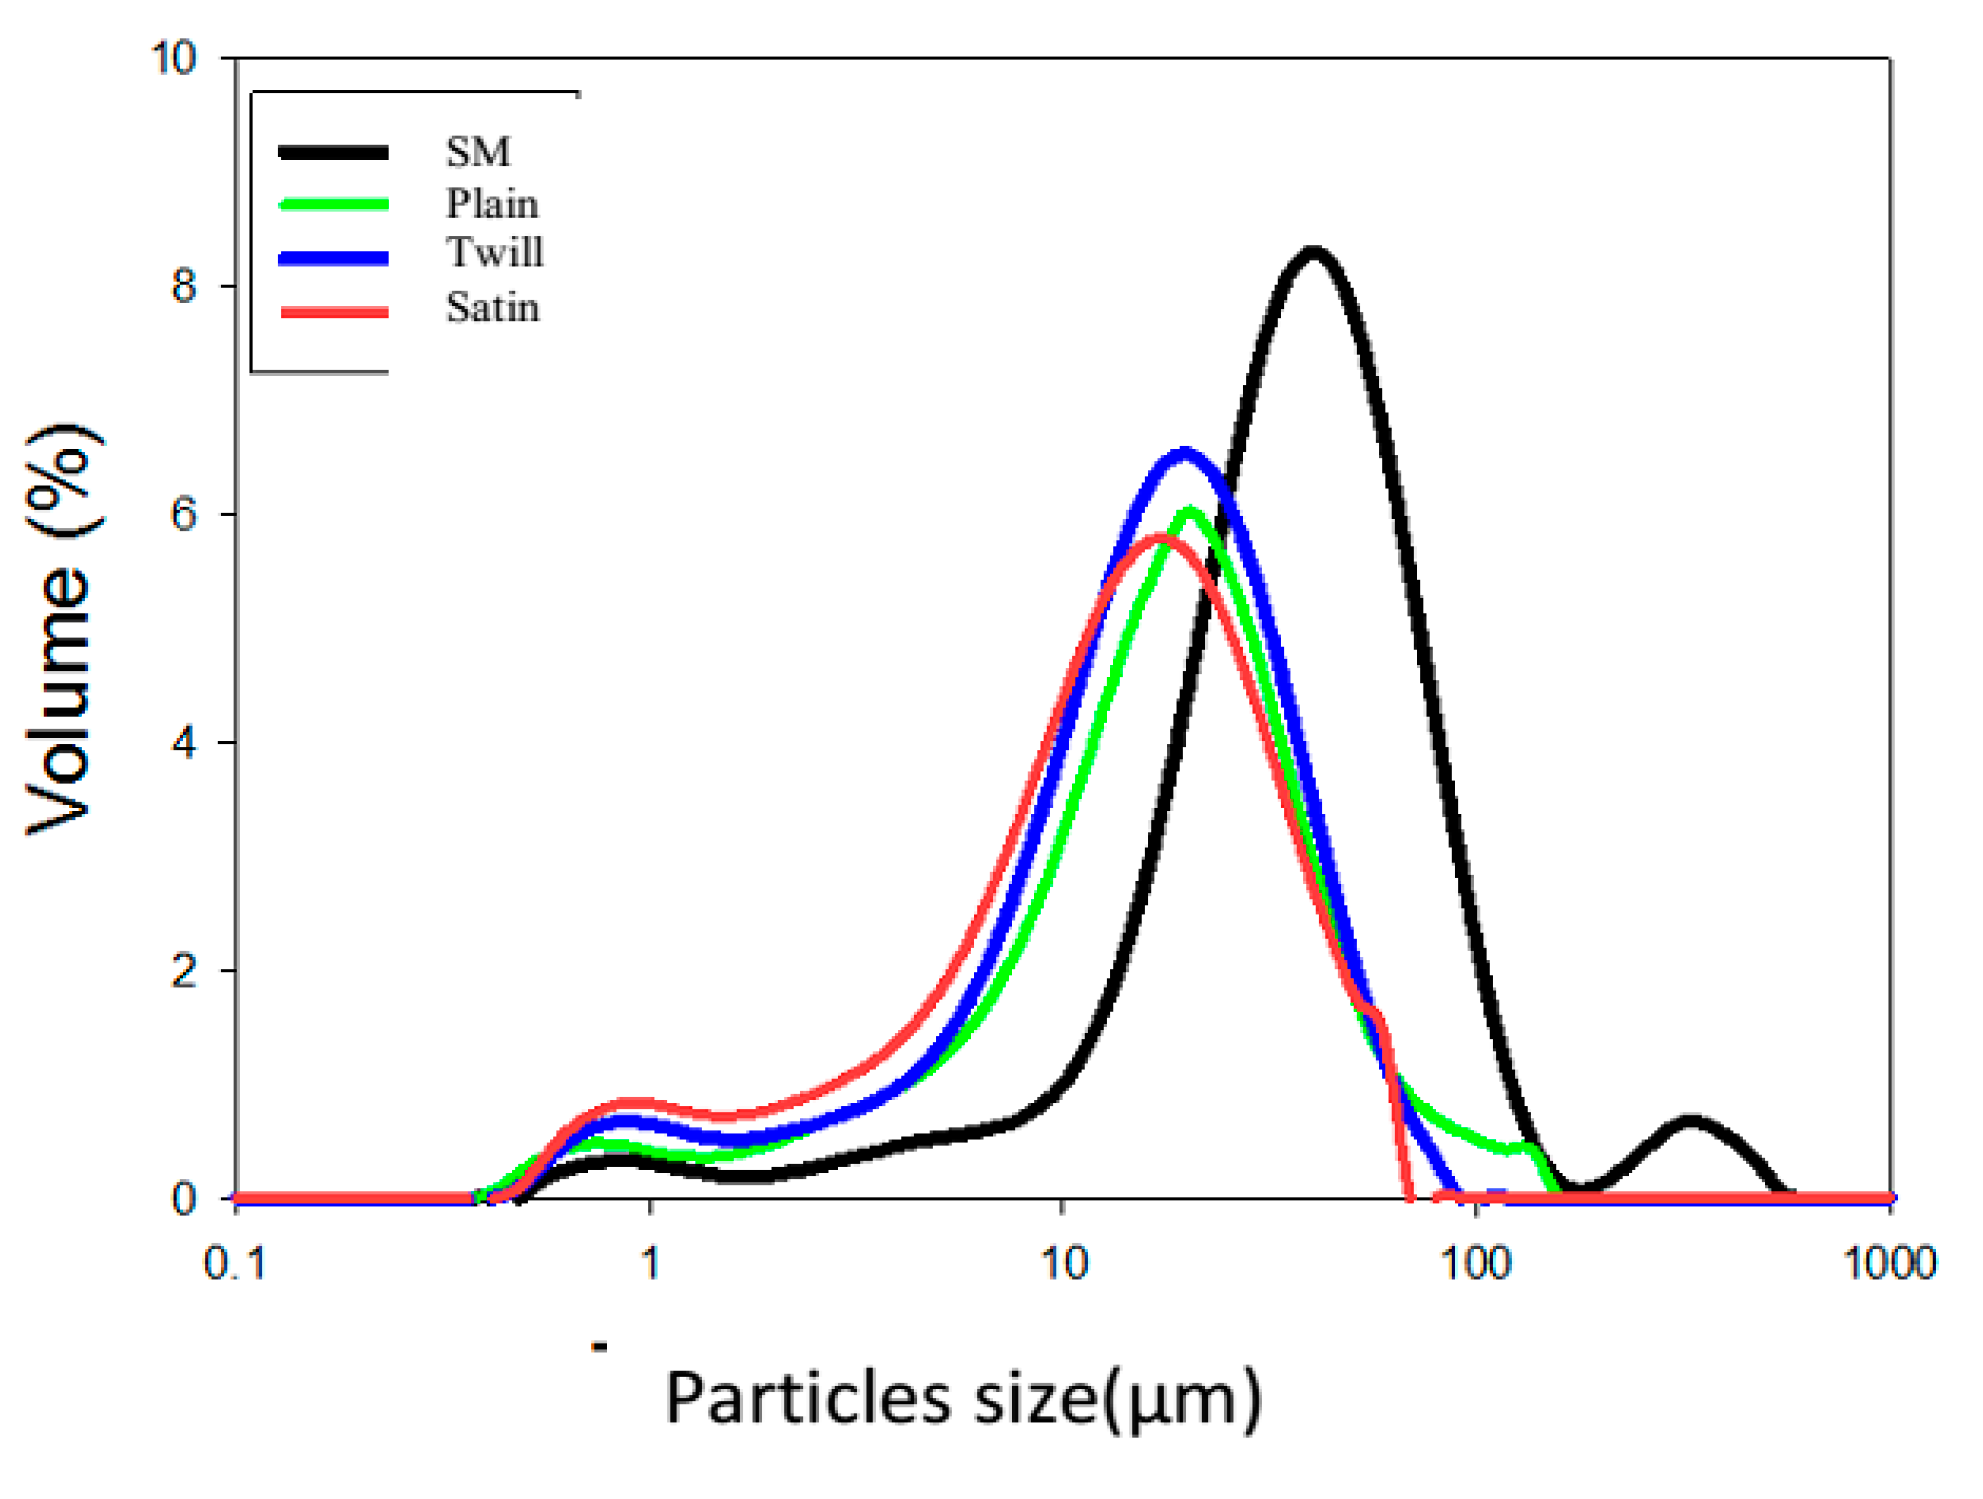
In order to determine the cut-off for the different membranes, a particle size analysis was carried out. Figure 6 shows the particle size distribution before and after filtration for different membranes.
Figure 11 above confirms the results obtained earlier. The cut-off threshold varies according to the type of weave. For the plain weave, with 50% void space, the diameter of the particles likely to pass through the membrane is 29µm for the serge membrane, 30% void space allows the passage of particles of 21µm, and finally for the satin membrane 18% void space allows particles of 15µm diameter to pass through the membrane. The particle size distribution of the mother solution is composed of two families of particles, so it is reasonable that depending on the diameter of each membrane, the larger particles will accumulate on the surface of the different membranes and form a filter cake that will negatively affect the flow (Kanade, 2016). In view of the hydrodynamic characteristics obtained, the best type of weave for a more economical filtration process is twill weave.

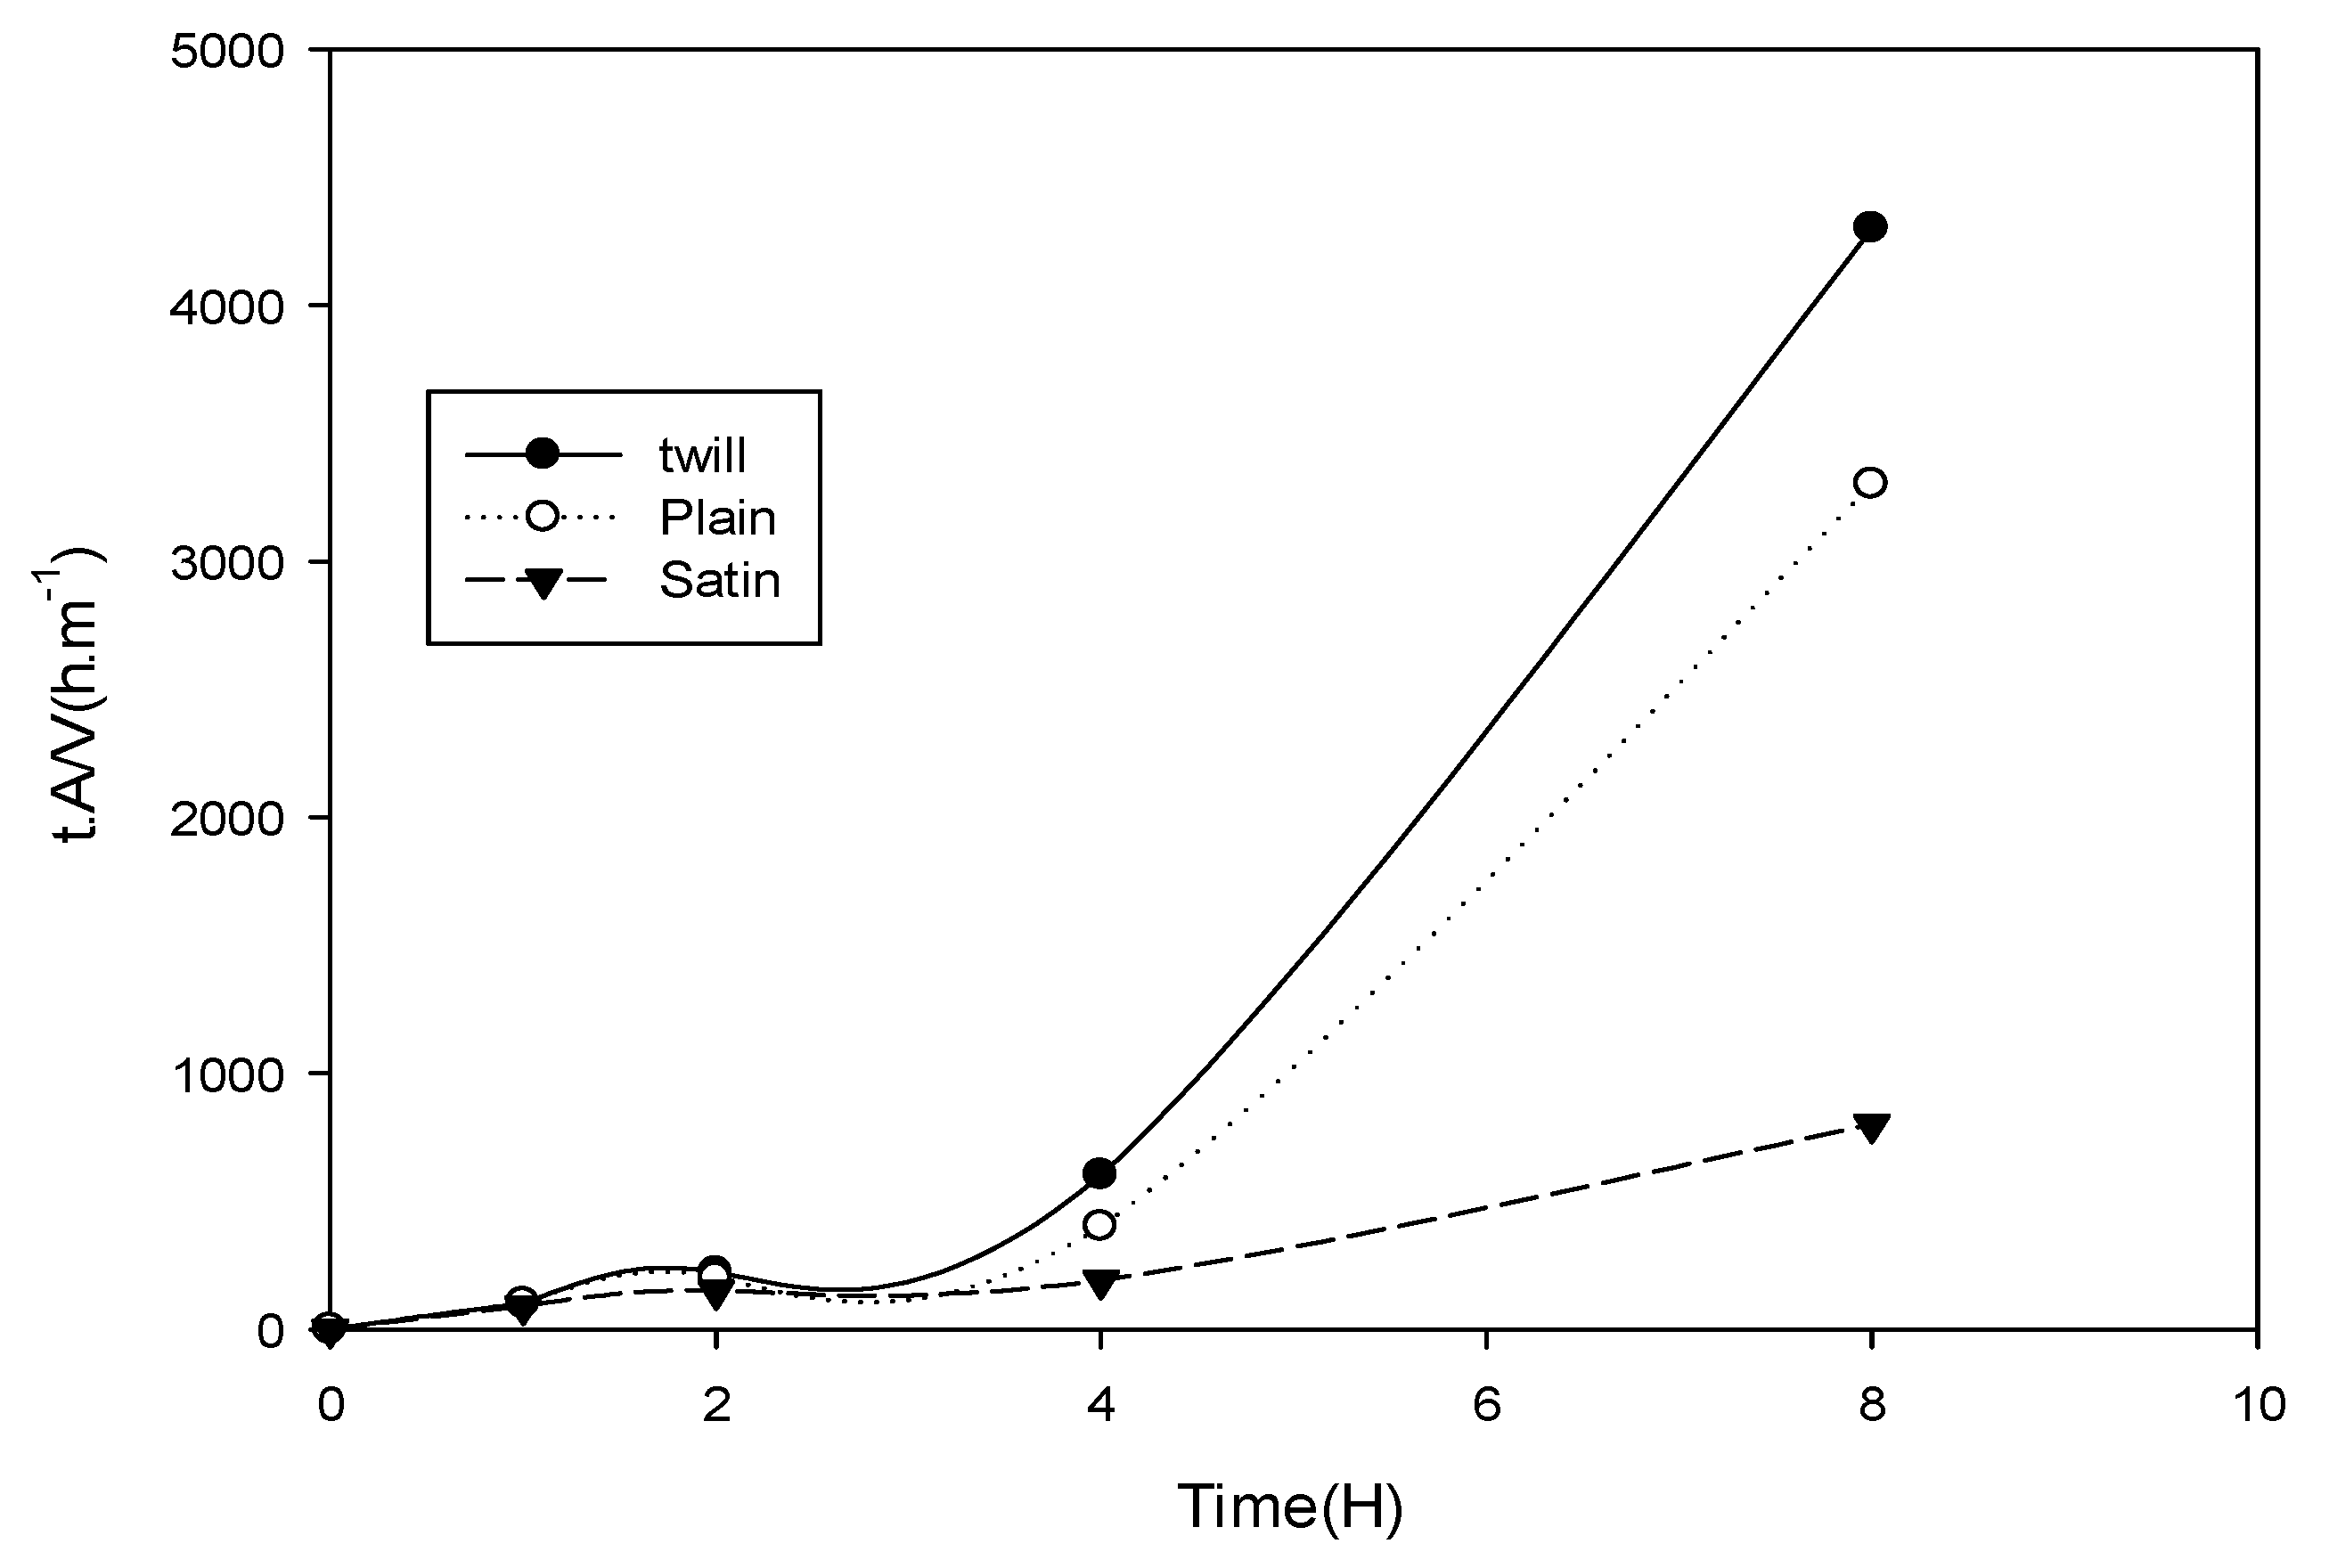
3.8. Effect of the Weaving Method on the Clogging Mechanism

Figure 12 shows that at the start of filtration, between 0 and 2 hours, there is little clogging. After this time, we see a linear increase in clogging for the serged and satin-finish membranes, while for the plain membrane it tends to remain constant after 3 hours of filtration. From 4 to 8 hours, there is a sudden increase in clogging. This phenomenon can be explained by the fact that at the start of filtration, the membranes are still clean and unclogged, which gives us low clogging values. This is due to the maximum availability of the membrane pores to allow the fluid to pass through [21]. However, as filtration time elapses, clogging increases, leading to obstruction of the membrane pores which reduces the effective surface area available for filtration and increases resistance to the passage of fluid through the membrane, resulting in increased clogging [28].

3.9. Characteristics of Membranes after Filtration

This table shows the characteristics of the different membranes after filtration tests. For the membrane obtained by plain weave, the total effective resistance is 1.78.1011 m-2, for the twill membrane the total resistance is 3.03.1011 m-2 and for the satin membrane the total resistance is 3.41.1011 m-2. According to this table, these resistances are proportional to the mass of the cake formed on the membrane surface. During filtration, the progressive accumulation of cake induces resistance at the membrane, which progressively affects the output flow. This table also shows the compressibility index which indicates that the membrane compresses more under pressure during filtration. This may be due to the nature of the material, as well as the porous structure of the material. For the different membranes, the indices range from 0.81 for the plain membrane, 1 for the twill membrane and 1.1 for the satin membrane. These differences are due to the influence of the porosity of each membrane, which has an influence on the transmembrane pressure. This compressibility creates a drop in outflow, which tends to stabilise during filtration tests (Figure 8).
Table 1. Summary table of filter media characteristics.
Types of Weave Thickness of Filter Element(s)
(m)
Porosity (ε) Effective Resistance of the Filter Element (Rm)
(m-2)
Cake Resistance
(Rg)
(m-2)
Compressibility Index Cake Mass
(W)
g/m2
Plain 0 ,001 0,5 2,57.109 1,76 .1011 0,81 26 ,34
Twill 0,004 0,3 2,76.109 3,01.1011 1 35,11
Satin 0,006 0,18 2,86.109 3,38.1011 1,1 43,23

3.10. Influence of Weaving Type on Flow during Filtration
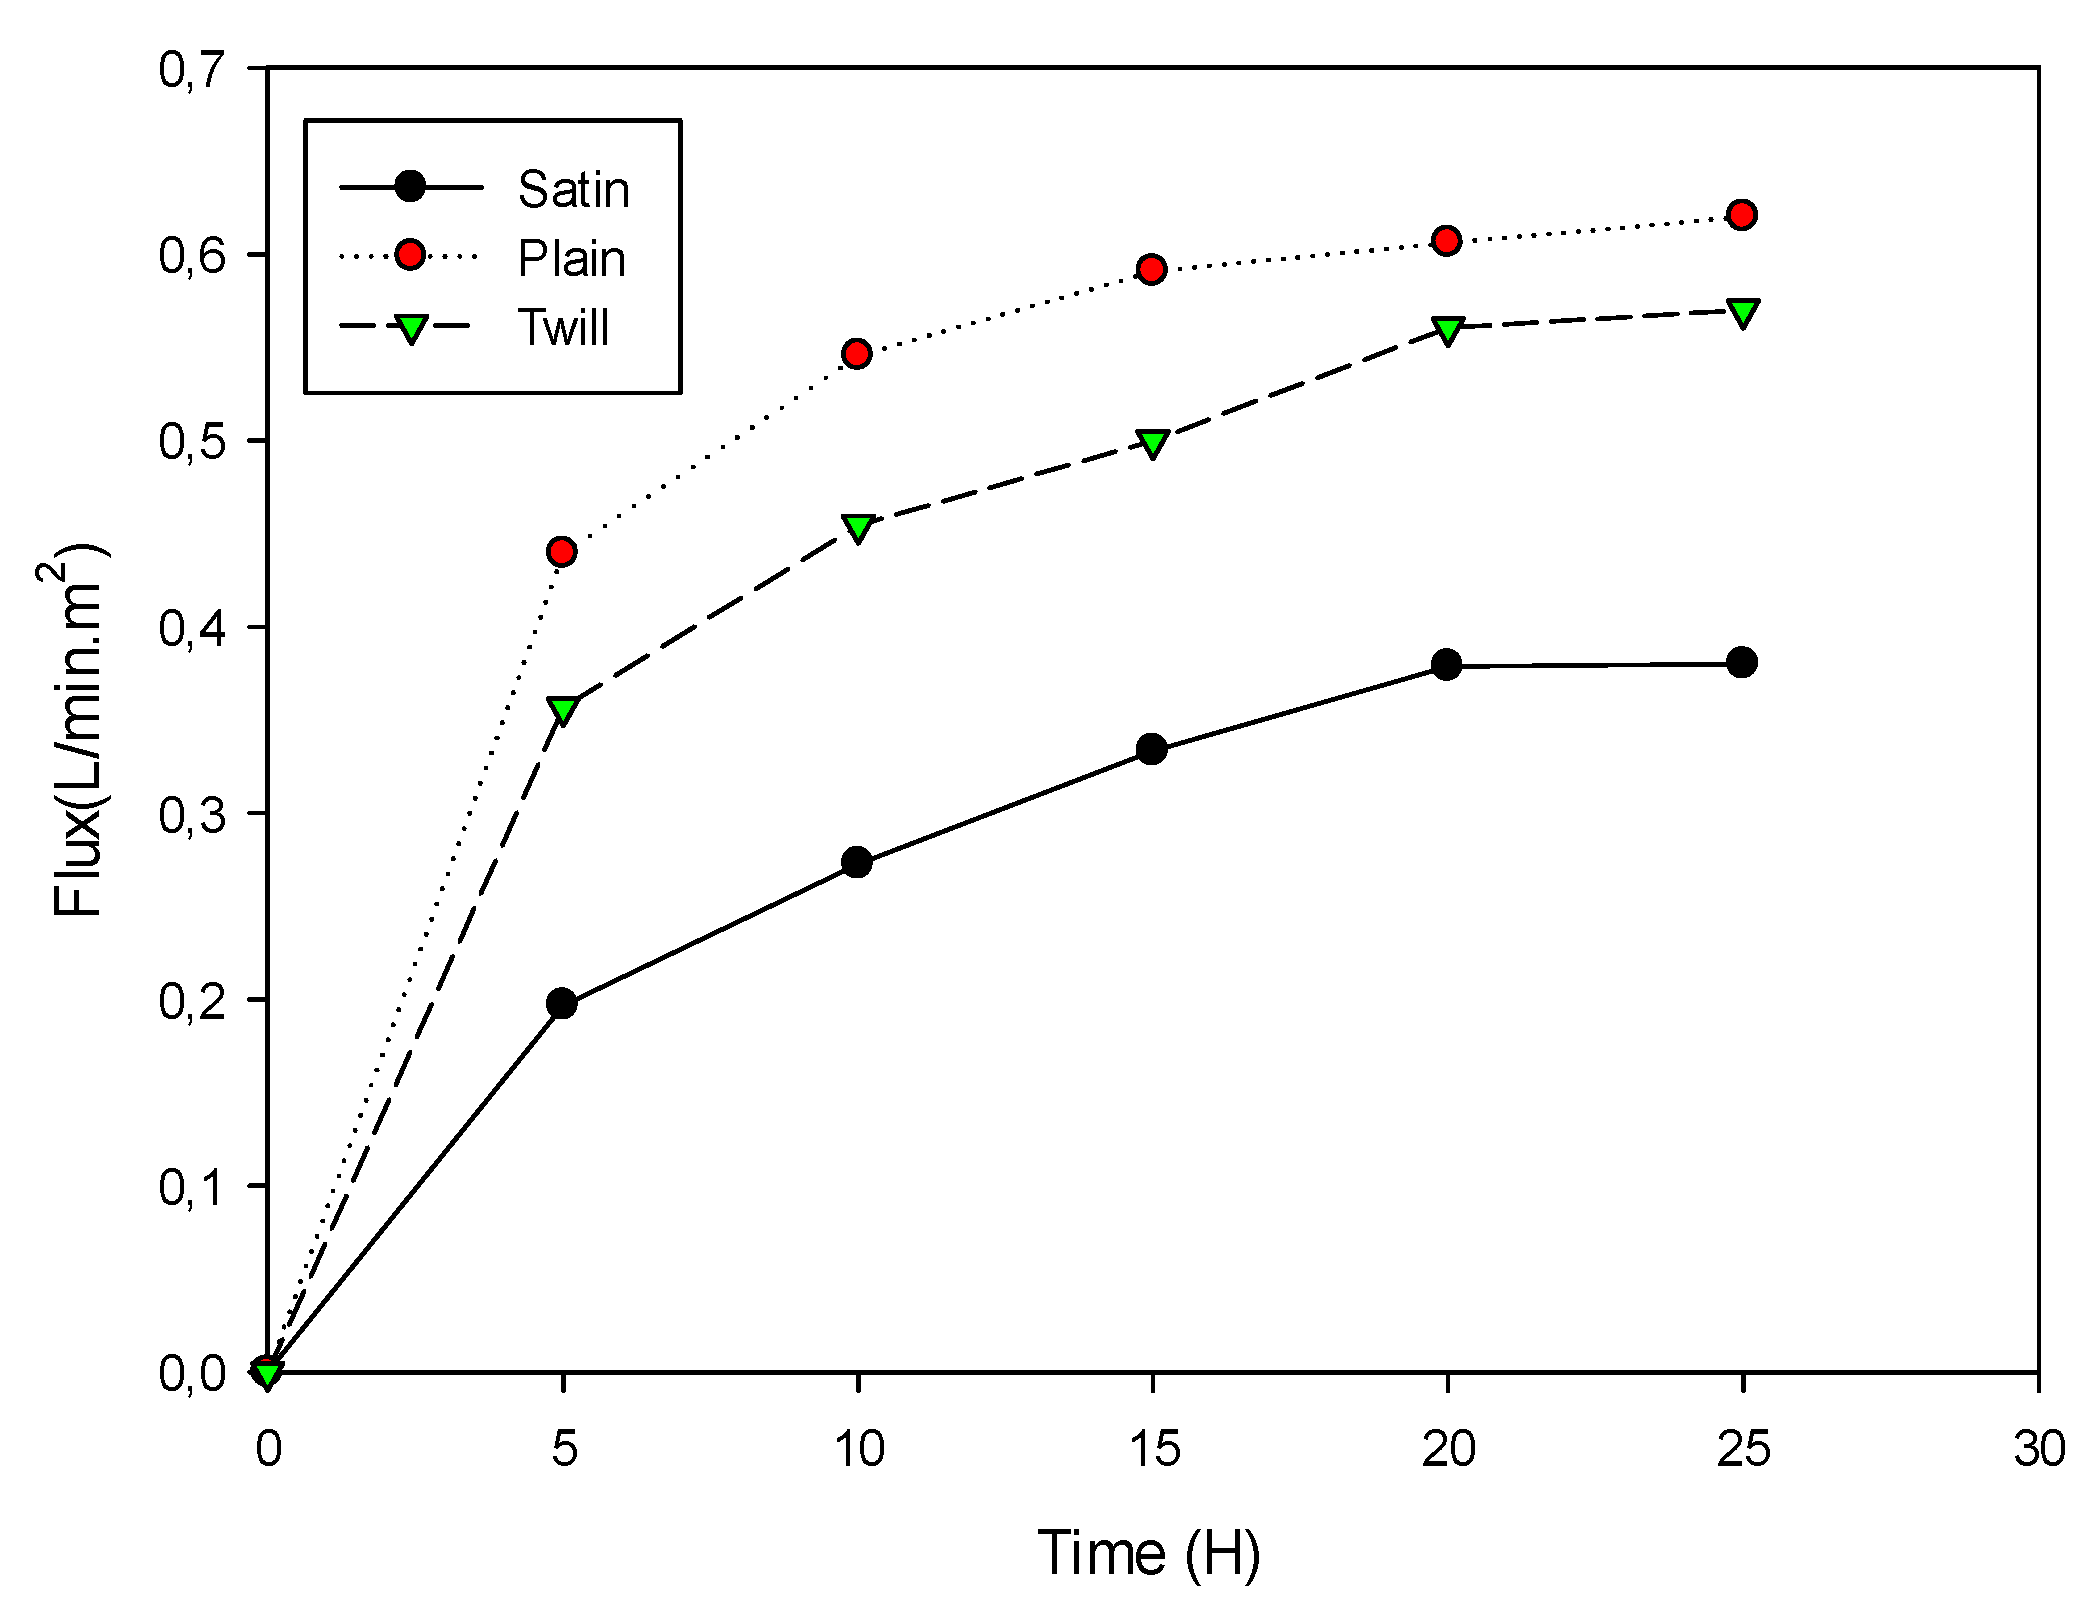
The shape of these curves confirms the information on the clogging mechanism showing that, for the different membranes the flux increases linearly up to a value of 0.20 L/min.m2 for the satin membrane, 0.44 L/min.m2 for the twill membrane and 0.47 for the membrane obtained using the uni membrane. For the membranes obtained by twill and plain weaves, the maximum value of linear flux generated is much higher than the flux obtained by the satin membrane. This can be explained by the fact that the satin weave makes it possible to obtain membranes with a low porosity (0.18), this is why during the filtration of turbidity suspensions (30 NTU), there is rapid formation of the filter cake. By observing the nominal filtration values for each membrane, it is possible to estimate the time required to form the first layer of cake which is 2h25min for the plain membranes, 1h45min for the twill membrane and 1h35 min for the satin membrane.
Figure 14. Variation of flux as a function of time during filtration of a 30 NTU suspension for different membranes.
Preprints 118786 g013

4. Conclusion

Throughout our study, the impact of the weaving method on filtration hydrodynamics was evaluated. Therefore, three types of conventional weave such as plain, twill and satin weaves were performed.The technique used for the design of each membrane affects the weave density and porosity. The filtration tests revealed that, the satin weave presents the highest resistance to flow, with a low permeability value and a high pressure drop compared to the plain and twill membrane, but this membrane presents a better retention. The membrane with the lowest turbidity value is the plain weave membrane. From an overall point of view, it can be seen that an increase in weave density leads to a decrease in permeability which increases resistance to flow. Comparing these three membranes, the twill membrane appears to be the most suitable for filtration.

References

  1. Begum Melike Tanis-Kanbura, René I. Peinadord , José I. Calvo, Antonio Hernández , JiaWei Chewa. 2021.Porosimetric membrane characterization techniques: a review. Journal of Membrane Science 619(3):118750. [CrossRef]
  2. Sulastri A. et Rahimidar L., 2016. Fabrication de biomembrane à partir de tige de banane pour l'élimination du plomb. Journal indonésien des sciences et technologies. 1(1): 115 - 131.
  3. Kozlowski.R . M, Mackiewicz-Talarczyk . M, and Barriga-Bedoya. J, (2010). “Natural Fibers Production, Processing, and Application: Inventory and Future Prospects,” in Contemporary Science of Polymeric Materials , vol. 1061, American Chemical Society, pp. 3–41.
  4. Gregory M.R, (2009). Environmental implications of plastic debris in marine settingsentanglement, ingestion, smothering, hangers-on, hitch-hiking and alien invasions.Philosophical Transactions of the Royal Society B: Biological Sciences, 364 pp. 2013-2025.
  5. Alimba CG and Faggio C (2019). Microplastics in the marine environment: Current trends in environmental pollution and mechanisms of toxicological profile. Environ. Toxicol. Pharmacol., 68, pp 1-164.
  6. Wilcox C et al. (2018). A quantitative analysis linking sea turtle mortality and plastic debris ingestion. Scient. Reports 8:12536 |. [CrossRef]
  7. Tserki, V., Zafeiropoulos, N.E., Simon, F., Panayiotou, C. (2005). A study of the effect of acetylation and propionylation surface treatments on natural fibres. Composites Part A:Applied Science and Manufacturing, 36(8), 1110-1118.
  8. Wafiroh S., Abdulloh A., Widati AA, 2021. Fibres creuses d'acétate de cellulose revêtues de Ti2O pour la dégradation des déchets de teinture textile. Technologie chimique. 15 (2): 291 -298. [CrossRef]
  9. Ortega, E., et al. (2014) Urban Fragmentation Map of the Chamberí District in Madrid. Journal of Maps, 1-10.
  10. Rajendran, K.V., Shivam, Saloni, Ezhil Praveena, P., Joseph Sahaya Rajan, J., Sathish Kumar, T., Avunje, Satheesha, Jagadeesan, V., Prasad Babu, S.V.A.N.V., Pande, Ashish, Navaneeth Krishnan, A., Alavandi, S.V., Vijayan, K.K., Emergence of Enterocytozoon hepatopenaei (EHP) in farmed Penaeus (Litopenaeus) vannamei in India, Aquaculture (2016). [CrossRef]
  11. Baghel S. Ravir, Poornima Suthar , Tejal K. Gajaria , Sourish Bhattacharya, Annamma Anil , C.R.K. Reddy.(2020). Seaweed biorefinery: A sustainable process for valorising the biomass of brown seaweed.Journal of Cleaner Production 263(21):121359. [CrossRef]
  12. Gao, J., An, Z., & Bai, X. (2019). A new representation method for probability distributions of multimodal and irregular data based on uniform mixture model. Annals of Operations Research. [CrossRef]
  13. Behera . B. K, and Hari . P. K, (2010). Woven textile structure: Theory and applications.
  14. Duroudier J.-P. , 1.7 Les supports filtrants, in Pratique de la filtration, HERMES Science Publications: Paris, (1999).
  15. Daufin, G., René, F., and Aimar, P. (1998). Les séparations par membrane dans les procédés de l’industrie alimentaire.
  16. Espinasse, B., Bacchin, P., and Aimar, P. (2008). Filtration method characterizing the reversibility of colloidal fouling layers at a membrane surface: Analysis through critical flux and osmotic pressure. J. Colloid Interface Sci. 320, 483–490.
  17. Bessière, Y. (2005). Filtration frontale sur membrane : mise en évidence du volume filtré critique pour l’anticipation et le contrôle du colmatage. Université Paul Sabatier.
  18. Chanlong, (2011). .M,Effect of fabric constructionon water permeability rate of woven filter cloth.Easten Liaoning University,325 Wenhua roat,Dandong, Liaoning,118003,China ddcd@126.com. Advanced material Research, vol 331 ,PP 48-51.doi : 10.4028 /AMR 331.48.
  19. Kameni. N. M. Bernard, N. K. Sylvere, K. G. Patrice, and K. G. Joseph, “Coagulation and sedimentation of concentrated laterite sus- pensions: comparison of hydrolysing salts in presence of Grewia spp. biopolymer,” Journal of Chemistry, vol. 2019, Article ID 1431694, 9 pages, 2019.
  20. Pratikhya Badanayak, Seiko Jose & Gautam Bose (2023) Banana pseudo stem fiber: A critical review on fiber extraction, characterization, and surface modification, Journal of Natural Fibers, 20:1.
  21. Sutherland and Derek. (2000). Handbook of filter media. Elsevier.
  22. Kanade, P. Role of Spinning Machine Process Variables on Porosity of DREF Spun Yarn. Fibers Polym 24, 2521–2527 (2023). [CrossRef]
  23. Abdul Cader Salahudeen Izzathul Mumthas, Ganemulle Lekamalage Dharmasri Wickramasinghe and Ujithe SW Gunasekera Effect of physical, chemical and biological extraction methods on the physical behaviour of banana pseudo-stem fibres: Based on fibres extracted from five common Sri Lankan cultivars Journal of Engineered Fibers and Fabrics.Volume 14, January-December 2019. [CrossRef]
  24. Turan R., Befru, et O. Ayse, "Prediction of the in-plane et through-plane fluid flow behavior of woven fabrics." Textile Research Journal (2013): 700-717.
  25. Hanafi Y., K.Baddari, A.Szymczyk, F.Zibouche. Caractérisation de la densité de charge de surface de membranes nanoporeuses Journal of Materials, Processes and Environment 1 (01) (2013).
  26. Nsoe M.N. , E.V. Amba, N.M. Kameni, G.P. Kofa, K.S. Ndi, M. Heran and G.J. Kayem.(2023). Biodegradation of Natural Rubber Wastewater in the Submerged Membrane Bioreactor by Pichia Guilliermondii and Yarrowia Lipolytica. International Journal of Membrane Science and Technology, 2023, 10, 38-46.
  27. Kouakou E., Salmon T., Marchot P., Crine M.,(2006b). Influence of operating parameters on nitrite accumulation in a nitrifying submerged MBR. Proc. Int. Symp. Environ. Biotechnol.Liepzig, Germany, 9th to 13th September 2006. 5pp.
  28. Contreras, A.E., Kim, A., Li, Q., 2009. Combined fouling of nanofiltration membranes: Mechanisms and effect of organic matter. Journal of Membrane Science 327, 87–95.
  29. Marie Grégoire. Extraction des fibres de chanvre pour des composites structuraux – Optimisation du potentiel mécanique des fibres pour des applications concernant des matériaux composites 100% bio-sourcés. Matériaux et structures en mécanique [physics.class-ph]. Institut National Polytechniquede Toulouse - INPT, 2021. Français. NNT : 2021INPT0002ff. tel-04165247ff.
  30. Athijayamani A, Thiruchitrambalam M, Natarajan U, Pazhanivel B. Influence of alkalitreated fibers on the mechanical properties and machinability of roselle and sisal fiber hybrid polyester composite. Polymer Composites 2010; 31:723–31.
  31. Mbouyap Chengoué A, T. Tchotang, C. Bopda Fokam, B. Kenmeugne. 2020.Influence of extractions techniques on the physico-mechanical properties of banana pseudo- stem fibers J. Mater. Environ. Sci. 11(7), pp. 1121-1128.
  32. Venkataravanappa, R.Y.; Lakshmikanthan, A.; Kapilan, N.; Chandrashekarappa, M.P.G.; Der, O.;Ercetin, A. Physico-Mechanical Property Evaluation and Morphology Study of Moisture-Treated Hemp–Banana Natural-Fiber- Reinforced Green Composites. J. Compos. Sci. 2023, 7, 266. [CrossRef]
  33. Lerch T. P.; Determination of surface density of nonporous membranes with air-coupled ultrasound. AIP Conf. Proc. 31 March 2015; 1650 (1): 1292–1298. [CrossRef]
  34. Sumesh, K. R., V. Kavimani, G. Rajeshkumar, S. Indran, and A. Khan. 2022. Mechanical, water absorption and wear characteristics of novel polymeric composites: Impact of hybrid natural fibers and oil cake filler addition. Journal of Industrial Textiles 51 (4):5910S–37.
  35. Jermann, D., Pronk, W., Kägi, R., Halbeisen, M., Boller, M., 2008. Influence of interactions between NOM and particles on UF fouling mechanisms. Water Research 42, 3870–3878.
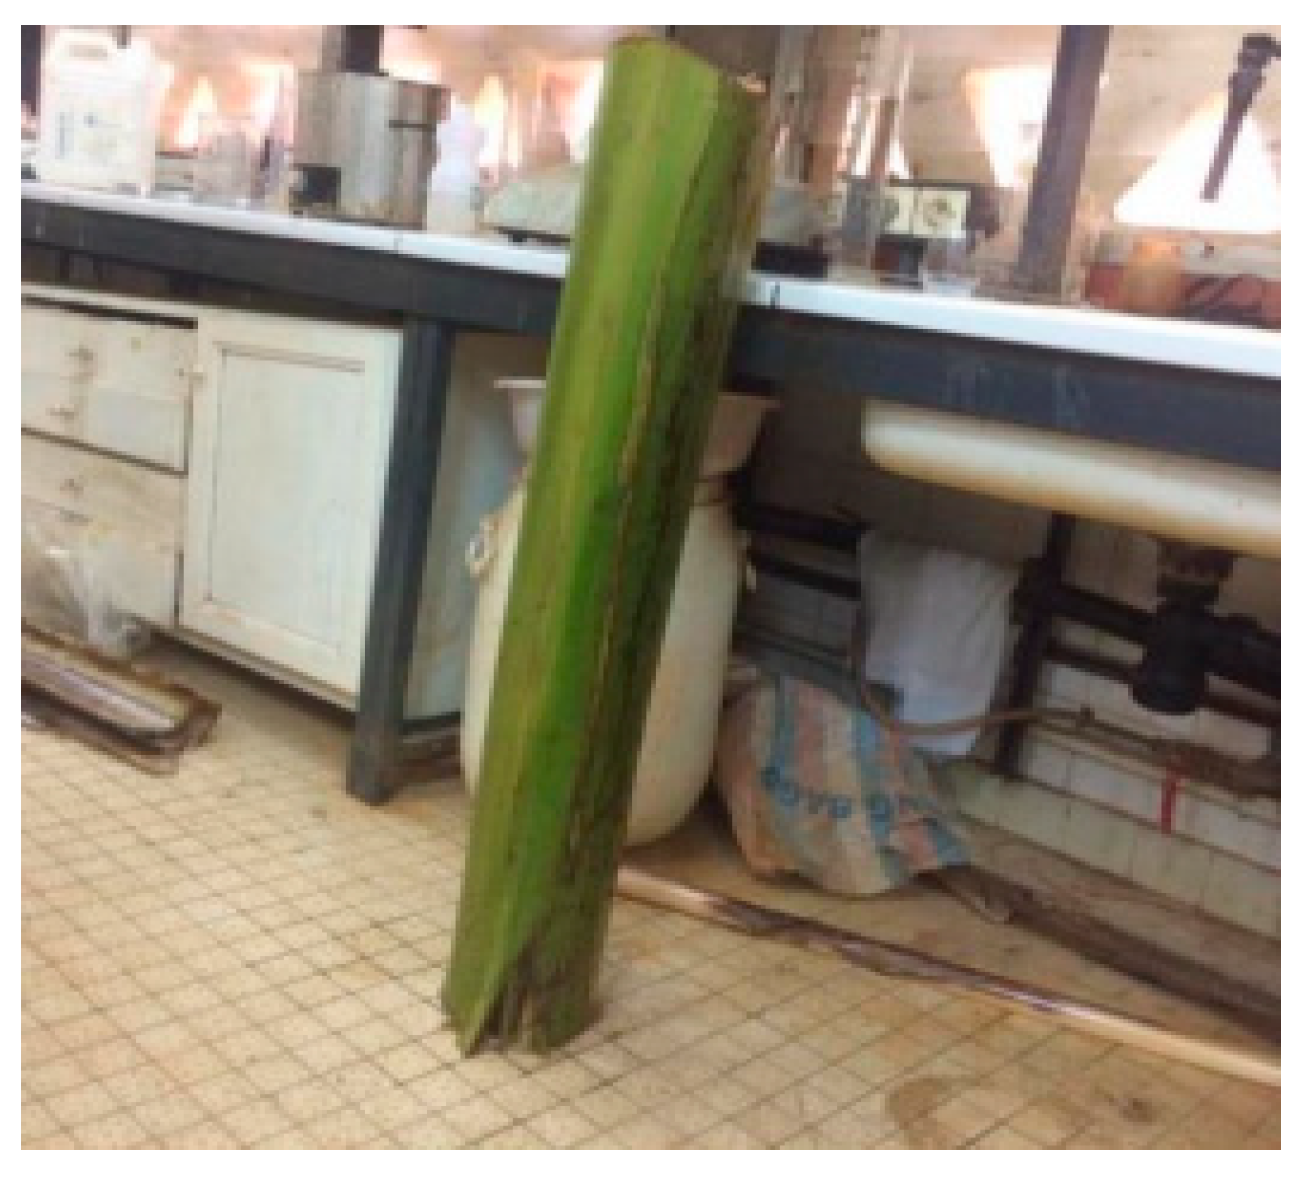
Figure 1. Banana pseudo-stem.
Preprints 118786 g001
Figure 2. Harvesting fields.
Preprints 118786 g002
Figure 3. 1. Bach, 2. agitator, 3. pump, 4,6,9: valves, 5. flowmeter, 7. pressure gauge and 8. filtration membrane.
Preprints 118786 g003
Figure 4. Banana fibre extraction process [20].
Preprints 118786 g004
Figure 8. Variation in flux as a function of TMP with different types of membrane in distilled water.
Preprints 118786 g008
Figure 9. Flux variation as a function of TMP with different types of membrane in a lateritic solution.
Preprints 118786 g009
Figure 10. Turbidity variation as a function of time at different weaving modes (plain, twill, satin).
Preprints 118786 g010
Figure 11. Particle size distribution as a function of weave type.
Preprints 118786 g011
Figure 12. Clogging mechanisms as a function of time for different types of weave.
Preprints 118786 g012
Table 2. Characteristics of the wire produced.
Characteristics Valors Preprints 118786 i003
Types S
Number of twists 10
Tex 168
Wire diameter (mm) 0,75
Porosity 0,5
Table 3. Characteristics of the filter media manufactured.
Preprints 118786 i004
Disclaimer/Publisher’s Note: The statements, opinions and data contained in all publications are solely those of the individual author(s) and contributor(s) and not of MDPI and/or the editor(s). MDPI and/or the editor(s) disclaim responsibility for any injury to people or property resulting from any ideas, methods, instructions or products referred to in the content.
Copyright: This open access article is published under a Creative Commons CC BY 4.0 license, which permit the free download, distribution, and reuse, provided that the author and preprint are cited in any reuse.
Prerpints.org logo

Preprints.org is a free preprint server supported by MDPI in Basel, Switzerland.

Subscribe

© 2024 MDPI (Basel, Switzerland) unless otherwise stated