Submitted:
19 September 2024
Posted:
23 September 2024
You are already at the latest version
Abstract
Keywords:
1. Introduction
2. Literature Review
3. Method
3.1. Hypothesis
3.2. Data Pre-Processing
3.3. Convolutional Neural Network Structure
4. Results
4.1. Benchmark Comparison
4.2. Evaluation Metrics Comparison among Each Scaled Multi-Spectrogram Settings
5. Discussion
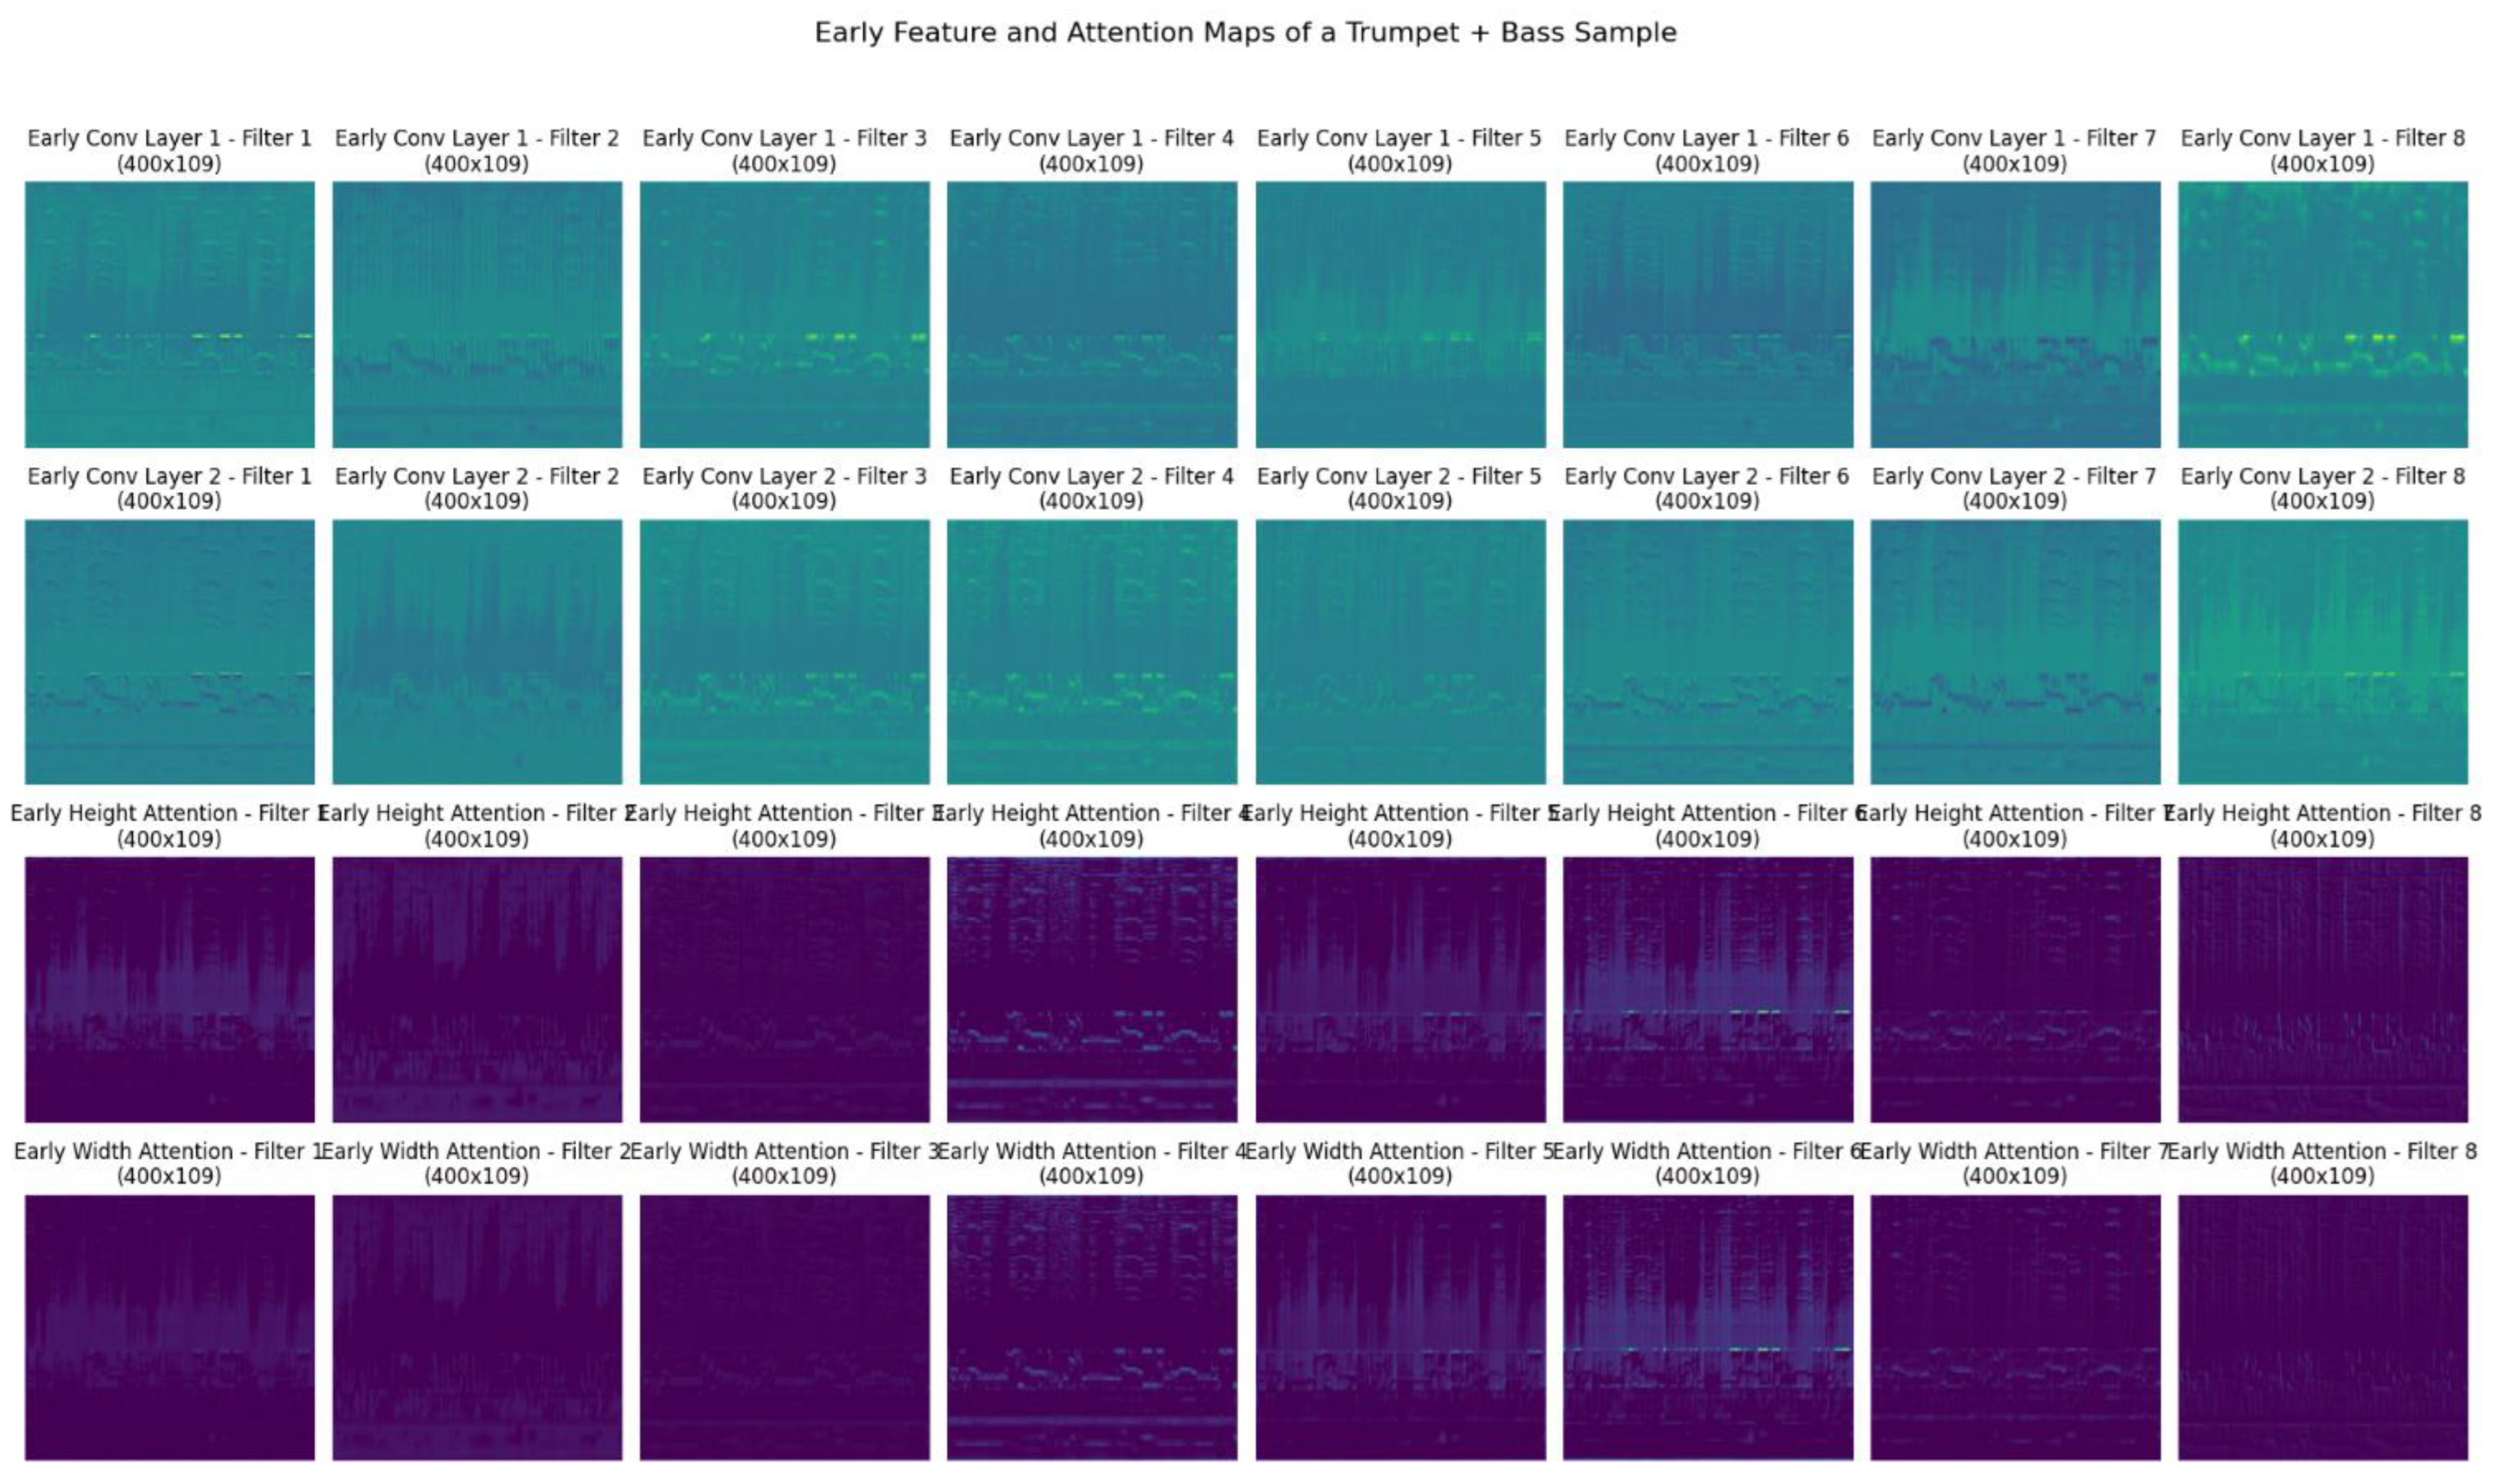
5.1. Early Attention Layer Analysis
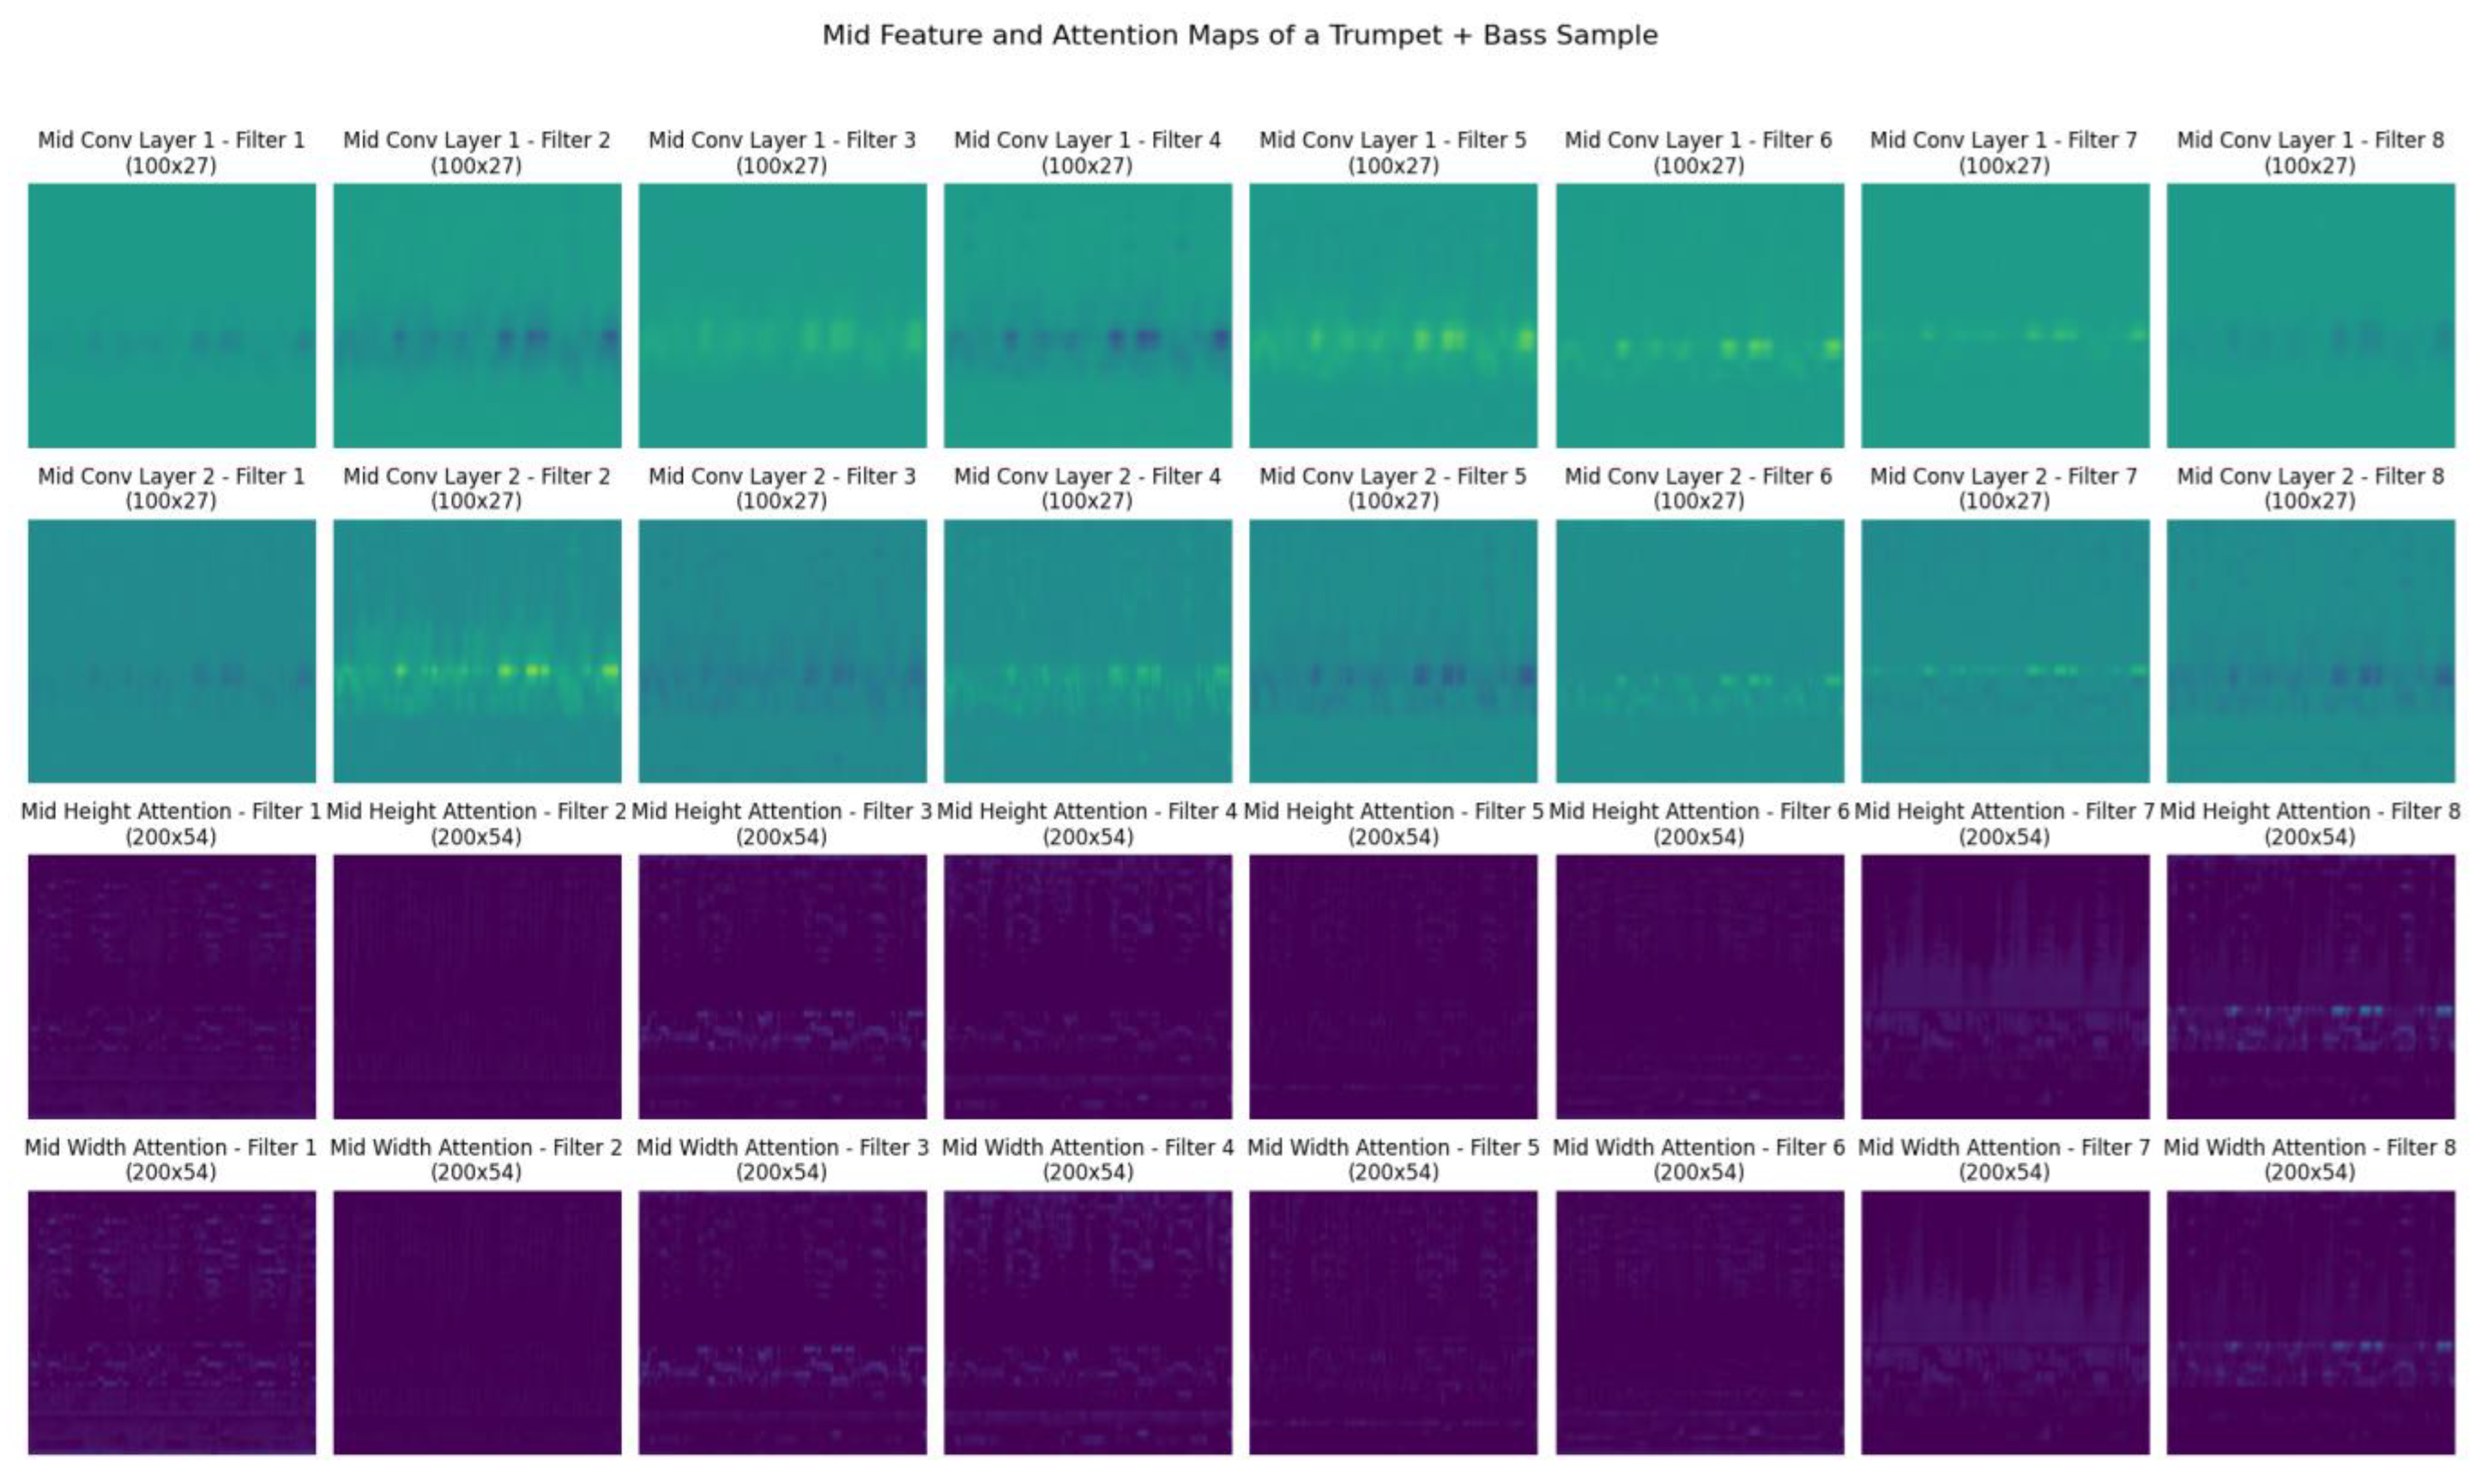
5.2. Mid Attention Layer Analysis
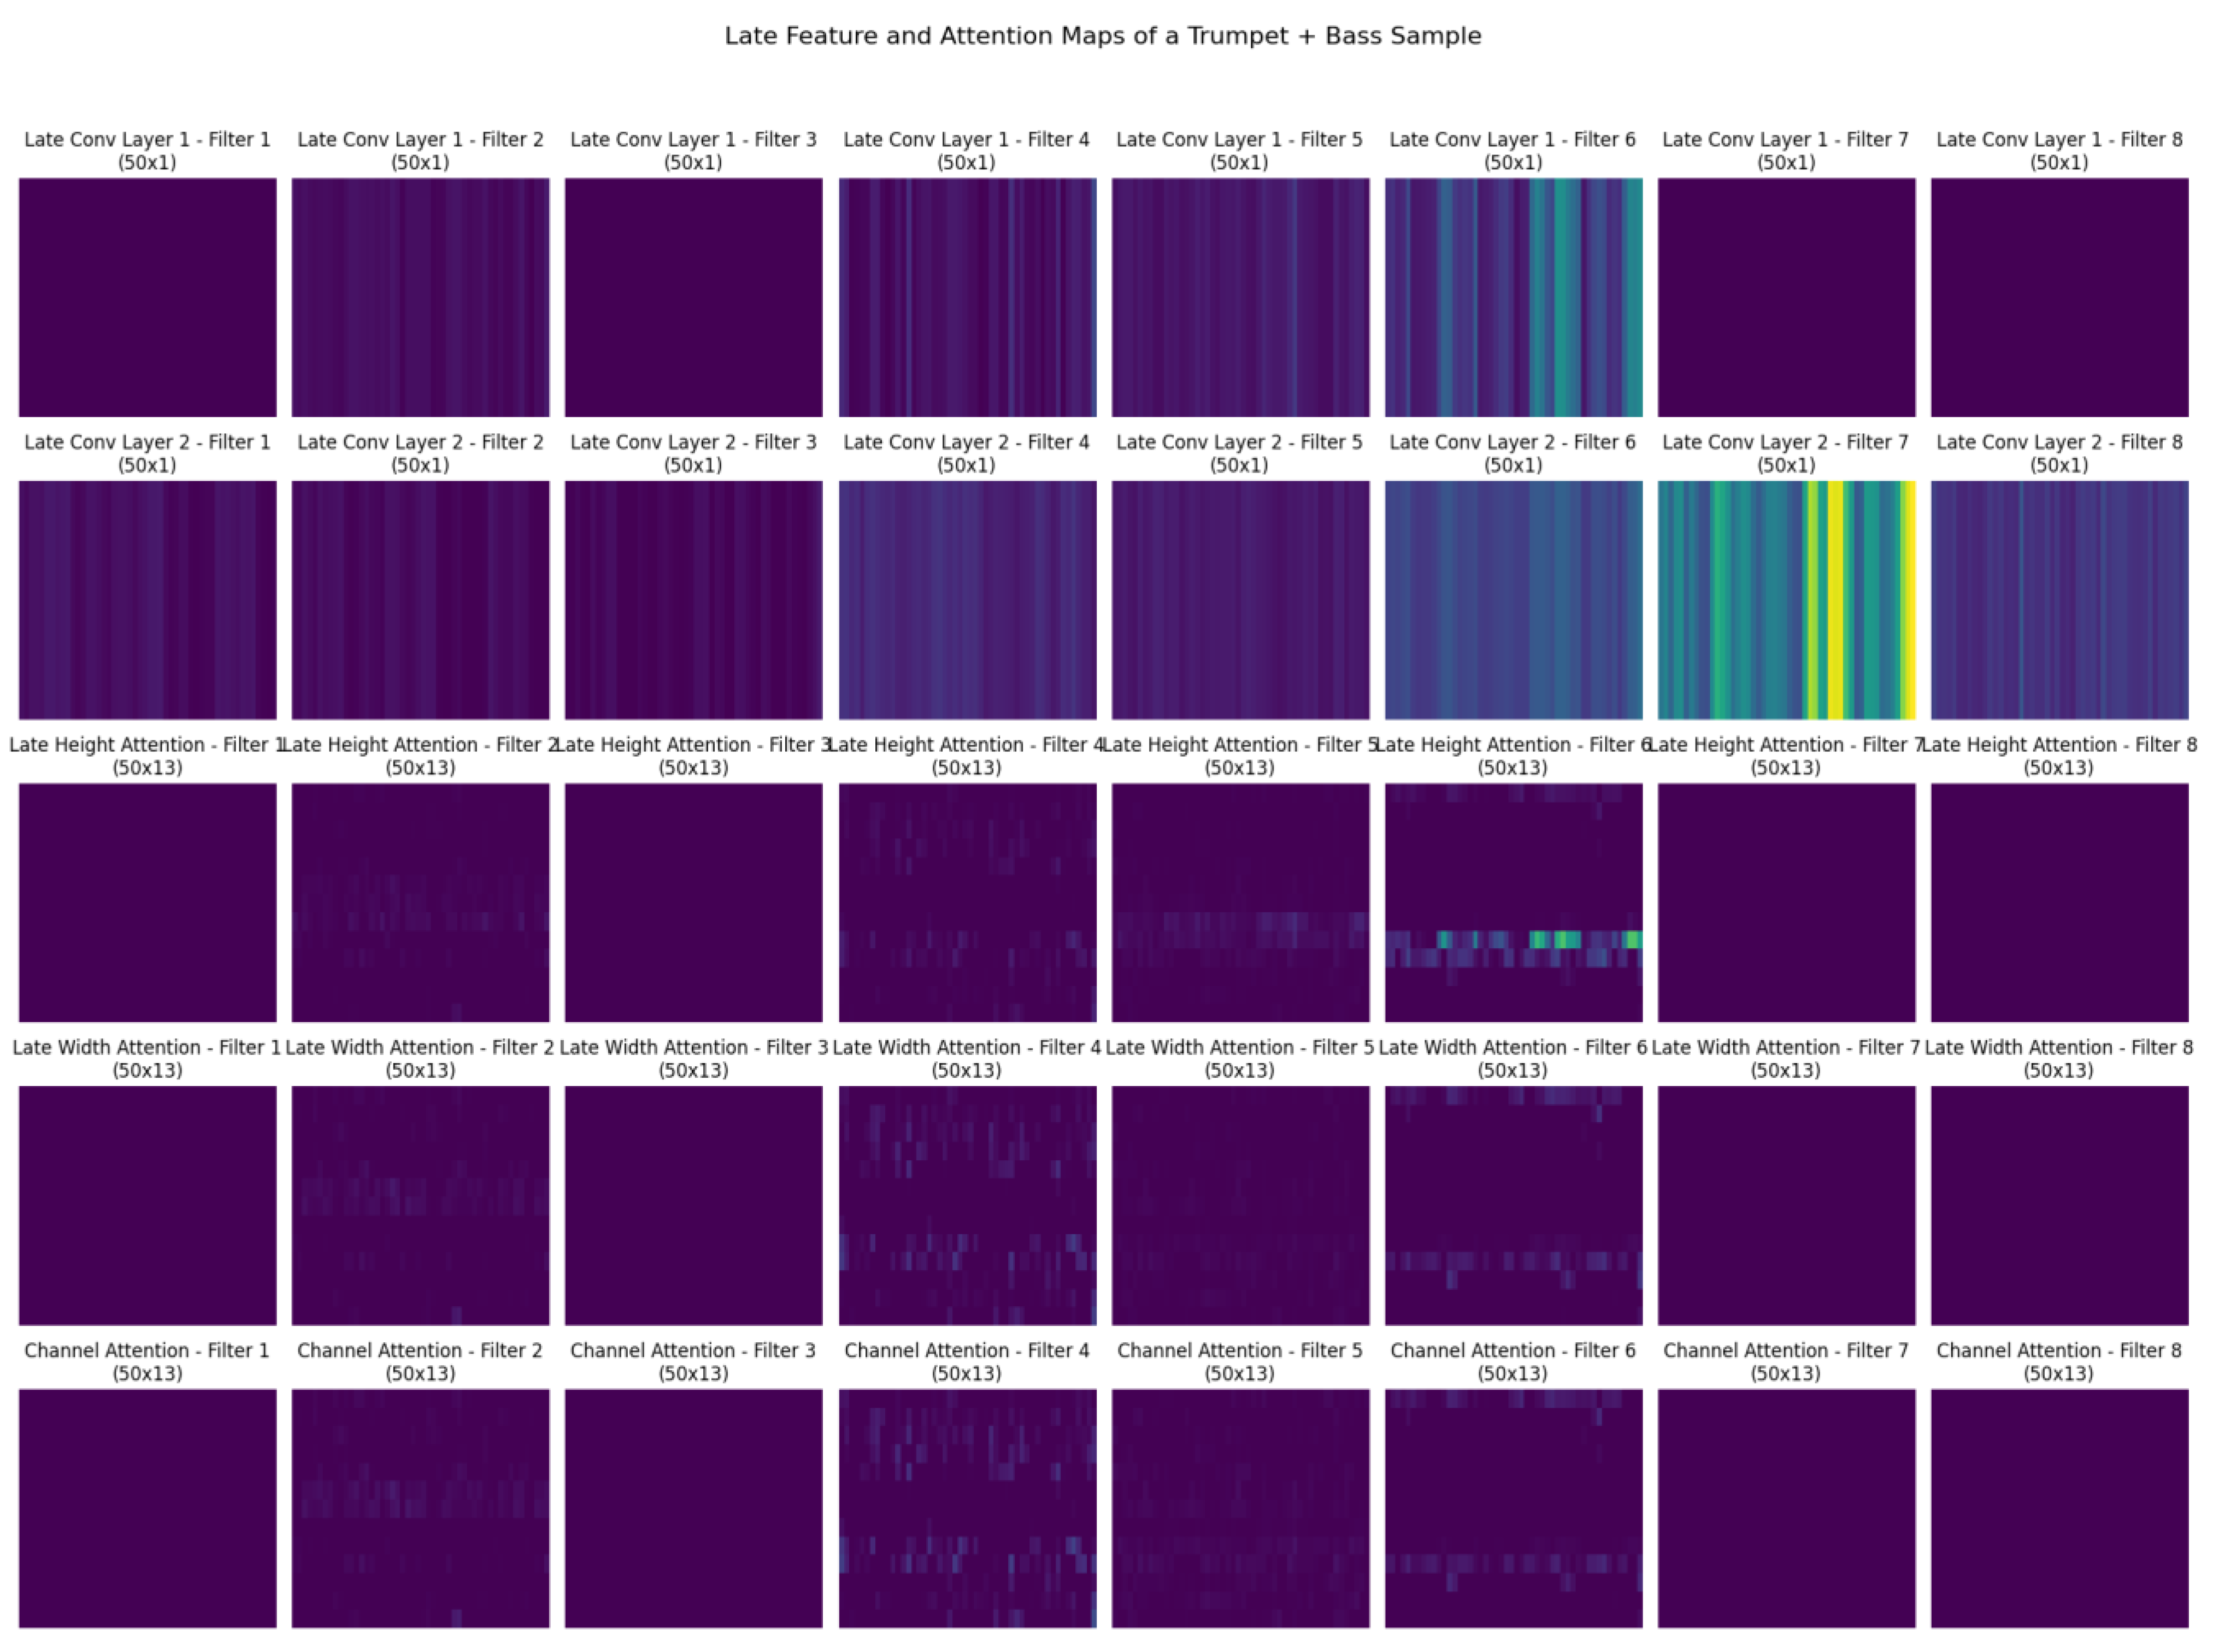
5.3. Late Attention Layer Analysis
6. Conclusion
7. Future Work
8. Reproducibility
References
- Chi, Z.; Li, Y.; Chen, C. Deep Convolutional Neural Network Combined with Concatenated Spectrogram for Environmental Sound Classification. In Proceedings of the 2019 IEEE 7th International Conference on Computer Science and Network Technology (ICCSNT); IEEE, 2019; pp. 251–254.
- Ghosal, D.; Kolekar, M.H. Music Genre Recognition Using Deep Neural Networks and Transfer Learning. In Proceedings of the Interspeech; 2018; pp. 2087–2091.
- Xiao, H.; Liu, D.; Chen, K.; Zhu, M. AMResNet: An Automatic Recognition Model of Bird Sounds in Real Environment. Applied Acoustics 2022, 201, 109121. [CrossRef]
- Xing, Z.; Baik, E.; Jiao, Y.; Kulkarni, N.; Li, C.; Muralidhar, G.; Parandehgheibi, M.; Reed, E.; Singhal, A.; Xiao, F.; et al. Modeling of the Latent Embedding of Music Using Deep Neural Network. arXiv preprint arXiv:1705.05229 2017. arXiv:1705.05229 2017.
- Kethireddy, R.; Kadiri, S.R.; Alku, P.; Gangashetty, S.V. Mel-Weighted Single Frequency Filtering Spectrogram for Dialect Identification. IEEE Access 2020, 8, 174871–174879. [CrossRef]
- Wang, Q.; Su, F.; Wang, Y. A Hierarchical Attentive Deep Neural Network Model for Semantic Music Annotation Integrating Multiple Music Representations. In Proceedings of the Proceedings of the 2019 on International Conference on Multimedia Retrieval; 2019; pp. 150–158.
- Hou, Q.; Zhou, D.; Feng, J. Coordinate Attention for Efficient Mobile Network Design. In Proceedings of the Proceedings of the IEEE/CVF conference on computer vision and pattern recognition; 2021; pp. 13713–13722.
- Vaswani, A.; Shazeer, N.; Parmar, N.; Uszkoreit, J.; Jones, L.; Gomez, A.N.; Kaiser, Ł.; Polosukhin, I. Attention Is All You Need. Advances in neural information processing systems 2017, 30.
- He, K.; Zhang, X.; Ren, S.; Sun, J. Deep Residual Learning for Image Recognition. In Proceedings of the Proceedings of the IEEE conference on computer vision and pattern recognition; 2016; pp. 770–778.
- Humphrey, E.J.; Bello, J.P.; LeCun, Y. Moving beyond Feature Design: Deep Architectures and Automatic Feature Learning in Music Informatics. In Proceedings of the ISMIR; 2012; pp. 403–408.
- LeCun, Y.; Bottou, L.; Bengio, Y.; Haffner, P. Gradient-Based Learning Applied to Document Recognition. Proceedings of the IEEE 1998, 86, 2278–2324. [CrossRef]
- McLoughlin, I.; Zhang, H.; Xie, Z.; Song, Y.; Xiao, W. Robust Sound Event Classification Using Deep Neural Networks. IEEE/ACM Transactions on Audio, Speech, and Language Processing 2015, 23, 540–552. [CrossRef]
- Griffin, D.; Lim, J. Signal Estimation from Modified Short-Time Fourier Transform. IEEE Transactions on acoustics, speech, and signal processing 1984, 32, 236–243. [CrossRef]
- Davis, S.; Mermelstein, P. Comparison of Parametric Representations for Monosyllabic Word Recognition in Continuously Spoken Sentences. IEEE transactions on acoustics, speech, and signal processing 1980, 28, 357–366. [CrossRef]
- Slaney, M. Auditory Toolbox. Interval Research Corporation, Tech. Rep 1998, 10, 1194.
- Pham, L.; Phan, H.; Nguyen, T.; Palaniappan, R.; Mertins, A.; McLoughlin, I. Robust Acoustic Scene Classification Using a Multi-Spectrogram Encoder-Decoder Framework. Digital Signal Processing 2021, 110, 102943. [CrossRef]
- Schmidt, E.M.; Kim, Y.E. Learning Rhythm And Melody Features With Deep Belief Networks. In Proceedings of the ISMIR; 2013; pp. 21–26.
- Han, K.; Yu, D.; Tashev, I. Speech Emotion Recognition Using Deep Neural Network and Extreme Learning Machine. In Proceedings of the Interspeech 2014; 2014.
- Schlüter, J.; Gutenbrunner, G. Efficientleaf: A Faster Learnable Audio Frontend of Questionable Use. In Proceedings of the 2022 30th European Signal Processing Conference (EUSIPCO); IEEE, 2022; pp. 205–208.
- Engel, J.; Resnick, C.; Roberts, A.; Dieleman, S.; Norouzi, M.; Eck, D.; Simonyan, K. Neural Audio Synthesis of Musical Notes with Wavenet Autoencoders. In Proceedings of the International Conference on Machine Learning; PMLR, 2017; pp. 1068–1077.
- Bosch, J.J.; Fuhrmann, F.; Herrera, P. IRMAS: A Dataset for Instrument Recognition in Musical Audio Signals 2018.
- Racharla, K.; Kumar, V.; Jayant, C.B.; Khairkar, A.; Harish, P. Predominant Musical Instrument Classification Based on Spectral Features. In Proceedings of the 2020 7th International Conference on Signal Processing and Integrated Networks (SPIN); IEEE, 2020; pp. 617–622.
- Humphrey, E.; Durand, S.; McFee, B. OpenMIC-2018: An Open Data-Set for Multiple Instrument Recognition. In Proceedings of the ISMIR; 2018; pp. 438–444.
- Koutini, K.; Schlüter, J.; Eghbal-Zadeh, H.; Widmer, G. Efficient Training of Audio Transformers with Patchout. arXiv preprint arXiv:2110.05069 2021. arXiv:2110.05069 2021.
- Ding, Y.; Lerch, A. Audio Embeddings as Teachers for Music Classification. arXiv preprint arXiv:2306.17424 2023. arXiv:2306.17424 2023.
- Schmid, F.; Koutini, K.; Widmer, G. Dynamic Convolutional Neural Networks as Efficient Pre-Trained Audio Models. IEEE/ACM Transactions on Audio, Speech, and Language Processing 2024.
- Hornik, K.; Stinchcombe, M.; White, H. Multilayer Feedforward Networks Are Universal Approximators. Neural networks 1989, 2, 359–366. [CrossRef]
- Bradski, G. The Opencv Library. Dr. Dobb’s Journal: Software Tools for the Professional Programmer 2000, 25, 120–123.
- Liu, Z.; Lin, Y.; Cao, Y.; Hu, H.; Wei, Y.; Zhang, Z.; Lin, S.; Guo, B. Swin Transformer: Hierarchical Vision Transformer Using Shifted Windows. In Proceedings of the Proceedings of the IEEE/CVF international conference on computer vision; 2021; pp. 10012–10022.
Disclaimer/Publisher’s Note: The statements, opinions and data contained in all publications are solely those of the individual author(s) and contributor(s) and not of MDPI and/or the editor(s). MDPI and/or the editor(s) disclaim responsibility for any injury to people or property resulting from any ideas, methods, instructions or products referred to in the content. |
© 2024 by the authors. Licensee MDPI, Basel, Switzerland. This article is an open access article distributed under the terms and conditions of the Creative Commons Attribution (CC BY) license (http://creativecommons.org/licenses/by/4.0/).


