Preprint
Article

Performance of Calcium Aluminate and Calcium Sulfoaluminate Cement Mortars Incorporating Fly Ash and Limestone Powder

Altmetrics

Downloads

52

Views

34

Comments

0

Submitted:

20 September 2024

Posted:

23 September 2024

You are already at the latest version

Alerts
Abstract
This study assesses the performance of calcium aluminate (CAC) and calcium sulfoaluminate (CSA) cement mortars, particularly when blended with fly ash (FA) and limestone powder (LP). The effects of incorporating 20% FA, 15% LP, and their combination (FA 20% and LP 15%), using a water-binder ratio of 0.40 were explored. The study meticulously evaluates the performance of the mortar mixtures in terms of setting time and mechanical properties, including compressive strength, flexural strength, and direct tensile strength. Additionally, the study investigated the alkali-silica reaction (ASR) and autogenous shrinkage. Advanced analytical methods such as X-ray diffraction (XRD), Thermogravimetric Analysis (TGA), and Scanning Electron Microscopy (SEM) were employed to further understand the microstructural changes. The study reveals a significant correlation between compressive, flexural, and direct tensile strengths of the mortar mixtures. Notably, CSA and CAC mortar mixtures with SCMs showed an ASR value lower than the recommended 0.10%, while the autogenous shrinkage for both CAC and CSA mixtures was less compared to Ordinary Portland Cement (OPC). The influence of SCMs, though not substantial, was clearly observed. TGA results corroborated the phases identified in XRD and those observed in SEM, through the thermal decomposition of the phases present in the mixtures. This study contributes valuable insights into the use of SCMs in improving the performance and sustainability of CAC and CSA cement mortars.
Keywords: 
Subject: Engineering  -   Civil Engineering

1. Introduction

The cement sector faces the critical challenge of reducing its carbon emissions, a pressing issue given the considerable amount of carbon dioxide (CO2) released during the production of portland cement clinker. Tackling this issue is important for the adoption of sustainable methods and decreasing environmental damage. Specifically, the production of portland cement clinker releases approximately 0.6 to 0.8 tons of CO2 for every ton manufactured [1,2]. Consequently, there is an increasing demand for alternative binders and clinkers that do not contain portland cement clinkers, such as alkali-activated (AA) binders [3], Calcium Sulfoaluminate (CSA) cement [4], and Calcium Aluminate cement (CAC) [3].
CSA cement has attracted considerable attention due to its environmental benefits, including lower CO2 emissions and reduced energy consumption during manufacturing [4,5]. The main hydration phase of CSA is ye'elimite (C4A3S), accompanied by smaller amounts of belite (C2S), anhydrite (CS), and gehlenite (C2AS) [6,7]. Ye'elimite undergoes hydration with the involvement of anhydrite, leading to the formation of ettringite and aluminum hydroxide (AH3), as shown in Equation (1). Ye'elimite can hydrate independently in the absence of anhydrite, resulting in Equation (2) [8,9].
C 4 A 3 S + 2 C S · H 2 + 34 H C 3 A · 3 C S · 32 H + 2 A H 3
C 4 A 3 S + 18 H C 3 A · C S · 12 H + 2 A H 3
These hydration reactions contribute significantly to the remarkable properties of CSA-based systems, such as quick setting times, high early strength, impermeability, and resistance to both sulfate and chloride corrosion, in addition to low levels of alkalinity [10].
Alumina cement, commonly known as High Alumina Cement or CAC, is a specialized type of cement that differs from OPC with regard to its raw materials and exceptional mechanical properties. CAC exhibits remarkable characteristics, including achieving high early-age strength with compressive strength exceeding 50 MPa within 1 day of curing, excellent high-temperature resistance, and outstanding chemical sulfates resistance and resistance to acids [11,12]. Furthermore, CAC displays high resistance to abrasion and mechanical shock. These unique attributes make CAC a preferred choice in various industries, including construction, refractory, and oil well cementing [13]. The primary phase of CAC is known to be monocalcium aluminate (CA), which exhibits delayed setting but rapid hardening. Other phases present in CAC include CA2, C12A7, C4AF, C2S, and C2AS. Notably, C3S is not present in CAC cement. While C12A7 sets quickly, it has no impact on strength gain, while C4AF has little or no contribution to setting time and strength gain. C2S and C2AS contribute to strength gain at a later stage [14]. Upon the hydration process, principal hydrates, including C2AH8, CAH10, and C3AH6, along with AH3, are formed [14,15]. The conversion of metastable hydrates CAH10 and C2AH8 to stable hydrate C3AH6 and poorly crystalline AH3-gibbsite can increase porosity and reduce strength. This phenomenon of hydration product conversion was first highlighted by Neville in the late 1950s but was not well understood until the sudden failure of some bridges and buildings. Shirani et al. [16] used synchrotron ptychographic nanotomography to quantify the "secondary water porosity" that develops during conversion. This porosity can facilitate the ingress of chemicals such as chlorides, impacting durability. Although the use of CAC in structural applications was limited in the 1970s, recent efforts have been made to reintroduce it into structural use since 2000.
One way to reduce the cost and carbon emissions associated with producing CSA is by incorporating SCMs like LP [17,18,19] or industrial by-products such as fly ash and slag [10,20]. Fly ash has been extensively researched in the past as an additive to OPC, where it serves as both a filler and pozzolan [5,21,22,23,24]. This results in increased hydration of the OPC because of an increased effective water-binder ratio at a constant water/solid ratio. The filler effect is particularly important during early stages when fly ash has little reaction for up to seven days. With the high pH in pore solution of the OPC, fly ash can react and dissolve with portlandite to form additional C-S-H, leading to more efficient utilization of the OPC [22,23,25]. Although there has been extensive research into the use of FA in portland cement, the exploration of its use in CSA cement blends has been limited [10,20,26,27]. During early hydration, the pore solutions of CSA cement typically have a lower pH compared to portland cement, suggesting that the dissolution of fly ash may be slower in CSA systems [28,29]. It is important to note that when OPC incorporating FA hydrates, the primary reaction associate of FA, portlandite, is not typically created or formed. However, if hydrated calcium sulfoaluminate cement contains calcium silicate hydrate, C-S-H, this may provide calcium ions through the transformation into a C-S-H with a lower Ca/Si ratio, similar to the process observed in OPC mixed with FA. Studies suggest that adding 5-15% FA to CSA cements can improve compressive strength by approximately 3-6 MPa after 28 days of age, but higher amounts of FA can actually decrease compressive strength. FA is known to promote the early formation of ettringite in CSA cement system, while strätlingite is noticed only following 180 days of age at a high water-to-cement ratios, indicating limited reaction of the FA [10,23,26].
Moreover, according to research conducted by Martin et al. [30], adding up to 15% FA by mass while maintaining a constant water-binder ratio can preserve compressive strength values similar to those of pure mixture without FA. However, the same study also observed an important reduction in compressive strength through a 45% incorporation of fly ash. Similarly, Collepardi et al. [31] found that using 40% FA led to decreased strength levels due to an increase in the water/cement ratio. Meanwhile, López-Zaldívar et al. [32] discovered that incorporating 10% treated FA obtained from municipal solid waste incineration into CAC mortars resulted in the presence of hydrated tetracalcium monocarboaluminate, which densely correlates to the observed increase in strength. Pyatina and Sugama [33] also found that heating the CAC and FA blend can enhance acid resistance.
This study, therefore, aims to evaluate the performance of CAC and CSA cement mortars incorporating FA and LP. Various blends of OPC, CSA, and CAC, with different proportions of LP and FA, were prepared and tested. The objective is to assess the influence of these SCMs on key properties such as setting time, compressive strength, tensile strength, flexural strength, autogenous shrinkage, and alkali-silica reaction. Additionally, the microstructure of selected blends was analyzed using XRD, TGA, and SEM. This approach provides new insights into the combined effects of SCMs on cement performance.

2. Experimental Program

2.1. Materials and Method

A Type I Ordinary Portland Cement (OPC) was used as a benchmark for comparison. In addition, three different commercially available CSA cements were obtained from a manufacturer and were sourced as: CSA1 (C1), CSA2 (C2), and CSA3 (C3), while CAC1 (CA1) and CAC2 (CA2) are calcium aluminate, each with their own unique chemical composition. CA2 is a proprietary ternary blend with CAC, CSA, and OPC. Limestone powder (LP) and high calcium Fly ash (FA) were used as SCM. Table 1 below describes the chemical compositions of all the cementitious binders used in this study.
The OPC utilized in this research was provided by the manufacturer and has a Blaine fineness of 310 m2/kg and a density of 3.15 g/cm3. The mixture design comprised of three distinct systems. The first system consisted solely of pure cement, which was labeled as OPC, CSA1, CSA2, CSA3, CAC1, and CAC2. In the binary system, FA was introduced at 20% replacement rate by mass, while LP was added separately at 15% by mass in another set. Lastly, ternary cement blends were examined with the incorporation of two SCMs in the mixture. These blends contained 20% fly ash and 15% limestone, combined with 65% pure cement binders. The mixtures were produced with a water-binder ratio of 0.40 and a cement to fine aggregate ratio of 1:2.75.
To mix the mortar samples, a 5-quart laboratory mixer with three different speeds is utilized. Initially, the cement is dry mixed for 30 seconds at speed 1. After, water is introduced and mixed for an additional 30 seconds at speed 1, followed by an additional 30 seconds of mixing at speed 2. The mixture is then stopped and scraped around the edges before sand is incorporated. Next, the mixture was blended for 2 minutes at speed 2 and stopped once again to ensure a homogeneous mixture. The mixed mortar samples were then cast into an assortment of molds and vibrated for 2 minutes. After 24 hours, the mortars were taken out of the molds and then kept in a room with moist/wet conditions at a temperature of 20 ± 2oC until the testing days. Table 2 provides the detailed mixture proportions for all the cement mortar samples used in this study.

2.2. Test Methods

2.2.1. Setting Time

To test for the initial and final setting time, the prepared cement paste was poured into a non-absorbent conical ring placed on a glass plate. The mixed paste was poured through the smaller end of the ring until the paste surface and the border of the ring are levelled. The sides of the conical ring were gently tapped, and the surface was smoothened. The molded sample was placed in an environmental chamber for testing with automatic vicat needle apparatus. The indicator on the vicat apparatus was set to zero before starting to take measurement. Measurements were then taken around 5 mm away from the previous penetration, moving outwards in a circular pattern from the center. The frequency of measurements for different types of SCM varied, and the time between preparing the specimen and making the first measurement depended on the nature of the specimen. Data points were gathered until the needle showed no displacement or no marks were visible on the cement paste for 90 seconds. The final setting time is the time at which this occurs. The initial time was found through linear interpolating the time at which 25 mm of displacement was expected to happen.

2.2.2. Mechanical Properties

To evaluate the mechanical properties of the mortar mixtures, compressive strength test was conducted in accordance with ASTM C349. The mixtures were tested on 6hrs, 1, 7, 28, 56, and 91 days for compressive strength. Meanwhile, flexural strength was conducted in accordance with ASTM C348 and tested on 28 days of age. Direct tensile strength was tested according to ASTM C307-03 on 28 days of age.

2.2.3. Alkali-Silica Reaction

Mortar samples with dimensions of 25 x 25 x 285 mm were used for Alkali-Silica Reaction (ASR). To initiate the ASR reaction, the mortar bar samples are immersed in a hot sodium hydroxide (NaOH) water solution with a temperature of 80°C for 28 days. The first measurement of the samples was taken as the "zero reading", while the expansions of the samples were measured after submerging them in a hot water bath for 24 hours at a temperature of 80°C. The length changes of the bars were then recorded at 1, 3, 7, 14, and 28 days using a length comparator. The samples were carefully removed from the NaOH solution for a maximum of 15 seconds to record the length changes. The difference between the initial reading of each specimen and the reading for each time period represents the expansion of the specimen for that period. An expansion rate of 0 to 0.10% indicates that it is not harmful or reactive. A 0.10 to 0.20% expansion rate is considered harmful or deleterious and would require further testing. An expansion rate above 0.20% is seen as reactive or deleterious [34].

2.2.4. Autogenous Shrinkage

All mortar mixtures adhered to a specified water-binder ratio of 0.40 and a sand to cement ratio of 2.75, as outlined in Table 3. The mortar samples were mixed in accordance with ASTM C305. Corrugated tubes were then fully filled and maintained at a temperature of 23°C throughout the testing period. The length of four replicated samples was measured at final setting time, as well as at ages of 0, 3, 7, 14, 28, and 56 days of ages. The autogenous shrinkage strains were calculated relative to the initial length measurements taken at final setting time.

2.2.5. Particle Size Distribution

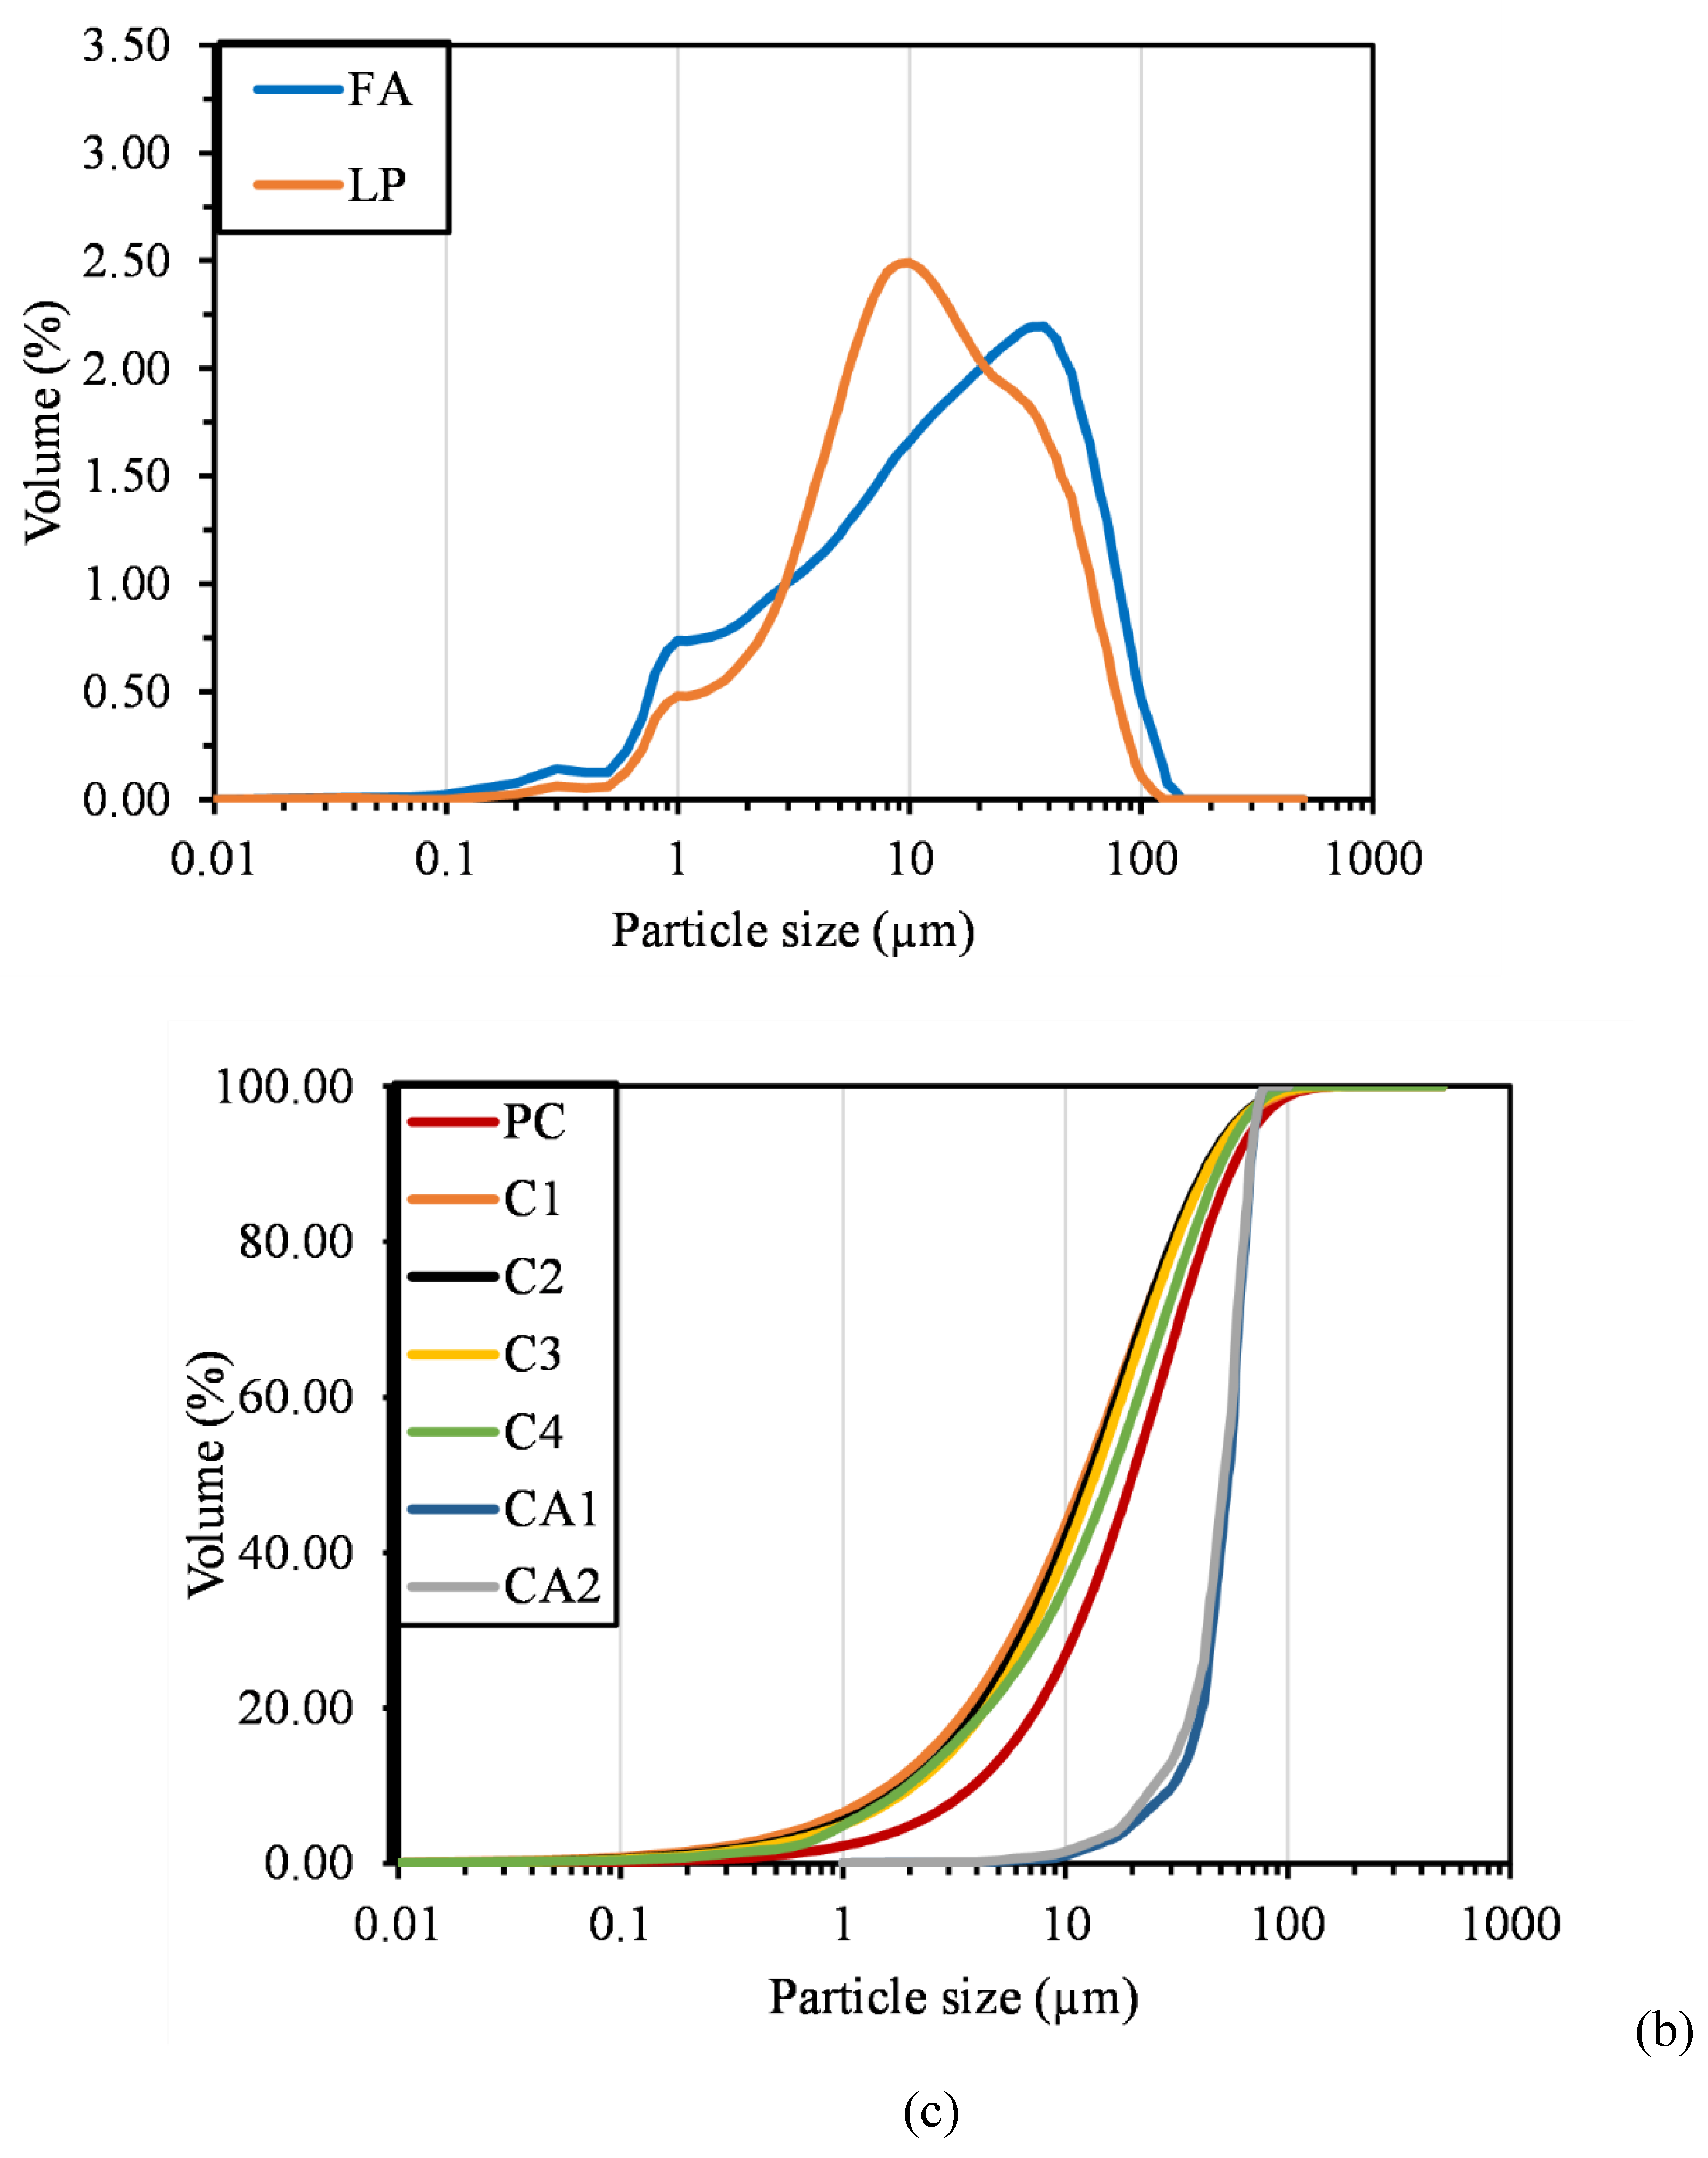
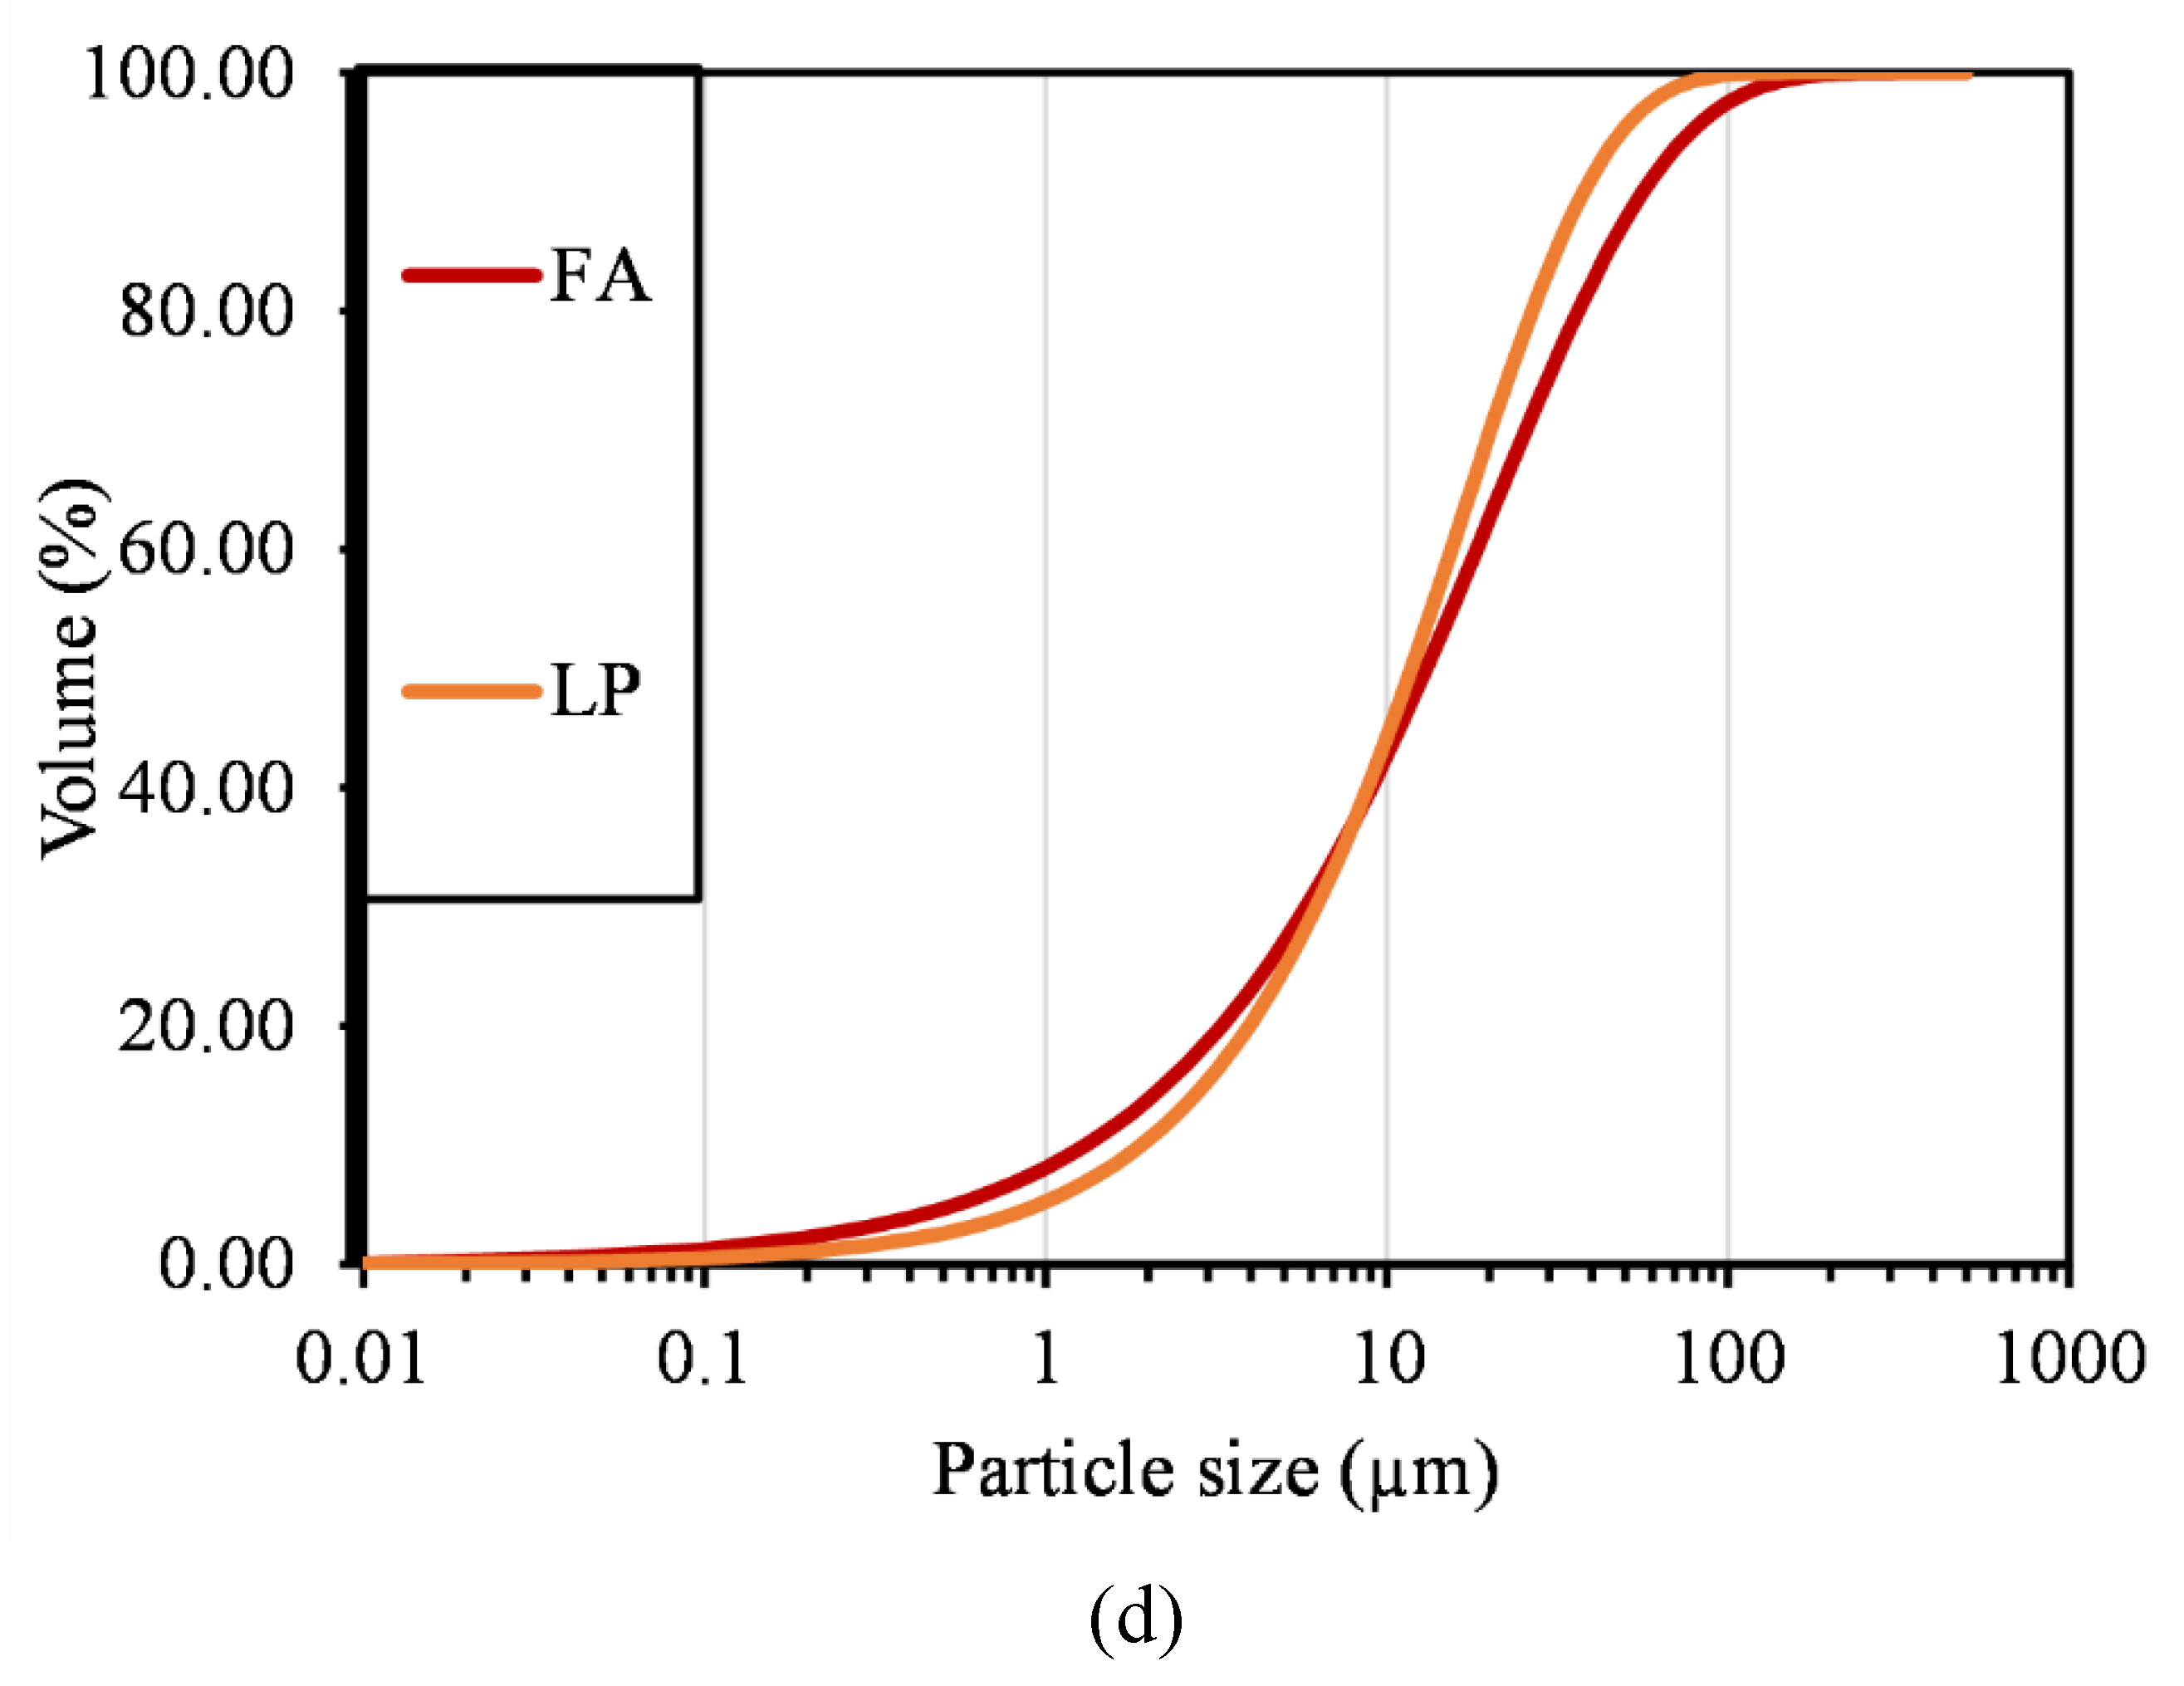
Laser diffraction was utilized to conduct the particle size distribution experiment of four distinct types of cement, including CSA cement, OPC, FA, and LP. The process involved introducing approximately 5 grams of cement powder into the ISO Anton Paar PSA 1090L device, where the particles were dispersed in liquid and laser diffraction measurements were taken over a range of particle sizes from 0.04 to 500 μm. The average value reported was a combination of three measurements, and the data indicated exceptional consistency, with a variation in mean particle sizes of repeated measurements being less than 1%. Figure 1a,b represent the particle distribution of different cementitious binders and SCMs in this study, respectively.
The PSD analysis indicated that PC had particle sizes of 1.58 µm, 12.53 µm, and 45.37 µm at the 10th, 50th, and 90th percentiles (D10, D50, and D90), respectively. The PSD of CSA cement varied across the series. C1 had particle size values similar to PC in all percentiles, indicating a similar PSD. C2 showed a marginally coarser distribution with particle size values of 1.81 µm, 13.23 µm, and 43.40 µm for D10, D50, and D90, respectively. C3 had an even coarser PSD with particle size values of 1.94 µm, 13.99 µm, and 44.40 µm for D10, D50, and D90, respectively. C4 exhibited the coarsest distribution among all variants with particle size values of 1.95 µm, 16.08 µm, and 50.12 µm for D10, D50, and D90, respectively. In comparison, FA had a finer PSD at lower percentiles with a D10 of 1.27 µm but had an increased particle size at higher percentiles with a D90 of 54.86 µm. LP had the broadest range of particle sizes with particle size values of 2.08 µm, 10.55 µm, and 42.16 µm for D10, D50, and D90, respectively. The comprehensive analysis of PSD highlights the subtle differences among cementitious materials and emphasizes the potential implications these variations may have on the rheological properties and performance of cementitious composites.

2.2.6. Scanning Electron Microscope

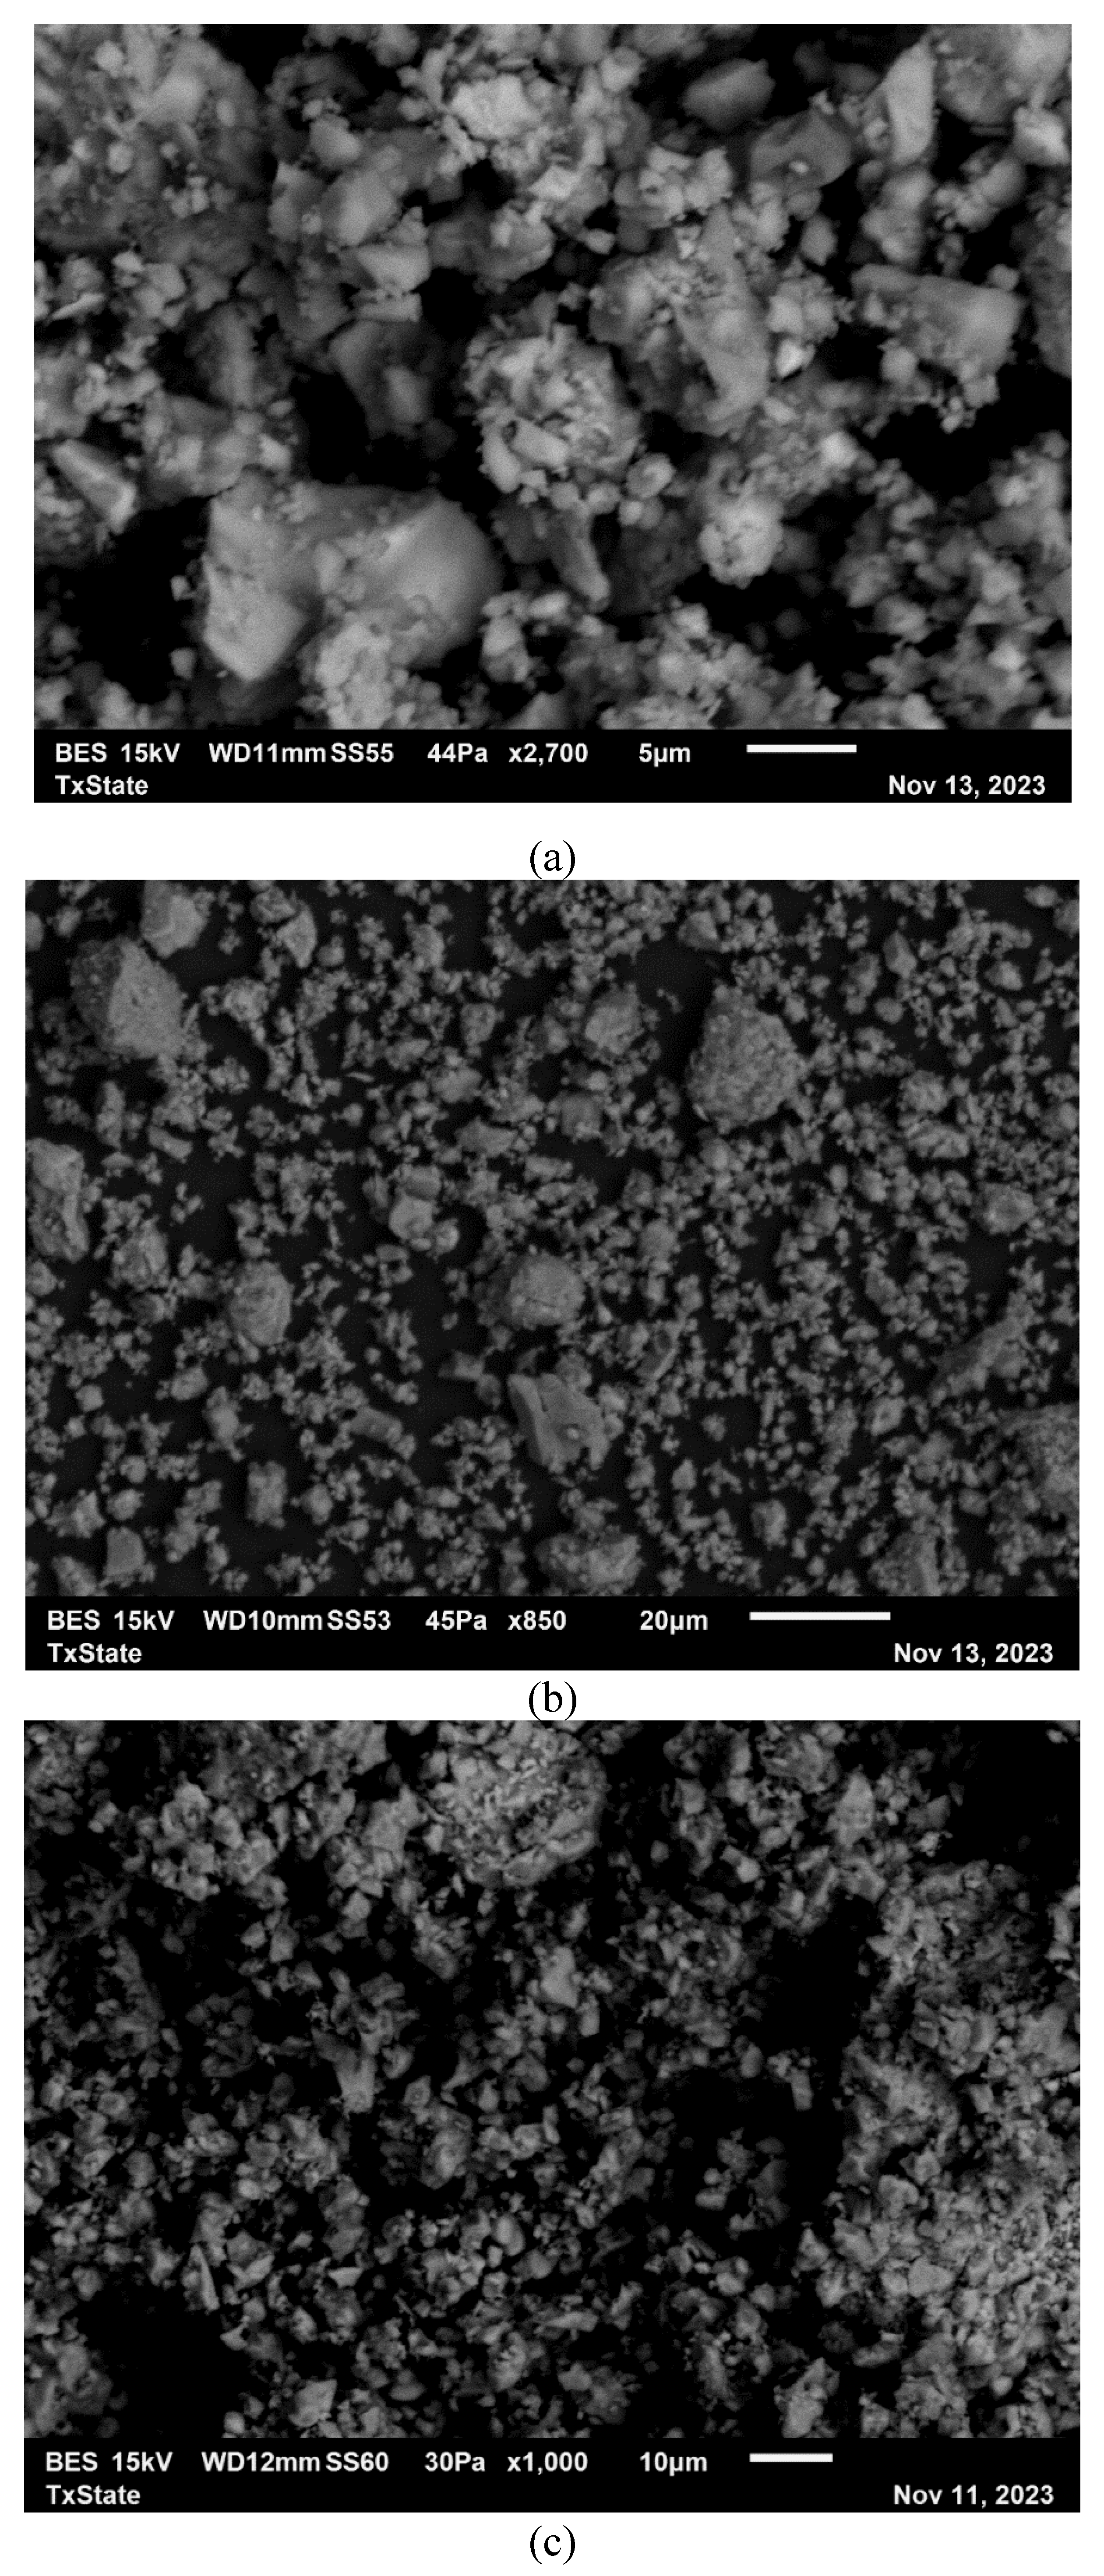
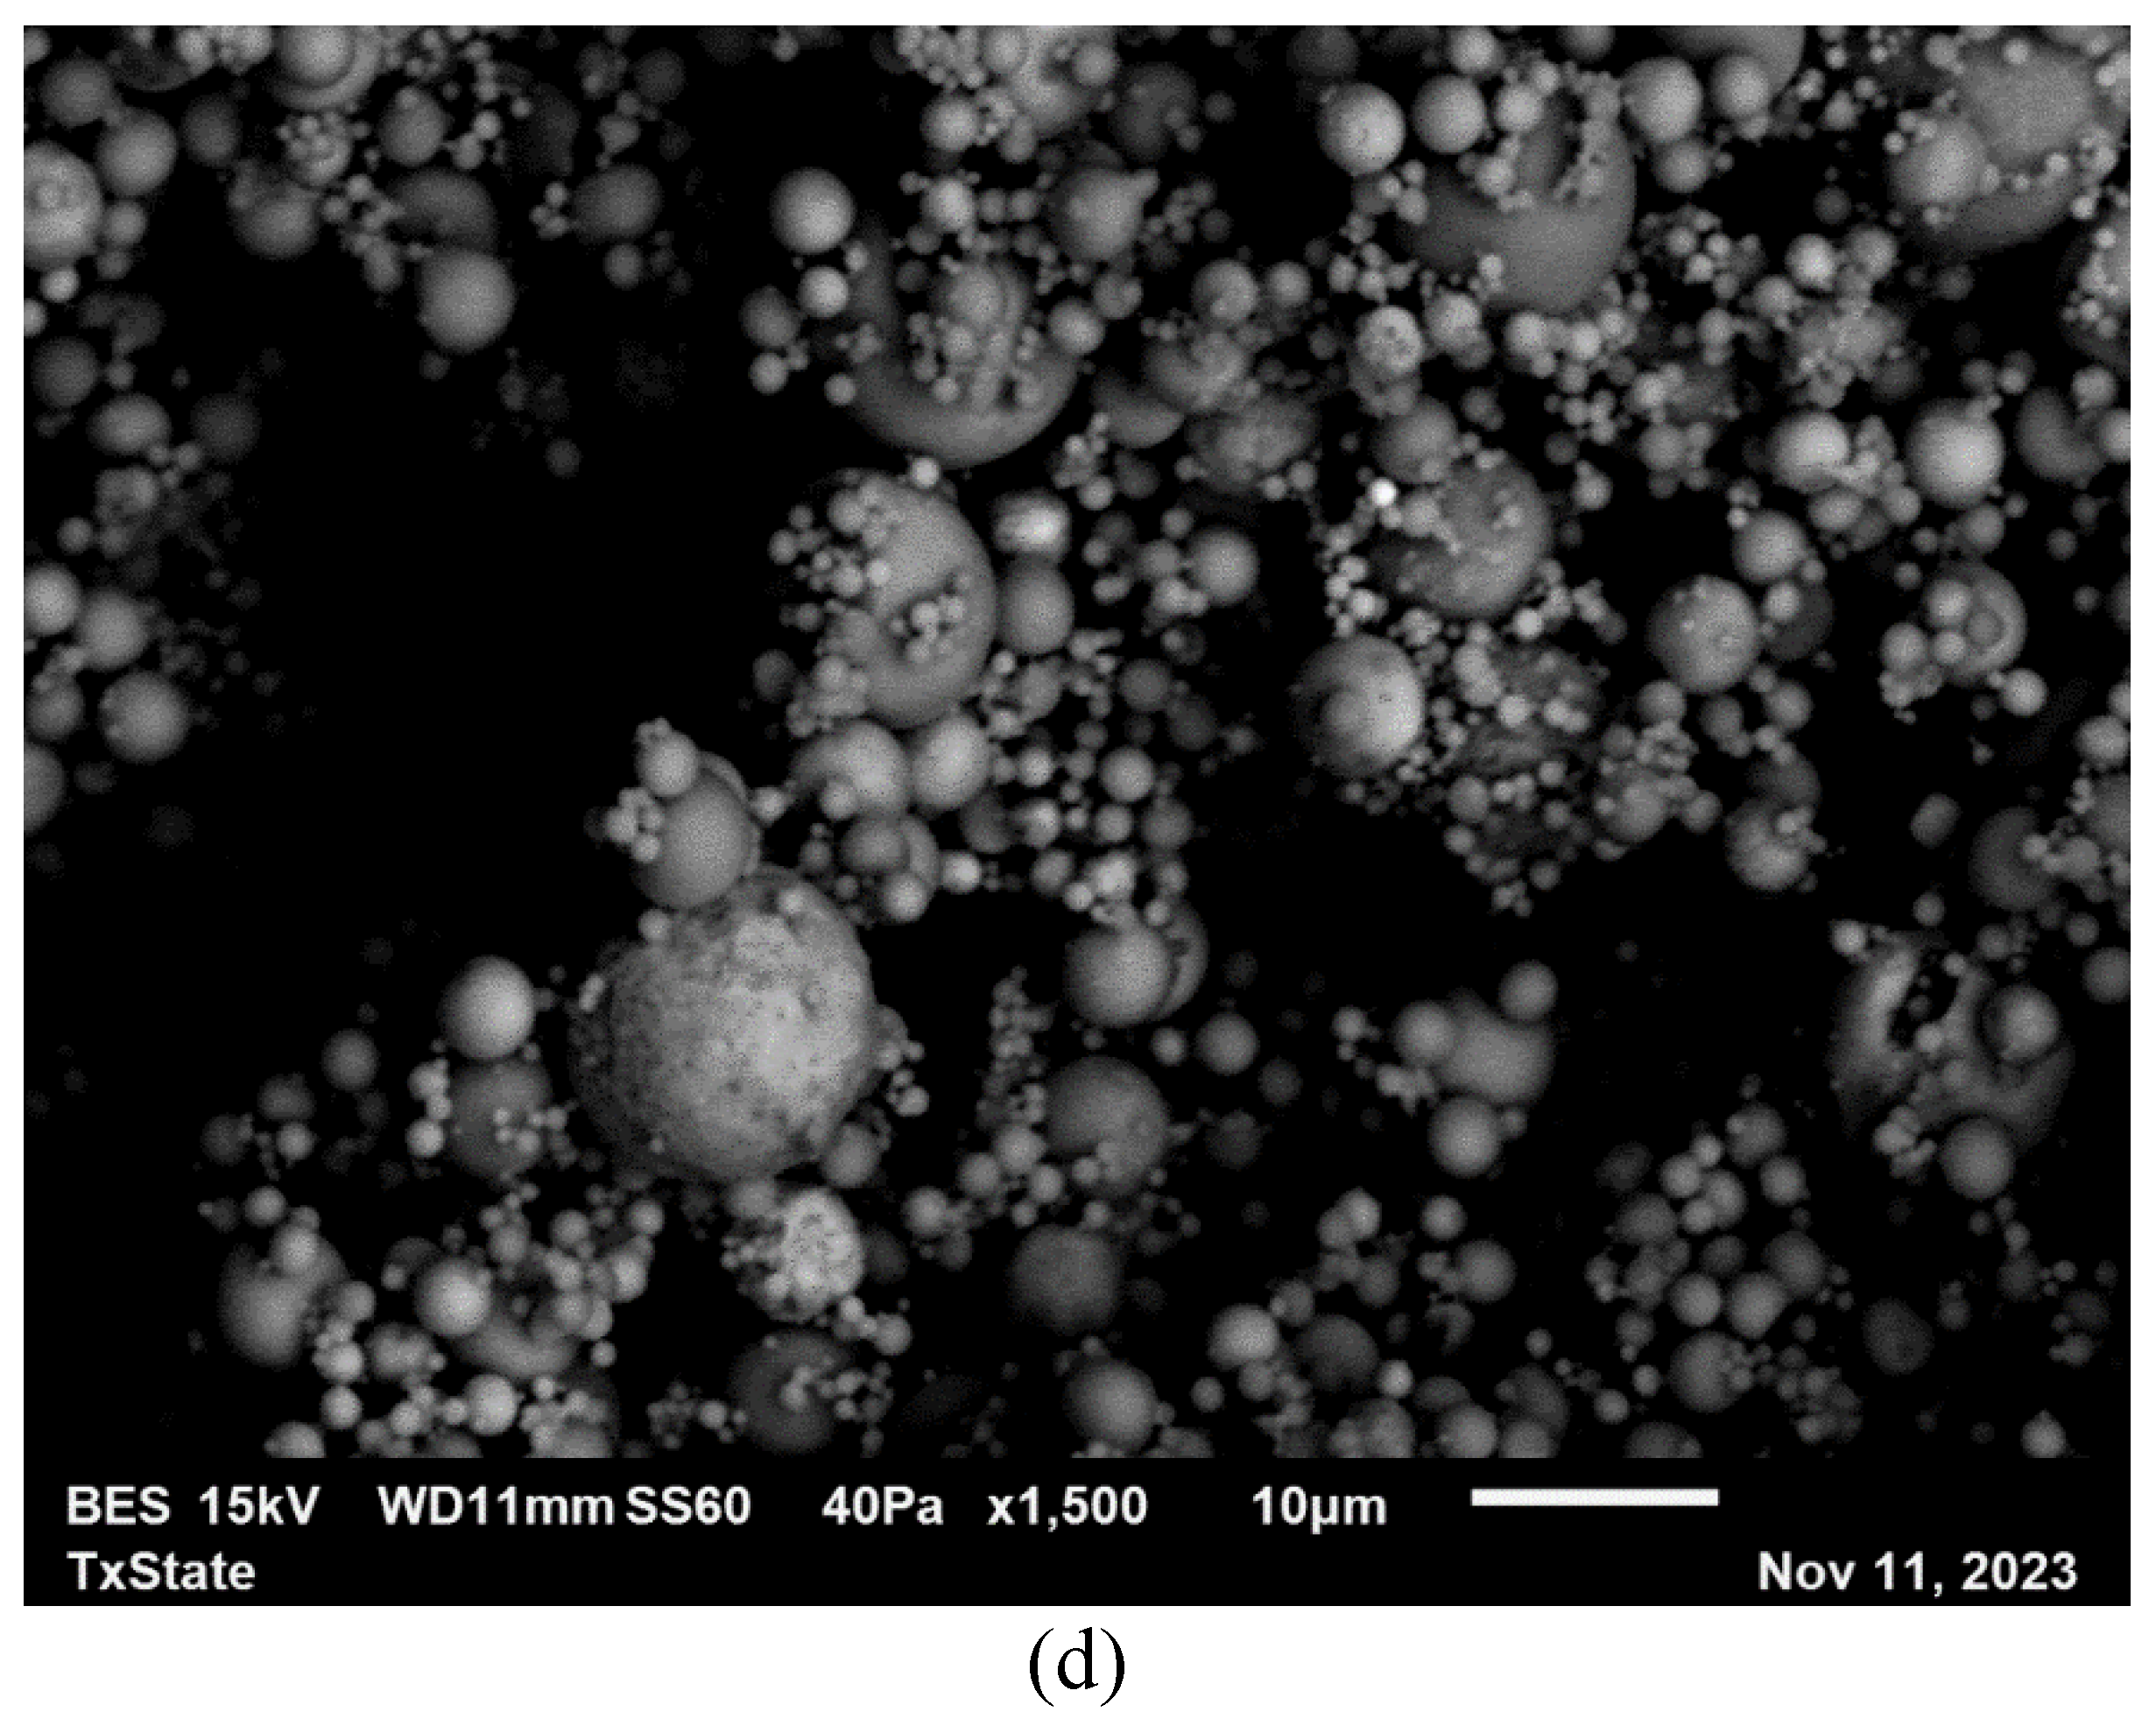
To analyze the morphology of the binders in this study, an SEM imaging analysis was investigated utilizing a JEOL JSM-6010 Plus/LA instrument. The cement powders were placed on carbon tape, attached to a SEM stub, and any excess particles were removed using compressed air. Sputter coating was not applied, as there was no contact between cement and carbon tape that would encourage charging during imaging. To obtain representative images for analysis, the SEM was set to secondary electron mode with a low vacuum and an accelerating voltage of 15 kV. The working distance was set to 11-12mm. Figure 2 demonstrates the SEM morphology of C3, C2, LP and FA.

2.2.7. Thermogravimetric Analysis

To conduct TGA testing, samples of cement paste were extracted from the cores of compressive strength testing samples. These cores were then subjected to a process of fine grinding and homogenization, followed by loading approximately 35 mg of the resulting powder into the TGA. Temperature gradually ramped up to 1000°C under an inert nitrogen atmosphere. Testing was carried out within 24 hours of crushing the samples. The hydration process was halted by soaking the samples in isopropanol and allowing them to rest for about 20 to 30 minutes. The samples were then placed in an aerated oven at a temperature of 40°C for 5 minutes. The data obtained through TGA testing was found to be consistently reproducible.

2.2.8. X-ray Diffraction

To determine the qualitative phases in the mixtures, a Rigaku diffractometer was employed. Prior to XRD analysis, the samples were subjected to crushing and grounding into fine powders using a mortar and pestle, following the same procedures as those employed in TGA and SEM. The scanning range spanned from 5° to 90°, and the speed of the scanning process was set at an interval of 5° per minute.

3. Results and Discussion

3.1. Initial and Final Setting Time

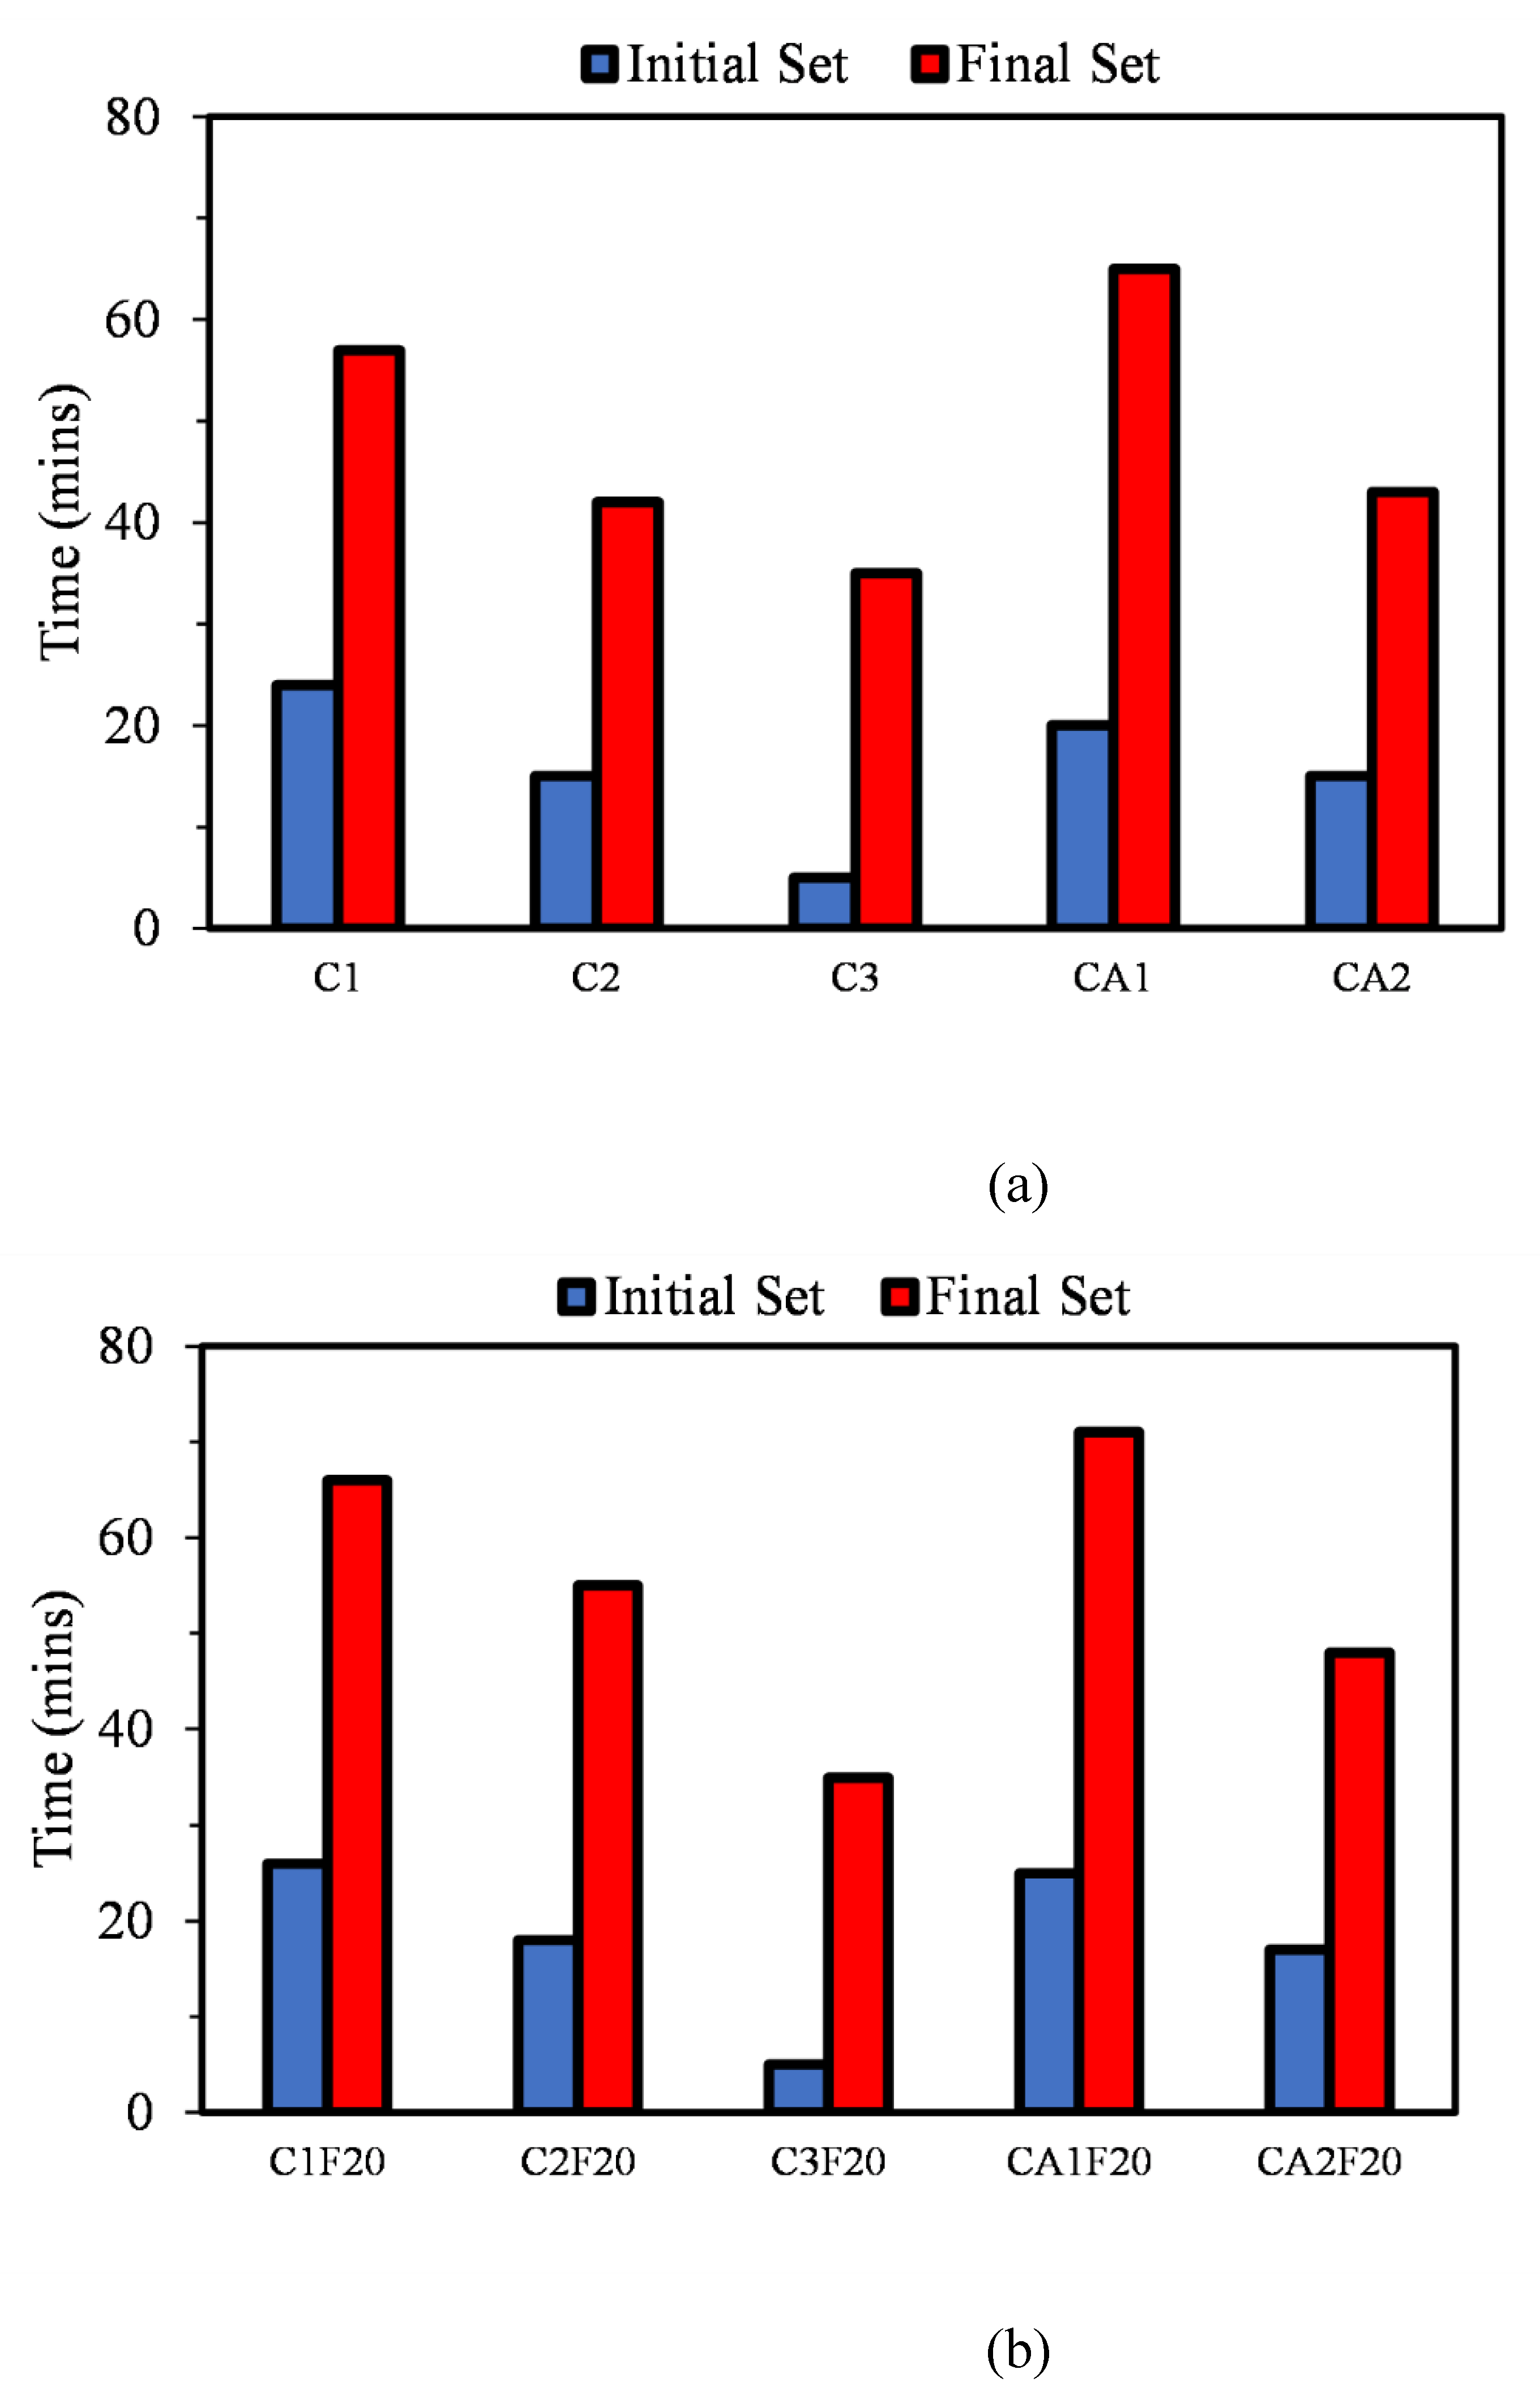
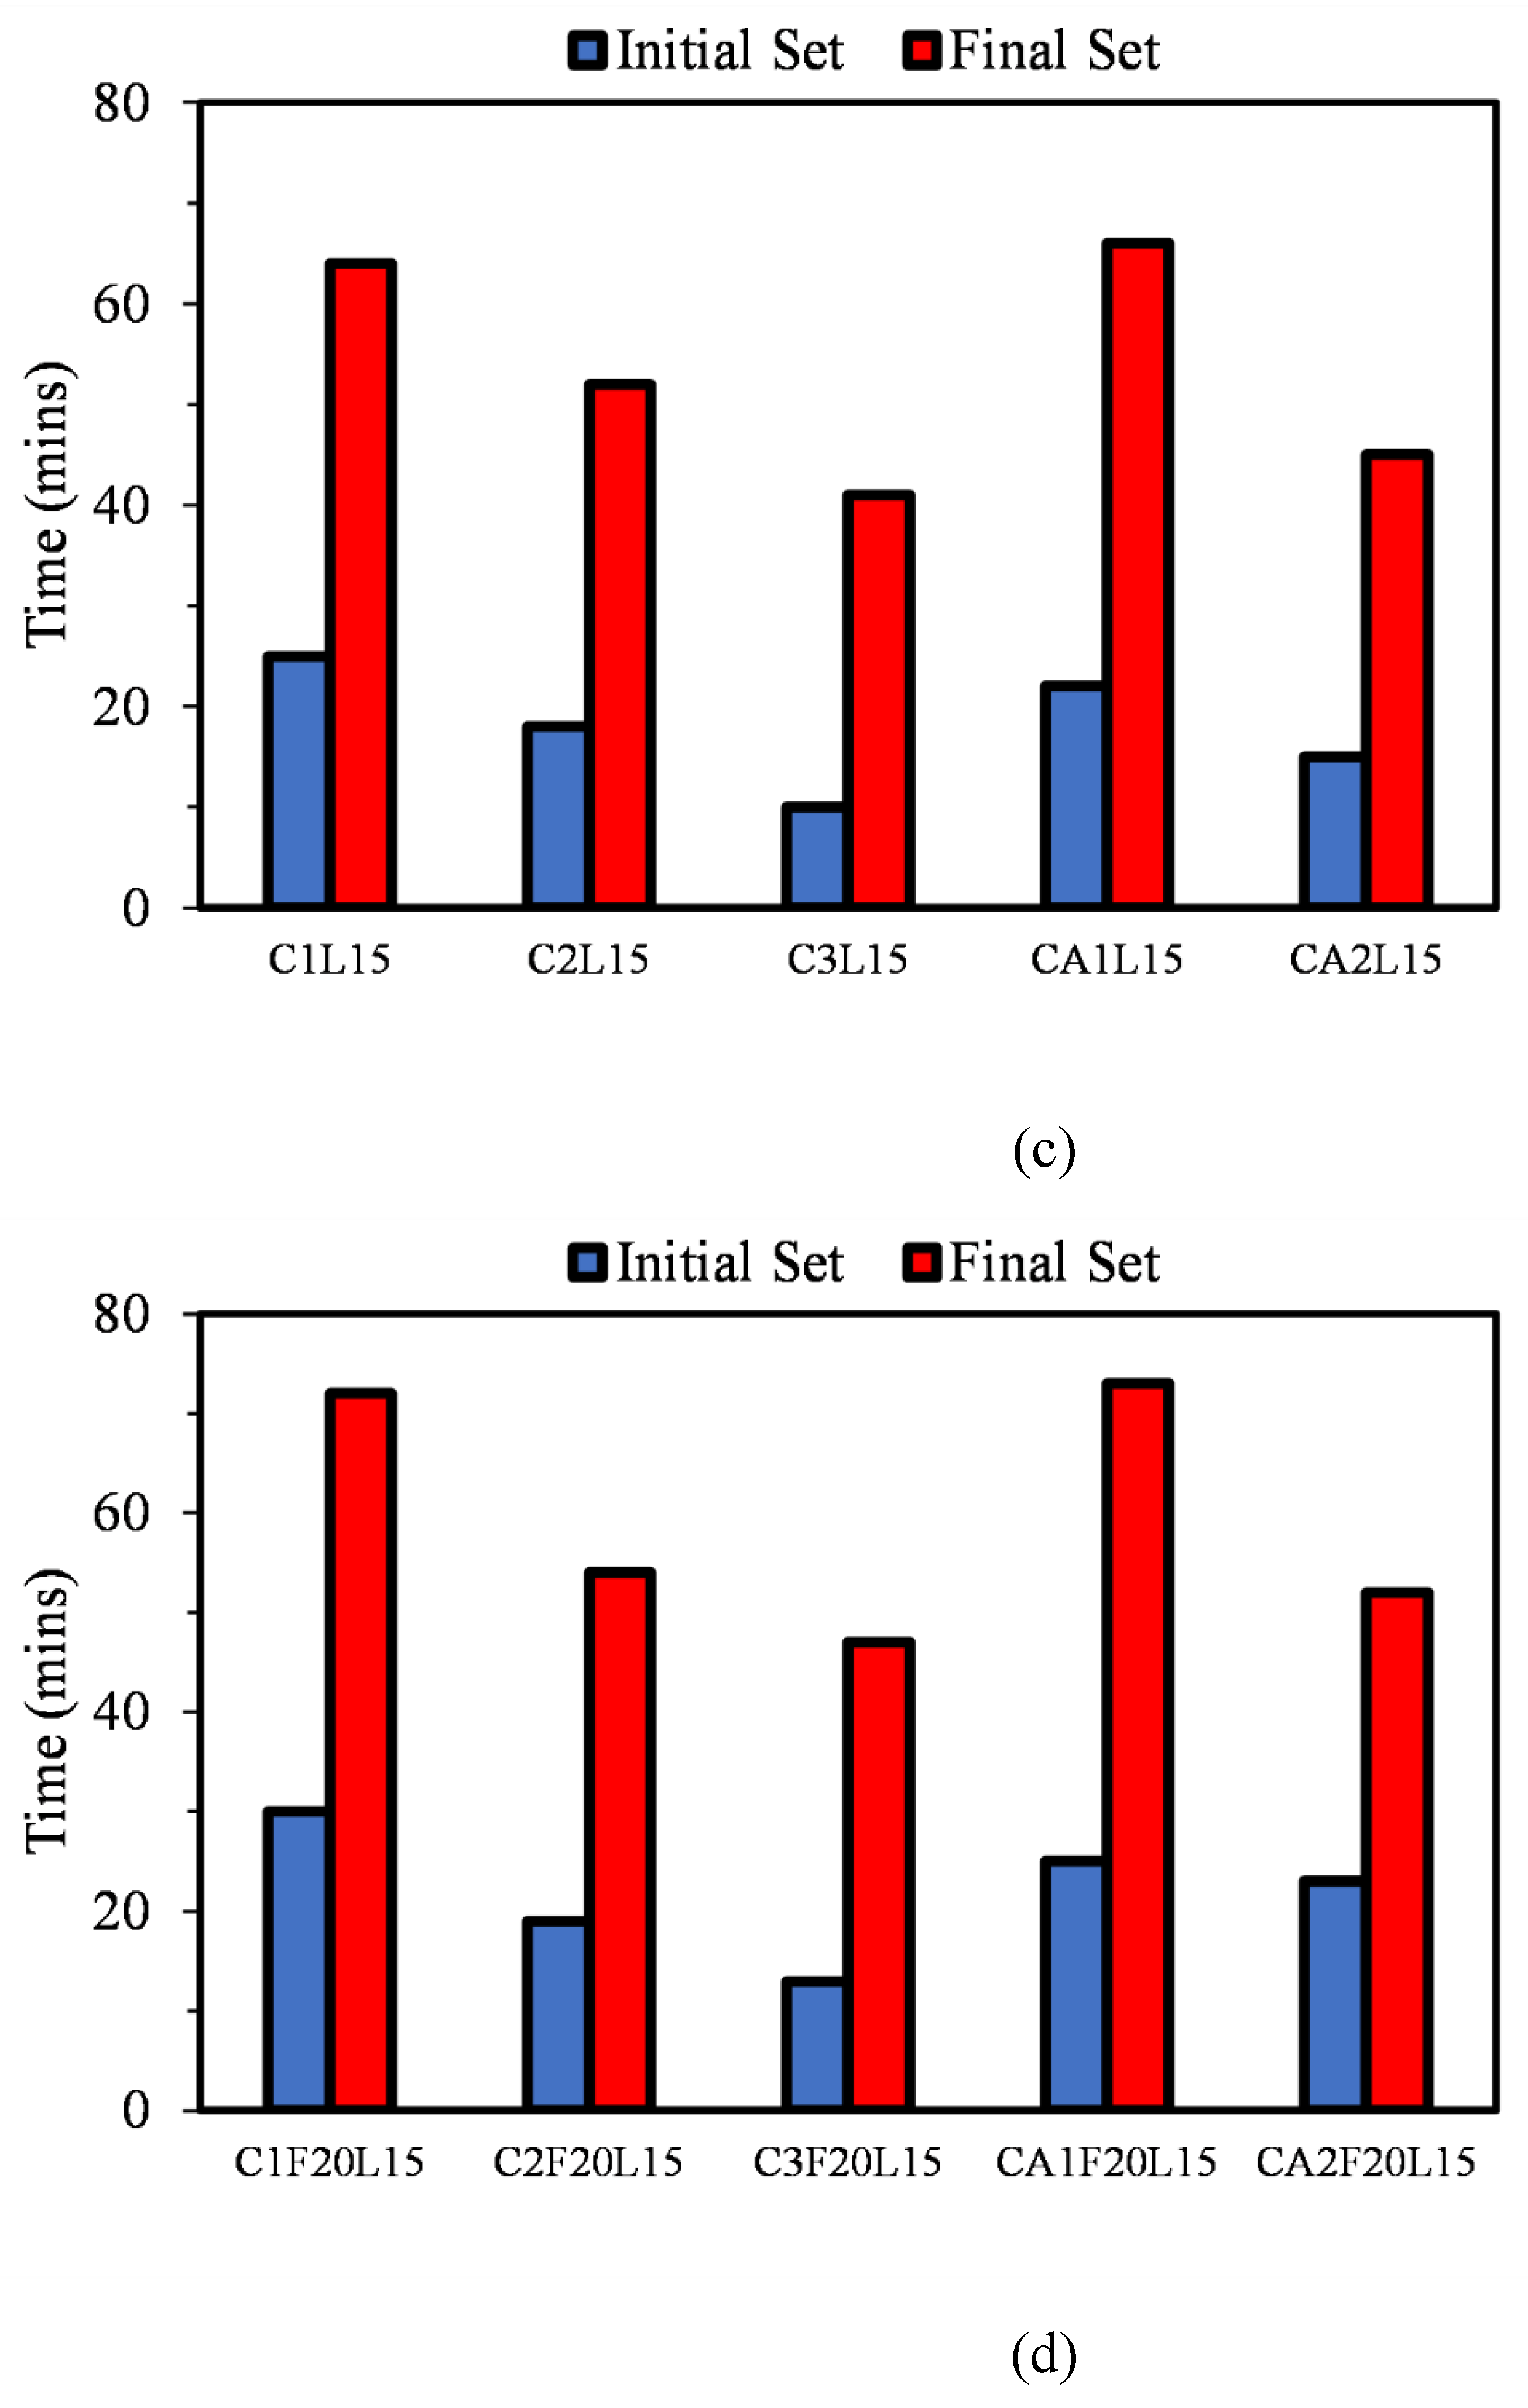
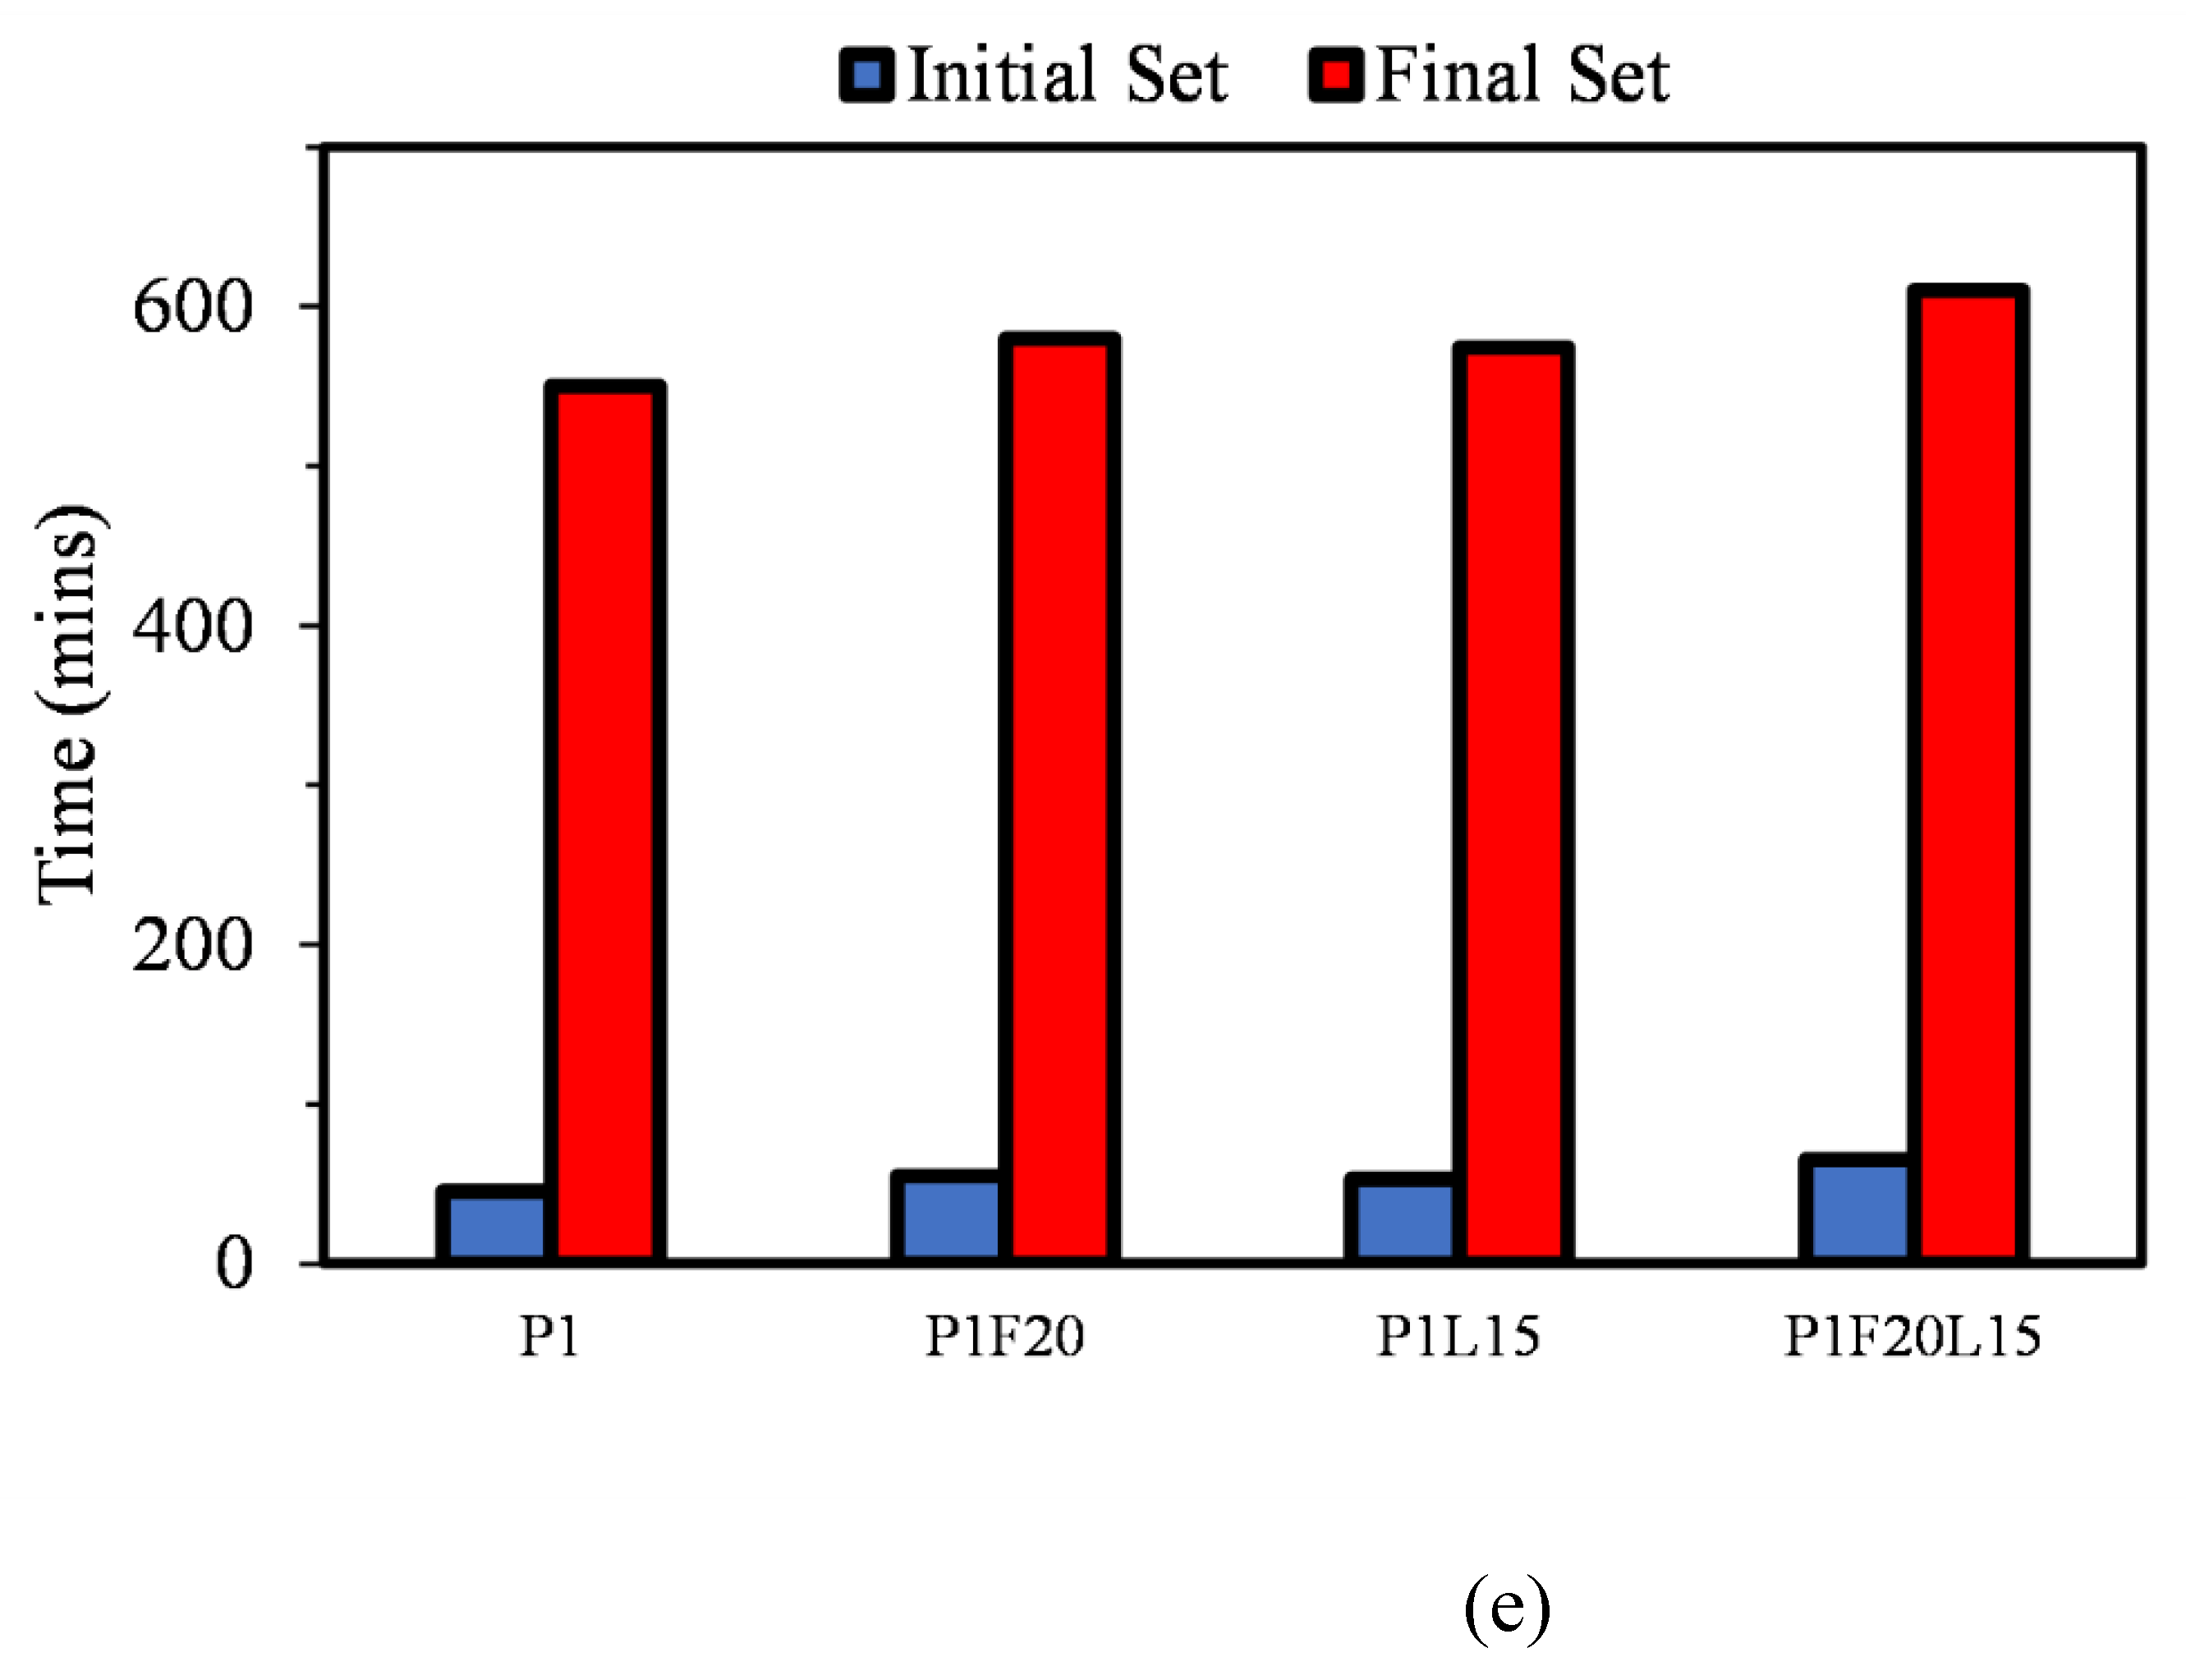
Figure 3 illustrates the setting behaviors of various cement types investigated in this study.
Figure 3a indicates how the different chemical compositions of the binders influenced the initial and final setting characteristics of all the pure mixtures. The time at which the mixtures start to solidify and harden, leading to an increase in compressive strength, is known as their setting time. This study shows that the initial setting time for all cements occurred when their heat patterns began to accelerate, while the final setting time occurred before the corresponding heat output maxima [26,35]. It can be seen in Figure 3e, that P1 shows the most significant initial and final setting times compared to the other binders in Figure 3a. The difference in the setting behaviors of C1, C2, and C3 is associated with the difference in the percentages of alumina, calcium sulfate, silica among others as demonstrated in Table 1. The incorporation of FA and LP had an influence on the duration taken to reach initial set, final set, and the duration between both for OPC, all CSA and CAC binders. When FA was added at a 20% dosage, the time taken to achieve initial set for P1, C1, C2, C3, CA1, and CA2 increased by 18.18%, 7.69%, 16.67%, 0%, 20%, and 11.76%, respectively while the final set time also increased 5.17%, 13.63%, 23.63%, 0%, 8.45%, and 10.42% respectively. Moreover, the incorporation of 15% LP shows a similar trend to the influence of FA. For the initial set, when compared to the pure cement binders in Figure 3a, there is an increase of 15.09%, 4%, 16.67%, 50%, 9.09%, and 0% for P1L15, C1L15, C2L15, C3L15, CA1, and CA2, respectively as shown in Figure 3c. The final set for mixtures with LP similarly shows an increase relative to all the pure binders. And lastly, the incorporation of combined FA and LP at 35% as seen in Figure 3d shows a similar trajectory like the mixtures with either FA or LP. There is a clear and significant increase in all the mixtures for both initial and final setting durations. An increase in initial and final set compared to the pure binders means a hold up in both the initial and final set time, consequently causing a delay in hydration process.
Upon using FA as a substitute for CSA cement, the setting time of the mixture is significantly affected, as evident in Figure 3b. FA, being pozzolanic in nature, interacts with calcium hydroxide in the company of water to manufacture more cementitious materials, albeit at a slower pace compared to the hydration of CSA and CAC cement. As a result, when FA substitutes CSA or CAC cement, the overall reaction rate decelerates, leading to longer setting times for the cement paste. The increase in the initial and the final setting time is partially due to the reduced availability of calcium sulfate, which is critical for early strength development in CSA cement, and is supported by references [36,37]. Additionally, the FA particles physically impede the rapid hydration of both CAC and CSA by occupying space within the paste, thereby reducing the overall surface area available for hydration [26,30,32]. Furthermore, the w/b of 0.40 plays a crucial part in this process. A lower w/b may cause a denser packing of particles, which can further slow down the hydration process due to reduced water and ion mobility within the paste [26,30,32]. LP, predominantly consisting of calcium carbonate (CaCO₃), which serves as an effective filler in cement-based materials. Its interaction with aluminate phases present in the cementitious system can result in the formation of carbo-aluminate phases that can significantly alter the kinetics of hydration [17,18,21].
In comparison to OPC, CSA cement undergoes hydration at a significantly faster rate without an induction period [38], primarily due to the rapid reaction kinetics of the ye’elimite phase when combined with water and calcium sulfate. It has been observed that the presence of calcium sulfate notably accelerates the ye’elimite reaction, a contrast to the hydration behavior of OPC. Consequently, for most practical uses, it is advisable to employ retarders to moderate the hydration process of CSA cement. Various retarders, including organic acids such as citric and tartaric acids, sugars like sodium gluconate, and inorganic substances such as borax, are commonly utilized for this purpose [28,39]. These studies indicate that the retarders function either by hindering the formation of ettringite through the reduced solubility of ye’elimite or by sequestering calcium ions, thus slowing down the reaction rate. Interestingly, borax promotes the formation of a semi-crystalline phase known as ulexite, which forms a layer over the ye’elimite surface, effectively blocking further nucleation and growth of ettringite [36,40,41,42].

3.2. Compressive Strength

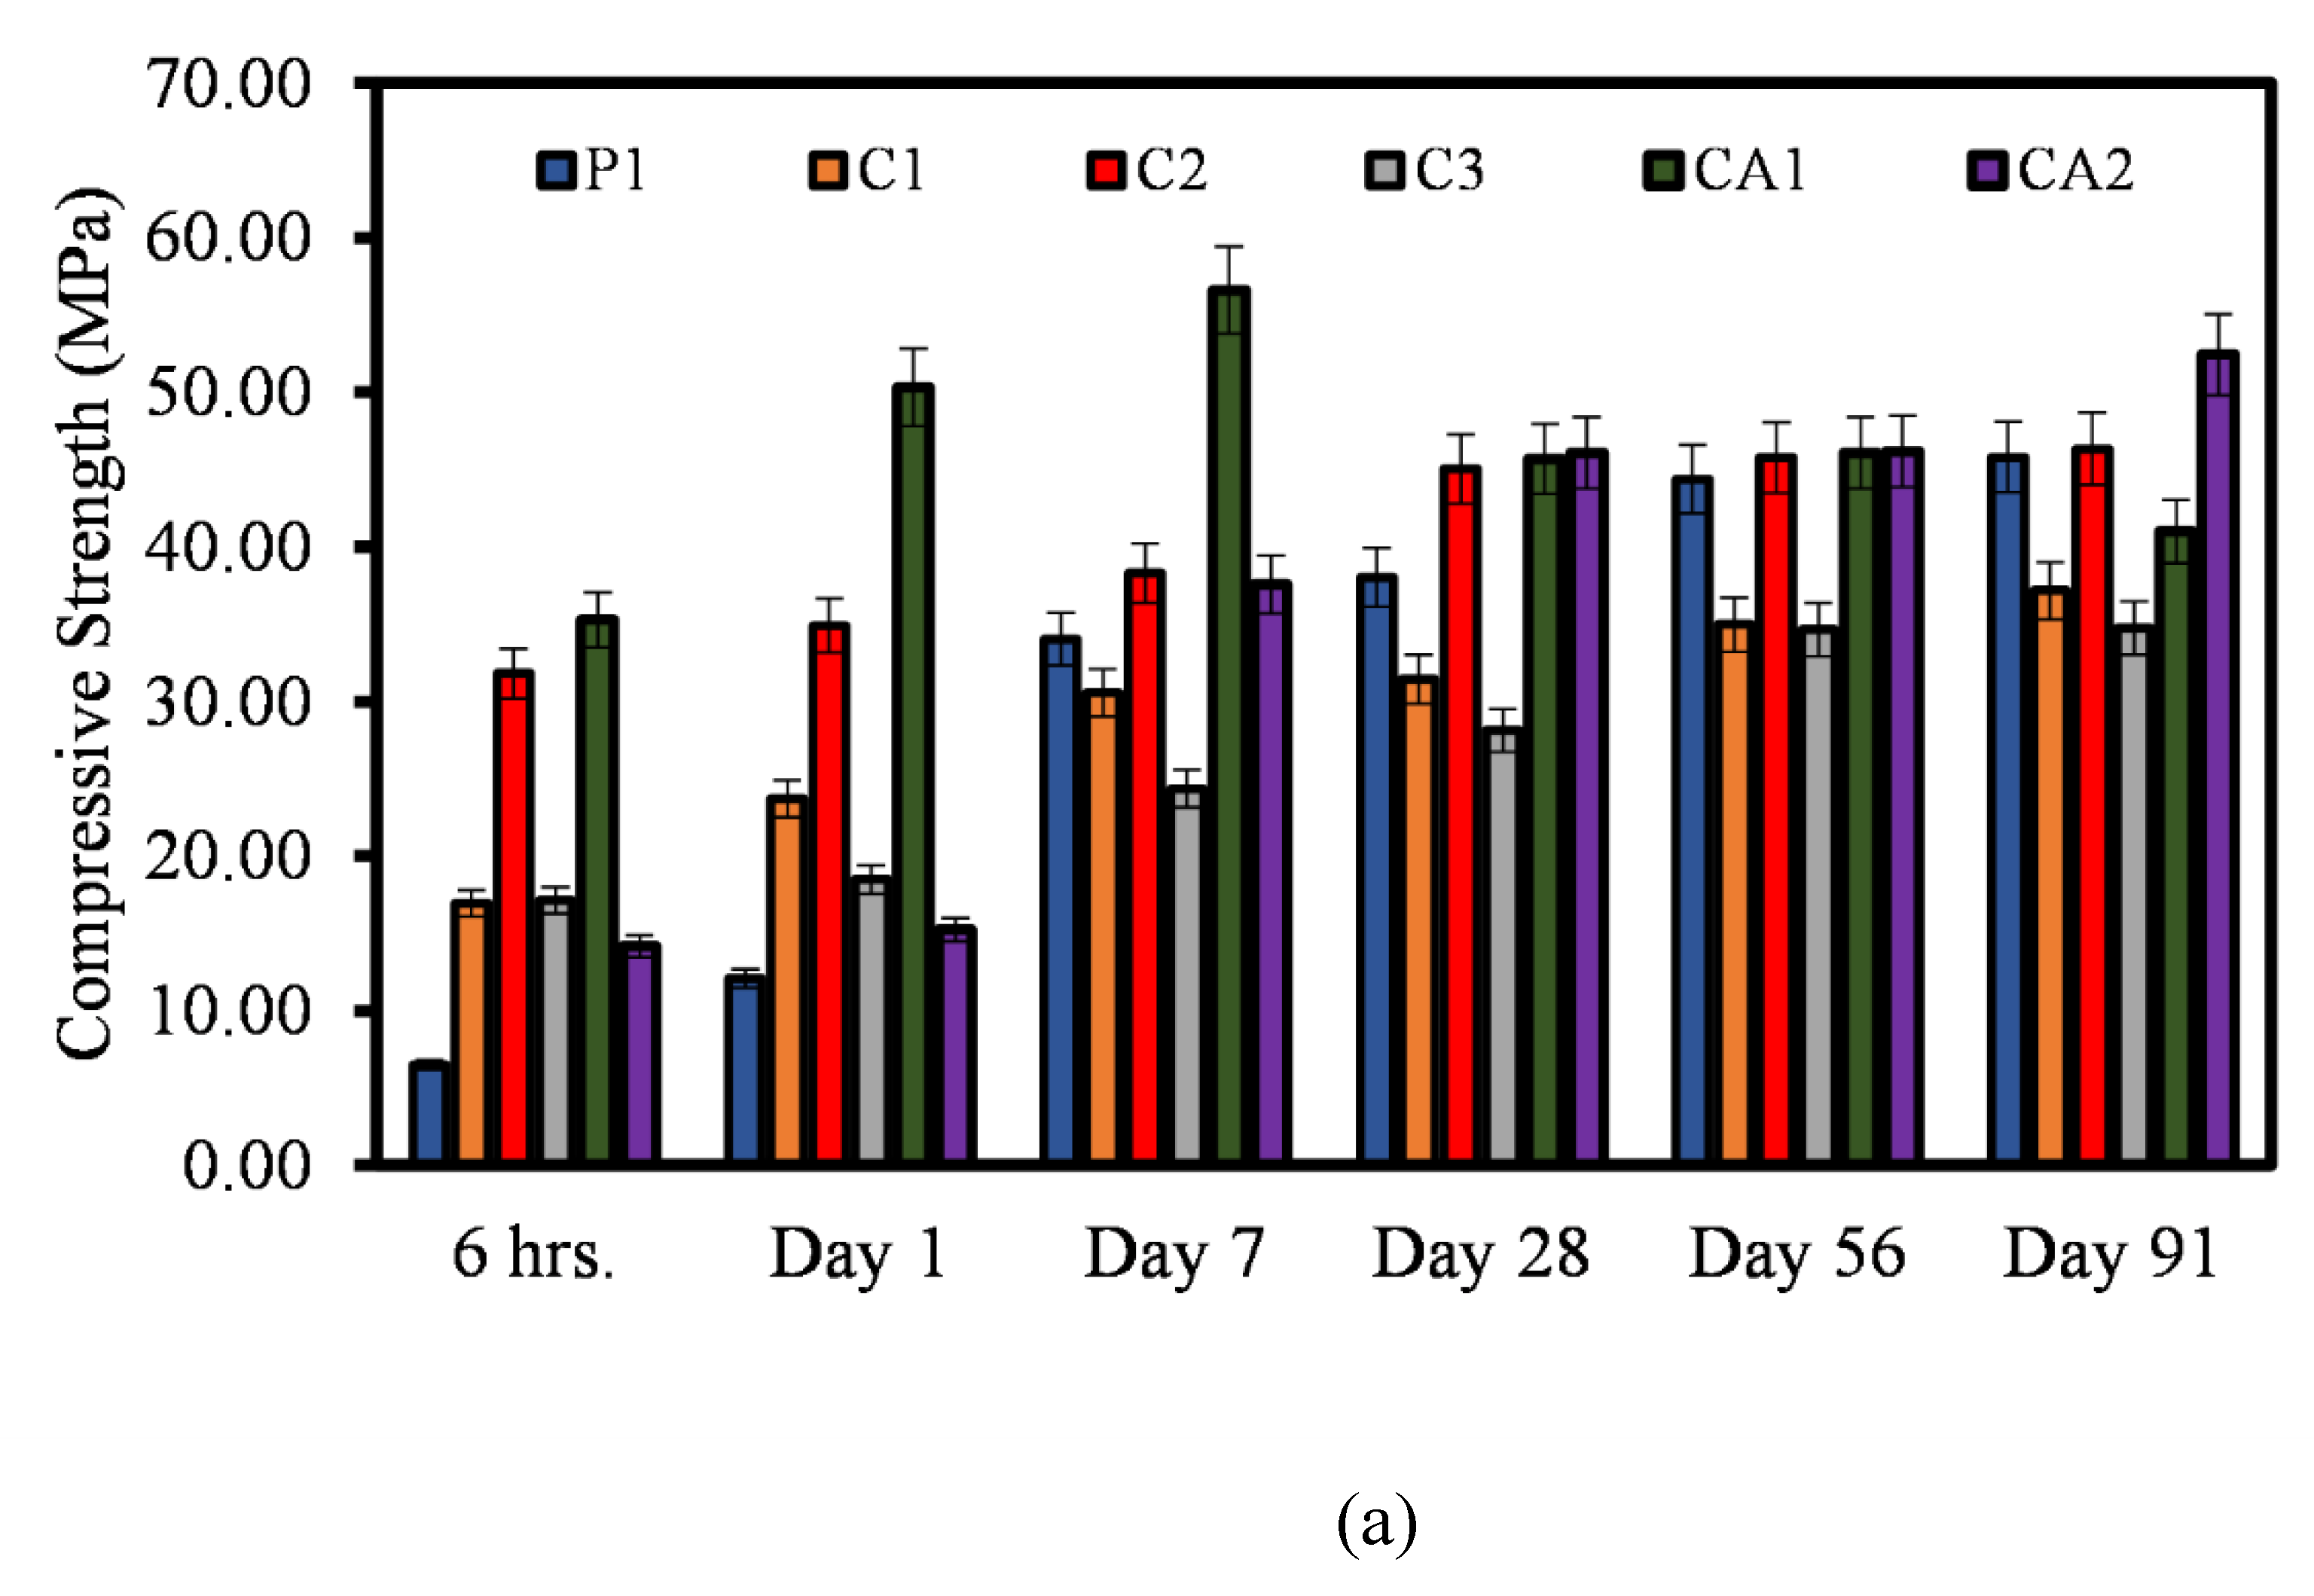
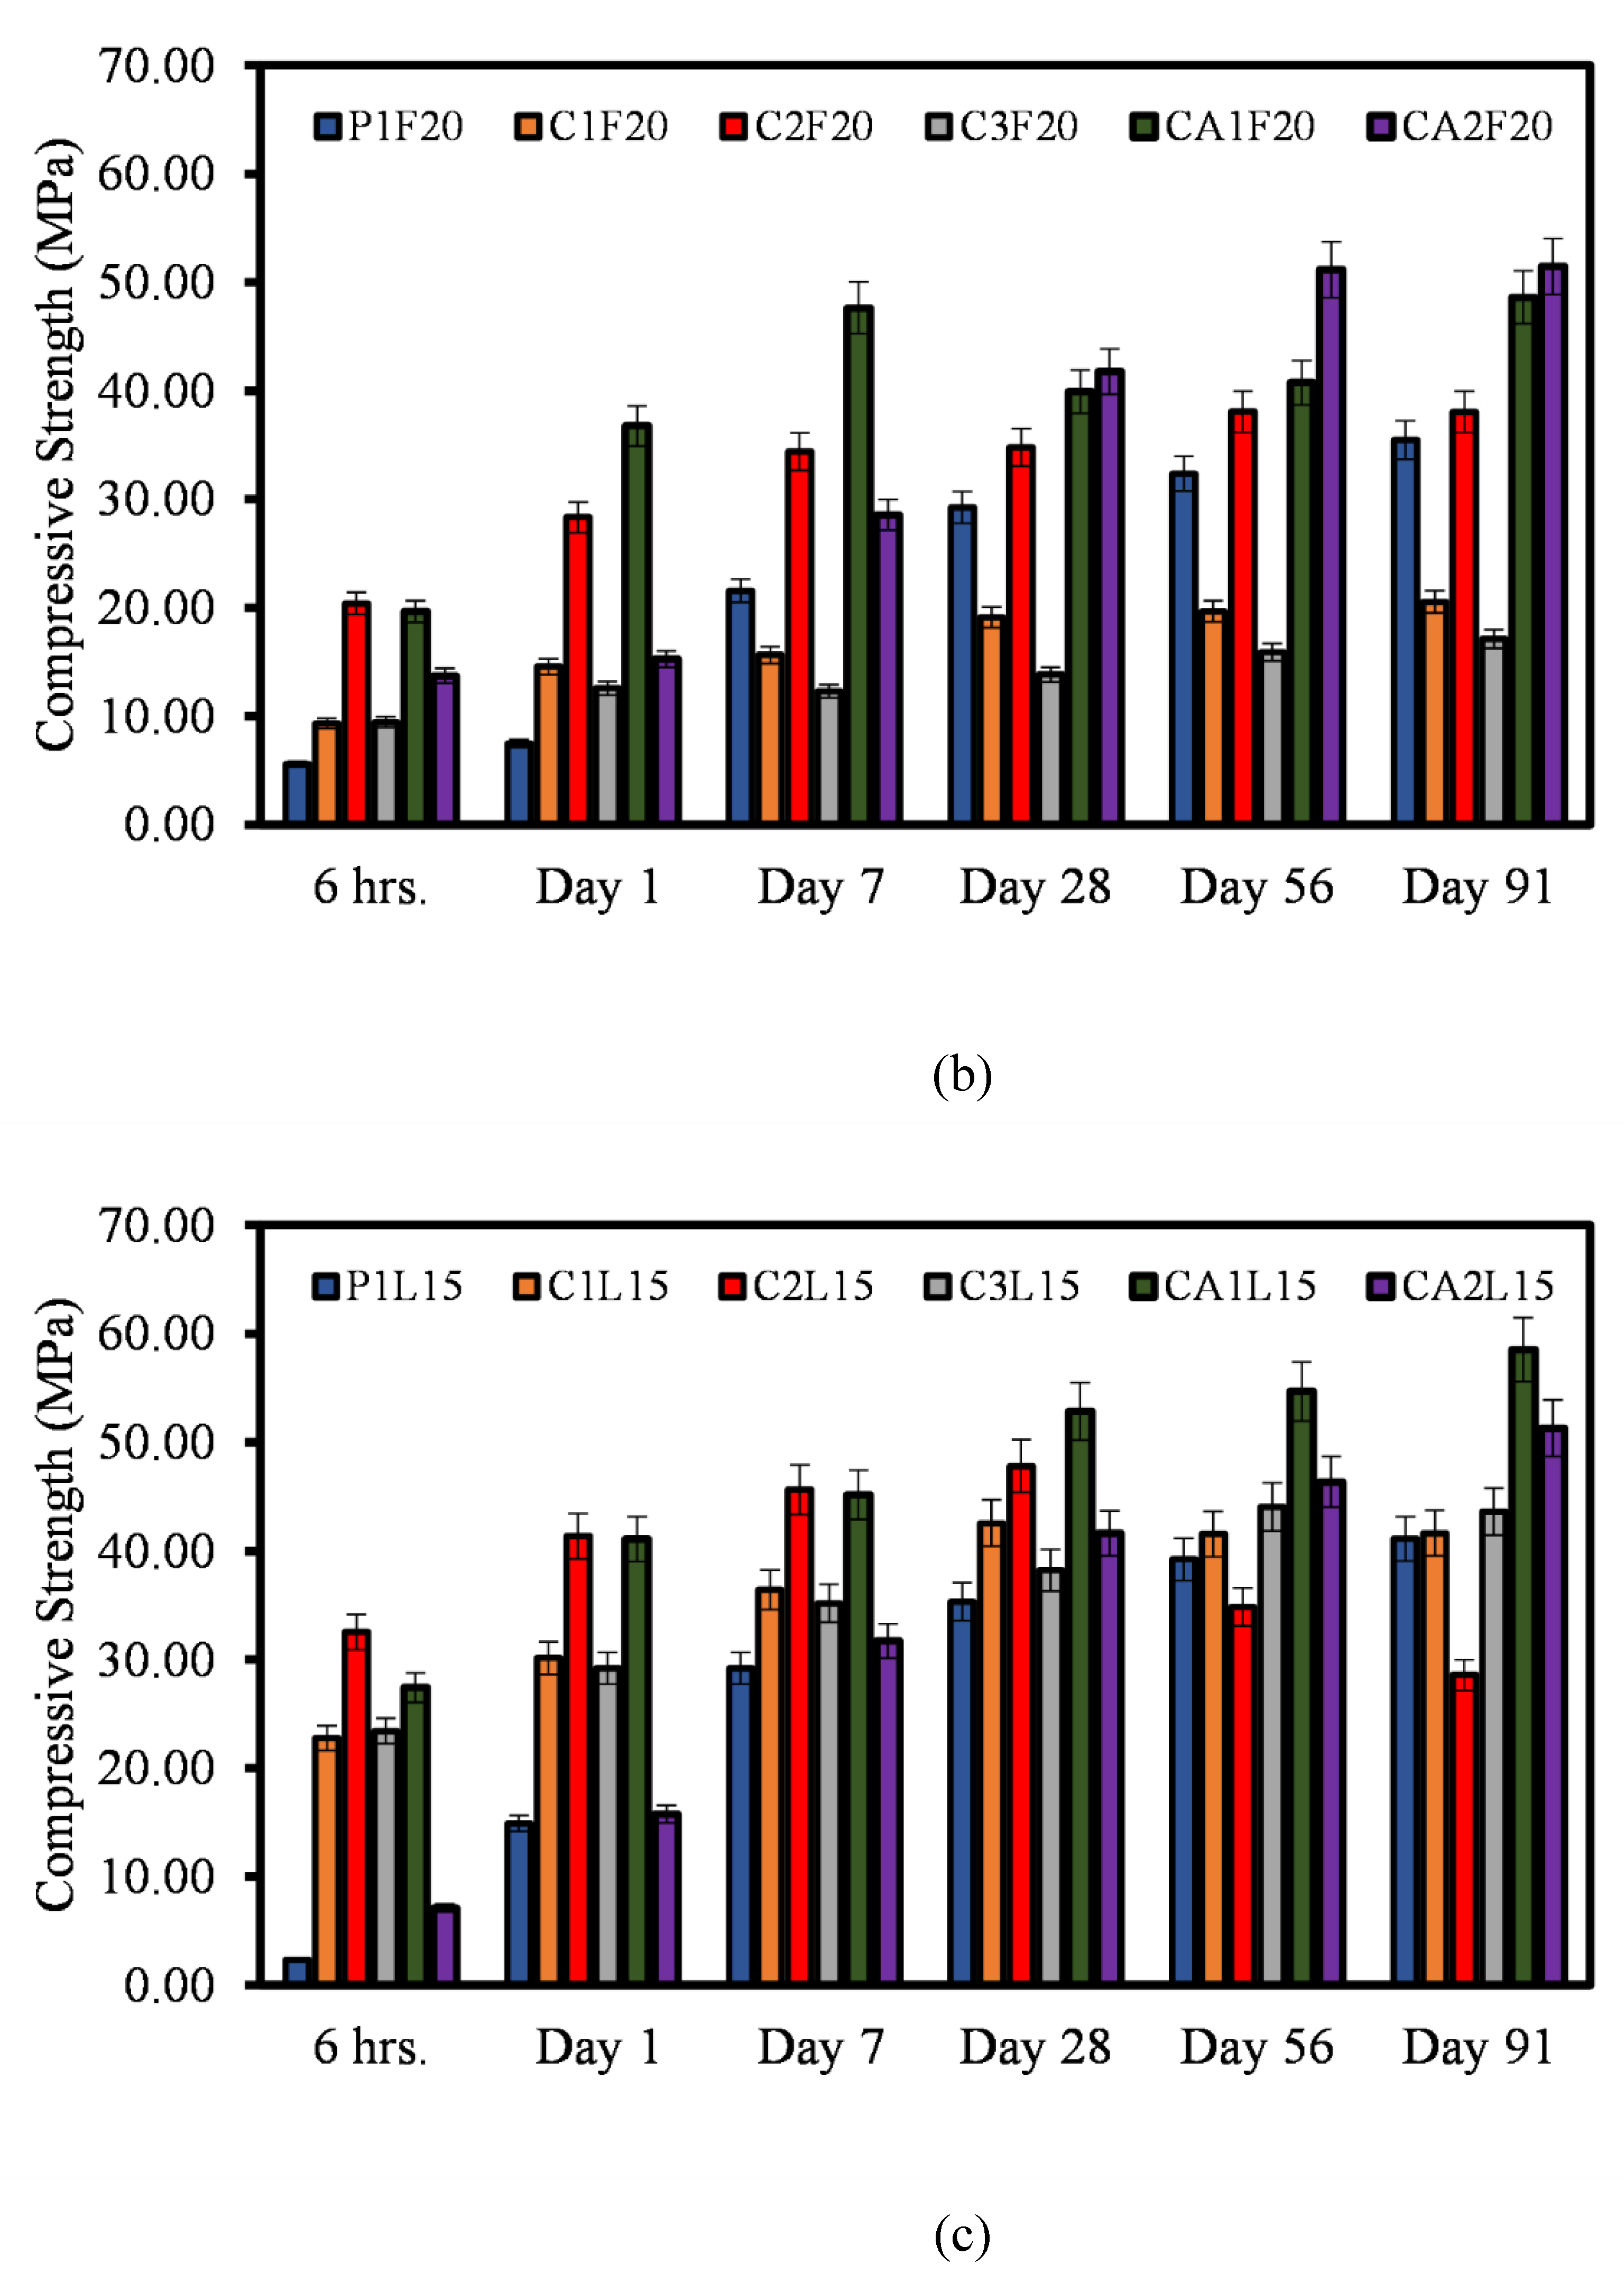
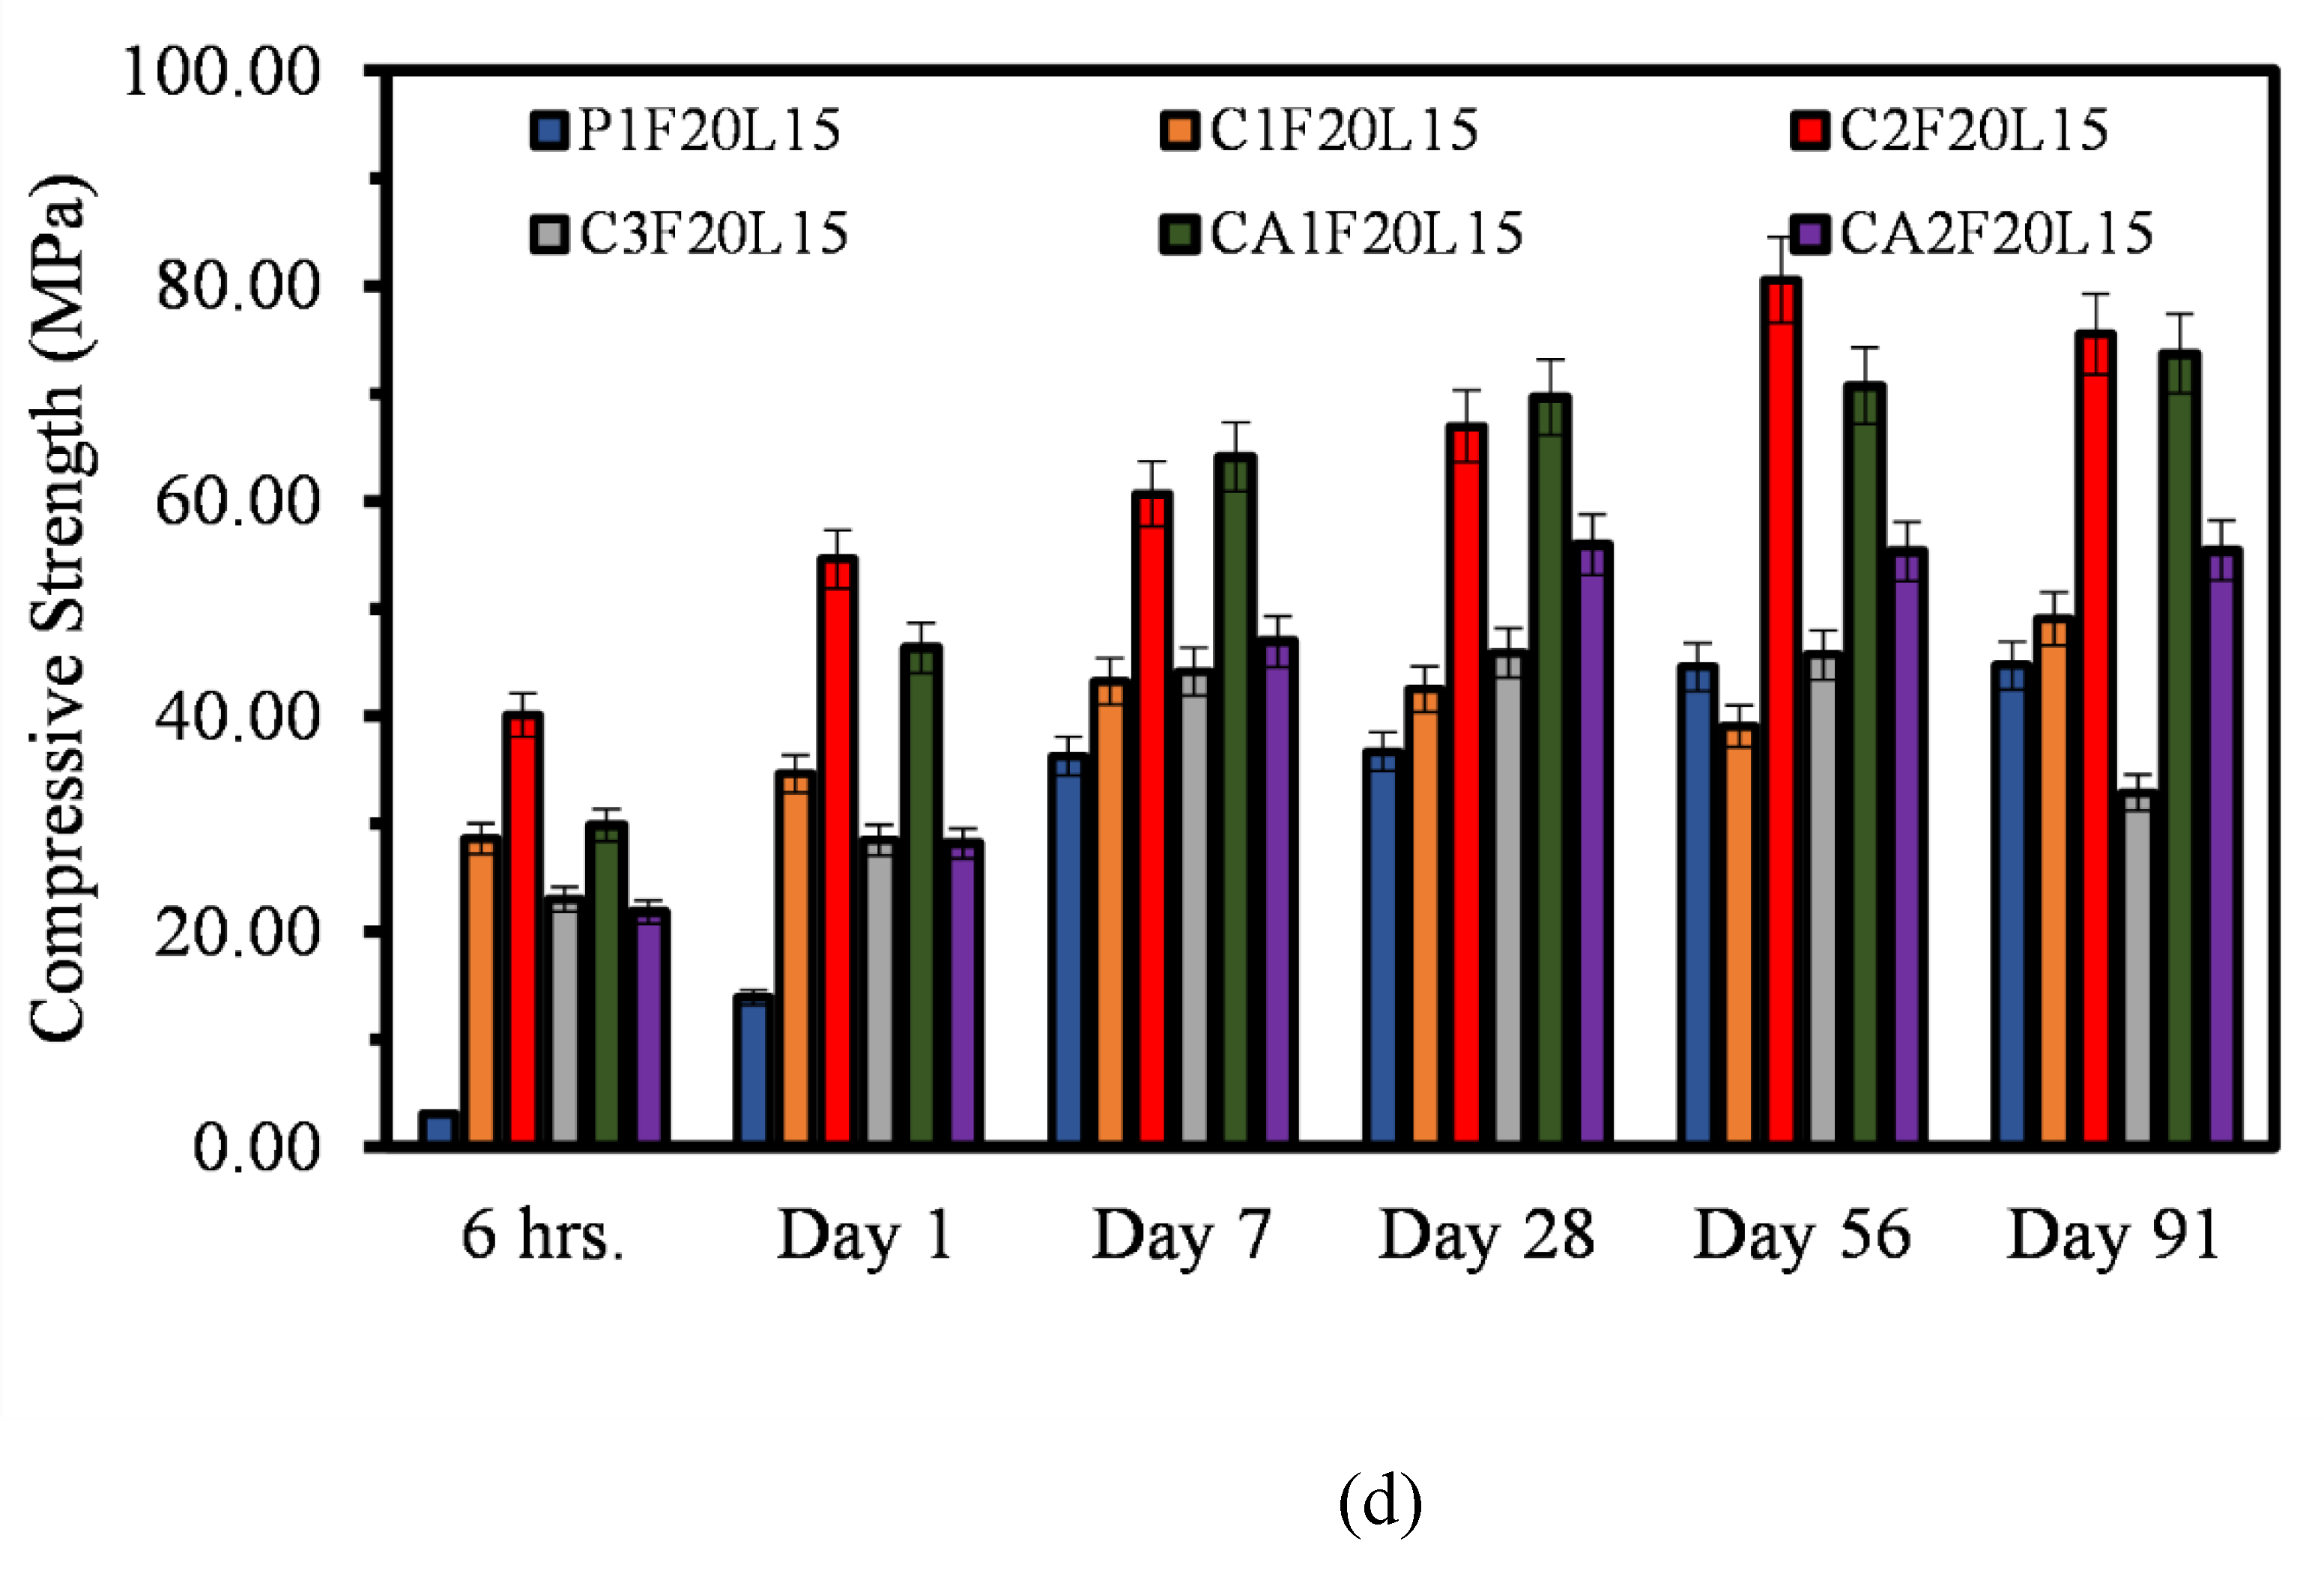
Figure 4 illustrates the 6 hrs., 1, 7-, 28-, 56-, and 91-days compressive strength of all the different mixtures.
The compressive strength for all mixtures ranges from 2.36 MPa to 80.55 MPa. It can be inferred from Figure 4a that at early age, P1 shows a low compressive strength up until the 7 days of age. However, the mortar mixtures with CSA and CAC showed a high early strength even at just 6 hrs., especially in the case of C2 and CA1. There is a gradual strength development in most of the mixtures in most cases. But there is a sharp reduction of about 23.09% from 7 days of age to 28 days of age for CA1. Moreover, the incorporation of FA certainly influenced the strength development of the samples. It can be seen in Figure 4b that there is a strength development with each age with P1F20 showing the least compressive strength at 6 hrs., and 1-day. Compared to the pure binders shown in Figure 4b, there is a reduction of about 2.6% to 15% of compressive strength with the inclusion of 20% FA. CA2F20 shows the most compressive strength at 51.46 MPa after 91 days of age. Similar to CA1, CA1F20 also decreases from 7 days of age to 28 days of age. Additionally, the effect of LP is evident as demonstrated in Figure 4c. There is a strength reduction at the early age of 6 hrs., however, evidence of strength development is clearly visible. There is a strength reduction of about 1.46 to 21.23% when comparing mixtures with LP to pure binder mixtures. CA1L15 shows the highest compressive strength of 58.53 MPa at 91 days of age while P1L15 has the lowest compressive strength of 2.36 MPa at only 6 hrs. of age. And lastly, the incorporation of combined FA and LP is illustrated in Figure 4d. P1F20L15 shows the lowest compressive strength at just 6 hrs. of age while C2F20L15 has the highest compressive strength of 75.52 MPa at 91 days of age. Generally, the incorporation of combined FA and LP shows a similar trend compared to mixtures incorporating either only FA or LP. In some instances, there is a strength reduction at later age (56 and 91 days) especially in the case of C3F20L15. The results presented are in accordance with other previous studies [31,43,44,45].
The findings presented in Figure 4 indicate that the incorporation of FA to CSA cement may not significantly enhance the early age mechanical strengths, as observed in Figure 4b. However, the same addition can promote the later-age compressive strength, as demonstrated in Figure 4b and 4c, which is consistent with previous research studies [10,26,30]. The incorporation of FA in the CSA cement system results in reduced cohesion between the particles and the hydration products of the cement at early stages, leading to slower strength development within the first days of hydration compared to the control paste. However, with extended curing time, the FA particles gradually react and bond with the CSA hydration phases, eventually leading to an increase in the compressive strength of the FA-dosed pastes. In some cases, the compressive strength of FA-incorporated mortar mixtures can even surpass or be equal to that of the control cementitious mortar.
Moreover, the incorporation of FA into the CAC system has been found to produce higher compressive strengths at later stages compared to the control, as shown in Figure 4. Previous research [3,11,46] explored a similar trend and identified pozzolanic reactivity as a crucial determinant of the compressive strength and durability of the FA-cement system. It has been observed that pozzolanic materials with higher silica content react more readily with Ca (OH)2, leading to higher levels of C-(A)-S-H production. The physical and chemical characteristics of FA affect the compressive strength development of the FA-cement system. The chemical effect is primarily driven by the pozzolanic reaction between the amorphous silica in FA and Ca (OH)2, which occurs during the cement hydration reaction and leads to the production of C-S-H gel. The physical effect, known as the "filler effect," is caused by the ability of FA particles to enhance the packing of solid materials by occupying the voids between cement grains, similar to how cement particles occupy gaps between fine aggregate particles.
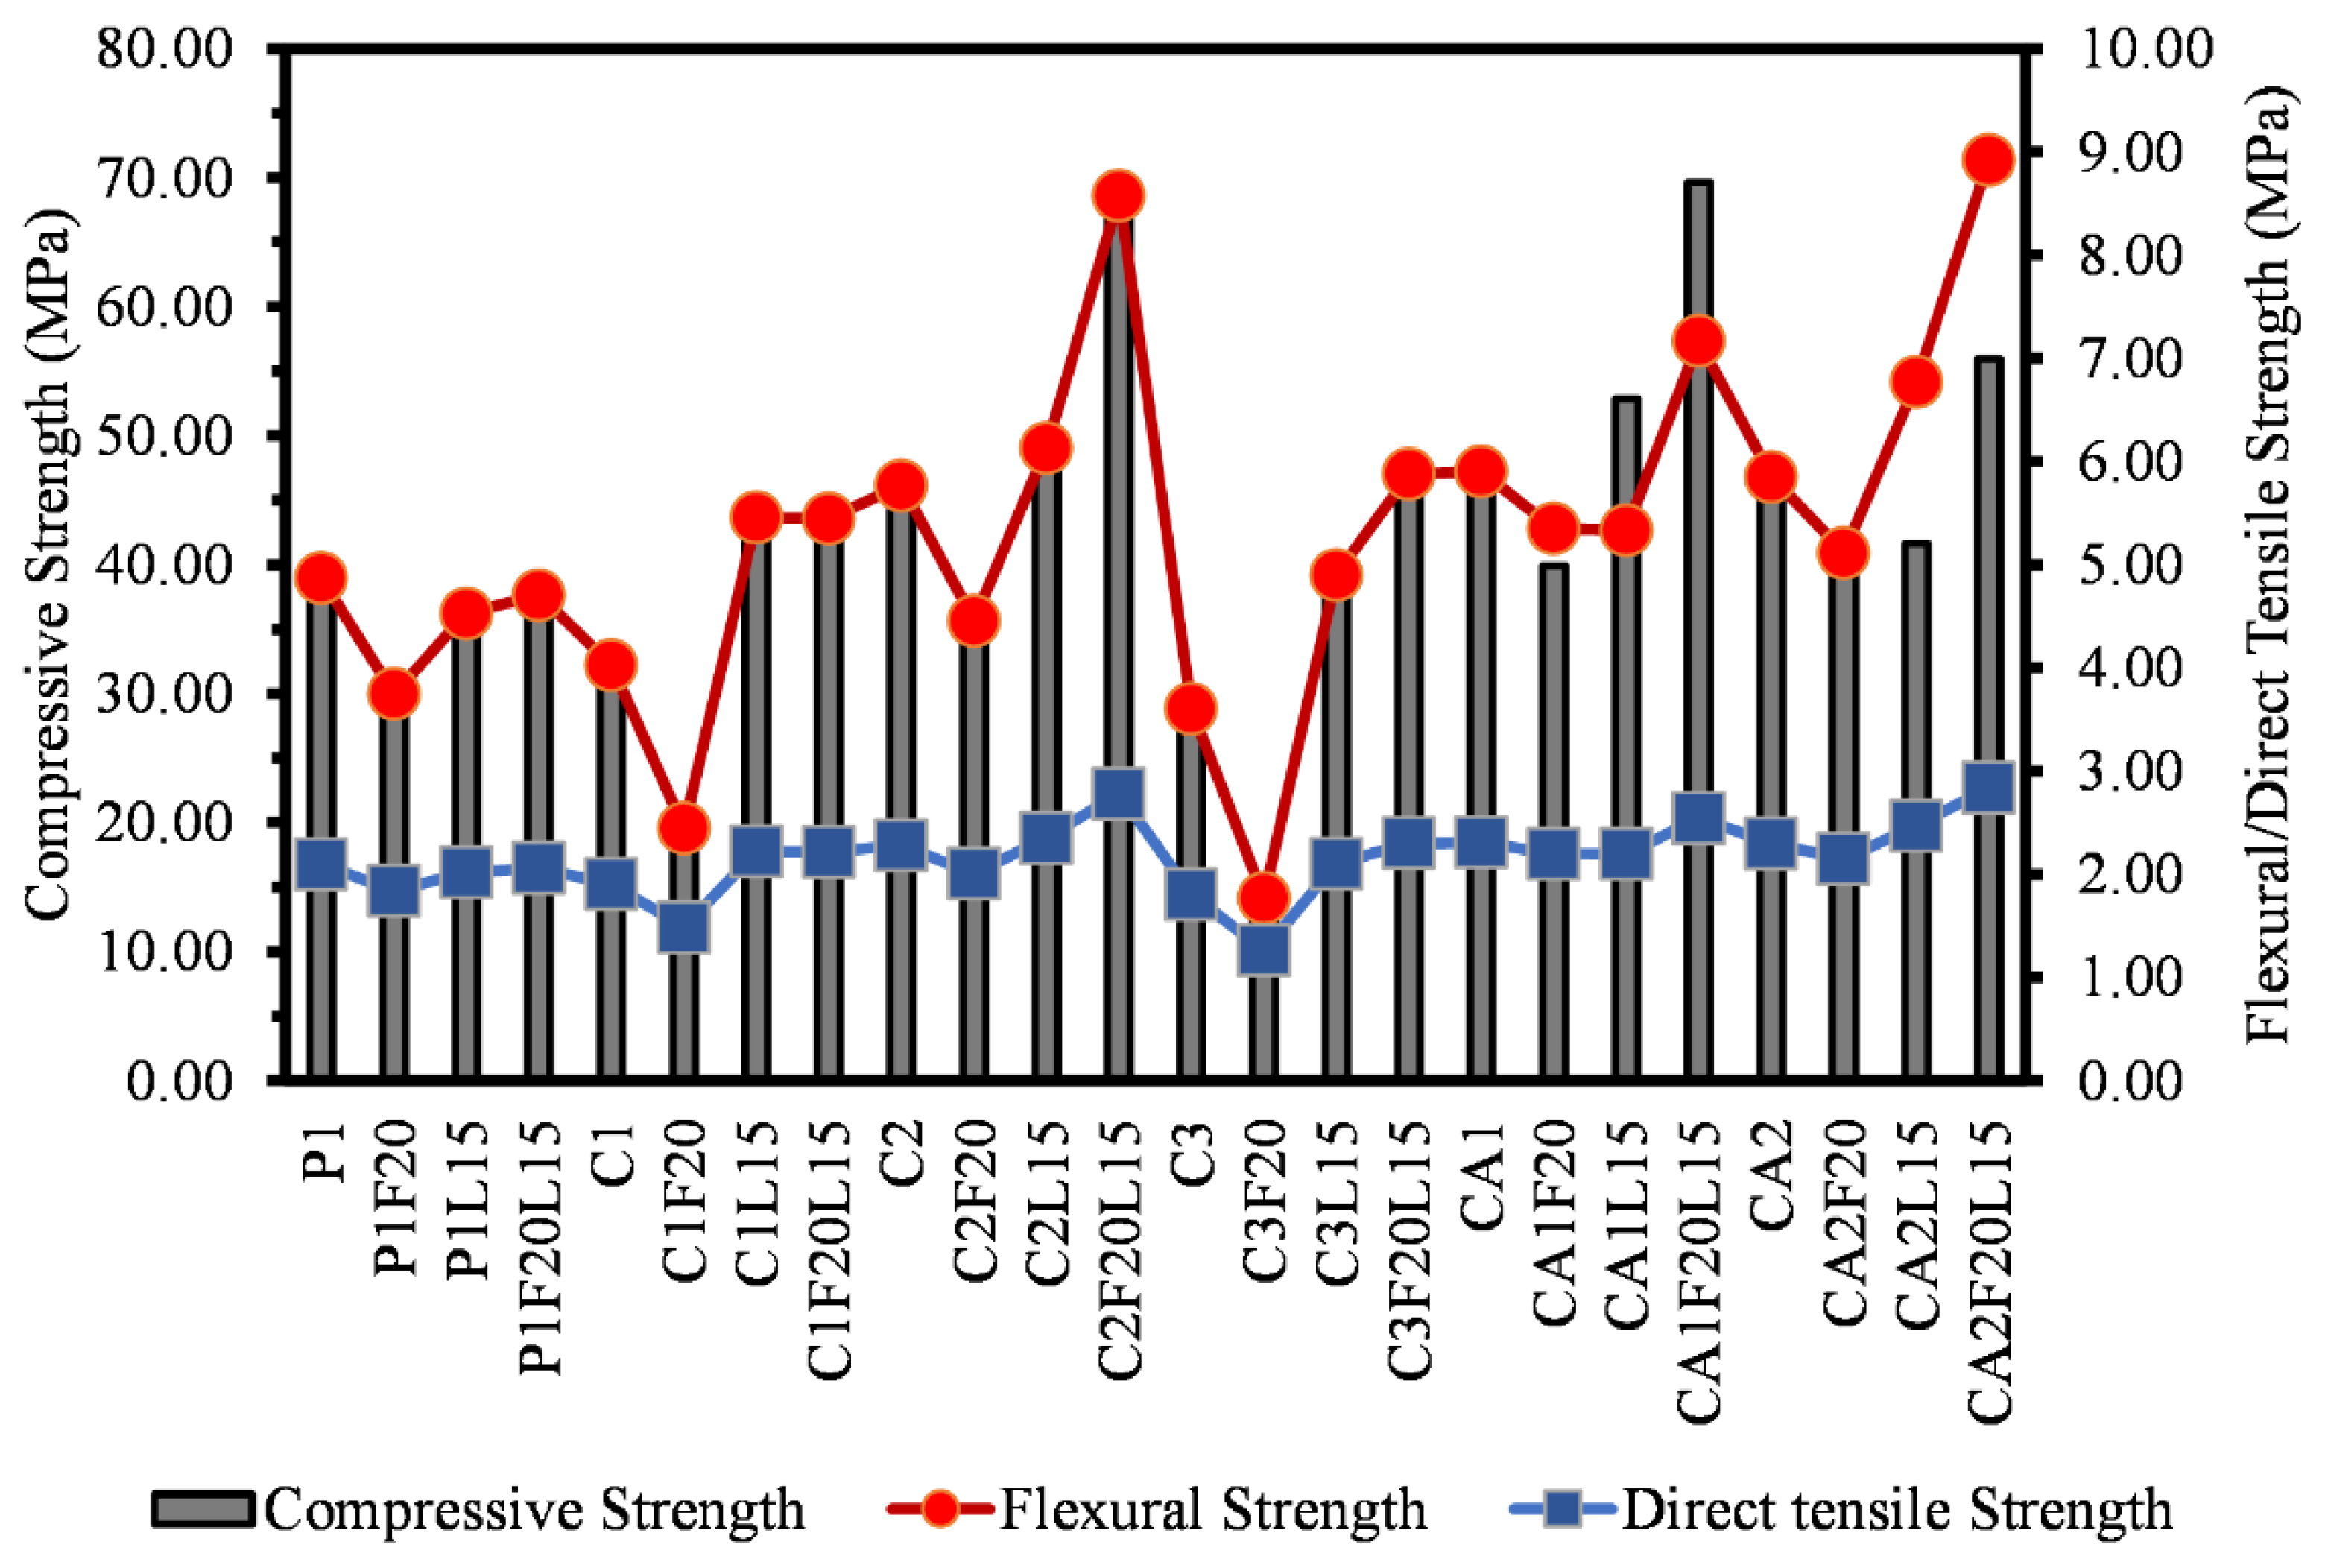
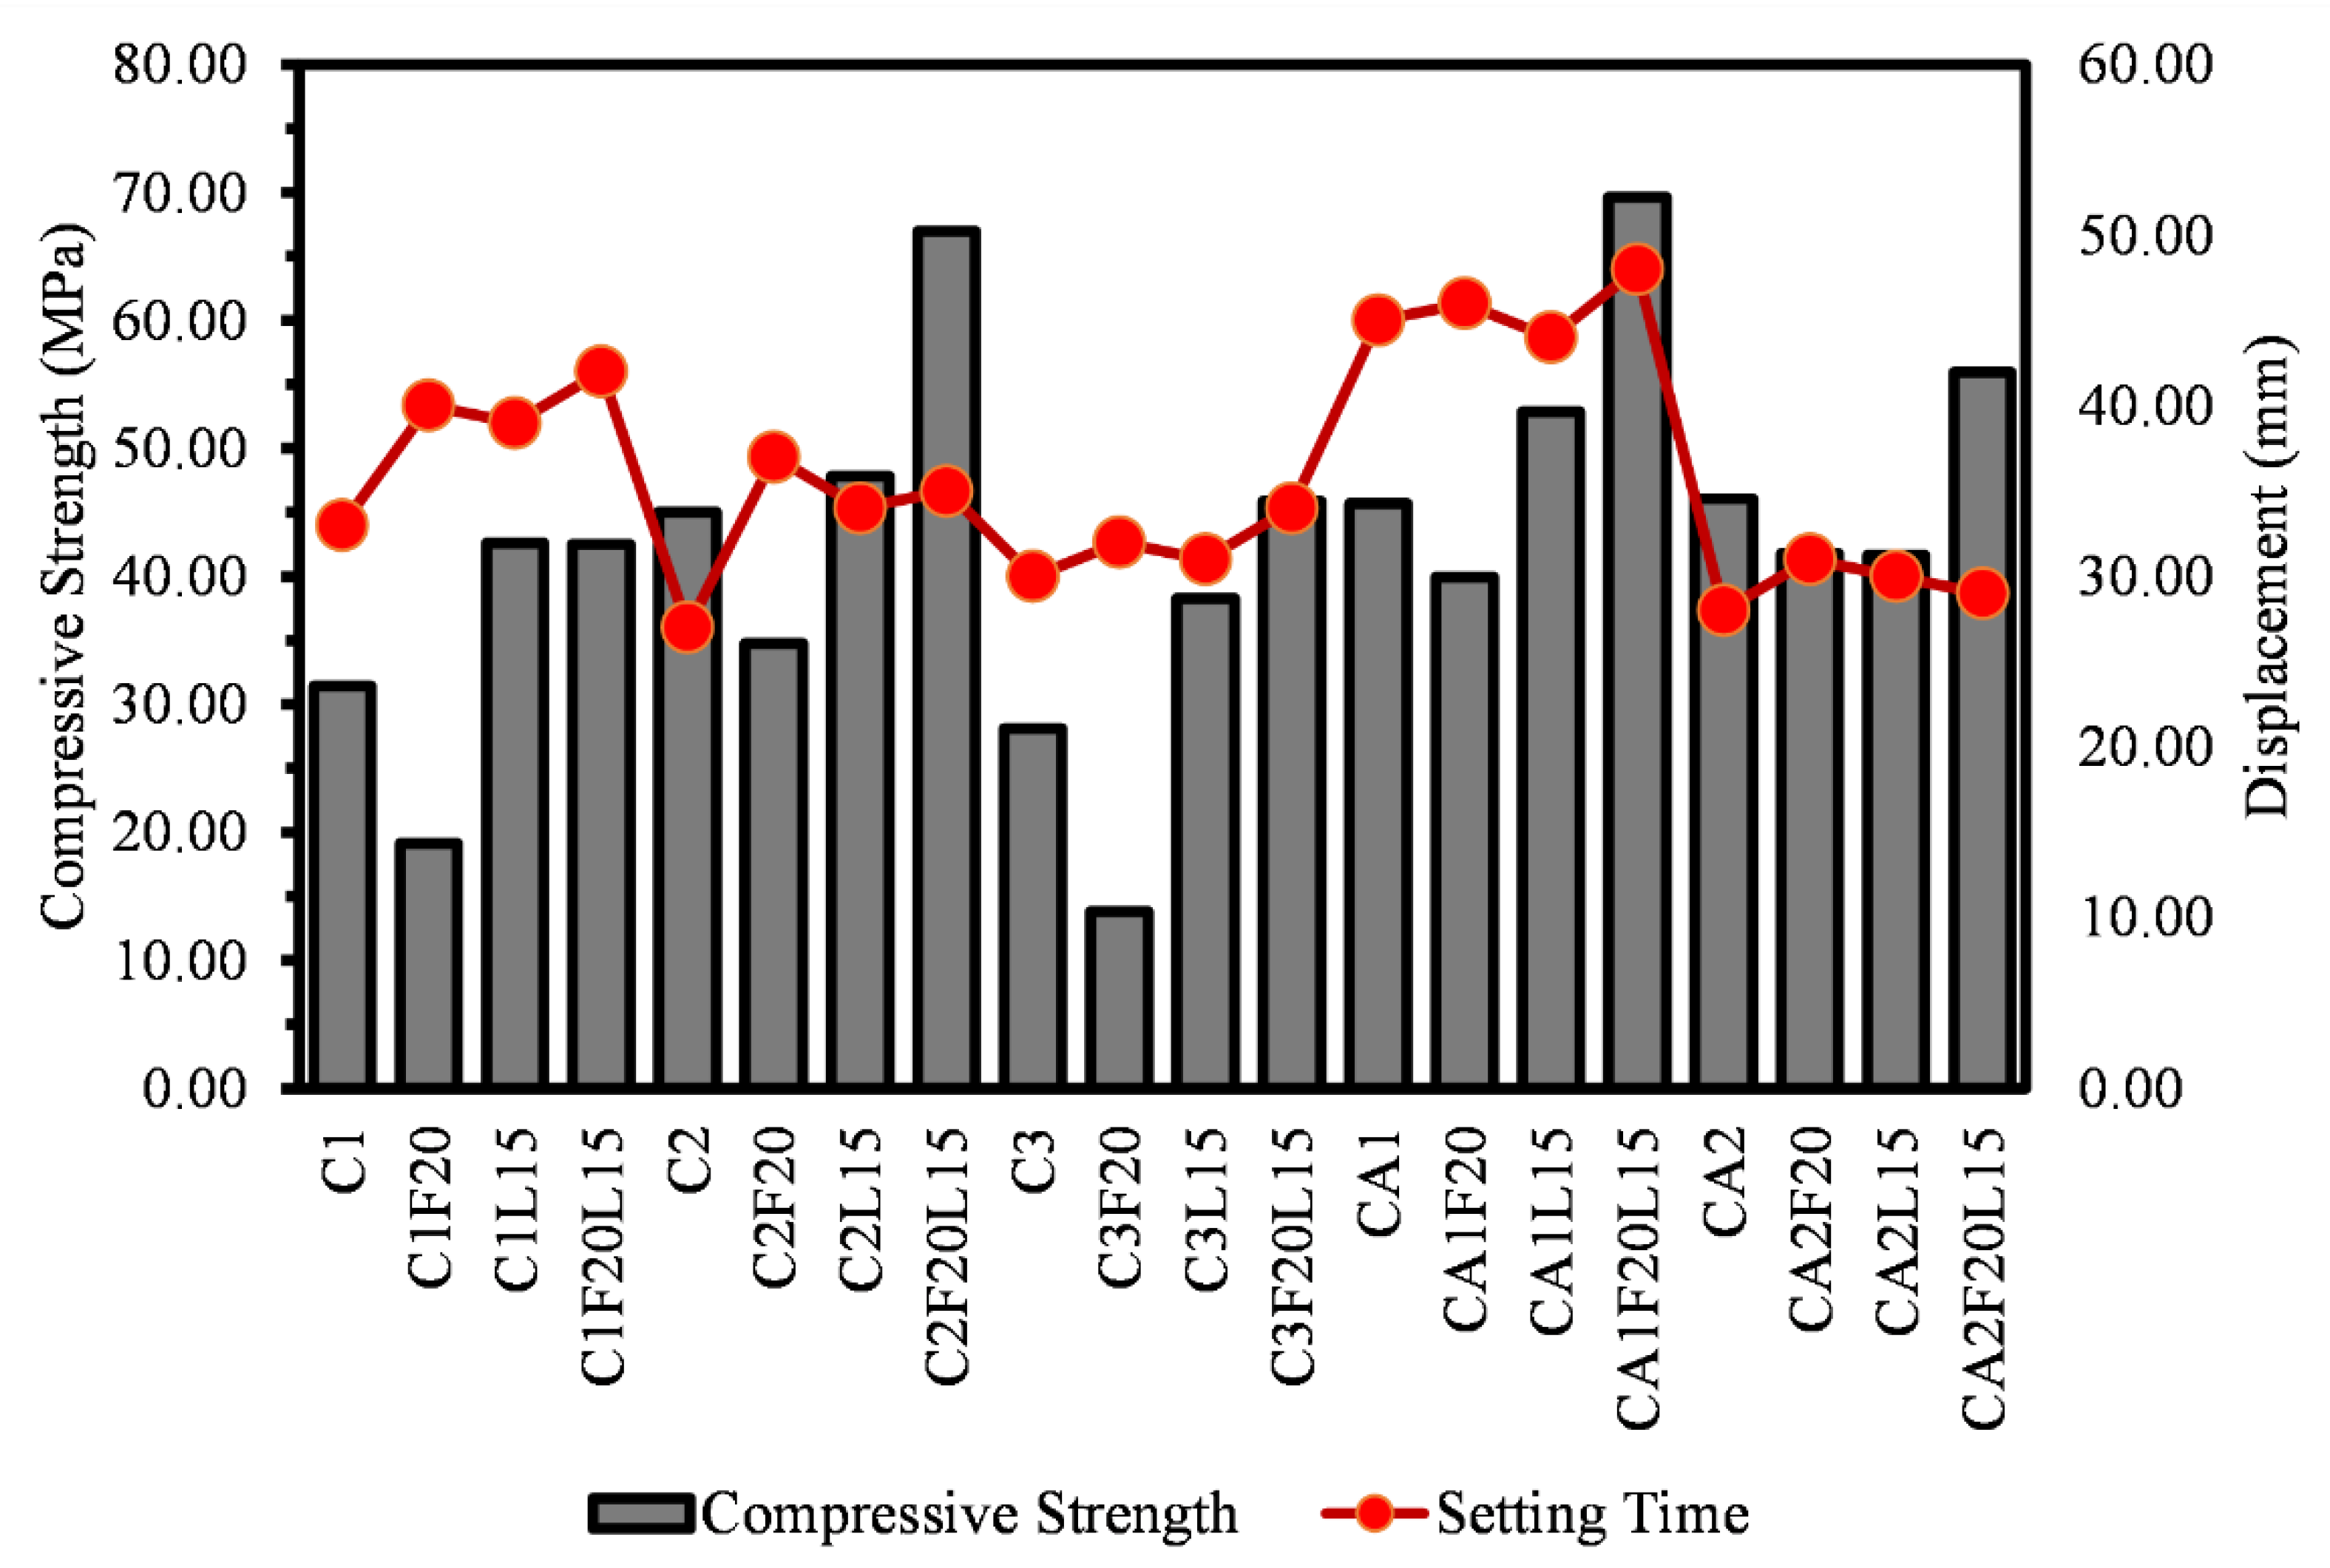
Furthermore, the addition of LP to CAC systems has been found to increase their compressive strength especially in later ages, as evidenced from Figure 4. In 1948, Daniel [47] observed that the inclusion of LP in cement enhances its compressive strength. Later, Soroka and Setter [48] confirmed the filler effect of LP and its accelerating effect on the hydration of CAC mortar due to its nucleation effect. This could explain why cement binders that incorporate LP perform better at early stages as compared to those incorporating fly ash as shown in Figure 4c. Figure 8 illustrates the relationship between compressive strength, direct tensile strength, and flexural strength of the mixtures at 28 days of age while Figure 9 demonstrates the relativeness of compressive strength and the setting time (displacement, mm) of the mixtures.

3.3. Flexural Strength

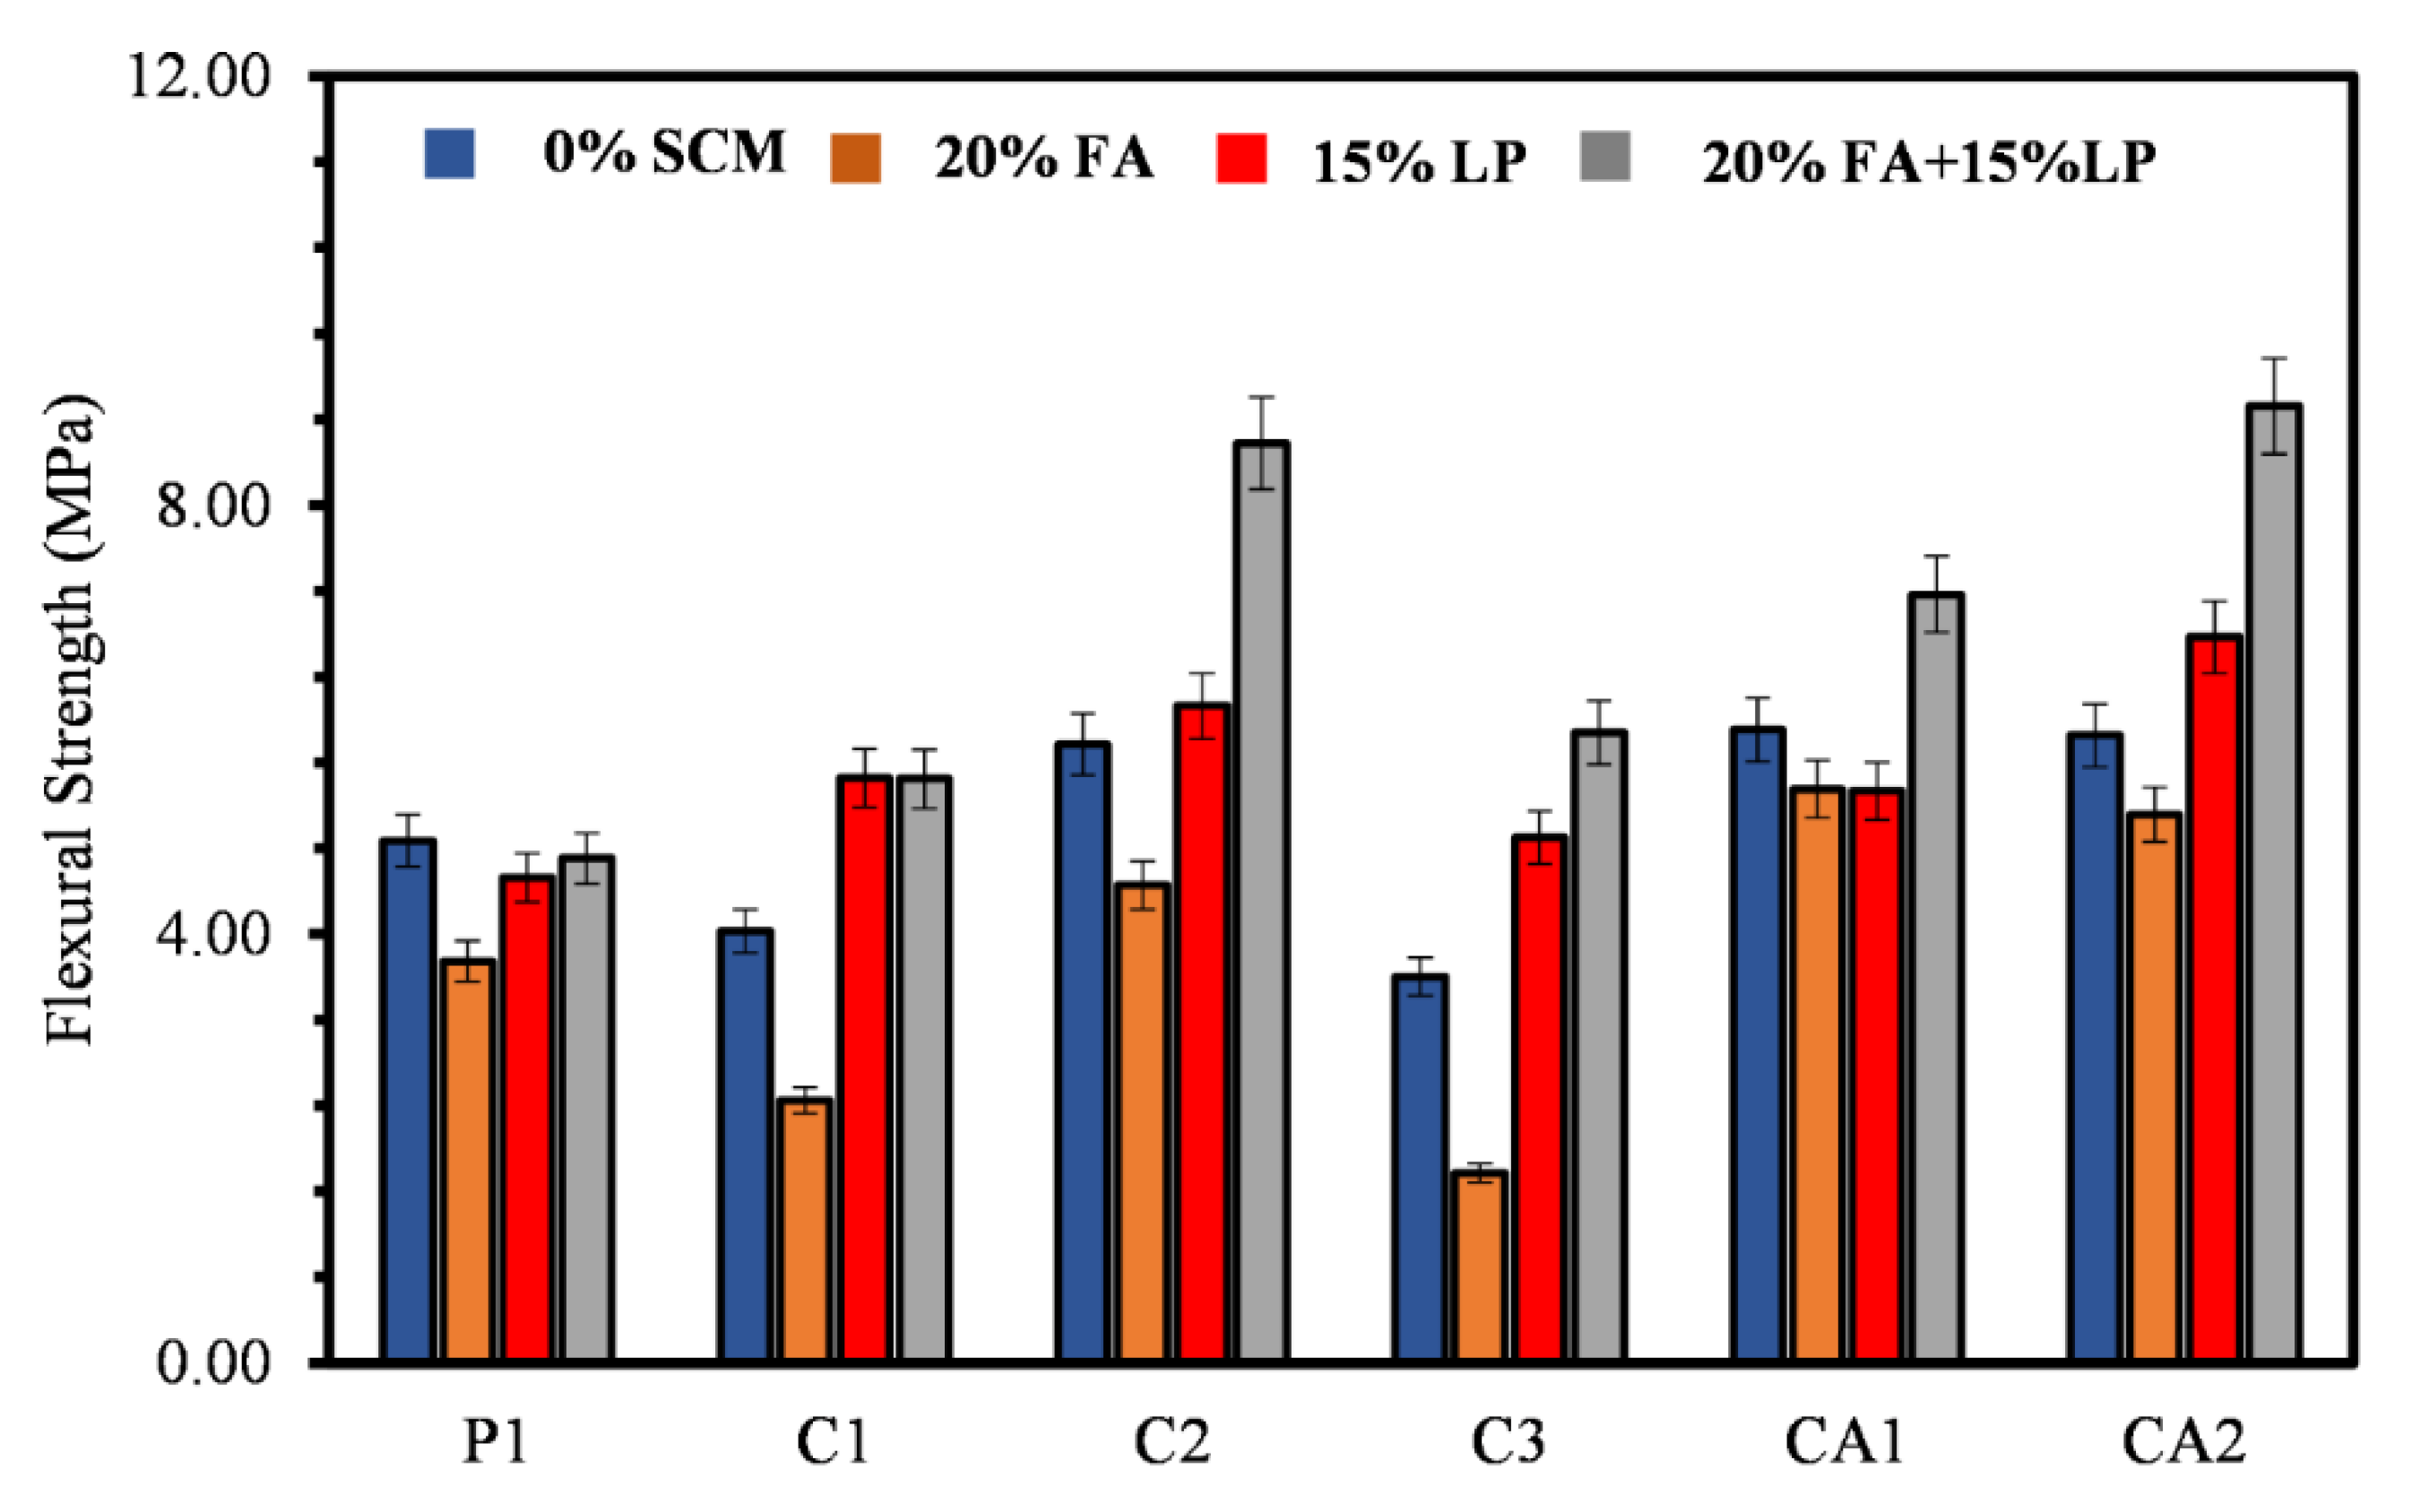
Figure 5 shows the flexural strength of the mixtures at 28 days of age. P1 with 0% SCM has a flexural strength of 4.87 MPa.
Compared to other corresponding binders with 0%, that is a 20.8% and 35.3% reduction in flexural strength relative to C1 and C3 respectively, while there is an increase of 15.60%, 20.23%, and 16.75% relative to C2, CA1, and C2 respectively. With the incorporation of 20% FA, it can be inferred from Figure 5 that there is a visible flexural strength reduction compared to binders with 0% SCM. For instance, for P1, C1, C2, C3, CA1, and CA2, there is a strength reduction of 29.99%, 64.44%, 29.50%, 103.39%, 10.31%, and 14.45% compared to their corresponding binders with 20% FA (P1F20, C1F20, C2F20, C3F20, CA1F20, and CA2F20). However, at 28 days of curing, the flexural strength for C1, C2, C3, and CA2 incorporating 15% LP increased relative to their corresponding binders with 0% SCM and 20% FA. The flexural strength for all mixtures containing a combined 20%FA+15%LP (35% SCM) showed the highest strengths compared to 0% SCM, 20%FA, and 15%LP except mixtures made with P1. The maximum flexural strength of 8.92 MPa is seen in CA2F20L15. Similar to the trends observed in the compressive strength, the influence of both FA and LP is evidenced in the flexural strength of the mixtures, as reported in previous studies [43,44,48].
This study supports previous research by Xu et al. [34], who discovered that the combination of super-fine LP and low-quality FA can enhance the strength of cement mortar when mixed at a specific ratio [34]. This aligns with the increase in flexural strength observed when LP and FA are combined. Monzó et al. also found that using finer fractions of FA improves mechanical properties, including compressive and flexural strength, which corresponds with the increase in strength observed when FA is included at later ages [48]. However, Ali et al. noted that the compressive and flexural strength of cement mortars decreases with increasing fly ash content beyond 40% [49]. This supports the observation that excessive amounts of FA can be detrimental to flexural strength.

3.4. Direct Tensile Strength

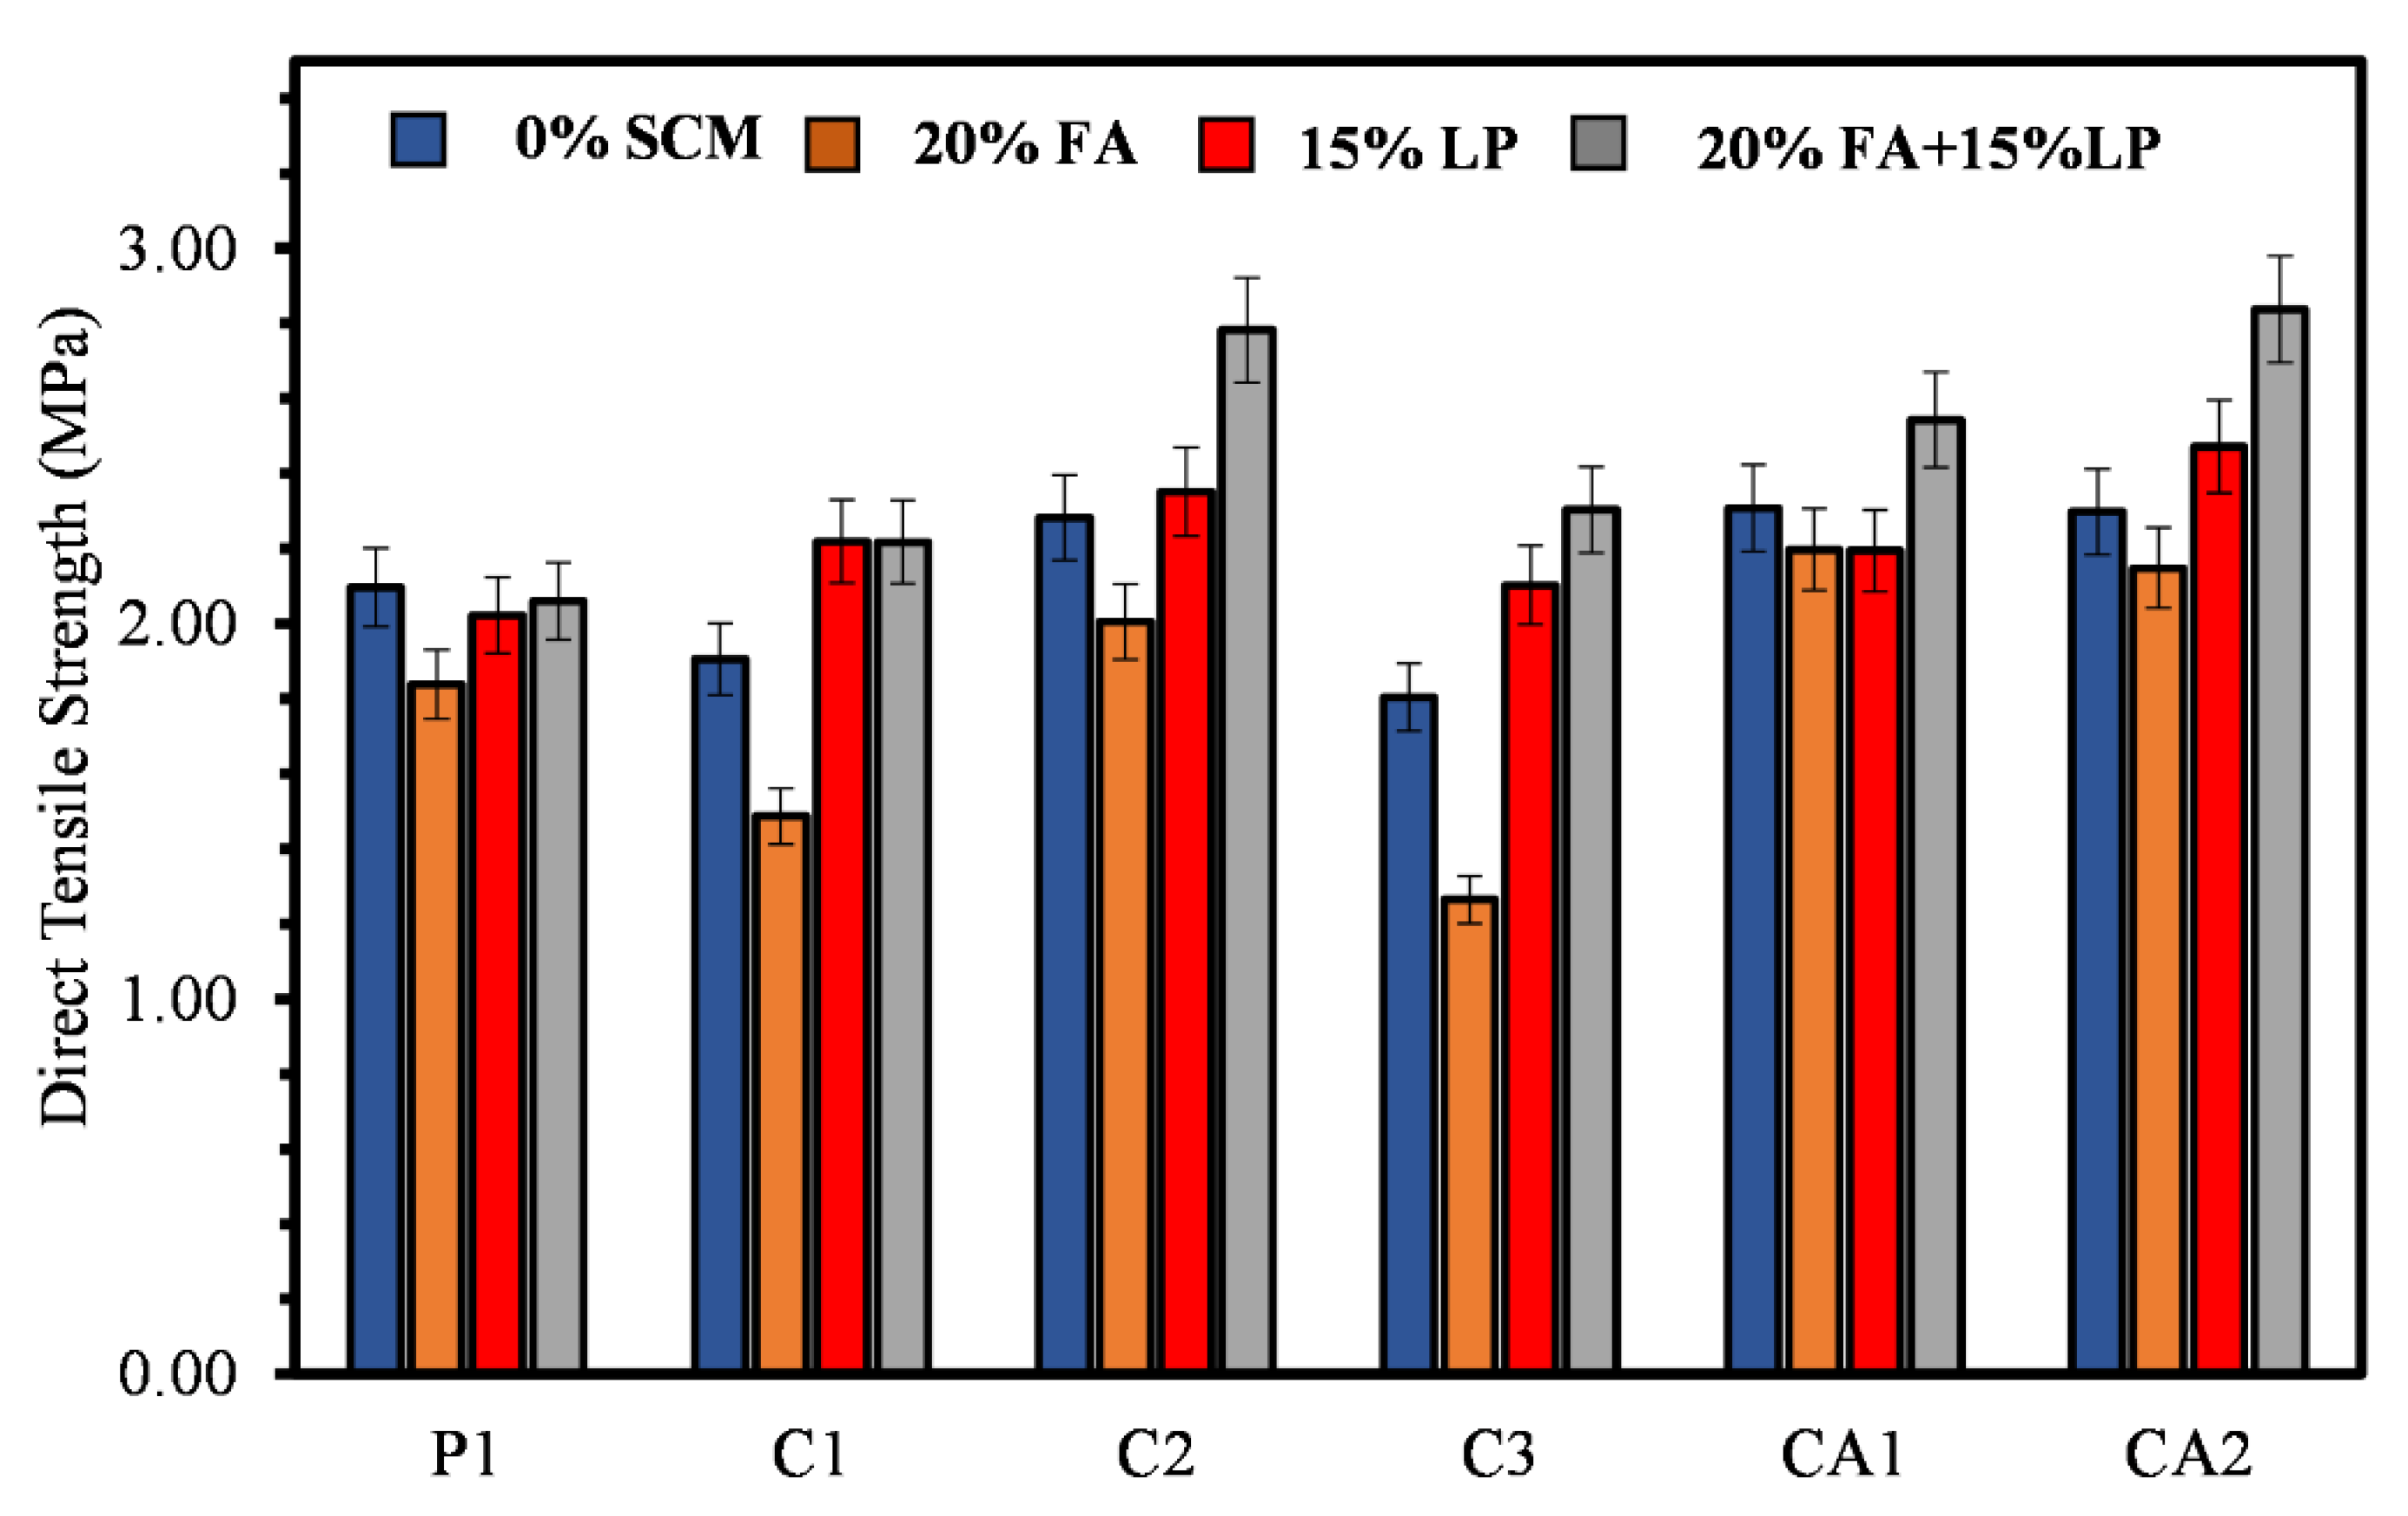
The utilization of tensile strength testing is highly recommended for quantifying any alterations in the microstructural characteristics of the materials in question. Tensile testing methodically detects the weakest point in such materials, allowing for a thorough assessment of their resistance to stress and deformation [50]. Figure 6 demonstrates the 28 days of age direct-tensile strength for all the mortar mixtures.
Similar to trends observed in the compressive strength and the flexural strength results, the incorporation of FA and LP separately and combined had an influence on the direct tensile strength of the mortar mixtures. The direct tensile strengths at 28 days of age range from 1.26 MPa to 2.84 MPa. With 0% SCM, CA2 shows the highest direct tensile strength with 2.29 MPa while C3 has the lowest with 1.80 MPa. Moreover, with the addition of 20% FA, there is a 6.50% reduction in direct tensile strength of CA2. However, C1 and C3 show a notable reduction in direct tensile strength by 28.19% and 42.85% with incorporation of FA. Similarly, the influence of LP on the various binders is illustrated in Figure 6. Unlike the effect of FA, LP could be seen to increase some of the binders such as C1, C2, C3, and CA2. The direct tensile strength for C1, C2, C3, and CA2 with 15% LP increased by 14.41%, 2.98%, 14.29%, and 7.66%, respectively compared to the binders with no SCM. Additionally, it can be inferred from Figure 6, the combined effect of FA and LP on the various binders. The results presented in Figure 6 adhere to previous studies [37,51,52].
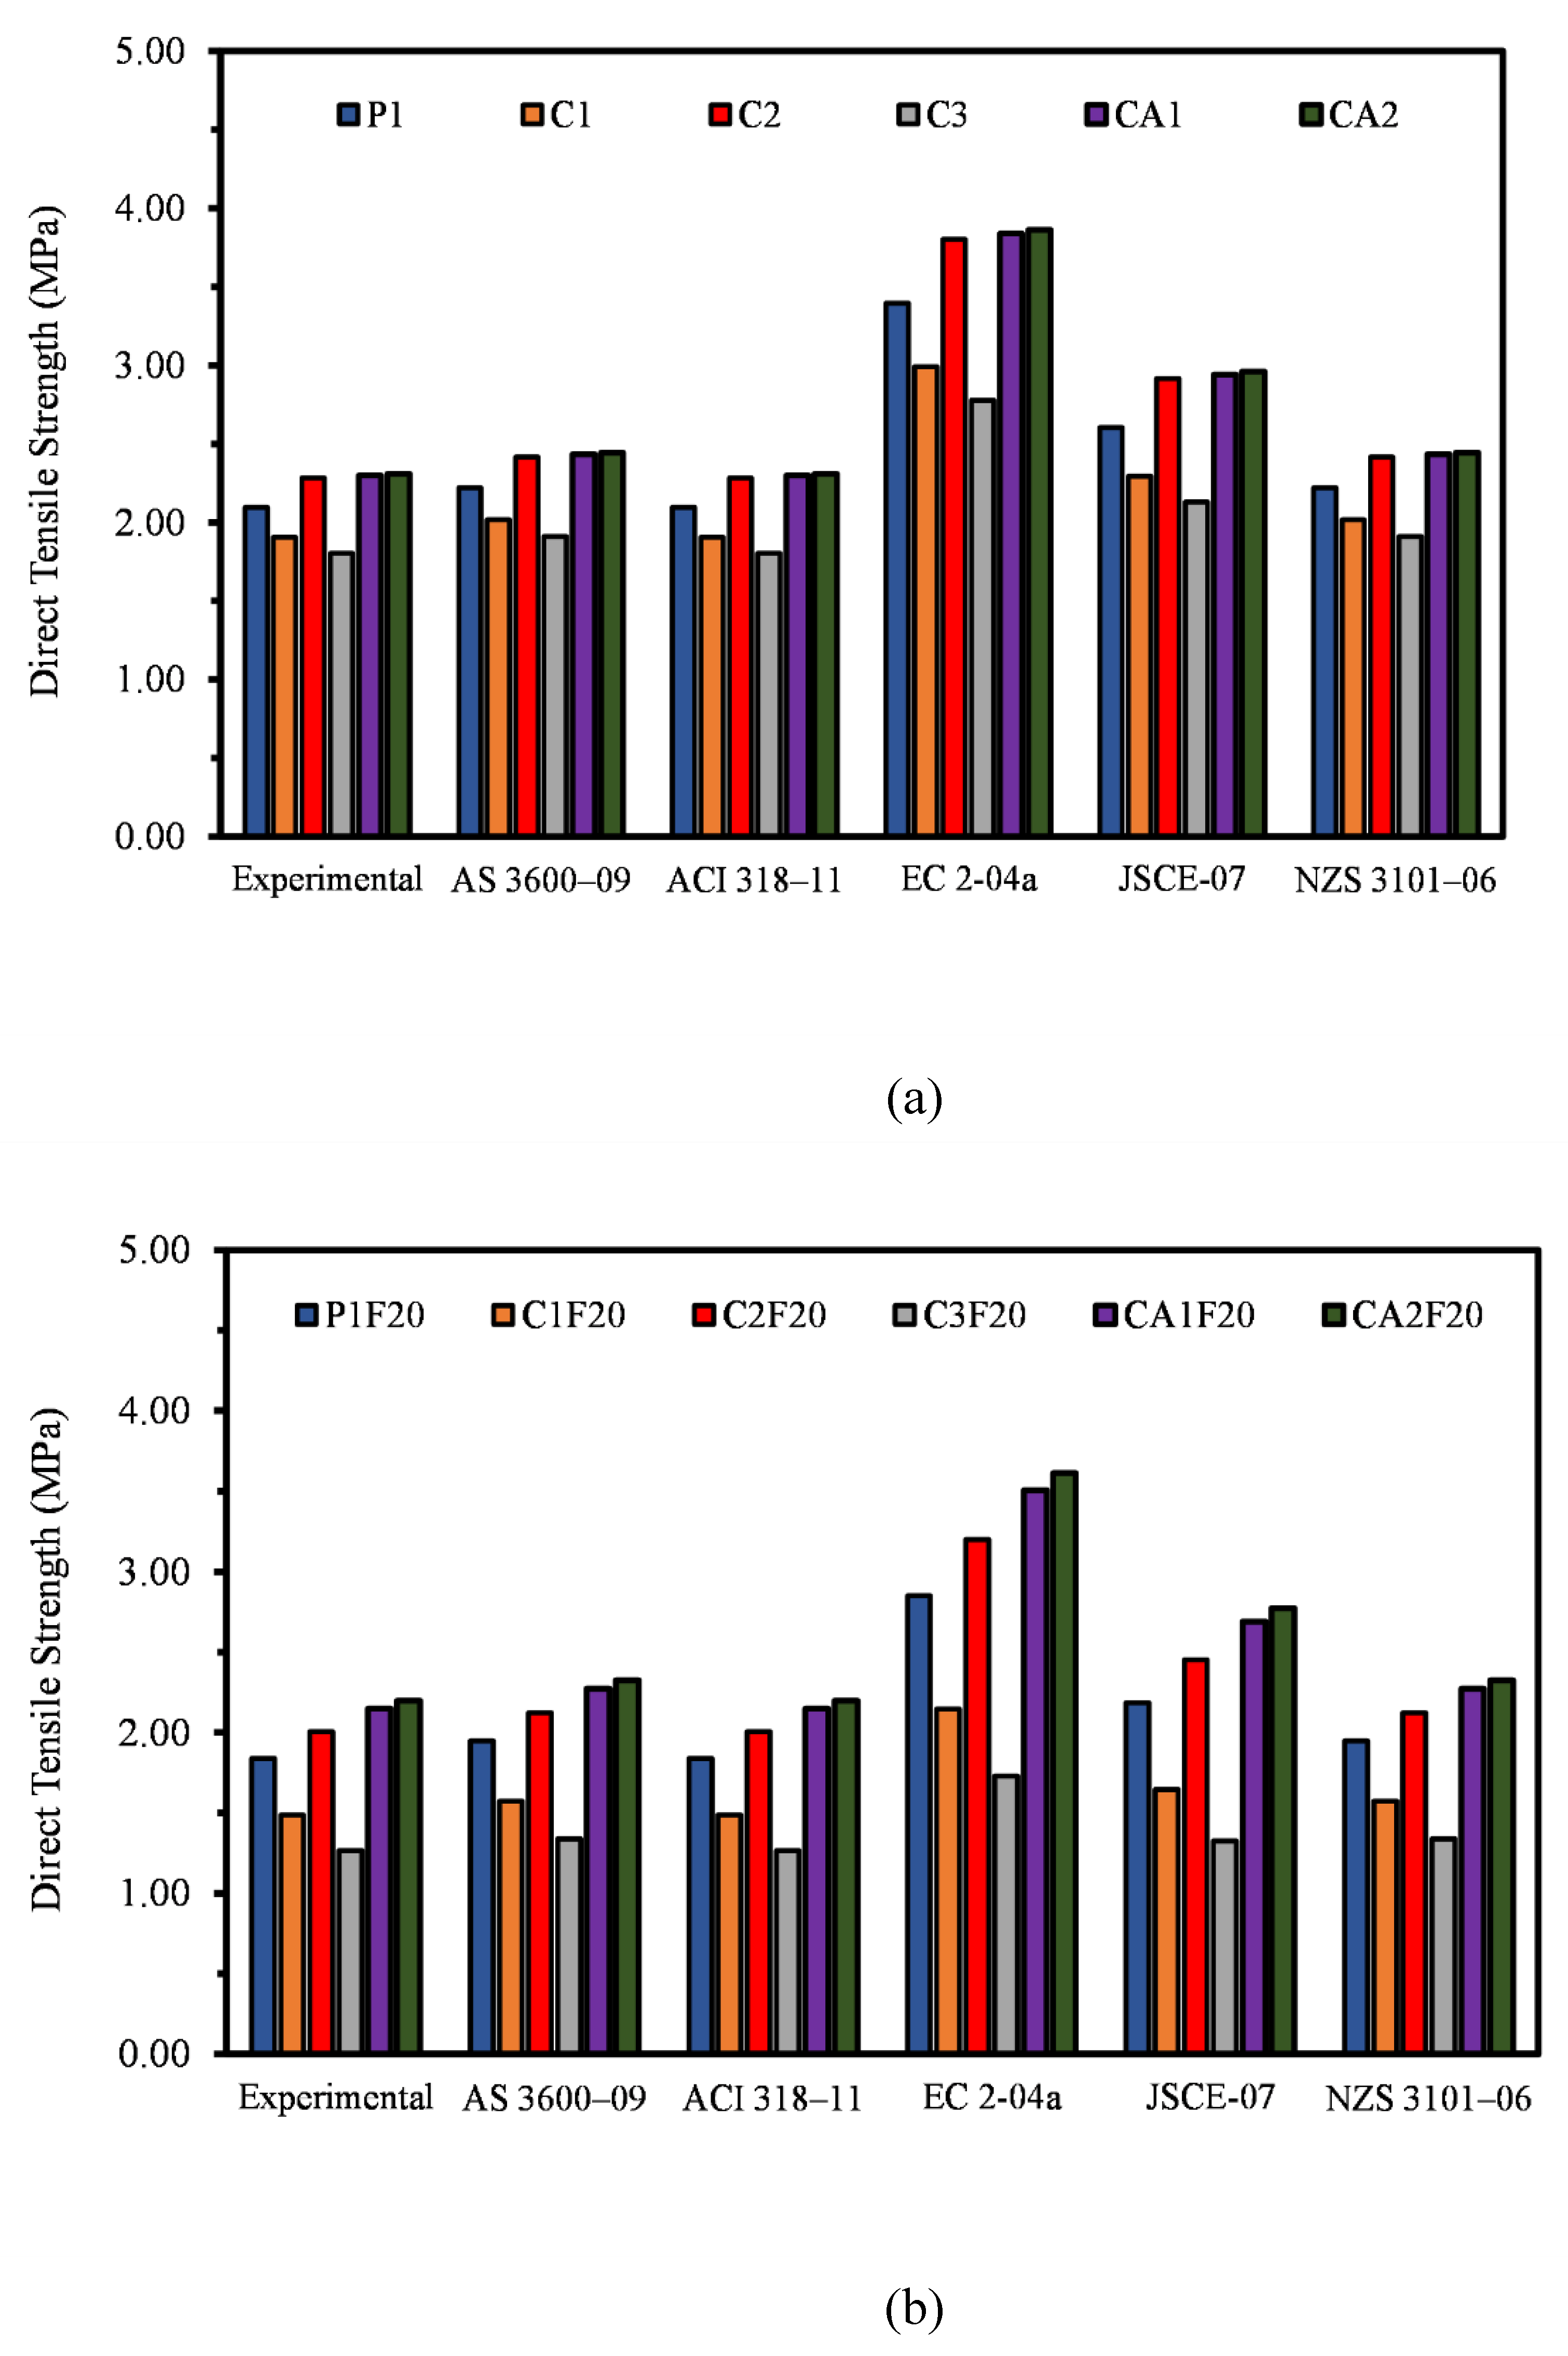
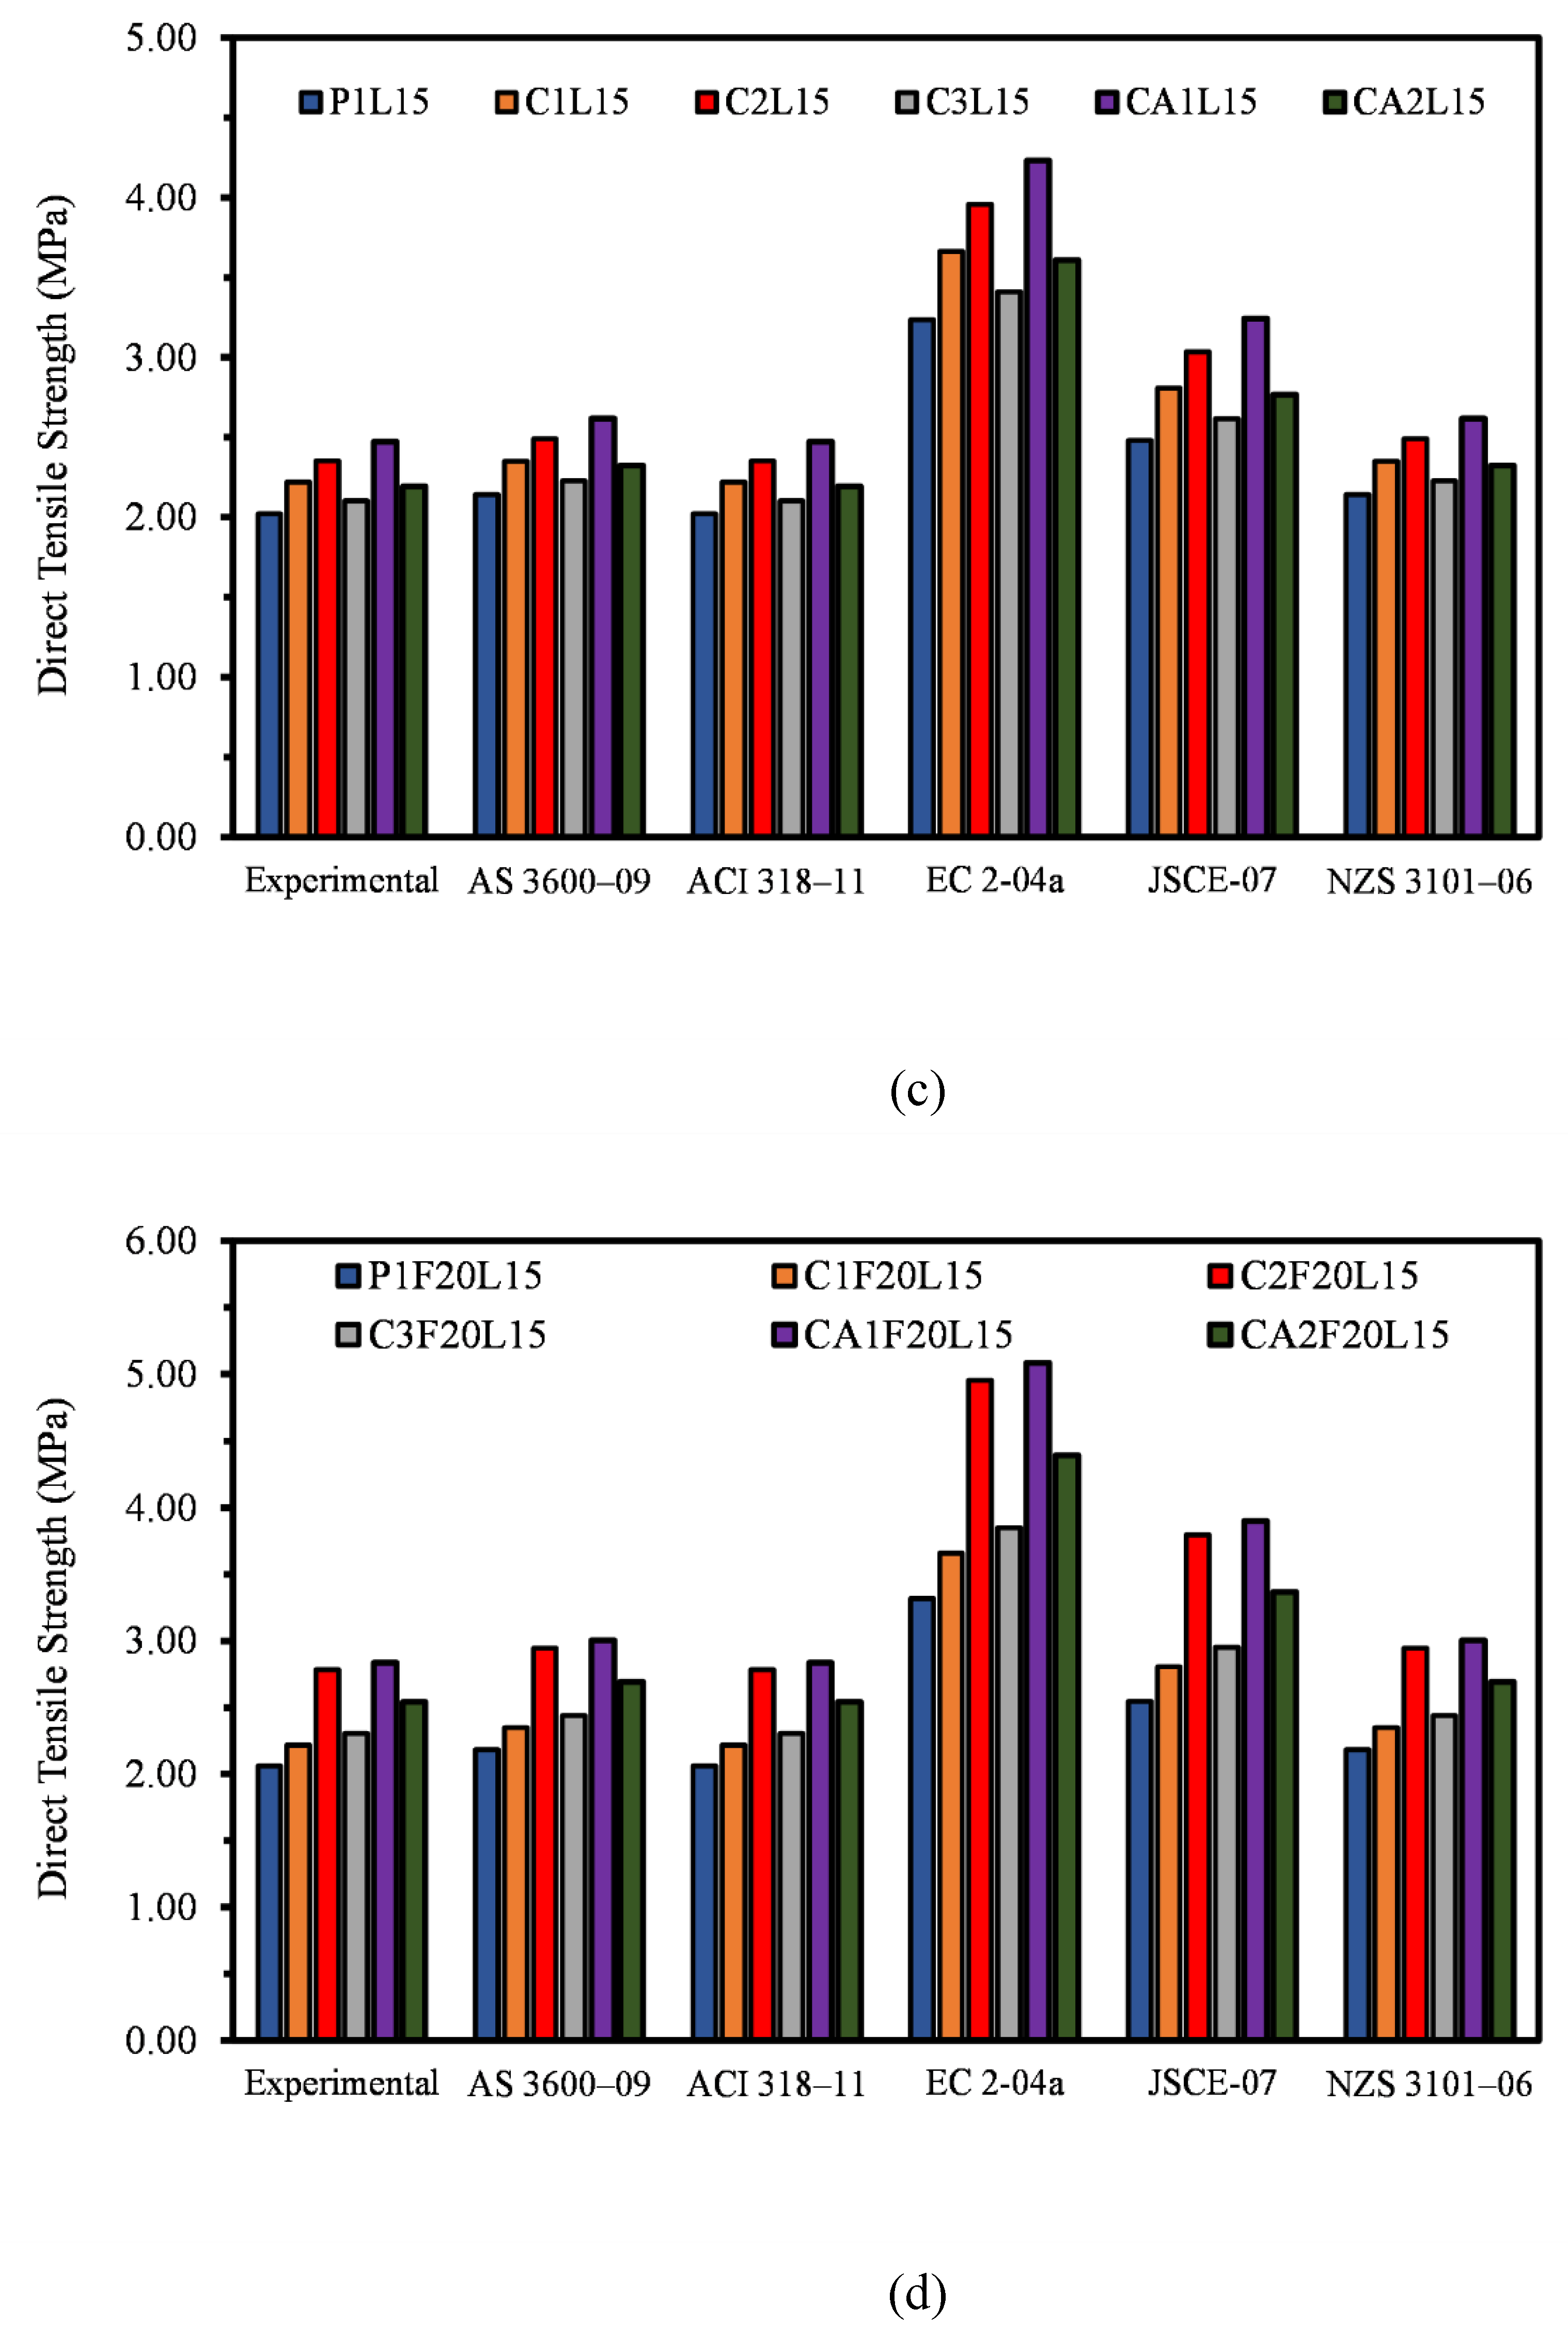
Furthermore, the direct tensile testing (presented in Figure 7) aims to investigate the extent to which current design codes can be applied to predict the direct tensile strength of the mixtures examined in this study.
To achieve this objective, the predictions derived from the code expressions were compared against the experimental test results of 28-day direct tensile strength. Table 3 provides a list of the current design code expressions used for predicting the direct tensile strength.
This comparison is conducted to determine the accuracy of the code expressions in predicting the direct tensile strength of the mixtures examined in this study. It is worth noting that, despite the limitations inherent in the use of code expressions, these calculations remain an important tool for engineers and designers in the construction industry. By providing a standardized approach to the prediction of material properties, design codes play a vital role in ensuring the safety and reliability of structures. It can be inferred from Figure 7 that the predicted results with different codes are similar to the experimental results. Even though there are differences in the results, it can be inferred that all the results are within a reasonable range. Figure 7a, Figure 7b, Figure 7c, and Figure 7d have shown that EC 2-04 and JSCE-07 tend to overestimate the tensile strength of the mixtures, while AS 3600-09 and NZS 3101-06 tend to underestimate their tensile strength. Of all the design code expressions, ACI-11 yielded the closest predictions for all the mixtures. Figure 8 shows the relationship between compressive strength, flexural strength, and direct tensile strength at 28 days of curing. This shows that the mechanical properties are interrelated, with higher compressive strength generally corresponding to increases in both flexural and tensile strengths. And Figure 9 shows the relationship between setting time and 28-days compressive strength. The figure shows how changes in setting time influence the long-term strength development of the mortar mixtures. Figure 9 shows that mortar mixtures with longer setting times may exhibit slower early strength gain but can achieve similar or even higher compressive strength at a later age.

3.5. Alkali-Silica Reaction

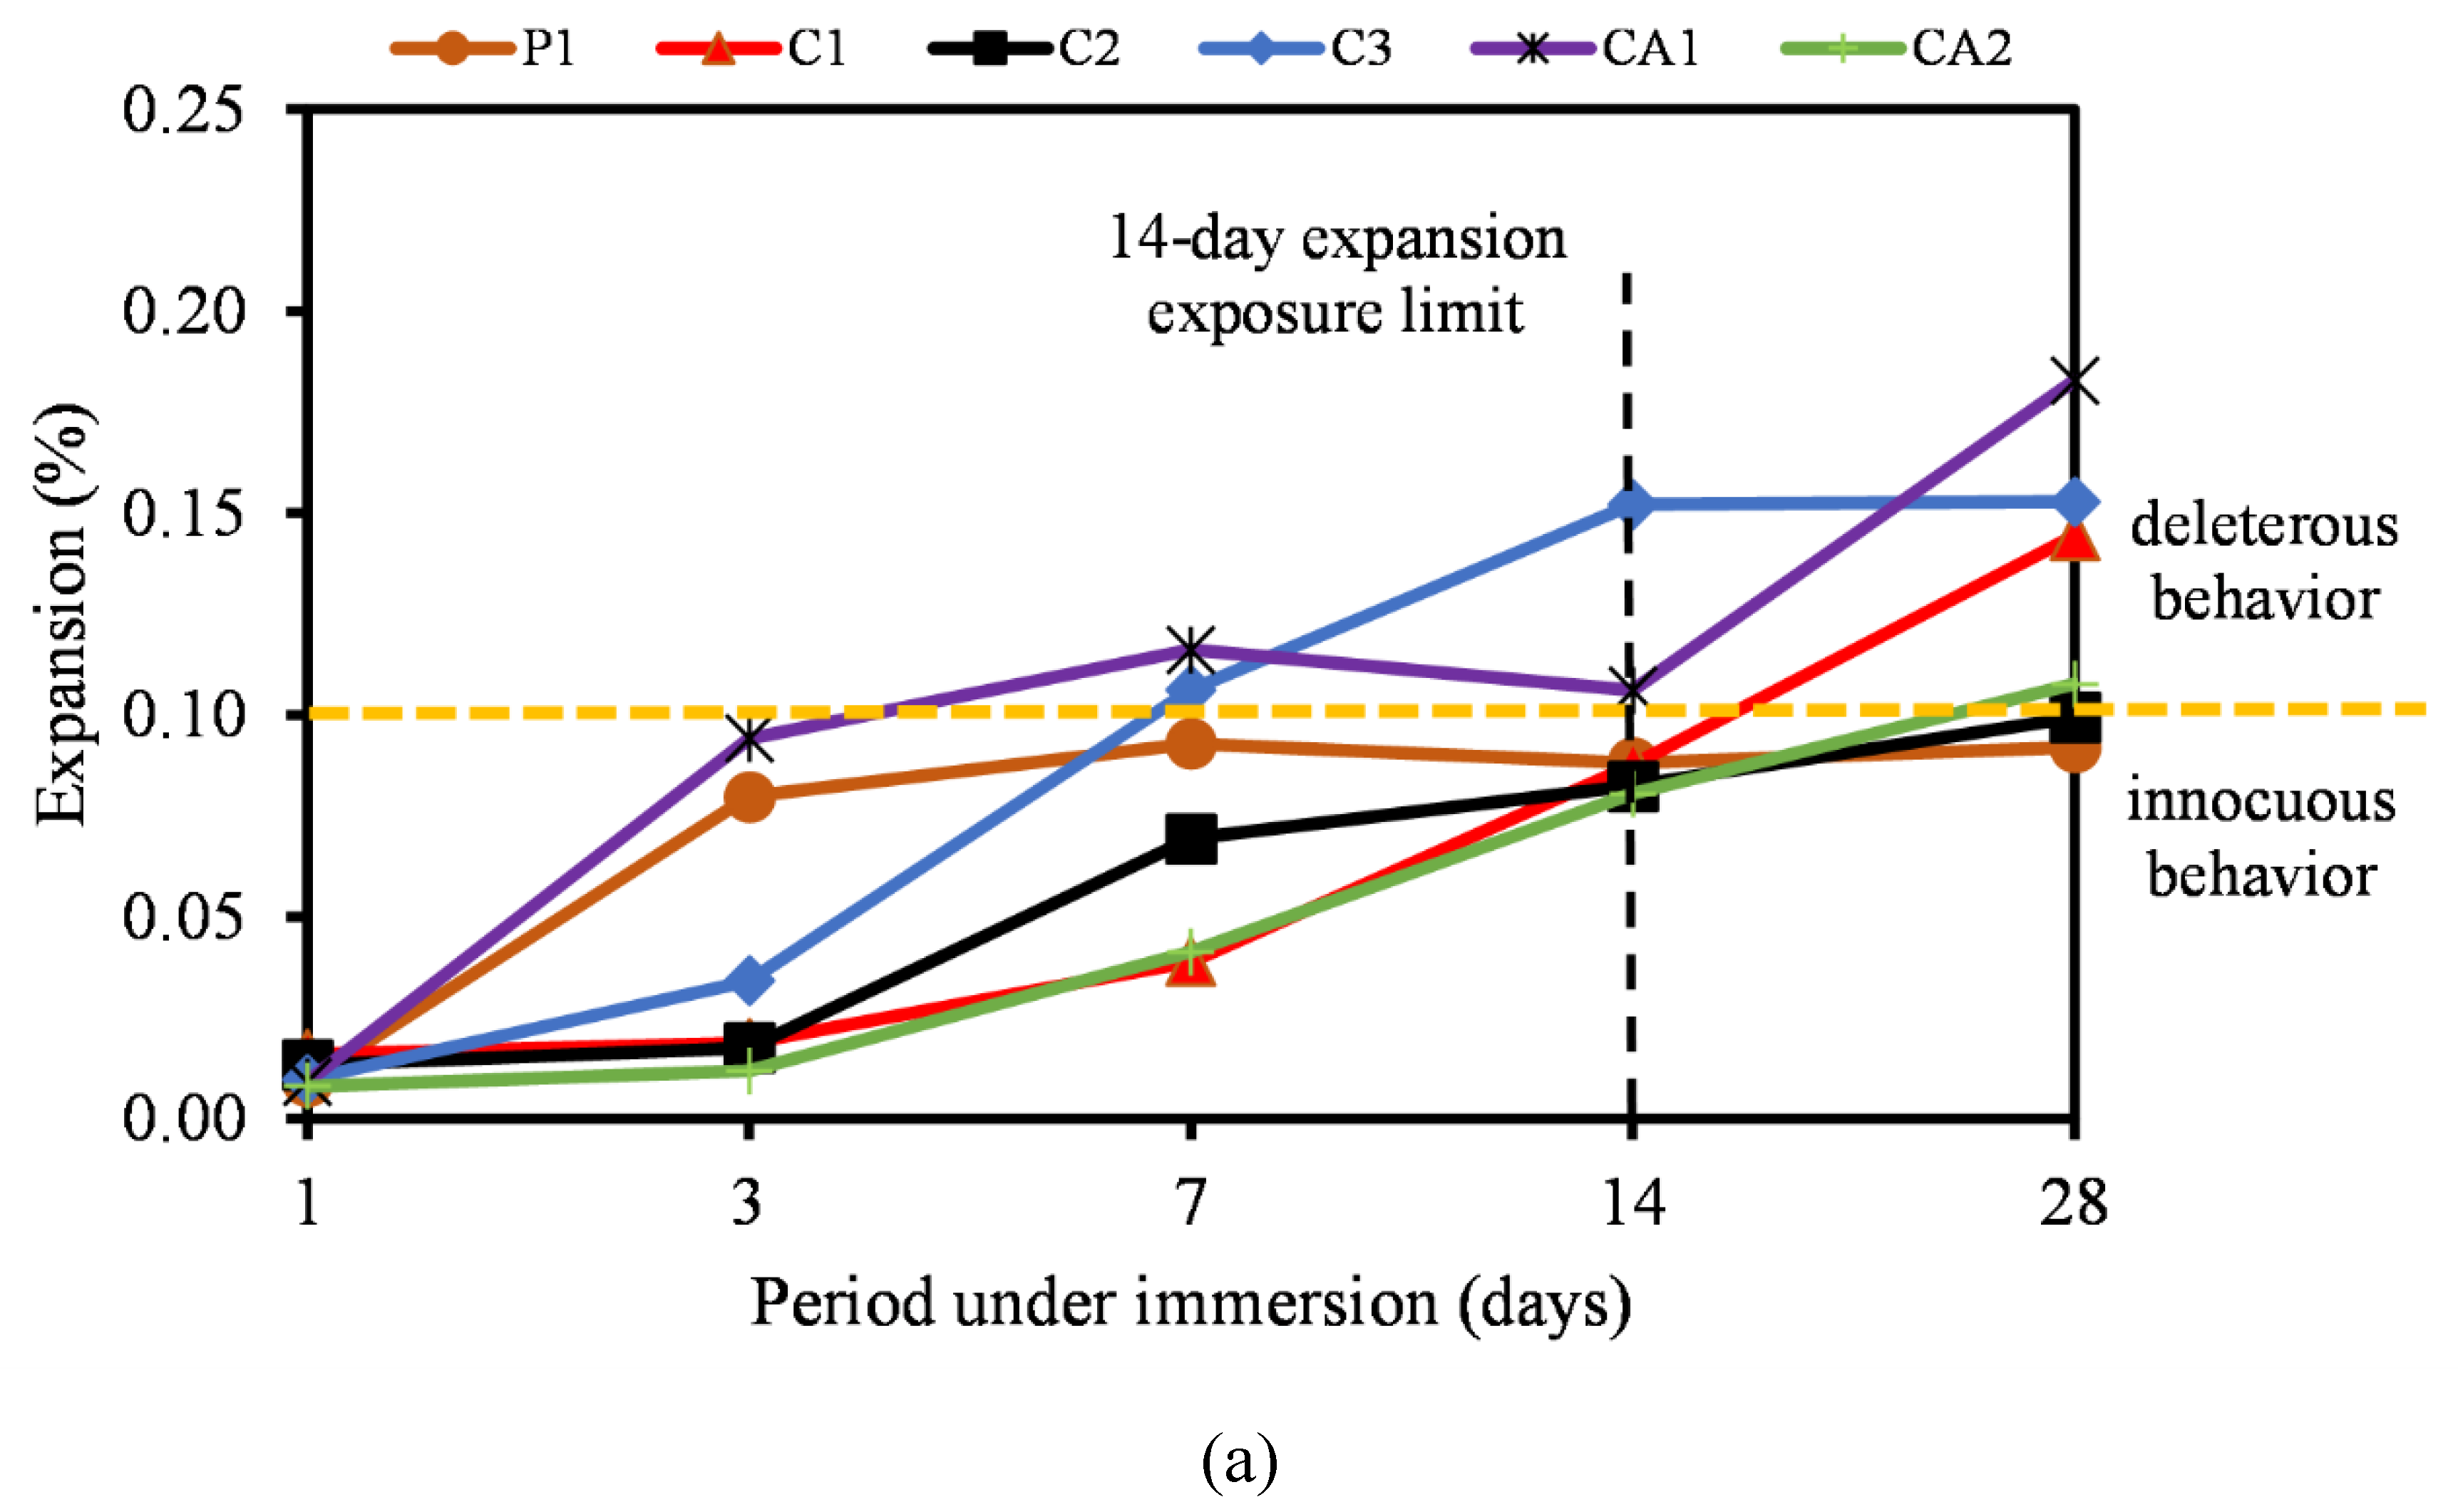
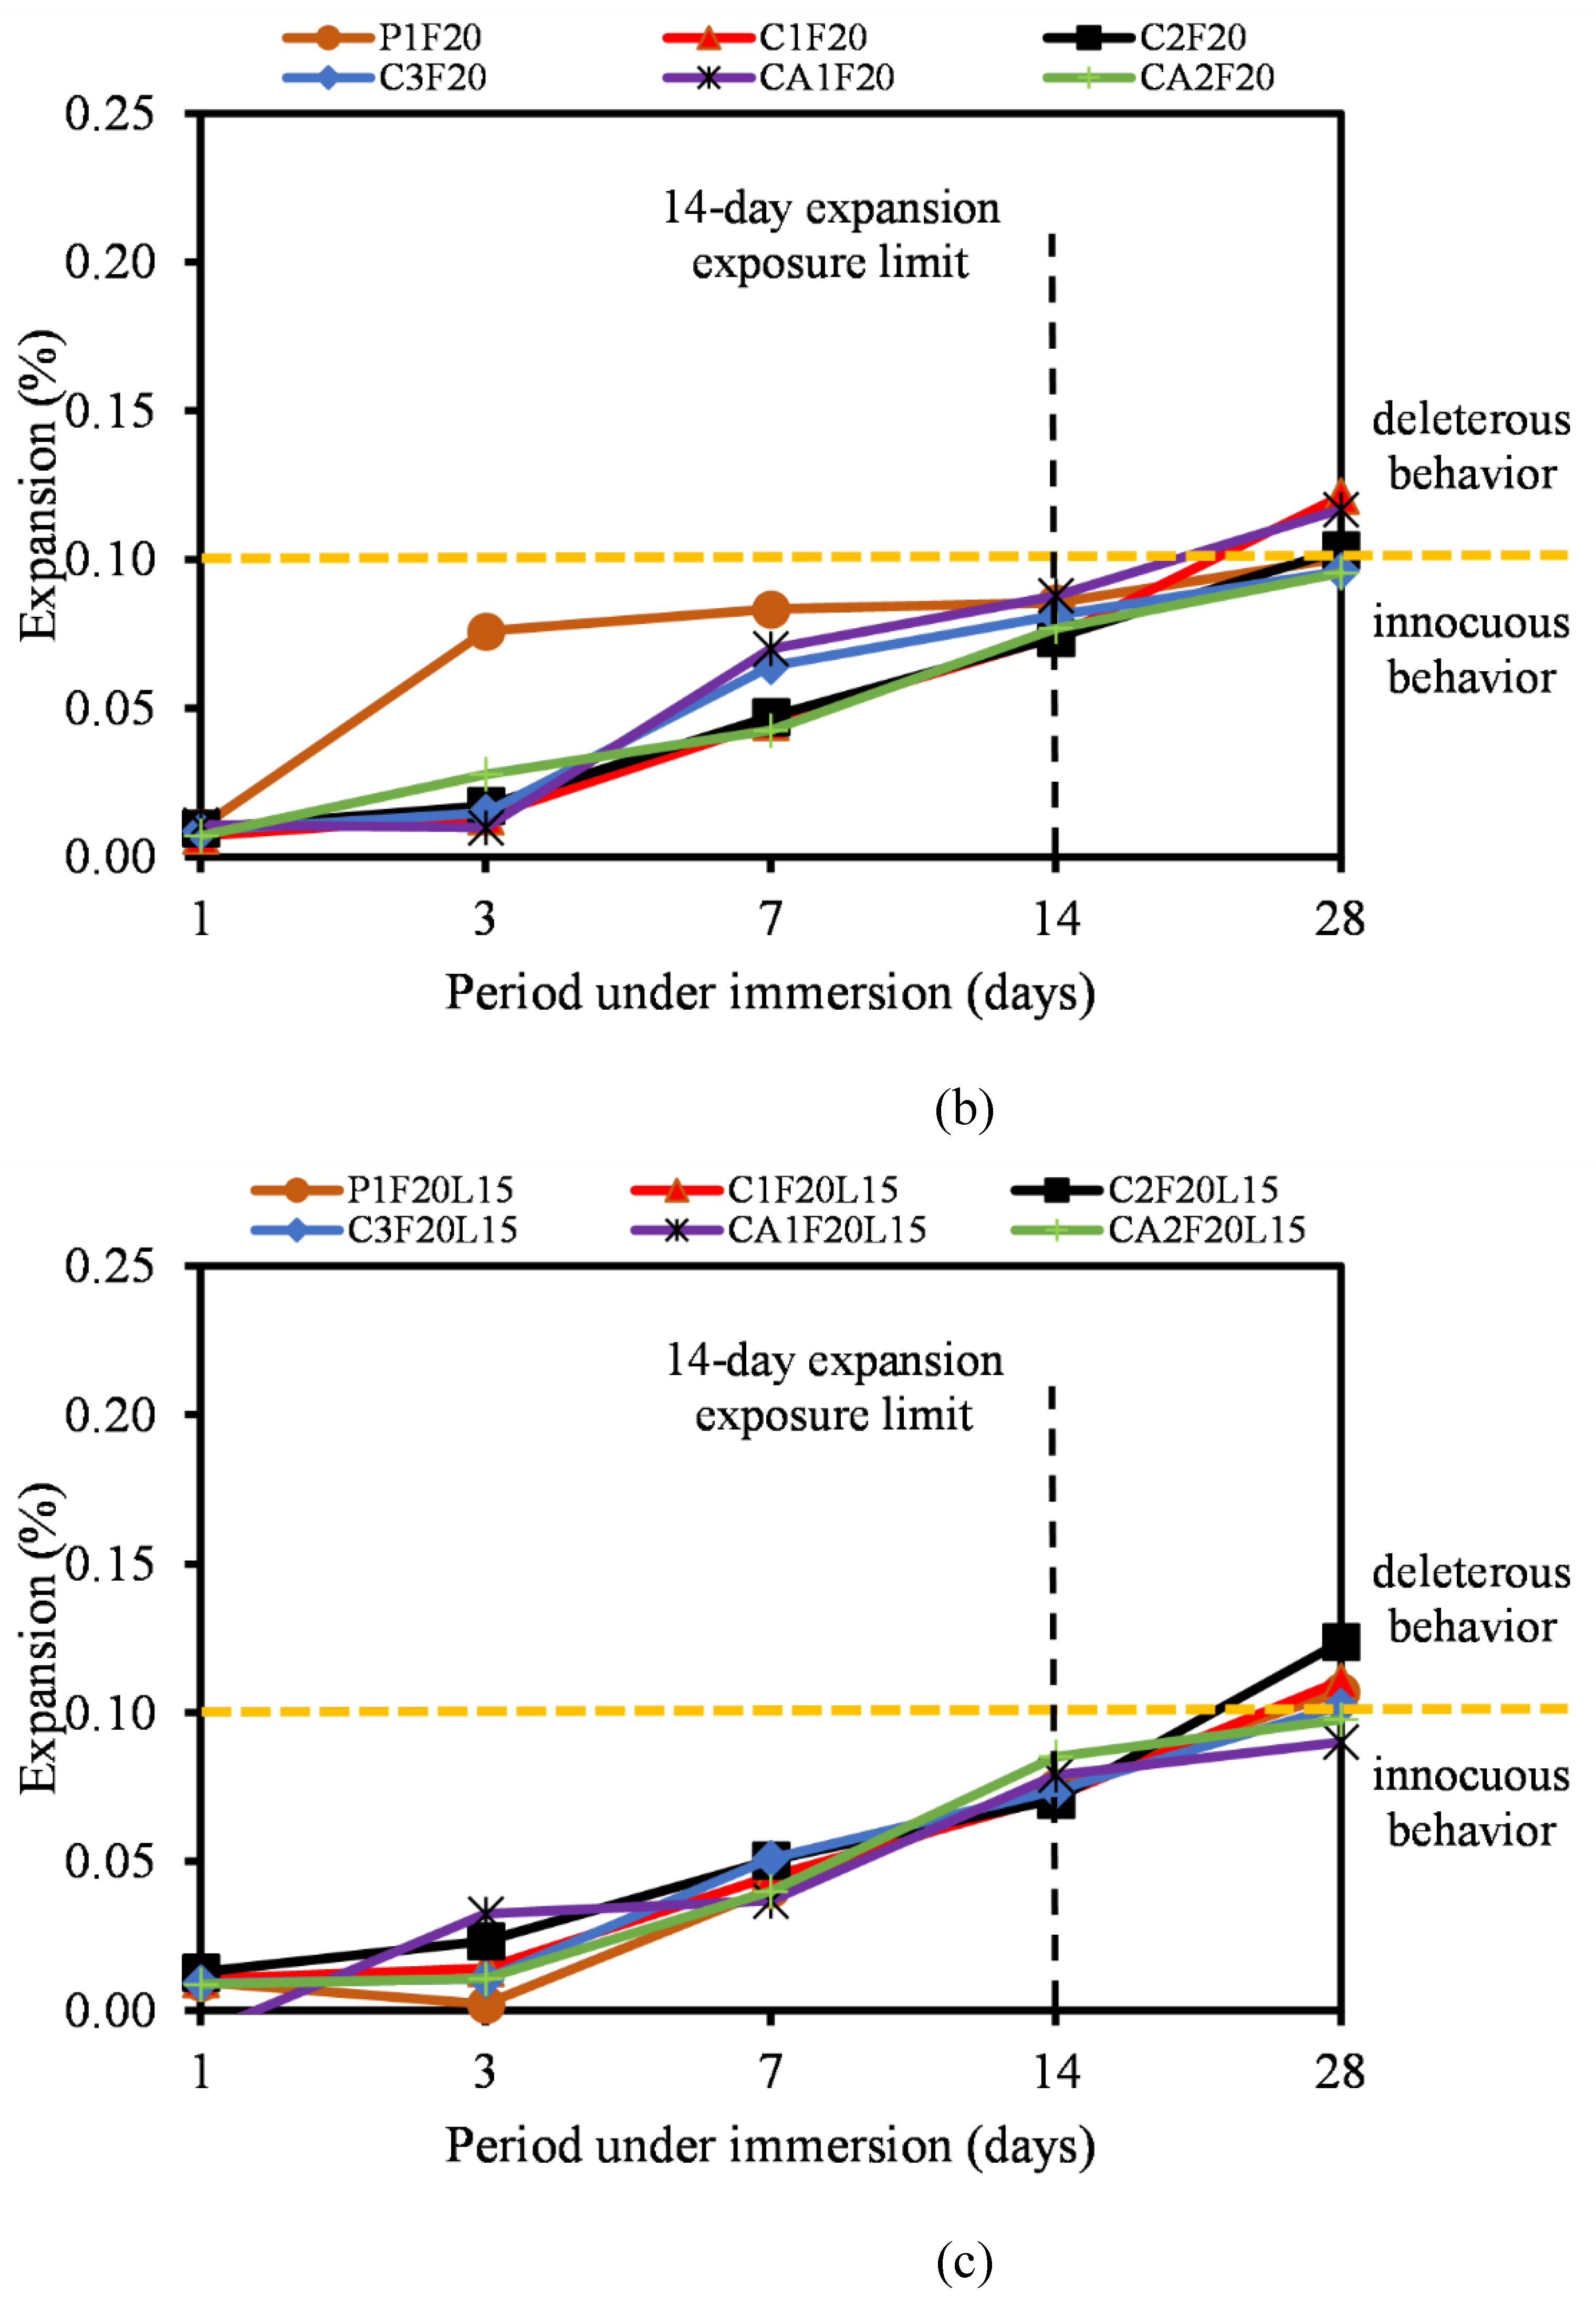
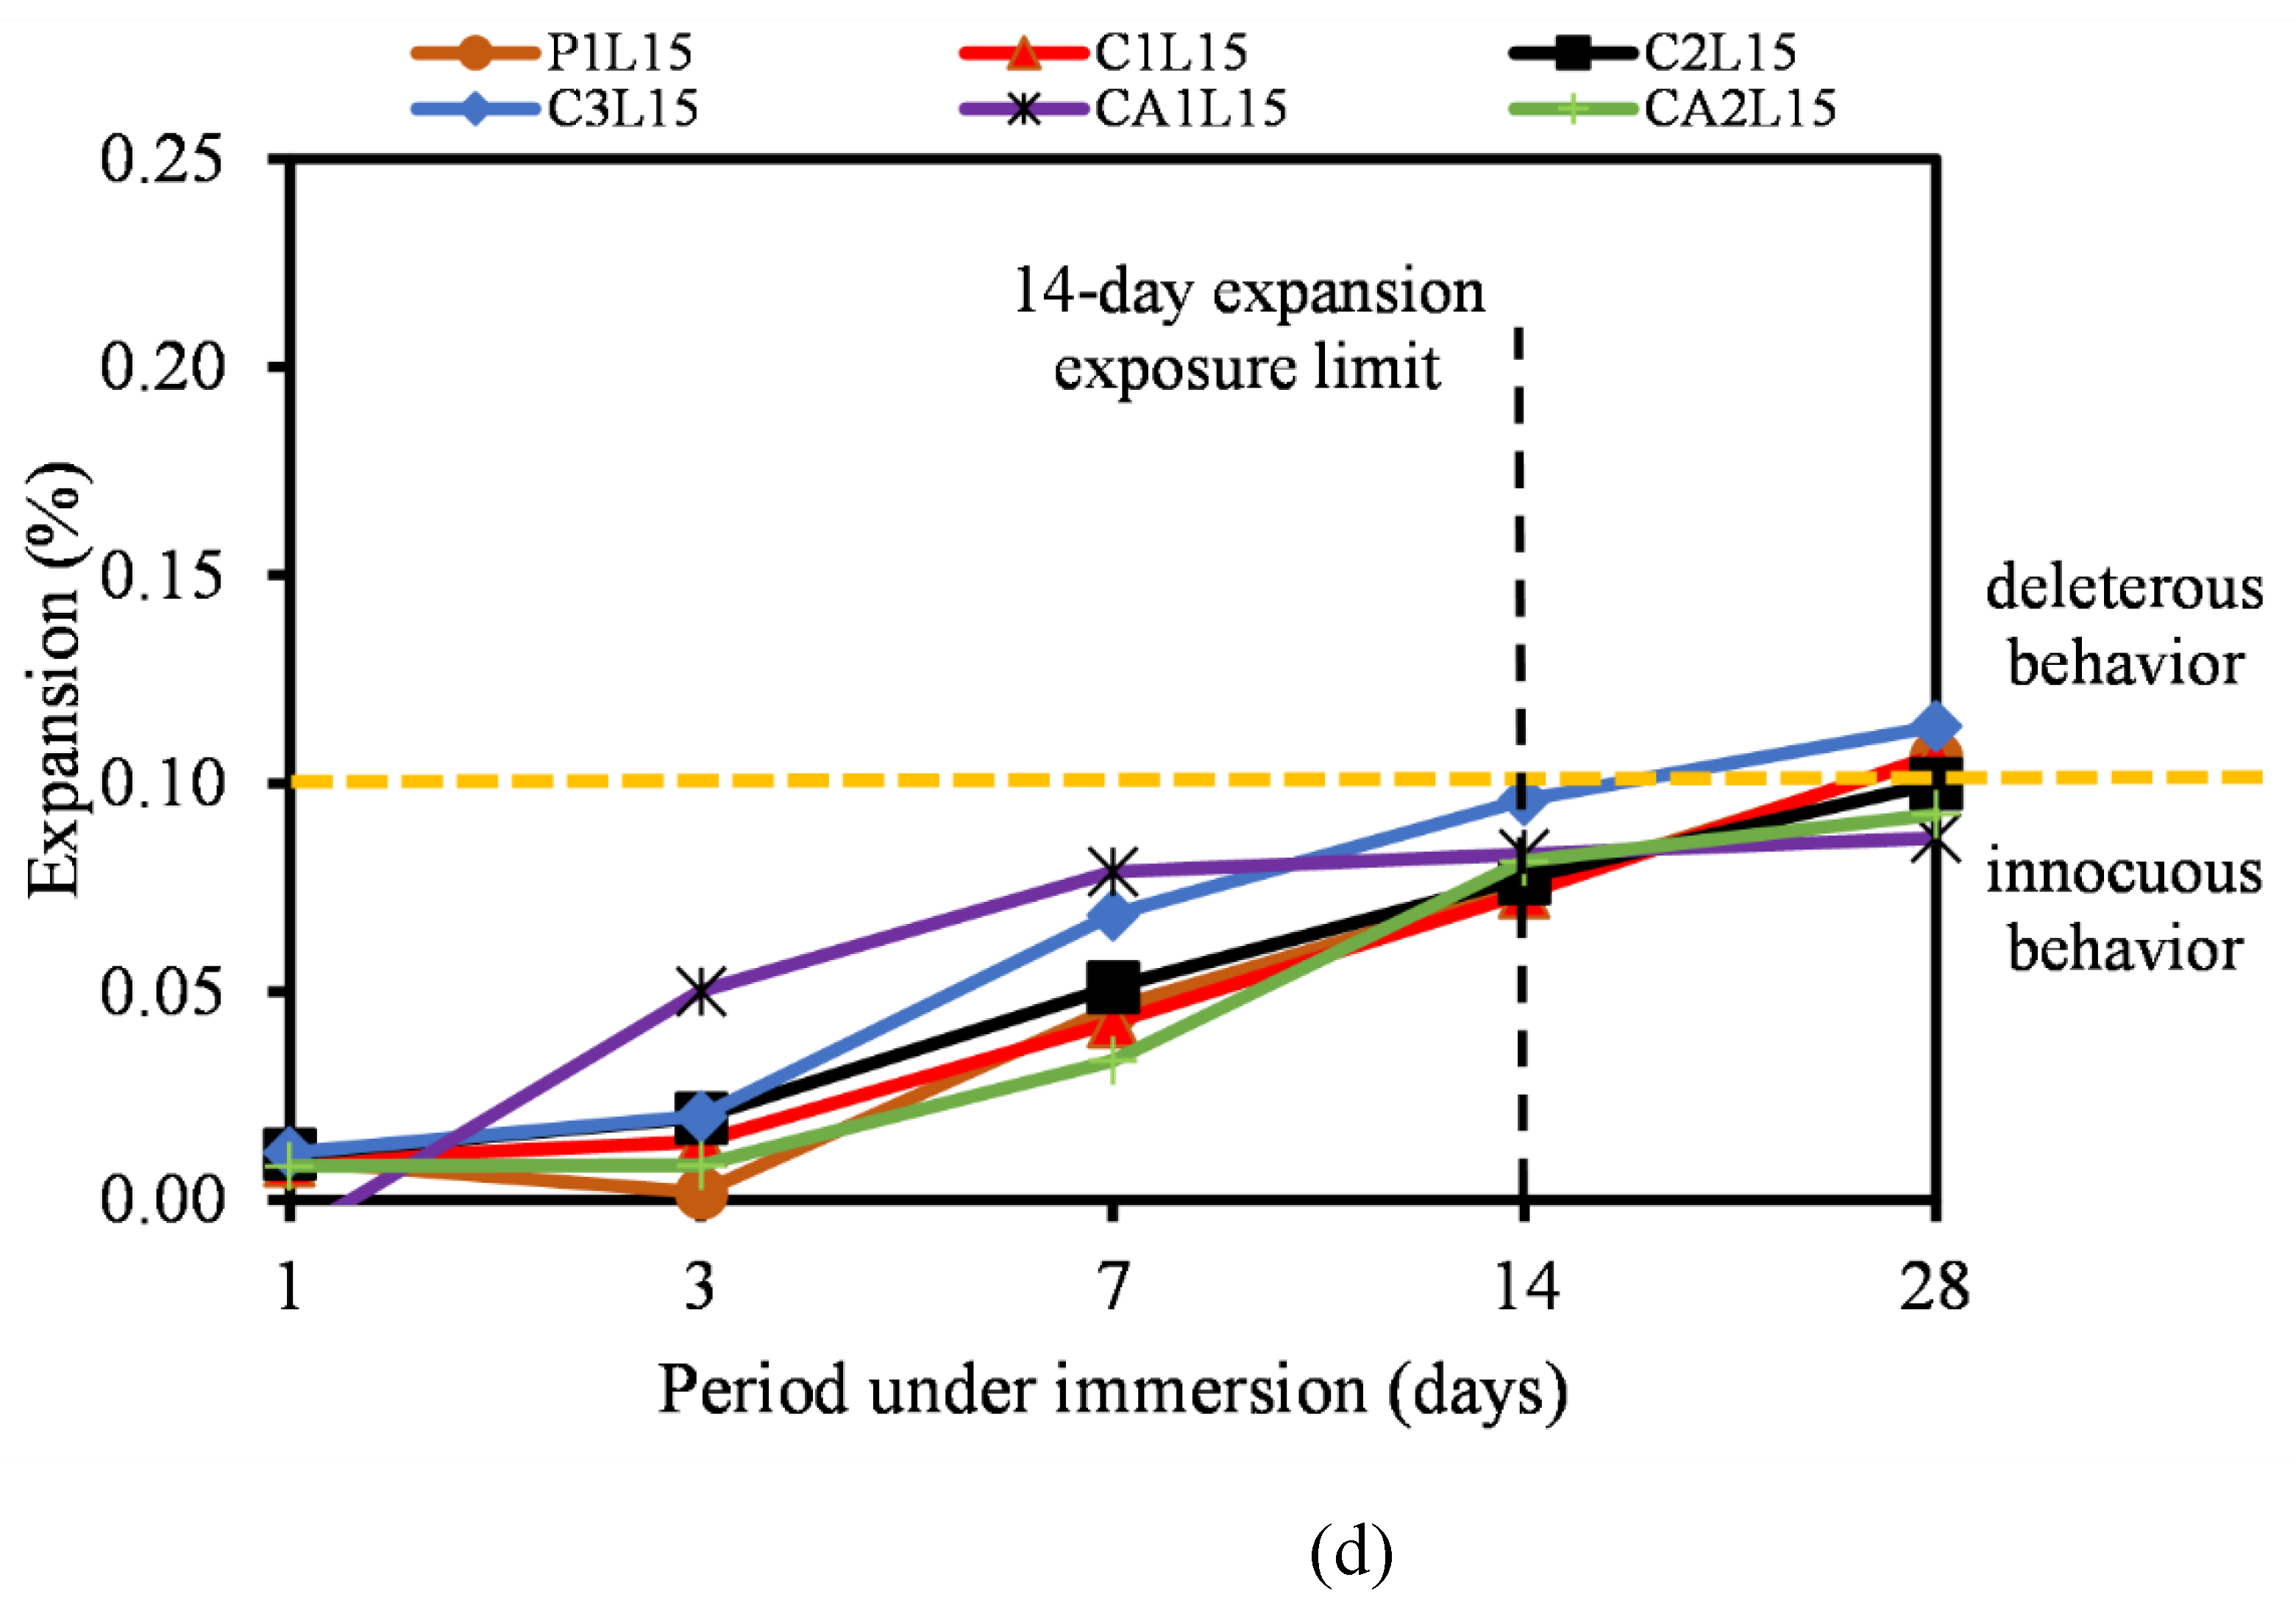
Figure 10 illustrates the length expansion of all mortar mixtures produced with potentially less reactive fine aggregate, then immersed in 1M NaOH solution at 80oC for 28 days.
In Figure 10a, it can be observed that C3 and CA1 exceeded the 14-day expansion exposure limit with 0.15% and 0.11% respectively. Other mixtures such as CA2, P1, and C2 still remained under innocuous condition as observed in Figure 10a. Moreover, it can be observed that the addition of FA to the mixtures reduced the expansion rate of the mixtures as seen in Figure 10b. All the mixtures remained under innocuous conditions at 14 days of testing and only C1F20 and CA1F20 showed a slight expansion increase at 28 days of measurement.
Previous studies such as Shuangzhen Wang conducted a study to evaluate the effectiveness of cofired biomass fly ashes in reducing ASR in mortar [58]. The study involved using different ratios of fly ash to cement (15/85, 25/75, 35/65) for testing periods of up to 600 days. The results showed that cofired biomass fly ashes can reduce ASR expansion comparably or even more effectively than traditional fly ash. The different fly ash used reduced ASR by 10-30 percent which is similar to the current study where fly ash reduced ASR by 5-20 percent in most of the mixtures. The reduction mechanisms were identified as alkali dilution, alkali absorption, and reduction in alkali ions transfer, which were confirmed through pore solution chemistry analysis. Similarly, Hamza Tariq studied the impact of the alkali content of cement on ASR expansion and its mitigation using fly ash [59]. It was found that ASR has a negative effect on the mechanical properties of mortars, reducing compressive and flexural strengths by 15% and 31%, respectively. This highlights the importance of controlling both the alkali content of cement and adding fly ash to control ASR-induced damage in concrete structures.
Krishna Siva conducted a study on the effectiveness of portland-limestone cement (PLC) with SCMs in preventing ASR [60]. The study found that mixtures containing PLCs and SCMs generally performed similarly or better in mitigating ASR compared to those with OPCs and SCMs. Specifically, it was found that interground PLCs with up to 15% limestone were effective in preventing ASR, indicating that SCM combinations effective with OPCs could be used as-is with PLCs. Pore solution analysis and bulk electrical resistivity measurements further supported these observations, suggesting that the slight reduction in pore solution alkalinity and enhanced resistance to mass transport were key factors in the improved performance of PLCs in ASR mitigation.
The incorporation of FA into CSA cement mortar serves a multifaceted role in mitigating ASR, a destructive chemical process leading to the expansion and cracking of the specimen [61]. FA serves as a pozzolanic material and reacts with calcium hydroxide, a by-product of cement hydration, to form additional cementitious compounds. This reaction effectively consumes the calcium hydroxide that could otherwise contribute to ASR gel formation. The pozzolanic reaction enhances the microstructure of the mortar, resulting in a denser and less permeable product. Furthermore, it reduces the overall alkali content, which is a crucial factor in the occurrence of ASR [62,63].
Just like CSA, FA plays a similar role in mitigating ASR in CAC systems as reported Pingping et. al [64]. Additionally, the incorporation of LP also reduced the risk of ASR by helping to mitigate length expansion and deleterious behaviors of the mixtures. As observed in Figure 10c, none of the mixtures with LP exceeded 0.10% after 14 days under immersion in 1M NaOH. However, after 28 days, only C3L15 slightly showed a deleterious characteristic. The same can be said of the combined effect of FA and LP on the pure binders. The incorporation of both FA and LP followed the same trend as the effect of only FA or only LP. All the mixtures were under 0.10% after 14 days of measurement, however, C2F20L15 slightly increased in swerved into the deleterious zone. LP plays a complex role in influencing the ASR in CSA and CAC cement mortar, a chemical process that is known to cause detrimental expansion. Its primary action is to alter the chemical composition of the mortar mixture, where it reacts with aluminate phases to form carboaluminate phases. This transformation has the potential to mitigate ASR by stabilizing the expansive ASR gel. Moreover, carbonate ions derived from LP interact with the alkali-silica gel, reducing its capacity to absorb water and expand. Additionally, the inclusion of LP in the mortar mixture enhances the microstructure by filling voids, thereby minimizing moisture ingress, which is critical for ASR progression [32,64,65,66,67,68].

3.6. Autogenous Shrinkage

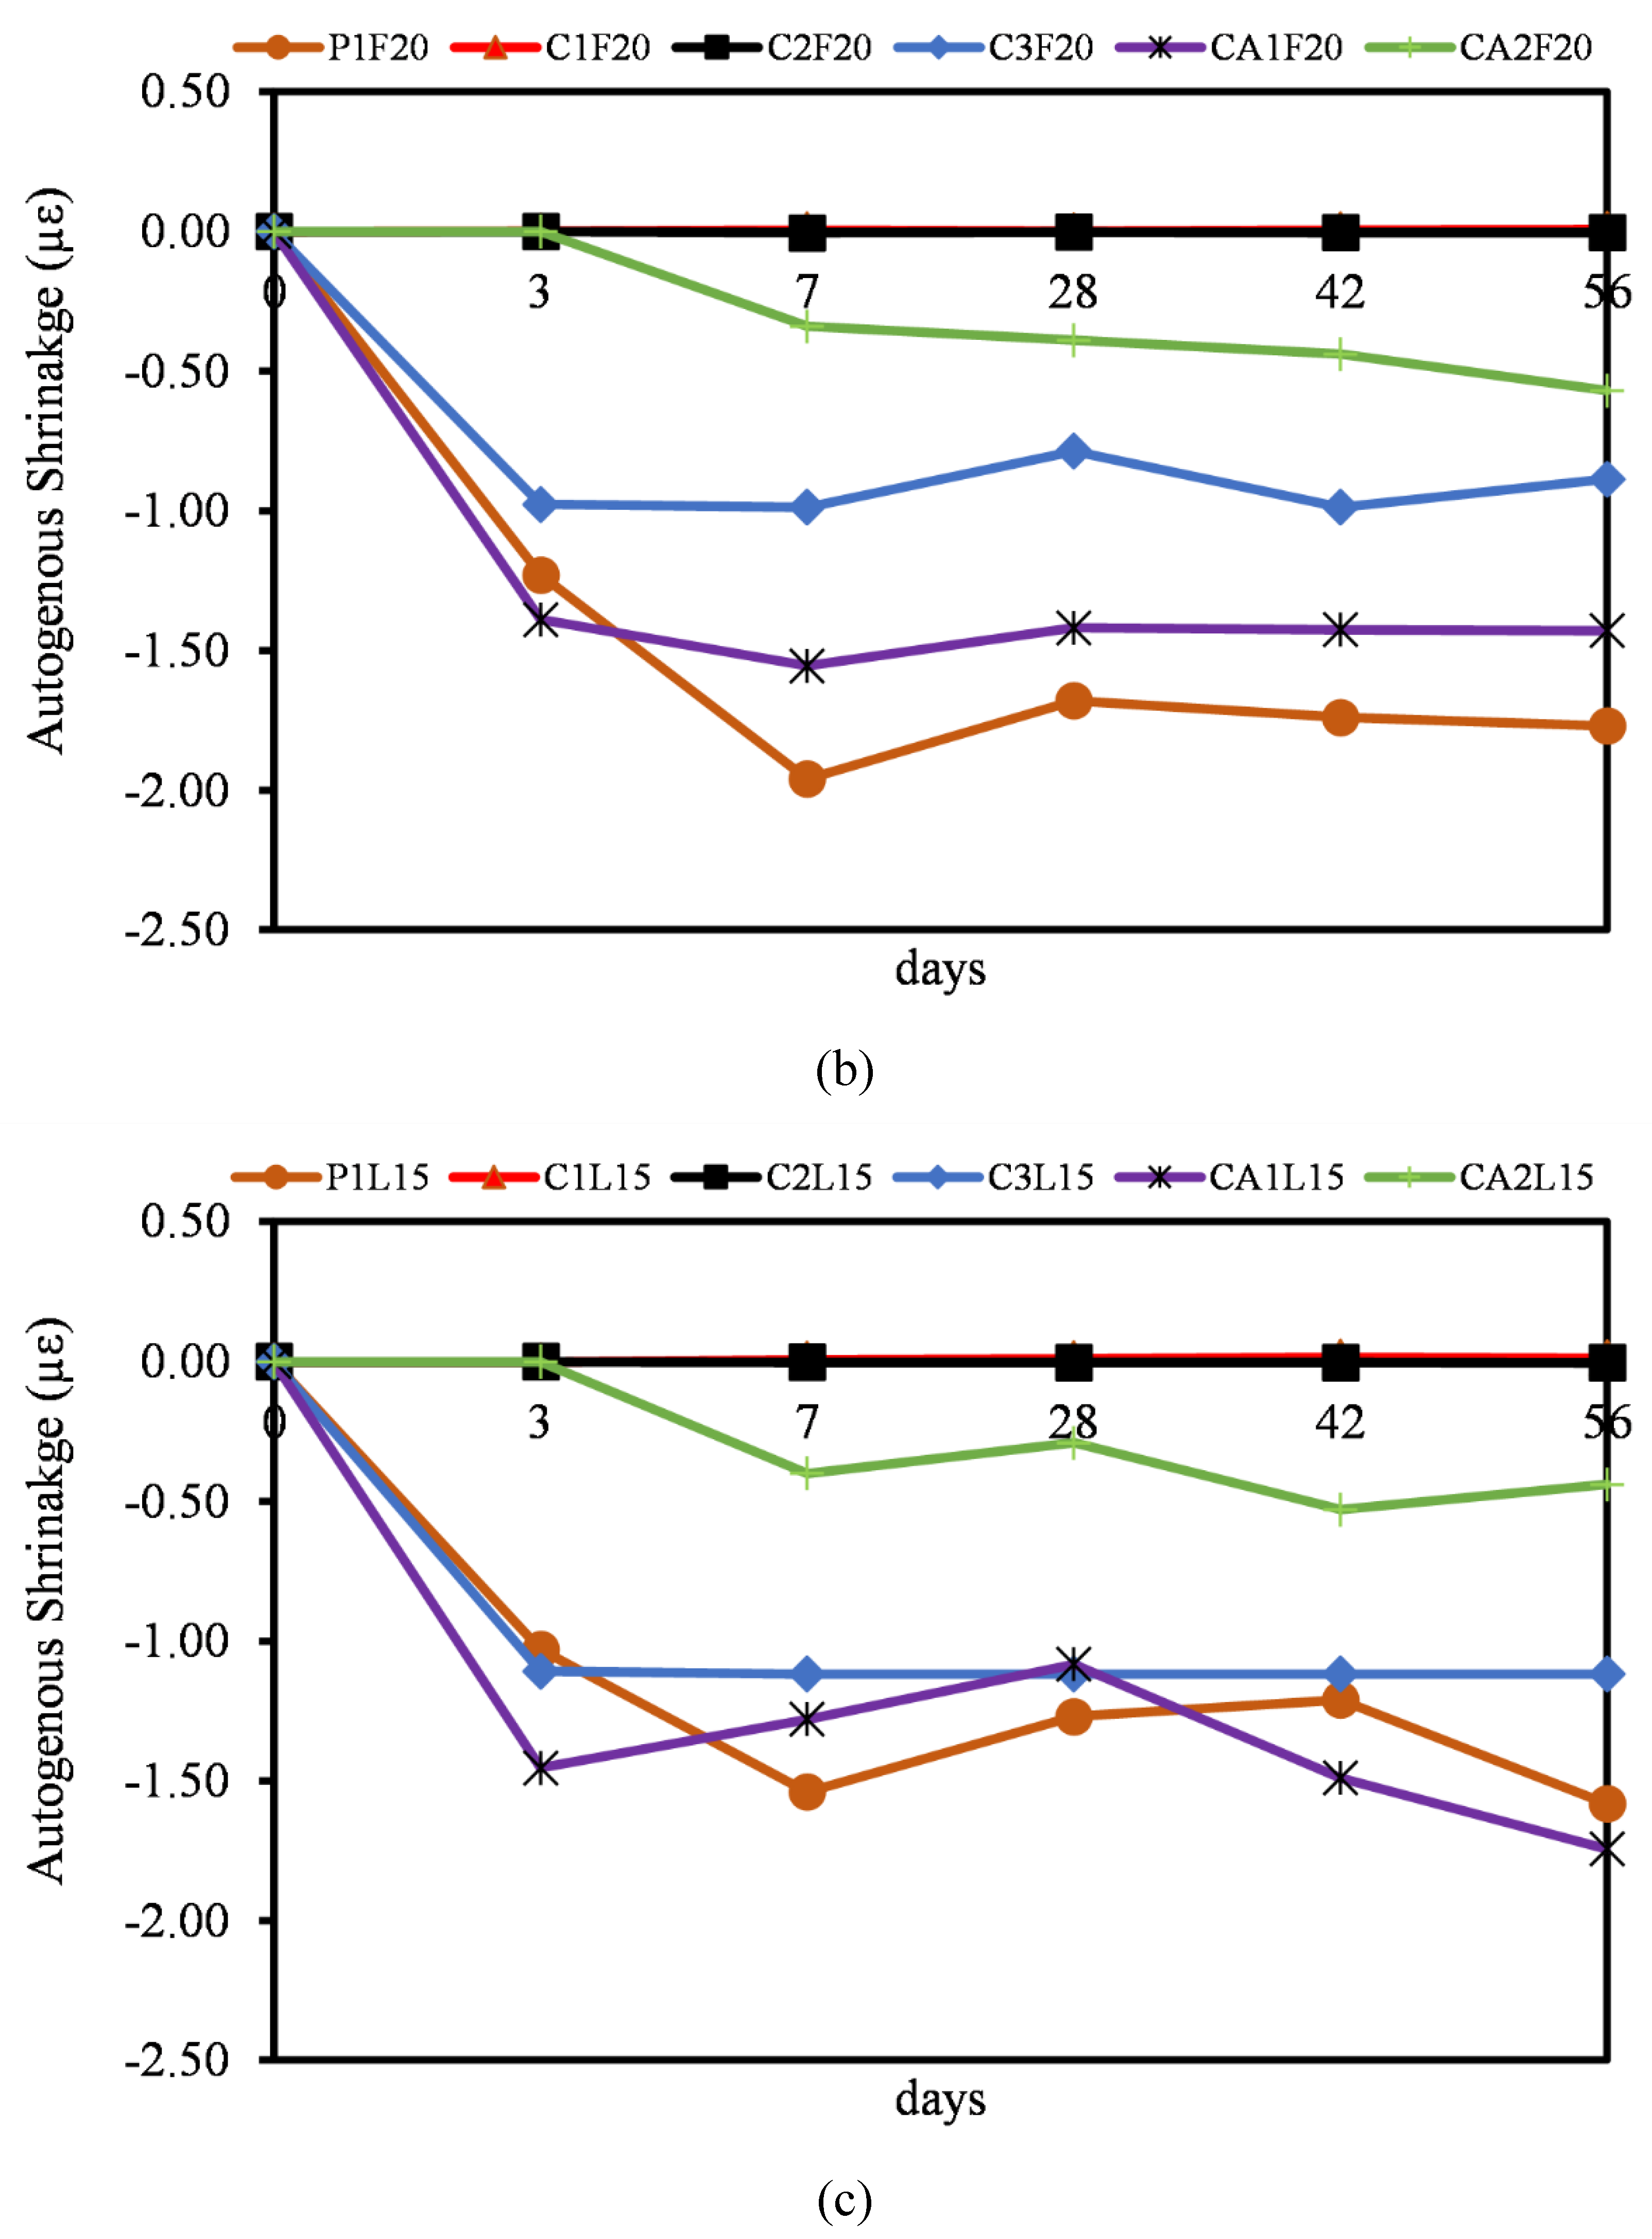
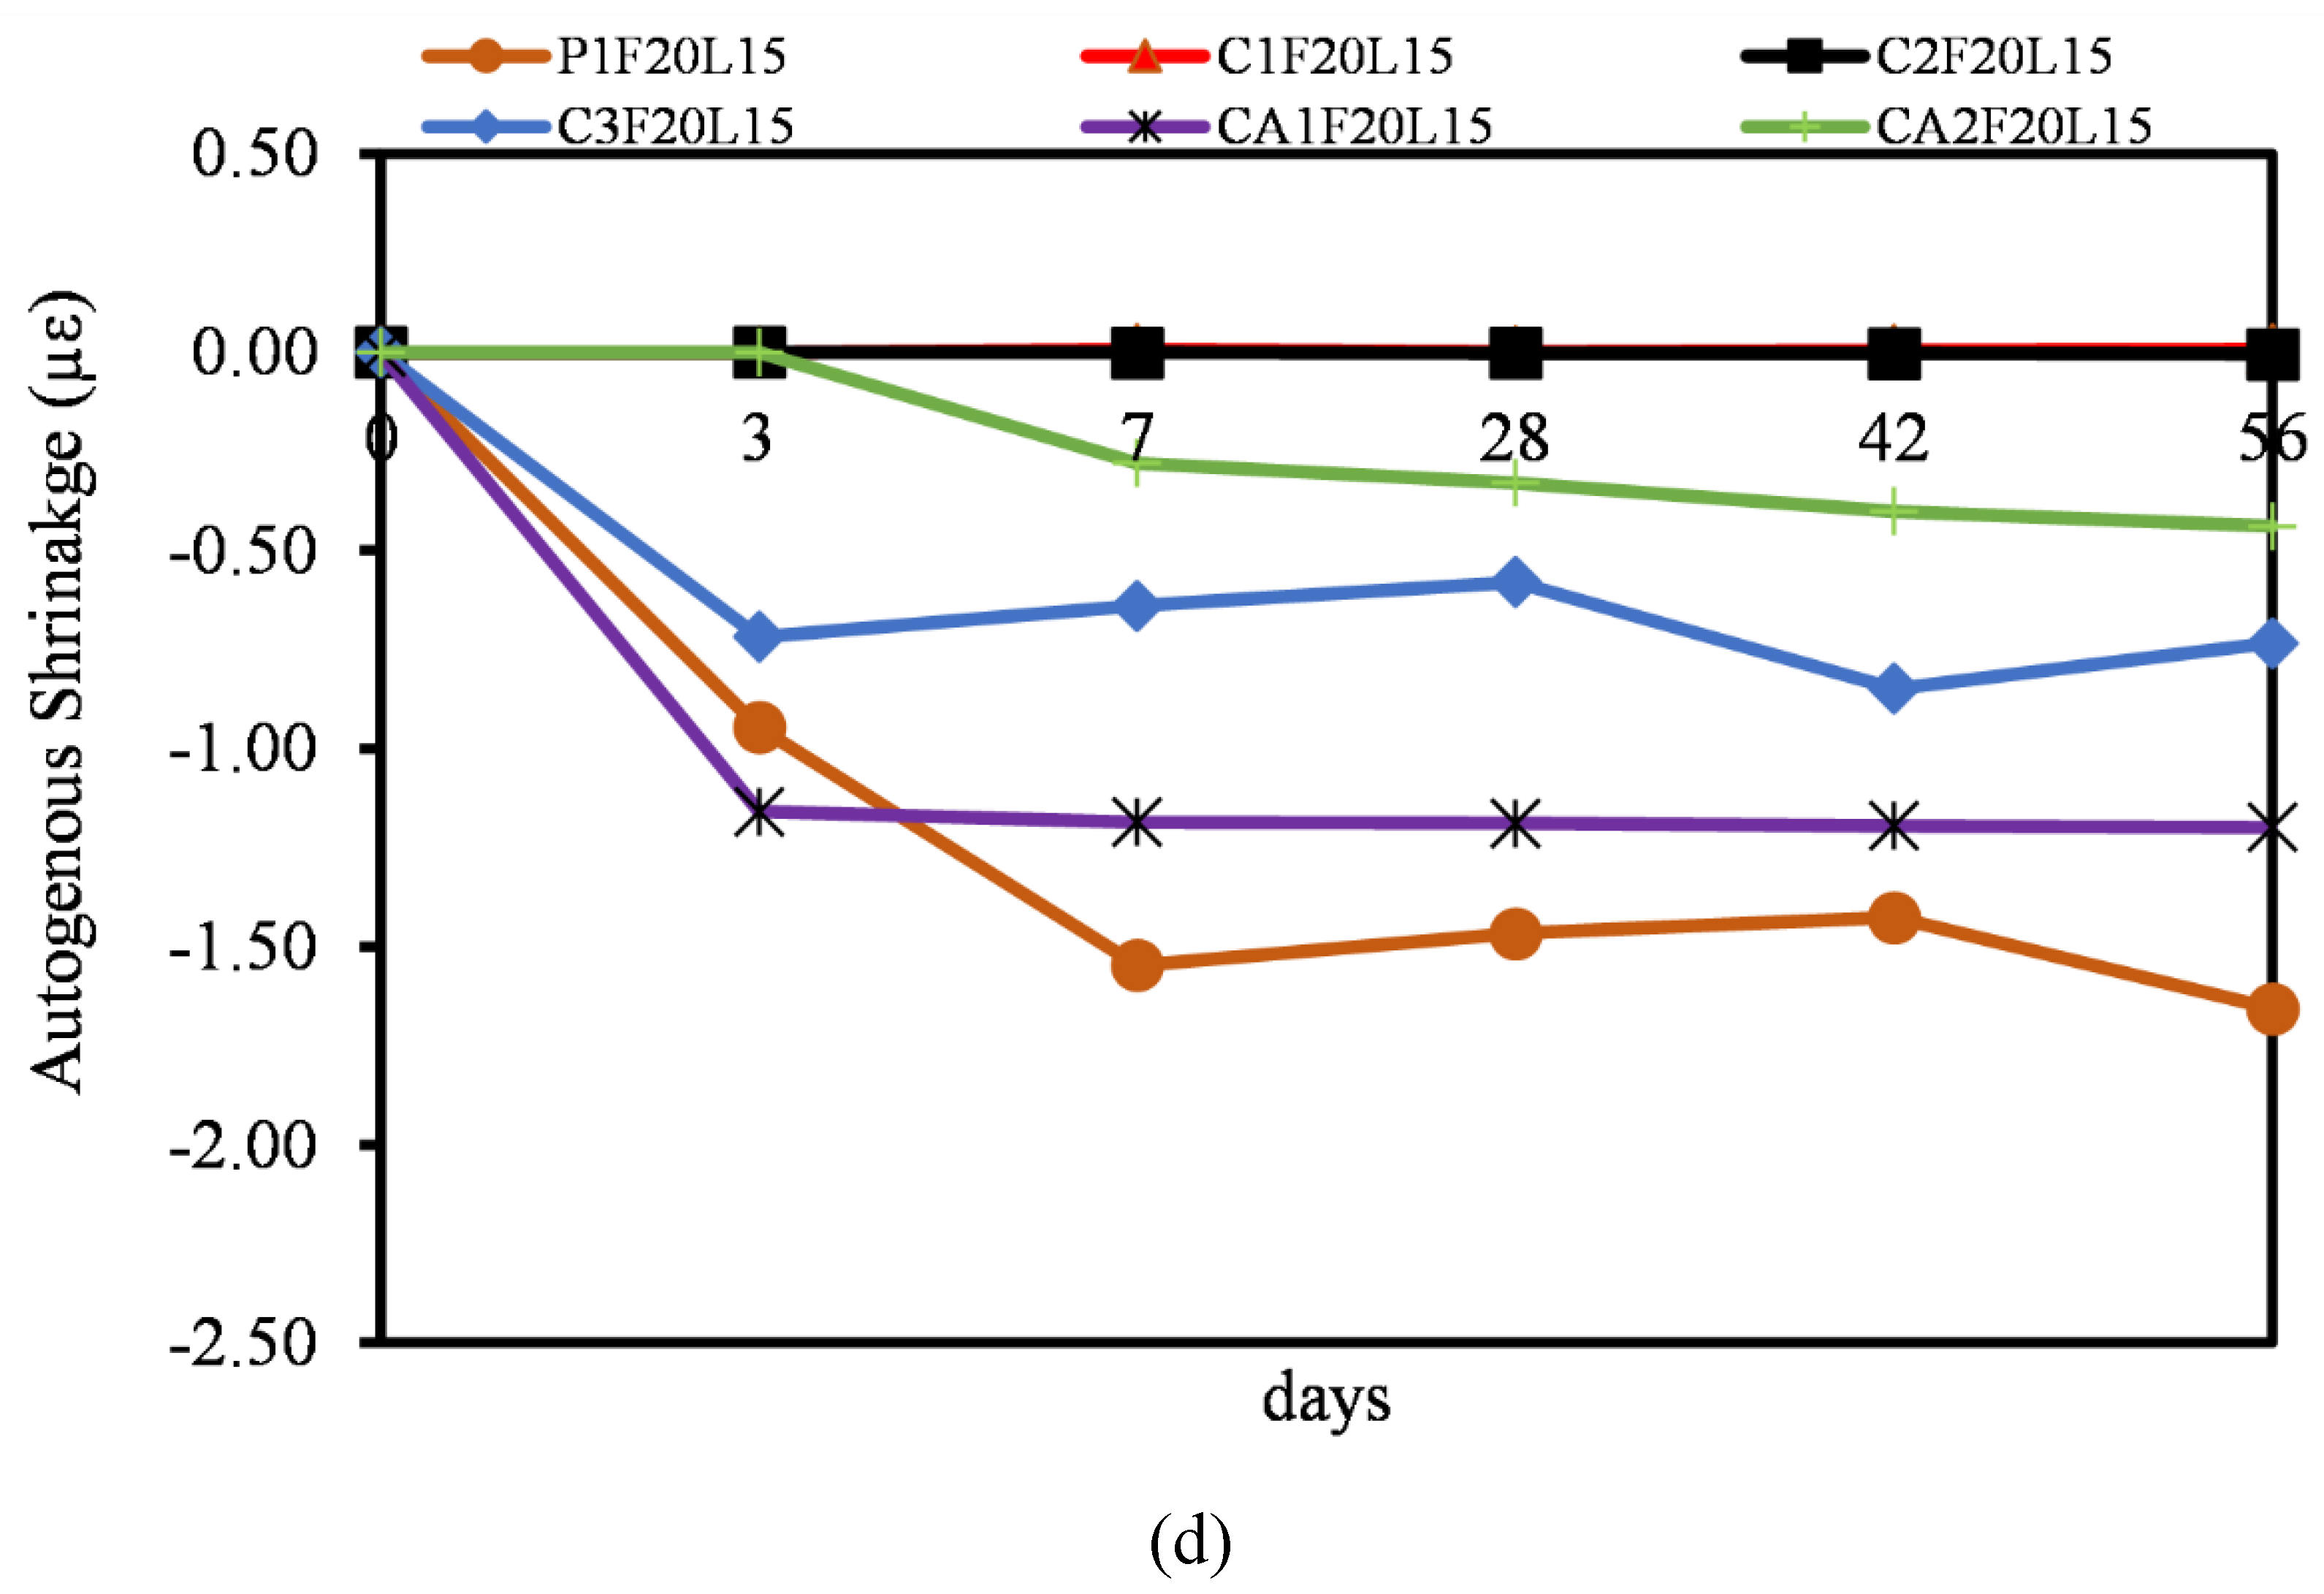
A study by Termkhajornkit et. al [69] suggests that autogenous shrinkage is a multi-stage process that can be broken down into four different phases. The initial two stages are primarily driven by the gravitational settling of particles, resulting in significant shrinkage. In the third stage, autogenous shrinkage is governed by the cement hydration reaction and the formation of ettringite from Al2O3. Finally, in the fourth stage, the rate of autogenous shrinkage decreases. As time progresses beyond day 56 of hydration, the role of Al2O3 diminishes, and the degree of SCM such as FA and LP hydration becomes the primary factor driving autogenous shrinkage. Figure 11 displays the autogenous shrinkage development in all mortar mixtures during the 56-day hydration period.
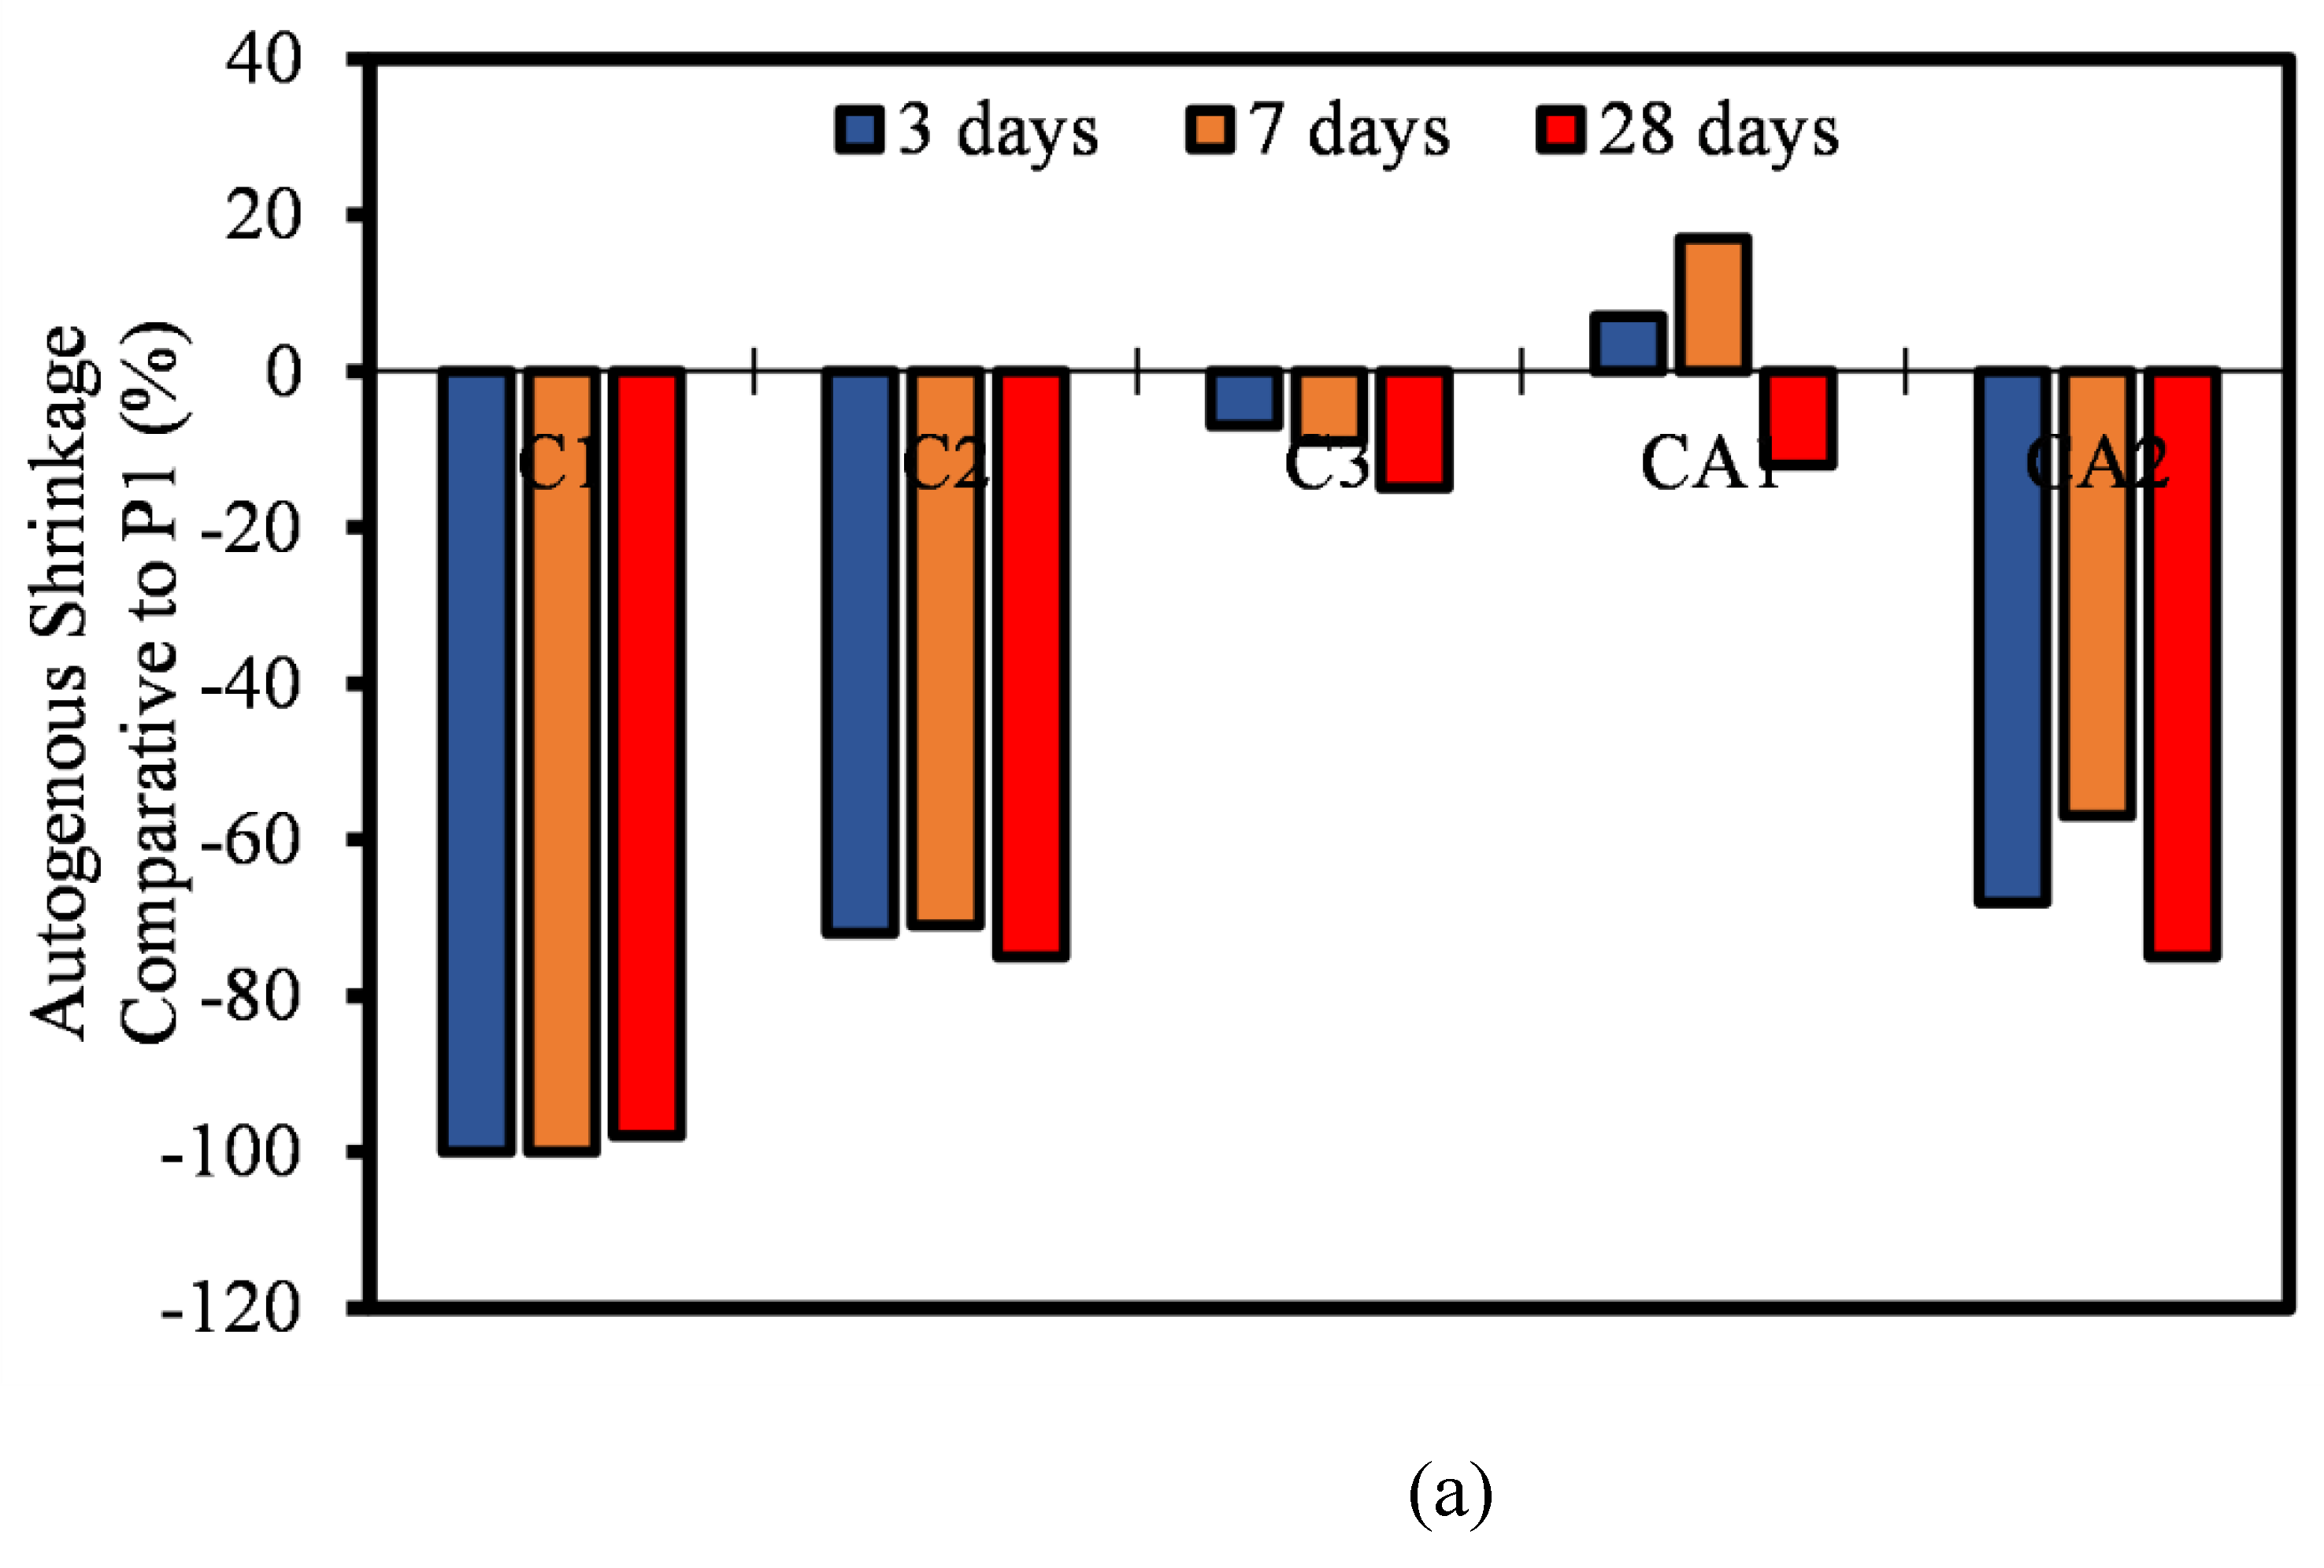
C1 and C2 mortar mixtures exhibited notably less autogenous shrinkage than the P1 mixture at 3, 7, 14, 28, and 56 days of age. Meanwhile, the CA1 and C3 mixtures had a higher autogenous shrinkage. Both CA1 and P1 were the most susceptible mixtures at all stages of hydration, displaying very similar shrinkage relative to each other. Figure 12 illustrates the autogenous shrinkage for all mortar mixtures relative OPC.
The chemical compositions of CSA binders may account for differences in their autogenous shrinkage (as shown in Figure 12). Notably, measurements were taken after final setting time, leading to lower values in some cases like C1, C2, and CA2. Shrinkage mostly occurred before final set, making chemical shrinkage measurements more reliable than autogenous shrinkage measurements [70]. Additionally, C1, C2, and CA2 experienced the majority of shrinkage within the initial 48 hours, with minimal change in the following days. CA1, on the other hand, had more prolonged shrinkage due to the continued hydration of calcium silicates. Regression of autogenous shrinkage began around 3 days of hydration in the CA2 sample due to conversion, resulting in water release and a decrease in shrinkage (Figure 12a). Finally, the C3 mixtures saw an increase in expansion for about 7 days of age, followed by no significant change during the test period.
Previous studies conducted by Sirtoli et al. [71] revealed that CSA cement mortar experiences rapid self-desiccation and notable autogenous shrinkage in comparison to OPC mortar. However, blending CSA with OPC can alleviate these effects through a bi-modal shrinkage evolution pattern. In a separate study, Kumarappa and Peethamparan delved further into autogenous shrinkage in Alkali Activated Slag Mortars (AASM) and identified the rate of reaction, internal relative humidity, and pore solution surface tension as key factors [72]. It was discovered that internal curing and shrinkage reducing admixtures are effective in mitigating autogenous shrinkage. Furthermore, Wu et al. highlighted that High-Performance Concrete (HPC) can exacerbate autogenous shrinkage due to low water-to-binder ratios and SCMs [73]. It was suggested various mitigation strategies such as using low-heat cement and fibers. Additionally, Polat demonstrated the potential of micro and nano-sized MgO, CaO, and nano-clay in significantly reducing autogenous shrinkage [74]. The most substantial reductions were observed for mixes containing 7.5% CaO and nano-MgO. The incorporation of carbon nanotubes (CNT) and carbon fibers (CF) was also found to inhibit early hydration reactions, thereby reducing shrinkage. The effects were dependent on the CF to CNT ratio, CF length, and fine aggregate content.
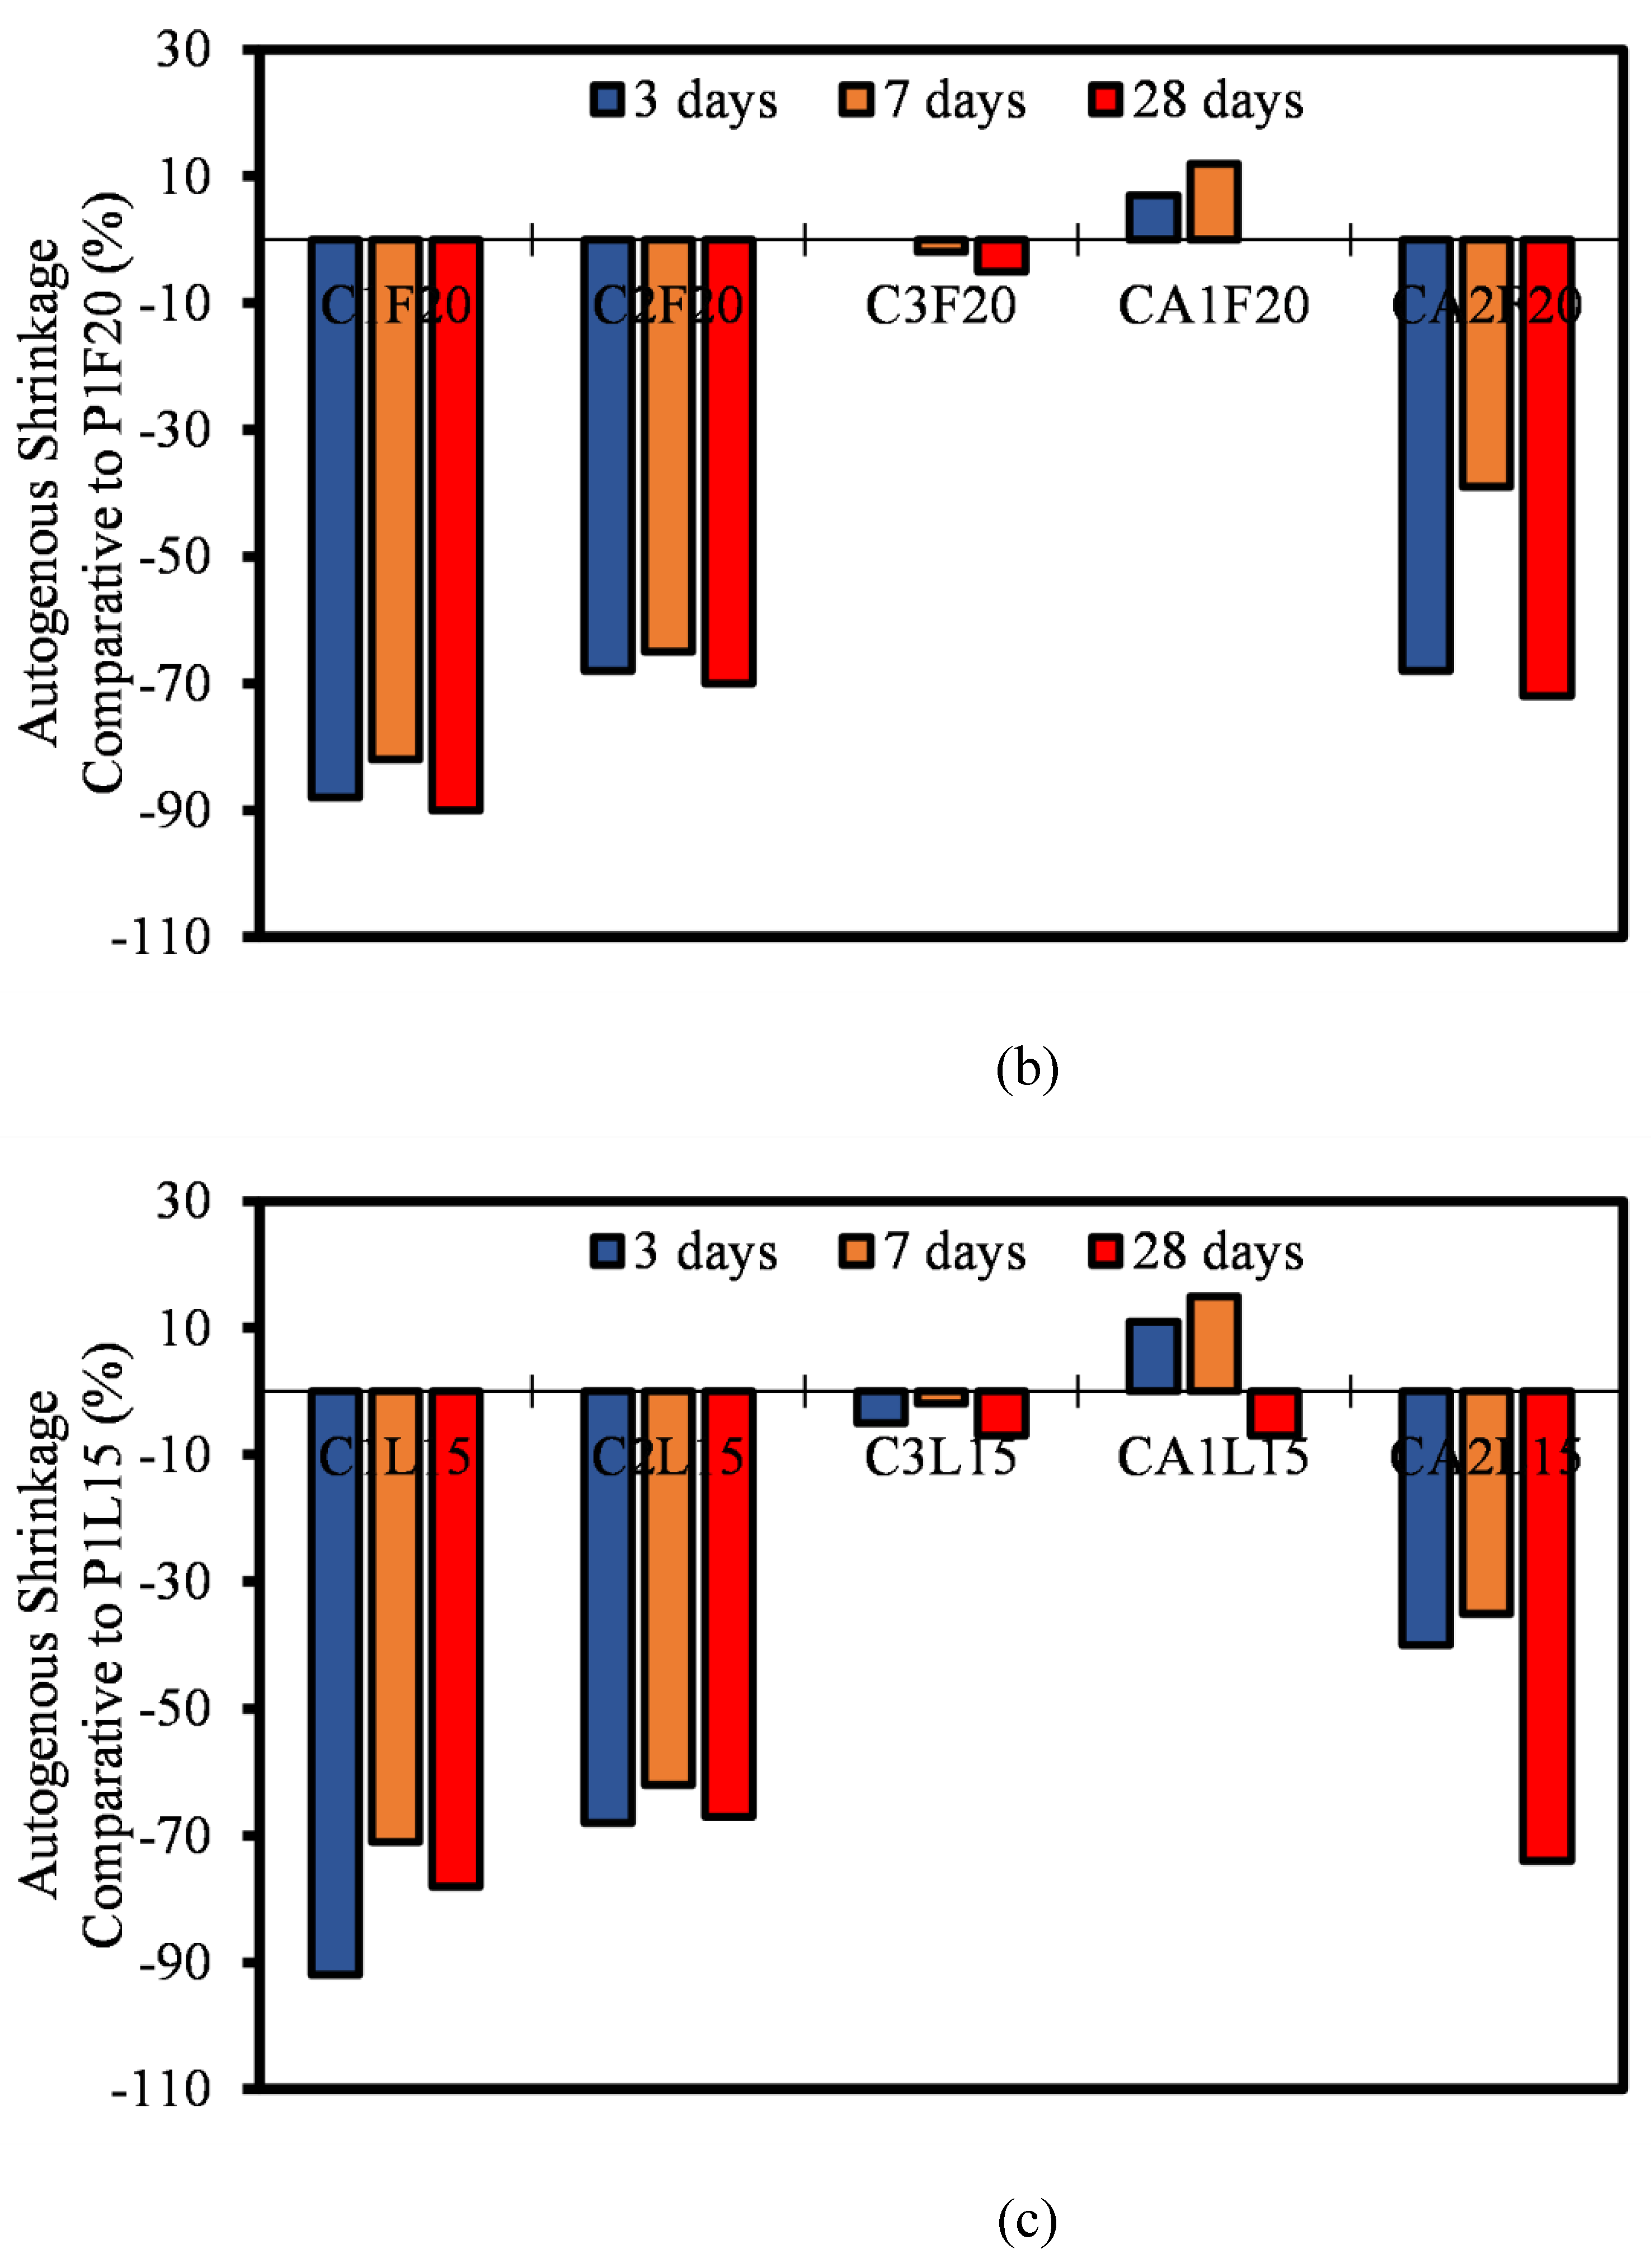
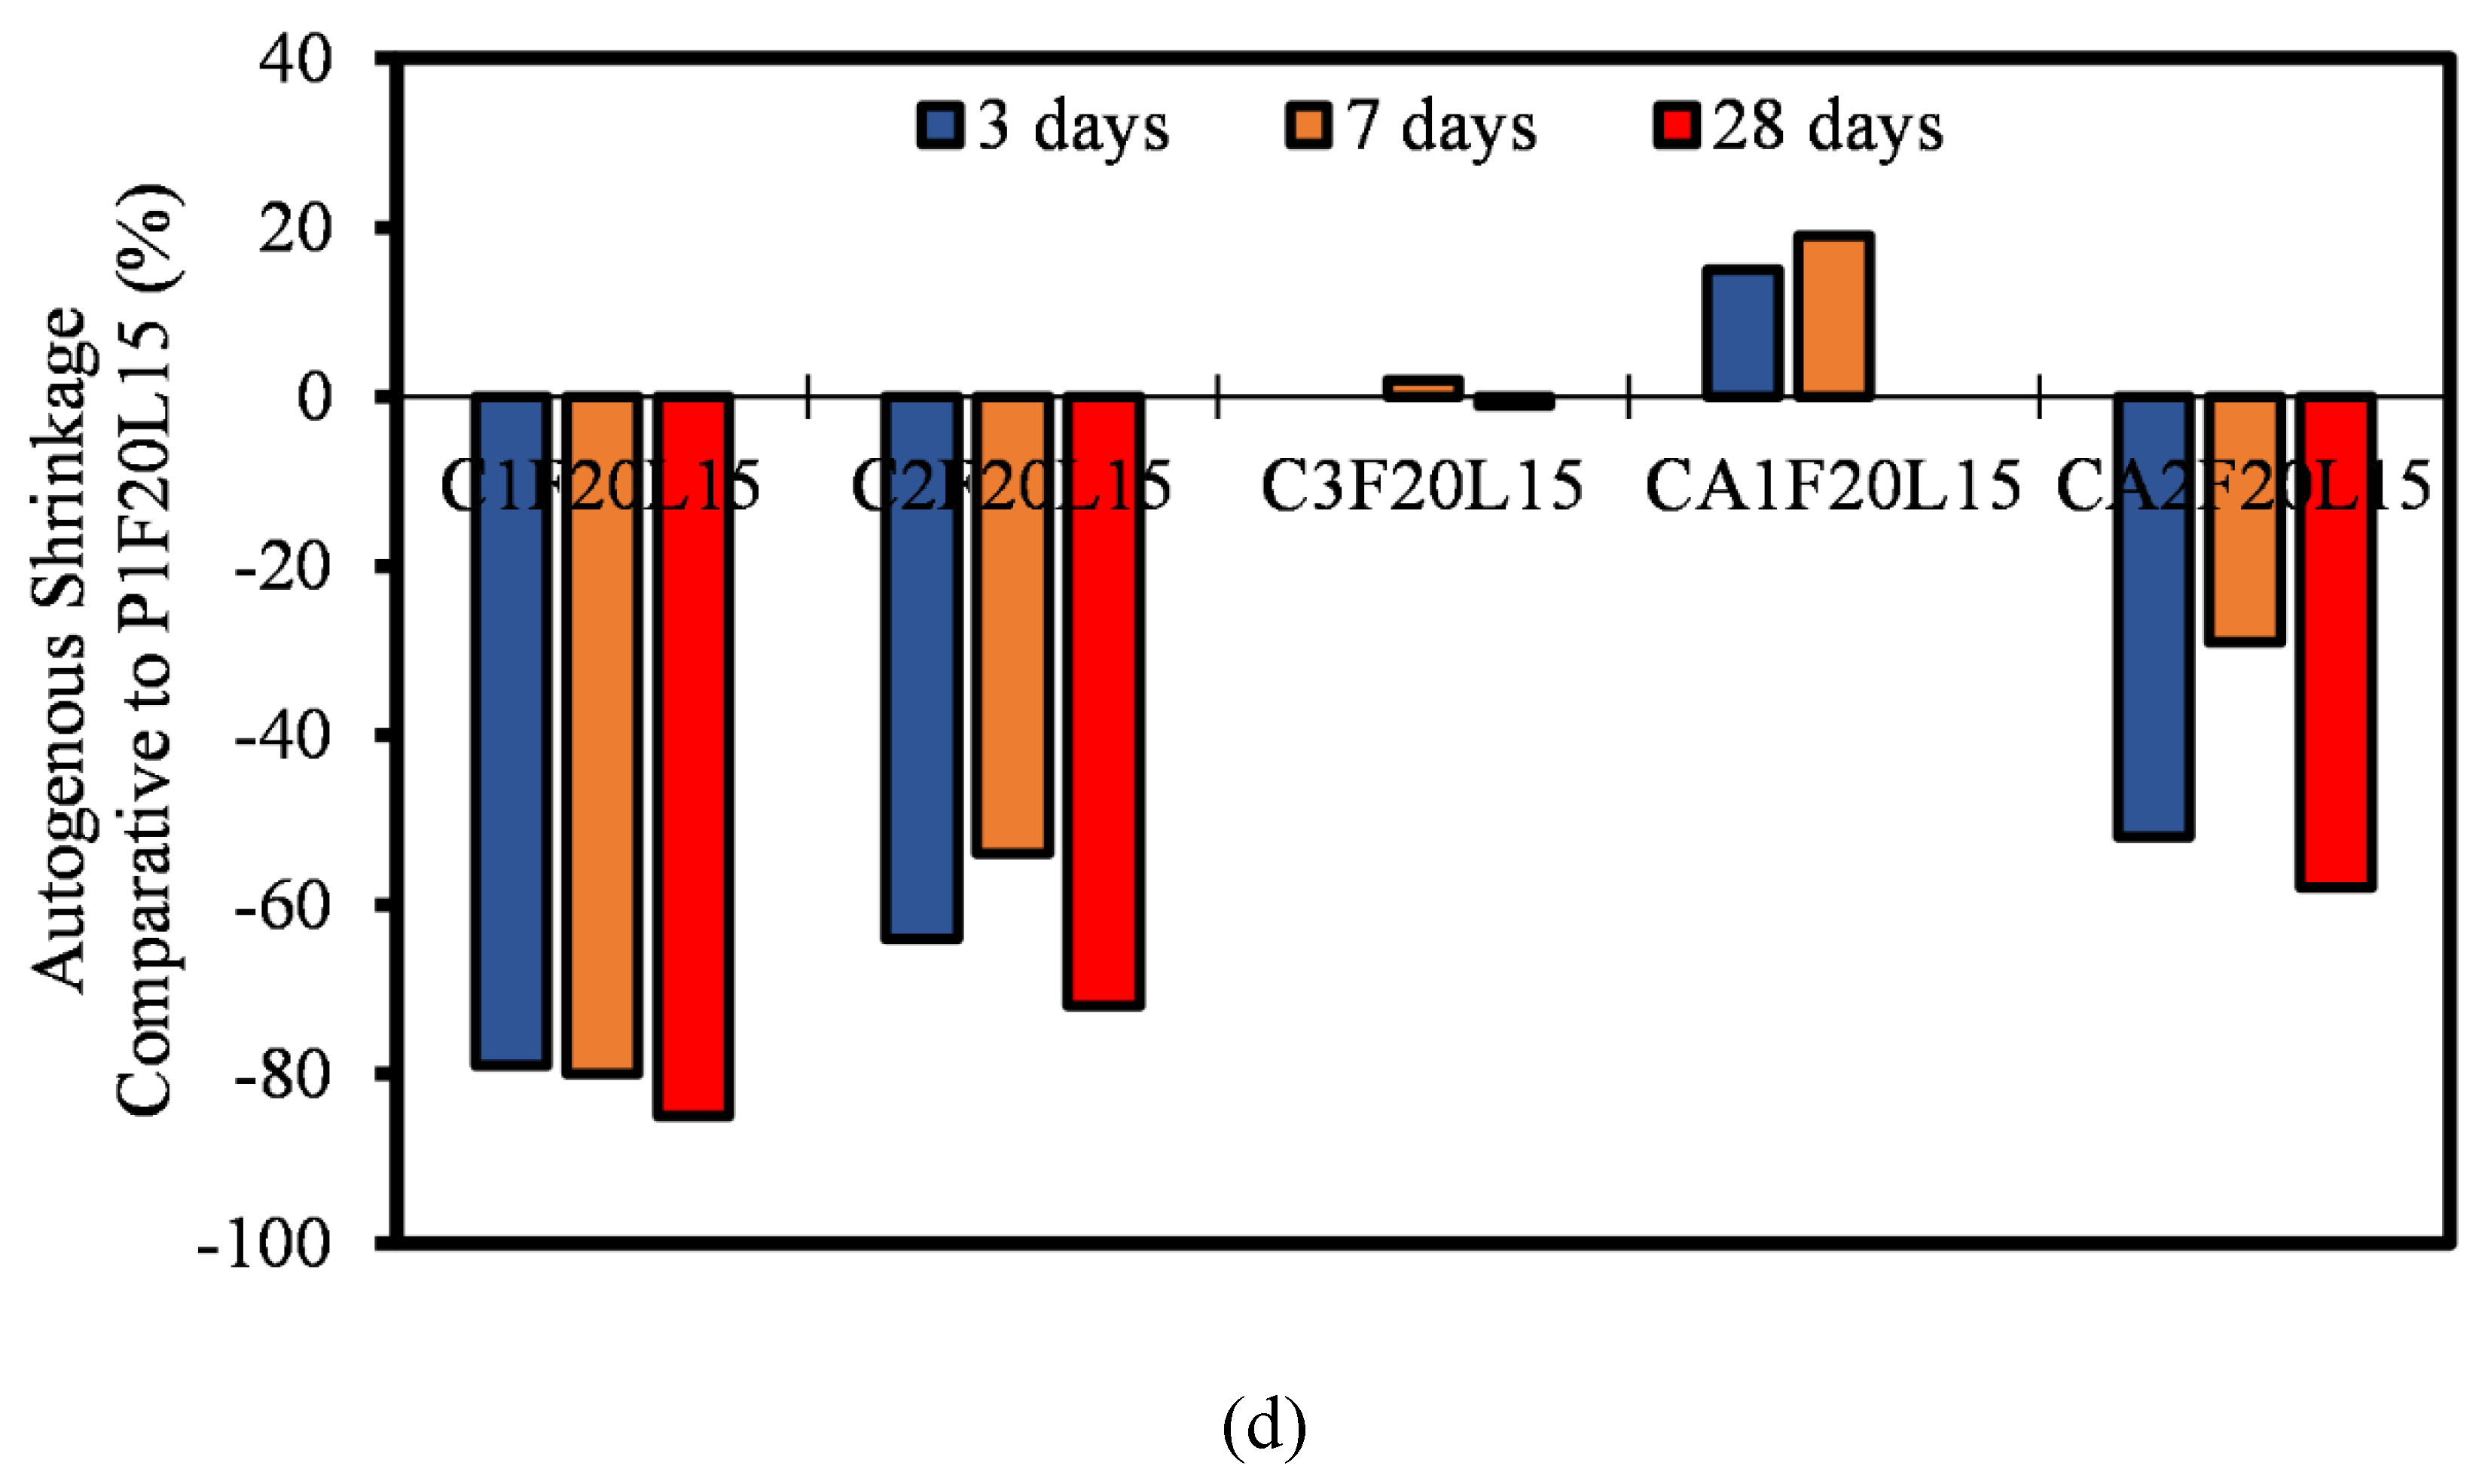
The influence of either FA and LP or combined can be seen in Figure 12b, 12c, and 12d. There is a minimal reduction in the autogenous shrinkage of mortar mixtures incorporating FA and LP compared to the mixtures with no SCM. However, the trend for all these mixtures is similar to each other regardless of the type and percentage of SCM incorporation. LP, a calcium carbonate-based material, serves as a filler in CSA and CAC binder systems. By reducing the capillary pore size and total volume, it enhances the microstructure of the mortar mixtures, resulting in improved volume stability and altered hydration kinetics, leading to the formation of carboaluminate phases that regulate the volume changes in the early setting stages [71,75,76,77]. Furthermore, LP increases the water demand, affecting the degree of shrinkage in the mixture. However, when LP and FA are used in combination, their effects on autogenous shrinkage are nuanced. The filler effect of LP may counterbalance the increased shrinkage caused by the pozzolanic activity of FA [69,75,78,79].

3.7. Microstructural Analysis

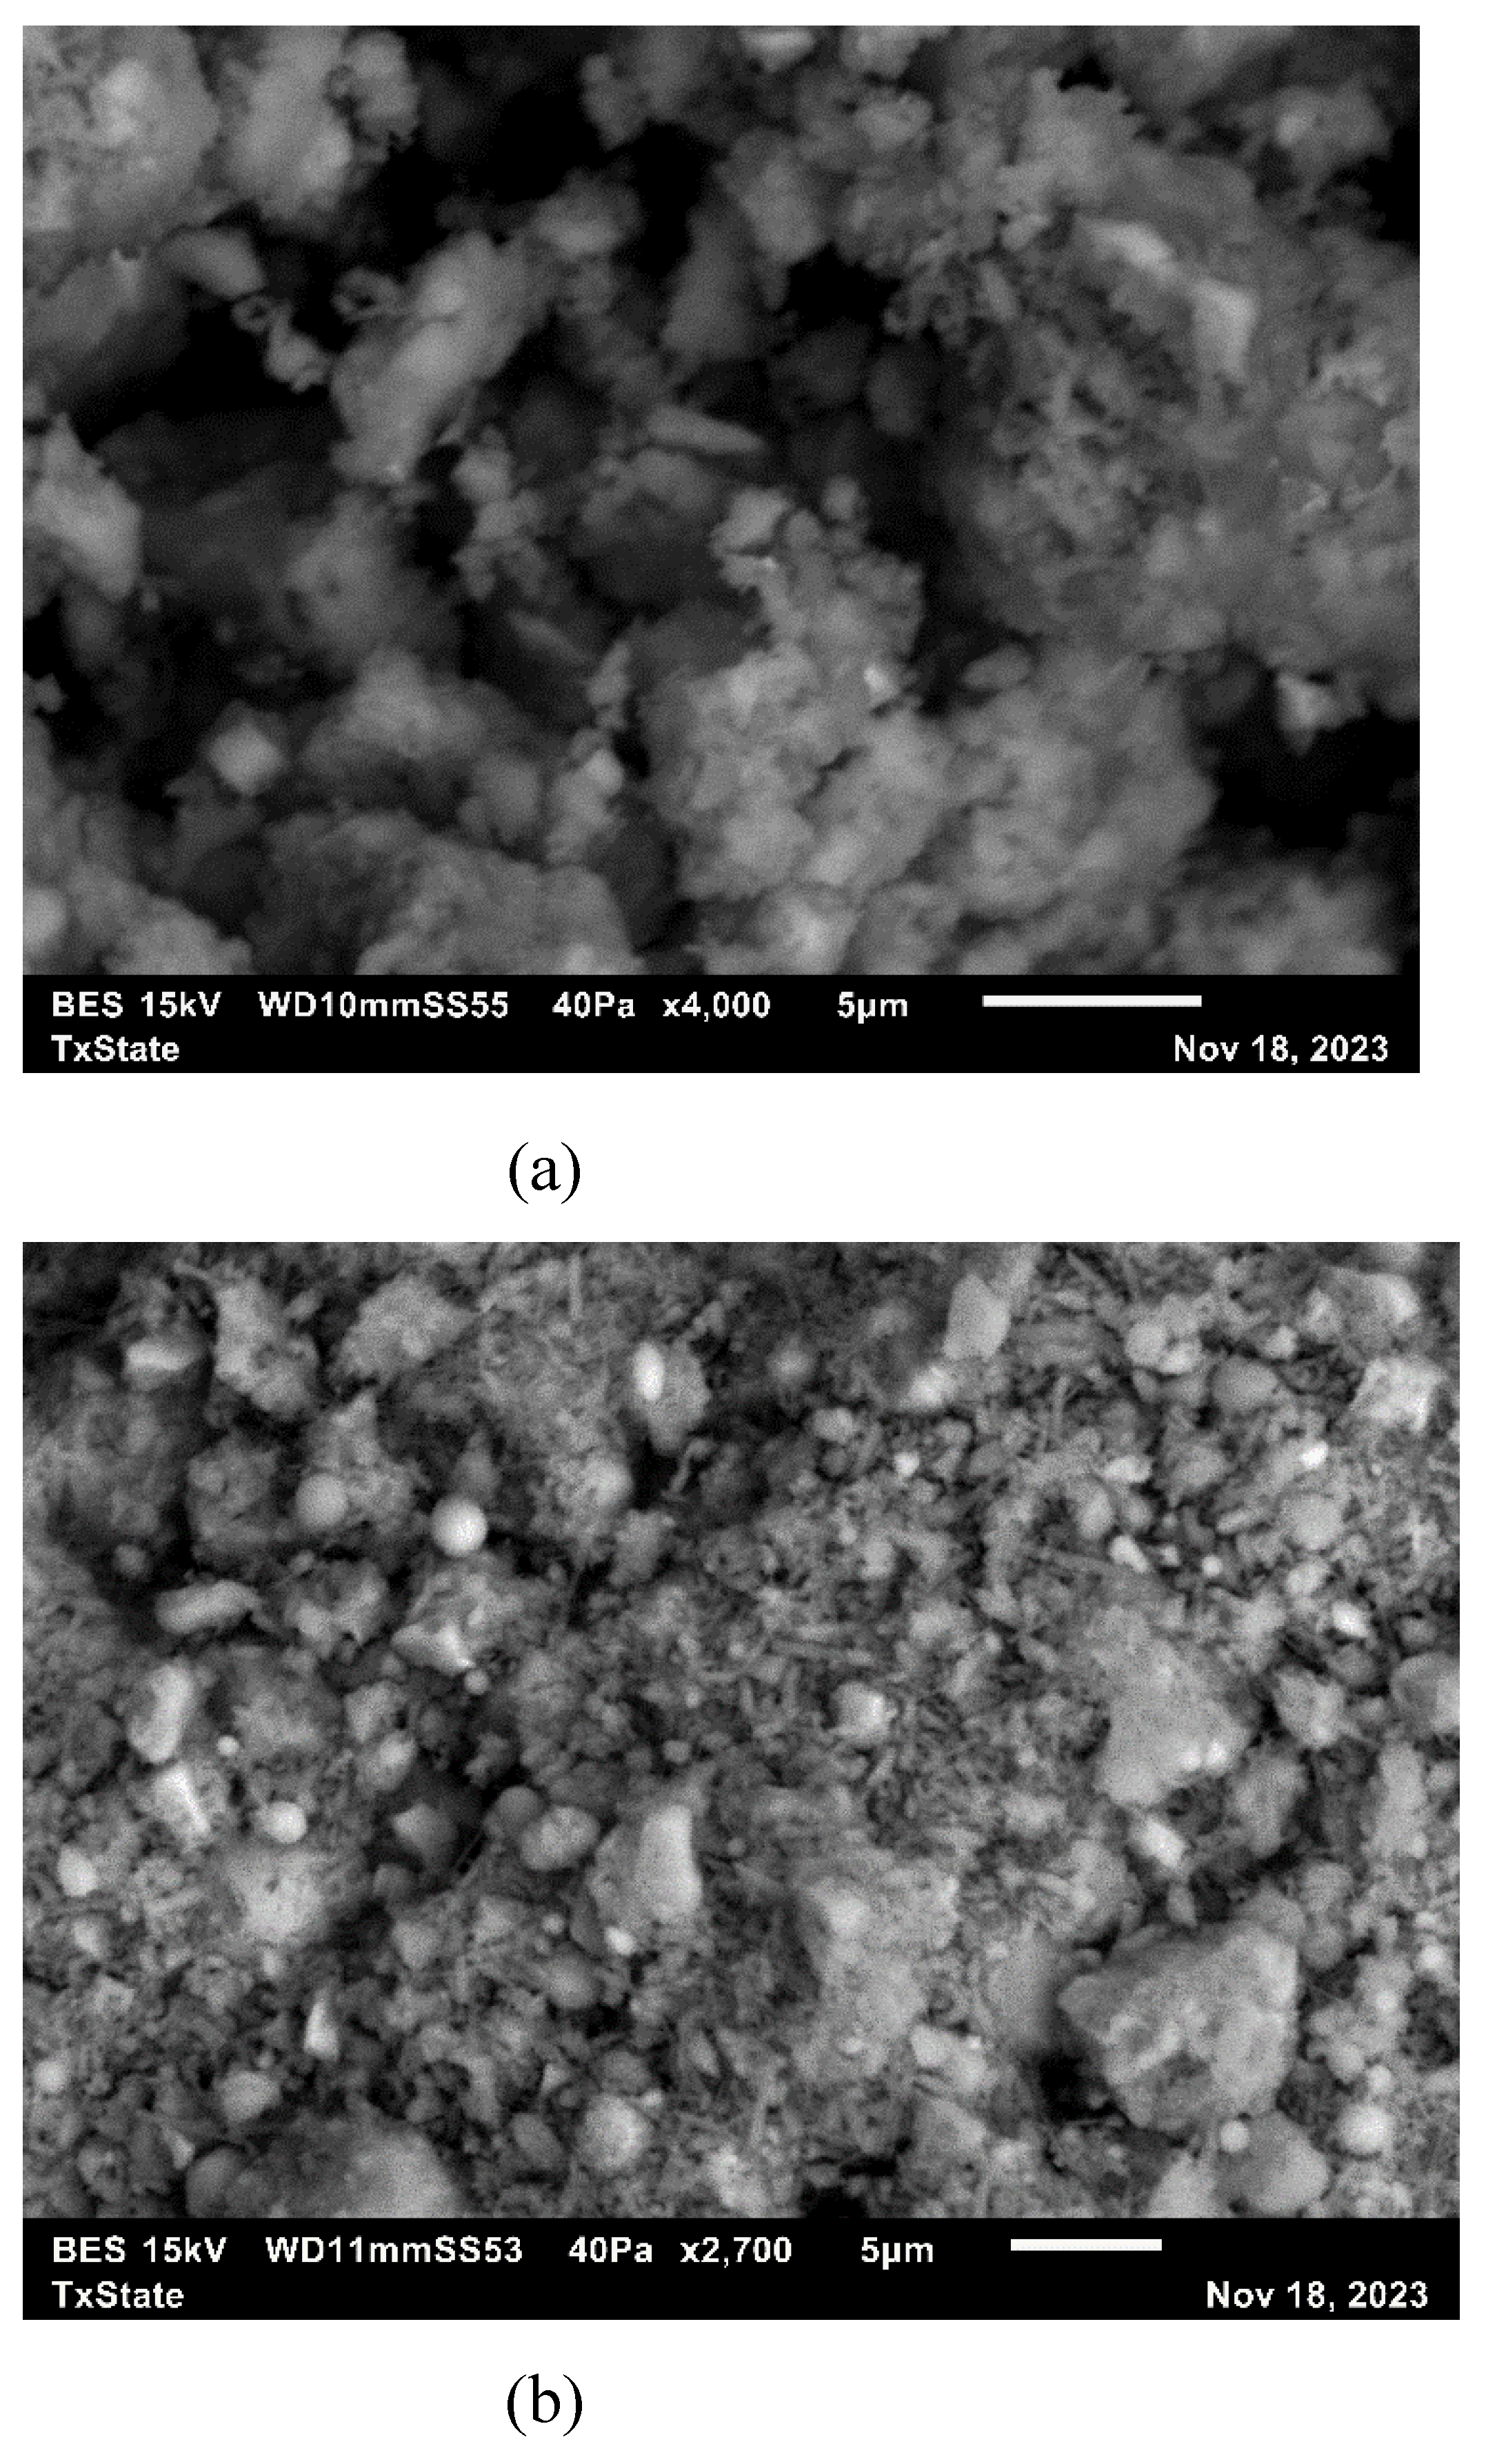
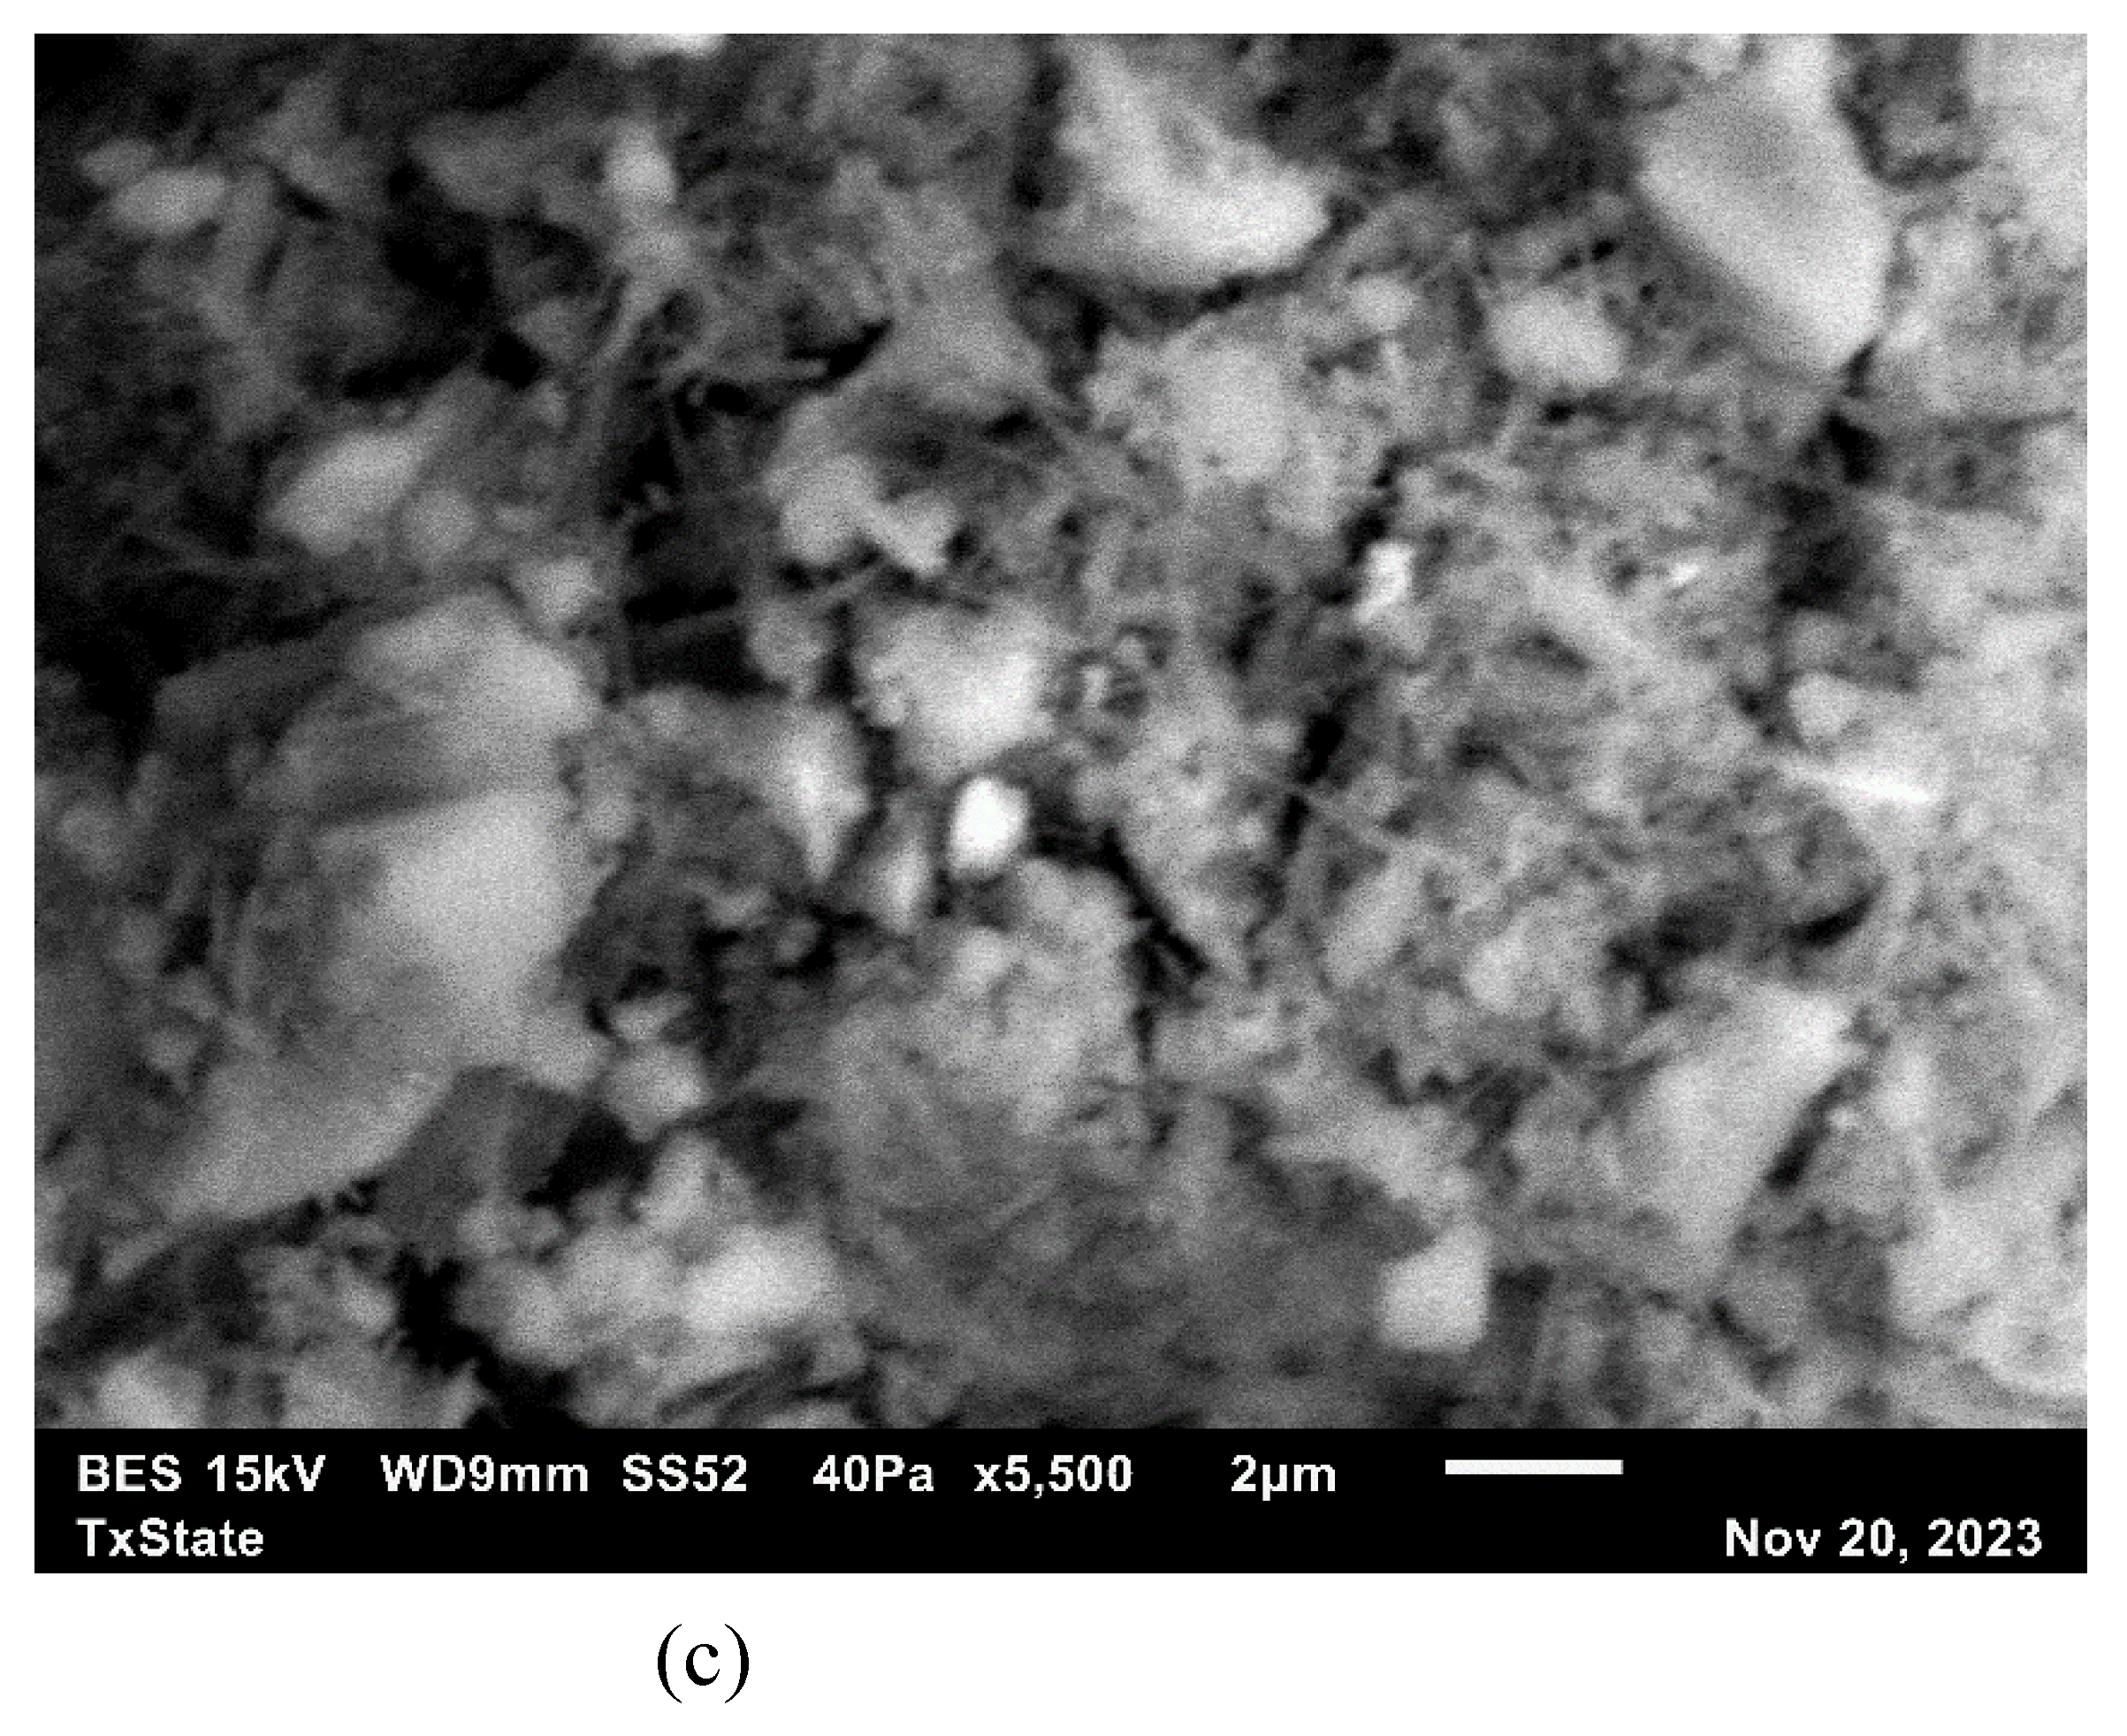
Figure 13 shows the surface morphology of C3, C3F20, and C3L15 mortar mixtures after three days of hydration.
Each mixture is represented by an SEM image in Figure 13a, Figure 13b and Figure 13c. The images reveal that the early stages of hydration produce a denser microstructure in the CSA cement. By day three, calcium hydroxide plates are present alongside crystallized ettringite. The SEM images show the formation of well-distributed, needle-like ettringite structures within the pores.
The observed denser microstructure in CSA cement suggests a more compact matrix, which is usually attributed to improved mechanical properties. A denser structure translates into fewer voids and capillary pores, which leads to less permeability [44]. The presence of Ca(OH)2 plates could have different influences on the mixture. While they indicate continuous hydration, which is necessary for strength development, they can also create planes of weakness within the mixture [80,81]. However, their role in providing sites for secondary hydration reactions, particularly in the presence of pozzolanic materials like fly ash, can contribute to long-term strength gain and durability [81]. The needle-like AFt observed, which are a typical characteristic of CSA cement hydration, are known to contribute to early strength development. These structures can form a reinforcing network within the cement paste, improving the interlocking and, consequently, the mechanical properties [78,79]. Furthermore, the addition of FA (as shown in C3F20) may alter the hydration process by consuming Ca(OH)2 to form additional C-S-H over time, leading to enhanced mechanical properties at later stages of curing. FA particles can also act as micro-fillers, contributing to the density of the mixture [45,80]. LP in the mixture (C3L15) may provide a filler effect that contributes to the densification of the microstructure. The finer particles of LP can fill in the gaps between the cement particles, leading to a more homogeneous and compact matrix, which can translate to increased strength [82].
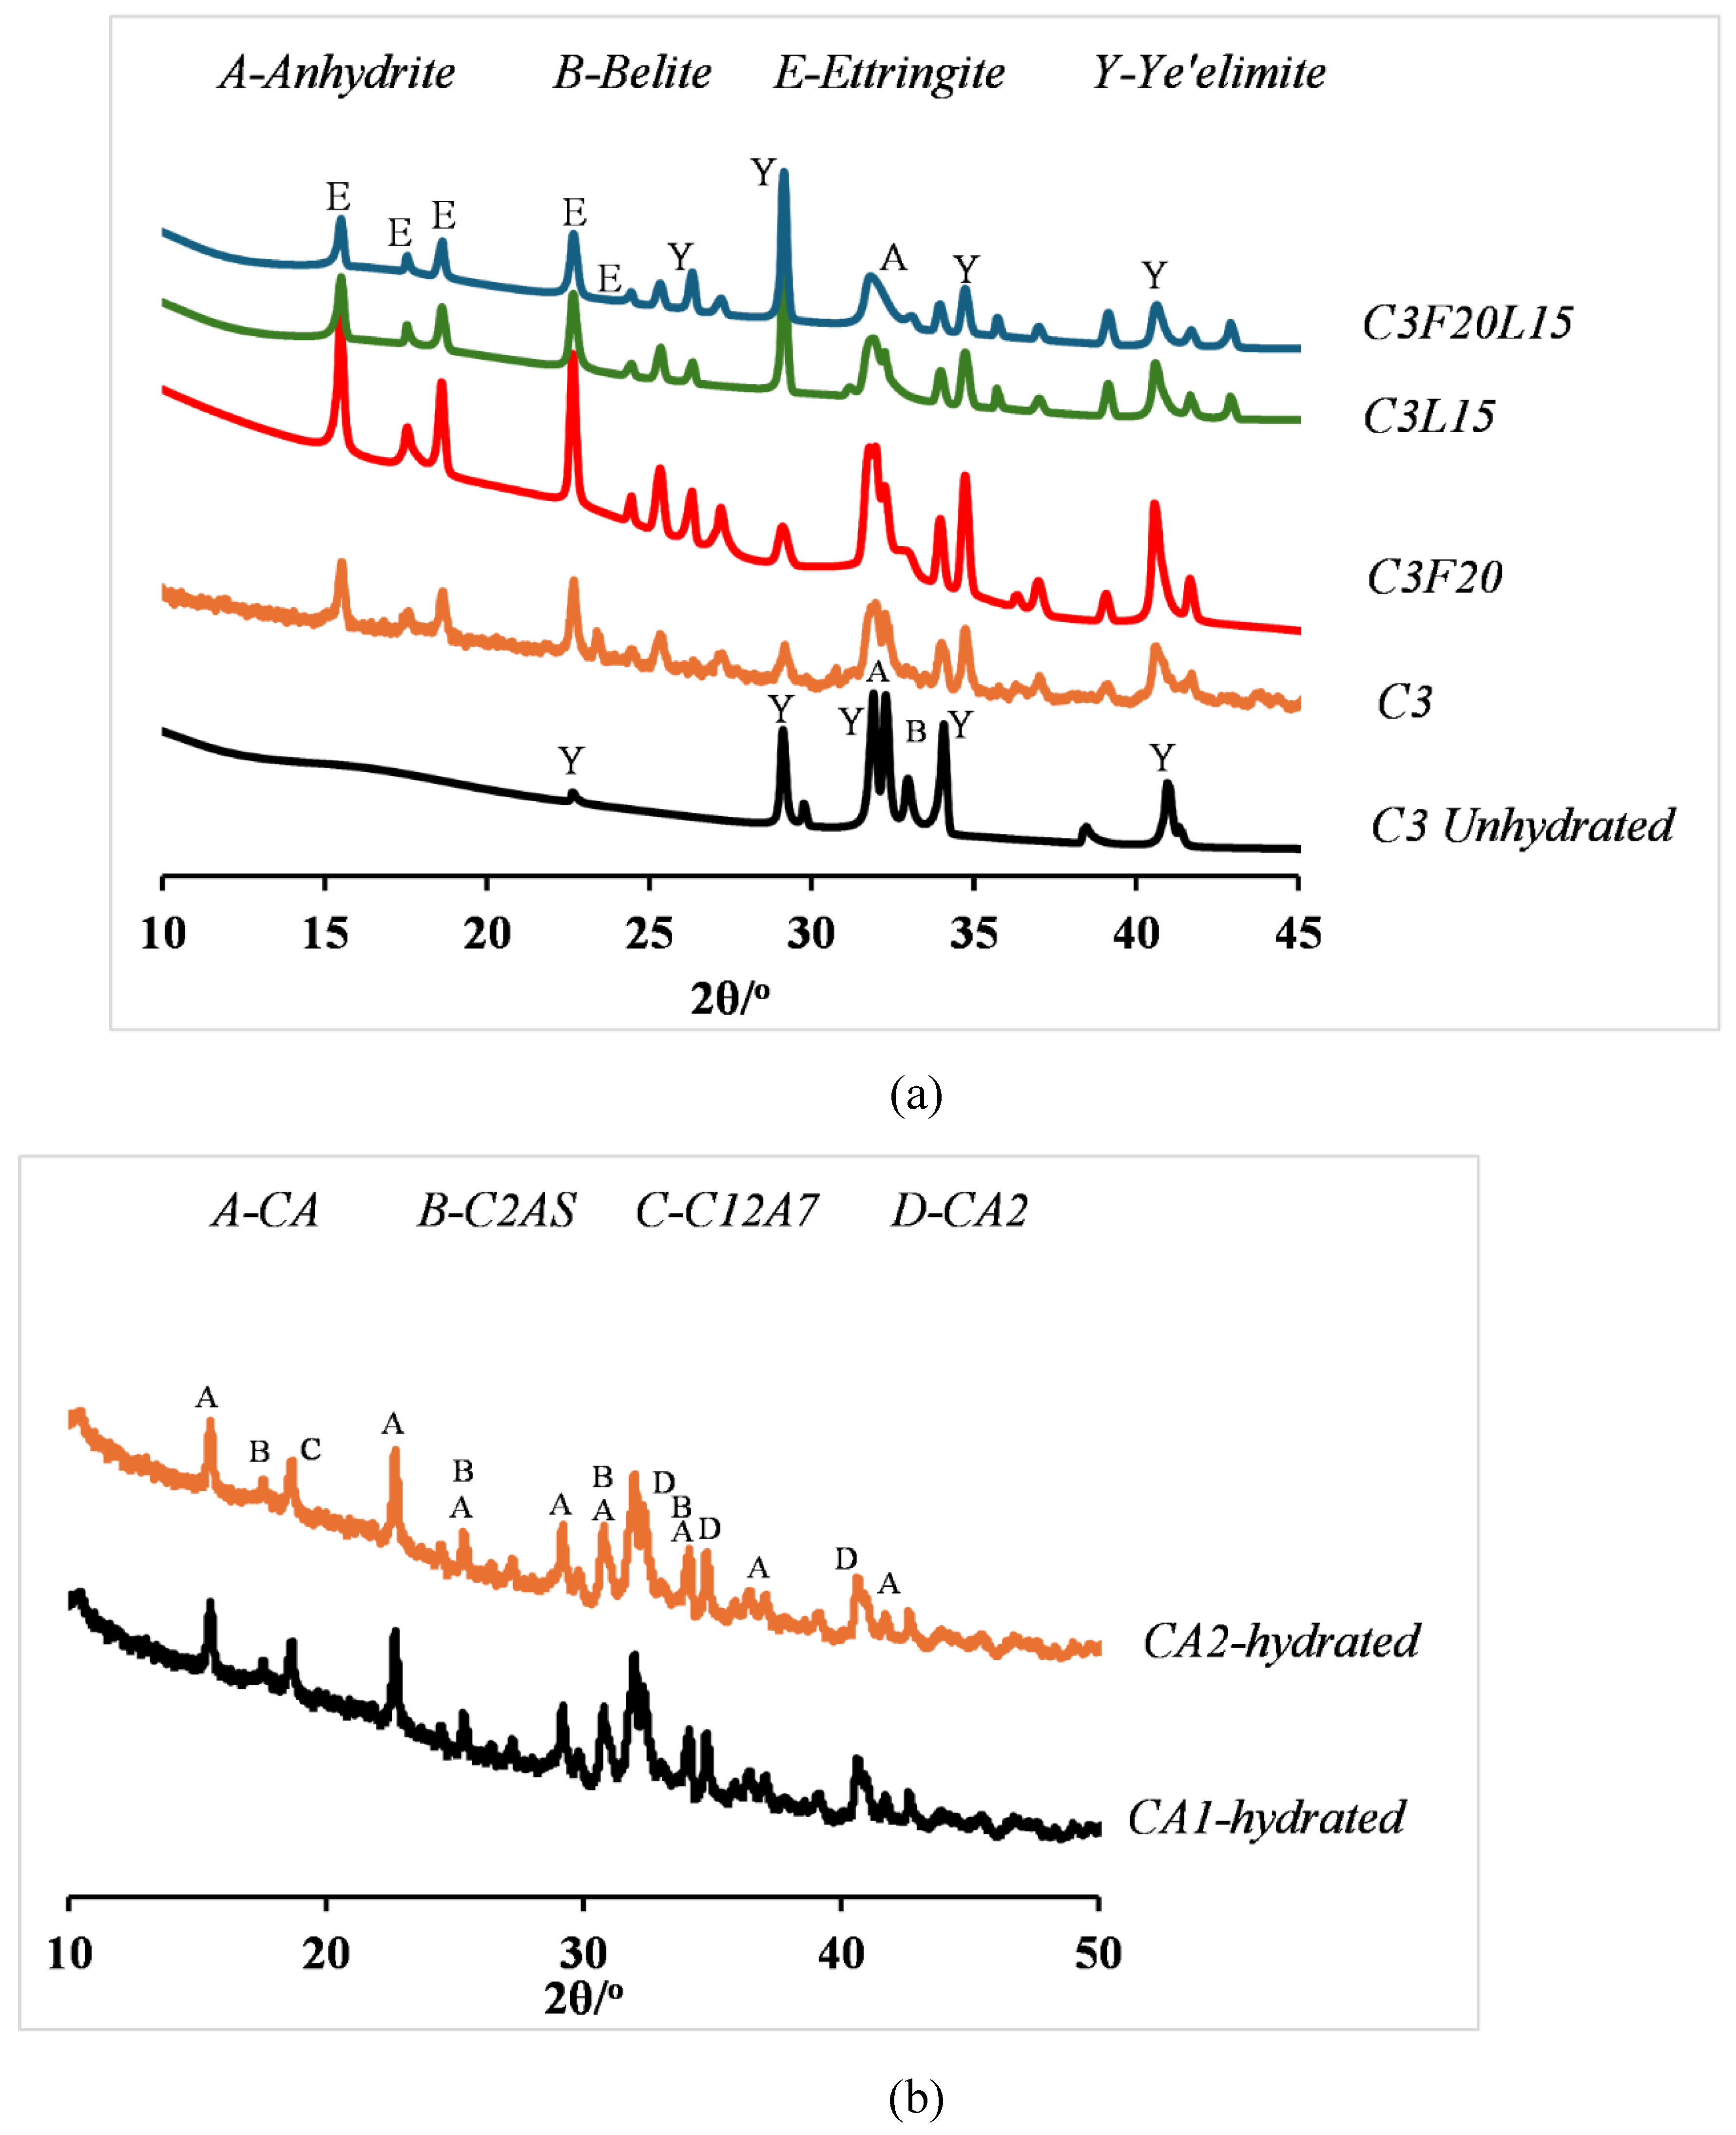
Additionally, the XRD test investigated the crystalline phase composition in hydration products of different samples, with a particular emphasis on the effect of FA and LP on the hydration characteristics of CSA. Samples were labeled as C3, C3F20, C3L15, C3F20L15, CA1, and CA2. Following a three-day curing period, XRD analysis was performed on the samples. Figure 14a provides a thorough analysis of the hydration products of C3 cement pastes systems, containing modified versions of FA and LP.
The findings demonstrate that ettringite is the dominant crystalline phase in the hydration products of C3 cement pastes after three days. The absence of portlandite suggests that the cement's belite content had not yet reacted with water. The consistent intensity peak of belite in the XRD patterns of C3, C3F20, C3L15, C3F20L15 cements, both pre- and post-hydration, supports the conclusion that no significant reaction occurred within the initial three-day period. This observation is consistent with other studies that have shown a delayed hydration process for belite in CSA cement systems [30,83,84]. Meanwhile, Figure 14b illustrates the XRD analysis for CA1 and CA2. The primary component of CA1 and CA2 were found to be CA (Al2CaO4), with smaller amounts of CT (CaTiO3) and C2AS (Ca2Al2SiO7) also present, which is consistent with previously published literature [3,46,48]. The comprehensive composition of CAC mortar mixtures, comprising CA, CT, and C2AS, forms a solid foundation for predicting the hydration behavior and potential mechanical performance of these specific variants [68].
Based on the XRD analysis, the CSA cement mortar's mechanical properties during its initial stages are heavily influenced by the existence of ettringite [79]. Although belite reacts slowly and FA and LP have minimal impact on crystalline phase formation, these mixtures could potentially experience significant strength increases at later ages due to the eventual hydration of belite and the secondary reactions of the SCMs [9]. The exact influence of these SCMs could most likely become more apparent over an extended curing time, affecting significant mechanical properties such as compressive strengths and tensile strengths [9,37]
Furthermore, the thermogravimetric (TG) and derivative thermogravimetry (DTG) profiles of various samples after three days of hydration are presented in Figure 15.
These profiles reveal distinct dehydration behaviors among the samples. The TG-DTG results for the C3 cement paste and its variants with FA and LP exhibit three prominent dehydration rate peaks within the temperature range up to 1000°C. The first peak, occurring at around 100°C, is attributed to the dehydration of ettringite, as shown in Figure 15a. Notably, the rate of weight loss derivative for the CSA cement mixtures surpasses that of the OPC paste. The second peak, at around 250°C, likely represents the decomposition of aluminum hydroxide, Al(OH)₃. This observation is consistent with previous research that postulates the formation of ettringite following the production of Al (OH)₃ in CSA cement paste systems [30,83,84].
It has been observed that in the temperature range of 300°C to 600°C, there is no significant dehydration peaks in the CSA cement paste systems. This suggests that the hydration products of the CSA pastes during this temperature range do not include the Ca(OH)₂ and C-S-H gel. However, at approximately 780°C, a dehydration peak is noted for the C3 cement paste systems and their variants. This peak may be due to the decomposition of sulfoaluminate and monosulfate (AFm) phases formed during the ion diffusion-controlled hydration stage of the CSA paste through thermal and chemical processes. After 3-days of age, the primary hydration products in the CSA cement pastes are identified as ettringite (AFt), Al(OH)₃, and AFm. The incorporation of SCMs like FA and LP has limited impact on the hydration products of CSA pastes at this stage. However, the weight loss varies among the different mixtures, with the order of decreasing weight reduction being C3F20 > C3F20L15 > C3 > C2L15, as demonstrated in Figure 15b. The variation in weight loss, influenced by the addition of SCMs, reflects the differing initial mineral compositions of the binders [28,37,84,85]. It is important to note that weight reduction alone does not definitively indicate enhanced cement hydration or the presence of more hydration products and should be interpreted with caution.
The observed variations in weight loss among the mixtures and their descending order of weight reduction suggest discrepancies in the level of hydrate formation. It could be possible that mixtures with higher weight loss have a larger volume of hydration products that contribute to mechanical strength, such as AFt [44]. This further suggests that CSA cement mortar may possess favorable early-age mechanical properties due to the formation of AFt and the filling effect of aluminum hydroxide as observed in the compressive strength study [30,83,84]. However, the absence of CaOH and C-S-H gel could imply that other mechanisms are responsible for long-term strength development. The presence of SCMs has the potential to alter the volume of hydration products as seen in the weight loss data, which could impact the mechanical properties in the later stages, particularly through secondary reactions and enhanced mixture density [44].

4. Conclusions

The current study evaluates the performance of CAC and CSA cement mortar incorporating FA and LP.
  • The findings show that there is a correlation between the mechanical properties of both CSA and CAC cement mortars. There is a clear correlation between the compressive strength, flexural and the direct tensile strengths of the mortars. Similar relationship can be said for the compressive strength and the setting time of the mortar systems.
  • Furthermore, the ASR of most CSA and CAC was lower than the 0.10% ASR recommendation. Most of the mixtures remained under innocuous conditions at 14 days of testing and only C1F20 and CA1F20 (FA incorporated samples) showed a slight expansion increase at 28 days of measurement.
  • The incorporation of FA into CSA cement mortar serves a multifaceted role in mitigating ASR, a destructive chemical process leading to the expansion and cracking of the mortar. LP also reduced the risk of ASR by helping to mitigate length expansion and deleterious behavior of the mixtures as reported. Similarly, the reactivity of the fine aggregate used was regarded as low, hence could be attributed to the low reactivity of the cementitious binders.
  • Most of the autogenous shrinkage for both CAC and CSA mortar mixtures had a lower autogenous shrinkage relative to OPC. The influence of the SCMs (FA and LP) was evident, even though there wasn’t significant reduction in the rate of autogenous shrinkage. It can be concluded that, at early ages, the reaction in autogenous shrinkage is usually only dependent on the hydration and mechanism of only the pure binders. The effect of FA and LP is believed to come into play after 28 days of age.
  • Finally, these findings are significant for the cement and concrete industries, highlighting the potential of CAC and CSA mortars incorporating FA and LP in creating more sustainable, durable, and resilient building materials. This study not only provides valuable data on the mechanical and durability properties of these different mortar systems but also emphasizes areas for future research, especially in understanding the long-term effects of SCMs on CSA and CAC mortar performance. Such knowledge advances contribute to current literature and the capacity to construct sustainably and effectively, addressing global environmental issues while ensuring structural integrity.

References

  1. P. Hawkins, P. Tennis, R. Detwiler, The Use of Limestone in Portland Cement: A State-of-the-Art Review, 2003.
  2. J.B.S. Eikeland Per Ove, Corporate Responses to EU Emissions Trading: Resistance, Innovation or Responsibility?, Routledge, London, 2016. [CrossRef]
  3. Oliveira, I.; Ortega, F.; Pandolfelli, V. Hydration of CAC cement in a castable refractory matrix containing processing additives. Ceram. Int. 2009, 35, 1545–1552. [Google Scholar] [CrossRef]
  4. Telesca, A.; Marroccoli, M.; Pace, M.; Tomasulo, M.; Valenti, G.; Monteiro, P. A hydration study of various calcium sulfoaluminate cements. Cem. Concr. Compos. 2014, 53, 224–232. [Google Scholar] [CrossRef]
  5. Gartner, E. Industrially interesting approaches to ‘low-CO2’ cements. Cem. Concr. Res. 2004, 34, 1489–1498. [Google Scholar] [CrossRef]
  6. Sharp, J.H.; Lawrence, C.D.; Yang, R. Calcium sulfoaluminate cements—low-energy cements, special cements or what? Adv. Cem. Res. 1999, 11, 3–13. [Google Scholar] [CrossRef]
  7. Glasser, F.; Zhang, L. High-performance cement matrices based on calcium sulfoaluminate–belite compositions. Cem. Concr. Res. 2001, 31, 1881–1886. [Google Scholar] [CrossRef]
  8. Zhang, L.; Glasser, F.P. Investigation of the microstructure and carbonation of CS¯A-based concretes removed from service. Cem. Concr. Res. 2005, 35, 2252–2260. [Google Scholar] [CrossRef]
  9. Gastaldi, D.; Paul, G.; Marchese, L.; Irico, S.; Boccaleri, E.; Mutke, S.; Buzzi, L.; Canonico, F. Hydration products in sulfoaluminate cements: Evaluation of amorphous phases by XRD/solid-state NMR. Cem. Concr. Res. 2016, 90, 162–173. [Google Scholar] [CrossRef]
  10. García-Maté, M.; De la Torre, A.; León-Reina, L.; Aranda, M.; Santacruz, I. Hydration studies of calcium sulfoaluminate cements blended with fly ash. Cem. Concr. Res. 2013, 54, 12–20. [Google Scholar] [CrossRef]
  11. Fan, W.; Zhuge, Y.; Ma, X.; Chow, C.W.; Gorjian, N. Strain hardening behaviour of PE fibre reinforced calcium aluminate cement (CAC) – Ground granulated blast furnace (GGBFS) blended mortar. Constr. Build. Mater. 2020, 241, 118100. [Google Scholar] [CrossRef]
  12. Voegel, C.; Giroudon, M.; Bertron, A.; Patapy, C.; Matthieu, P.L.; Verdier, T.; Erable, B. Cementitious materials in biogas systems: Biodeterioration mechanisms and kinetics in CEM I and CAC based materials. Cem. Concr. Res. 2019, 124. [Google Scholar] [CrossRef]
  13. J. Bizzozero, Hydration and dimensional stability of calcium aluminate cement based systems, EPFL, 2014. [CrossRef]
  14. Calcium aluminate, expansive and other cements, Default Book Series (n.d.). [CrossRef]
  15. Midgley, H.G.; Midgley, A. The conversion of high alumina cement. Mag. Concr. Res. 1975, 27, 59–77. [Google Scholar] [CrossRef]
  16. Shirani, S.; Cuesta, A.; De la Torre, A.; Diaz, A.; Trtik, P.; Holler, M.; Aranda, M. Calcium aluminate cement conversion analysed by ptychographic nanotomography. Cem. Concr. Res. 2020, 137, 106201. [Google Scholar] [CrossRef]
  17. Pelletier-Chaignat, L.; Winnefeld, F.; Lothenbach, B.; Müller, C.J. Beneficial use of limestone filler with calcium sulphoaluminate cement. Constr. Build. Mater. 2012, 26, 619–627. [Google Scholar] [CrossRef]
  18. Martin, L.H.; Winnefeld, F.; Müller, C.J.; Lothenbach, B. Contribution of limestone to the hydration of calcium sulfoaluminate cement. Cem. Concr. Compos. 2015, 62, 204–211. [Google Scholar] [CrossRef]
  19. Hargis, C.W.; Telesca, A.; Monteiro, P.J. Calcium sulfoaluminate (Ye'elimite) hydration in the presence of gypsum, calcite, and vaterite. Cem. Concr. Res. 2014, 65, 15–20. [Google Scholar] [CrossRef]
  20. Živica, V. Properties of blended sulfoaluminate belite cement. Constr. Build. Mater. 2000, 14, 433–437. [Google Scholar] [CrossRef]
  21. De Weerdt, K.; Ben Haha, M.; Le Saout, G.; Kjellsen, K.; Justnes, H.; Lothenbach, B. Hydration mechanisms of ternary Portland cements containing limestone powder and fly ash. Cem. Concr. Res. 2011, 41, 279–291. [Google Scholar] [CrossRef]
  22. Baert, G.; Hoste, S.; De Schutter, G.; De Belie, N. Reactivity of fly ash in cement paste studied by means of thermogravimetry and isothermal calorimetry. J. Therm. Anal. Calorim. 2008, 94, 485–492. [Google Scholar] [CrossRef]
  23. B. Lothenbach, K. Scrivener, R. Hooton, Supplementary cementitious materials, Cement and Concrete Research 41 (2011) 1244–1256.
  24. Rahhal, V.; Talero, R. Calorimetry of Portland cement with metakaolins, quartz and gypsum additions. J. Therm. Anal. Calorim. 2008, 91, 825–834. [Google Scholar] [CrossRef]
  25. Hwang, C.-L.; Shen, D.-H. The effects of blast-furnace slag and fly ash on the hydration of portland cement. Cem. Concr. Res. 1991, 21, 410–425. [Google Scholar] [CrossRef]
  26. Ioannou, S.; Reig, L.; Paine, K.; Quillin, K. Properties of a ternary calcium sulfoaluminate–calcium sulfate–fly ash cement. Cem. Concr. Res. 2014, 56, 75–83. [Google Scholar] [CrossRef]
  27. Ma, B.; Li, X.; Shen, X.; Mao, Y.; Huang, H. Enhancing the addition of fly ash from thermal power plants in activated high belite sulfoaluminate cement. Constr. Build. Mater. 2014, 52, 261–266. [Google Scholar] [CrossRef]
  28. Winnefeld, F.; Lothenbach, B. Hydration of calcium sulfoaluminate cements — Experimental findings and thermodynamic modelling. Cem. Concr. Res. 2009, 40, 1239–1247. [Google Scholar] [CrossRef]
  29. Andac, M.; Glasser, F.P. Pore solution composition of calcium sulfoaluminate cement. Adv. Cem. Res. 1999, 11, 23–26. [Google Scholar] [CrossRef]
  30. Martin, L.H.; Winnefeld, F.; Tschopp, E.; Müller, C.J.; Lothenbach, B. Influence of fly ash on the hydration of calcium sulfoaluminate cement. Cem. Concr. Res. 2017, 95, 152–163. [Google Scholar] [CrossRef]
  31. Collepardi, M.; Monosi, S.; Piccioli, P. The influence of pozzolanic materials on the mechanical stability of aluminous cement. Cem. Concr. Res. 1995, 25, 961–968. [Google Scholar] [CrossRef]
  32. López-Zaldívar, O.; Lozano-Díez, R.; Verdú-Vázquez, A.; Llauradó-Pérez, N. Effects of the addition of inertized MSW fly ash on calcium aluminate cement mortars. Constr. Build. Mater. 2017, 157, 1106–1116. [Google Scholar] [CrossRef]
  33. Pyatina, T.; Sugama, T. Acid resistance of calcium aluminate cement–fly ash F blends. Adv. Cem. Res. 2016, 28, 433–457. [Google Scholar] [CrossRef]
  34. Standard Guide for Reducing the Risk of Deleterious Alkali-Aggregate Reaction in Concrete, (n.d.). https://www.astm.org/c1778-23.html (accessed February 21, 2024).
  35. Ma, B.; Ma, M.; Shen, X.; Li, X.; Wu, X. Compatibility between a polycarboxylate superplasticizer and the belite-rich sulfoaluminate cement: Setting time and the hydration properties. Constr. Build. Mater. 2014, 51, 47–54. [Google Scholar] [CrossRef]
  36. Zajac, M.; Skocek, J.; Bullerjahn, F.; Ben Haha, M. Effect of retarders on the early hydration of calcium-sulpho-aluminate (CSA) type cements. Cem. Concr. Res. 2016, 84, 62–75. [Google Scholar] [CrossRef]
  37. Brien, J.V.; Henke, K.R.; Mahboub, K.C. OBSERVATIONS OF PEAK STRENGTH BEHAVIOR IN CSA CEMENT MORTARS. J. Green Build. 2013, 8, 97–115. [Google Scholar] [CrossRef]
  38. Zhang, L.; Glasser, F.P. Hydration of calcium sulfoaluminate cement at less than 24 h. Adv. Cem. Res. 2002, 14, 141–155. [Google Scholar] [CrossRef]
  39. Sahu, S.; Havlica, J.; Tomková, V.; Majling, J. Hydration behaviour of sulphoaluminate belite cement in the presence op various calcium sulphates. Thermochim. Acta 1991, 175, 45–52. [Google Scholar] [CrossRef]
  40. Cheung, J.; Jeknavorian, A.; Roberts, L.; Silva, D. Impact of admixtures on the hydration kinetics of Portland cement. Cem. Concr. Res. 2011, 41, 1289–1309. [Google Scholar] [CrossRef]
  41. Bullerjahn, F.; Zajac, M.; Skocek, J.; Ben Haha, M. The role of boron during the early hydration of belite ye’elimite ferrite cements. Constr. Build. Mater. 2019, 215, 252–263. [Google Scholar] [CrossRef]
  42. Zou, F.; Tan, H.; Guo, Y.; Ma, B.; He, X.; Zhou, Y. Effect of sodium gluconate on dispersion of polycarboxylate superplasticizer with different grafting density in side chain. J. Ind. Eng. Chem. 2017, 55, 91–100. [Google Scholar] [CrossRef]
  43. Sun, Z.; Zhou, J.; Qi, Q.; Li, H.; Zhang, N.; Mu, R. Influence of Fly Ash on Mechanical Properties and Hydration of Calcium Sulfoaluminate-Activated Supersulfated Cement. Materials 2020, 13, 2514. [Google Scholar] [CrossRef]
  44. Guo, X.; Shi, H.; Hu, W.; Wu, K. Durability and microstructure of CSA cement-based materials from MSWI fly ash. Cem. Concr. Compos. 2013, 46, 26–31. [Google Scholar] [CrossRef]
  45. Markosian, N.; Tawadrous, R.; Mastali, M.; Thomas, R.J.; Maguire, M. Performance Evaluation of a Prestressed Belitic Calcium Sulfoaluminate Cement (BCSA) Concrete Bridge Girder. Sustainability 2021, 13, 7875. [Google Scholar] [CrossRef]
  46. Dunster, I. Holton, A laboratory study of the resistance of CAC concretes to chemical attack by sulphate and alkali carbonate solutions, in: 2001: pp. 333–348.
  47. Soroka, I.; Stern, N. Calcareous fillers and the compressive strength of portland cement. Cem. Concr. Res. 1976, 6, 367–376. [Google Scholar] [CrossRef]
  48. L. Amathieu, T. Bier, K. Scrivener, Mechanisms of set acceleration of Portland cement through CAC addition, International Conference on Calcium Aluminate Cements (2001) 303–317.
  49. Ali, M.; Gopal, S.; Handoo, S. Studies on the formation kinetics of calcium sulphoaluminate. Cem. Concr. Res. 1994, 24, 715–720. [Google Scholar] [CrossRef]
  50. Rodrıguez, R.; Gutierrez, I. Correlation between nanoindentation and tensile propertiesInfluence of the indentation size effect. Mater. Sci. Eng. A 2003, 361, 377–384. [Google Scholar] [CrossRef]
  51. Brien, J.V.; Henke, K.R.; Mahboub, K.C. INFLUENCE OF LATEX POLYMER ADDITION ON THE BEHAVIOR OF MATERIALS CONTAINING CSA CEMENT CURED AT LOW HUMIDITY. J. Green Build. 2013, 8, 94–109. [Google Scholar] [CrossRef]
  52. Dashti, J.; Nematzadeh, M. Compressive and direct tensile behavior of concrete containing Forta-Ferro fiber and calcium aluminate cement subjected to sulfuric acid attack with optimized design. Constr. Build. Mater. 2020, 253, 118999. [Google Scholar] [CrossRef]
  53. AS 3600:2018 | Concrete Structures, Steel & Tendons | SAI Global, (n.d.). https://infostore.saiglobal.com/en-us/Standards/AS-3600-2018-98877_SAIG_AS_AS_207930/ (accessed January 25, 2024).
  54. ACI: Building code requirements for structural concrete... - Google Scholar, (n.d.). https://scholar.google.com/scholar_lookup?title=%E2%80%9C318-11%3A+Building+Code+Requirements+for+Structural+Concrete+and+Commentary+%28318%E2%80%9311%29%2C%E2%80%9D+ed%3A+American+Concrete+Institute&author=A.+Aci&publication_year=2011&inst=6114818187226770759 (accessed January 25, 2024).
  55. Européen: Eurocode 2: Design of concrete structures—pa... - Google Scholar, (n.d.). https://scholar.google.com/scholar_lookup?title=Eurocode+2%3A+Design+of+concrete+structures%3A+Part+1%E2%80%931%3A+General+rules+and+rules+for+buildings&author=B.S.+Institution&publication_year=2004&inst=6114818187226770759 (accessed January 25, 2024).
  56. Uomoto, T.; Ishibashi, T.; Nobuta, Y.; Satoh, T.; Kawano, H.; Takewaka, K.; Uji, K. Standard Specifications for Concrete Structures-2007 by Japan Society of Civil Engineers. Concr. J. 2008, 46, 3–14. [Google Scholar] [CrossRef]
  57. NZS 3101.1:2006 (inc A1, A2, A3) Concrete structures standard. - Part 1: The design of concrete structures. - SPONSORED. | Building CodeHub, (n.d.). https://codehub.building.govt.nz/resources/nzs-3101-12006-inc-a1-a2-a3/ (accessed January 25, 2024).
  58. Cofired biomass fly ashes in mortar: Reduction of Alkali Silica Reaction (ASR) expansion, pore solution chemistry and the effects on compressive strength | Semantic Scholar, (n.d.). https://www.semanticscholar.org/paper/Cofired-biomass-fly-ashes-in-mortar%3A-Reduction-of-Wang/374c86198c39c5004c259671e812ec2ff2ea5807 (accessed March 19, 2024).
  59. H. Tariq, R. Azam, A. Ahmed, W. Abbass, S. Abbas, THE EFFECT OF ALKALI CONTENT OF CEMENT ON ASR EXPANSION: EVALUATION AND ITS MITIGATION USING FLY ASH, (n.d.).
  60. Chopperla, K.S.T.; Smith, J.A.; Ideker, J.H. The efficacy of portland-limestone cements with supplementary cementitious materials to prevent alkali-silica reaction. Cement 2022, 8, 100031. [Google Scholar] [CrossRef]
  61. Lindgård, J.; Andiç-Çakır, Ö.; Fernandes, I.; Rønning, T.F.; Thomas, M.D.A. Alkali–silica reactions (ASR): Literature review on parameters influencing laboratory performance testing. Cem. Concr. Res. 2012, 42, 223–243. [Google Scholar] [CrossRef]
  62. R. Detwiler, The Role of Fly Ash Composition in Reducing Alkali-Silica Reaction, (n.d.).
  63. Shehata, M.H.; Thomas, M.D.A. The effect of fly ash composition on the expansion of concrete due to alkali–silica reaction. Cem. Concr. Res. 2000, 30, 1063–1072. [Google Scholar] [CrossRef]
  64. He, P.; Zhang, B.; Lu, J.-X.; Poon, C.S. A ternary optimization of alkali-activated cement mortars incorporating glass powder, slag and calcium aluminate cement. Constr. Build. Mater. 2020, 240, 117983. [Google Scholar] [CrossRef]
  65. Gołaszewski, J.; Gołaszewska, M. Properties of mortars with Calcium Sulfoaluminate cements with the addition of Portland cement and limestone. Arch. Civ. Eng. 2021, 67, 425–435. [Google Scholar] [CrossRef]
  66. V.K. Harish, P.R. Rangaraju, INVESTIGATIONS INTO ALKALI-SILICA REACTION IN CALCIUM SULFO- ALUMINATE CEMENT MORTARS AND ITS BLENDS WITH POZZOLANS, (n.d.).
  67. Kleib, J.; Aouad, G.; Louis, G.; Zakhour, M.; Boulos, M.; Rousselet, A.; Bulteel, D. The use of calcium sulfoaluminate cement to mitigate the alkali silica reaction in mortars. Constr. Build. Mater. 2018, 184, 295–303. [Google Scholar] [CrossRef]
  68. Bizzozero, J.; Scrivener, K.L. Limestone reaction in calcium aluminate cement–calcium sulfate systems. Cem. Concr. Res. 2015, 76, 159–169. [Google Scholar] [CrossRef]
  69. Termkhajornkit, P.; Nawa, T.; Nakai, M.; Saito, T. Effect of fly ash on autogenous shrinkage. Cem. Concr. Res. 2005, 35, 473–482. [Google Scholar] [CrossRef]
  70. Burris, L.E.; Kurtis, K.E. Influence of set retarding admixtures on calcium sulfoaluminate cement hydration and property development. Cem. Concr. Res. 2018, 104, 105–113. [Google Scholar] [CrossRef]
  71. Sirtoli, D.; Wyrzykowski, M.; Riva, P.; Lura, P. Autogenous and drying shrinkage of mortars based on Portland and calcium sulfoaluminate cements. Mater. Struct. 2020, 53, 1–14. [Google Scholar] [CrossRef]
  72. Kumarappa, D.B.; Peethamparan, S.; Ngami, M. Autogenous shrinkage of alkali activated slag mortars: Basic mechanisms and mitigation methods. Cem. Concr. Res. 2018, 109, 1–9. [Google Scholar] [CrossRef]
  73. Wu, L.; Farzadnia, N.; Shi, C.; Zhang, Z.; Wang, H. Autogenous shrinkage of high performance concrete: A review. Constr. Build. Mater. 2017, 149, 62–75. [Google Scholar] [CrossRef]
  74. Polat, R.; Demirboğa, R.; Khushefati, W.H. Effects of nano and micro size of CaO and MgO, nano-clay and expanded perlite aggregate on the autogenous shrinkage of mortar. Constr. Build. Mater. 2015, 81, 268–275. [Google Scholar] [CrossRef]
  75. Tao, Y.; Rahul, A.; Mohan, M.K.; De Schutter, G.; Van Tittelboom, K. Recent progress and technical challenges in using calcium sulfoaluminate (CSA) cement. Cem. Concr. Compos. 2023, 137. [Google Scholar] [CrossRef]
  76. D. Sirtoli, Shrinkage and creep of high-performance concrete based on calcium sulfoaluminate cement - ScienceDirect, (2019). https://www.sciencedirect.com/science/article/pii/S095894651831014X (accessed July 26, 2022).
  77. Khatib, J.M.; Ramadan, R.; Ghanem, H.; Elkordi, A.; Baalbaki, O.; Kırgız, M. Chemical shrinkage of paste and mortar containing limestone fines. Mater. Today: Proc. 2022, 61, 530–536. [Google Scholar] [CrossRef]
  78. Afroz, S.; Zhang, Y.; Nguyen, Q.D.; Kim, T.; Castel, A. Shrinkage of blended cement concrete with fly ash or limestone calcined clay. Mater. Struct. 2023, 56, 1–20. [Google Scholar] [CrossRef]
  79. Liu, J.; An, R.; Jiang, Z.; Jin, H.; Zhu, J.; Liu, W.; Huang, Z.; Xing, F.; Liu, J.; Fan, X.; et al. Effects of w/b ratio, fly ash, limestone calcined clay, seawater and sea-sand on workability, mechanical properties, drying shrinkage behavior and micro-structural characteristics of concrete. Constr. Build. Mater. 2022, 321, 126333. [Google Scholar] [CrossRef]
  80. Mohan, M.K.; Rahul, A.; De Schutter, G.; Van Tittelboom, K. Early age hydration, rheology and pumping characteristics of CSA cement-based 3D printable concrete. Constr. Build. Mater. 2021, 275, 122136. [Google Scholar] [CrossRef]
  81. Mohammed, T.; Torres, A.; Aguayo, F.; Okechi, I.K. Evaluating carbonation resistance and microstructural behaviors of calcium sulfoaluminate cement concrete incorporating fly ash and limestone powder. Constr. Build. Mater. 2024, 442. [Google Scholar] [CrossRef]
  82. Brien, J.V.; Henke, K.R.; Mahboub, K.C. OBSERVATIONS OF PEAK STRENGTH BEHAVIOR IN CSA CEMENT MORTARS. J. Green Build. 2013, 8, 97–115. [Google Scholar] [CrossRef]
  83. Jansen, D.; Goetz-Neunhoeffer, F.; Lothenbach, B.; Neubauer, J. The early hydration of Ordinary Portland Cement (OPC): An approach comparing measured heat flow with calculated heat flow from QXRD. Cem. Concr. Res. 2011, 42, 134–138. [Google Scholar] [CrossRef]
  84. F. Winnefeld, Interaction of superplasticizers with calcium sulfoaluminate cements, 2012.
  85. Winnefeld, F.; Martin, L.H.; Müller, C.J.; Lothenbach, B. Using gypsum to control hydration kinetics of CSA cements. Constr. Build. Mater. 2017, 155, 154–163. [Google Scholar] [CrossRef]
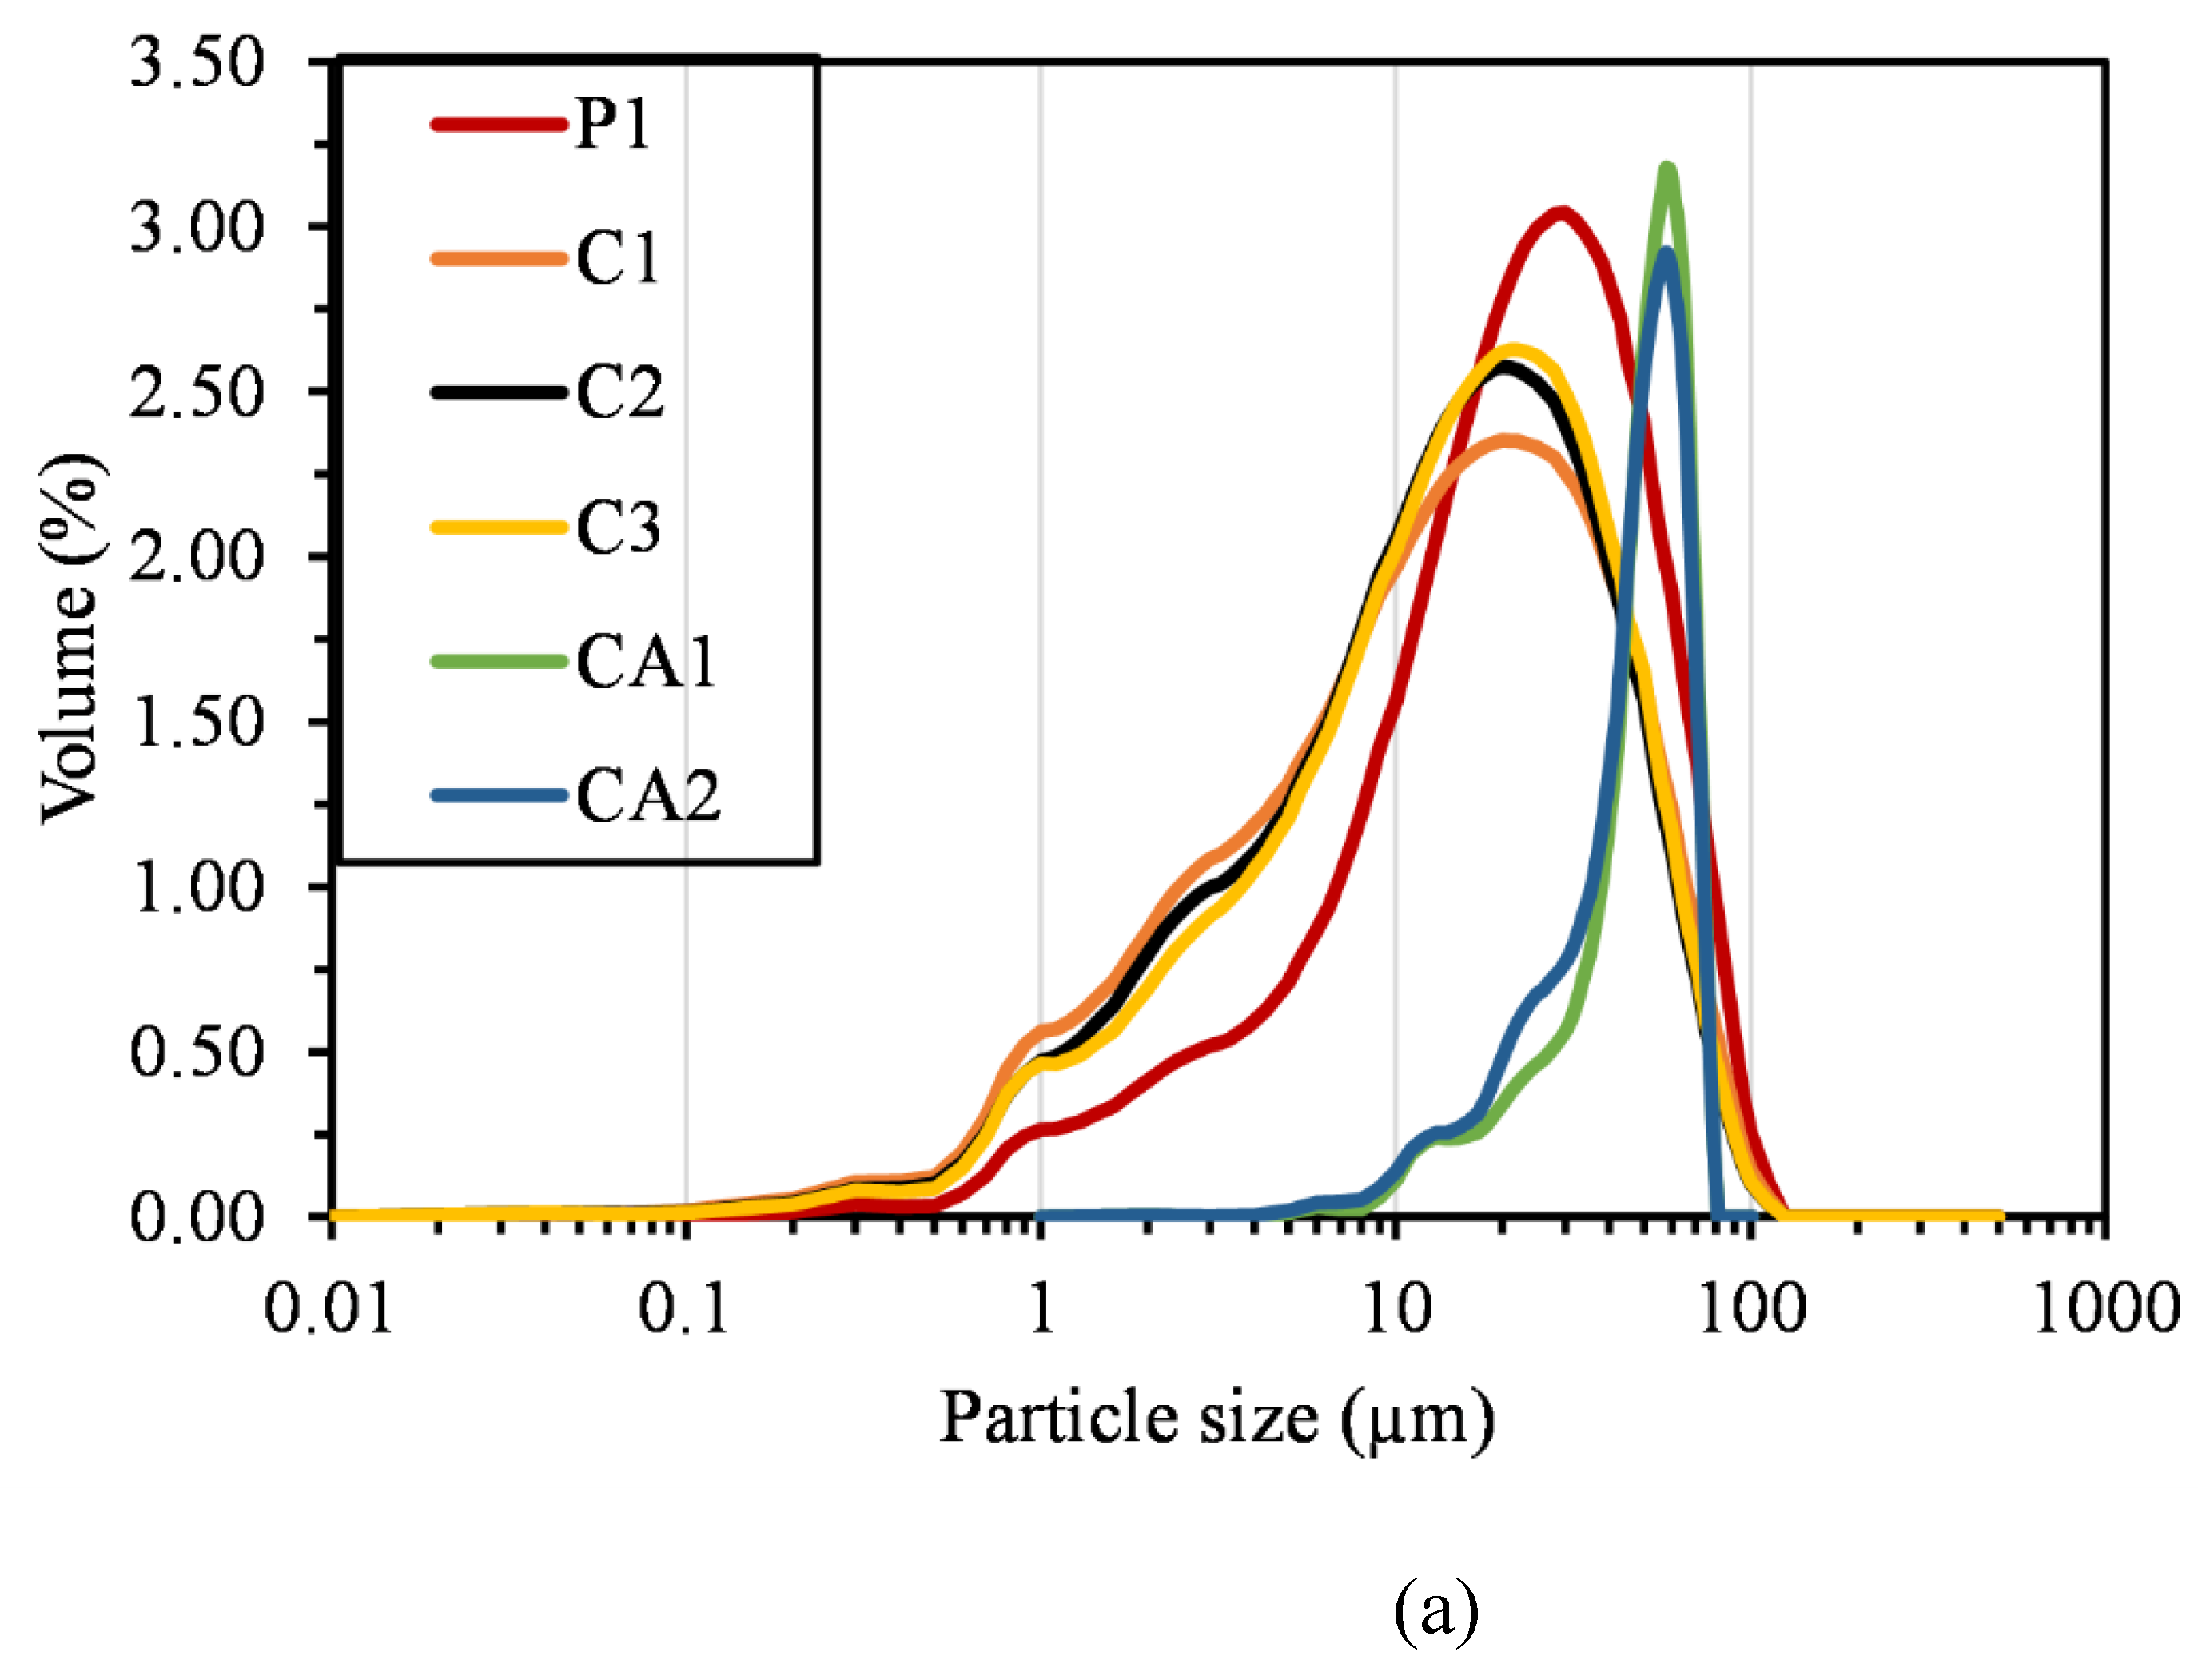
Figure 1. Particle size distribution of cementitious binders for (a) pure cement (b) FA and LP And Cumulative Distribution curve for (c) pure cement (d)FA and LP
Preprints 118772 g001aPreprints 118772 g001bPreprints 118772 g001c
Figure 2. Particle size distribution of cementitious binders for (a) pure cements (b) FA and LP: SEM morphology images of (a) C3 (b) C2 (c) LP (d) FA
Preprints 118772 g002aPreprints 118772 g002b
Figure 3. The initial and final setting times of different mixtures Incorporating (a) pure binders (b) FA (c) LP (d) both FA and LP (e) OPC.
Preprints 118772 g003aPreprints 118772 g003bPreprints 118772 g003c
Figure 4. Demonstrates 6 hrs., 1, 7-, 28-, 56-, and 91-days compressive strength of all mortar mixtures Incorporating (a) pure binders (b) FA (c) LP (d) combined FA and LP.
Preprints 118772 g004aPreprints 118772 g004bPreprints 118772 g004c
Figure 5. Flexural Strength of mixtures with different SCMs at 28 days of curing.
Preprints 118772 g005
Figure 6. Demonstrates the direct tensile strength of all mortar mixtures at 28-days of curing.
Preprints 118772 g006
Figure 7. Direct tensile strength comparison between experimental and different design code predictions at 28 days of curing.
Preprints 118772 g007aPreprints 118772 g007b
Figure 8. Relationship between compressive strength, flexural strength, and direct tensile strength at 28 days of curing.
Preprints 118772 g008
Figure 9. Relationship between setting time (displacement) and 28-days compressive strength.
Preprints 118772 g009
Figure 10. Length Expansion of all mortar mixtures incorporating (a) pure binders (b) FA (c) LP (d) combined FA and LP.
Preprints 118772 g010aPreprints 118772 g010bPreprints 118772 g010c
Figure 11. Autogenous shrinkage for all mortar mixtures incorporating (a) pure binders (b) FA (c) LP (d) combined FA and LP.
Preprints 118772 g011aPreprints 118772 g011bPreprints 118772 g011c
Figure 12. Autogenous Shrinkage of all mortar mixtures with CSA and CAC compared to OPC.
Preprints 118772 g012aPreprints 118772 g012bPreprints 118772 g012c
Figure 13. Illustrates the hydrated SEM images for (a) C3 (b) C3F20 (c) C3LP.
Preprints 118772 g013aPreprints 118772 g013b
Figure 14. 3-day XRD analysis for (a) C3 with its variants incorporating SCMs (b) hydrated CA1 and CA2.
Preprints 118772 g014
Figure 15. Illustrates the 3-day TG and DTG profiles of C3 cement paste [81].
Preprints 118772 g015
Table 1. The Chemical Compositions of cementitious materials.
Compound P1 C1 C2 C3 CA1 CA2 FA LP
SiO2 19.60 20.56 13.63 14.72 4.34 13.46 34.87 4.50
Al2O3 5.19 16.14 15.82 14.37 38.65 12.23 17.43 -
Fe2O3 2.06 1.35 0.75 1.22 15.09 2.67 5.67 -
CaO 64.01 45.31 51.28 53.85 38.37 56.65 27.60 -
MgO 1.12 1.23 1.14 1.23 0.39 2.86 5.50 -
SO3 3.86 14.73 16.62 14.40 0.16 9.90 2.27 -
Na2O 0.12 0.77 0.29 0.10 0.05 0.20 1.69 -
K2O 0.91 0.72 0.62 0.59 0.14 0.79 0.46 -
Na2Oe 0.72 1.24 0.69 0.49 0.14 0.72 - -
P2O5 0.13 0.16 0.15 0.15 0.12 0.11 - -
Cl 0.01 0.02 0.02 0.02 0.00 0.01 - -
TiO2 0.24 0.76 0.72 0.65 1.82 0.60 - -
MnO 0.03 0.01 0.01 0.04 0.11 0.14 - -
ZnO 0.01 0.02 0.02 0.01 0.02 0.07 - -
Cr2O3 0.01 0.02 0.02 0.02 0.11 0.04 - -
CaCO3 - - - - - - - 92.00
MgCO3 - - - - - - - 2.50
LOI 3.80 4.74 3.06 3.39 1.55 1.21 0.42
CO2 2.49 1.81 1.28 1.76 0.64 0.54 - -
Table 2. Mixture Proportion of the cement pastes studied.
Systems Mixture Mix ID PureBinder FA LP Water/
Binder
Sand Flow
(mm)
Pure OPC P1 1.00 0 0 0.40 2.75 25.75
CSA1 C1 1.00 0 0 0.40 2.75 33.50
CSA2 C2 1.00 0 0 0.40 2.75 30.50
CSA3 C3 1.00 0 0 0.40 2.75 27.25
CAC1 CA1 1.00 0 0 0.40 2.75 30.25
CAC2 CA2 1.00 0 0 0.40 2.75 27.75
Binary OPC+20%FA P1F20 0.80 0.20 0 0.40 2.75 30.00
CSA1+20%FA C1F20 0.80 0.20 0 0.40 2.75 29.00
CSA2+20%FA C2F20 0.80 0.20 0 0.40 2.75 29.00
CSA3+20%FA C3F20 0.80 0.20 0 0.40 2.75 28.50
CAC1+20%FA CA1F20 0.80 0.20 0 0.40 2.75 31.25
CAC2+20%FA CA2F20 0.80 0.20 0 0.40 2.75 29.50
OPC+15%LP P1L15 0.85 0 0.15 0.40 2.75 27.25
CSA1+15%LP C1L15 0.85 0 0.15 0.40 2.75 28.50
CSA2+15%LP C2L15 0.85 0 0.15 0.40 2.75 28.25
CSA3+15%LP C3L15 0.85 0 0.15 0.40 2.75 27.50
CAC1+15%LP CA1L15 0.85 0 0.15 0.40 2.75 32.00
CAC2+15%LP CA2L15 0.85 0 0.15 0.40 2.75 29.25
Ternary OPC+20%FA+15%LP P1F20L15 0.65 0.20 0.15 0.40 2.75 25.75
CSA1+20%FA+15%LP C1F20L15 0.65 0.20 0.15 0.40 2.75 28.75
CSA2+20%FA+15%LP C2F20L15 0.65 0.20 0.15 0.40 2.75 30.50
CSA3+20%FA+15%LP C3F20L15 0.65 0.20 0.15 0.40 2.75 29.25
CAC1+20%FA+15%LP CA1F20L15 0.65 0.20 0.15 0.40 2.75 31.00
CAC2+20%FA+15%LP CA2F20L15 0.65 0.20 0.15 0.40 2.75 29.50
Table 3. Design code expressions.
Codes Predicted Tensile strength Reference
AS 3600–09 0.36√f'c [53]
ACI 318–11 0.34√f'c [54]
EC 2-04a 0.3(f'c)2/3 [55]
JSCE-07 0.23(f'c)2/3 [56]
NZS 3101–06 0.36√f'c [57]
Disclaimer/Publisher’s Note: The statements, opinions and data contained in all publications are solely those of the individual author(s) and contributor(s) and not of MDPI and/or the editor(s). MDPI and/or the editor(s) disclaim responsibility for any injury to people or property resulting from any ideas, methods, instructions or products referred to in the content.
Copyright: This open access article is published under a Creative Commons CC BY 4.0 license, which permit the free download, distribution, and reuse, provided that the author and preprint are cited in any reuse.
Prerpints.org logo

Preprints.org is a free preprint server supported by MDPI in Basel, Switzerland.

Subscribe

© 2024 MDPI (Basel, Switzerland) unless otherwise stated