1. Introduction
The concept of a robot controlled by iris movement to aid individuals with physical disabilities is an innovative concept with the potential for substantial improvements in their overall quality of life. This technology has the capacity to offer greater autonomy and enhanced interaction with the environment, thereby addressing specific challenges faced by those with mobility limitations.
This technology has the potential to empower individuals facing limited mobility challenges, significantly improving their capacity to engage with and navigate their surroundings. The impact of movement disabilities on the lives of physically disabled individuals is substantial, and this innovative technology aims to address these challenges by providing a means for more independent and effective interaction with the environment. Hence, there is need to develop a robot which can be controlled using iris movement.
The iris stands out as one of the safest and most accurate biometric authentication methods. Unlike external features like hands and face, the iris is an internal organ, shielded and, as a result, less susceptible to damage [
5,
6,
7]. This inherent protection contributes to the reliability and durability of iris-based authentication systems.
In their work, the authors [
8] have proposed a new method for iris recognition using the Scale Invariant Feature Transformation (SIFT). The initial step involves extracting the SIFT characteristic feature, followed by a matching process between two images. This matching is executed by comparing associated descriptors at each local extremum. Experimental results conducted using the BioSec multimodal database, display that the integration of SIFT with a matching approach yields significantly superior performance compared to various existing methods.
An alternative model discussed in [
9] is the Speeded up Robust Features (SURF). The proposed model in [
9] suggests the potential advantages of SURF in the context of iris recognition or other related applications. This model introduces a method that emphasizes efficient and robust feature extraction. SURF enhances the speed of feature detection and description, making it particularly suitable for applications with real-time constraints. This model extracts unique features from annular iris images, which results in satisfactory recognition rates.
In their work, the authors [
10] have developed a system for iris recognition using a SURF key extracted from normalized and enhanced iris images. This meticulous process is designed to yield high accuracy in iris recognition, displaying the effectiveness of employing SURF-based techniques in enhancing the precision of biometric systems.
With the same objective, Masek [
11] utilized the Canny edge detector and the circular Hough transform to effectively detect iris boundaries. The feature extraction process involves Log-Gabor wavelets, and recognition is achieved through the application of Hamming distance. This approach highlights the integration of various image-processing techniques to enhance iris recognition accuracy [
11].
In [
12], the authors introduced an iris recognition system that focuses on characterizing local variations within image structures. The approach involves constructing a one-dimensional (1D) intensity signal, capturing essential local variations from the original 2D iris image. Additionally, Gaussian–Hermite moments of intensity signals are employed as distinctive features. The classification process utilizes the cosine similarity measure and a nearest Centre classifier. This work demonstrates a systematic approach to iris recognition by emphasizing local image variations and employing specific features for accurate classification.
Recent research papers have studied the integration of machine learning techniques for iris recognition. In [
13], the authors present a model that uses artificial neural networks for personal identification purposes. Another work found in [
14], applied neural networks for iris recognition. This method involves the extraction, normalization, and enhancement of eyes from images. The process is then applied across numerous images within a dataset, employing a neural network for iris classification. These approaches display the increasing utilization of machine learning in advancing the accuracy and efficiency of iris recognition systems.
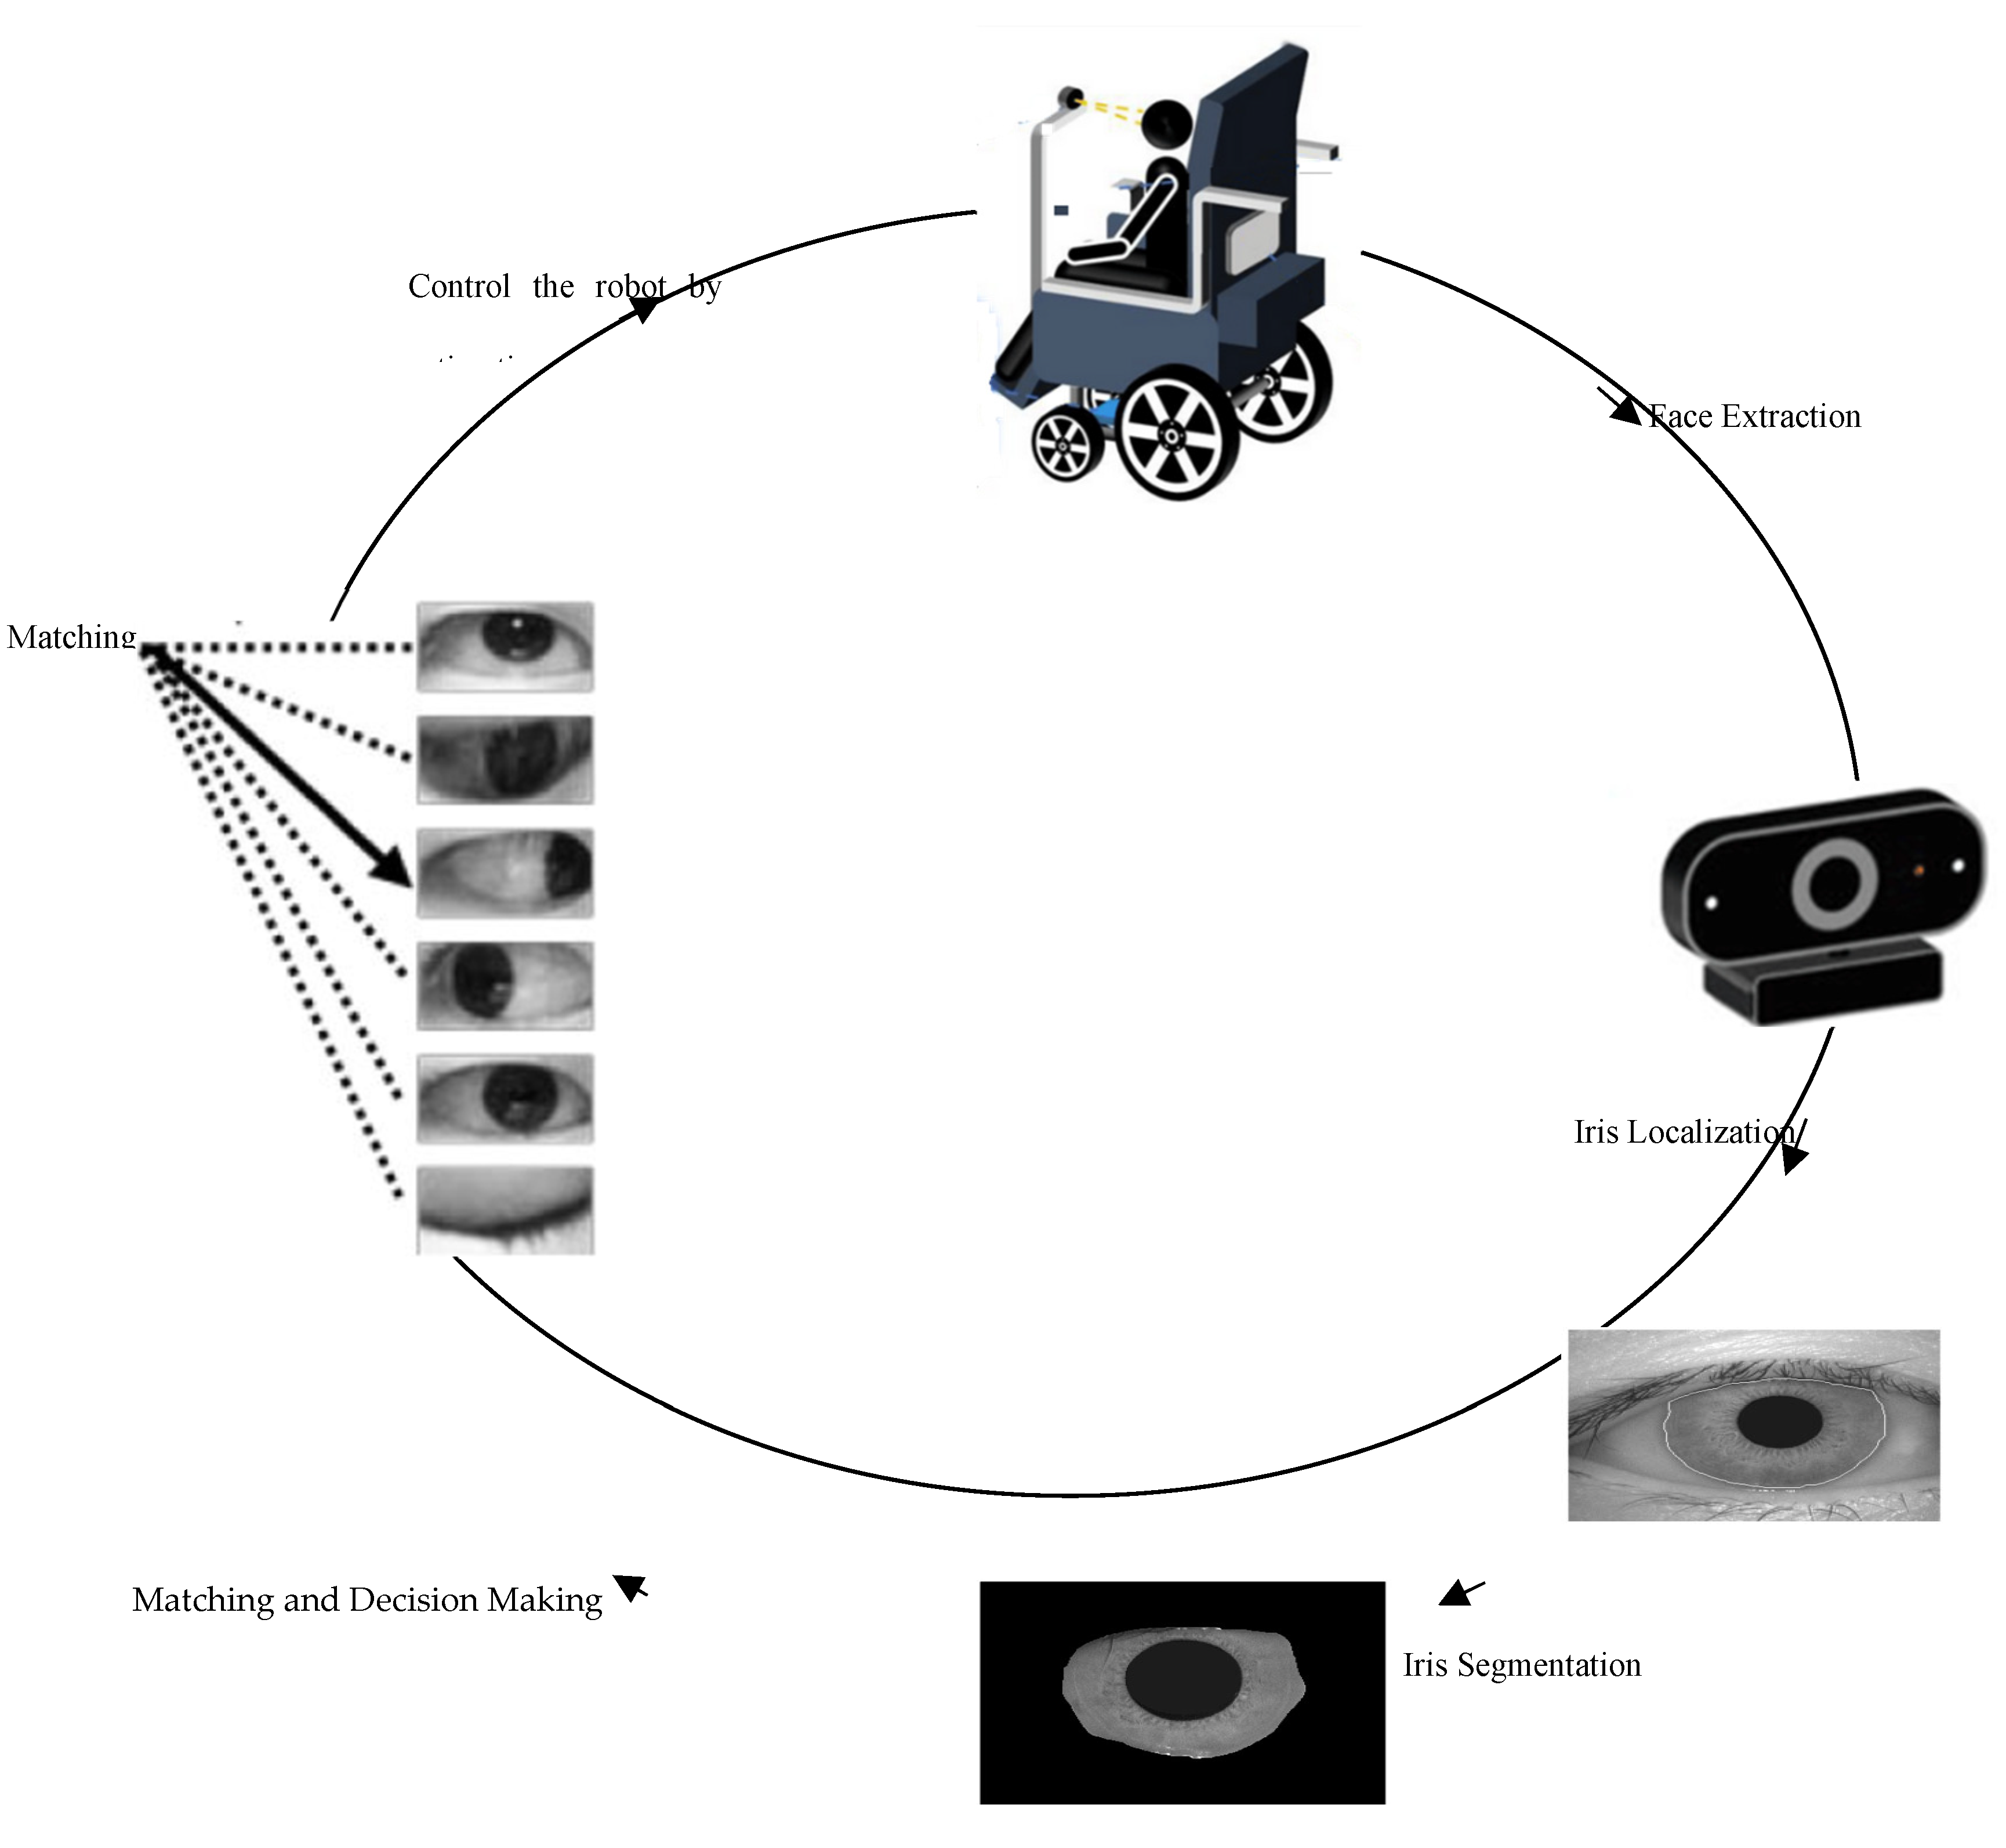
The control cycle of a robot based on iris recognition involves specific steps tailored to the task of identifying individuals using their iris patterns.
As shown in
Figure 1, the process begins with capturing images of individuals’ faces using a camera system equipped with appropriate optics for iris imaging. This step is crucial to obtain clear and high-resolution images of the iris. Once the images are captured, the robot’s software analyzes them to locate the regions of interest corresponding to the irises within the images. This localization step involves detecting the circular shape of the iris and isolating it from the rest of the eye.
After localizing the iris region, the robot’s software segments the iris pattern from the surrounding structures such as eyelids and eyelashes. This segmentation process ensures that only the iris pattern is considered for recognition, improving accuracy. The robot’s software compares the extracted iris pattern with the templates in the database using similarity metrics or pattern-matching algorithms. Based on the degree of similarity or a predefined threshold, the system makes a decision regarding the identity of the individual. Once the closest-matched template is identified, the associated gaze direction is used to estimate the user’s current gaze direction.
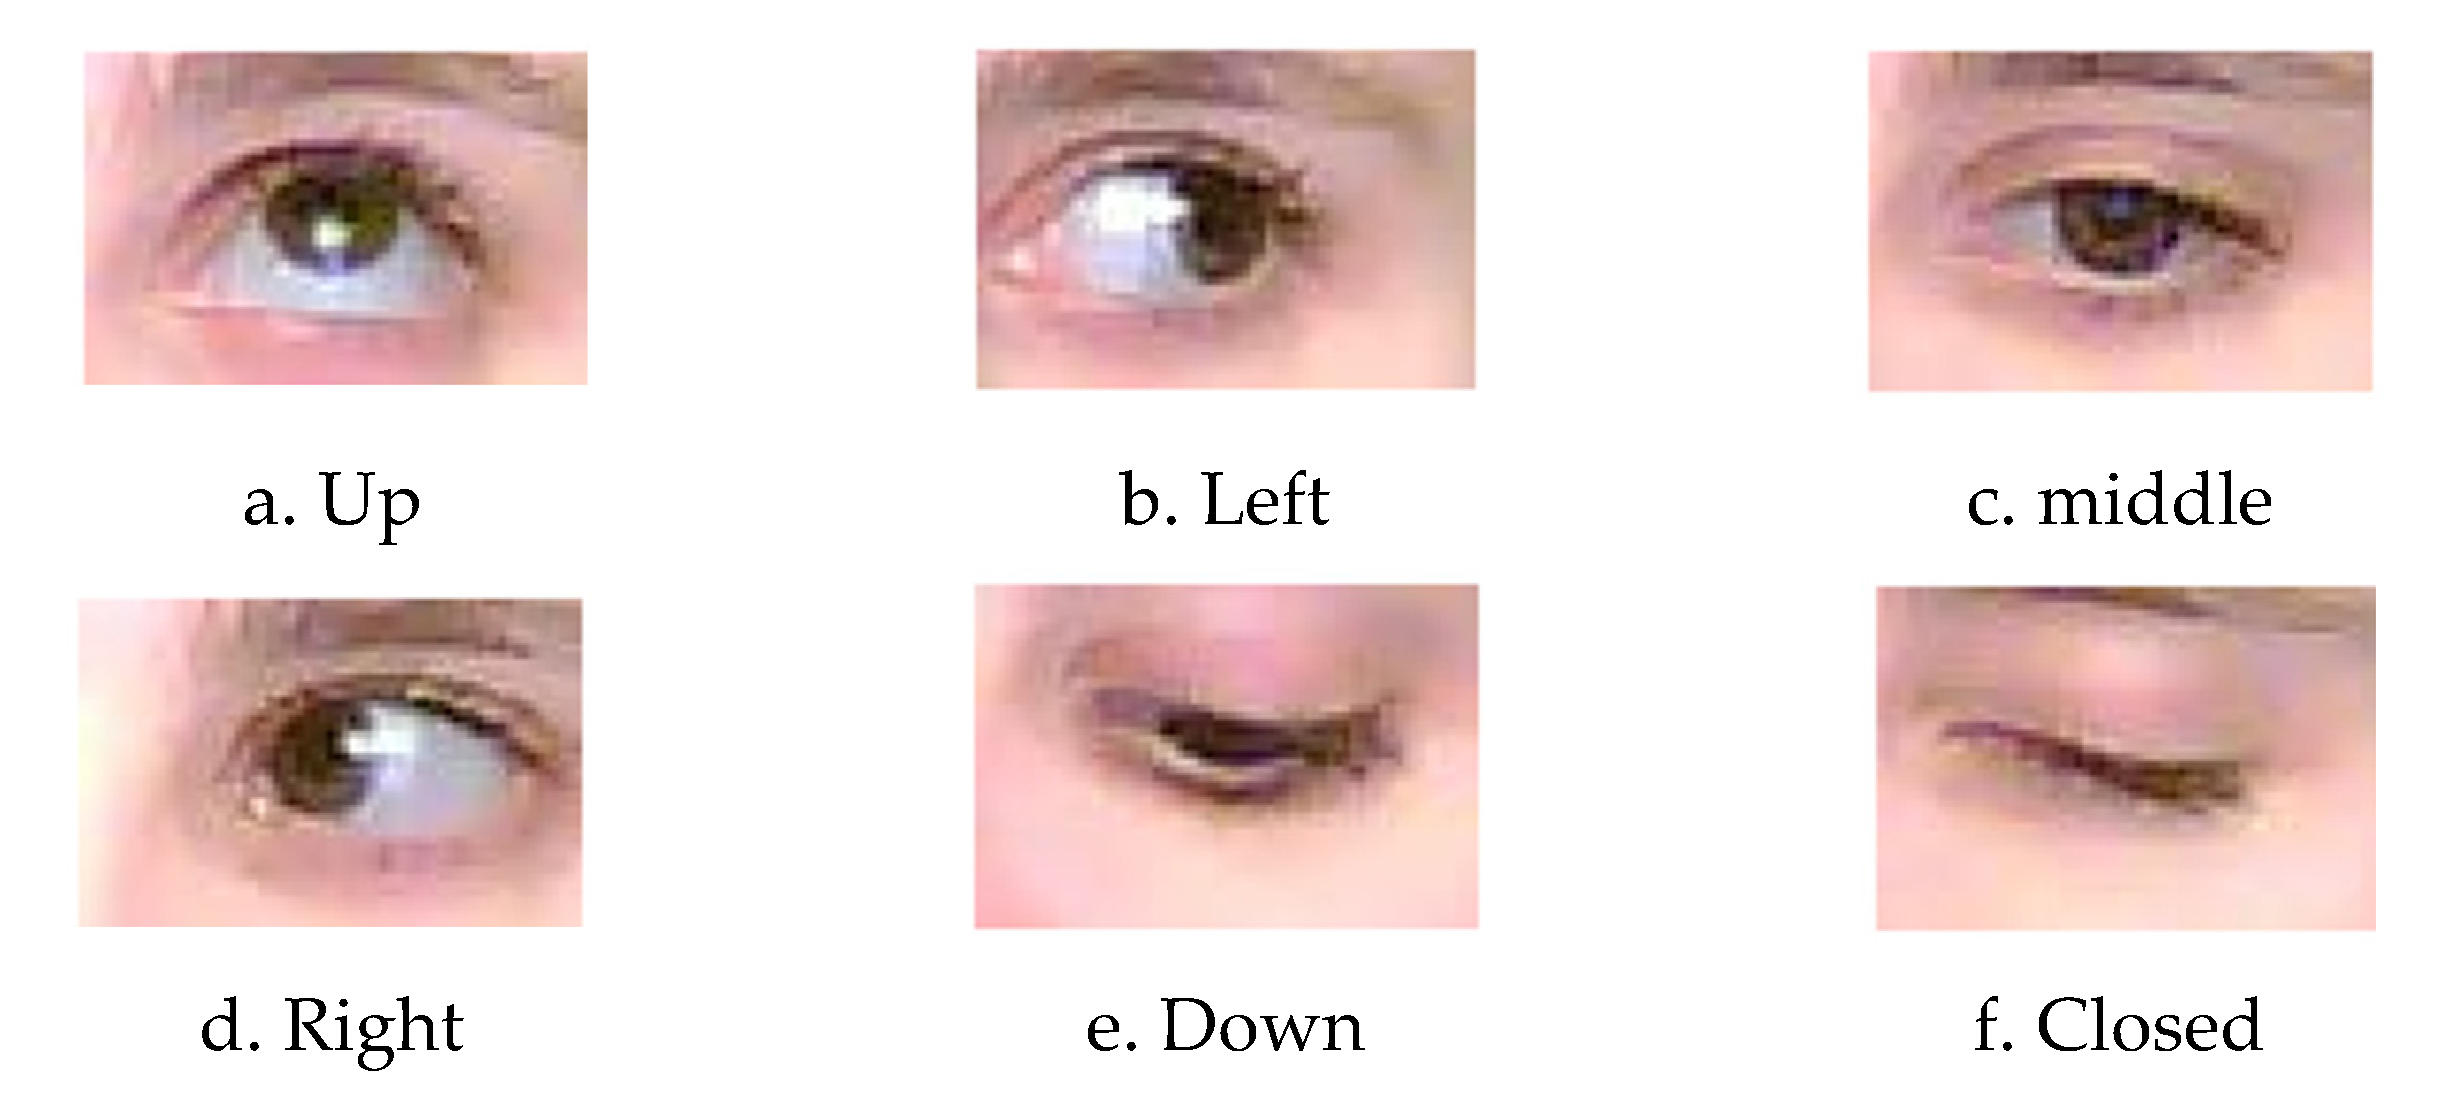
The estimated gaze direction can be represented numerically (e.g., angles relative to the camera’s orientation) or categorically as shown in
Figure 2, (e.g., “left,” “right,” “up,” “down,” “center”). Depending on the application, additional processing or calibration may be necessary to translate the estimated gaze direction into meaningful actions or commands for the robot or system being controlled. In addition, throughout the process, the robot provides feedback to the user, indicating whether the iris recognition was successful or if any errors occurred. In case of errors or unsuccessful recognition attempts, the system may prompt the user to retry or seek alternative authentication methods.
In our proposed model, the iris recognition system is structured around two principal stages: “Iris Segmentation and Localization” and “Feature Classification and Extraction” [
16]. This systematic approach ensures a comprehensive process that involves accurately identifying and isolating the iris in the initial stage, followed by the extraction and classification of relevant features to facilitate robust and precise iris recognition.
The proposed approach in this work diverges from traditional methods by introducing a novel concept that combines advanced segmentation, search, and classification techniques for iris recognition. The proposed method aims to exhaustively explore various solutions by integrating these techniques for improved iris recognition performance. The iris localization is achieved through the application of fast gradient filters utilizing a fuzzy inference system (FIS). This process involves employing rapid gradient-based filtering techniques in conjunction with a fuzzy inference system to accurately identify and extract the iris region from its background. Then, the process of iris segmentation is performed utilizing the bald eagle search (BES) algorithm. This involves employing the BES algorithm to efficiently locate and delineate the boundaries of the iris region within an image, ensuring accurate segmentation for subsequent analysis and recognition tasks.
The initial step employs fast gradient filters using a fuzzy inference system is used to segment the iris into two distinct classes. Then, the bald eagle search (BES) algorithm is applied to identify and extract the iris region from its background. Subsequently, feature extraction is performed using the integration of DWT and PCA. Finally, the classification is carried out using the Fuzzy KNN classifier.
2. The Proposed Method
Iris recognition is a biometric technique used to identify individuals based on the unique features of their iris. It offers an automated method for authentication and identification by analyzing patterns within the iris. This process involves capturing images or video recordings of one or both irises using cameras or specialized iris scanners. Mathematical pattern recognition techniques are then applied to extract and analyze the intricate patterns present in the iris.
In this work, we are interested in identifying people by their iris. The proposed system is conceptually different and explores new strategies. Specifically, it explores the potential of combining advanced segmentation techniques and fuzzy clustering methods. This unconventional method offers a fresh perspective on iris recognition, aiming to enhance accuracy and efficiency through innovative algorithmic integration rather than incremental design improvements.
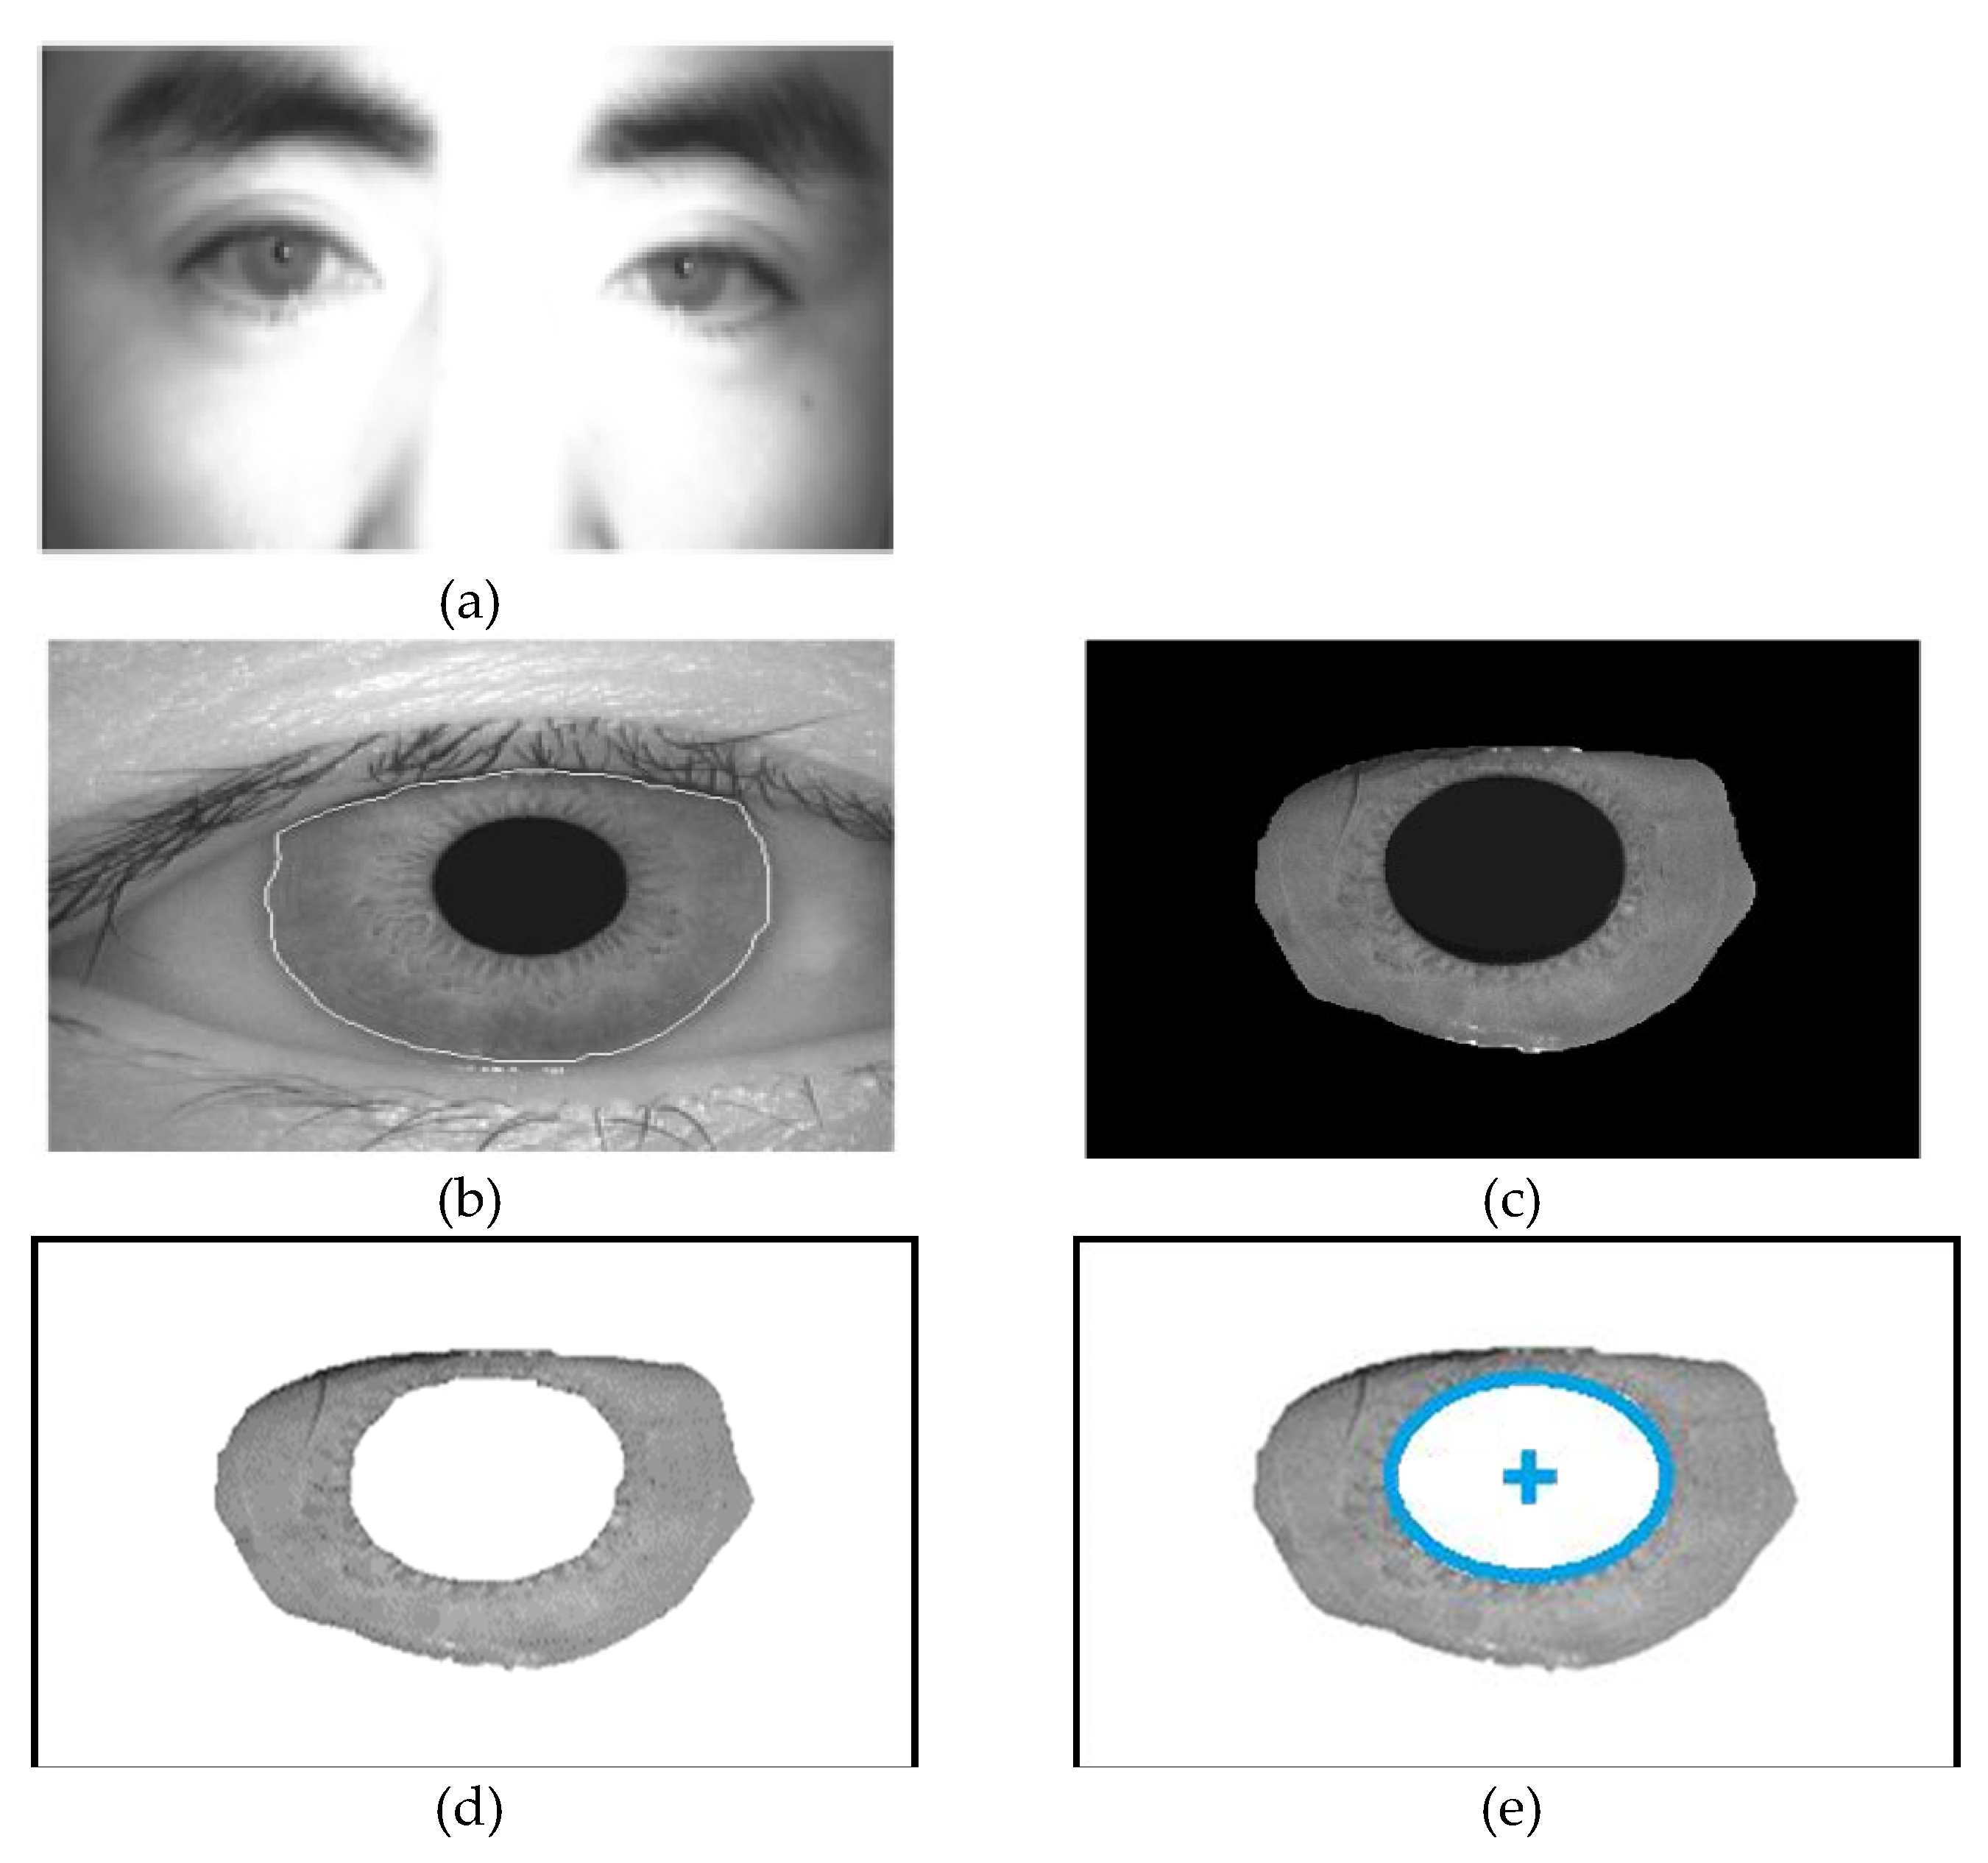
The proposed iris recognition method and finding the centroid localization as shown in
Figure 3, is developed using four fundamental steps: (1) Localization, (2) segmentation, (3) iris matching/classification, and (4) Finding centroid Location [
16].
The iris localization step involves detecting the iris region within the human image. Following this, the images are segmented into two classes: iris and non-iris. The feature extraction phase is pivotal in the recognition cycle, where feature vectors are extracted for each identified iris from the segmentation phase. Accurate feature extraction is crucial for achieving precise results in subsequent steps.
Through the application of fast gradient filters utilizing a fuzzy inference system (FIS), iris localization algorithms can accurately identify the edges of the iris while effectively distinguishing them from surrounding structures such as eyelids. This capability enables precise segmentation of the iris, laying the foundation for subsequent processing steps in the iris recognition pipeline. By ensuring accurate segmentation, these algorithms enhance match accuracy and overall performance of iris recognition systems. Then, the process of iris segmentation is accomplished through the utilization of the Bald Eagle Search (BES) algorithm. This algorithm efficiently locates and delineates the boundaries of the iris within an image, ensuring accurate segmentation. By employing the BES algorithm, the iris region can be accurately isolated from its surrounding structures, enabling further analysis and recognition tasks in the iris recognition pipeline with enhanced precision and reliability.
In the iris recognition system, feature extraction is paramount for achieving high recognition rates and reducing classification time. The efficiency of the feature extraction technique significantly impacts the success of recognition and classification tasks on iris templates. This study investigates the integration of Discrete Wavelet Transform (DWT) and Principal Component Analysis (PCA) for feature extraction from iris images.
The proposed technique aims to generate iris templates with reduced resolution and runtime, optimizing the classification process. Initially, DWT is applied to the normalized iris image to extract features. DWT enables the capture and representation of essential image characteristics in a multi-resolution framework, facilitating efficient feature extraction.
By leveraging DWT and PCA, the proposed method enhances the effectiveness of feature extraction from iris images, resulting in improved recognition accuracy and reduced computational overhead. The integration of these techniques enables the generation of compact yet informative iris templates, contributing to the overall performance enhancement of the iris recognition system.
During the recognition phase, matching and classification of image features are conducted based on Fuzzy KNN algorithm to determine the identity of an iris in comparison to all template iris databases. This comprehensive process ensures that iris recognition is performed accurately and effectively, providing reliable results for identity verification or authentication purposes.
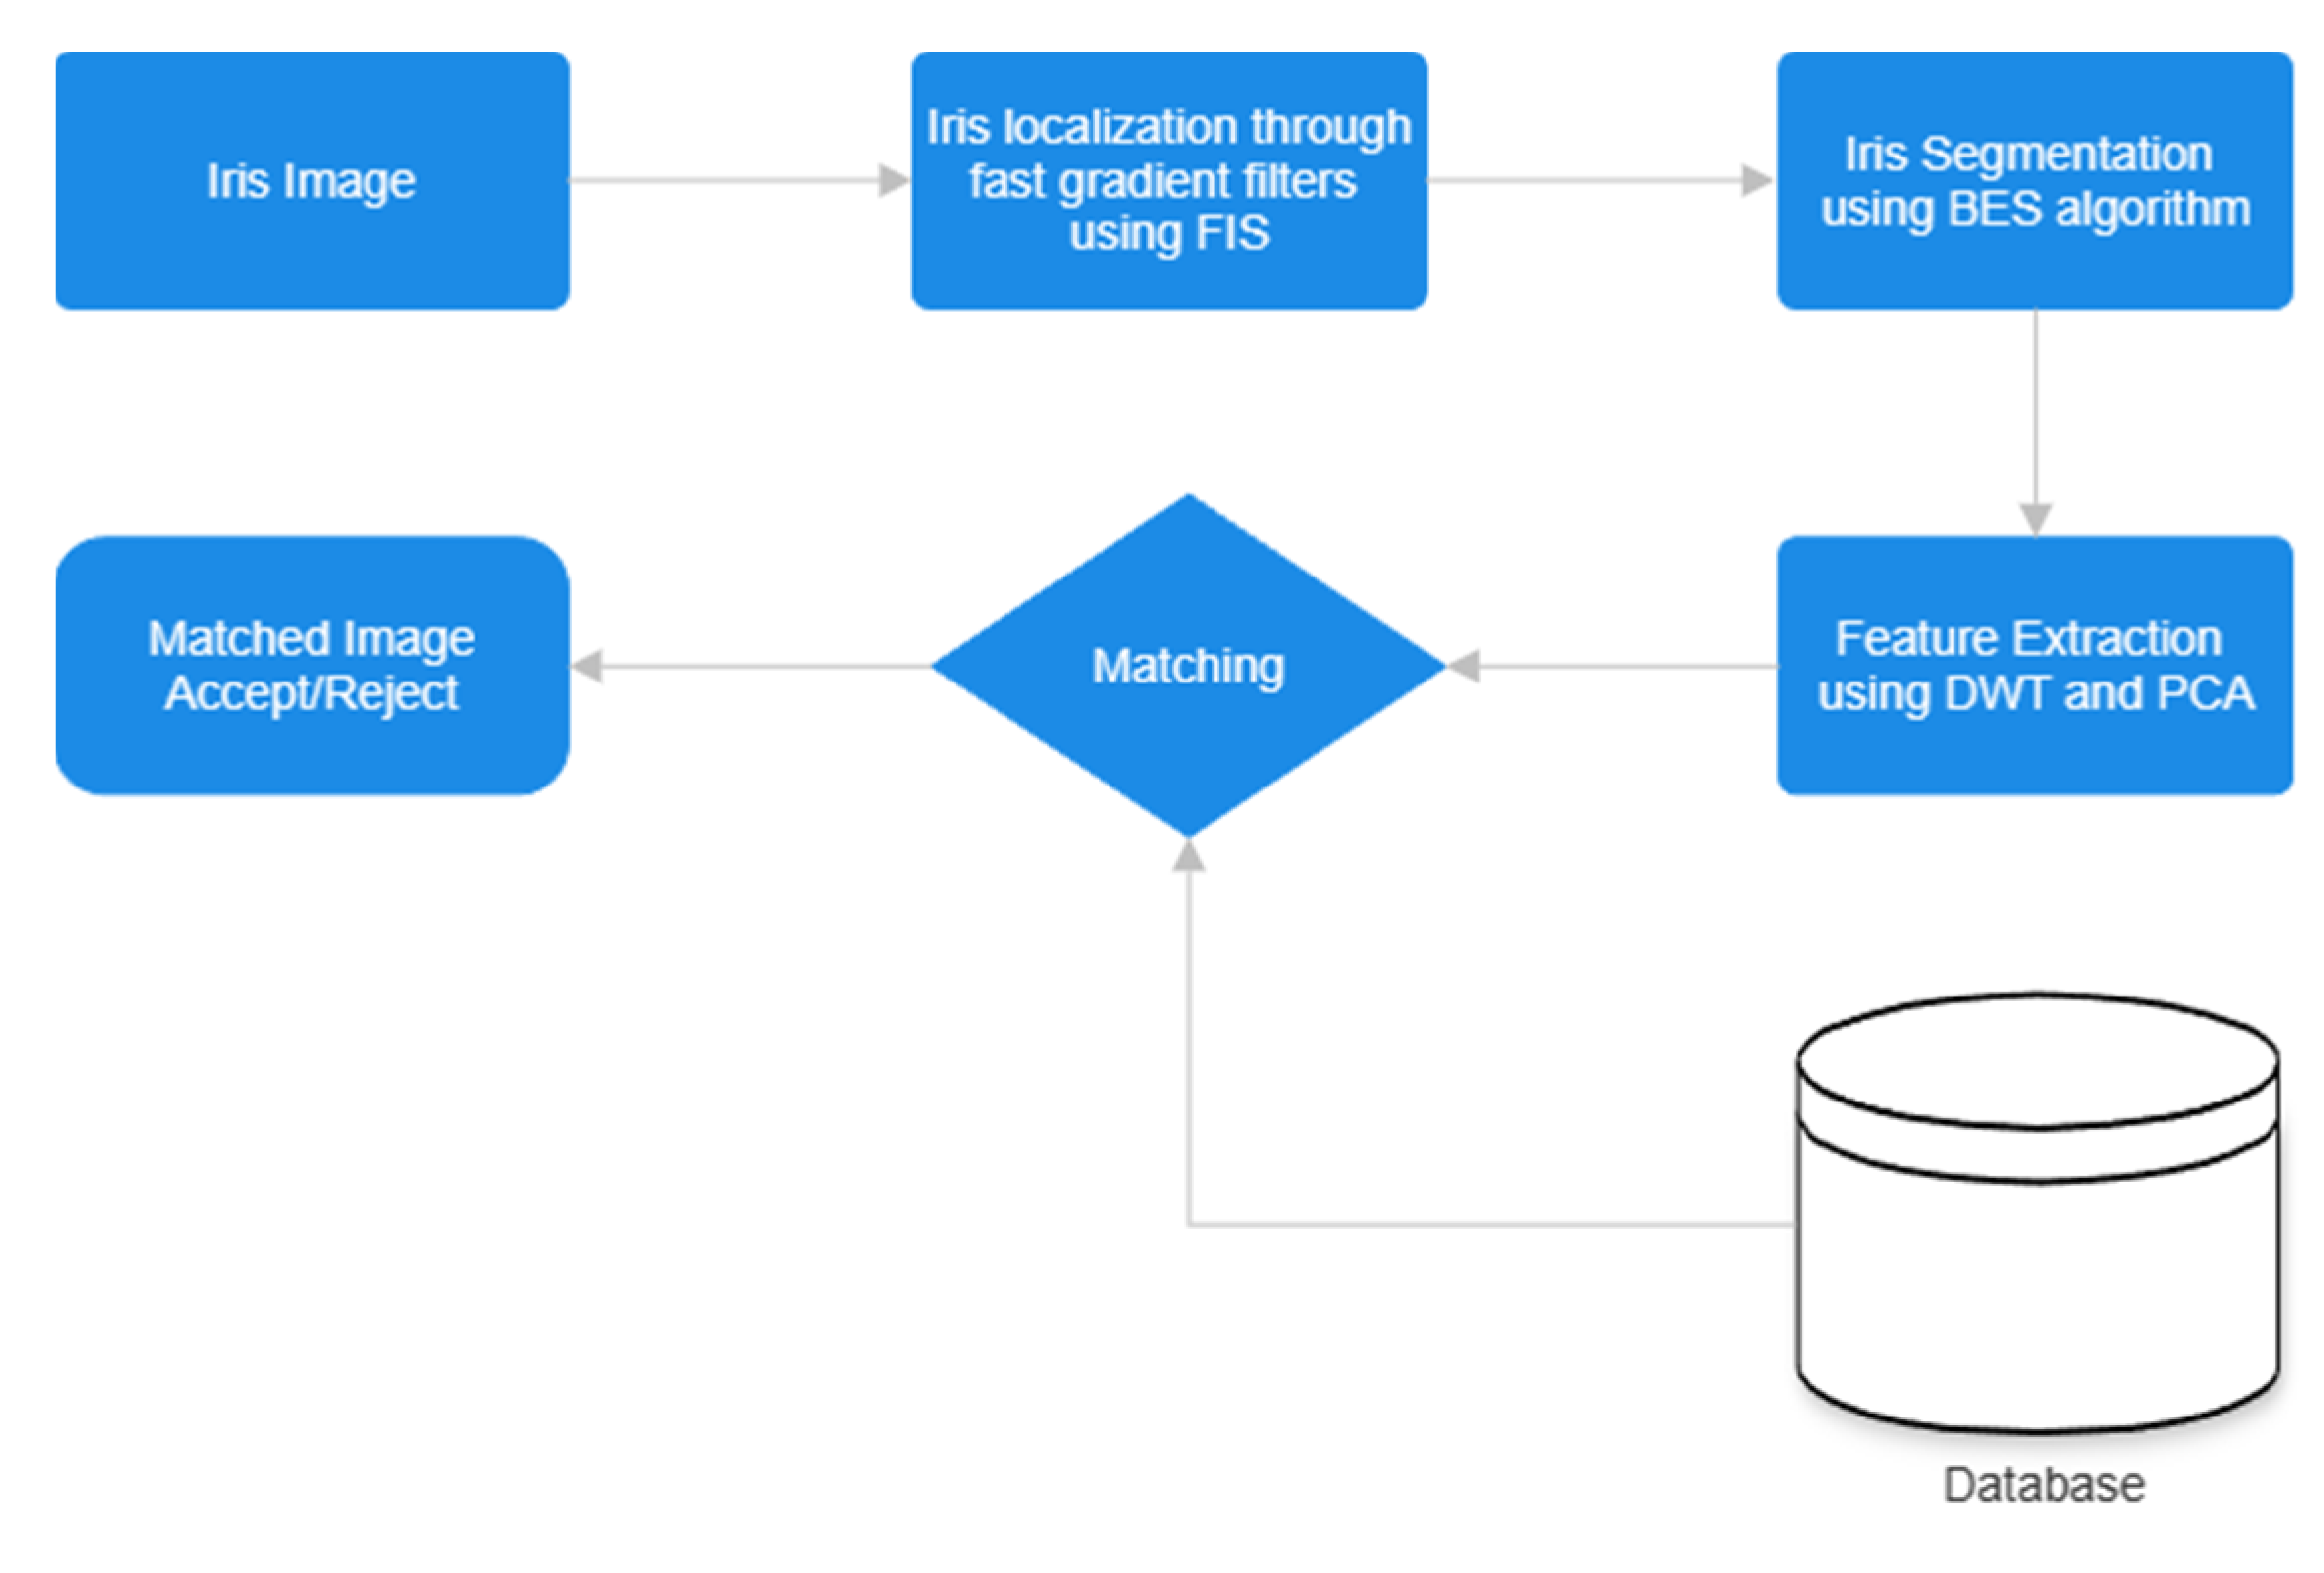
After the iris recognition step and the detection of iris boundaries, the localization of the center of the iris is a crucial step, especially for estimating gaze direction. Once the center of the iris is accurately localized, it can serve as a reference point for determining the direction in which a person is looking. This information is then used to control the robot in the desired direction. The flowchart shown in
Figure 4 depicts the stages of the proposed iris recognition.
2.1. Iris Localization through Fast Gradient Filters Using a Fuzzy Inference System (FIS)
Iris localization is indeed a critical step in iris recognition systems as it significantly impacts match accuracy. This step primarily involves identifying the borders of the iris, including the inner and outer edges of the iris as well as the upper and lower eyelids.
Detecting edges in digital images through fast gradient filters using a fuzzy inference system (FIS) involves combining traditional gradient-based edge detection techniques with fuzzy logic to improve edge detection performance, particularly in noisy or complex image environments [
17].
Fast gradient filters compute the gradient of the image intensity to identify edges. They are commonly used due to their simplicity and effectiveness. The second derivative
G of an image
I is typically calculated using convolution with kernel
K
The Laplacian operator is utilized for edge detection and image enhancement tasks. The Laplacian edge detector uses only one kernel. It calculates second order derivatives in a single pass. Two commonly used small kernels are:
In this work, we’ll focus on adjusting a single parameter, such as the threshold used in edge detection, based on the fuzzified input of gradient magnitude. A fuzzy inference system (FIS) is utilized to adaptively adjust parameters or thresholds of the fast gradient filters based on fuzzy rules and input variables. The four main components of the fuzzy inference system (FIS) are depicted in the algorithm 1.
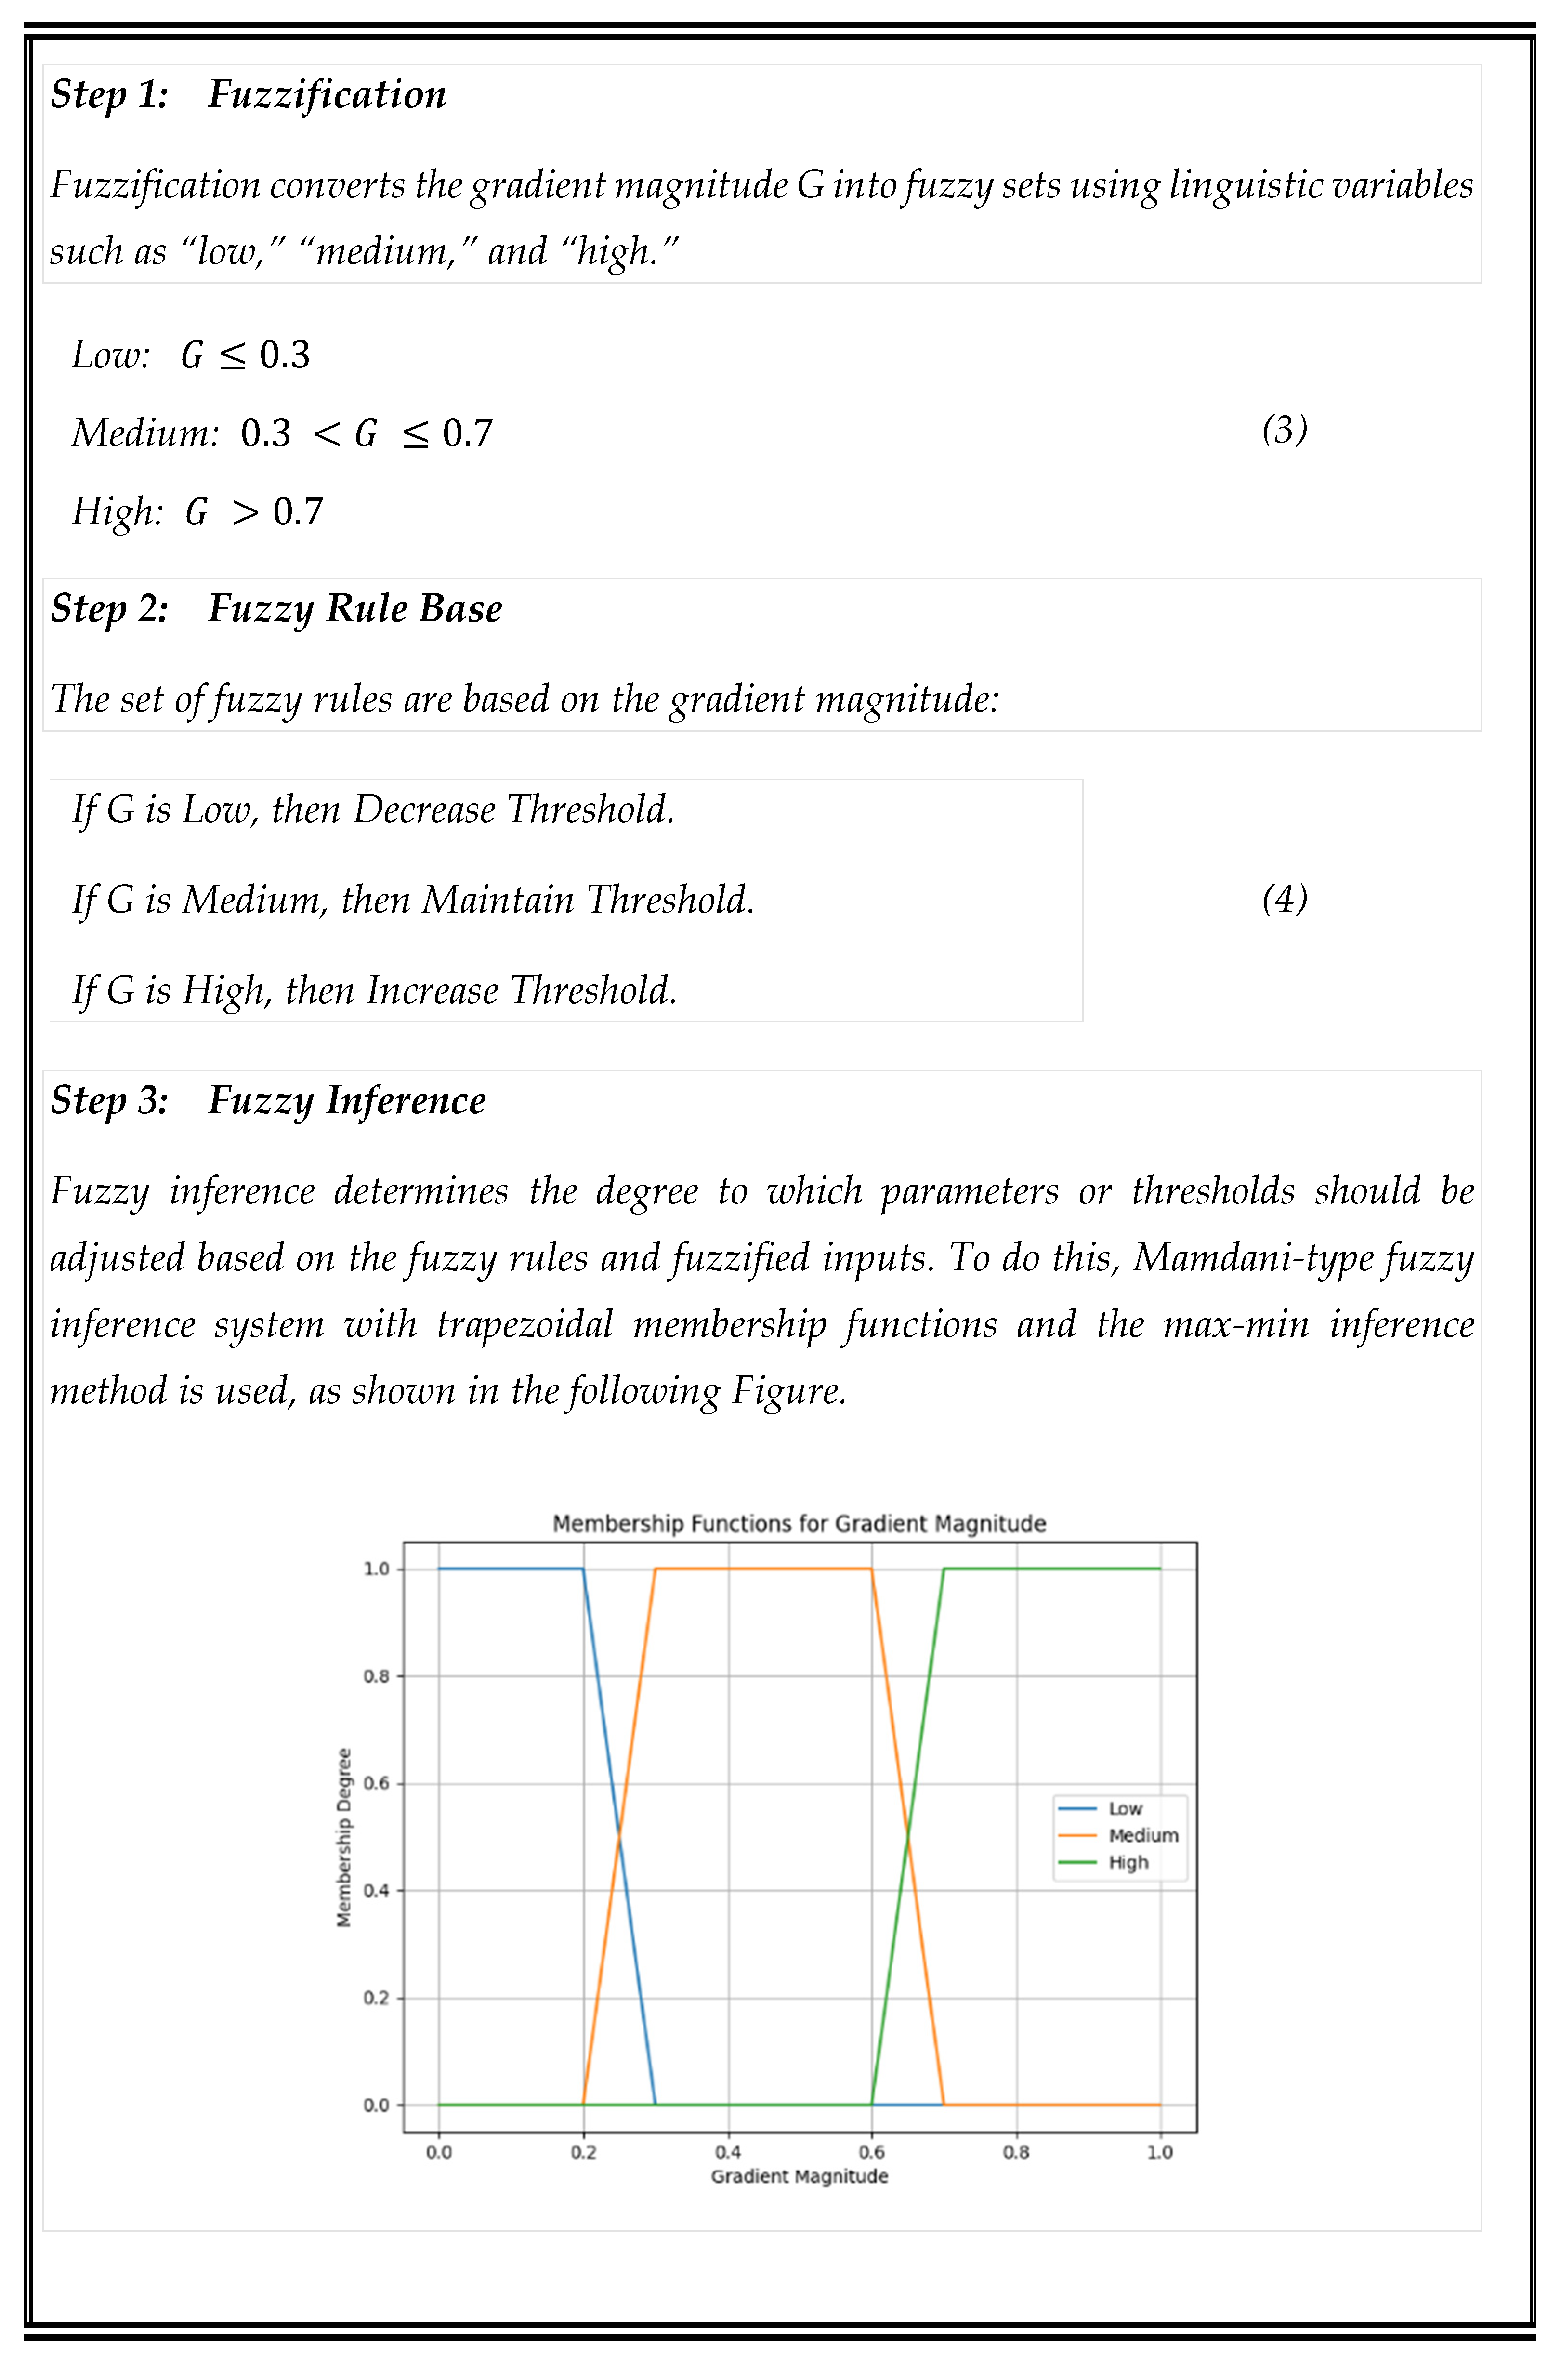
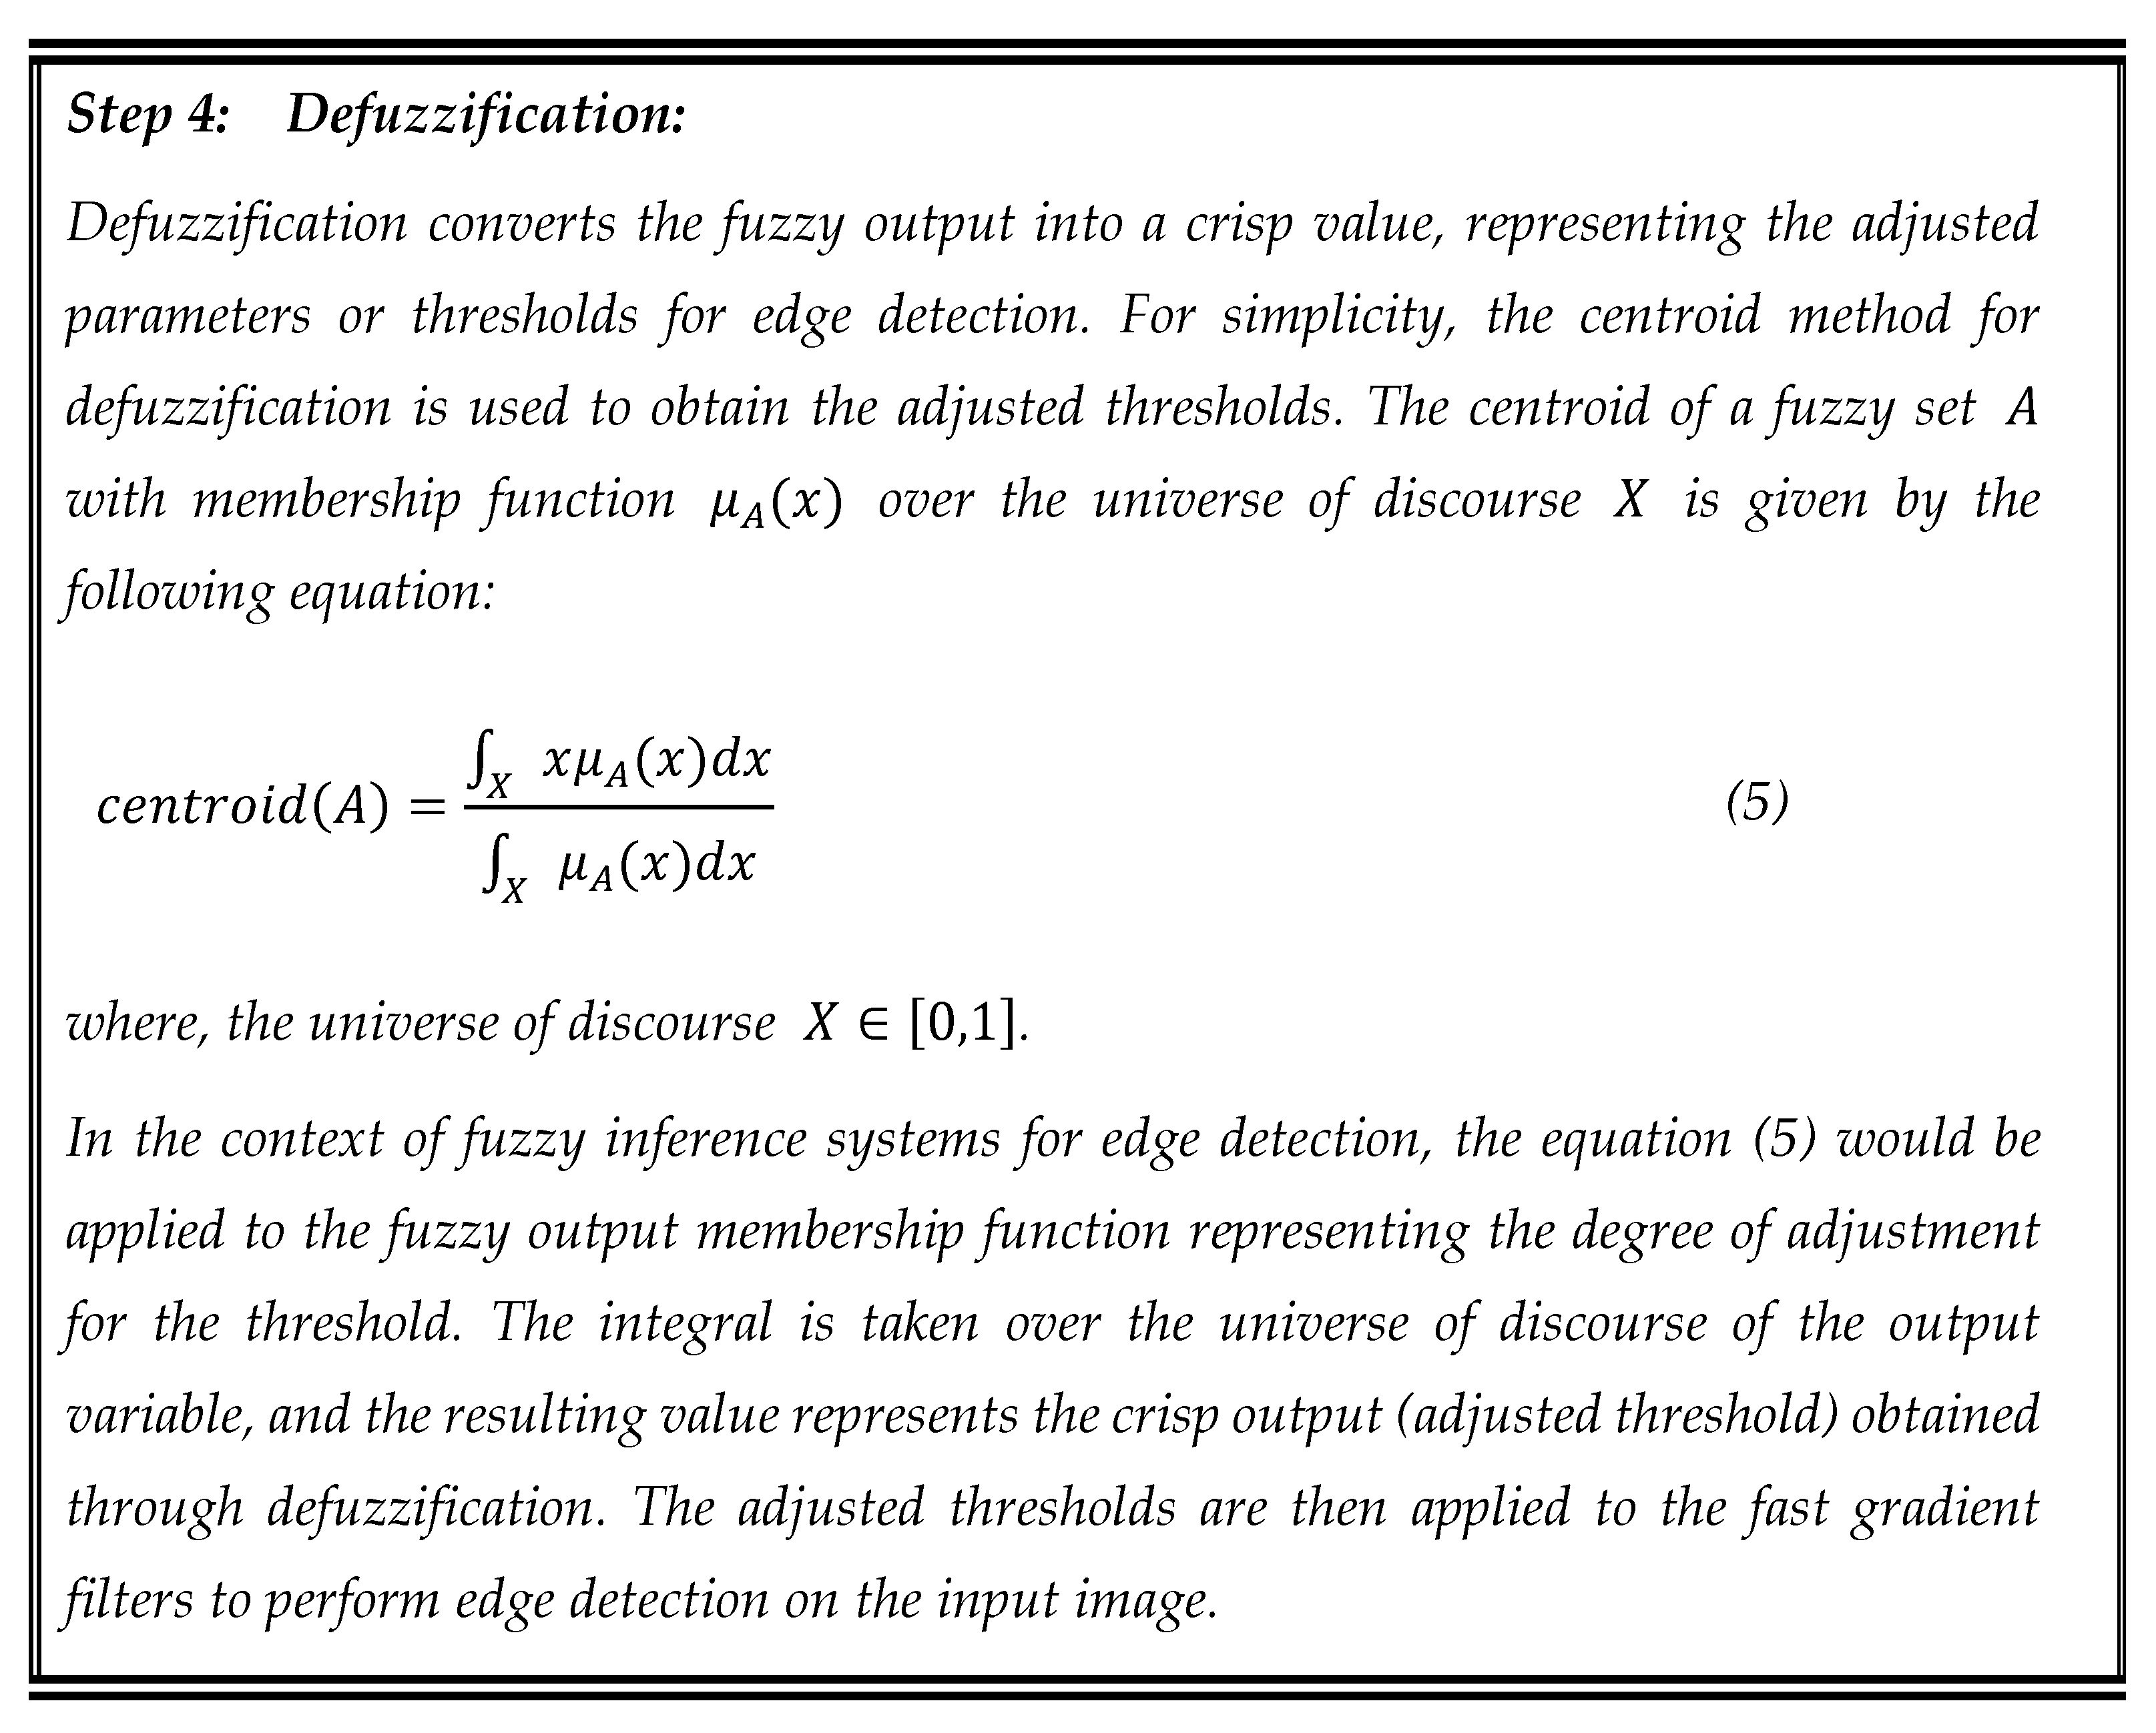
By applying fast gradient filters using a fuzzy inference system (FIS), iris localization algorithms can effectively identify the edges of the iris and differentiate them from surrounding structures such as eyelids. This facilitates accurate segmentation and subsequent processing steps in the iris recognition pipeline, ultimately improving match accuracy.
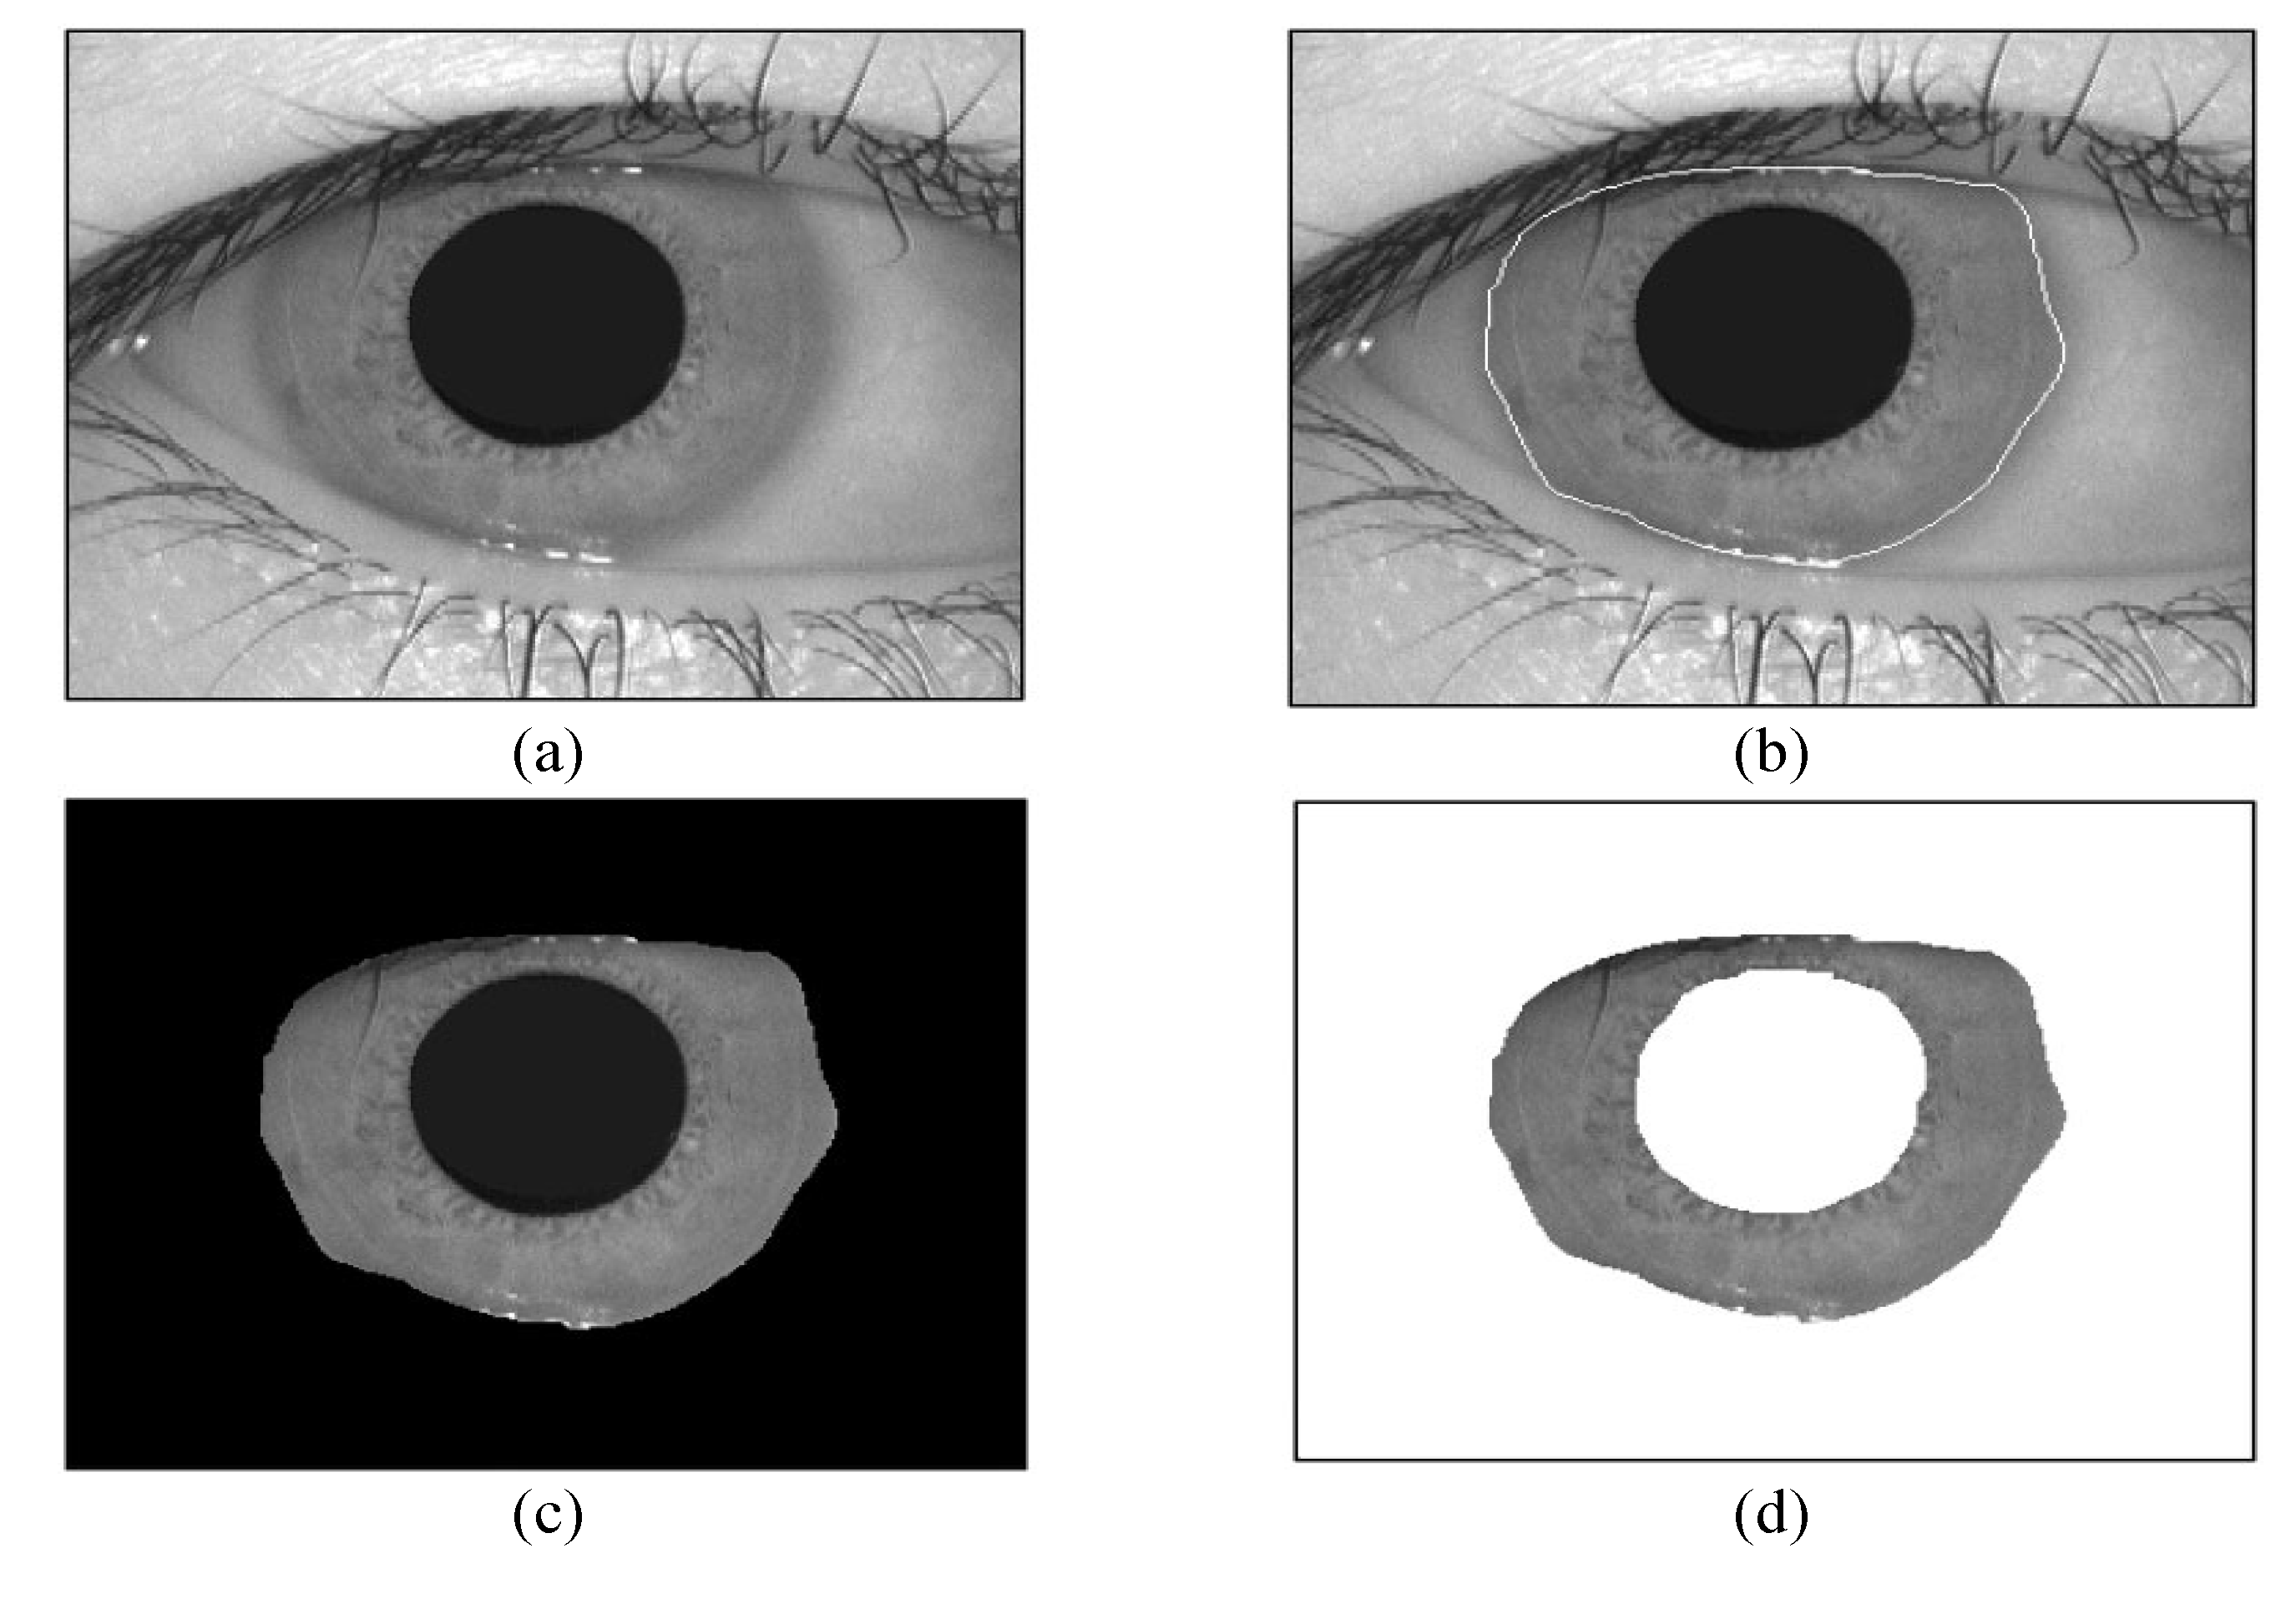
Figure 5 presents the localization of the iris through the fast gradient filters using a fuzzy inference system (FIS) and the reference edge detection.
2.2. Iris Segmentation Using Bald Eagle Search (BES) Algorithm
A novel method for iris segmentation using a bald eagle search (BES) algorithm [
18] is used for iris segmentation. This approach consists of three main stages: Select, Search, and Swoop. During the select phase, the algorithm thoroughly explores the entirety of the available search space in order to locate potential solutions, while the Search phase focuses on exploiting the selected area, and the Swoop phase targets the identification of the best solution.
In the select stage, bald eagles identify and select the best area within the selected search space where they can hunt for prey. This behavior is expressed mathematically through Equation (1).
where
is the total number of search agents,
is the parameter for controlling the changes in position that takes a value between
and
, and
is a random number that takes a value between
and
.
In the selection stage, an area is selected based on the available information from the previous stage. Another search area is randomly selected that differs from but is located near the previous search area. denotes the search space that is currently selected by bald eagles based on the best position identified during their previous search. The eagles randomly search all points near the previously selected search space.
The current movement of bald eagles is calculated by multiplying the randomly explored prior information by the factor . This procedure introduces random changes to all search points.
indicates that all information from the previous points has been used. The current movement is determined by multiplying the randomly searched prior information by α. This process randomly changes all search points.
In the search stage, the search process is within the selected search space and moves in different directions within a spiral space to accelerate their search. The best position for the swoop is mathematically expressed in Eq. (7).
where
is a parameter that takes a value between 5 and 10 for determining the corner between point search in the central point and
takes a value between 0.5 and 2 for determining the number of search cycles.
have values in between 0 and 1.
During the swooping stage, bald eagles swing from the optimal position within the search space to their target prey. Additionally, all points within the space also converge towards the optimal point. Equation (3) provides a mathematical representation of this behavior.
where
are the algorithmic numbers having values in the range
. Lastly, the final solutions in P are reported as the final population and the best solution obtained in the population for solving the problem.
2.3. Feature Extraction and Matching
Feature extraction is the most important and critical part of the iris recognition system. The successful recognition rate and reduction of classification time of two iris templates mostly depend on efficient feature extraction technique. This work explores the integration of DWT and PCA for feature extraction from images [
19].
In this section, the proposed technique produces an iris template with reduced resolution and runtime for classifying the iris templates. To produce the template, firstly DWT has been applied to the normalized iris image. Feature extraction using Discrete Wavelet Transform (DWT) is used in this work to capture and represent important characteristics of images in a multi-resolution framework.
The first step involves decomposing the image into four-frequency sub-bands, namely LL (low-low), LH (low-high), HL (high-low), and HH (high-high) using DWT. DWT achieves this by passing the signal through a series of low-pass and high-pass filters, followed by down sampling.
The LL sub-band represents the feature or characteristics of the iris, so that this sub-band can be considered for further processing.
Figure 5(a) shows the original iris image is (256 × 256). After applying DWT on a normalized iris image, the resolution of LL sub-band is (128 × 128). LL sub-band represents the lower resolution approximation iris with required feature or characteristics, as this sub-band has been used instead of the original normalized iris data for further processing using PCA. As the resolution of the iris template has been reduced, so the runtime of the classification will be similarly reduced.
PCA has found the most discriminating information presented in LL sub-band to form
feature matrix
PCA has found the most discriminating information presented in LL sub-band to form
feature matrix
In the second step, PCA has found the most discriminating information presented in LL sub-band to form feature matrix, and the resultant feature matrix has been passed into the classifier for recognition. The mathematical analysis of PCA includes:
The mean of each vector of the matrix LL of size
is given in the equation:
The mean is subtracted from all of the vectors to produce a set of zero mean vectors is given in the equation.
where
is the zero mean vectors,
is each element of the column vector,
is the mean of each column vector.
The Covariance matrix is computed using the equation:
The Eigenvectors and Eigenvalues are computed using the equation:
where
are the Eigenvalue and
are the Eigenvectors.
Each of an Eigenvectors is multiplied with zero mean vectors
to form the feature vector. The feature vector is given by the equation:
In iris recognition, a similarity measure is utilized to quantify the resemblance between two iris patterns based on the features extracted from them. Various techniques are employed for comparing irises, each with its own advantages and limitations. For the purpose of classification, Fuzzy K-nearest neighbour algorithm seems to be an intriguing approach for iris recognition.
The Fuzzy KNN algorithm revolves around the principle of membership assignment [
20]. Similar to the classic KNN algorithm, the variant proceeds to find the k nearest neighbours of a testing dataset from the training dataset. It then proceeds to assign “membership” values to each class found in the list of k Nearest Neighbours.
The membership values are calculated using a fuzzy math algorithm that focuses on the weight of each class. The formula for the calculation is:
where: P is the test pattern and
.
Finally, the class with the highest membership is then selected for the classification result.
2.4. Locating the Center of the Iris
Once the iris boundary is detected, locating the center involves finding the centroid of the segmented iris region. This can be achieved using the following equations:
where (
are the coordinates of the iris boundary points, and
is the total number of boundary points.
These equations provide a basic framework for iris segmentation and center localization. However, it’s important to note that implementation details may vary depending on factors such as image quality, noise levels, and specific requirements of the application. Adjustments and optimizations may be necessary to achieve optimal segmentation and center localization performance.
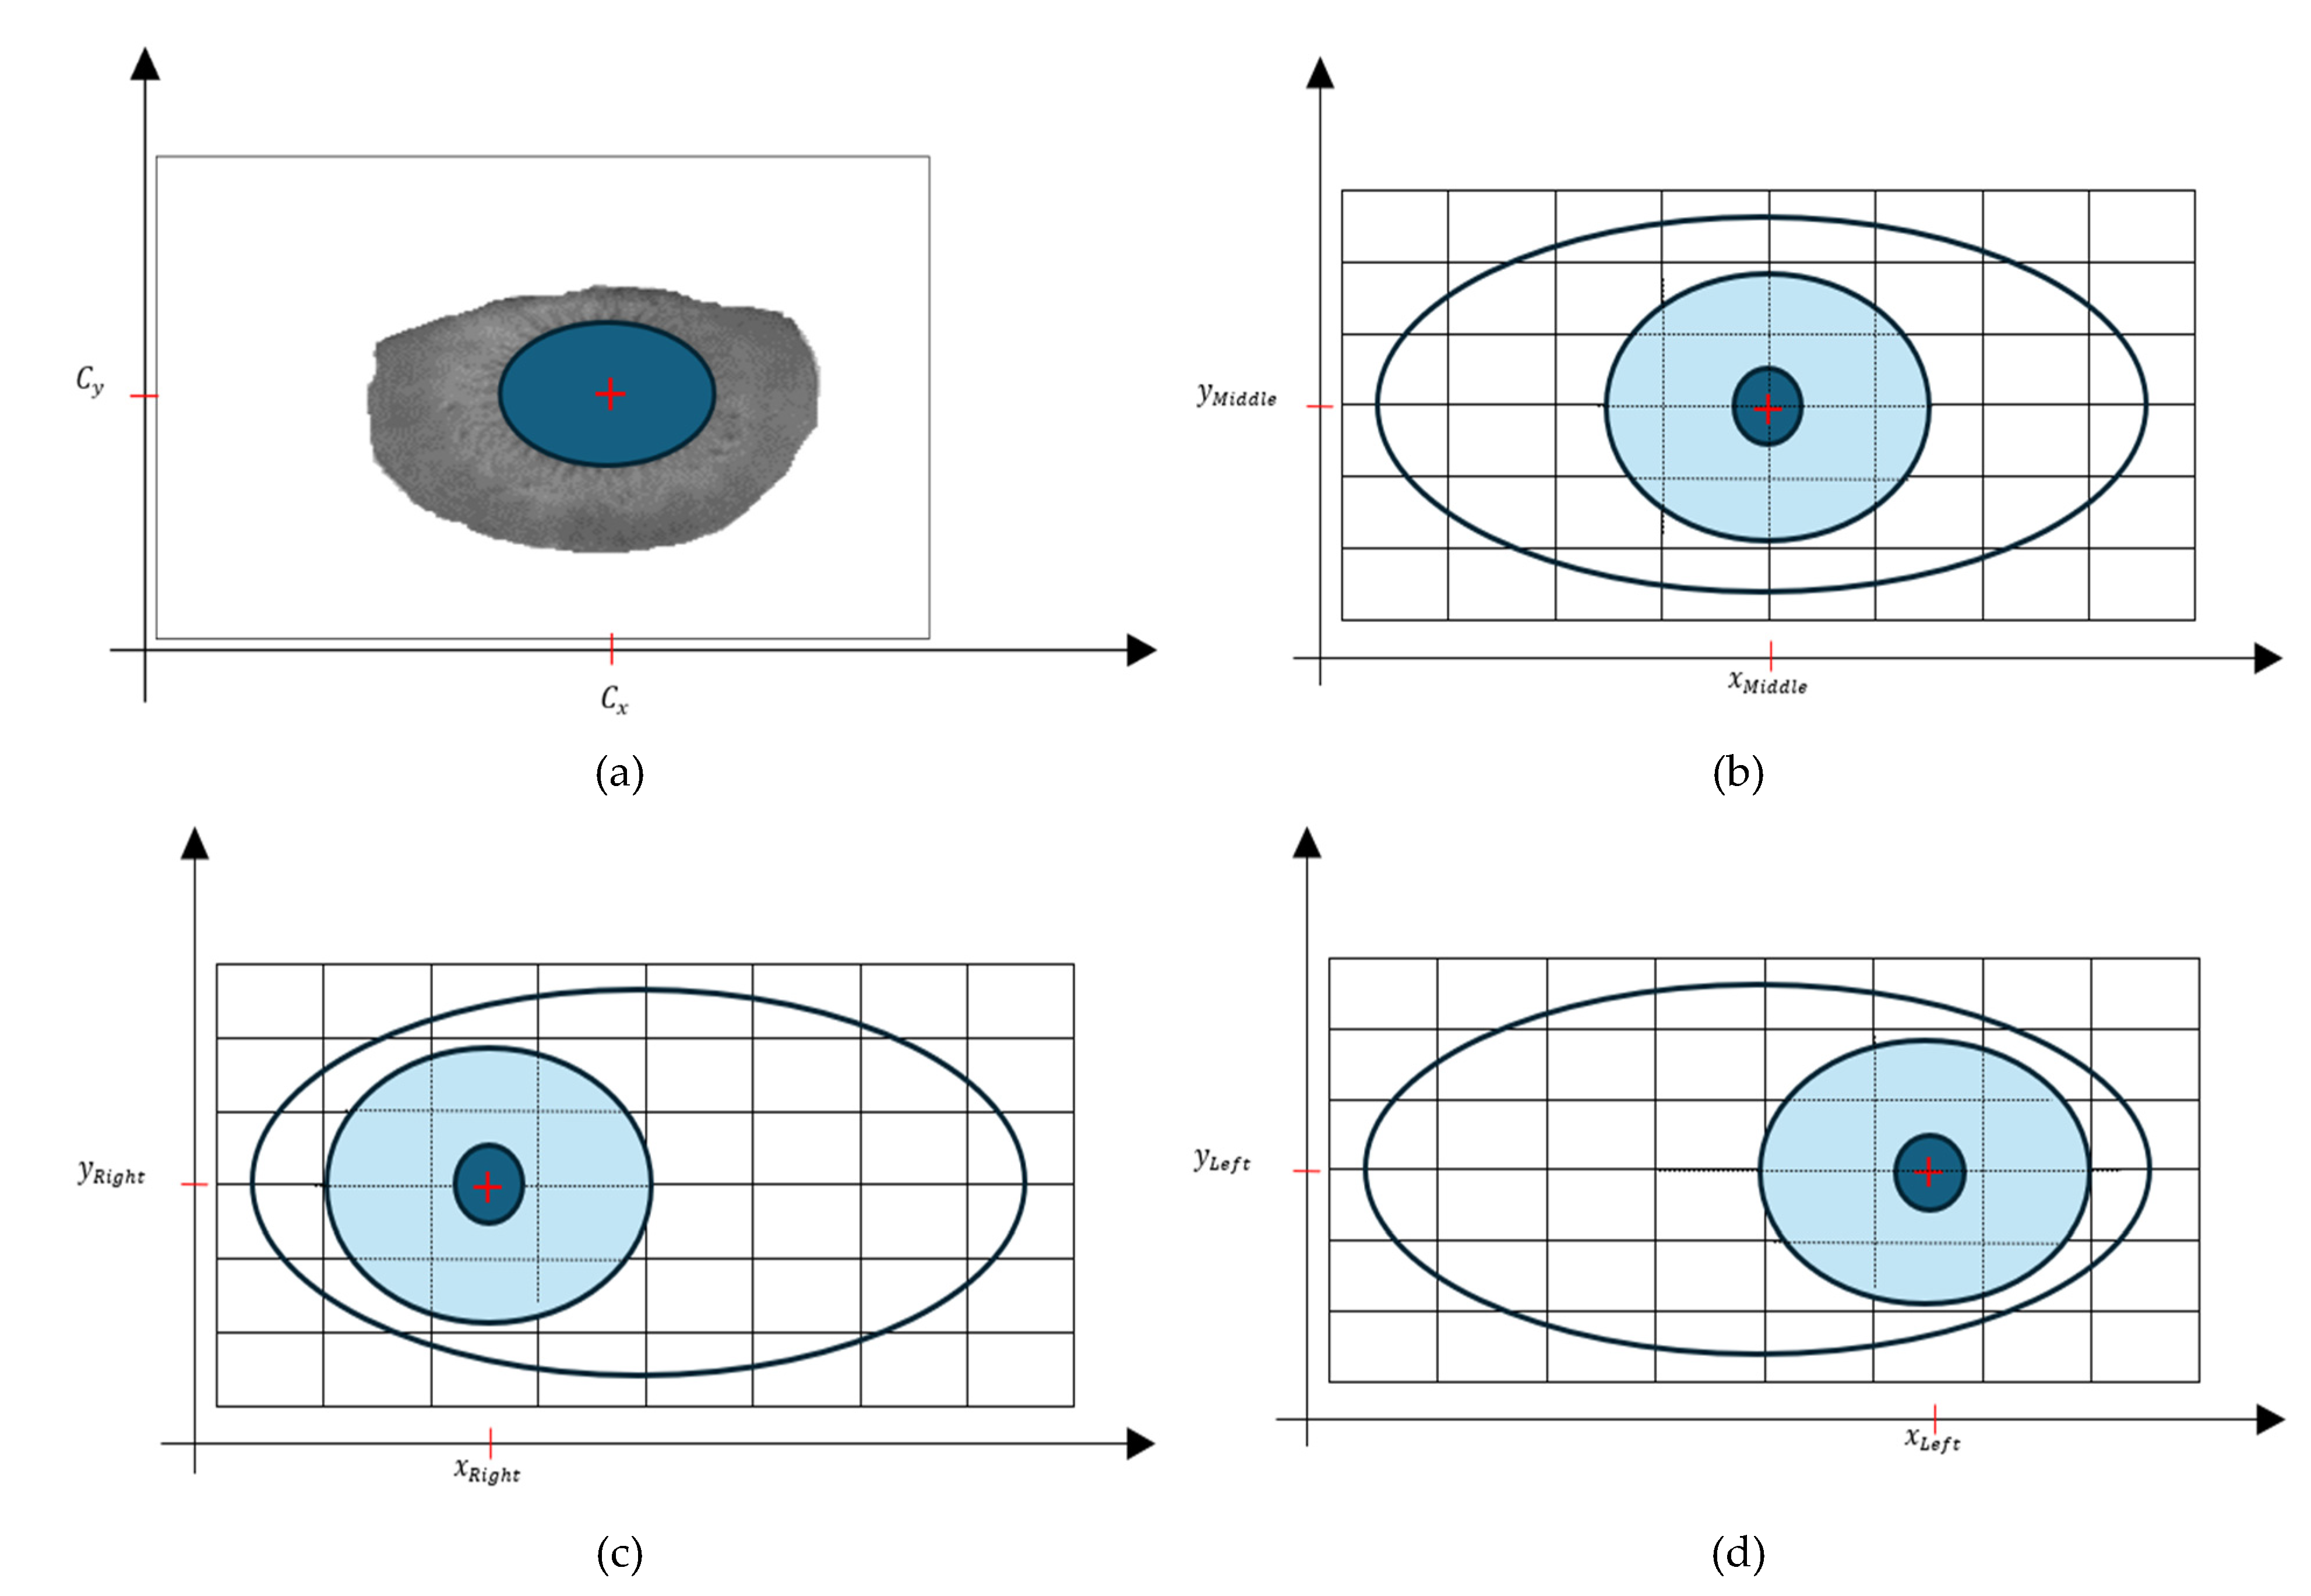
To select the desired direction of gaze from the iris center coordinates (
,
), the Euclidean distance is calculated between the iris center and the coordinates representing each direction of gaze (Up, Left, Middle, Right, Down, and Closed). Then, the direction with the lowest Euclidean distance is chosen as the desired direction. Samples of the coordinates representing the direction (Middle, Right and Left) are presented in
Figure 6. To calculate the Euclidean distance (
) between the iris center (
,
) and the coordinates representing the “Right” direction, you can use the following formula:
3. Experimental Results and Discussion
To evaluate the efficiency and accuracy of the proposed iris recognition method, experiments are conducted comparing its performance against existing methods, as described earlier. These experiments are typically carried out using MATLAB software version 10, which provides a comprehensive environment for image processing, feature extraction, classification, and evaluation.
For performance analysis, the iris images in the CASIA Iris database are initially stored in gray level format, utilizing 8 bits with integer values ranging from 0 to 255. This format allows for efficient representation of grayscale intensity levels, facilitating subsequent image processing and analysis.
The CASIA Iris database is a significant dataset comprising 756 images captured from 108 distinct individuals. As one of the largest publicly available iris databases, it offers a diverse and comprehensive collection of iris images for evaluation purposes. The database encompasses variations in factors such as illumination conditions, occlusions, and pose variations, making it suitable for assessing the robustness and accuracy of iris recognition algorithms under real-world scenarios.
After performing the image segmentation detailed in
Section 2.2, the homogeneous areas within each image were acquired. The BES algorithm is employed to handle a predetermined number of regions in an image (specifically, the iris and pupil) for segmentation purposes.
Figure 7 displays the segmentation results for an example image from the database. In this figure, (a) depicts the original image, while (d) illustrates its region representation. The segmentation results demonstrate that the two regions were accurately segmented through the bald eagle search (BES) algorithm.
To evaluate accuracy, a segmentation sensitivity criterion is employed to ascertain the number of correctly classified pixels. This criterion measures the ability of the segmentation algorithm to accurately identify and delineate regions of interest within the image. By comparing the segmented regions to ground truth annotations or manually labeled regions, the segmentation sensitivity criterion quantifies the accuracy of the segmentation process. This evaluation metric provides valuable insights into the performance of the segmentation algorithm, enabling researchers to assess its effectiveness and reliability in accurately partitioning images into meaningful regions.
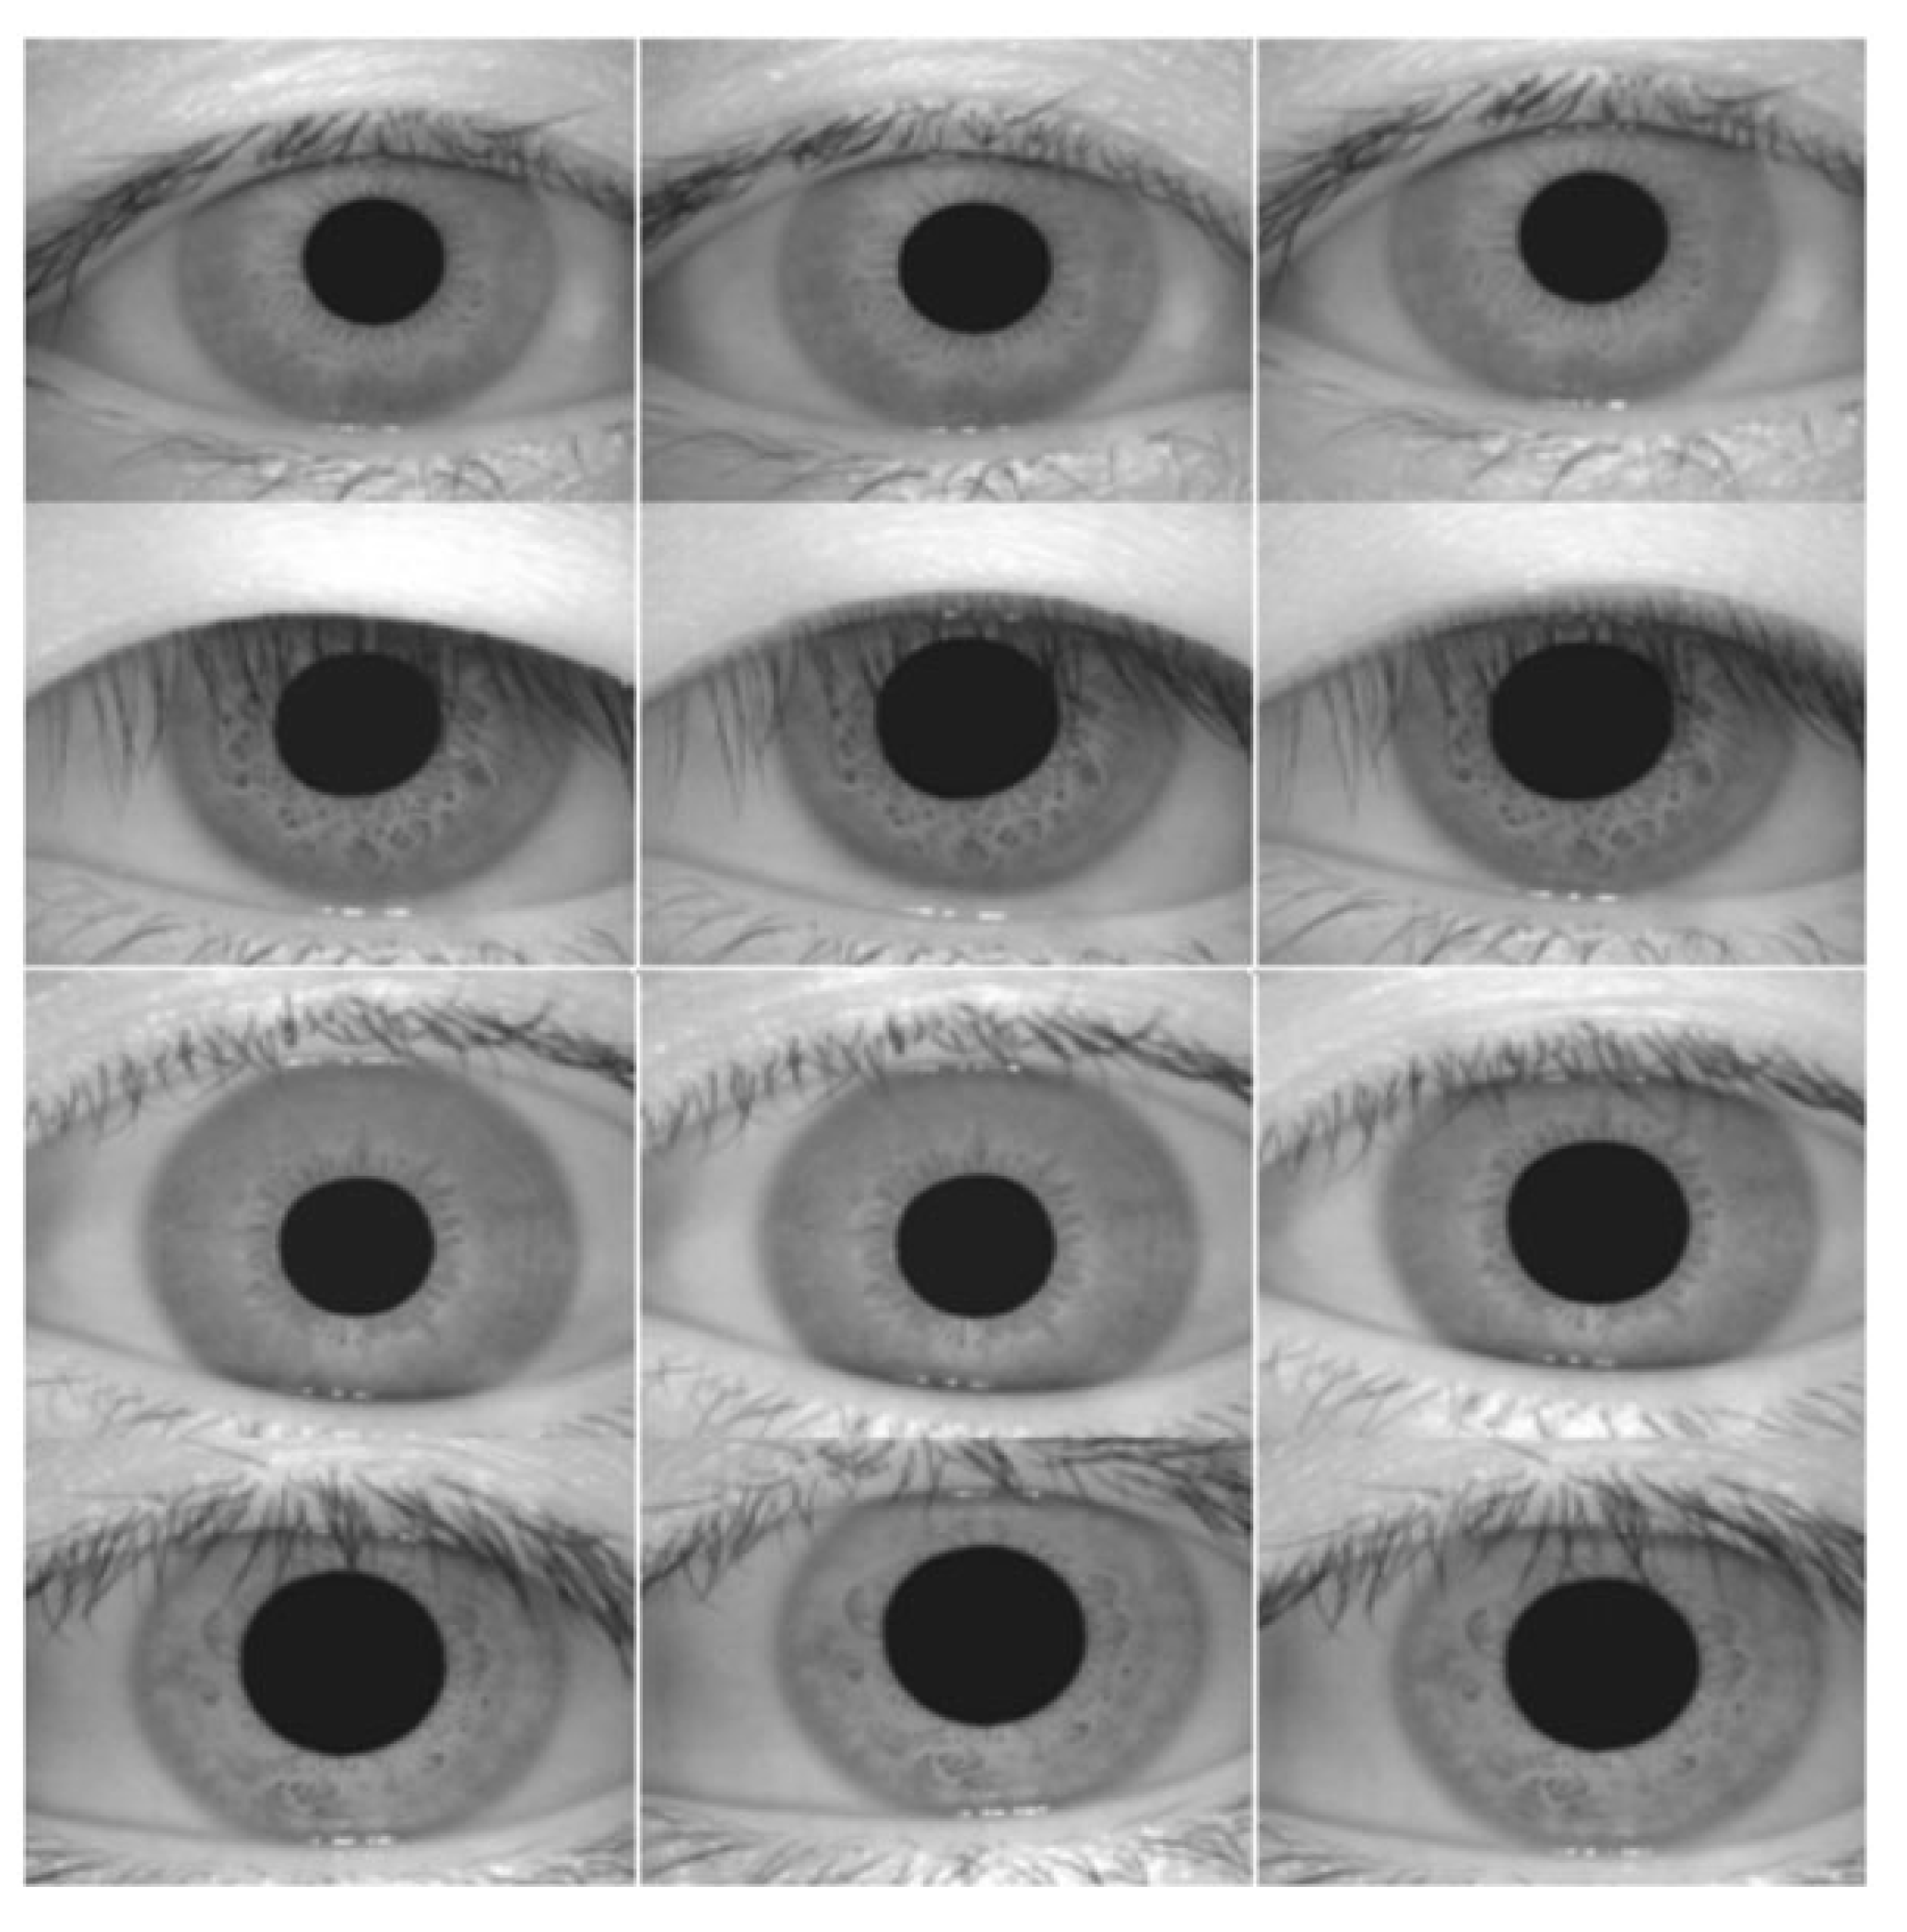
Figure 8 shows sample iris images from the evaluation dataset, comprised of 756 images sourced from the CASIA database. These images serve as representative examples utilized in the evaluation process. For the segmentation of the test database, the computational effort required was significant. The segmentation process encompassed a total duration of 5.5 hours to process all 756 images. On average, the segmentation algorithm took approximately 1.9 seconds to process each individual image. The computational time required for segmentation is an important consideration, as it directly impacts the efficiency and feasibility of the iris recognition system and the control of the robot. While the segmentation process may be time-consuming, achieving accurate and reliable segmentation results is crucial for subsequent stages of feature extraction, matching, and classification.
The segmentation sensitivity of some existing methods FAMT [
21], FSRA [
22], BWOA [
23] and the bald eagle search (BES) algorithm [
18] is shown in
Table 1. It can be seen from
Table 1 that 31.77%, 20.44%, and 2.73% of pixels were incorrectly segmented by FAMT [
21], FSRA [
22], BWOA [
23] and the bald eagle search (BES) algorithm [
18], respectively.
Indeed, the experimental results indicate that the BES algorithm surpasses existing methods in terms of segmentation accuracy [
24]. The optimal segmentation of the two regions is achieved through the BES algorithm.
We calculated the segmentation sensitivity as follows:
where:
: is the number of correctly classified pixels.
: is the size of image.
The comprehensive analysis conducted in this study involved randomly dividing the 756 images into training and testing datasets.
The dataset is partitioned into training and testing subsets using a 4:3 ratio. Specifically, 432 images are randomly chosen for the training set, while 324 images are selected from all cases to form the test set. Within the training set, four iris images are selected for each subject to facilitate feature extraction.
Depending on the total number of images chosen, the training set may contain 108, 216, 324, or 432 images. Importantly, for each individual, irises with matching indices are chosen for both the training and testing sets to ensure consistency in the evaluation process.
To reduce the dimensionality of the training set, a subset of feature vectors is randomly selected. Feature vectors corresponding to these selected features are then utilized to construct a smaller training set. This approach aims to minimize the computational complexity required by the FKNN classifier, as the reduced feature set results in fewer operations during classification.
Let
be the original feature matrix with dimensions
, where
is the number of feature vectors.
, and
be subsets of feature vectors randomly selected, each containing 60, 100, and 128 feature vectors respectively. As depicted in
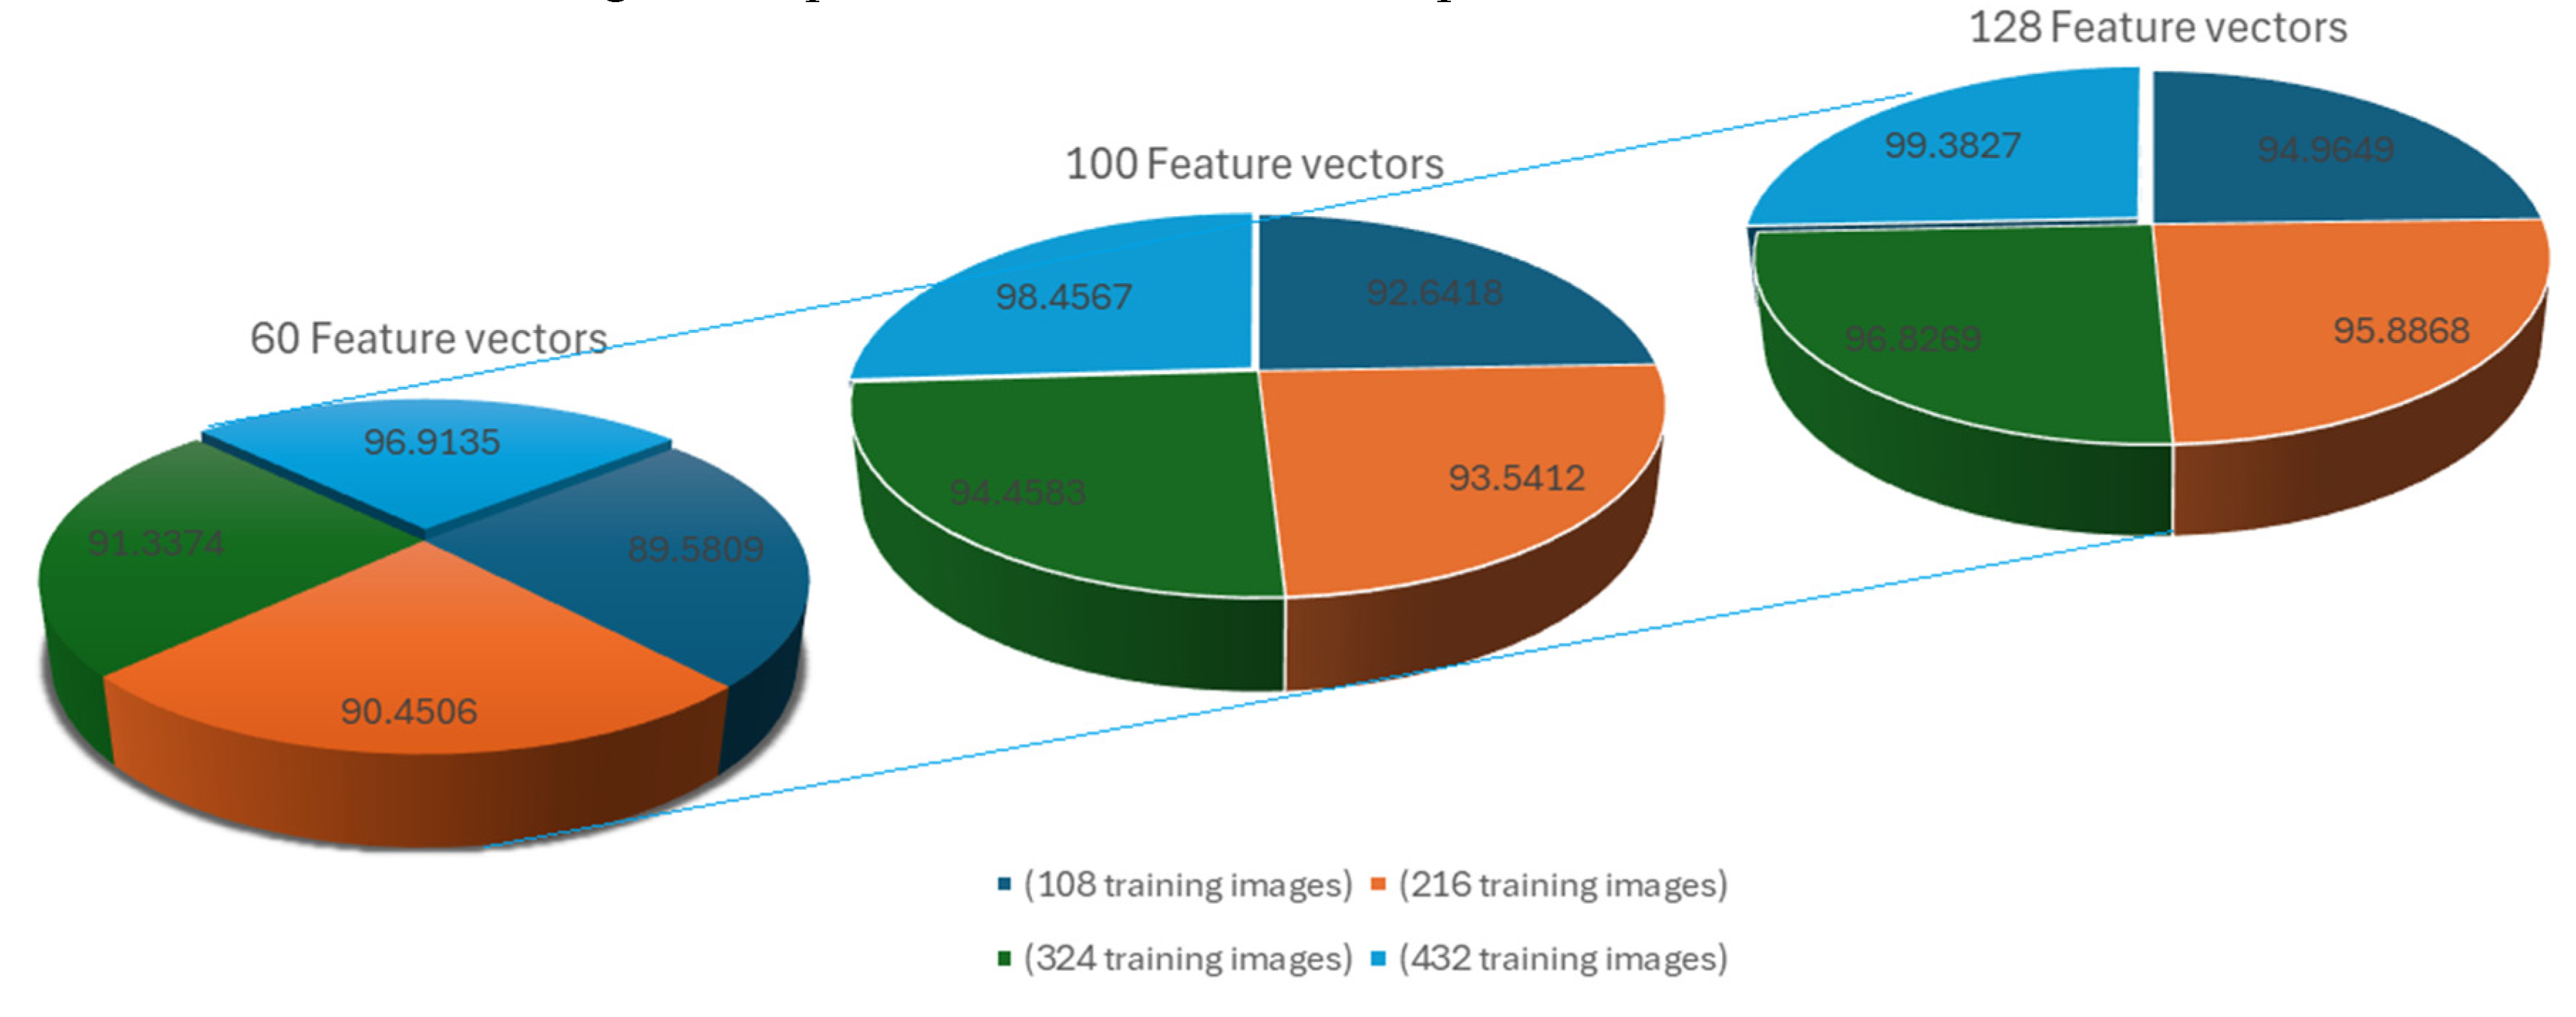
Figure 9, it is clear that augmenting the quantity of training images leads to an improvement in recognition accuracy. When applying the proposed method with a total of 432 training images (4 images per individual) and utilizing 128 feature vectors,
Figure 9 illustrates that the recognition performance achieves a peak level of 99.3827%.
However, we used the iris recognition rate in our evaluation [
25]. We calculated the iris recognition rate as follows:
where:
IRR%: Face Recognition Rate.
TNF: Total Number of Faces.
TNFR: Total number of False Recognition.
Furthermore, numerical comparisons of the Equal Error Rate (EER), Iris Recognition Rate (IRR) [
25], True Positive (TP), False Positive (FP), and False Negative (FN) are provided as benchmarks against various contemporary techniques in the face recognition literature.
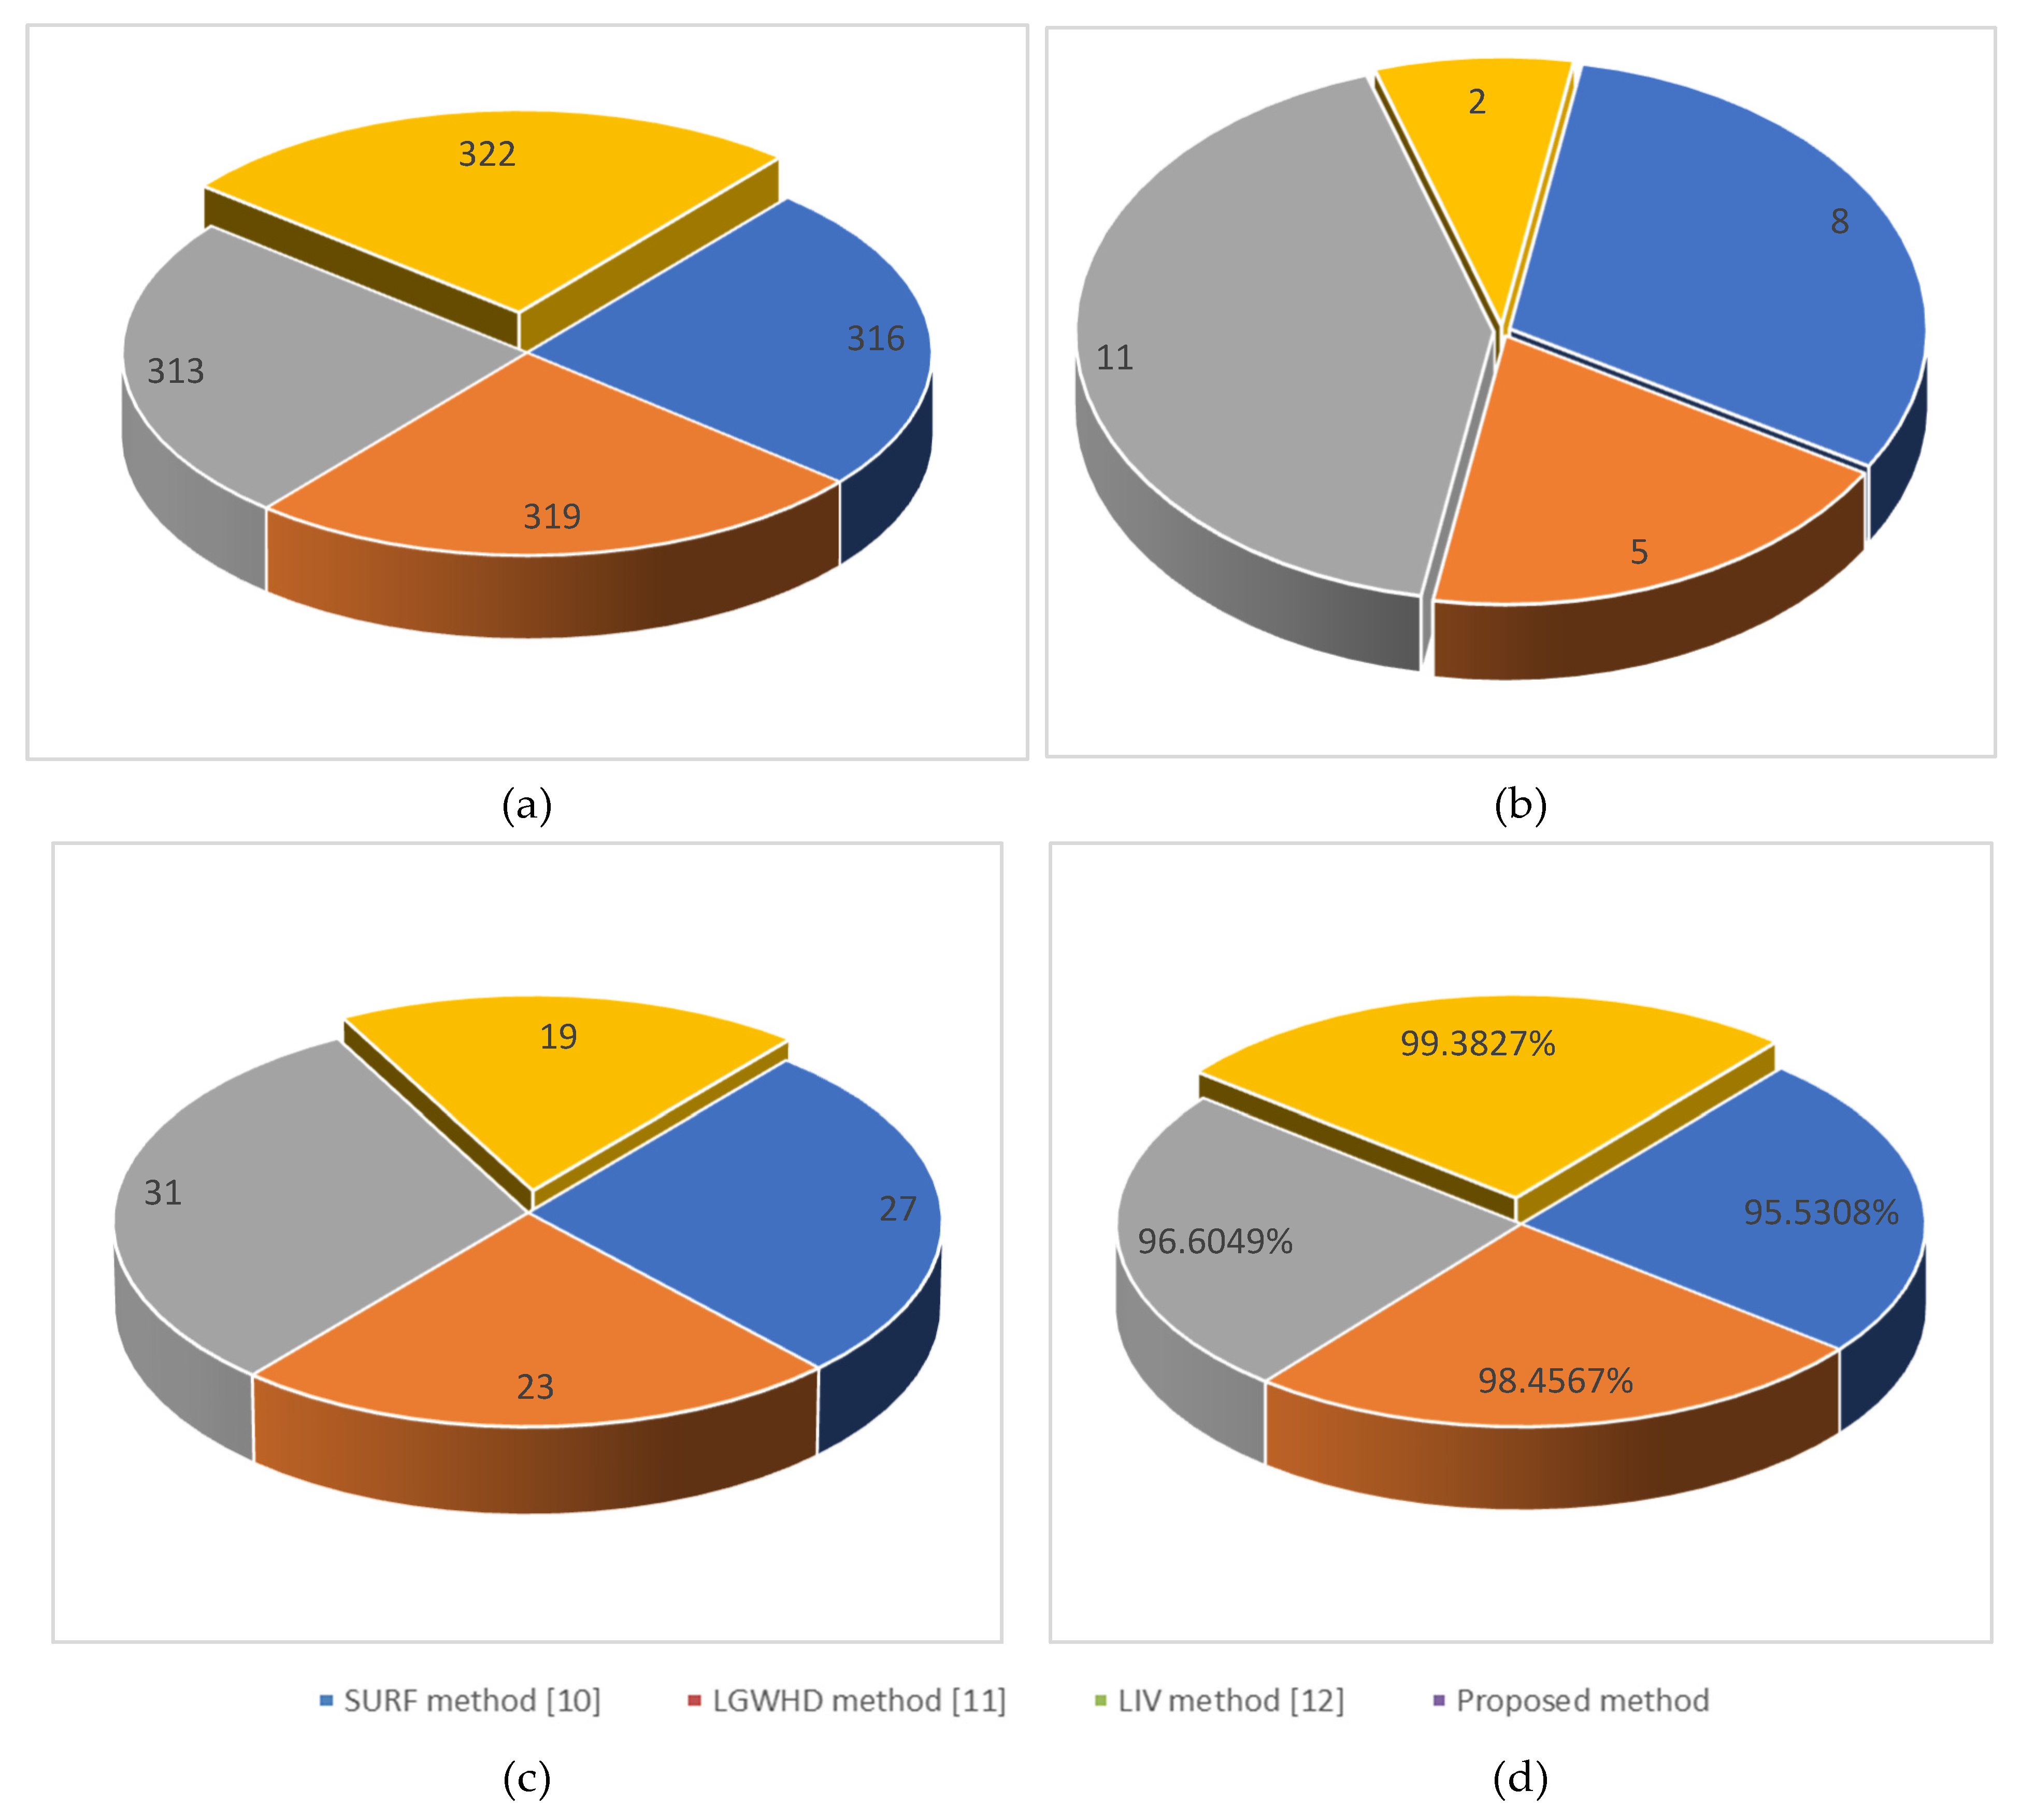
Figure 10 presents a numerical comparison of iris recognition utilizing various methods including the Speeded Up Robust Features (SURF) method [
10], the Log-Gabor wavelets and the Hamming distance method (LGWHD) [
11] and the Local intensity variation method (LIV) [
12], on the CASIA database. In this comparison, 57% of samples for each individual are allocated to the training set, while the remaining 43% are utilized in the test set.
Additionally,
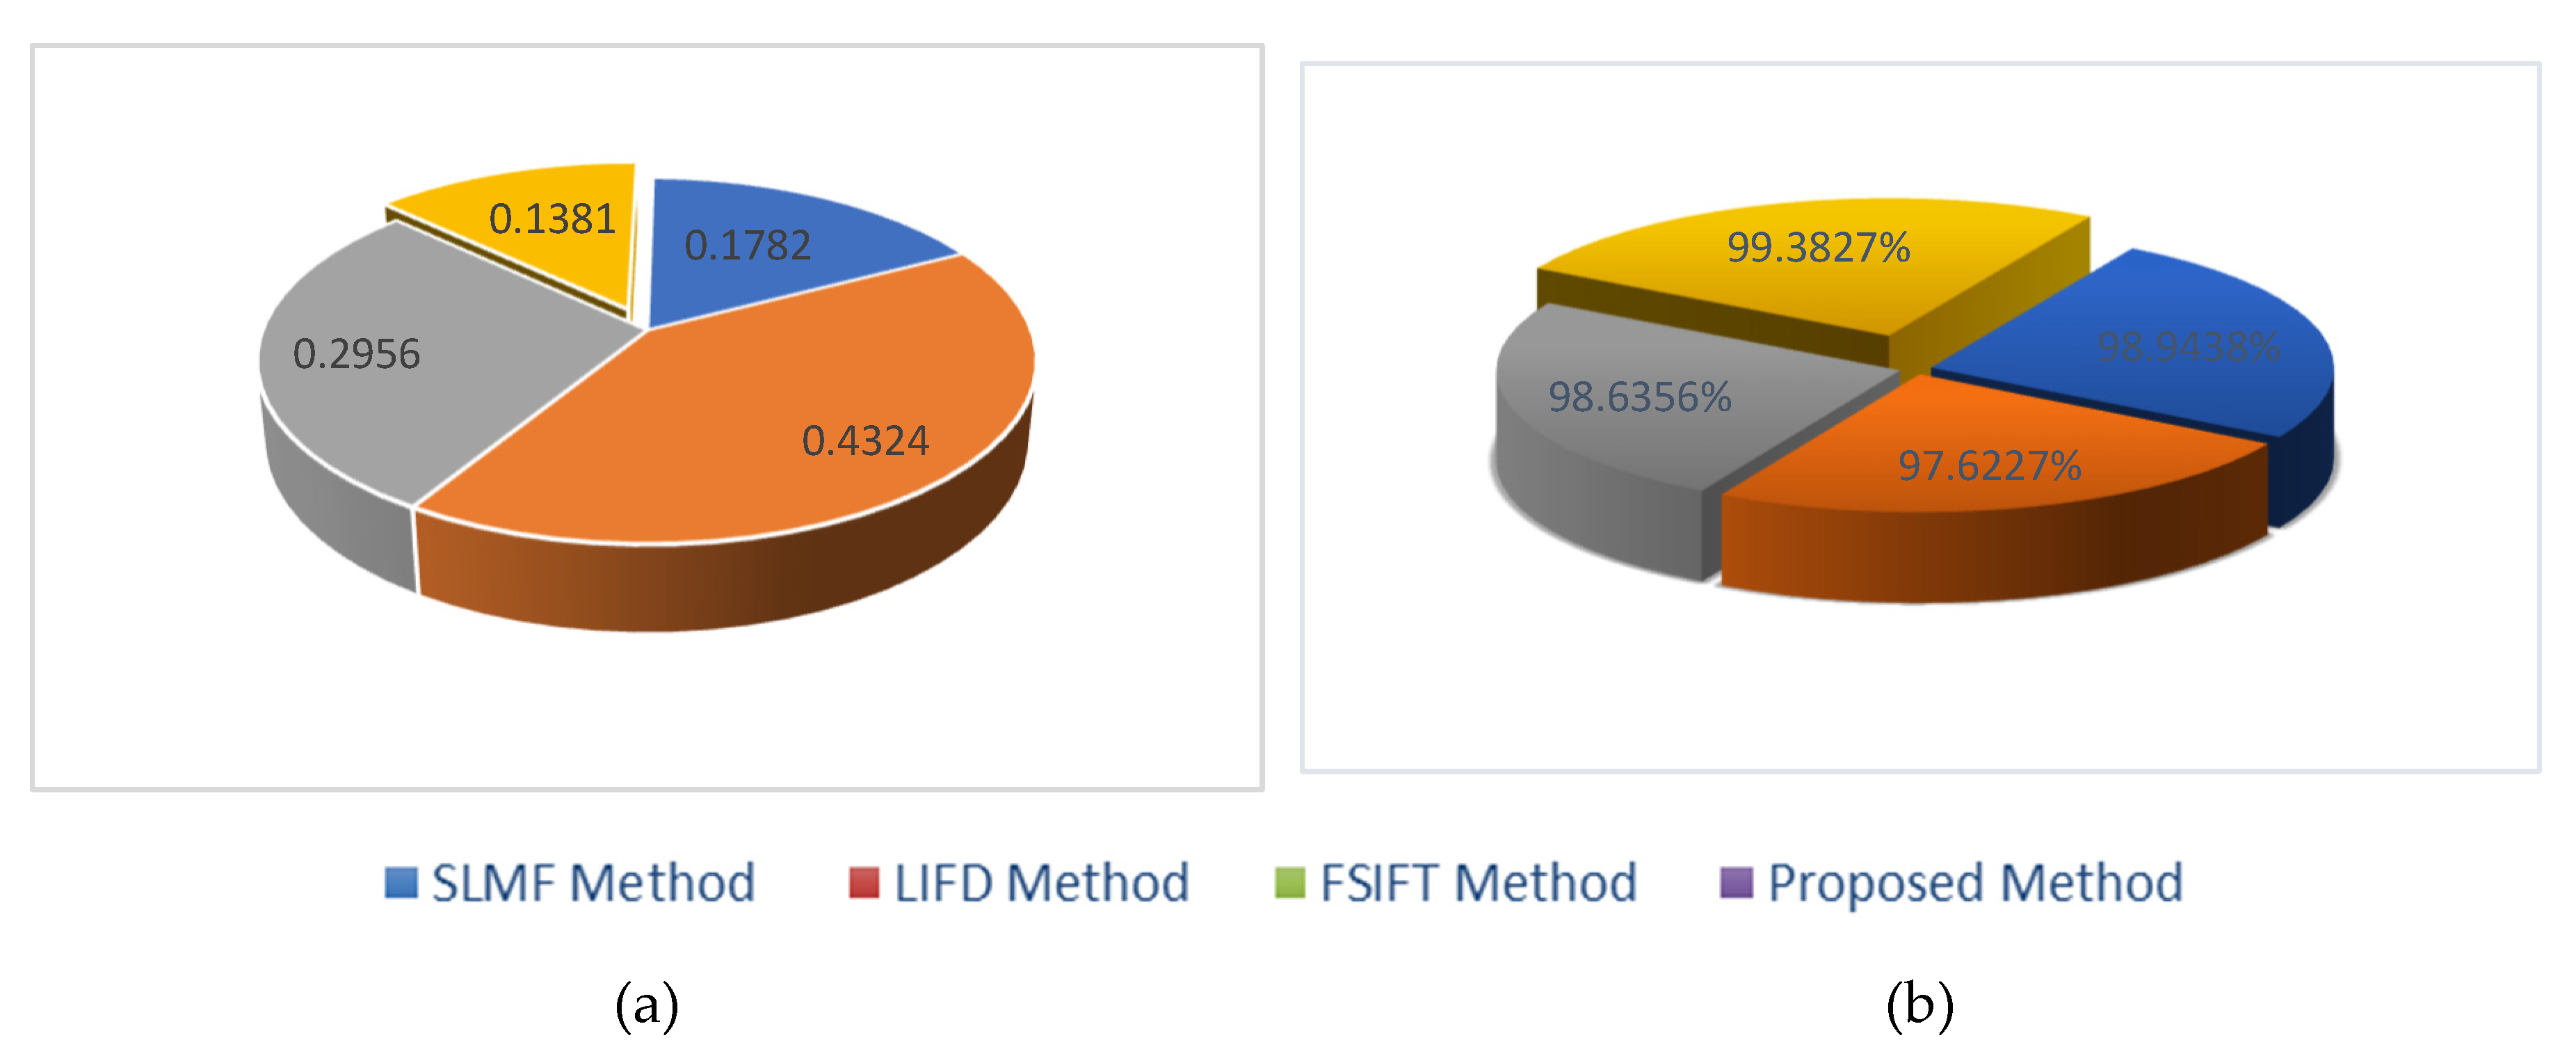
Figure 11 provides intuitive comparisons between the supervised learning based on matching features (SLMF) [
26], the local invariant feature descriptor (LIFD) [
27], and the Fourier-SIFT method (FSIFT) [
28] in terms of Equal Error Rate (EER) and Iris Recognition Rate (IRR).
As shown in
Figure 11, the proposed method achieves an Equal Error Rate (EER) of 0.1381% and an Iris Recognition Rate (IRR) of 99.3827%. Particularly, the proposed method significantly outperforms other approaches according to the numerical comparison method. Furthermore, from
Table 2, it is evident that the false positive rate (FPR) is 0.6172%, indicating a higher accuracy rate achieved by the proposed method.
The computational time required for segmentation and classification is an important consideration, as it directly impacts the efficiency and feasibility of the iris recognition system and the control of the robot.
On average, the segmentation algorithm required around 1.9 seconds to process each image, and the classification algorithm took approximately 1.3 seconds for iris recognition and localization of the iris center. The computational times for both segmentation and classification are crucial for assessing the feasibility of real-time operation in robotics. The relatively short processing times observed in the experiments indicate promising potential for real-time operation. However, further optimization may be necessary to achieve even faster processing speeds, particularly for applications requiring rapid responses.
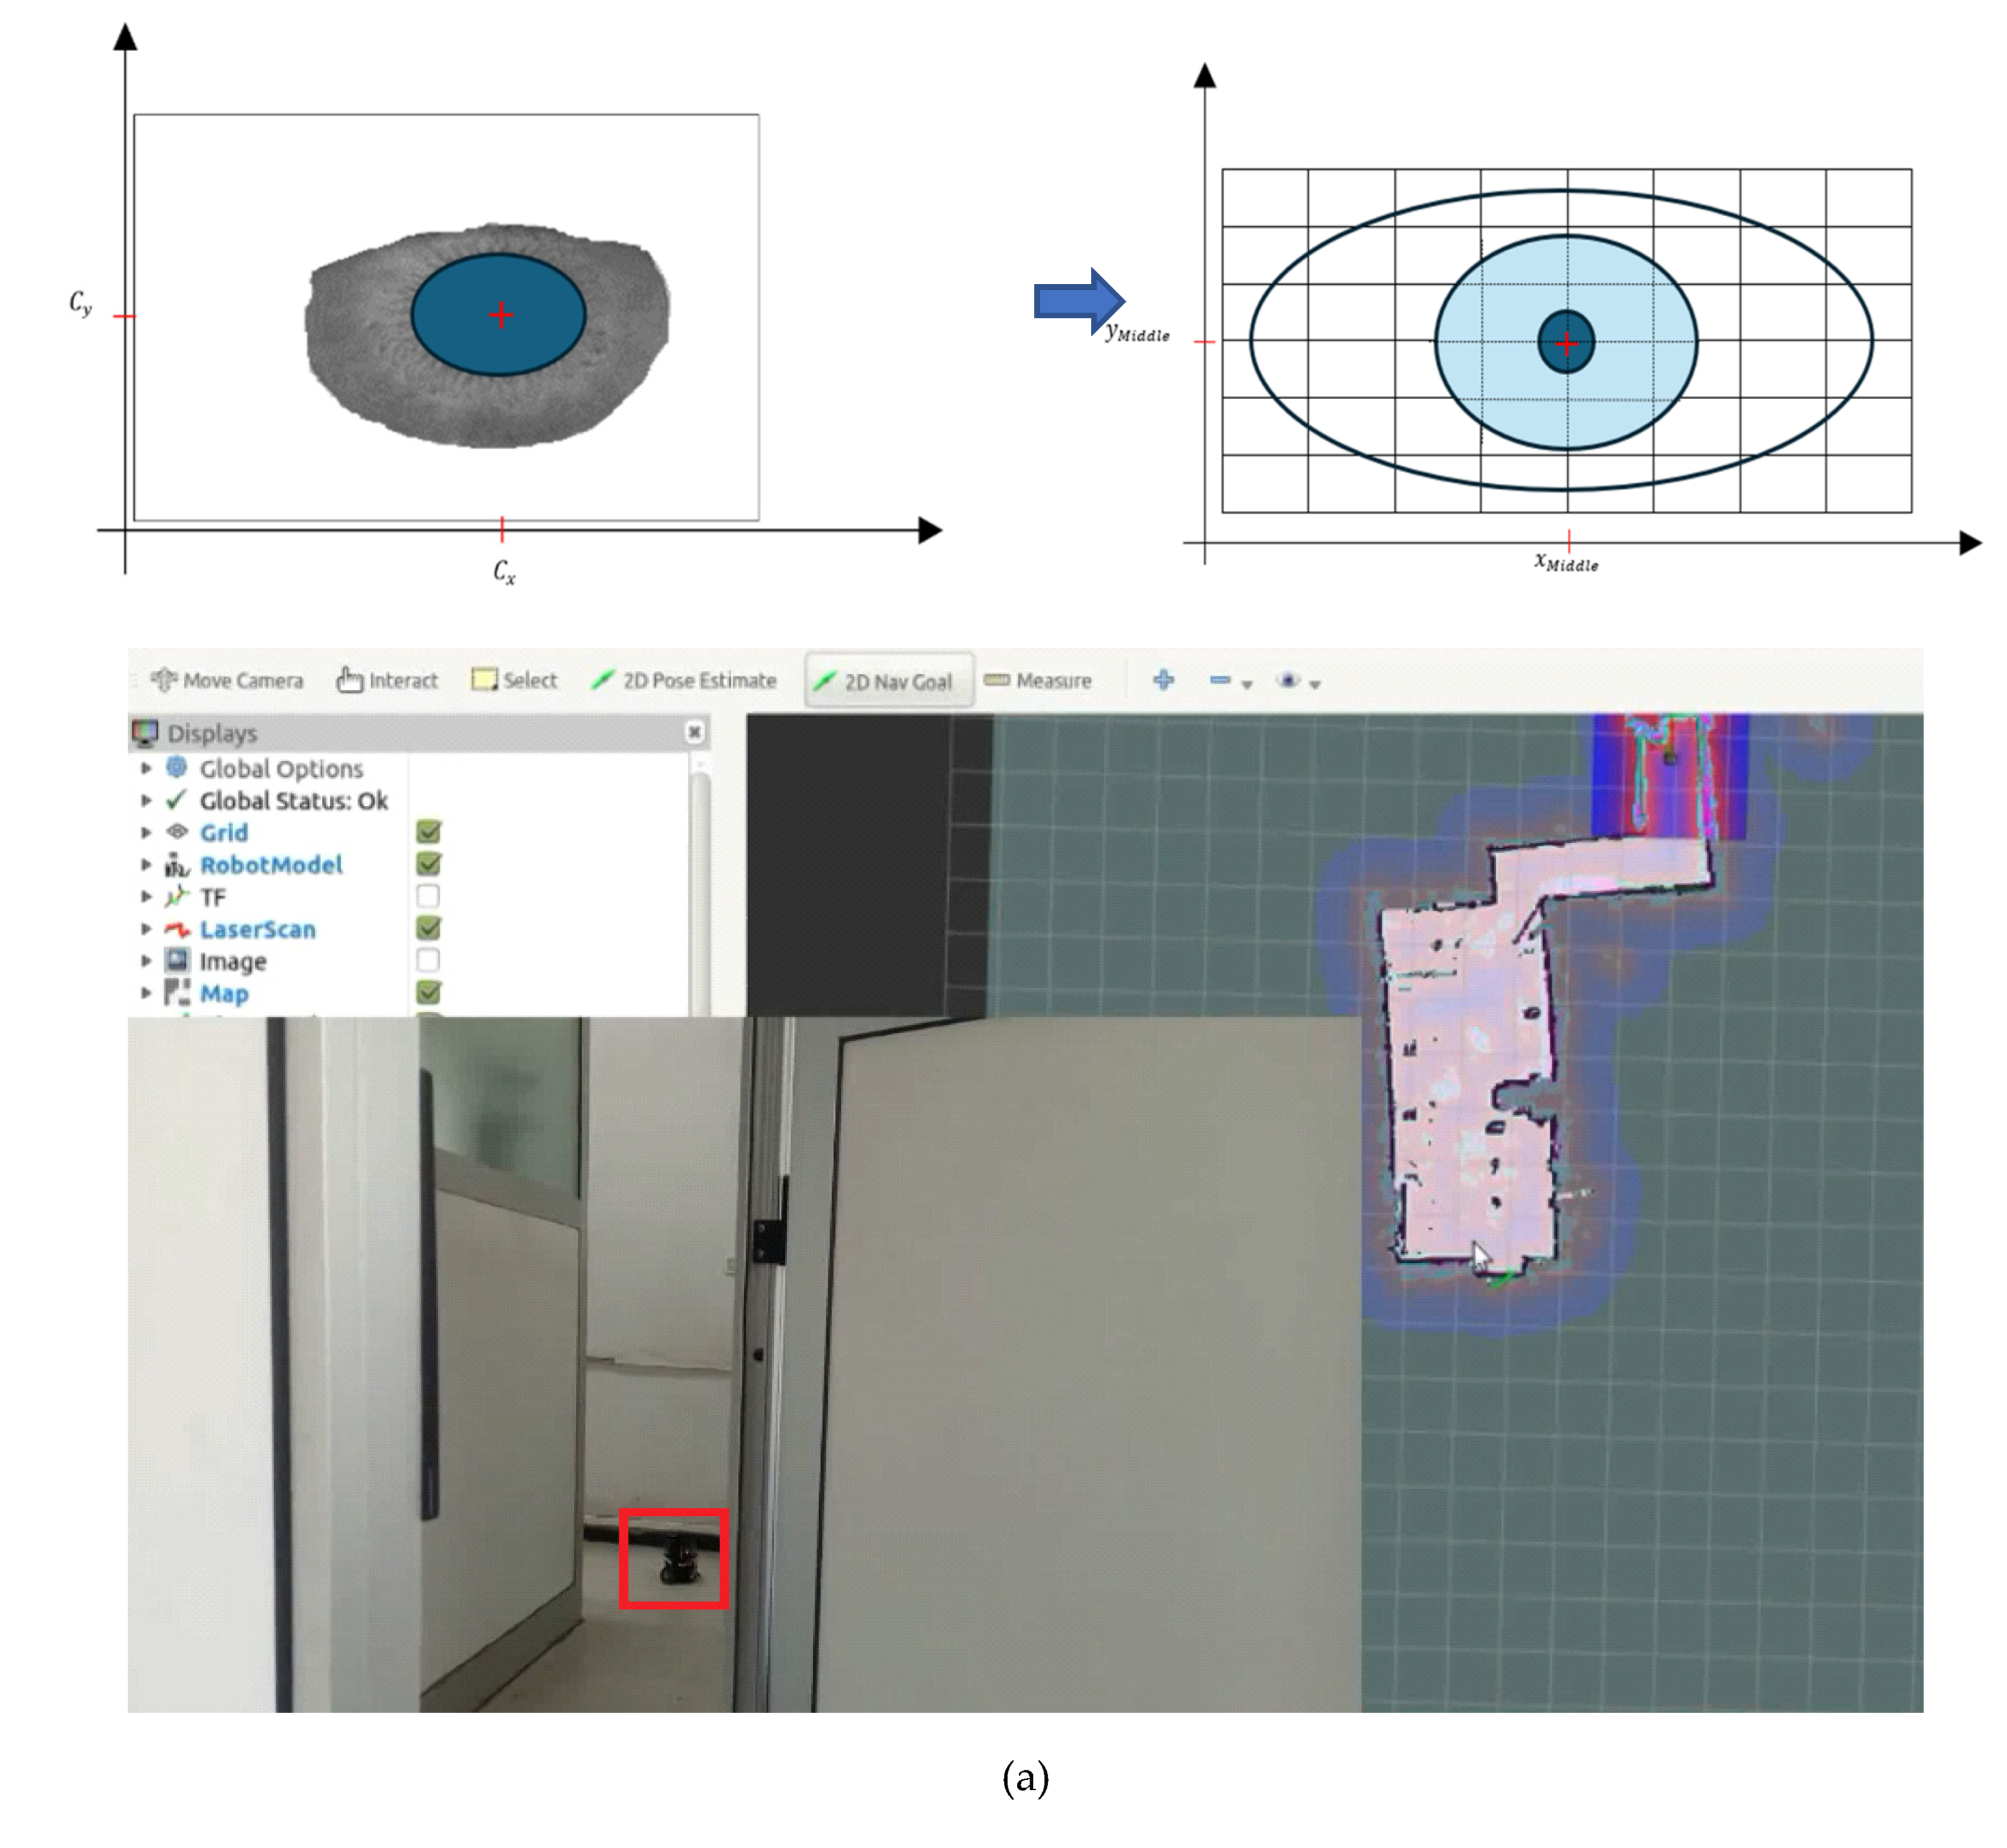
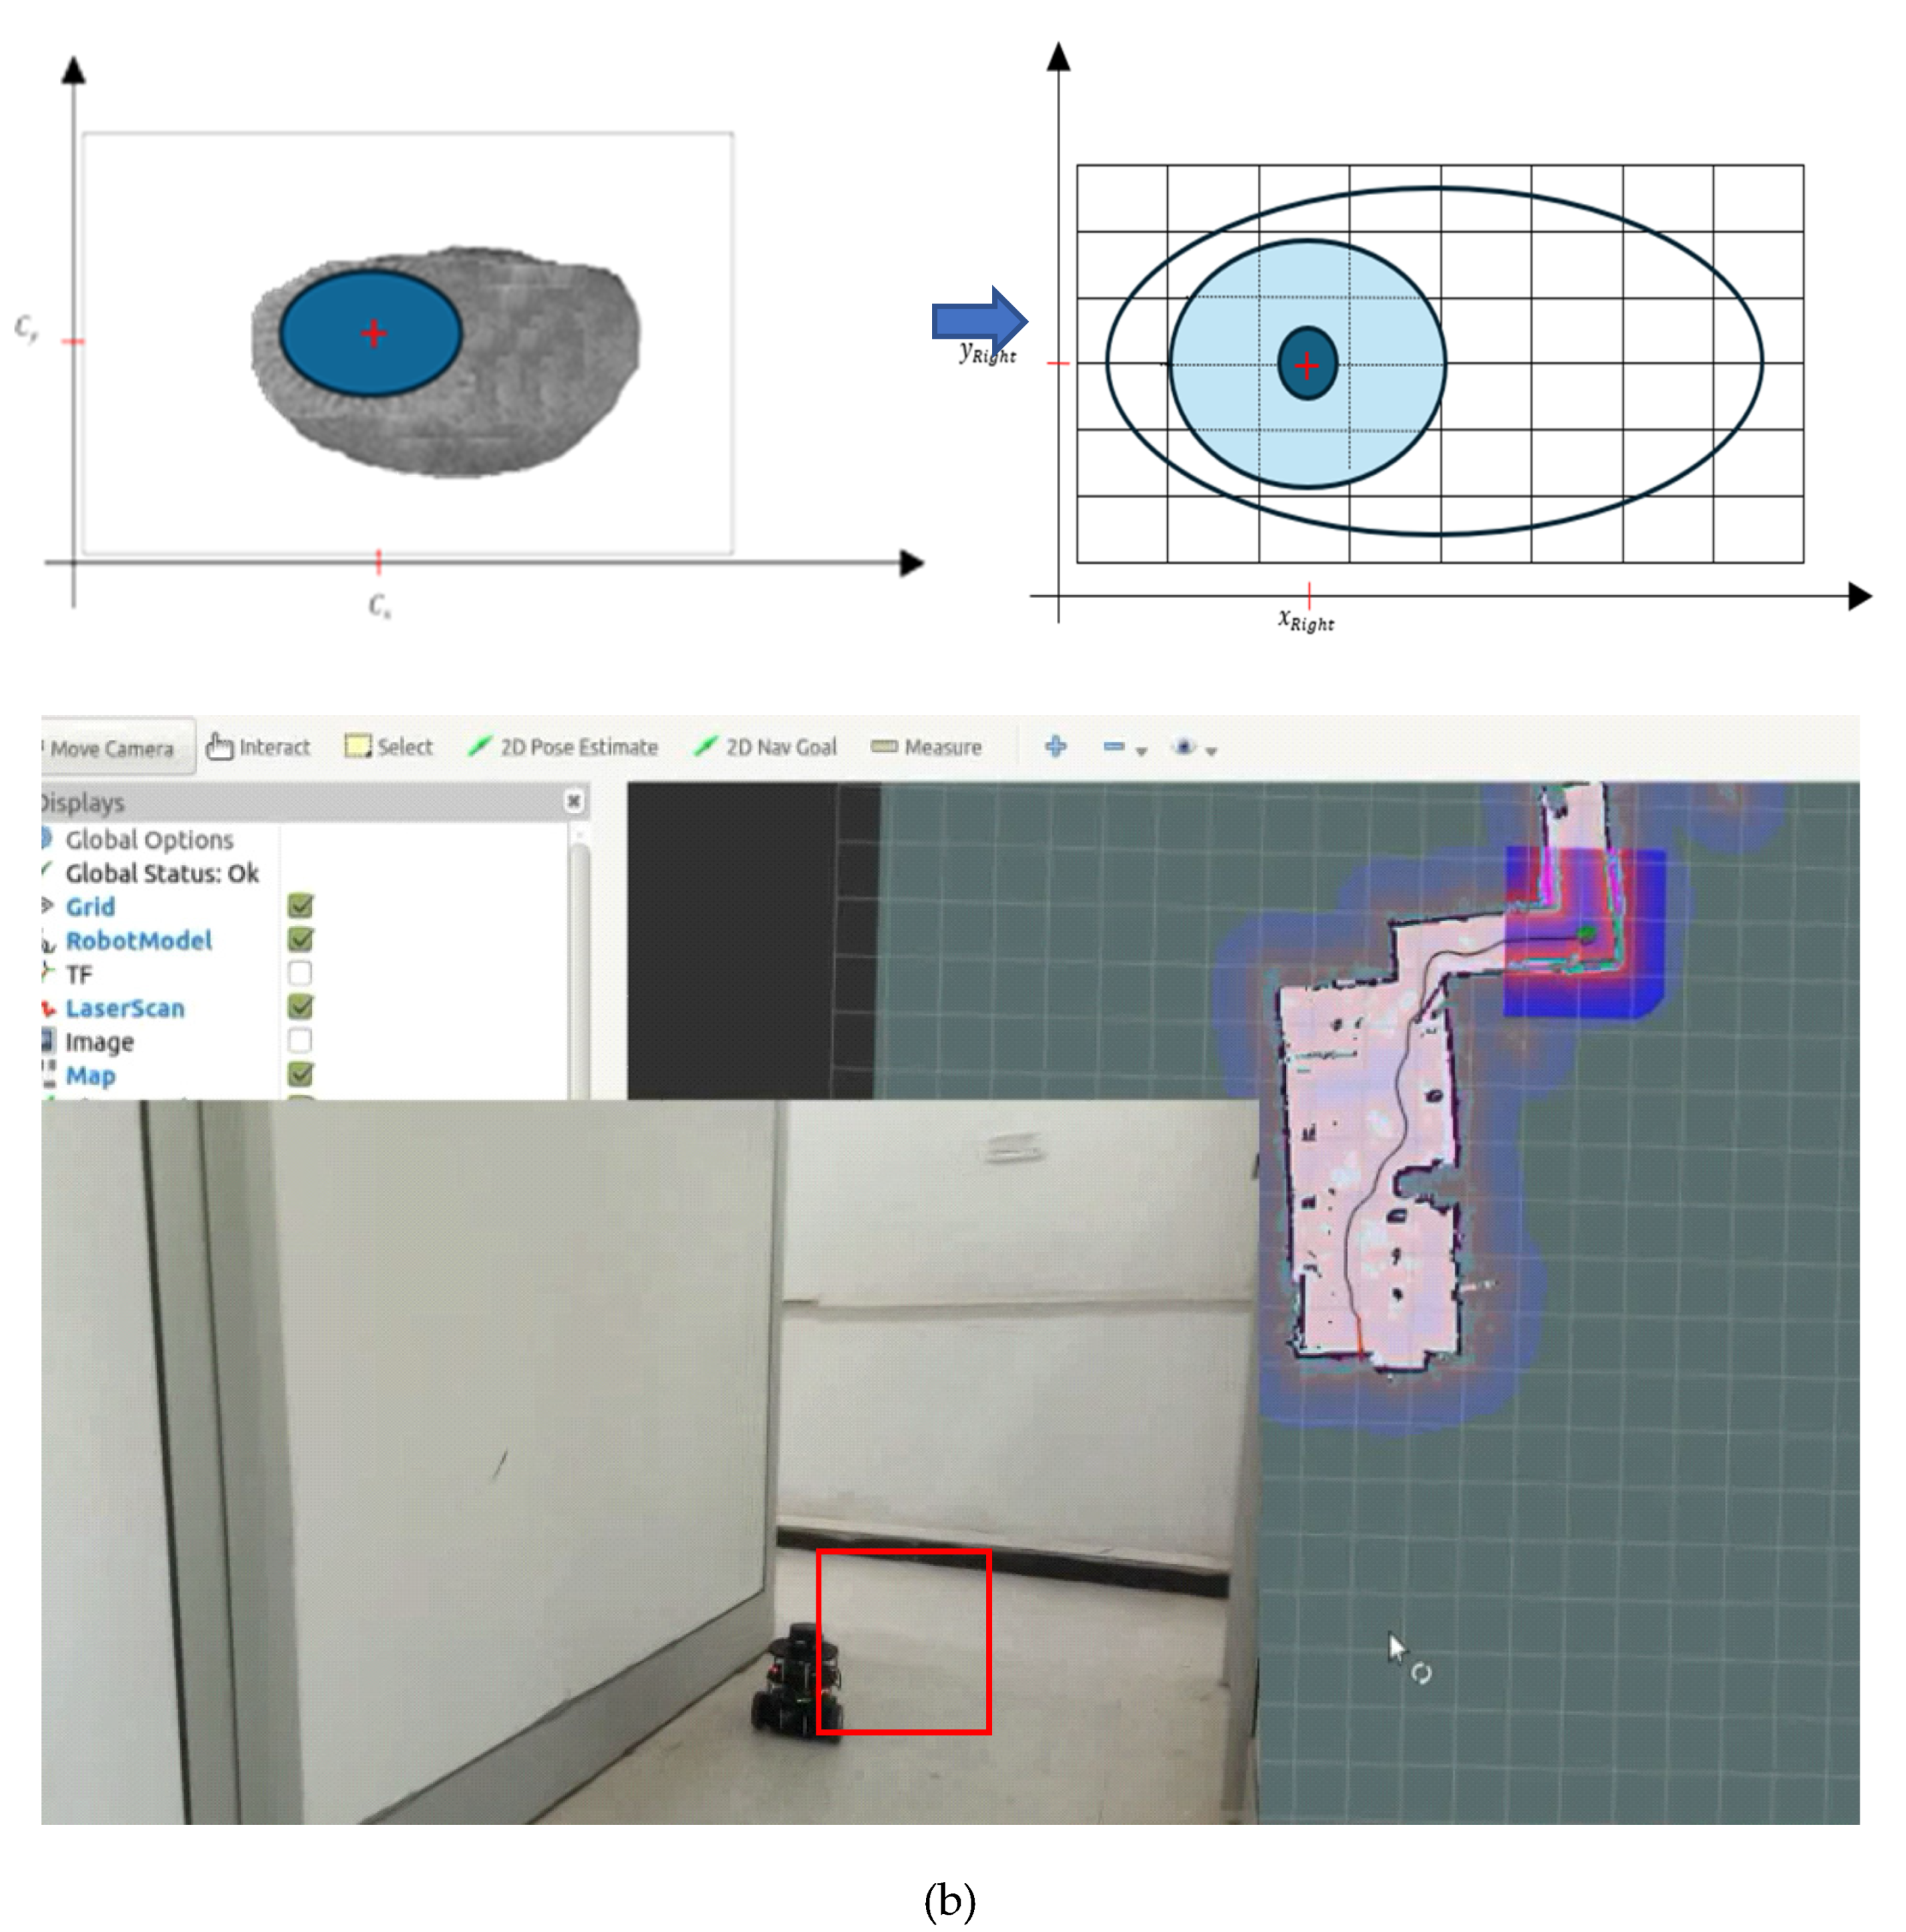
In
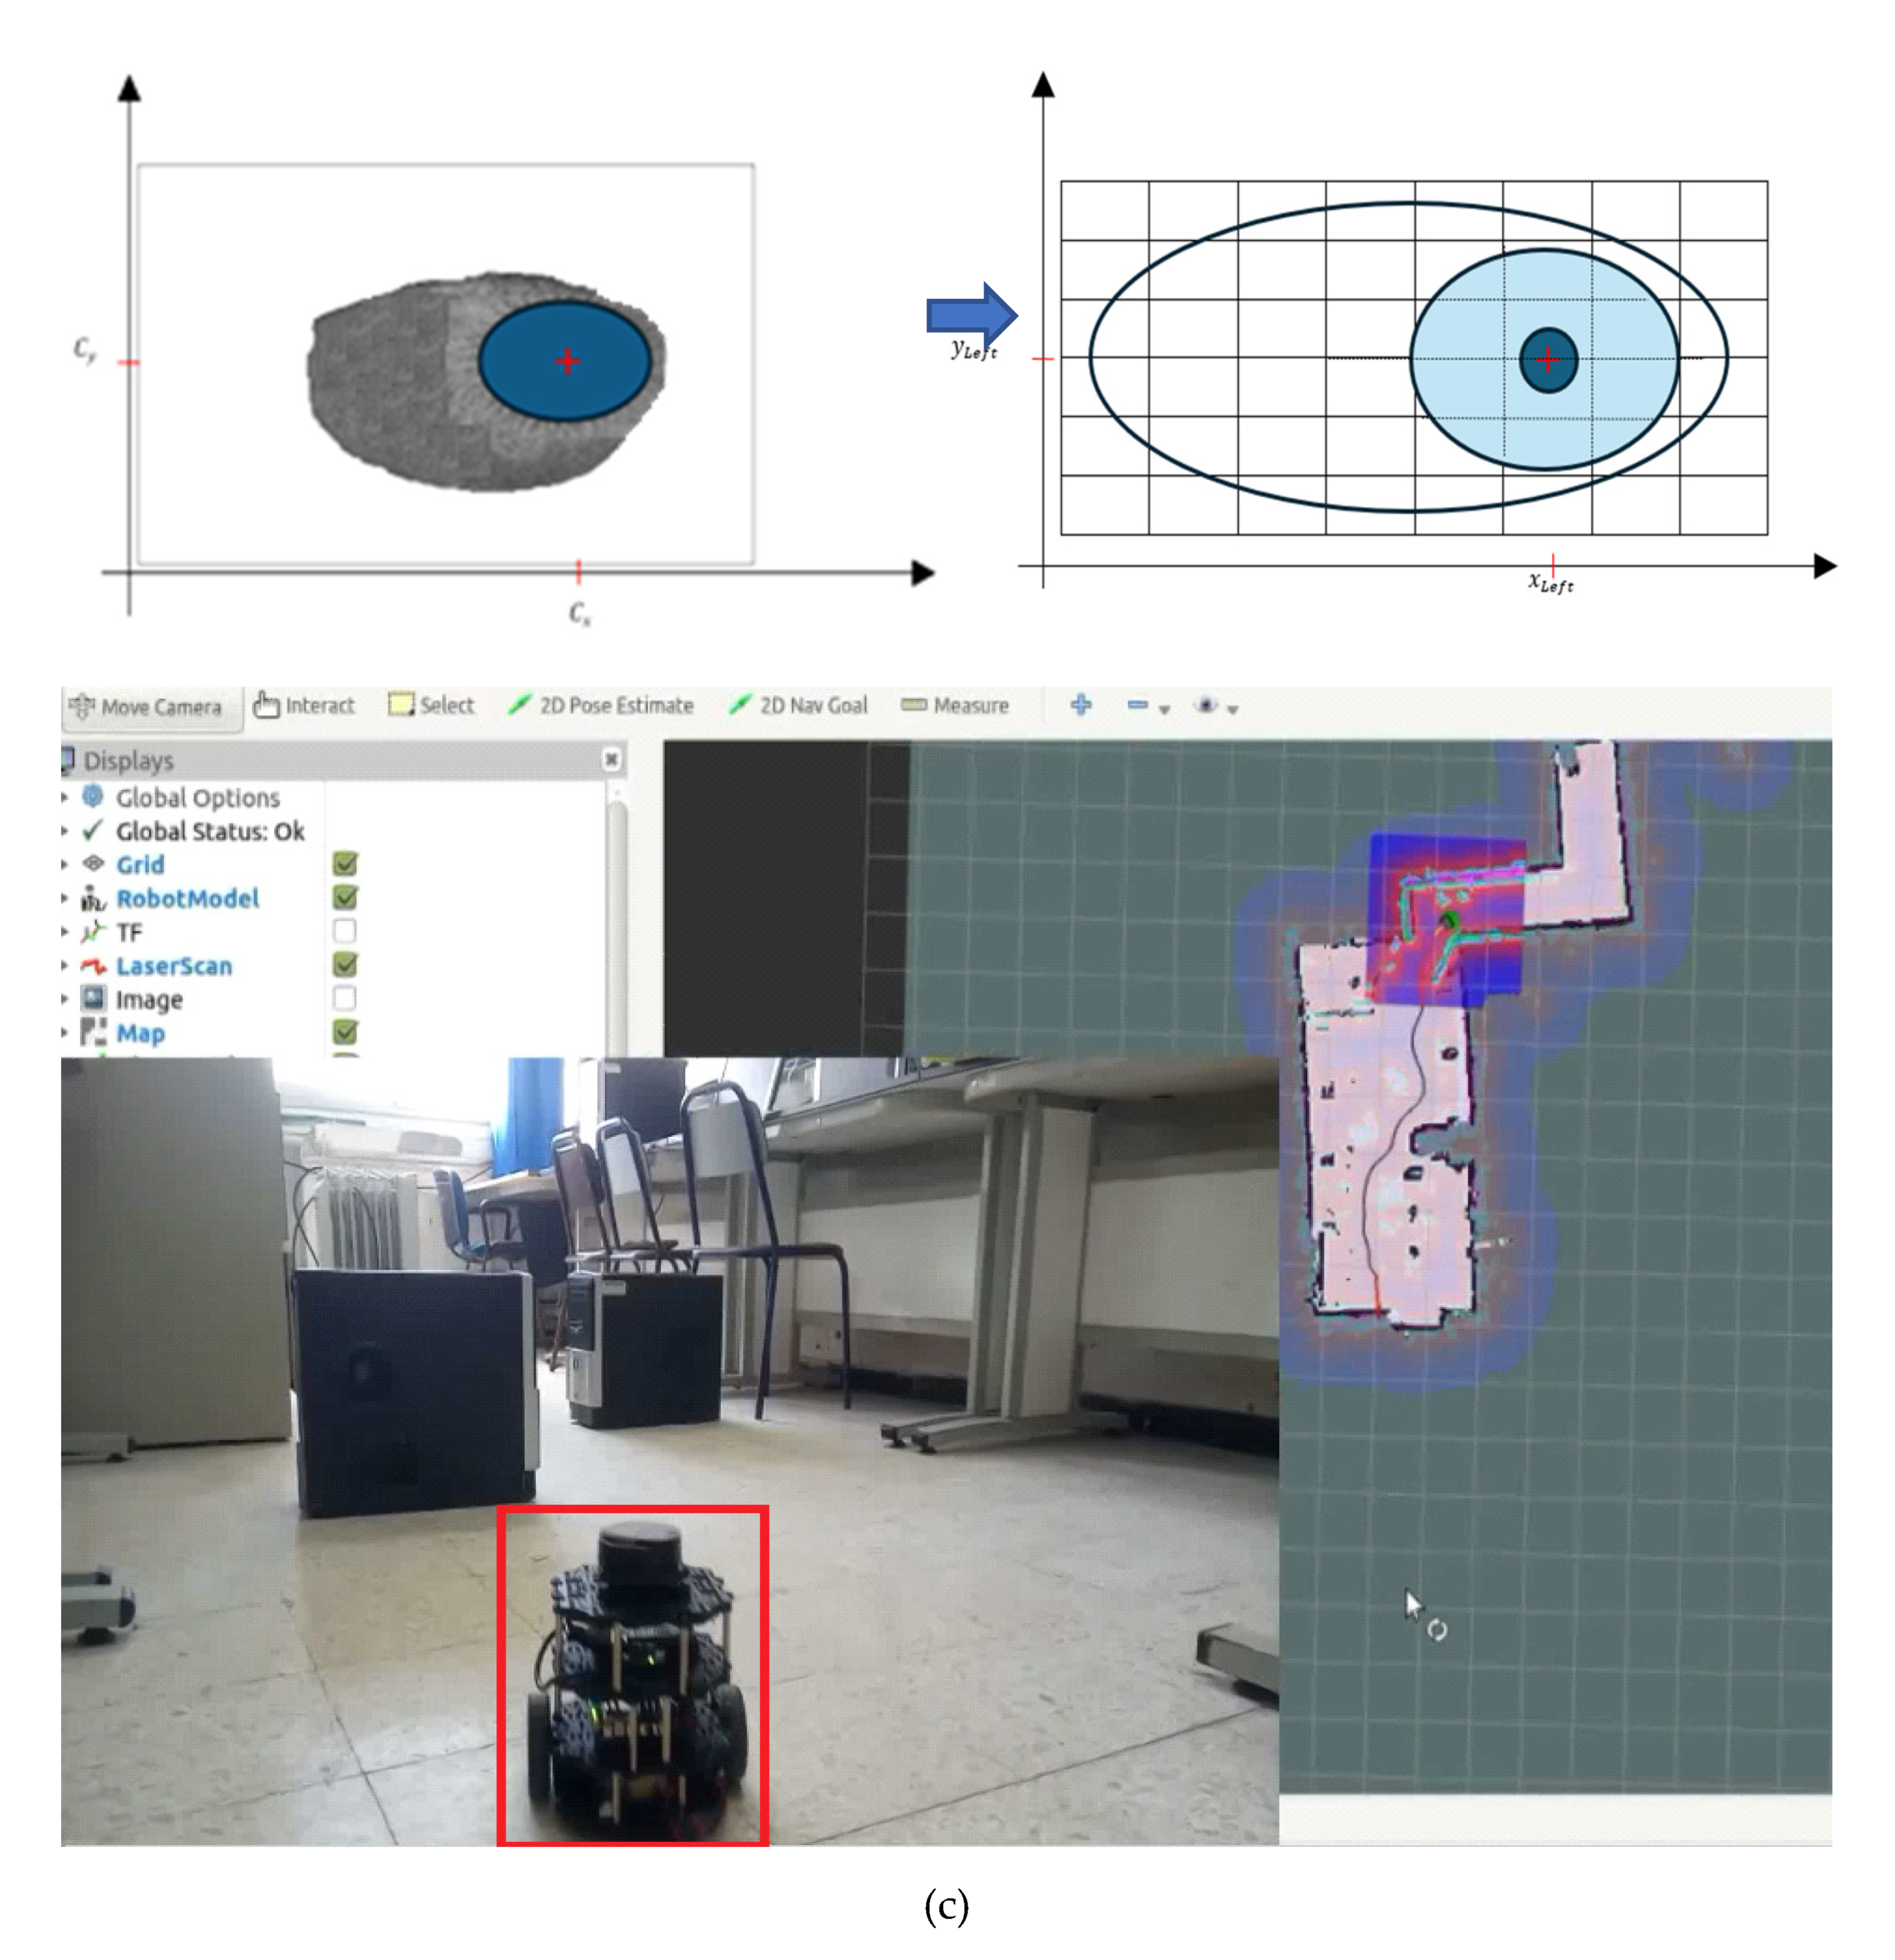
Figure 12, the movement of the robot
TurtleBot 3 is determined by the position of the center of the iris relative to different directional points. In
Figure 12(a), the robot moves forward because the distance between the center of the iris and the Middle direction is minimal. This suggests that the robot perceives the iris to be centered and thus moves straight ahead.
Figure 12(b) demonstrates that the robot moves right. This decision is made because the distance between the center of the iris and the Right direction is minimal, indicating that the iris is off-center to the left from the robot’s perspective. To correct this misalignment, the robot adjusts its trajectory to the right. Finally, in
Figure 12(c), the robot moves left. This adjustment is made because the distance between the center of the iris and the Left direction is minimal, suggesting that the iris is off-center to the right from the robot’s viewpoint. Consequently, the robot corrects its trajectory by moving left. Consequently, the robot’s movement is guided by minimizing the distance between the center of the iris and predetermined directional points, allowing it to navigate in different directions based on the perceived position of the iris.
Figure 1.
Control cycle of a robot based on iris recognition.
Figure 1.
Control cycle of a robot based on iris recognition.
Figure 2.
Image templates for different gaze directions taken during initialization. During operation, the current eye image is matched against these templates to estimate gaze direction [
15].
Figure 2.
Image templates for different gaze directions taken during initialization. During operation, the current eye image is matched against these templates to estimate gaze direction [
15].
Figure 3.
The proposed iris recognition method and finding the centroid localization, (a) Sample image of CASIA Iris-M1-S2, (b) Localization of the iris, (c) Iris segmentation, (d) Iris Detection, and (e) Finding centroid Location.
Figure 3.
The proposed iris recognition method and finding the centroid localization, (a) Sample image of CASIA Iris-M1-S2, (b) Localization of the iris, (c) Iris segmentation, (d) Iris Detection, and (e) Finding centroid Location.
Figure 4.
The diagram of the proposed method.
Figure 4.
The diagram of the proposed method.
Figure 5.
The localization of iris. (a) Original image (Human eye), (b) Edge detection through fast gradient filters using a fuzzy inference system (FIS), (c) The localization of iris (d) Segmented image (2 regions: Iris and background) using bald eagle search (BES) algorithm.
Figure 5.
The localization of iris. (a) Original image (Human eye), (b) Edge detection through fast gradient filters using a fuzzy inference system (FIS), (c) The localization of iris (d) Segmented image (2 regions: Iris and background) using bald eagle search (BES) algorithm.
Figure 6.
The coordinates representing each direction, (a) the iris center coordinates (, ), (b) the Middle direction, (c) the Right direction, and (d) the Left direction.
Figure 6.
The coordinates representing each direction, (a) the iris center coordinates (, ), (b) the Middle direction, (c) the Right direction, and (d) the Left direction.
Figure 7.
Image segmentation. (a) Original image. (b) Iris localization. (c) Segmented image (3 regions: Iris, Pupil, and background). (d) Segmented image (2 regions: Iris and background).
Figure 7.
Image segmentation. (a) Original image. (b) Iris localization. (c) Segmented image (3 regions: Iris, Pupil, and background). (d) Segmented image (2 regions: Iris and background).
Figure 8.
Example of irises of the human eye. Twelve were selected for a comparison study. The patterns are numbered from 1 through 12, starting at the upper left-hand corner. Image is from CASIA iris database (Fernando Alonso-Fernandez, 2009).
Figure 8.
Example of irises of the human eye. Twelve were selected for a comparison study. The patterns are numbered from 1 through 12, starting at the upper left-hand corner. Image is from CASIA iris database (Fernando Alonso-Fernandez, 2009).
Figure 9.
The proposed method rates of iris recognition based on the number of training images and feature vectors dimension.
Figure 9.
The proposed method rates of iris recognition based on the number of training images and feature vectors dimension.
Figure 10.
Iris recognition evaluation results, (a) True positive, (b) False positive, (c) False negative, and (d) Iris recognition rate.
Figure 10.
Iris recognition evaluation results, (a) True positive, (b) False positive, (c) False negative, and (d) Iris recognition rate.
Figure 11.
The recognition performance of the supervised learning based on matching features (SLMF) [
26], the local invariant feature descriptor (LIFD) [
27], the Fourier-SIFT method (FSIFT) [
28] and the proposed method on CASIA iris database, (a) ERR (%), and (b) IRR (%).
Figure 11.
The recognition performance of the supervised learning based on matching features (SLMF) [
26], the local invariant feature descriptor (LIFD) [
27], the Fourier-SIFT method (FSIFT) [
28] and the proposed method on CASIA iris database, (a) ERR (%), and (b) IRR (%).
Figure 12.
The movement of the robot in different directions, (a) Moving forward, (b) Moving right, and (c) Moving left.
Figure 12.
The movement of the robot in different directions, (a) Moving forward, (b) Moving right, and (c) Moving left.
Table 1.
Segmentation sensitivity from FAMT [
21], FSRA [
22], BWOA [
23] and BES [
18] for the data set shown in
Figure 8.
Table 1.
Segmentation sensitivity from FAMT [
21], FSRA [
22], BWOA [
23] and BES [
18] for the data set shown in
Figure 8.
| |
FAMT |
FSRA |
BWOA |
BES |
| Image 1 |
97.6642 |
96.7067 |
97.7610 |
98.7395 |
| Image 2 |
96.6461 |
95.6986 |
96.7419 |
97.7102 |
| Image 3 |
97.7018 |
96.7440 |
97.7987 |
98.7775 |
| Image 4 |
98.2627 |
97.2994 |
98.3601 |
99.5444 |
| Image 5 |
95.7377 |
94.7991 |
95.8326 |
96.7917 |
| Image 6 |
96.6490 |
95.7014 |
96.7447 |
97.7131 |
| Image 7 |
96.5125 |
96.0371 |
96.6082 |
97.5751 |
| Image 8 |
97.7358 |
97.2543 |
97.8327 |
98.8119 |
| Image 9 |
98.6629 |
98.1769 |
97.7915 |
99.7492 |
| Image 10 |
95.5424 |
95.0718 |
94.6986 |
96.5943 |
| Image 11 |
95.6187 |
95.1476 |
94.7741 |
96.6714 |
| Image 12 |
96.6222 |
96.1463 |
95.7688 |
97.6860 |
Table 2.
The iris recognition performance of different approaches on CASIA database.
Table 2.
The iris recognition performance of different approaches on CASIA database.
| Methods |
EER (%) |
IRR (%) |
| SLMF method [26] |
0.1782 |
98.9438 |
| LIFD method [27] |
0.4324 |
97.6227 |
| FSIFT method [28] |
0.2956 |
98.6356 |
| Proposed iris recognition method |
0.1381 |
99.3827 |


