Submitted:
21 September 2024
Posted:
23 September 2024
You are already at the latest version
Abstract
Keywords:
1. Introduction
2. Materials and Methods
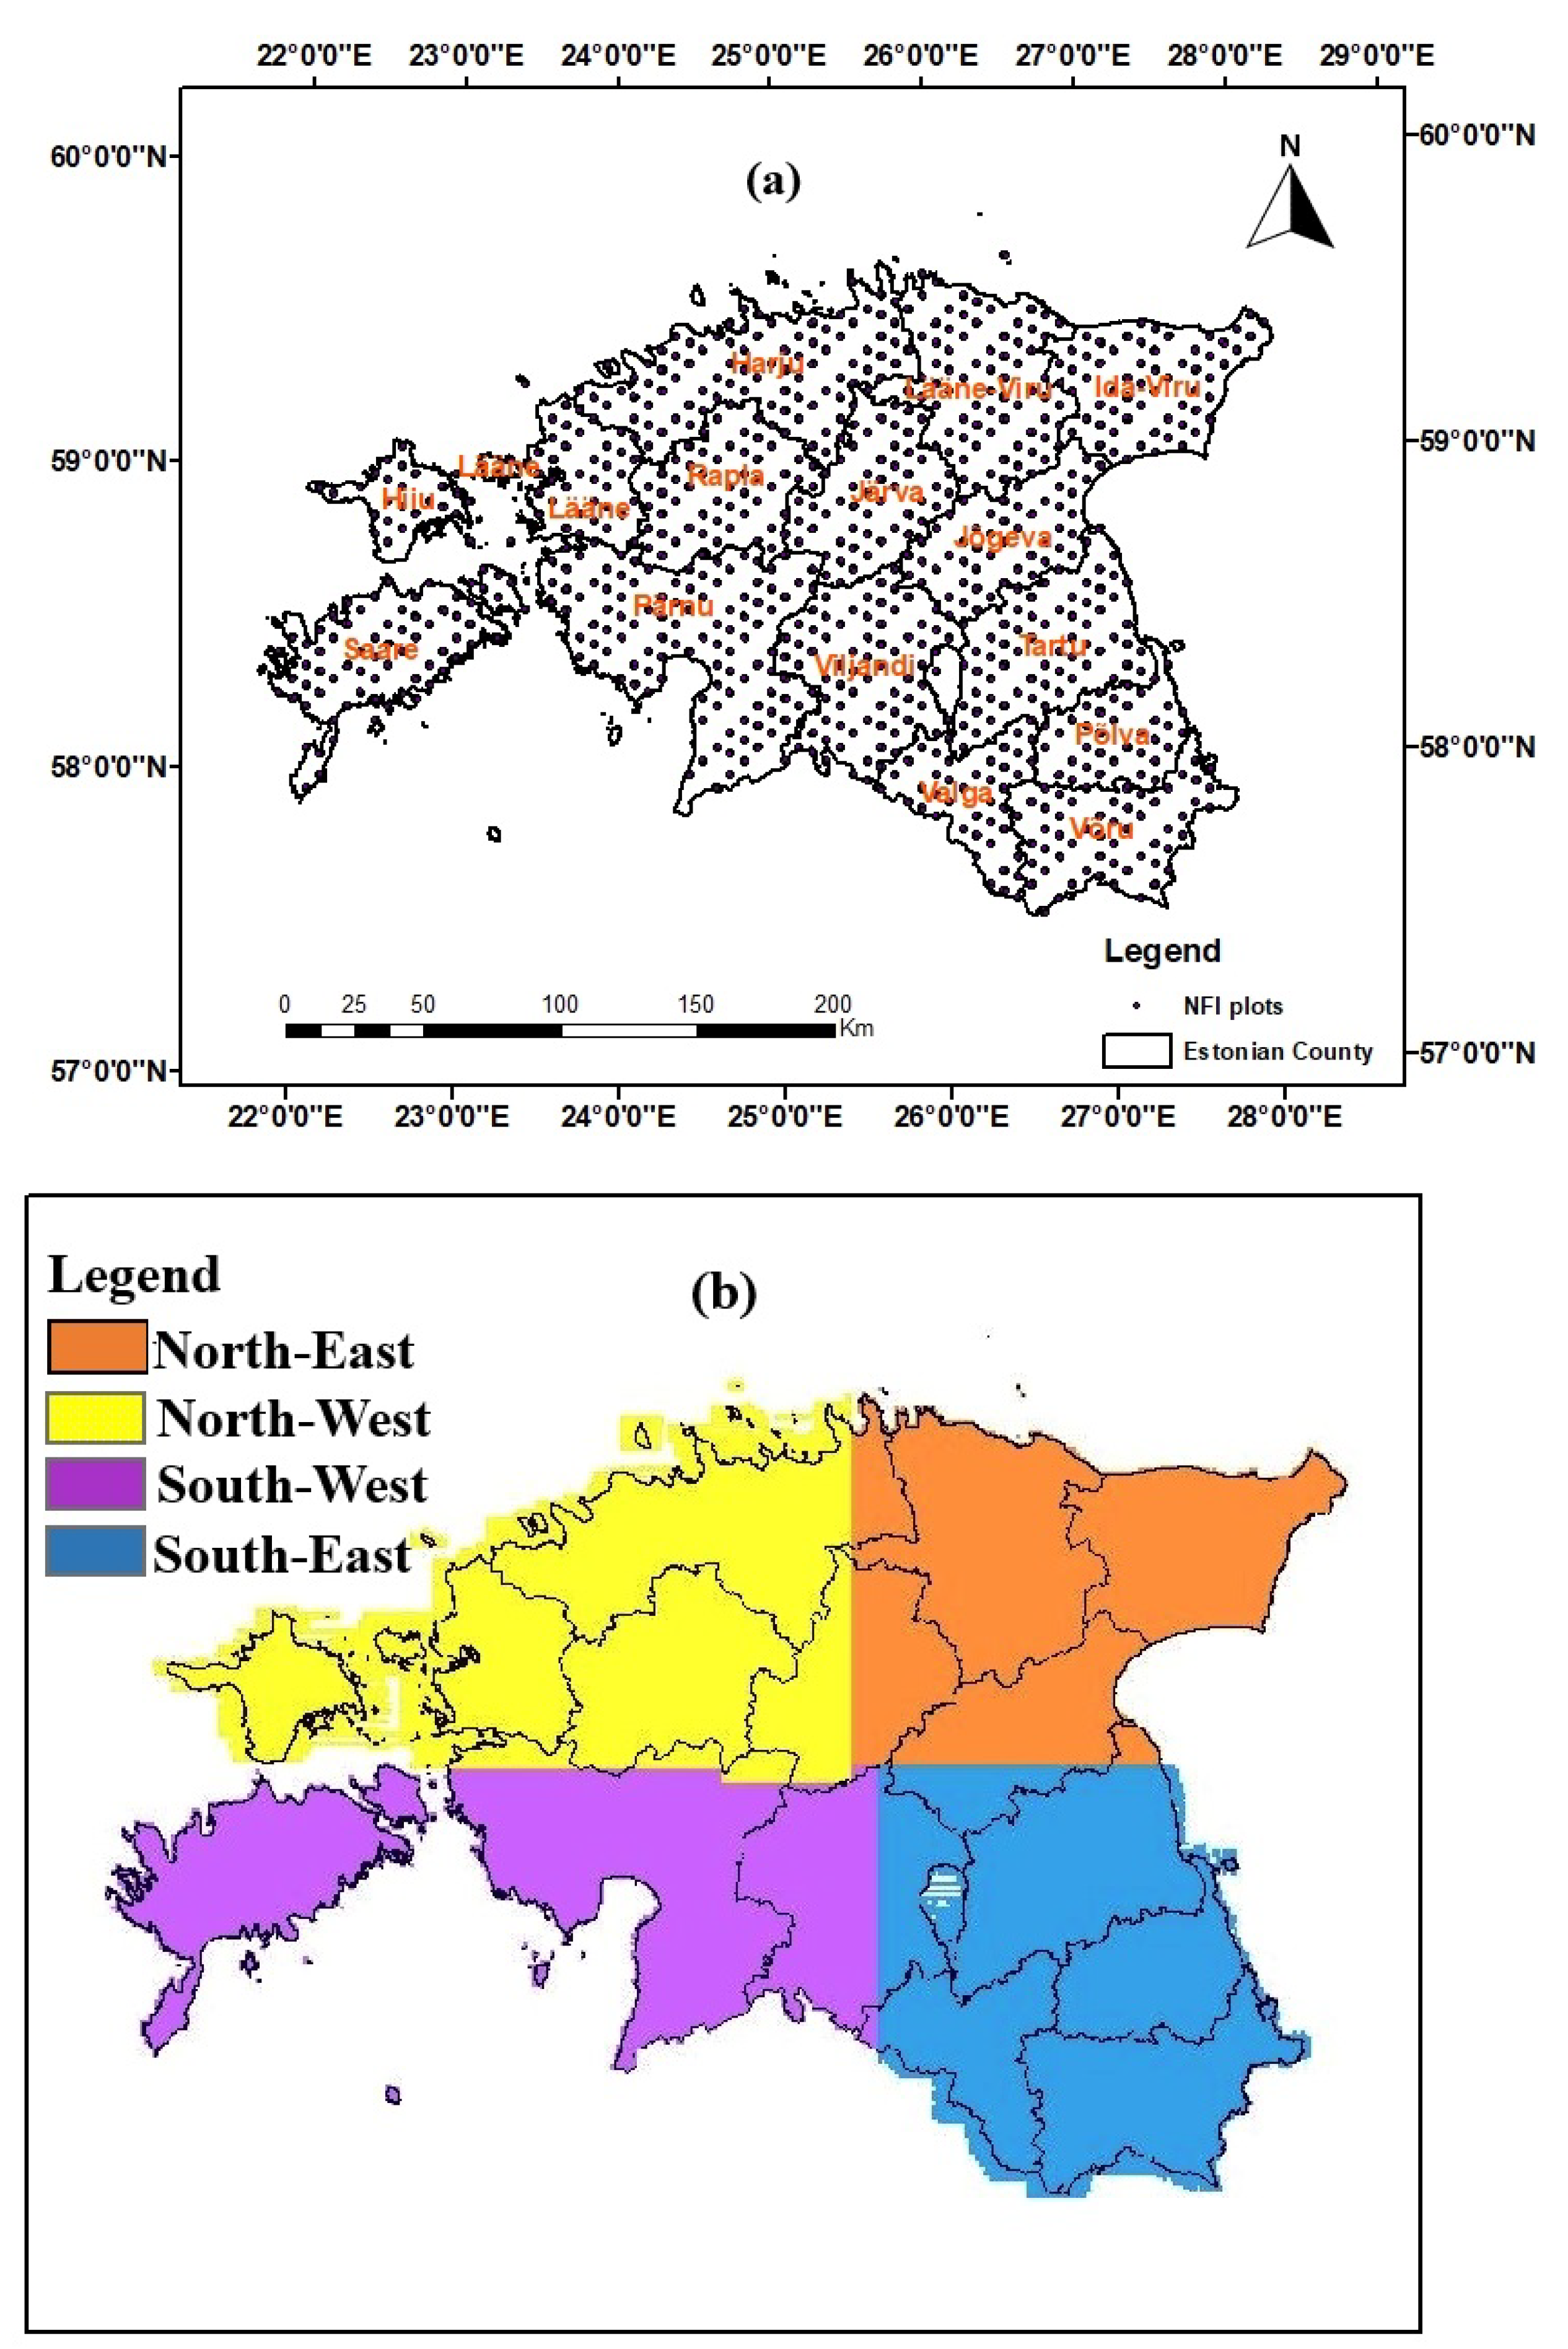
2.1. Study Area
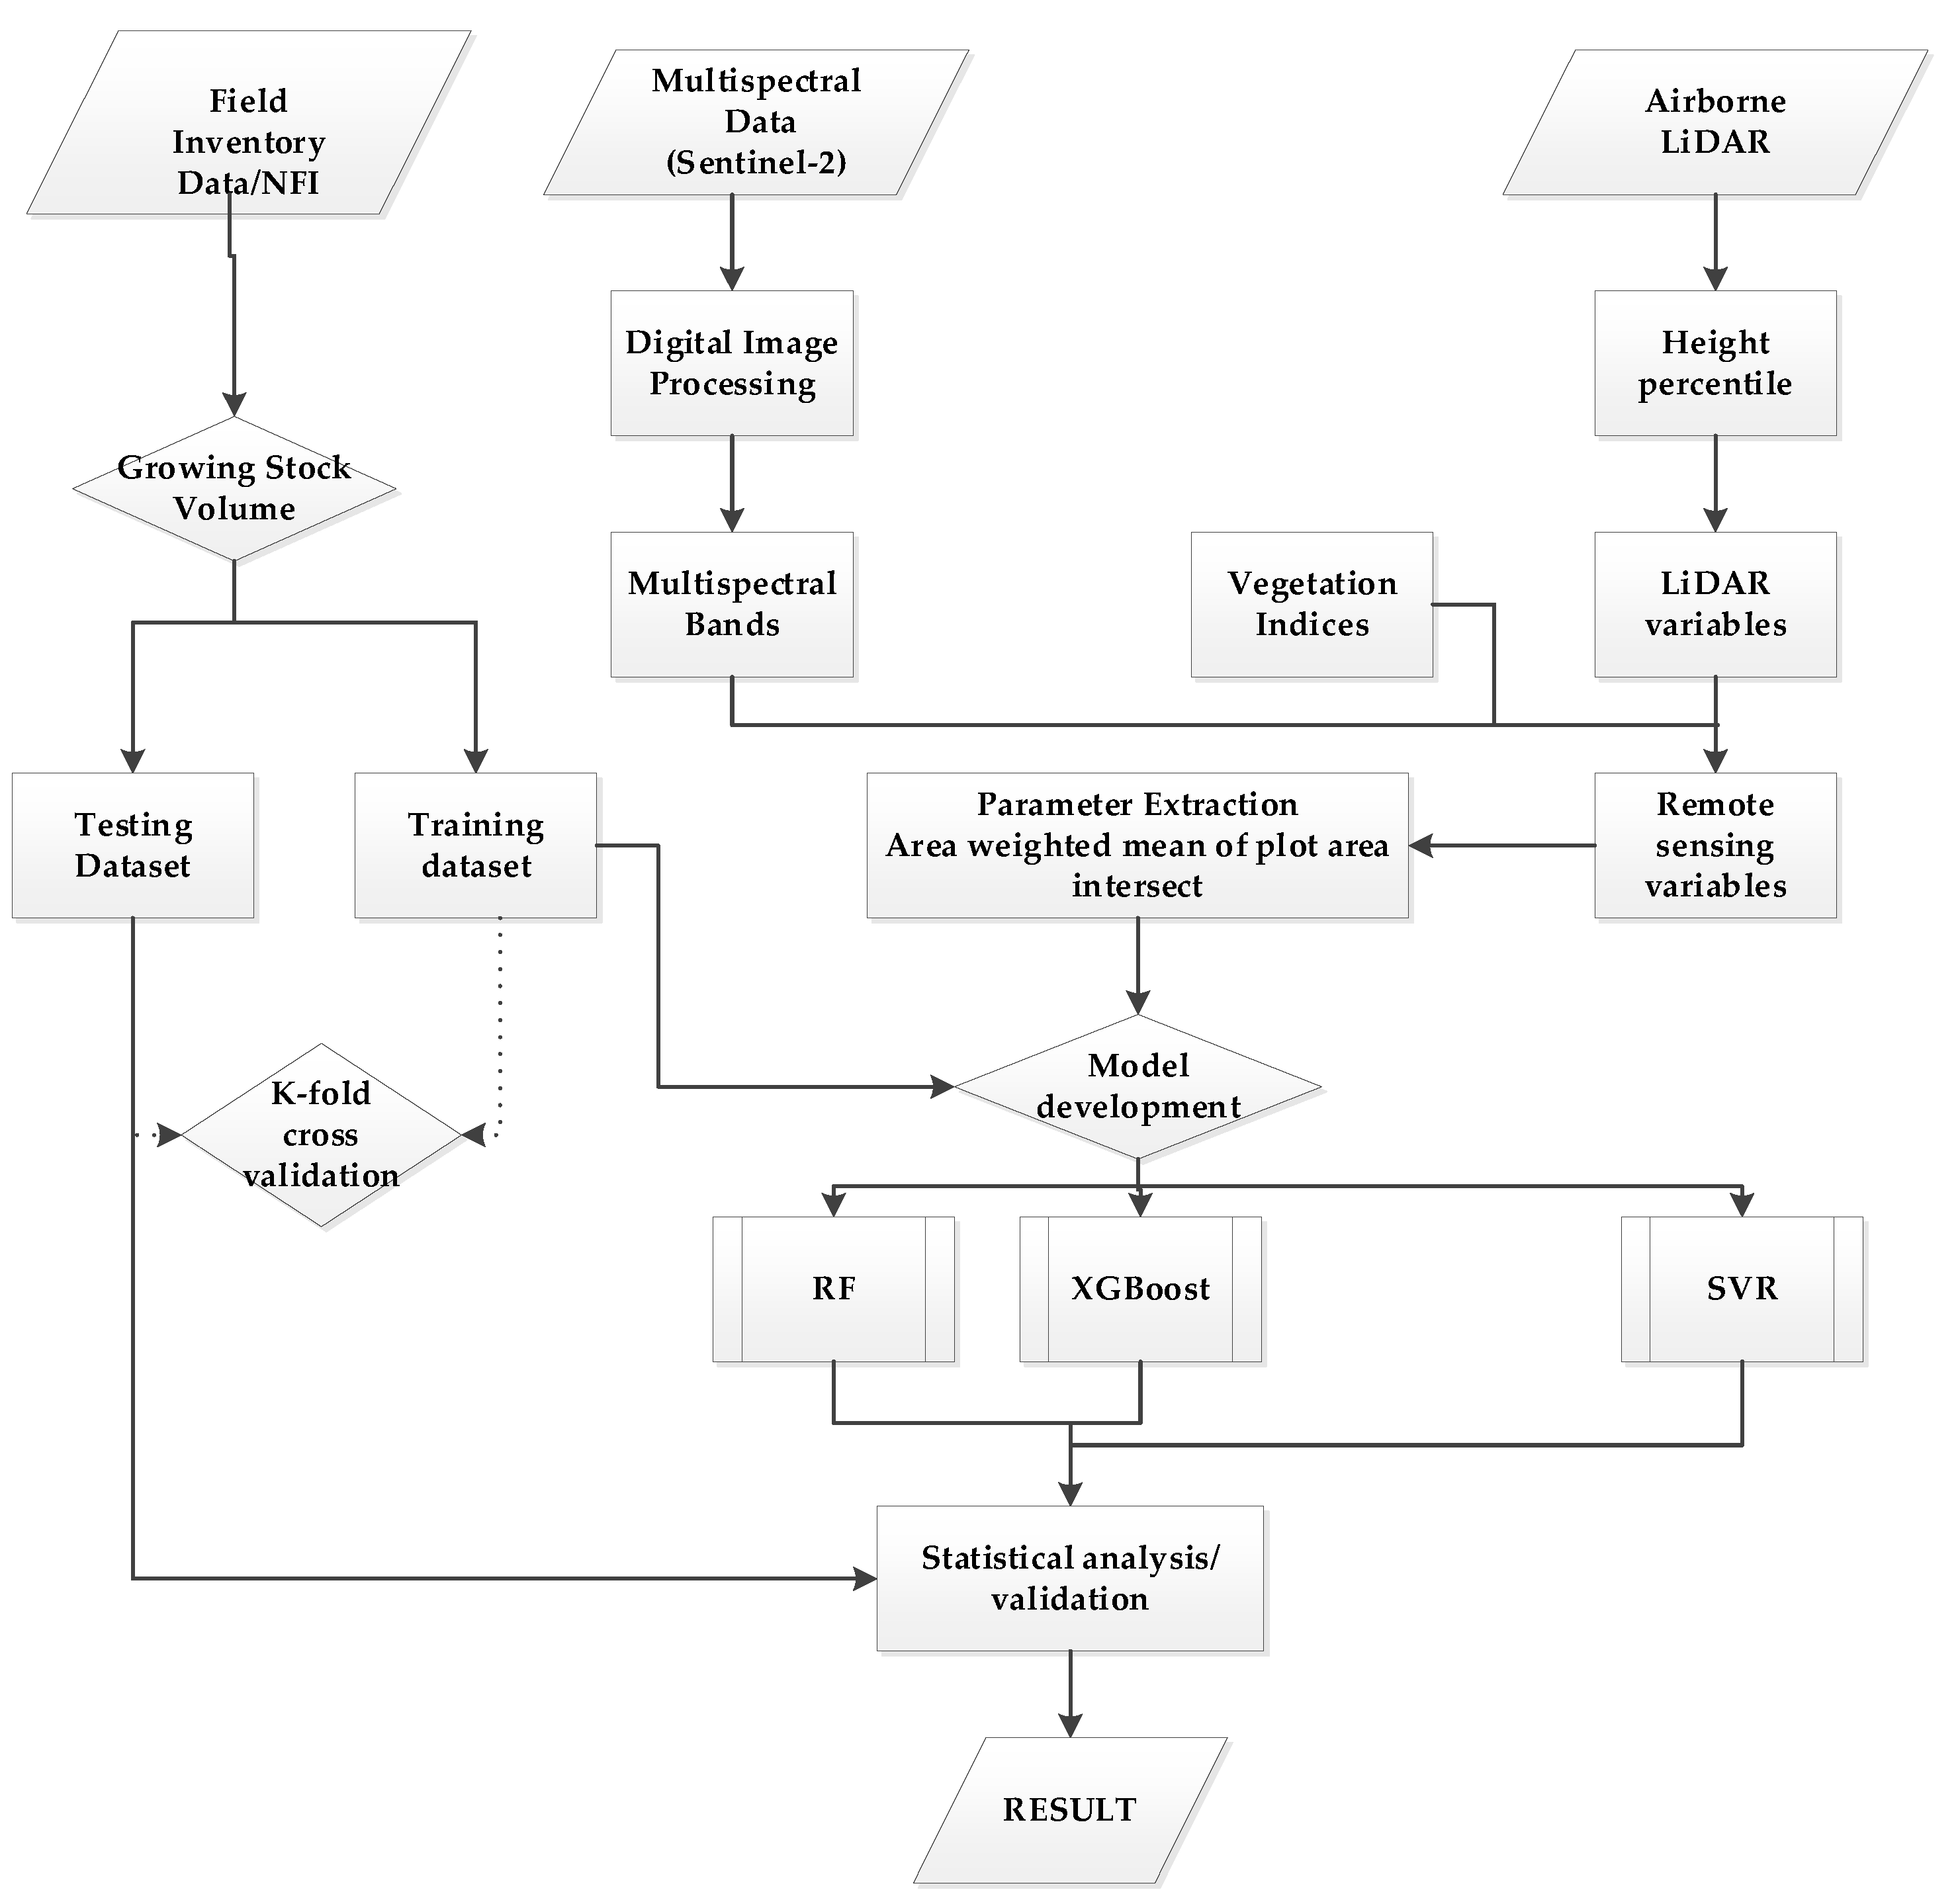
2.2. General Overview of Methods
2.3. Estonian National Forest Inventory
2.4. Field Inventory Measurement
2.5. Remote Sensing Data
2.6. LiDAR Data
2.7. Independent Variable Screening
2.8. Regression Analysis
2.8.1. Random Forest Regression
2.8.2. Support Vector Regression (SVR)
2.8.3. Extreme Gradient Boosting
2.9. Model Evaluation
3. Results
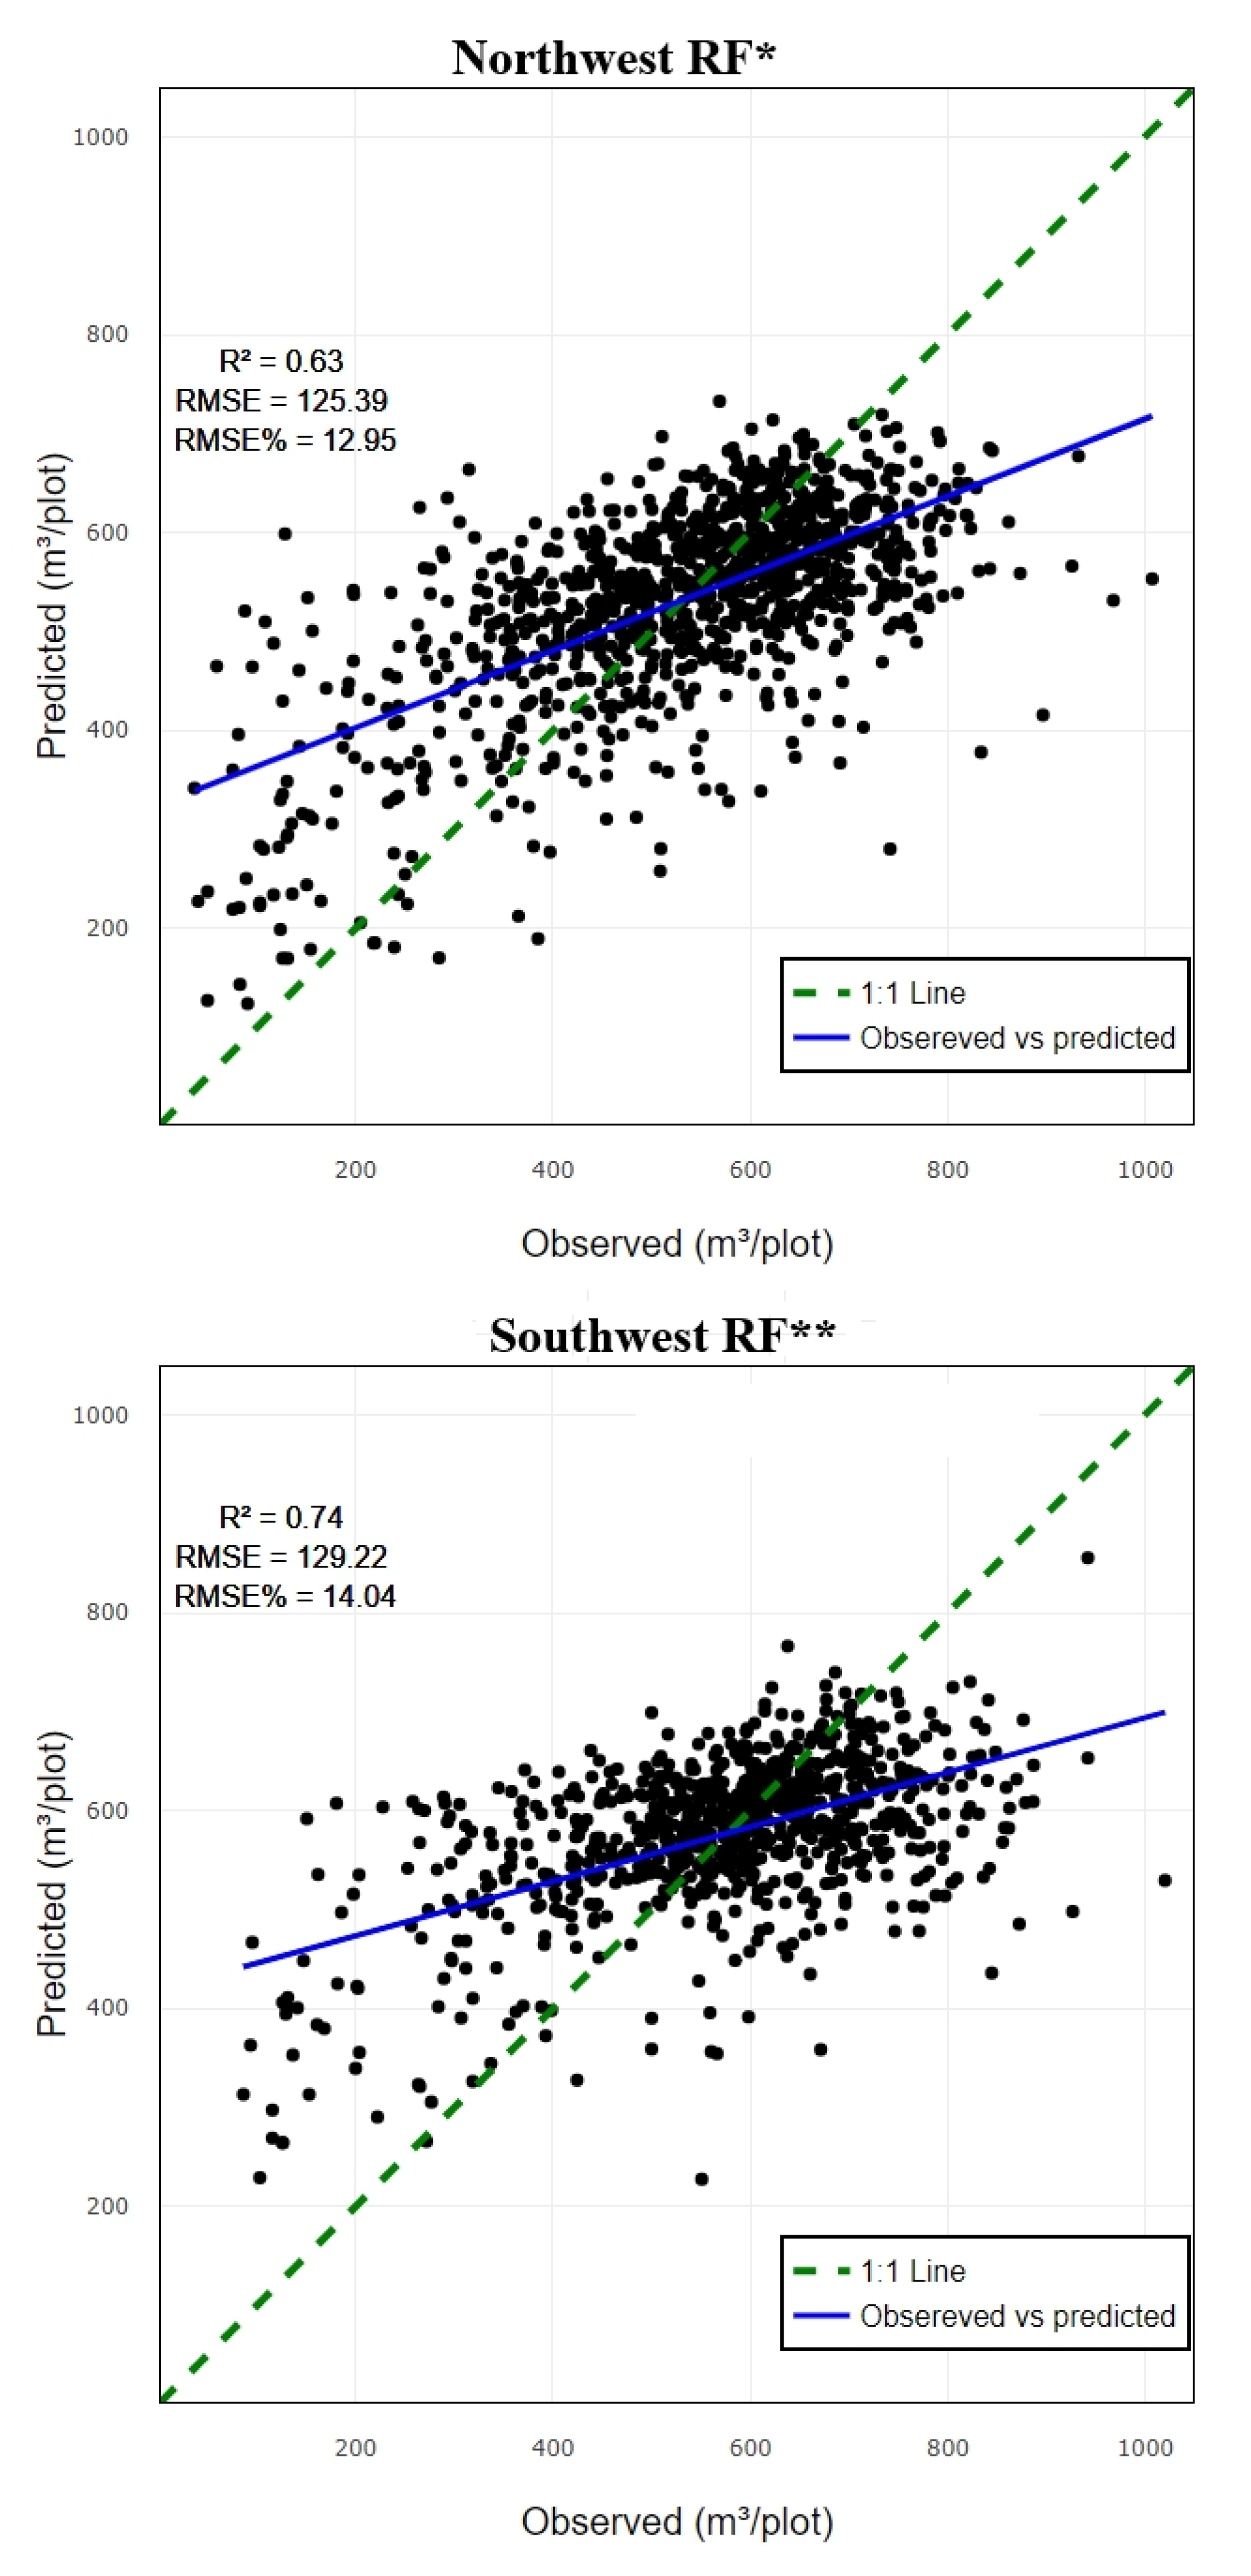
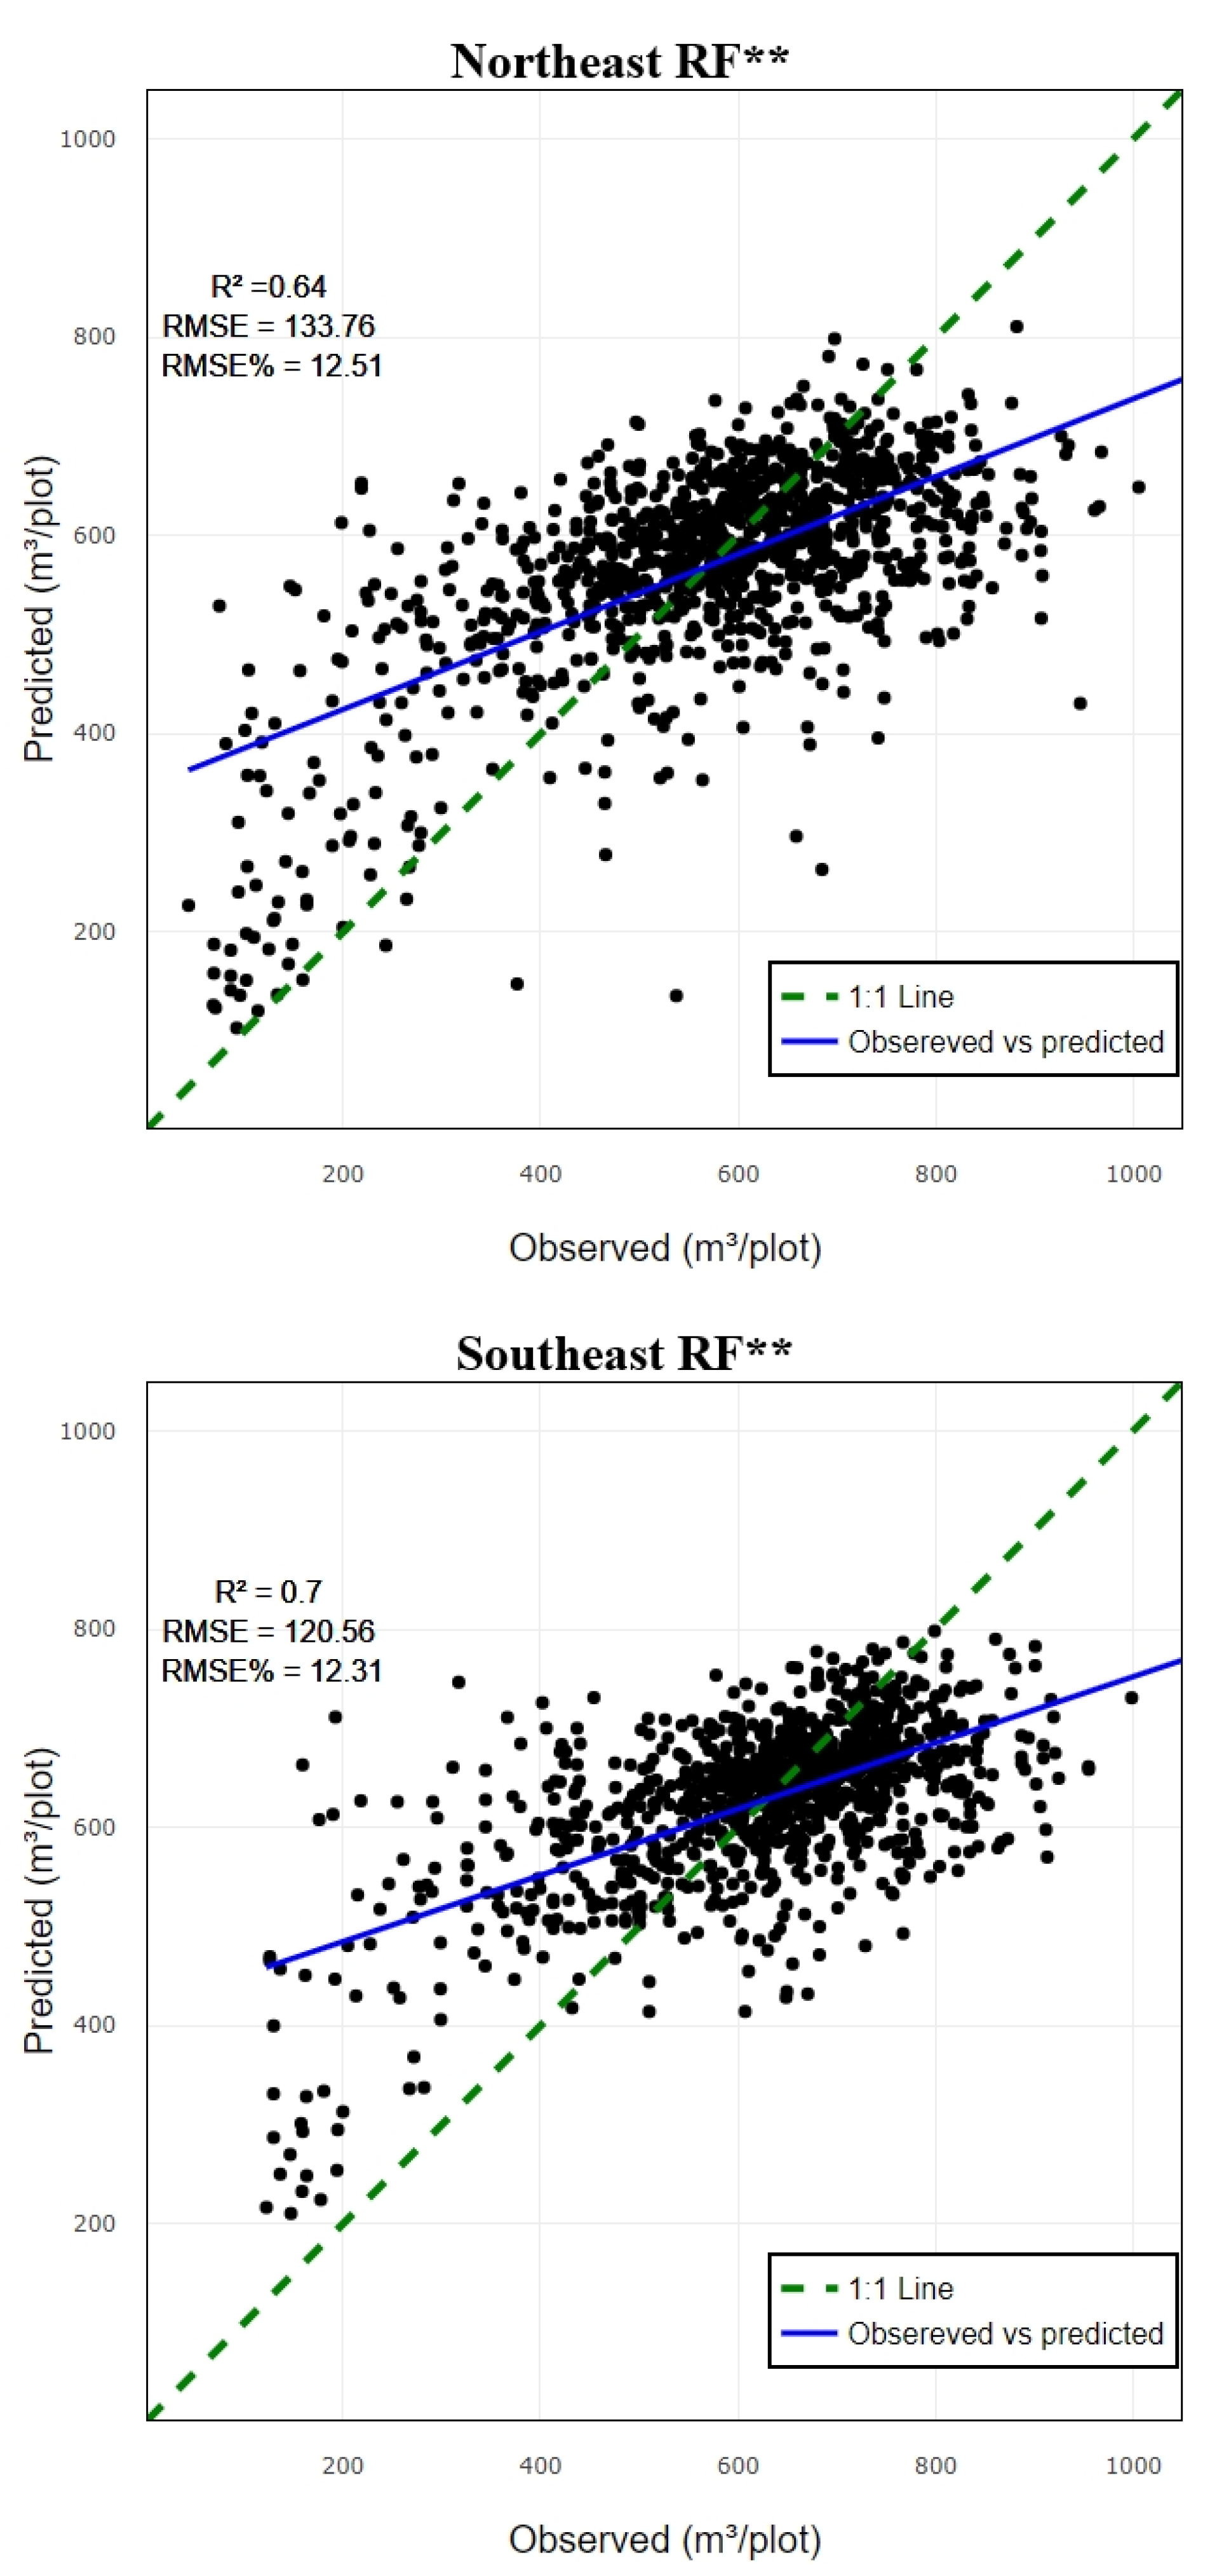
3.1. Performance Assessment Based on Random Forest Predictive Model
3.2. Performance Assessment Based on Support Vector Regression
| Variables | R² | RMSE | RMSE% | |
|---|---|---|---|---|
| CO1 | NW | 0.81 | 150.01 | 15.49 |
| CO2 | 0.53 | 130.53 | 13.48 | |
| CO3 | 0.52 | 123.41 | 12.74 | |
| CO4 | 0.51 | 125.05 | 12.91 | |
| CO1 | SW | 0.79 | 141.35 | 15.36 |
| CO2 | 0.74 | 136.17 | 14.79 | |
| CO3 | 0.64 | 124.53 | 13.53 | |
| CO4 | 0.64 | 129.57 | 14.08 | |
| CO1 | NE | 0.65 | 153.53 | 14.06 |
| CO2 | 0.65 | 149.16 | 13.95 | |
| CO3 | 0.43 | 129.83 | 12.14 | |
| CO4 | 0.6 | 138.98 | 13 | |
| CO1 | SE | 0.86 | 144.46 | 14.76 |
| CO2 | 0.79 | 132.45 | 13.52 | |
| CO3 | 0.63 | 116.43 | 11.89 | |
| CO4 | 0.68 | 122.34 | 12.5 |
3.3. Performance assessment based on Extreme gradient boosting
| Variables | R² | RMSE | RMSE% | |
|---|---|---|---|---|
| CO1 | NW | 0.78 | 143.67 | 14.84 |
| CO2 | 0.68 | 133.77 | 13.81 | |
| CO3 | 0.61 | 124.46 | 12.85 | |
| CO4 | 0.64 | 126.15 | 13.03 | |
| CO1 | SW | 0.77 | 139.37 | 15.19 |
| CO2 | 0.74 | 136.17 | 14.79 | |
| CO3 | 0.68 | 129.32 | 14.05 | |
| CO4 | 0.69 | 128.29 | 13.94 | |
| CO1 | NE | 0.69 | 139.63 | 13.09 |
| CO2 | 0.72 | 148.16 | 13.86 | |
| CO3 | 0.6 | 132.63 | 12.4 | |
| CO4 | 0.59 | 134.25 | 12.56 | |
| CO1 | SE | 0.8 | 138.01 | 14.1 |
| CO2 | 0.75 | 131.4 | 13.4 | |
| CO3 | 0.65 | 119.48 | 12.17 | |
| CO4 | 0.65 | 123.36 | 12.6 |
3.4. Model Predictive Power at Each Quadrant/ Comparative Analysis of Predictive Model
4. Discussion
5. Conclusions
Author Contributions
Funding
Data Availability Statement
Acknowledgments
Conflicts of Interest
Appendix A


References
- Bonan, G.B. Forests and Climate Change: Forcings, Feedbacks, and the Climate Benefits of Forests. Science 2008, 320, 1444–1449. [Google Scholar] [CrossRef] [PubMed]
- Pan, Y.; Birdsey, R.A.; Fang, J.; Houghton, R.; Kauppi, P.E.; Kurz, W.A.; Phillips, O.L.; Shvidenko, A.; Lewis, S.L.; Canadell, J.G.; et al. A Large and Persistent Carbon Sink in the World’s Forests. Science 2011, 333, 988–993. [Google Scholar] [CrossRef] [PubMed]
- Mori, A.S.; Furukawa, T.; Sasaki, T. Response Diversity Determines the Resilience of Ecosystems to Environmental Change. Biological Reviews 2013, 88, 349–364. [Google Scholar] [CrossRef] [PubMed]
- Sing, L.; Metzger, M.J.; Paterson, J.S.; Ray, D. A Review of the Effects of Forest Management Intensity on Ecosystem Services for Northern European Temperate Forests with a Focus on the UK. Forestry: An International Journal of Forest Research 2018, 91, 151–164. [Google Scholar] [CrossRef]
- Belcher, B.; Ruíz-Pérez, M.; Achdiawan, R. Global Patterns and Trends in the Use and Management of Commercial NTFPs: Implications for Livelihoods and Conservation. World Development 2005, 33, 1435–1452. [Google Scholar] [CrossRef]
- Brown, S. Measuring Carbon in Forests: Current Status and Future Challenges. Environmental Pollution 2002, 116, 363–372. [Google Scholar] [CrossRef]
- Chirici, G.; McRoberts, R.E.; Winter, S.; Bertini, R.; Brändli, U.-B.; Asensio, I.A.; Bastrup-Birk, A.; Rondeux, J.; Barsoum, N.; Marchetti, M. National Forest Inventory Contributions to Forest Biodiversity Monitoring. Forest Science 2012, 58, 257–268. [Google Scholar] [CrossRef]
- Zhou, Y.; Feng, Z. Estimation of Forest Stock Volume Using Sentinel-2 MSI, Landsat 8 OLI Imagery and Forest Inventory Data. Forests 2023, 14, 1345. [Google Scholar] [CrossRef]
- FAO Global Forest Resources Assessment Report, Estonia Global Forest Resources Assessment. (accessed on 15 November 2022).
- Næsset, E. Practical Large-Scale Forest Stand Inventory Using a Small-Footprint Airborne Scanning Laser. Scandinavian Journal of Forest Research 2004, 19, 164–179. [Google Scholar] [CrossRef]
- Breidenbach, J.; Anton-Fernandez, C.; Petersson, H.; Mcroberts, R.E.; Astrup, R. Quantifying the Model-Related Variability of Biomass Stock and Change Estimates in the Norwegian National Forest Inventory. Forest Science 2014, 60, 25–33. [Google Scholar] [CrossRef]
- Wulder, M.A.; White, J.C.; Fournier, R.A.; Luther, J.E.; Magnussen, S. Spatially Explicit Large Area Biomass Estimation: Three Approaches Using Forest Inventory and Remotely Sensed Imagery in a GIS. Sensors 2008, 8, 529–560. [Google Scholar] [CrossRef] [PubMed]
- Kangas, A.; Astrup, R.; Breidenbach, J.; Fridman, J.; Gobakken, T.; Korhonen, K.T.; Maltamo, M.; Nilsson, M.; Nord-Larsen, T.; Næsset, E.; et al. Remote Sensing and Forest Inventories in Nordic Countries – Roadmap for the Future. Scandinavian Journal of Forest Research 2018, 33, 397–412. [Google Scholar] [CrossRef]
- Wang, X.; Zhang, C.; Qiang, Z.; Xu, W.; Fan, J. A New Forest Growing Stock Volume Estimation Model Based on AdaBoost and Random Forest Model. Forests 2024, 15, 260. [Google Scholar] [CrossRef]
- Du, C.; Fan, W.; Ma, Y.; Jin, H.I.; Zhen, Z. The Effect of Synergistic Approaches of Features and Ensemble Learning Algorith on Aboveground Biomass Estimation of Natural Secondary Forests Based on Als and Landsat 8. Sensors 2021, 21. [Google Scholar] [CrossRef]
- Asner, G.P.; Knapp, D.E.; Martin, R.E.; Tupayachi, R.; Anderson, C.B.; Mascaro, J.; Sinca, F.; Chadwick, K.D.; Higgins, M.; Farfan, W.; et al. Targeted Carbon Conservation at National Scales with High-Resolution Monitoring. Proceedings of the National Academy of Sciences 2014, 111. [Google Scholar] [CrossRef]
- Loveland, T.R.; Irons, J.R. Landsat 8: The Plans, the Reality, and the Legacy. Remote Sensing of Environment 2016, 185, 1–6. [Google Scholar] [CrossRef]
- Gobakken, T.; Næsset, E. Assessing Effects of Laser Point Density, Ground Sampling Intensity, and Field Sample Plot Size on Biophysical Stand Properties Derived from Airborne Laser Scanner Data. Canadian Journal of Forest Research 2008, 38, 1095–1109. [Google Scholar] [CrossRef]
- Rosema, A.; Verhoef, W.; Noorbergen, H.; Borgesius, J.J. A New Forest Light Interaction Model in Support of Forest Monitoring. Remote Sensing of Environment 1992, 42, 23–41. [Google Scholar] [CrossRef]
- Lim, K.; Treitz, P.; Wulder, M.; St-Onge, B.; Flood, M. LiDAR Remote Sensing of Forest Structure. Progress in Physical Geography: Earth and Environment 2003, 27, 88–106. [Google Scholar] [CrossRef]
- White, J.C.; Coops, N.C.; Wulder, M.A.; Vastaranta, M.; Hilker, T.; Tompalski, P. Remote Sensing Technologies for Enhancing Forest Inventories: A Review. Canadian Journal of Remote Sensing 2016, 42, 619–641. [Google Scholar] [CrossRef]
- Mura, M.; Bottalico, F.; Giannetti, F.; Bertani, R.; Giannini, R.; Mancini, M.; Orlandini, S.; Travaglini, D.; Chirici, G. Exploiting the Capabilities of the Sentinel-2 Multi Spectral Instrument for Predicting Growing Stock Volume in Forest Ecosystems. International Journal of Applied Earth Observation and Geoinformation 2018, 66, 126–134. [Google Scholar] [CrossRef]
- Lang, M.; Sims, A.; Pärna, K.; Kangro, R.; Möls, M.; Mõistus, M.; Kiviste, A.; Tee, M.; Vajakas, T.; Rennel, M. Remote-Sensing Support for the Estonian National Forest Inventory, Facilitating the Construction of Maps for Forest Height, Standing-Wood Volume, and Tree Species Composition Kaugseirel Põhinev Lahendus Eesti Statistilise Metsainventuuri Jaoks Puistute Kõrguse, Tüvemahu Ja Liigilise Koosseisu Kaartide Koostamiseks. Forestry Studies 2020, 73, 77–97. [Google Scholar] [CrossRef]
- McRoberts, R.E.; Tomppo, E.O.; Næsset, E. Advances and Emerging Issues in National Forest Inventories. Scandinavian Journal of Forest Research 2010, 25, 368–381. [Google Scholar] [CrossRef]
- Næsset, E. Predicting Forest Stand Characteristics with Airborne Scanning Laser Using a Practical Two-Stage Procedure and Field Data. Remote Sensing of Environment 2002, 80, 88–99. [Google Scholar] [CrossRef]
- Nilsson, M.; Nordkvist, K.; Jonzén, J.; Lindgren, N.; Axensten, P.; Wallerman, J.; Egberth, M.; Larsson, S.; Nilsson, L.; Eriksson, J.; et al. A Nationwide Forest Attribute Map of Sweden Predicted Using Airborne Laser Scanning Data and Field Data from the National Forest Inventory. Remote Sensing of Environment 2017, 194, 447–454. [Google Scholar] [CrossRef]
- Lindgren, N.; Olsson, H.; Nyström, K.; Nyström, M.; Ståhl, G. Data Assimilation of Growing Stock Volume Using a Sequence of Remote Sensing Data from Different Sensors. Canadian Journal of Remote Sensing 2022, 48, 127–143. [Google Scholar] [CrossRef]
- Allan Sims Principles of National Forest Inventory Methods. In Definition and Uncertainty of Forests. Managing Forest Ecosystems; Springer, 2022; Vol. 43.
- Chowdhury, T.A.; Thiel, C.; Schmullius, C. Growing Stock Volume Estimation from L-Band ALOS PALSAR Polarimetric Coherence in Siberian Forest. Remote Sensing of Environment 2014, 155, 129–144. [Google Scholar] [CrossRef]
- Lu, D.; Chen, Q.; Wang, G.; Liu, L.; Li, G.; Moran, E. A Survey of Remote Sensing-Based Aboveground Biomass Estimation Methods in Forest Ecosystems. International Journal of Digital Earth 2016, 9, 63–105. [Google Scholar] [CrossRef]
- Zharko, V.O.; Bartalev, S.A.; Sidorenkov, V.M. Forest Growing Stock Volume Estimation Using Optical Remote Sensing over Snow-Covered Ground: A Case Study for Sentinel-2 Data and the Russian Southern Taiga Region. Remote Sensing Letters 2020, 11, 677–686. [Google Scholar] [CrossRef]
- Hudak, A.T.; Lefsky, M.A.; Cohen, W.B.; Berterretche, M. Integration of Lidar and Landsat ETM+ Data for Estimating and Mapping Forest Canopy Height. Remote Sensing of Environment 2002, 82, 397–416. [Google Scholar] [CrossRef]
- Asner, G.P.; Mascaro, J.; Muller-Landau, H.C.; Vieilledent, G.; Vaudry, R.; Rasamoelina, M.; Hall, J.S.; van Breugel, M. A Universal Airborne LiDAR Approach for Tropical Forest Carbon Mapping. Oecologia 2012, 168, 1147–1160. [Google Scholar] [CrossRef] [PubMed]
- Fernández-Landa, A.; Fernández-Moya, J.; Tomé, J.L.; Algeet-Abarquero, N.; Guillén-Climent, M.L.; Vallejo, R.; Sandoval, V.; Marchamalo, M. High Resolution Forest Inventory of Pure and Mixed Stands at Regional Level Combining National Forest Inventory Field Plots, Landsat, and Low Density Lidar. International Journal of Remote Sensing 2018, 39, 4830–4844. [Google Scholar] [CrossRef]
- Chirici, G.; Mura, M.; McInerney, D.; Py, N.; Tomppo, E.O.; Waser, L.T.; Travaglini, D.; McRoberts, R.E. A Meta-Analysis and Review of the Literature on the k-Nearest Neighbors Technique for Forestry Applications That Use Remotely Sensed Data. Remote Sensing of Environment 2016, 176, 282–294. [Google Scholar] [CrossRef]
- Hawryło, P.; Francini, S.; Chirici, G.; Giannetti, F.; Parkitna, K.; Krok, G.; Mitelsztedt, K.; Lisańczuk, M.; Stereńczak, K.; Ciesielski, M.; et al. The Use of Remotely Sensed Data and Polish NFI Plots for Prediction of Growing Stock Volume Using Different Predictive Methods. Remote Sensing 2020, 12, 3331. [Google Scholar] [CrossRef]
- Hu, T.; Sun, Y.; Jia, W.; Li, D.; Zou, M.; Zhang, M. Study on the Estimation of Forest Volume Based on Multi-Source Data. Sensors 2021, 21, 7796. [Google Scholar] [CrossRef] [PubMed]
- Myroniuk, V.; Bell, D.M.; Gregory, M.J.; Vasylyshyn, R.; Bilous, A. Uncovering Forest Dynamics Using Historical Forest Inventory Data and Landsat Time Series. Forest Ecology and Management 2022, 513, 120184. [Google Scholar] [CrossRef]
- Singh, C.; Karan, S.K.; Sardar, P.; Samadder, S.R. Remote Sensing-Based Biomass Estimation of Dry Deciduous Tropical Forest Using Machine Learning and Ensemble Analysis. Journal of Environmental Management 2022, 308. [Google Scholar] [CrossRef]
- Chirici, G.; Giannetti, F.; McRoberts, R.E.; Travaglini, D.; Pecchi, M.; Maselli, F.; Chiesi, M.; Corona, P. Wall-to-Wall Spatial Prediction of Growing Stock Volume Based on Italian National Forest Inventory Plots and Remotely Sensed Data. International Journal of Applied Earth Observation and Geoinformation 2020, 84, 101959. [Google Scholar] [CrossRef]
- Hudak, A.T.; Crookston, N.L.; Evans, J.S.; Hall, D.E.; Falkowski, M.J. Nearest Neighbor Imputation of Species-Level, Plot-Scale Forest Structure Attributes from LiDAR Data. Remote Sensing of Environment 2008, 112, 2232–2245. [Google Scholar] [CrossRef]
- Forest. 2020 Yearbook Forest 2018.(Aastaraamat Mets 2018).; Raudsaar, M., Siimon, K.L.,. Valgepea, M. (eds.)., Ed.; Tallinn, Keskkonnaagentuur.
- Raukas, A. Briefly about Estonia. Dynamiques environnementales 2018, 284–291. [Google Scholar] [CrossRef]
- RT Forest Act. Riigiteataja I 2006, 30, 232.
- Raudsaar M; Merenäkk M; Valgepea M Yearbook Forest 2013 2014.
- Adermann V Eesti Metsad 2010 [Estonian Forests 2010 Available at Http://Www.Digar.Ee/Id/Nlib-Digar:258209; 2012.
- Reintam L . . Soil Objectives. In: Raukas, A. (Ed.). Estonian Environment: Past, Present and Future. Ministry of the Environment of Estonia, Environment Information Centre 1996, 106–108.
- Kohava, P. Forests in Estonia 1999 (Eesti Metsad 1999). 2000, 44.
- FRA Estonia GLOBAL FOREST RESOURCES ASSESSMENT 2015 COUNTRY REPORT; 2015.
- Zhang, C.; Gao, Z.; Null, S.Y.; Li, P. Edge Detectors Based on Pauta Criterion with Application to Hybrid Compact-WENO Finite Difference Scheme. AAMM 2023, 15, 1379–1406. [Google Scholar] [CrossRef]
- Breiman, L. Random Forests. Machine Learning 2001, 45, 5–32. [Google Scholar] [CrossRef]
- Breiman, L. Bagging Predictors; Kluwer Academic Publishers, 1996; Vol. 24, pp. 123–140;
- Liaw, A.; Wiener, M. Classification and Regression by randomForest; 2002; Vol. 2;
- Vapnik, V.S.; Golowich, A. Smola Support Vector Method for Function Approximation, Regression Estimation, and Signal Processing. Advances in Neural Information Processing Systems 1997, 9, 281–287. [Google Scholar]
- Liu, K.; Wang, J.; Zeng, W.; Song, J. Comparison and Evaluation of Three Methods for Estimating Forest above Ground Biomass Using TM and GLAS Data. Remote Sensing 2017, 9. [Google Scholar] [CrossRef]
- Dibike, Y.B.; Velickov, S.; Solomatine, D.; Abbott, M.B. Model Induction with Support Vector Machines: Introduction and Applications. Journal of Computing in Civil Engineering 2001, 15, 208–216. [Google Scholar] [CrossRef]
- Chen, T.; Guestrin, C. XGBoost: A Scalable Tree Boosting System. In Proceedings of the Proceedings of the ACM SIGKDD International Conference on Knowledge Discovery and Data Mining; Association for Computing Machinery, August 13 2016; Vol. 13–17-August-2016, pp. 785–794.
- Li, Y.; Li, C.; Li, M.; Liu, Z. Influence of Variable Selection and Forest Type on Forest Aboveground Biomass Estimation Using Machine Learning Algorithms. Forests 2019, 10. [Google Scholar] [CrossRef]
- Lahssini, K.; Teste, F.; Dayal, K.R.; Durrieu, S.; Ienco, D.; Monnet, J.-M. Combining LiDAR Metrics and Sentinel-2 Imagery to Estimate Basal Area and Wood Volume in Complex Forest Environment via Neural Networks. IEEE Journal of Selected Topics in Applied Earth Observations and Remote Sensing 2022, 15, 4337–4348. [Google Scholar] [CrossRef]
- Ma, T.; Hu, Y.; Wang, J.; Beckline, M.; Pang, D.; Chen, L.; Ni, X.; Li, X. A Novel Vegetation Index Approach Using Sentinel-2 Data and Random Forest Algorithm for Estimating Forest Stock Volume in the Helan Mountains, Ningxia, China. Remote Sensing 2023, 15, 1853. [Google Scholar] [CrossRef]
- Frampton, W.J.; Dash, J.; Watmough, G.; Milton, E.J. Evaluating the Capabilities of Sentinel-2 for Quantitative Estimation of Biophysical Variables in Vegetation. ISPRS Journal of Photogrammetry and Remote Sensing 2013, 82, 83–92. [Google Scholar] [CrossRef]
- Yu, T.; Pang, Y.; Liang, X.; Jia, W.; Bai, Y.; Fan, Y.; Chen, D.; Liu, X.; Deng, G.; Li, C.; et al. China’s Larch Stock Volume Estimation Using Sentinel-2 and LiDAR Data. Geo-spatial Information Science 2023, 26, 392–405. [Google Scholar] [CrossRef]
- Leite, R.V.; Amaral, C.H. do; Pires, R. de P.; Silva, C.A.; Soares, C.P.B.; Macedo, R.P.; Silva, A.A.L. da; Broadbent, E.N.; Mohan, M.; Leite, H.G. Estimating Stem Volume in Eucalyptus Plantations Using Airborne LiDAR: A Comparison of Area- and Individual Tree-Based Approaches. Remote Sensing 2020, 12, 1513. [Google Scholar] [CrossRef]
- Lin, W.; Lu, Y.; Li, G.; Jiang, X.; Lu, D. A Comparative Analysis of Modeling Approaches and Canopy Height-Based Data Sources for Mapping Forest Growing Stock Volume in a Northern Subtropical Ecosystem of China. GIScience & Remote Sensing 2022, 59, 568–589. [Google Scholar] [CrossRef]
- Saarela, S.; Grafström, A.; Ståhl, G.; Kangas, A.; Holopainen, M.; Tuominen, S.; Nordkvist, K.; Hyyppä, J. Model-Assisted Estimation of Growing Stock Volume Using Different Combinations of LiDAR and Landsat Data as Auxiliary Information. Remote Sensing of Environment 2015, 158, 431–440. [Google Scholar] [CrossRef]
- Fang, G.; He, X.; Weng, Y.; Fang, L. Texture Features Derived from Sentinel-2 Vegetation Indices for Estimating and Mapping Forest Growing Stock Volume. Remote Sensing 2023, 15, 2821. [Google Scholar] [CrossRef]
- Korhonen, L.; Hadi; Packalen, P. ; Rautiainen, M. Comparison of Sentinel-2 and Landsat 8 in the Estimation of Boreal Forest Canopy Cover and Leaf Area Index. Remote Sensing of Environment 2017, 195, 259–274. [Google Scholar] [CrossRef]
- Saarela, S.; Wästlund, A.; Holmström, E.; Mensah, A.A.; Holm, S.; Nilsson, M.; Fridman, J.; Ståhl, G. Mapping Aboveground Biomass and Its Prediction Uncertainty Using LiDAR and Field Data, Accounting for Tree-Level Allometric and LiDAR Model Errors. Forest Ecosystems 2020, 7. [Google Scholar] [CrossRef]
- Chen, L.; Ren, C.; Zhang, B.; Wang, Z. Multi-Sensor Prediction of Stand Volume by a Hybrid Model of Support Vector Machine for Regression Kriging. Forests 2020, 11, 296. [Google Scholar] [CrossRef]


| Zone | No. of plot | Min | Max | Mean | SD |
|---|---|---|---|---|---|
| N/W | 3712 | 36.89 | 1007.01 | 531.42 | 162.36 |
| S/W | 3651 | 80.8 | 1038.24 | 573.22 | 153.58 |
| N/E | 3852 | 31.76 | 1101.03 | 569.59 | 175.65 |
| S/E | 3665 | 122.08 | 1101.03 | 625.40 | 147.57 |
| All | 14880 | 31.76 | 1101.03 | 575.13 | 163.78 |
| Variable | Description | |
|---|---|---|
| Sentinel 2 | Blue | B2 |
| single band | Green | B3 |
| Red | B4 | |
| Red edge 1 | B5 | |
| Red edge 2 | B6 | |
| Red edge 3 | B7 | |
| NIR | B8 | |
| NIR narrow | B8A | |
| SWIR | B11 | |
| SWIR | B12 | |
| Veg. indices | NDVI | (B08-B04)/(B08+B04) |
| ARI1 | (1 / B03) - (1 / B05) | |
| MARI | (1 / B03) - (1 / B05) * B07 | |
| ARVI | (B8A - B04 - y * (B04 - B02)) / (B8A + B04 - y * (B04 - B02)) | |
| NDVIre705 | (B08-B05)/(B08+B05) | |
| NDVIre740 | (B08-B06)/(B08+B06) | |
| NDVIre783 | (B08-B07)/(B08+B07) | |
| EVI | 2.5*(B08-B04)/(BO8+2.4*B04+1) | |
| SAVI | (B08-B04) *(1+L)/ (BO8+B04+L) | |
| MCARI | ((B05 - B04) - 0.2 * (B05 - B03)) * (B05 / B04) | |
| Clgreen | (B07)/(B03-1) | |
| ND11 | (B07-B05)/(B07+B05) | |
| chlre | (B07)/(B05-1) | |
| GNDVI | B08-BO3) / (B08+B03 | |
| MSAVI | 0.5*(2 * B08 + 1 - sqrt ((2 * B08 + 1)^2 - 8 * (B08 - B04))) | |
| Airborne Lidar | p25 | Height percentile of 25% |
| p50 | Height percentile of 50% | |
| p60 | Height percentile of 60% | |
| p70 | Height percentile of 70% | |
| p75 | Height percentile of 75% | |
| p80 | Height percentile of 80% | |
| p90 | Height percentile of 90% | |
| p95 | Height percentile of 95% | |
| first_returns_above | number of first return laser pulses | |
| percentage_all | percentage of all laser pulses | |
| total_first_return | total number of first return laser pulses |
| Variables | R² | RMSE | RMSE% | |
|---|---|---|---|---|
| CO1 | NW | 0.78 | 141.84 | 14.65 |
| CO2 | 0.69 | 133.1 | 13.74 | |
| CO3 | 0.63 | 125.39 | 12.95 | |
| CO4 | 0.64 | 126.74 | 13.09 | |
| CO1 | SW | 0.79 | 139.21 | 15.12 |
| CO2 | 0.77 | 138.57 | 15.05 | |
| CO3 | 0.7 | 126.85 | 13.78 | |
| CO4 | 0.74 | 129.22 | 14.04 | |
| CO1 | NE | 0.73 | 141.51 | 13.23 |
| CO2 | 0.74 | 147.2 | 13.77 | |
| CO3 | 0.61 | 132.17 | 12.36 | |
| CO4 | 0.64 | 133.77 | 12.51 | |
| CO1 | SE | 0.81 | 135.49 | 13.84 |
| CO2 | 0.74 | 128.41 | 13.12 | |
| CO3 | 0.68 | 119.35 | 12.19 | |
| CO4 | 0.7 | 120.56 | 12.32 |
| Quadrant | RF | SVR | XGBoost | |||
|---|---|---|---|---|---|---|
| R² | RMSE | R² | RMSE | R² | RMSE | |
| NW | 0.64* | 125.39 | 0.52* | 123.41 | 0.64** | 126.15 |
| SW | 0.74** | 129.22 | 0.64* | 124.53 | 0.69** | 128.29 |
| NE | 0.64** | 133.77 | 0.60** | 138.98 | 0.60* | 132.63 |
| SE | 0.70** | 120.56 | 0.68** | 122.34 | 0.65* | 123.66 |
Disclaimer/Publisher’s Note: The statements, opinions and data contained in all publications are solely those of the individual author(s) and contributor(s) and not of MDPI and/or the editor(s). MDPI and/or the editor(s) disclaim responsibility for any injury to people or property resulting from any ideas, methods, instructions or products referred to in the content. |
© 2024 by the authors. Licensee MDPI, Basel, Switzerland. This article is an open access article distributed under the terms and conditions of the Creative Commons Attribution (CC BY) license (http://creativecommons.org/licenses/by/4.0/).


