1. Introduction
Rice is one of the most important staple crops globally, particularly in China, where it plays a vital role in food security and agricultural economy. With the continuous development and iterative updates in unmanned aerial vehicles (UAVs), hyperspectral remote sensing technology based on UAV platforms is being widely applied. Hyperspectral remote sensing technology helps in non-destructive estimation of various physicochemical indicators of rice, facilitating intelligent management of rice production [
1]. Combining rice quality estimation with hyperspectral remote sensing technology allows for a more comprehensive, rapid, and objective understanding of rice quality, which is an inevitable trend in the development of automated grading[
2]. Previously, researchers have done preliminary explorations of rice quality using near-infrared spectroscopy technology Hui et al. [
1]conducted study on three main components in 102 rice samples, and established quantitative analysis models for rice moisture, protein, and amylose using partial least squares combined with near-infrared spectroscopy. Ying et al. [
2] used rapid near-infrared spectroscopy analysis technology and established a mathematical model between near-infrared spectroscopy and the crude protein content of rice using partial least squares regression, and predicted the crude protein content in brown rice. Zhang et al. [
3] obtained near-infrared spectra from 178 recombinant inbred lines of 51 rice varieties and developed a model based on partial least squares regression to estimate the rice protein and amylose contents. Cheng et al. [
4] based on a self-developed near-infrared spectroscopy platform, used 143 hybrid indica rice varieties with different taste qualities as materials, established models for single grain amylose and protein content, and explored the impact of genetic differences between parents on the taste quality of rice. The research proved that near-infrared spectroscopy could identify high taste quality hybrid indica rice.
In the field of estimating rice quality using hyperspectral technology, Barnaby et al. [
5] demonstrated that hyperspectral technology could be used for non-destructive high-throughput phenotypic analysis of grain chalkiness and potentially other grain quality traits in multiple rice samples. Xiao et al. [
6] used indoor-obtained reflectance spectra of rice flour and dry panicles as the basic data source through four steps: continuous wavelet spectral transformation, sensitive wavelet feature extraction, common feature analysis, and predictive model construction. It was found that, high-throughput hyperspectral prediction of amylose content was achieved, laying the foundation of hyperspectral estimation of amylose content in rice grains at the canopy level. Further, Lihong et al. [
7] also studied the correlation between rice grain quality and the spectral characteristics of the rice canopy reflection to realize high-throughput estimation of rice quality, and found satisfactory results. Xianlong et al. [
8] acquire multispectral canopy data of rice population at four stages and measure the protein content, amylose content, and taste value of rice grains. They constructed quality estimation models through stepwise multiple linear regression for different growth stages, and found that the amylose content of rice is difficult to estimate. Moreover, the accuracy of the maturity stage quality estimation model based on vegetation indices was superior to those of the other three stages, proving the high accuracy of quality estimation for rice quality using multispectral UAVs during the maturity period.
To ascertain the feasibility of utilizing unmanned aerial vehicle (UAV) hyperspectral imaging for estimating field rice quality further, this study employed the DJI Matrice M600Pro UAV equipped with a Gaia Sky-mini airborne hyperspectral camera. Hyperspectral data were collected during four growth stages of field rice, such as tillering stage, jointing stage, booting stage and grain filling stage. The objectives are to construct a model for estimating rice protein content using hyperspectral technology and machine learning, thereby providing technical support for future assessments of rice quality and contributing to the development of automated grading systems in precision agriculture.
2. Materials and Methods
2.1. Experimental Design
2.1.1. Experiment 1
The experiment 1 was proceeded during 2022-2023 at experimental farm of the College of Agronomy, Yangzhou University (119.426°E, 32.391°N)). The test materials for experiment 1 included four rice varieties: Yangnong Rice 1, Xiu Zhan 15, Y Liangyou 900, and Yangdao 6. Each variety was subjected to four nitrogen levels: 0 kg ha-1, 120 kg ha-1, 240 kg ha-1, and 360 kg ha-1, making a total of 16 plots with each plot measuring 3 m × 4 m. The nitrogen fertilizer was applied as base fertilizer: tillering fertilizer = 5:5, while phosphorus and potassium fertilizers were applied at rate of 150 kg ha-1 as base fertilizers. Further, field management activities were carried out according to conventional methods.
2.1.2. Experiment 2
This experiment was conducted in 2022 at the Xinminzhou experimental field of Yangzhou University (119.426°E, 32.391°N). The test materials for experiment was 2 consisted of 60 rice varieties, the names and field plot numbers of varieties are listed in
Table 1.
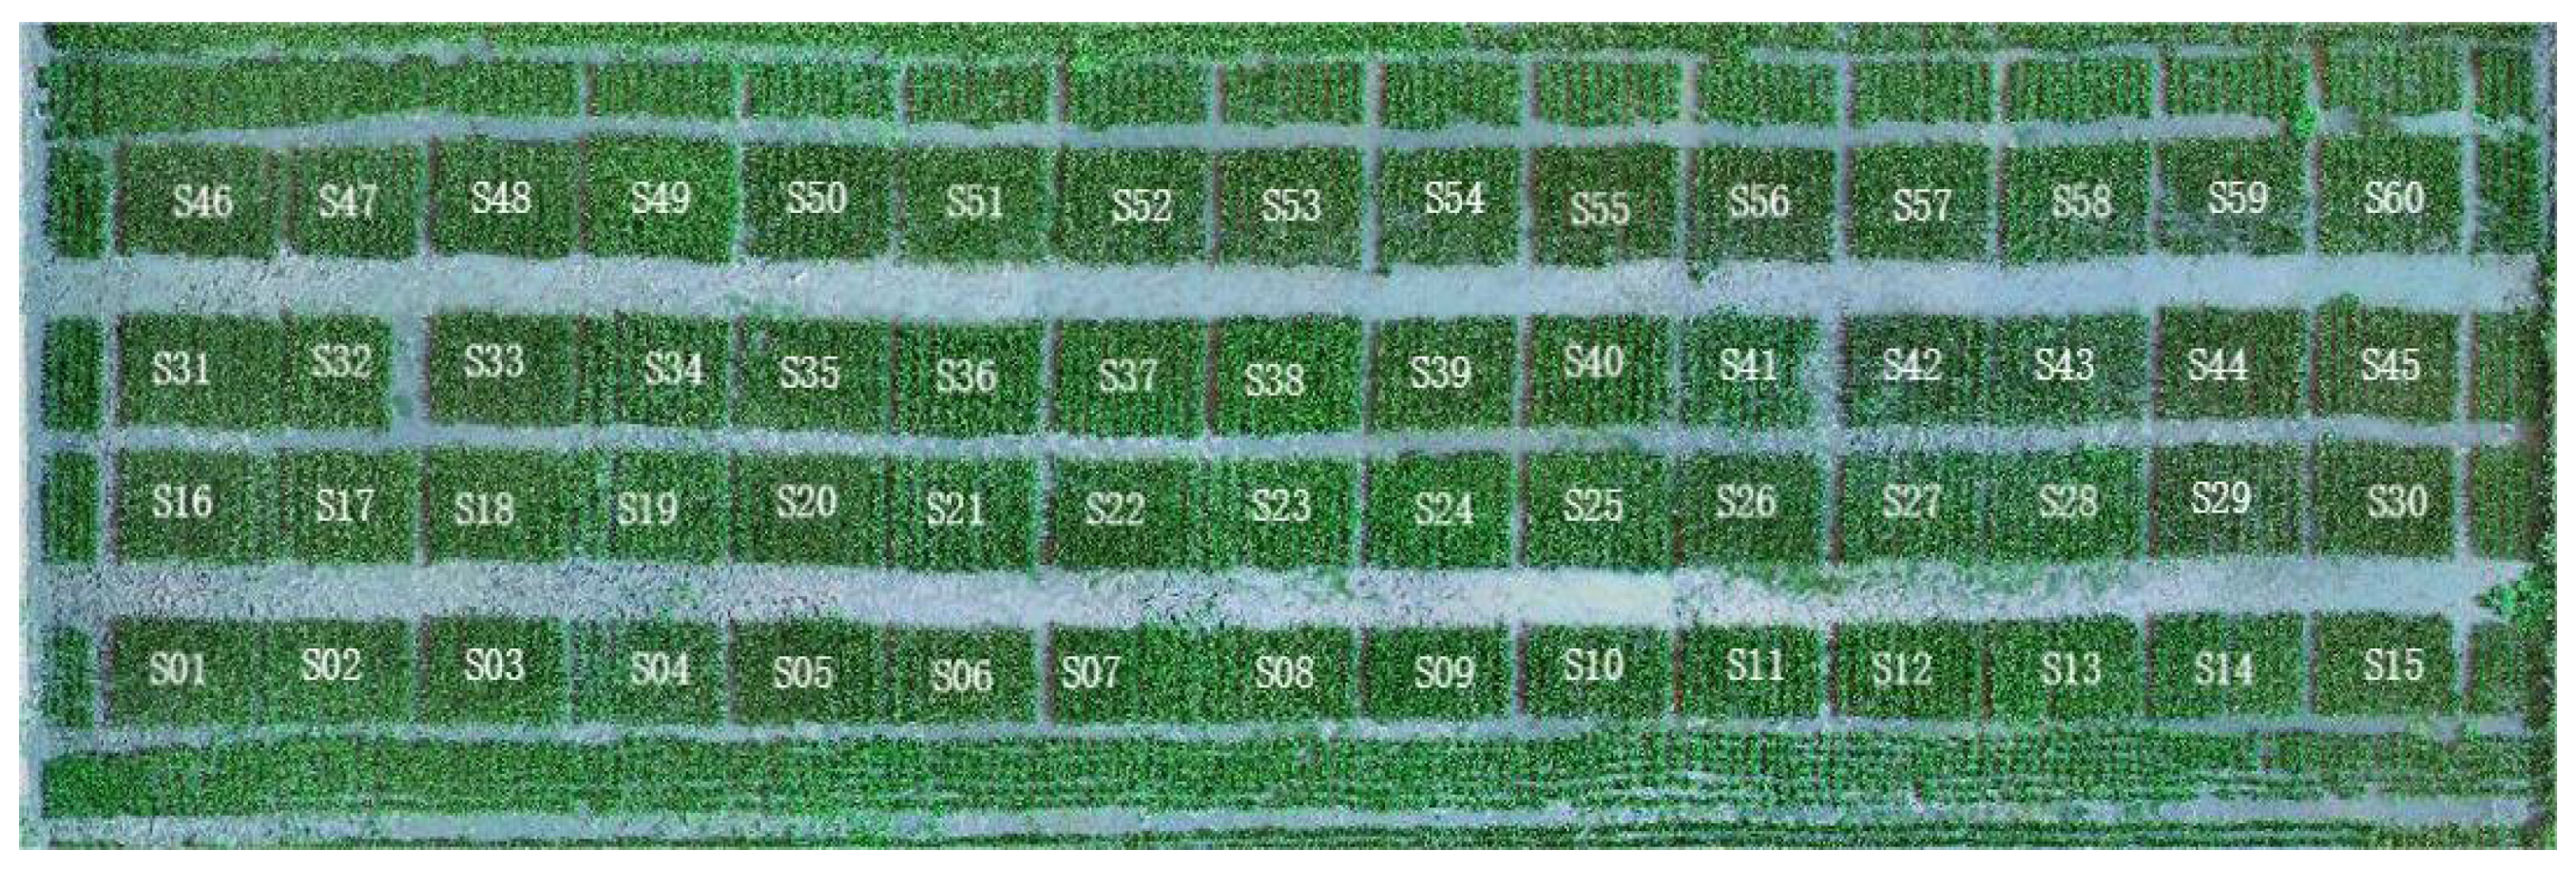
Each of the 60 varieties was planted in one plot, totaling 60 plots as shown in
Figure 1, and plot size was 3 m × 4 m. The nitrogen fertilizer was applied at 270 kg ha-1 as base fertilizer and tillering fertilizer in a 5:5 ratio. Phosphorus and potassium fertilizers were applied at a rate of 150 kg ha-1 as base fertilizers. All other field management was done according to conventional methods.
2.2. Data Acquisition
2.2.1. Rice Grain Crushing and Rice Flour Preparation
The target samples were crushed using the Dajie FS-II Laboratory Cyclone Mill/Laboratory Grinder to obtain rice flour. The specific procedure involved weighing approximately 20 g of polished rice, which was then air-dried for about three days at a ventilated location until the moisture content of the rice grains from all varieties was ≤14%. Milling could then commence. The polished rice was poured into the cyclone mill, and the outlet was tightly sealed with a plastic bag and rubber band to prevent sample loss. The resulting grain powder was sieved twice using a 100-mesh sieve. Finally, the sieved rice flour was collected into a sealed bag using a soft brush, air was expelled to prevent moisture and insect damage, and the samples were renumbered with an oil-based marker.
2.2.2. Protein Content Determination
Using equipment such as a benchtop centrifuge, constant temperature water bath, visible spectrophotometer/enzyme labeler, micro quartz cuvette/96-well plate, and micropipette, the soluble protein content in the sample powder were determined using the Comin BCA Protein Assay Kit.
2.2.3. UAV Hyperspectral Imaging Acquisition
Hyperspectral images were captured using the DJI Matrice M600 Pro UAV equipped with a Gaia Sky-mini airborne hyperspectral camera, capable of acquiring hyperspectral images in the 400-1000 nm range. Flight planning was done using DJI’s GS Pro software. The images were taken in clear weather without clouds and suitable sunlight, as excessive light may cause overexposure and affect the extraction of hyperspectral features. The optimal time was around 10 a.m., with short flight intervals to ensure sufficient and stable sunlight. The shooting angle was perpendicular to the ground, and the flight altitude was approximately 50 meters. Wind speeds were generally not more than Beaufort scale four to ensure flight stability and subsequent image stitching quality. The UAV images were taken at rice booting, heading, flowering, and grain filling stages, and all images were in JPG format. A grayscale gradient board prepared in advance was used for spectral data acquisition with the hyperspectral camera after UAV aerial photography, which was later used for radiometric correction in image stitching.
2.2.4. Image Preprocessing
Image stitching was conducted using Agisoft software, followed by image preprocessing with ENVI software, including denoising and sharpening, to effectively enhance image quality. A grayscale gradient board served as the calibration object, and ENVI was used to extract grayscale values from the board to establish a grayscale-reflectance curve equation for radiometric correction of the rice canopy reflectance spectra in the plots. Finally, the grayscale values were converted into true reflectance information of the rice canopy spectra, thereby enhancing experimental accuracy.
2.2.5. Selection of Vegetation Indices
The principle of vegetation indices is based on the reflective characteristics of vegetation at different wavelengths. Hyperspectral image data captured by the UAV was used to extract all bands from the images, and specific formulas were applied to calculate the required vegetation indices. This study selected 13 vegetation indices that were previously proposed for nutritional quality estimation (
Table 2).
2.3. Model Construction and Validation
The current study utilized two deep learning methods that have shown effective results in previous studies: the Stepwise Multiple Linear Regression (SMLR) and the Back Propagation Neural Network (BPNN). These methods were applied to construct and validate nutritional quality estimation models based on hyperspectral data from the rice canopy during the grain filling stage. Initially, we analyzed the correlation between rice nutritional quality indicators and the original spectral curves of the rice canopy, selecting highly correlated sensitive bands. Subsequent steps involve the selection and calculation of spectral vegetation indices, further analyzing the correlation between these indices and rice quality indicators. Based on this, vegetation indices with high correlation coefficients were selected as independent variables for modeling using both SMLR and BPNN.
Data from experiment 1 were used for model construction, while data from experiment 2 are employed to validate the models, comparing the two estimation models. Model accuracy was assessed using the coefficient of determination (R²) and root mean square error (RMSE) as metrics. The R² reflects the stability of model construction and validation; a value closer to 1 indicates better stability and higher fitting degree. While, RMSE is used to evaluate the precision of the model estimates; a lower RMSE indicates better predictive capability of the model. The specific formulas are as follows:
In above equations: represents the predicted value of the rice quality indicator, represents the actual measured value of the rice quality indicator, is the average value of the rice quality indicators, and n is the number of actual samples measured.
3. Results and Analysis
3.1. Correlation Analysis between Rice Canopy Hyperspectral Data and Rice Nutritional Quality Indicators
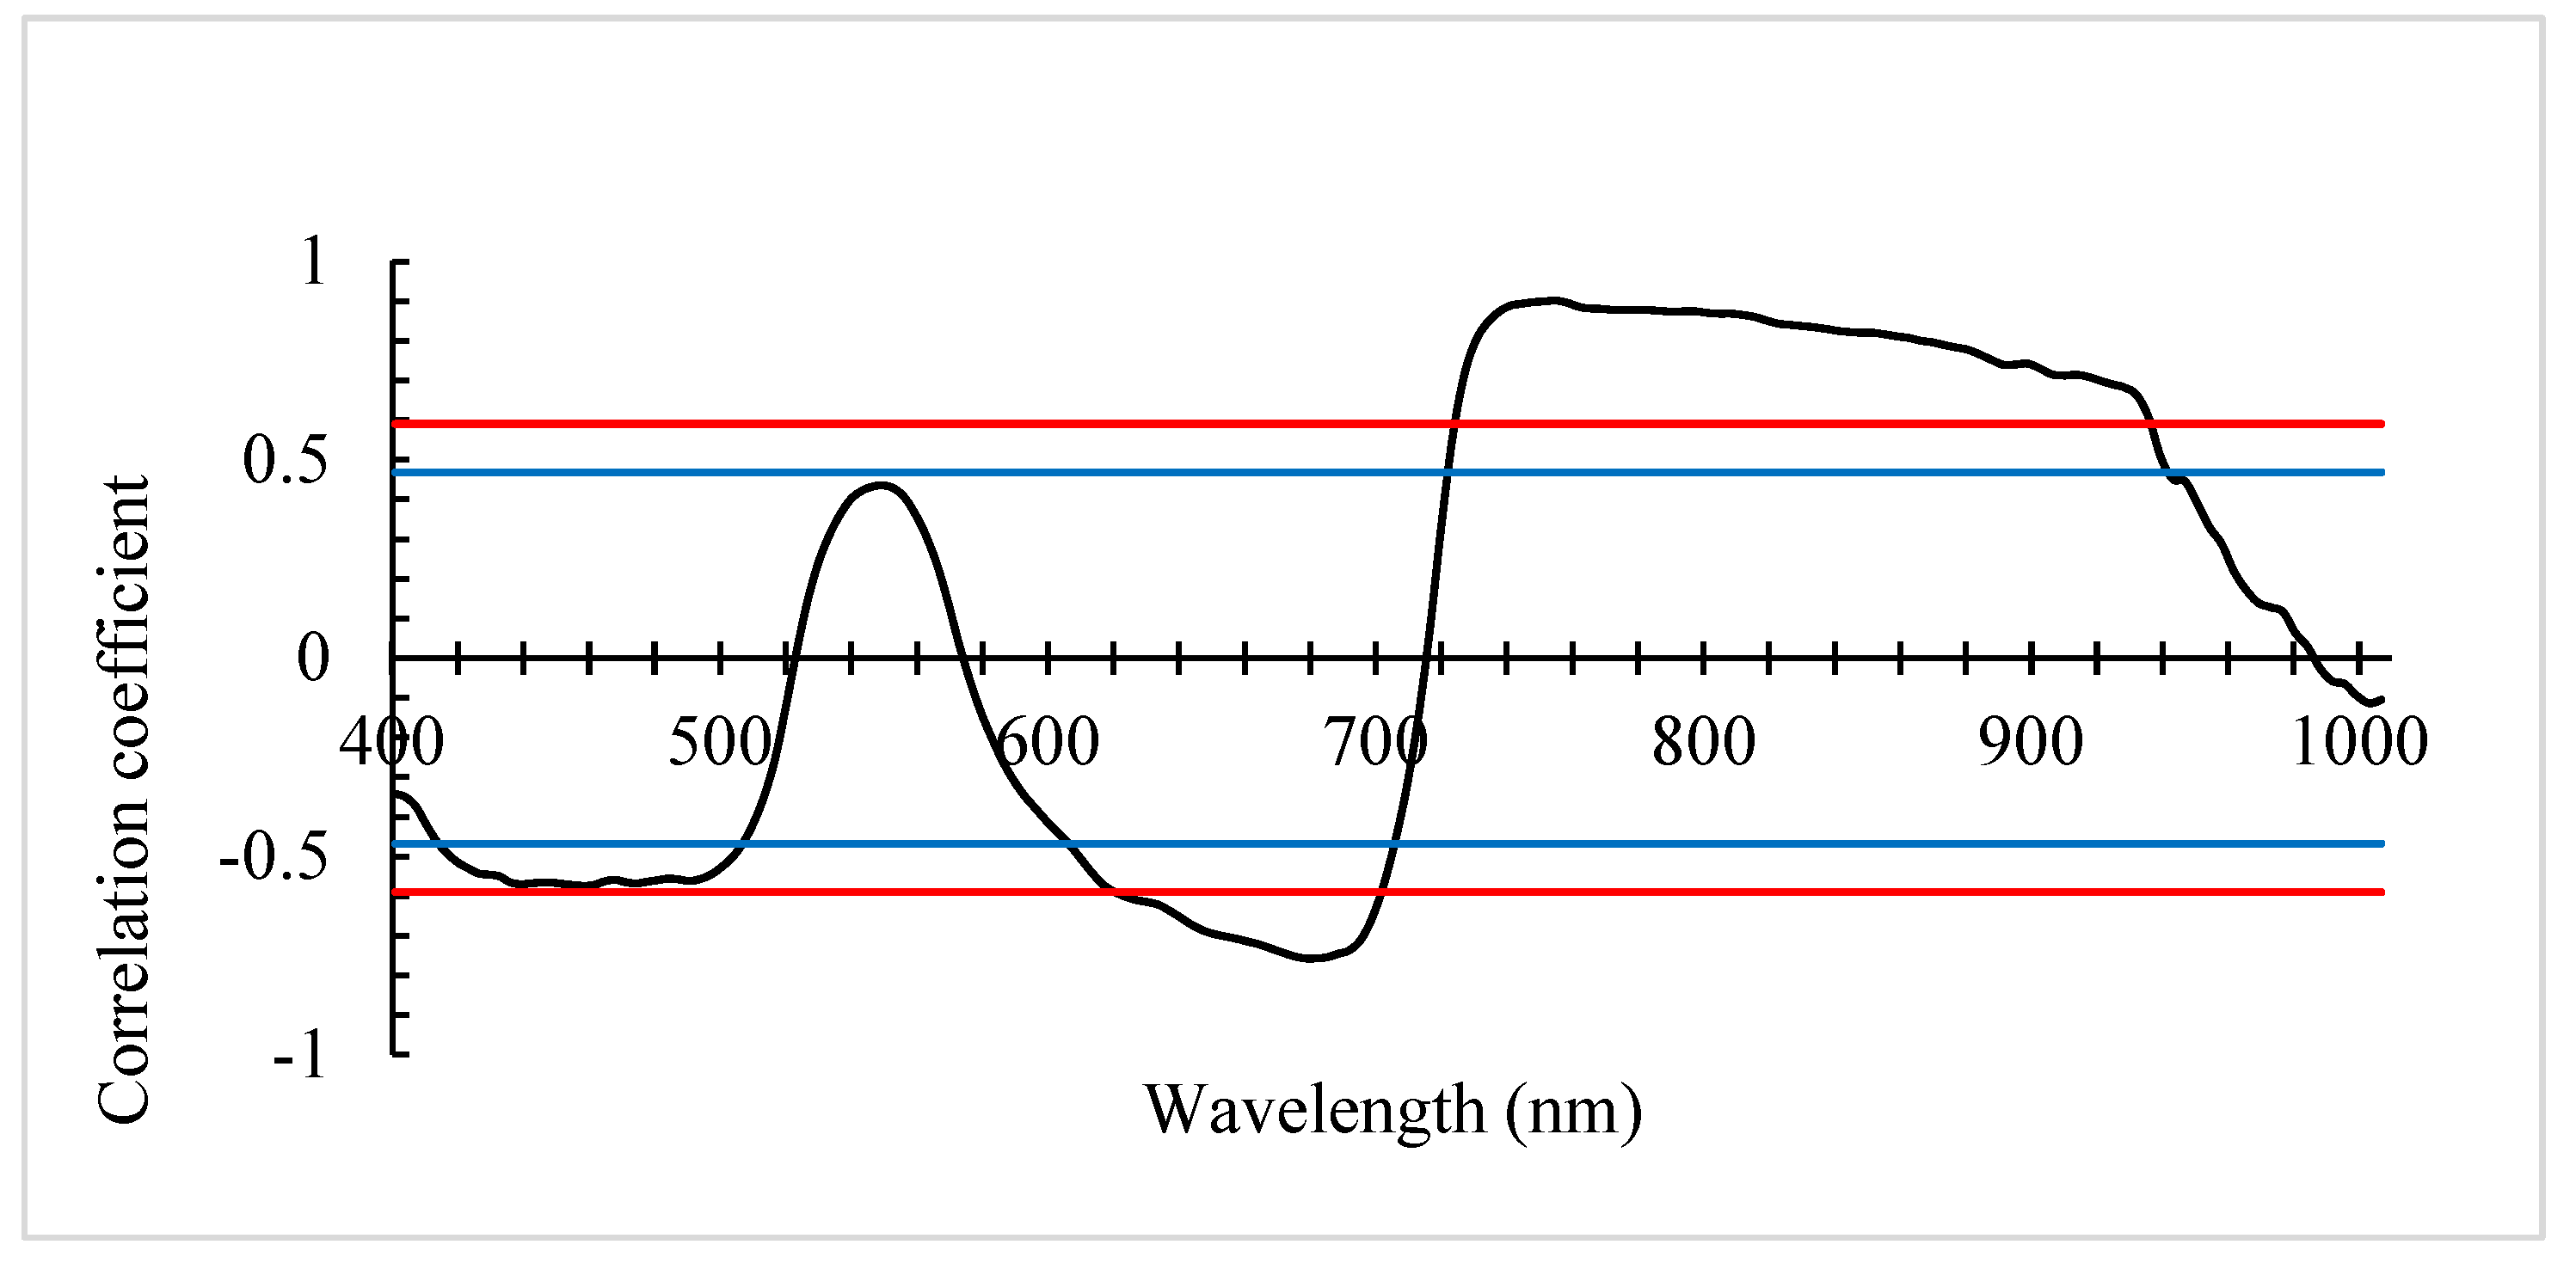
The correlation analysis between the hyperspectral data of rice leaf canopies during the grain filling stage and the nutritional quality indicator (protein content) was performed, and the resulting correlation coefficients were plotted in a curve.
From the graph, it is evident that within the wavelength ranges of 419-510 nm and 610-709 nm, grain protein content shows a negative correlation with spectral reflectance. A highly significant negative correlation occurs within the range of 623-706 nm, reaching a peak at 685 nm (r=-0.754). While, a positive correlation is observed within the range of 726-943 nm, becoming highly significant within the range of 730-939 nm, peaking at 755 nm (r=0.901).
In summary, by analyzing the correlation between rice nutritional quality indicator and the original spectral reflectance values of the rice leaf canopy, the sensitive wavelength bands for grain protein content on the original spectral curve were identified, laying the foundation for the subsequent selection and calculation of spectral vegetation indices.
Figure 2.
Correlation between rice nutritional quality indicator and rice canopy spectral curves. Here,
black curve represents the correlation at different wavelengths, while the red and blue line indicates
the significance level at 0.01, and 0.05 respectively.
Figure 2.
Correlation between rice nutritional quality indicator and rice canopy spectral curves. Here,
black curve represents the correlation at different wavelengths, while the red and blue line indicates
the significance level at 0.01, and 0.05 respectively.
3.2. Analysis of the Correlation between Selected Spectral Vegetation Indices and Rice Nutritional Quality
Based on the correlation analysis results between rice protein content and canopies hyperspectral data, wavelength bands that show a significant correlation with rice nutritional quality indicator were selected for calculating spectral vegetation indices. These indices were then correlated with rice nutritional quality to explore their suitability for estimating rice nutritional quality. To further enhance estimation precision, the four vegetation indices with the highest absolute correlation coefficients—VOG2, MSAVI, DVI, and TVI—were chosen for inverse modeling (
Table 3).
3.3. Establishment and Validation of a Rice Nutritional Quality Estimation Model Based on Stepwise Multiple Linear Regression
3.3.1. Model Establishment
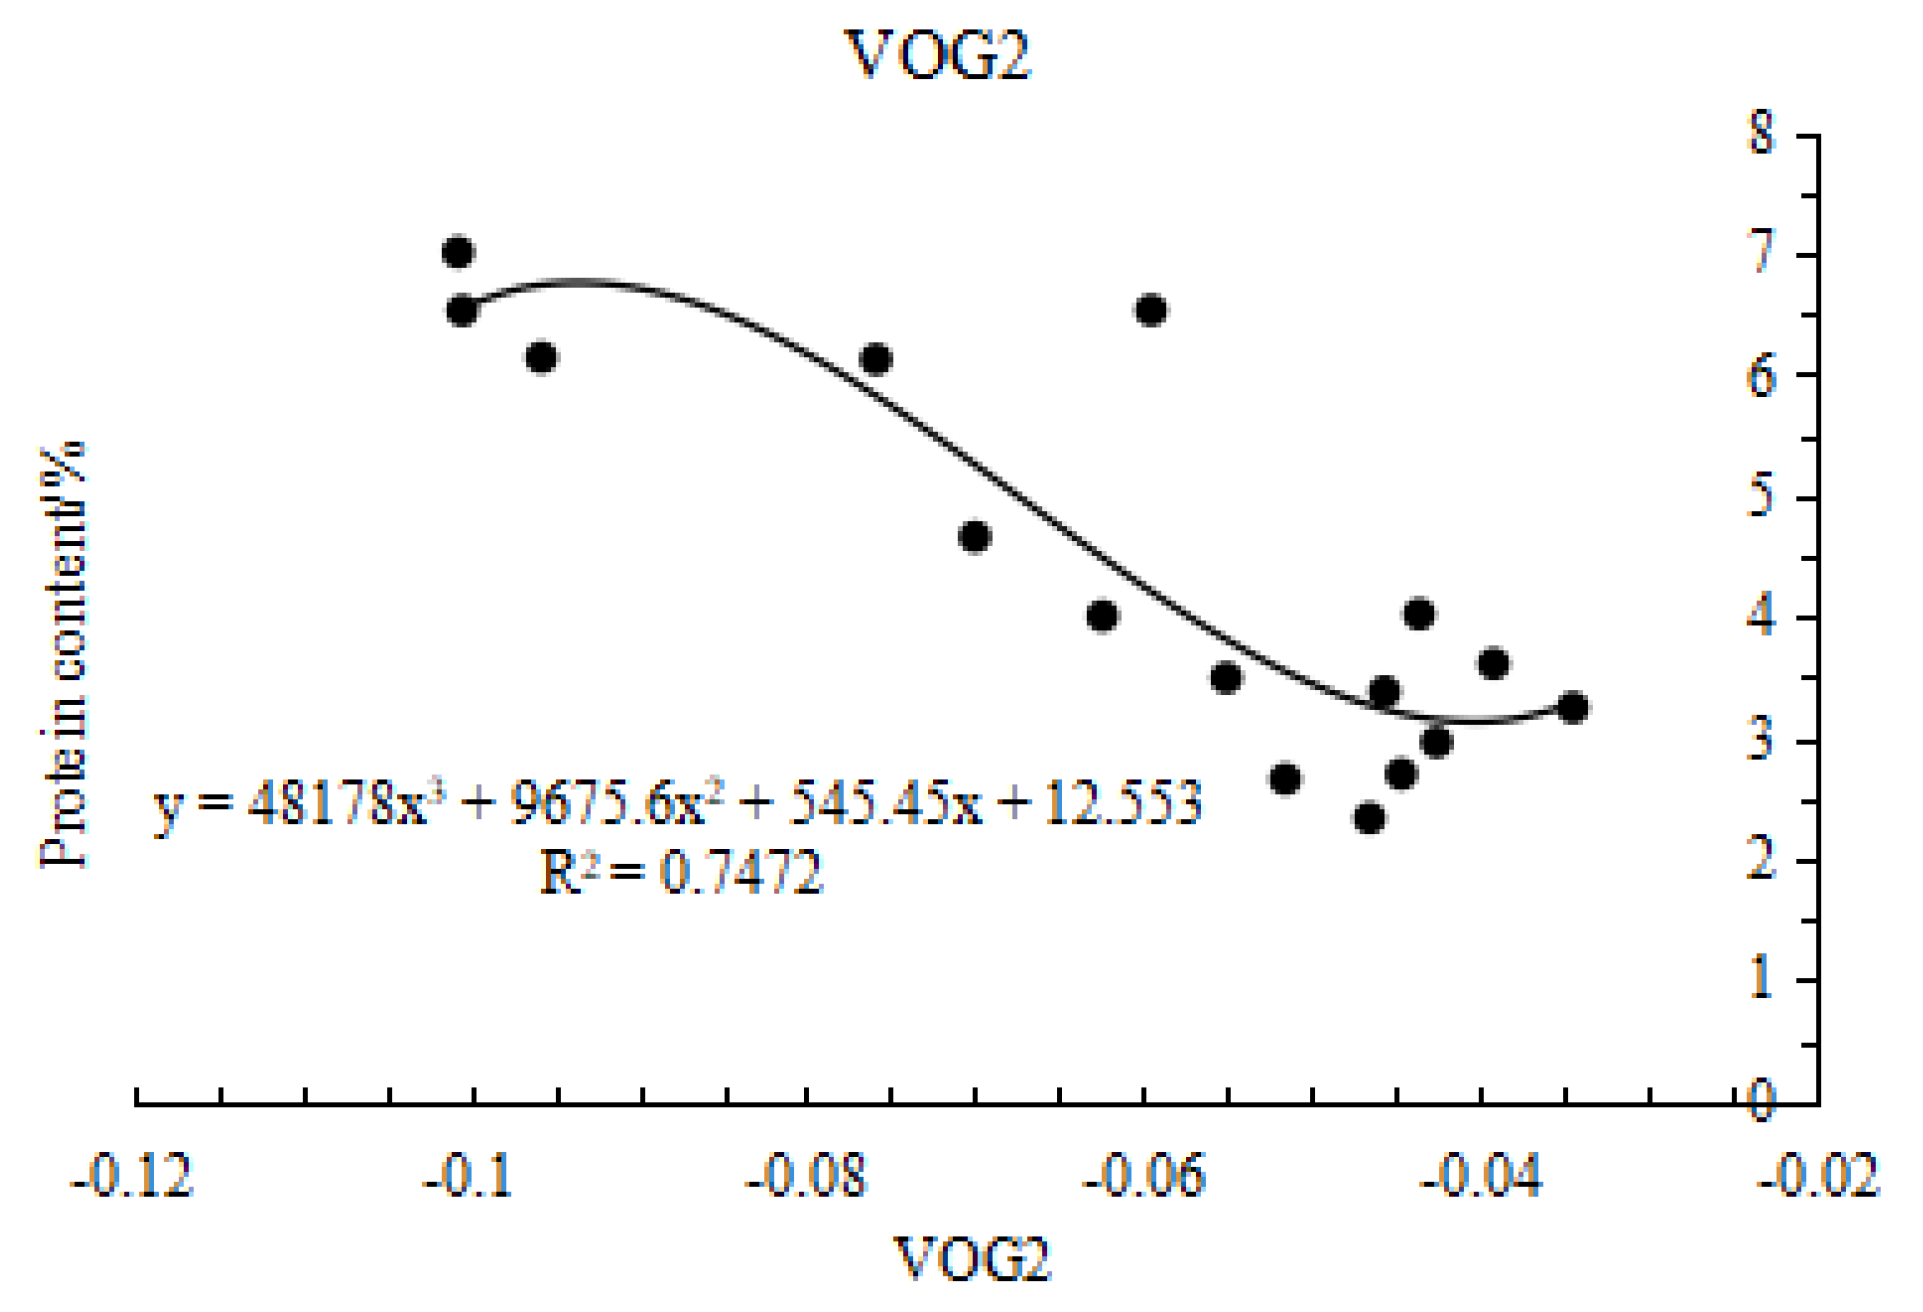
Based on data from experiment 1, vegetation indices were used as independent variables and grain protein content as the dependent variable for regression analysis. Various functions including linear, logarithmic, exponential, power, quadratic, and cubic were fitted. After a series of calculations and comparisons, a cubic function was finally chosen for modeling.
As shown in
Figure 3, the cubic function model for estimating grain protein content based on VOG2 had a regression equation of y=48178x3+9675.6x2+545.45x+12.553, R2=0.7472. The cubic function model based on MSAVI had a regression equation of y=-309.47x3+528.11x2-251.56x+39.589, R2=0.6235. The model based on DVI had a regression equation of y=2988.4x3-1722.2x2+329.08x-17.843, R2=0.6655; and the model based on TVI had a regression equation of y=-0.0018x3+0.1649x2-3.1598x+20.263, R2=0.6315. VOG2 outperforms the other vegetation indices in estimating grain protein content, with an R2 value of 0.7472. This higher R2 indicates that the VOG2 model explains a larger proportion of the variance in protein content, making it a more reliable predictor compared to the other indices. Specifically, VOG2 estimates protein content approximately 16.81 % better than the other indices on average. The superior performance of VOG2 is likely due to its sensitivity to the spectral features that correlate strongly with protein content, which may not be as effectively captured by the other indices.
3.3.2. Model Validation
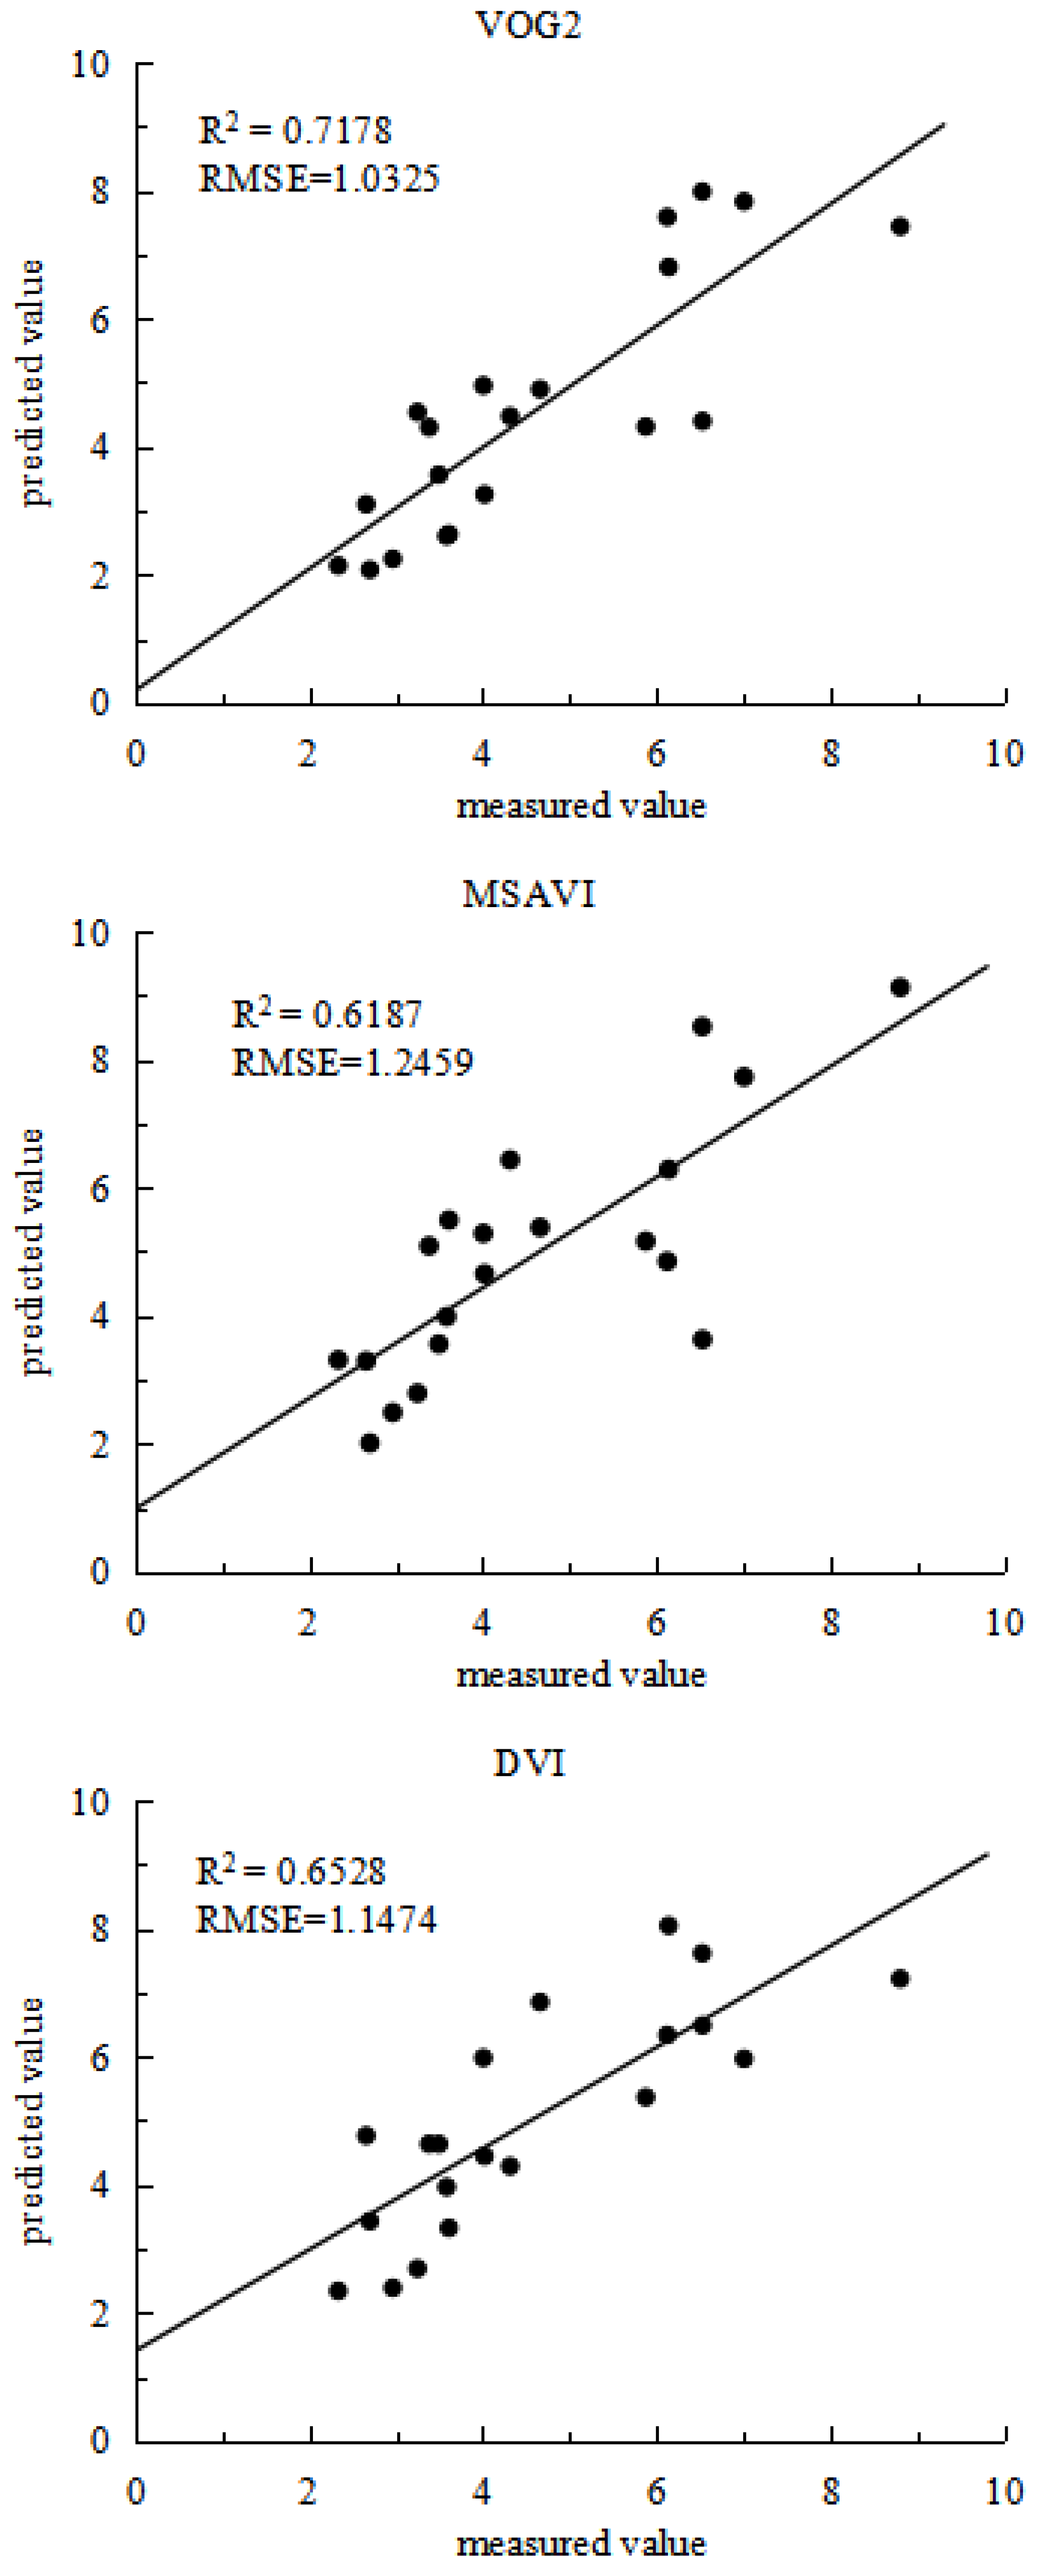
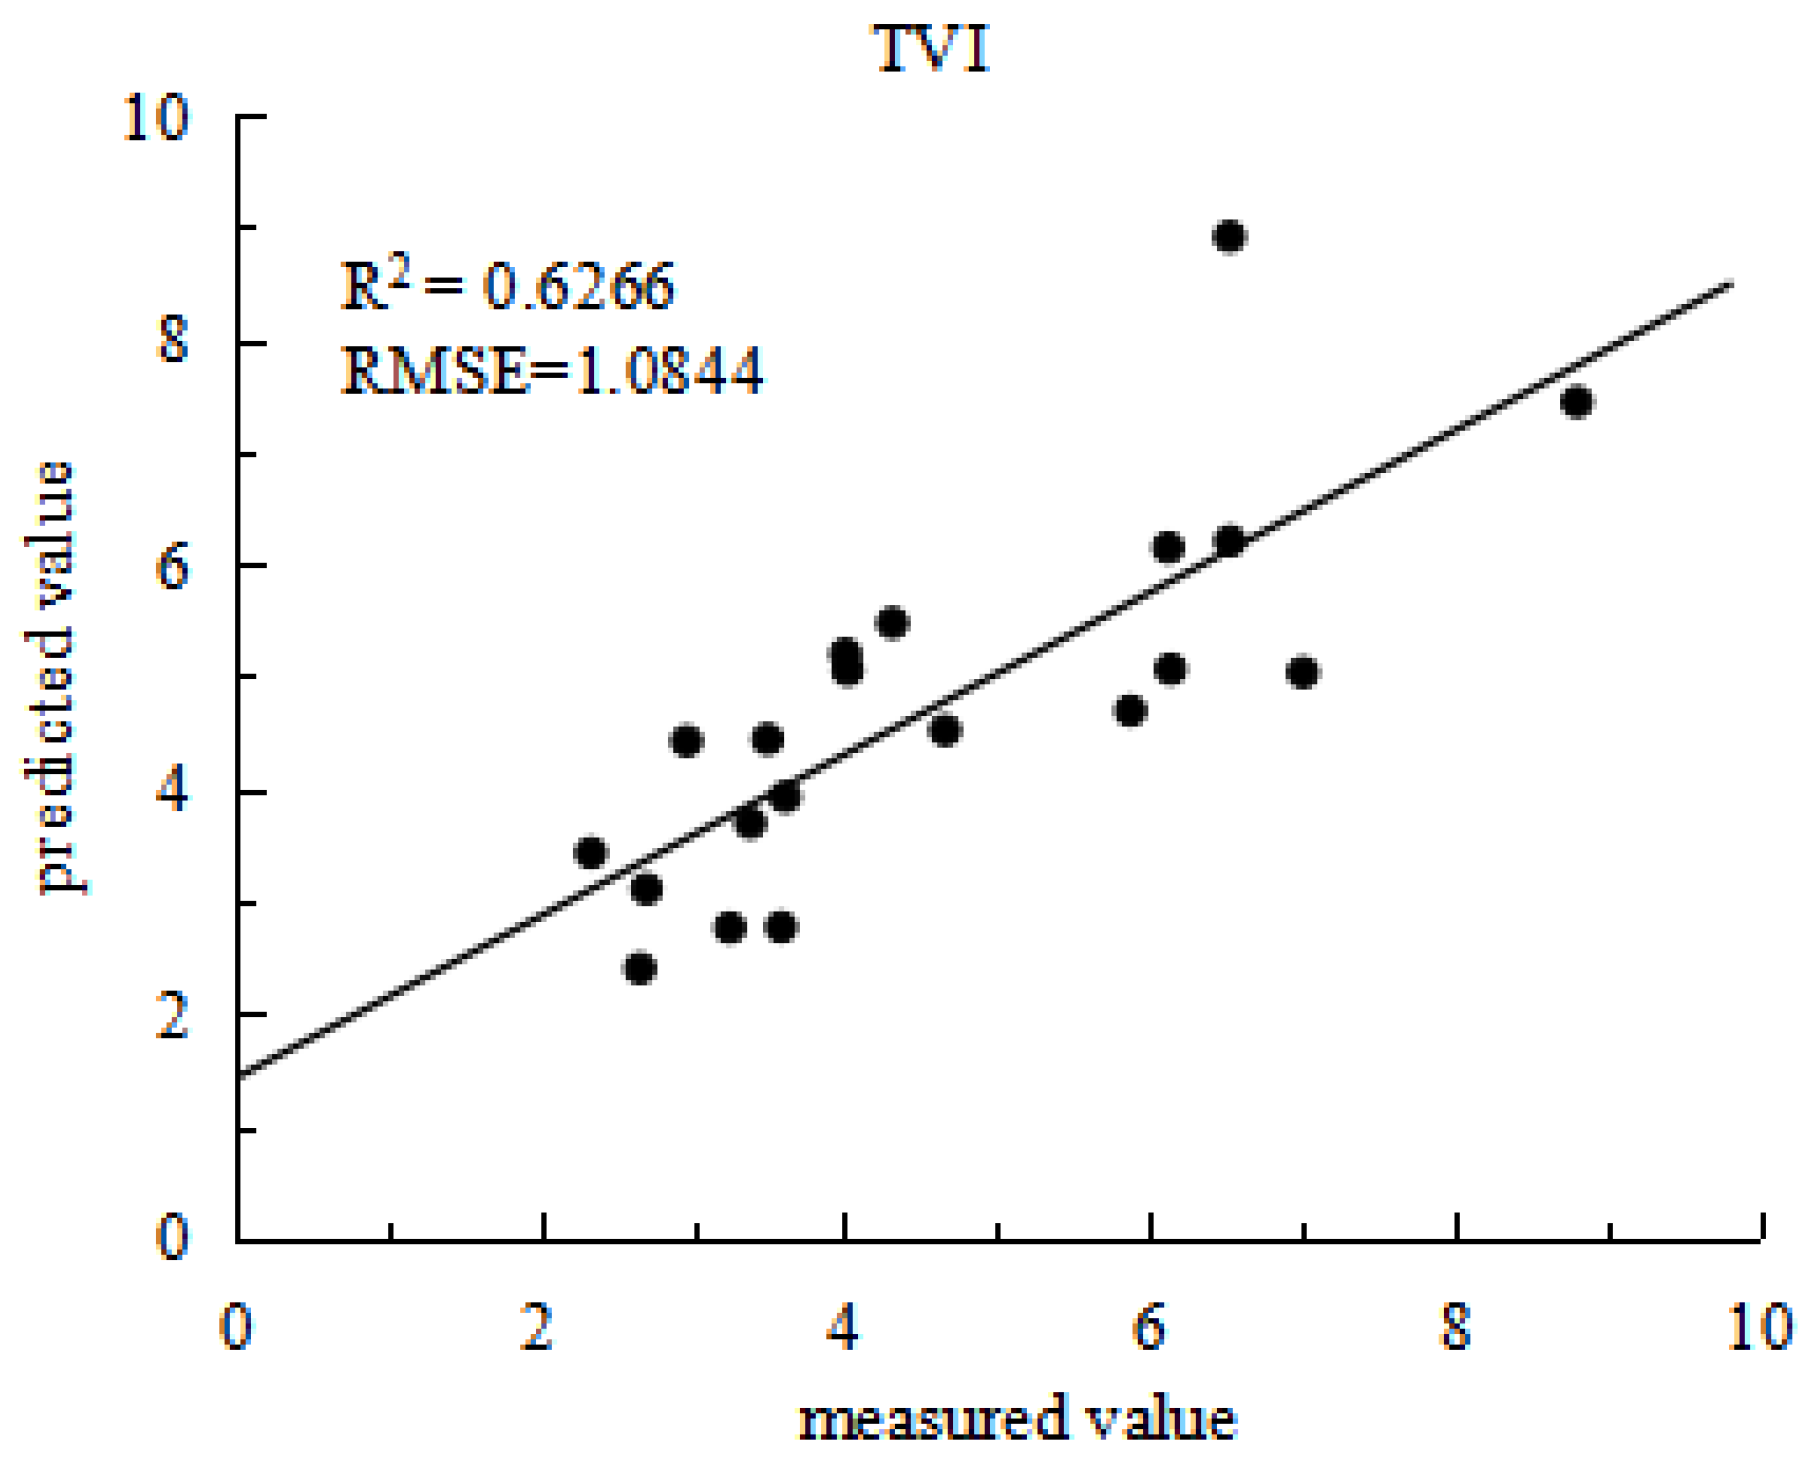
In order to validate the model further, partial data from experiment 2 were used as a validation set, as results shown in
Figure 4. The estimation models constructed using the four vegetation indices demonstrated considerable consistency between predicted and actual values. The VOG2 model achieved an R2 of 0.7178 and an RMSE of 1.0325; the MSAVI model had an R2 of 0.6187 and an RMSE of 1.2459; the DVI model recorded an R2 of 0.6528 and an RMSE of 1.1474; the TVI model showed an R2 of 0.6266 and an RMSE of 1.0844. Among these, the cubic function model based on VOG2 performed the best in estimating grain protein content, exhibiting good fit and high precision. This indicates that using hyperspectral vegetation indices to construct multivariate regression equations for estimating rice nutritional quality indicator is feasible.
3.4. Establishment and Validation of a Rice Nutritional Quality Estimation Model Based on BP Neural Network
The vegetation indices VOG2, MSAVI, DVI, and TVI, which are highly significantly correlated with grain protein content, were used as input layer neurons, and the grain protein content as the output layer neuron. Data from experiment 1 were used to establish the training set, and partial data from experiment 2 (n=20) were used to validate the test set. After multiple adjustments, the optimal number of neurons in the hidden layer was found to be 5, providing relatively good training results. The structure of the constructed BPNN estimation model is 4-5-1. The maximum training iterations were set to 1000, with a minimum training rate of 0.03, and the target error for training the network was set to 0.00001. The BPNN network was trained repeatedly using MATLAB software, with results as shown in
Figure 5. The training dataset achieved an R2 of 0.9516 and an RMSE of 0.3493 (
Figure 5A), and the test dataset achieved an R2 of 0.9619 and an RMSE of 0.2812 (
Figure 5B), indicating that the BPNN estimation model based on vegetation indices is highly accurate, stable, and effective.
3.5. Rice Variety Selection Based on Nutritional Quality Estimation Model
Using the BPNN model based on the four vegetation indices (VOG2, MSAVI, DVI, and TVI), 60 rice varieties from experiment 2 were screened, with a protein content threshold of >7% for selection. A total of 16 high nutritional quality rice varieties were identified, as shown in
Table 4.According to
Table 4, Hua Jing 5 exhibited the highest protein content at 10.25%, significantly higher than the lowest recorded value of 7.01% in Xiang Xue Dao 515. The protein content of the remaining varieties ranged between these two values, with Yan Feng 47 and Xu Dao 3 also demonstrating relatively high protein contents at 9.84% and 9.36%, respectively. This data highlights that Hua Jing 5 contains approximately 31.63% more protein than Xiang Xue Dao 515. In comparison, Yan Feng 47 has 28.56% more protein content than the lowest variety, and Xu Dao 3 has 25.09% more protein.
4. Discussion
4.1. Accuracy of the Estimation Model for Rice Quality
(1) The current study attempted to estimate rice protein contents using hyperspectral information from the rice canopy during the grain filling stage. The results indicate that the estimation model developed using the BP neural network method demonstrates good accuracy and stability, validating the feasibility of this approach. However, rice quality includes many indicators, such as appearance and processing quality. Therefore, further research is needed to determine which quality indicators can be more effectively estimated using hyperspectral information from the rice canopy.
(2) Previous research shows that hyperspectral imaging technology is widely used in rice variety selection, with different rice varieties exhibiting distinct external characteristics such as shape, texture, and color. Image processing techniques can extract these features from images for rice variety selection [
13,
14]. However, most current studies focus on feature extraction from images of rice grains, while studies on variety selection based on spectral information of external rice features (such as stems and leaves) are less common [
15,
16]. This study utilized hyperspectral information from the rice canopy during the grain filling stage and, through the established nutritional quality estimation model, preliminarily screened 60 rice varieties in the experiment, we effectively identified several varieties with high nutritional quality. However, compared to previous studies that selected rice varieties based on spectral information from rice grains, the high-protein rice varieties selected in this study have certain applicability, but their effectiveness requires further validation.
4.2. Comparative Analysis of Estimation Models
(1) Multiple regression analysis for rice quality estimation
A study by Lihong et al. [
7] explored the correlation between vegetation indices and rice quality indicators, resulting in the development of multiple regression models. However, their approach utilized a limited number of vegetation indices. Expanding on their study framework, this study incorporated 13 vegetation indices, enhancing the dataset and enabling the construction of multiple regression models for rice protein content estimation. These models demonstrated improved stability, fit, and accuracy, underscoring the utility of hyperspectral vegetation indices in developing regression equations for rice quality estimation [
17,
18]. This advancement provides a robust foundation for subsequent analyses in rice quality estimation research.
(2) BP neural network analysis for rice quality estimation
Following the methodology of Ruilin et al. [
19], this study employed the BPNN model on MATLAB to construct a rice nutritional quality estimation model. The model was improved by incorporating vegetation indices that exhibited highly significant correlation with quality indicator. The BPNN model, structured as 4-5-1, utilized these indices as input neurons, with rice quality indicators as the output. The results demonstrated that the BPNN model based on vegetation indices achieved high stability and accuracy, facilitating effective high-throughput estimation of rice nutritional quality using field hyperspectral data.
(3) Comparison between multiple regression and BP neural network models
Both multiple regression and BPNN models are suitable for estimating rice quality indicator. However, the BPNN models provide superior stability and high accuracy in estimating rice quality indicators, offering greater precision than multiple regression models. Consequently, BPNN models are recommended as the optimal approach for estimating a variety of rice quality indicators[
3]. On the other hand, multiple regression may inadvertently omit some variables during model construction, potentially leading to the loss of valuable information and resulting in less accurate models compared to BPNN[
4]. This aligns with findings from Baozheng et al. [
20], reinforcing the effectiveness of neural network approaches over traditional regression methods in complex agricultural data analysis.
5. Conclusion
This study developed highly accurate estimation models for rice nutritional quality using field spectral information and employed both multiple regression and BP neural network methods for modeling and inversion. The models were successfully applied to selection of highly nutritious rice varieties, providing valuable decision-making references for UAV remote sensing platforms in estimating rice quality. Despite achieving significant results. The models developed have specific applicability and are limited to certain varieties, making them unsuitable for others. Additionally, the data collected over only two years limits the general applicability of the rice quality estimation models, which needs further enhancement.
References
- Lü Hui, Zhang Zhengzhu, Wang Shengpeng, Qi Li, Lin Maoxian. Analysis and identification of rice quality based on near-infrared spectroscopy technology. Food Industry Science and Technology 2012, 33, 322–325. [Google Scholar]
- Li Ying. Establishment of near-infrared models for rice protein content and QTL analysis of rice protein and amylose content under water and drought conditions; Huazhong Agricultural University, 2006. [Google Scholar]
- Zhang H, Wu J, Luo L, Li Y, Yang H. Comparison of Near-Infrared Spectroscopy Models for Determining Protein and Amylose Contents Between Calibration Samples of Recombinant Inbred Lines and Conventional Varieties of Rice. Agricultural Sciences in China 2007, 6, 941–948. [Google Scholar] [CrossRef]
- Cheng W, Xu Z, Fan S, Zhang P, Xia F, Wang H, Ye Y, Liu B, Wang Q, Wu Y. Effects of Variations in the Chemical Composition of Individual Rice Grains on the Eating Quality of Hybrid Indica Rice Based on Near-Infrared Spectroscopy. Foods 2022, 11, 2634. [Google Scholar] [CrossRef] [PubMed]
- Barnaby J, Huggins T, Lee H, McClung A, Pinson S, Oh M, Pinson G, Tarpley L, Lee K, Kim M, Edwards J. Vis/NIR hyperspectral imaging distinguishes sub-population, production environment, and physicochemical grain properties in rice. Scientific Reports 2020, 10, 9284. [Google Scholar] [CrossRef] [PubMed]
- Zhang Xiao, Yan Yan, Wang Wenhui, Zheng Hengbiao, Yao Xia, Zhu Yan, Cheng Tao. Hyperspectral prediction of rice grain amylose content based on wavelet analysis. Acta Agronomica Sinica 2021, 47, 1563–1580. [Google Scholar]
- Xue Lihong, Cao Weixing, Li Yingxue, Zhou Dongqin, Li Weiguo. Correlation study between rice canopy reflectance spectral characteristics and grain quality indicators. China Rice Science 2004, (05), 57–62. [Google Scholar]
- Peng Xianlong, Wu Wenyu, Dong Qiang, Li Pengfei, Zhu Meirui, Liu Donghui, Liu Zhilei, Yu Cailian. Quality estimation of cold-region rice based on UAV multispectral imagery. Journal of Plant Nutrition and Fertilizers 2024, 30, 12–26, (list continues as formatted above for the remaining references). [Google Scholar]
- Liu H, Bruning B, Garnett T, Berger B. The performances of hyperspectral sensors for proximal sensing of nitrogen levels in wheat. Sensors 2020, 20, 4550. [Google Scholar] [CrossRef] [PubMed]
- Liu L, Dong Y, Huang W, Du X, Ma H. Monitoring Wheat Fusarium Head Blight Using Unmanned Aerial Vehicle Hyperspectral Imagery. Remote Sensing 2020, 12, 3811. [Google Scholar] [CrossRef]
- Hu J, Peng J, Zhou Y, Xu D, Zhao R, Jiang Q, Fu T, Wang F, Shi Z. Quantitative Estimation of Soil Salinity Using UAV-Borne Hyperspectral and Satellite Multispectral Images. Remote Sensing 2019, 11, 736. [Google Scholar] [CrossRef]
- Fu Z, Jiang J, Gao Y, Krienke B, Wang M, Zhong K, Cao Q, Tian Y, Zhu Y, Cao W, Liu X. Wheat growth monitoring and yield estimation based on multi-rotor unmanned aerial vehicle. Remote Sensing 2020, 12, 508. [Google Scholar] [CrossRef]
- Sendin K Williams P, Manley M. Near infrared hyperspectral imaging in quality and safety evaluation of cereals. Critical Reviews In Food Science And Nutrition 2018, 58, 575–590. [Google Scholar] [CrossRef] [PubMed]
- Wang L, Liu D, Pu H, Sun D, Gao W , Xiong, Z. Use of Hyperspectral Imaging to Discriminate the Variety and Quality of Rice. Food Analytical Methods 2015, 8, 515–523. [Google Scholar] [CrossRef]
- Caporaso N, Whitworth M, Fisk I. Near-Infrared spectroscopy and hyperspectral imaging for non-destructive quality assessment of cereal grains. Applied Spectroscopy Reviews 2018, 53, 667–687. [Google Scholar] [CrossRef]
- Sun D, Cen H, Weng H, Wan L, Abdalla A, El-Manawy A, Zhu Y , Zhao N, Fu H, Tang J, Li X, Zheng H,
Shu Q, Liu F, He Y. Using hyperspectral analysis as a potential high throughput phenotyping tool in GWAS for protein content of rice quality. Plant Methods 2019, 15, 54. [Google Scholar] [CrossRef] [PubMed]
- Shi Y, Yuan H, Xiong C, Zhang Q, Jia S, Liu J, Men H. Improving performance: A collaborative strategy for the multi-data fusion of electronic nose and hyperspectral to track the quality difference of rice. Sensors And Actuators B-Chemical 2021, 333, 129546. [Google Scholar] [CrossRef]
- Kang S, Zhang Q , Wei H, Shi Y. An efficient multiscale integrated attention method combined with hyperspectral system to identify the quality of rice with different storage periods and humidity. Computers And Electronics in Agriculture 2023, 23, 108259. [Google Scholar] [CrossRef]
- Sun Ruilin. Study on remote sensing monitoring of wheat leaf rust based on near-ground hyperspectral and UAV imagery. Yangzhou University, 2021. [Google Scholar]
- Chen Baozheng, Cai Deli, An Hongbo. Research progress on remote sensing prediction of grain quality in rice and wheat crops. Journal of Heilongjiang Bayi Agricultural University 2008, (01), 47–49. [Google Scholar]
|
Disclaimer/Publisher’s Note: The statements, opinions and data contained in all publications are solely those of the individual author(s) and contributor(s) and not of MDPI and/or the editor(s). MDPI and/or the editor(s) disclaim responsibility for any injury to people or property resulting from any ideas, methods, instructions or products referred to in the content. |
© 2024 by the authors. Licensee MDPI, Basel, Switzerland. This article is an open access article distributed under the terms and conditions of the Creative Commons Attribution (CC BY) license (http://creativecommons.org/licenses/by/4.0/).
