Preprint
Article

The Entropy of Mixing in Self-Assembly and the Role of Surface Tension in Modeling the Critical Micelle Concentration

Altmetrics

Downloads

59

Views

32

Comments

0

A peer-reviewed article of this preprint also exists.

This version is not peer-reviewed

Submitted:

22 September 2024

Posted:

23 September 2024

You are already at the latest version

Alerts
Abstract
A theory for the micelle formation of nonionic head-tail amphiphiles (detergents) in aqueous solutions is derived based on the traditional molecular thermodynamic modeling approach and a variant of Flory-Huggins theory that goes beyond lattice models. The theory is used to analyze experimental values for the critical micelle concentration of n-alkyl-ß-D-maltosides within a mass action model. To correlate those parts of the micellization free energy, that depend on the transfer of hydrophobic molecule parts into the aqueous phase, with molecular surfaces, known data for the solubility of alkanes in water are reanalyzed. The correct surface tension to be used in connection with the solvent excluded surface of the alky tail is 30 mN/m. This value is smaller than the measured surface tension of a macroscopic alkane-water interface, because the transfer free energy contains a contribution from the incorporation of the alkane or alkyl chain into water representing the change in free volume of the aqueous phase. Flory-Huggins theory works well, if one takes into account the difference in liberation free energy between micelles and monomers, which can be described in terms of the aggregation number as well as the thermal deBroglie wavelength and the free volume of the detergent monomer.
Keywords: 
Subject: Chemistry and Materials Science  -   Physical Chemistry

1. Introduction

The self-assembly in water of amphiphilic molecules (detergents, surfactants) – in particular those with a head-tail architecture like n-alkyl-ß-D-maltosides, where the maltose head (a sugar moiety) is hydrophilic and the alkyl tail is hydrophobic – is a vital process whose understanding bears implications for many research fields such as detergency [1], biochemistry [2,3,4,5], and biophysics [6,7,8,9]. In their seminal paper on the theory of self-assembly of hydrocarbon amphiphiles, Israelachvili et al. [10] quoted the opening paragraph of a review by Parsegian [11]: “Despite enormous progress in understanding the genetics and biochemistry of molecular synthesis we still have only primitive ideas of how linearly synthesized molecules form the multimolecular aggregates that are cellular structures. We assume that the physical forces acting between aggregates of molecules and between individual molecules should explain many of their associative properties; but available physical methods have been inadequate for measuring or computing these forces in solids and liquids.” Israelachvili et al. [10] continue by discussing the burden of linking physical concepts like force and free energy to observable properties of condensed matter and conclude their own opening paragraph by stating: “To be convincing, and to have any hope whatever of reducing to some semblance of order the vast complexity of those intricate multimolecular structures that are the subject of biology, any successful theories of self-assembly must have as a minimal requirement extreme simplicity to make them accessible to the biologist who has enough concerns of his own not to be dragged into the subtleties of modern physics” (italics by the present author). Some 50 years later, we face similar problems. It seems even that in the area of life science, the ratio of scientific studies requiring simplicity as regards self-assembly to those dwelling on the subtleties of modern physics (e. g., statistical physics [12]) has increased.
The focus of our own research in this context [13,14,15,16] is on understanding the self-assembly of mild, nonionic detergents such as alkyl maltosides in the context of isolating membrane protein complexes from the native membrane [17], keeping them in aqueous solution as detergent-protein complex (PDC) [8,18,19], and ultimately crystallizing them for structural characterization [6,17,19,20]. Building on the traditional molecular thermodynamic modeling (TMT) approach [10,21,22,23,24,25,26], we searched for a formula that links the critical micelle concentration (CMC) – a characteristic measurable quantity indicating the minimal detergent concentration required for the formation of globular detergent aggregates, termed micelles [27] – to a sum of contributions to the free energy change associated with this self-assembly. In the spirit of the simplicity alluded to above, the TMT approach seeks to explain each part of the sum in terms of molecular properties and comprehensible physical models. Our hope is that such a model, which in the first instance describes only the detergent, can ultimately be incorporated into a model for a more complex system containing, e. g., membrane proteins, vesicles etc. and serve as a prototype for modeling the formation of other types of aggregates such as the detergent belt surrounding a membrane protein in a PDC in aqueous solution [8,13].
A problem is here that in a biochemical context, the self-assembly of the detergent takes place in an aqueous medium that is not pure water, but contains a number of ingredients such as buffer and salt. Since the majority of models build within the TMT approach refers to pure water, the question arises of how to incorporate the “salt effects” in a sufficiently simple way into the model. An example of an answer to this question is the work by Carale et al. [26]. As shown below in Section 2.2., there are two contributions to the micellization free energy, termed g t r  and g i n t , that are related to the contact of hydrophobic molecular surfaces with water. One term, g t r , refers to the transfer of the alkyl tail of the detergent monomer into the micelle interior and is modeled on the basis of transfer free energies of alkanes into water. According to Carale et al. [26], salt effects may be modeled by using instead transfer free energies of alkanes into aqueous salt solutions. The second term, g i n t , referring to the formation of an interface between the hydrophobic interior of the micelle and the surrounding water (partially shielded by the detergent head groups), is modeled by considering the interfacial area of the micellar core and an interfacial tension believed to be identical with the measurable interfacial tension of a macroscopic alkane-water interface [21]. The solution to the problem of salt effects by Carale et al. [26] in this context is to use measured interfacial tensions of alkane-aqueous electrolyte interfaces [28].
Motivated by the idea that cosolute effects on micelle formation might be incorporated into the theory by simply changing the surface tension, we recast g t r in terms of the molecular surface of the alkyl tail and proposed to lump it together with g i n t [14]. Since data on the interfacial tension of alkanes and buffer solutions are generally not available, Bothe et al. [15] devised a fitting procedure, in which experimental CMC data of a series of detergents with the same head group but alkyl tails of different length were combined with molecular properties of the detergents to yield the remaining contributions to the micellization free energy. The surface tension σ describing the change in interaction between hydrophobic molecular surfaces of the detergent and the aqueous phase upon micelle formation could then be obtained from the slope value of a linear regression. The resulting value of σ 30 mN/m [15] was significantly smaller than the macroscopic value of σ 50 mN/m [14,21,28]. This discrepancy cannot be traced back to the buffer ingredients. Rather, it is related to an old problem that surface tensions associated with molecular surfaces (“microscopic” surface tensions) are found to be smaller than their measurable “macroscopic” counterparts [29,30].
Some 30 years ago, in their 1991 paper in Science, Sharp et al. [31] suggested that the discrepancy between “microscopic” and “macroscopic” surface tensions is due to the neglect of molecular volume differences between solute and solvent. It is at this stage, where the entropy of mixing comes into play. In the ideal-mixing models usually employed, the entropy of mixing for a simple solution consisting of the solvent (1) and one solute (2) has the form Δ S = k B N 1 ln X 1 + N 2 ln X 2 , where N i  and X i are, respectively, the particle number and mole fraction of species i  ( i = 1,2 ). The simplest way to take into account volume differences between molecular species is to use the theory developed by Flory and Huggins for polymer solutions based on lattice models [12,32,33,34]. According to this theory, one has to replace the mole fractions X i in the above equation for the entropy of mixing by volume fractions Y i (see below, Eq. (10)). As we shall discuss in detail in the present paper (and as is actually known since 1947 [35]), the same result can be obtained under appropriate approximations without invoking lattice models. Accordingly, Bothe et al. [15] speculated that their finding of a small surface tension value could be an artifact of the used ideal-mixing model.
The goal of the present paper is to clarify this issue by developing a Flory-Huggins type of theory for describing the CMC in combination with the TMT approach and - related to the latter – reanalyzing the solubility of alkanes in water in terms of surface tensions. As it turns out, the “microscopic” surface tensions are correct, which bears implications not only for modeling micellization, but also for understanding hydrophobic solvation in aqueous media of complex composition in general. A key aspect is that Sharp et al. [31] used a modified version of Flory-Huggins theory that was debated [36]. Here, we attempt an interpretation of this theory and try to explain, why it does not work in modeling micelle formation. In this respect, it was helpful to connect the theory to the concept of the pseudo-chemical potential (PCP) introduced by Ben-Naim [37,38]. This connection revealed a deeper problem in the modeling of micellization that is related to the treatment of kinetic energy in statistical mechanics.
The present paper necessarily deals with some of the subtleties of physics. To make these easier accessible, the paper contains a lot of explanations of theoretical concepts and partly has the character of a review. We hope that this is to the benefit of the reader who wants to understand the theory.

2. Theory

2.1. Free Energy of the Micellar Solution and the Entropy of Mixing

2.1.1. Definiton of the Free Energy and a Model for the Entropy of Mixing

To start with, we follow traditions and decompose the Gibbs free energy G of the micellar solution according to
G = G f + G m i x + G i n t ,
where G f is often referred to as the free energy of formation and contains the reference chemical potentials μ i * and the particle numbers N i of all chemical species in the solution:
G f = N W μ W * + ν 1 N ν ν μ ν * + α N α μ α * .
Here, the indices W , ν , and α stand, respectively, for the solvent water, detergent micelles with aggregation number ν (including monomers, for which ν = 1 ), and cosolutes (e. g., salt, buffer). We use the term “reference chemical potential” and the notation with an asterisk to distinguish μ i * from other standard chemical potentials to be discussed below in Section 2.1.3. In the context of Eq. (2), μ W * represents a Raoult´s law standard state [39,40] (i. e. pure water), while for all the solutes, μ i * represents a Henry´s law standard state [39,40] (i. e. infinite dilution in pure water). It is easy to see that the total number of detergent molecules in the solution is N d e t = ν ν N ν , if one takes into account that N ν is the number of micelles that contain ν detergent molecules. Accordingly, we have to distinguish two different ways of balancing the particle numbers:
N t o t = N W + N d e t + α N α ,
N ¯ = N W + ν N ν + α N α .
In eq. (3), all individual molecules are counted, whereas in eq. (4), a micelle counts as one particle. Mole fractions will be defined as X i = N i / N t o t for all species except the detergent, for which we set X ν = ν N ν / N t o t .
To keep the theoretical treatment as simple as possible, we consider only diluted detergent solutions (i. e. with detergent concentrations around the CMC), so that no interactions between detergent molecules except micelle formation need to be taken into account. Note that this excludes micelle-micelle interactions and thus puts limits to the applicability of the model. In contrast, we will consider interactions (other than aggregation) between detergent and cosolutes as well as between cosolutes by using a mean-field model of the Bragg-Williams type adapted to Flory-Huggins theory for the free energy of interaction [12]:
G i n t = β 1 α , ν J α ν Y α Y ν + α , α ´ J α α ´ Y α Y α ´ .
Here, J α ν and J α α ´ are coupling constants (also called exchange or mixing parameters), Y i is the volume fraction of species i , and β = k B T 1 ( k B and T are, respectively, the Boltzmann constant and the absolute temperature.) The factor 1/2 used to avoid double counting of interactions in the second sum in eq. (5) is absorbed into the constant J α α ´ . Note that solute-solvent interactions are covered by the reference chemical potentials μ i * of the solutes.
The free energy of mixing G m i x is related to the entropy of mixing S m i x by G m i x = T S m i x . Motivated by the work of Hildebrand [35], we will use a model of S m i x that takes into account molecular volume effects. To illustrate the basic idea, let us consider a gas with a van-der-Waals type equation of state, where only the excluded volume parameter b matters, but the attractive interaction parameter a is set to zero. Then, the entropy change for an isothermal expansion of the gas from a volume V 1 to a volume V 2 is given by
Δ S = k B ln V 2 b V 1 b .
Apparently, it is the difference V b that determines the entropy change. For further interpretation and to avoid confusion, we have to discuss the meaning of the parameter b . It is sometimes interpreted as the excluded volume (i. e. the volume around the center of mass (COM) of one molecule, into which the COM of another molecule cannot enter), which is different from the actual volume of a molecule, but often b is just an adjustable parameter. In the treatment by Hildebrand [35], it is the actual volume of a molecule (or one mole of molecules), so that the difference V b is the free volume (i. e. the empty space not occupied by molecules). Since we are talking here about the entropy related to the translational motion of molecules, it seems to make sense that the entropy is related to the free volume (cf. discussion in Section 4). In the following, we will denote by b i the actual volume of one molecule of species i , so that the free volume in a gas with N i such molecules is V N i b i .
With this preparation in mind, we now look at a binary liquid mixture. To obtain the entropy of mixing, we consider the transfer of N 1 molecules of type 1 and N 2 molecules of type 2 with molecular volumes b 1 and b 2 , respectively, from the pure state, where they occupy the respective volumes v 1 and v 2 , to a solution with total particle number N 1 + N 2 . Note that v i b i , since v i is not the volume of a molecule, but the volume occupied per molecule in the pure substance under given conditions of pressure P and temperature T . We can assume with easy conscience that v i > b i . Since the molecules under consideration are in general polyatomic, they have internal degrees of freedom (DOFs) due to vibrations, rotations, and librations. An important simplification suggested by Hildebrand [35] is to assume that the energy in these internal DOFs is not significantly different in the pure state and in the solution, so that the contribution of the internal DOFs to the entropy change can be neglected. Under these conditions, the entropy of mixing is obtained by considering for each component the expansion (or possibly compression) from its free volume N i ( v i b i ) in the pure state to its free volume V N 1 b 1 N 2 b 2 in the mixture, where V is the actual volume of the solution:
Δ S k B = N 1 ln V N 1 b 1 N 2 b 2 N 1 ( v 1 b 1 ) + N 2 ln V N 1 b 1 N 2 b 2 N 2 ( v 2 b 2 ) .
This equation can also be derived from statistical mechanics (Appendix A), albeit with some roughness in the spatial integration to be discussed in Section 4.
At this stage, it is still possible that due to interactions with molecules of different types, the volume occupied by one molecule in the mixture is different from the volume it occupies in the pure phase, i. e. there is an excess volume. An important further simplification is the assumption that the solution is additive, i.e. excess volumes are neglected and the volume of the mixture can be written simply as V = N 1 v 1 + N 2 v 2 . Then, the entropy of mixing becomes
Δ S k B = N 1 ln N 1 ω 1 + N 2 ω 2 N 1 ω 1 + N 2 ln N 1 ω 1 + N 2 ω 2 N 2 ω 2 ,
where we introduced the abbreviation ω i = v i b i .
We would like to link the free volumes to more handy quantities like the mole fraction X i and the volume fraction Y i . To this end, we make another simplifying assumption discussed by Hildebrand [35]: We assume that ω i is proportional to b i with a species-independent proportionality constant ς , i. e. ω i = ς b i . Then, v i = ς + 1 b i is also proportional to b i and
N 1 ω 1 N 1 ω 1 + N 2 ω 2 = N 1 ς b 1 N 1 ς b 1 + N 2 ς b 2 = N 1 ς + 1 b 1 N 1 ς + 1 b 1 + N 2 ς + 1 b 2 = N 1 v 1 N 1 v 1 + N 2 v 2 = N 1 v 1 V = Y 1 ,
so that
Δ S = k B N 1 ln Y 1 + N 2 ln Y 2 .
Thus, we can express the entropy of mixing in a very simple way in terms of particle numbers and volume fractions. This result has been obtained by Flory and Huggins based on a lattice model [32,33,34]. In Appendix B, we show a variant of such a lattice model along the lines of Hill´s treatment of Flory-Huggins theory [12] and adapted to the problem of micelle formation. We found it useful to recall that the same result can be obtained without a lattice model based on Hildebrand´s considerations [35] and in a somewhat more general framework.
Turning back to our micellar solution, we now have for the free energy of mixing:
G m i x = β 1 N W ln Y W + ν N ν ln Y ν + α N α ln Y α .

2.1.2. The Micellar Size Distribution

We apply the method of minimizing the Gibbs free energy to derive the micellar size distribution. To this end, we minimize G in Eq. (1) with respect to a variation of the numbers N ν under the constraint that the number N d e t = ν ν N ν defined above is constant. The result is
λ = 1 ν G N ν T , P , N W , N α , N ν ´ ,
where λ is to be identified with the chemical potential μ 1 of detergent monomers in the solution. The evaluation of the partial derivative in Eq. (12) is detailed in the Supplementary Material (SM, S1). Comparing the case of general ν with the case ν = 1 , we obtain from Eq. (12):
β ν μ ν * μ 1 * = ln X ν ν X 1 ν + ln c t o t v ν c t o t v 1 ν + 1 ν + 1 V α Y α v ν J α ν ν v 1 J α 1 N ¯ + L V v ν ν v 1 .
Here, we introduced the total molarity c t o t of the solution and the molar volume v i = N A v i with N A being Avogadro´s number. The quantity L contains detergent-cosolute as well as cosolute-cosolute interactions and is defined in Eq. (S7). The first term on the right-hand side (rhs) of Eq. (13) can be interpreted as the logarithm of the equilibrium constant K ν = X ν / ν X 1 ν for the formation of a micelle D ν from ν monomers D according to
ν D D ν .
Note that X ν / ν is the mole fraction of micelles of size ν . The use of K ν implies a mass action law, but since we allow for various numbers ν , we are working with a multi-equilibrium model in the present stage of the development.
The second term on the rhs of Eq. (13) originates from the fact that we describe the free energy of mixing in terms of volume fractions rather than mole fractions, where the latter approach would represent an ideal-mixing model. It is possible to formulate the mass action law in terms of volume fractions with the equilibrium constant
K ν = Y ν Y 1 ν = N ν v ν V ν V N 1 v 1 ν = c t o t N A N ν v ν N t o t ν N t o t c t o t N A N 1 v 1 ν = X ν c t o t v ν ν X 1 ν c t o t v 1 ν = K ν c t o t v 1 1 ν ,
so that the first and second term on the rhs of Eq. (13) together can be interpreted as the logarithm of K ν . Another variant often employed is to write the mass action law in terms of molarities yielding yet another equilibrium constant:
K ν = D ν D ν = N ν / N A V N 1 / N A V ν = N t o t X ν / ν N t o t X 1 ν N A V ν N A V = K ν c t o t 1 ν .
It has recently been suggested that equilibrium constants should always be formulated with dimensionless quantities [41] to avoid problems with units such as the factor c t o t 1 ν in Eq. (16). However, as is obvious from Eq. (15), not all equilibrium constants formulated with dimensionless quantities are equivalent.
The term 1 ν also originates from the use of volume fractions in G m i x (more about this in Section 2.1.3.), while the fourth term on the rhs of Eq. (13) is the molecular-volume weighted difference between micelle-cosolute and monomer-cosolute interactions. The last term follows from parts of G m i x and G i n t and contains the difference v ν ν v 1 between the volumes occupied by a micelle and ν monomers. This difference deserves a comment: The concept of an additive solution implies that the volume occupied by a species in solution is the same it occupies in a hypothetical pure solute phase. Since micelles and monomers are treated as different species, it is still possible that v ν ν v 1 . In fact, there is evidence from density measurements that a micelle of size ν occupies a different volume in aqueous solution as ν monomers together. However, to arrive at Flory-Huggins theory, we had to make the additional assumption that the volume occupied by a molecule is proportional to its molecular volume, where the proportionality constant ς + 1  is the same for all species (see above). Thus,
v ν = ς + 1 b ν = ς + 1 ν b 1 = ν v 1 .
and we have to conclude that v ν ν v 1 = 0 in Flory-Huggins theory. Clearly, this conclusion follows necessarily from a lattice model (cf. Appendix B), but it also follows rather directly from Hildebrand´s considerations [35] in a more general “lattice-free” context. Note that the implication is that the slight density difference of a detergent solution above and below the CMC cannot be accounted for in Flory-Huggins theory.
Taking into account Eq. (17), Eq. (13) simplifies to
ν g ν * = ln X ν ν X 1 ν + ln c t o t v ν c t o t v 1 ν + 1 ν + α Y α j α ν ,
where we have introduced the abbreviations g ν * = β μ ν * μ 1 * and
j α ν = ν v 1 V J α ν J α 1 .
Eq. (18) can be rearranged to give the micellar size distribution:
X ν = X 1 ν c t o t v 1 ν 1 exp ν g ν * + 1 ν + α Y α j α ν ,
where we assumed v ν = ν v 1 based on Eq. (17) and v i = N A v i . This distribution function differs from the one obtained with an ideal-mixing model by the pre-exponential factor c t o t v 1 ν 1 (which is actually ν c t o t v 1 ν 1 canceling out the factor ν in the ideal-mixing model) and the term 1 ν in the exponent. The last term in the exponent would also occur in an ideal-mixing model, but would be formulated in terms of X α rather than Y α .

2.1.3. Reference States and Standard States

In our model, the chemical potential of a detergent molecule in a micelle is (cf. Eq. (12) and )
μ ν = 1 ν G N ν T , P , N W , N α , N ν ´ = μ ν * + β ν 1 ln X ν ν + ln c t o t v ν + 1 N ¯ v ν V + v ν V α J α ν Y α L .
If we have no cosolutes, this reduces to
μ ν = μ ν * + β ν 1 ln X ν ν + ln c t o t v ν + 1 N ¯ v ν V .
Here, μ ν * refers to a reference state of a micelle at infinite dilution in water. Thus, μ ν * contains detergent-detergent interactions within the micelle as well as interactions of the micelle with water. (For ν = 1 , it contains only the interaction of the detergent monomer with water.) This Henry´s law standard state, in which the properties of an infinitely diluted system are extrapolated to X ν = 1 [39,40], is somewhat fictitious. However, Phillips had the nice idea to envisage such a state as a hypothetical pure phase of micelle hydrates [42]. Since we do not allow for micelle-micelle interactions, the hypothetical pure phase, albeit condensed, consists of non-interacting micelle hydrates. Such a reference state is useful in computations, as it allows to model μ ν * (or μ ν * μ 1 * , which is needed in Eq. (20)) on the basis of a single micelle in water. Besides the internal DOFs of the detergent molecules, detergent-detergent interactions within the micelle and interactions of the micelle with its hydration shell (including possibly water molecules penetrating the micelle) belong to the internal DOFs of the micelle hydrate. These internal DOFs are assumed to remain unaffected by putting the micelle into the solution, which facilitates the modeling and is the basis for the Flory-Huggins theory of G m i x in Eq. (11).
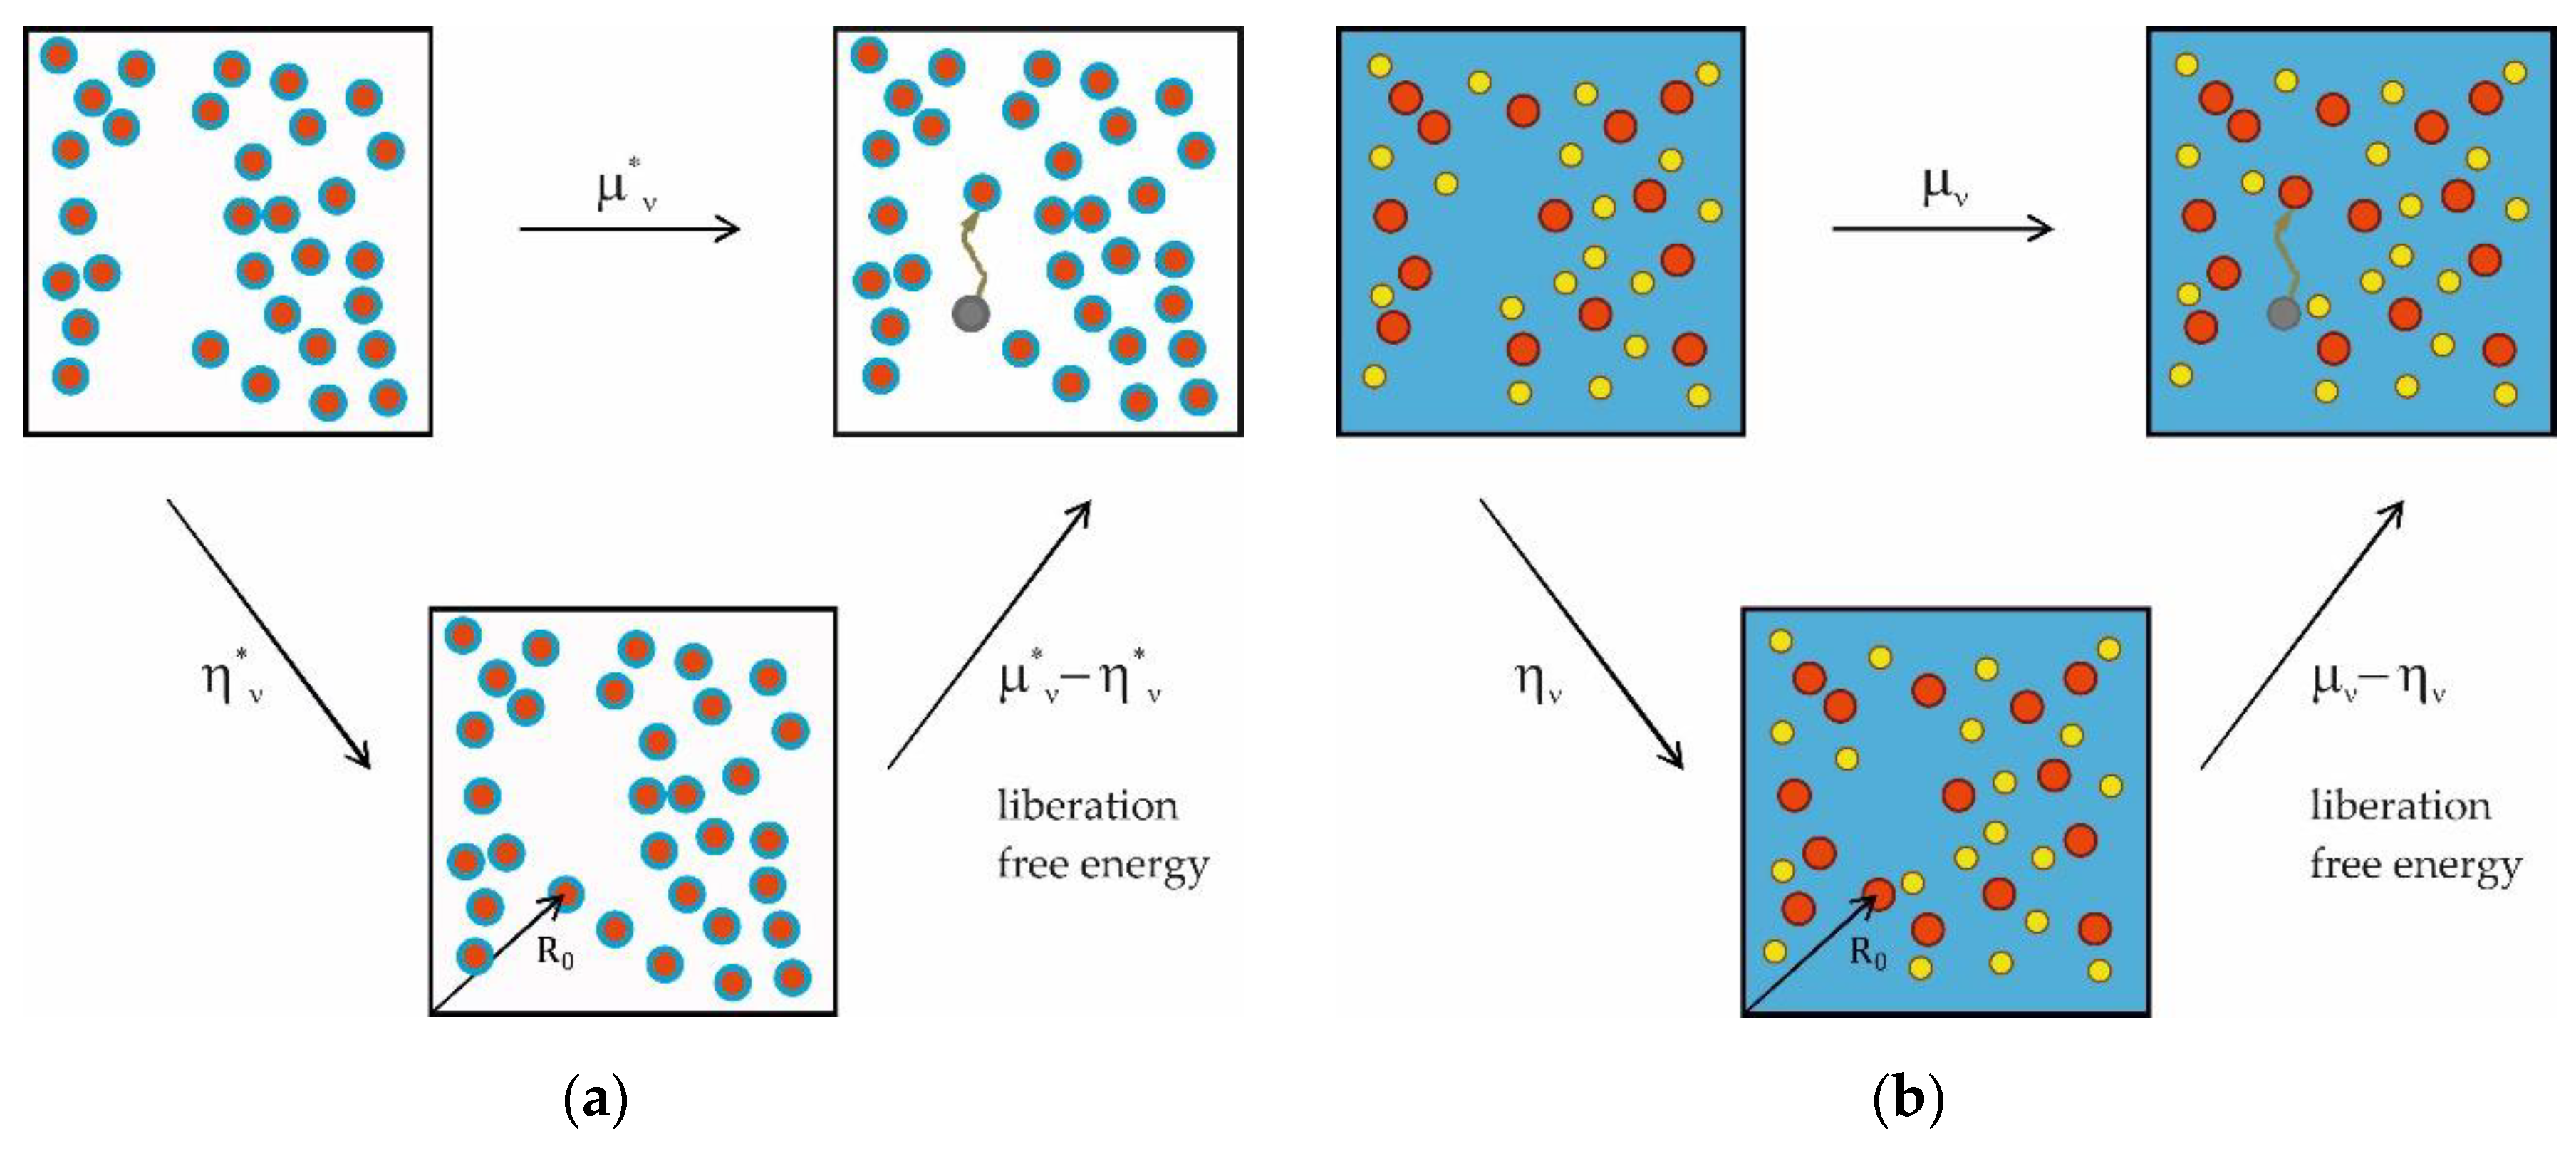
A physically appealing view has been provided by Ben-Naim [37,38], who introduced the PCP (Appendix C). It is worthwhile to consider this concept, as it sheds light on the mysterious term 1 N ¯ v ν / V in Eq. (22) (and other aspects; see below). The easiest way to envisage the chemical potential μ is to view it as the free energy difference between an N + 1 - and an N -particle system as done in Eq. (C1). The PCP η (as defined in Appendix C) is then obtained by adding the N + 1 th particle at a fixed position (which is arbitrary and denoted by the position vector R 0 in Figure 1; Eq. (C2)). The only free energy change that can be caused in this way by a non-interacting particle with no internal DOFs is due to a decrease of the free volume. This is the essential proposition made by Eq. (C8), where the pseudo-chemical potential is defined by a partial differentiation. The difference μ η is referred to as the liberation free energy and has three independent contributions due to removing the constraint of a fixed position from the added particle, originating from the particle´s kinetic energy, its expansion into the free volume and its indistinguishability from the other particles of the same type (Appendix C).
If we assume that the solution is additive and the volume occupied by a molecule is proportional to its actual volume (cf. Section 2.1.1.), we see that the term 1 N ¯ v ν / V corresponds to the difference Δ η ν = η ν η ν * of the micelle´s PCP between the solution and the pure hydrate phase (times β ; Appendix C). Note that Δ η ν does not contain contributions from the internal DOFs of the micelle hydrate, which is ultimately a consequence of the Flory-Huggins approach to the entropy of mixing. Then, Eq. (22) becomes
μ ν = μ ν * + ν 1 β 1 ln Y ν + Δ η ν .
We are now able to explain the term 1 ν occurring in the micellar size distribution in Eq. (20). It arises from the difference
β Δ η ν ν Δ η 1 = 1 N ¯ v ν V ν 1 N ¯ v 1 V = 1 N ¯ ν v 1 V ν 1 N ¯ v 1 V = 1 ν ,
has its origins in the finite molecular volumes, and vanishes in ideal-mixing models that neglect these volumes.
So far, we have defined the PCP η i only for featureless non-interacting particles. If we include particle-particle interactions and internal DOFs, we arrive at Eq. (D1) for the PCP, which is now termed μ ~ i in accordance with Ben-Naim [37] (Appendix D). The decomposition of the Gibbs free energy of the solution according to Eq. (1) and the use of Flory-Huggins theory for G m i x implies that we split any solute-solute interaction into a hard-core part, which makes its contribution to G m i x and yields the form of η i found for non-interacting particles with finite volume (SM S3), and a remaining part described approximately by G i n t . The solute-water interactions can be considered as being part of μ ~ i according to Eq. (D1), but we do not specify here the form of the potential energy B i of this interaction.
The next question is: How is μ ~ i related to μ i * ? By definition, μ ~ i does not contain the liberation free energy. We have to find out, where in G (Eq. (1)) the three contributions to the liberation free energy (see above and in Appendix C) occur. Certainly, they are not contained in G i n t . In G m i x , we subtract the hard-core part of the free energy of the pure solutes from that of the mixture. This merely accounts for the change of the free-volume contribution to the liberation free energy due to mixing. Hence, the pure-substance free-volume contribution and the other contributions to the liberation free energy are contained in G f . So, we have:
μ i * = μ ~ i * + β 1 ln N i Λ i 3 N i ω i ,
where the asterisk in μ ~ i * reminds us that it refers to the limit of infinite dilution in pure water. In Eq. (25), the three contributions to liberation are Λ i 3 (kinetic energy), N i (indistinguishability), and N i ω i (free volume). This choice of the reference chemical potential is ultimately dictated by the use of G m i x in Eq. (1), which is based on the free energy difference between the solution and the pure components (Appendix A). Note that the term Δ η ν in Eq. (23) serves to remove the pure-substance free-volume contribution to the PCP and add the appropriate free-volume contribution of the mixture. However, in the micellization free energy, which is the difference between micelles and monomers, the mixture contributions cancel out according to Eq. (24), which is a consequence of the approximations necessary to arrive at Flory-Huggins theory (specifically, Eq. (17)).
For micelles, Eq. (25) has to be modified slightly, because we defined the reference chemical potential by ν μ ν * (cf. Eq. (2)), so that
ν μ ν * = μ ~ ν * + β 1 ln Λ ν 3 ω ν .
Here, μ ~ ν * , Λ ν , and ω ν refer to a whole micelle, whereas μ ν * is the reference chemical potential of one detergent molecule in the micelle. Eq. (26) is illustrated in Figure 1a, if one replaces μ ν * and η ν * by ν μ ν * and μ ~ ν * , respectively.
In the presence of cosolutes, we may define the standard chemical potential  μ ν 0 by
μ ν 0 = μ ν * + v ν β ν V α J α ν Y α L = μ ν * + v 1 β V α J α ν Y α L .
It is then possible to write Eq. (21) in the simple form
μ ν = μ ν 0 + ν 1 β 1 ln Y ν + Δ η ν .
The standard state described by μ ν 0 corresponds to an infinite dilution in the aqueous medium containing all cosolutes α . With the abbreviation g ν 0 = β μ ν 0 μ 1 0 , we can write the micellar size distribution as
Y ν = Y 1 ν e ν 1 e ν g ν 0 .
The advantage of using this standard state is that the effects of the cosolutes on the micellization equilibria in Eq. (14) can be described by a shift of the equilibrium constants K ν . Let K ν * be the equilibrium constant in the absence of cosolutes (i. e in pure water). Then,
K ν K ν * = e ν g ν 0 g ν * = exp α Y α j α ν .
It is possible to consider the detergent-cosolute interactions as part of the PCP (cf. Appendix D), which we denote as μ ~ ν 0 to distinguish it from μ ~ ν * . Then, μ ν 0 can be related to μ ~ ν 0 via
ν μ ν 0 = μ ~ ν 0 + β 1 ln Λ ν 3 ω ν
in analogy to Eq. (26). Next, we compute the difference
ν μ ν 0 ν μ 1 0 = μ ~ ν 0 ν μ ~ 1 0 + β 1 ln Λ ν 3 ω 1 ν Λ 1 3 ν ω ν ,
which is required for the micellization free energy. By definition, the thermal deBroglie wavelength is given by Λ i = h / 2 π m i k B T , where m i is the mass of particle i . Neglecting the penetration of water or cosolutes into the micelle, we have m ν = ν m 1 and thus Λ ν = Λ 1 / ν (at constant T ). With ω ν = ς b ν = ς ν b 1 = ν ω 1 , we obtain
ν g ν 0 = β μ ~ ν 0 ν μ ~ 1 0 5 2 ln ν ν 1 ln Λ 1 3 ω 1 .
Eq. (33) states that the micellization free energy can be written as the PCP difference plus terms describing the liberation free energy difference between the micelle and ν monomers. Here, the problem arises that it is not clear, how the change in liberation free energy is accounted for in the traditional modeling of the micellization free energy (see below).

2.2. Mass Action Model and Molecular Thermodynamic Modeling

2.2.1. Mass Action Model and Definition of the Critical Micelle Concentration

When we talk about a mass action model, we mean that we allow only for one type of micelle with a fixed aggregation number m . This implies that we neglect the polydispersity of the micelles, and ν 1 , m . At this stage, it is useful to introduce the abbreviations x = y + z , y = X 1 , z = X m , and c = c t o t v 1 e , where e is Euler´s number. Then, the mass balance of detergent reads
x = y + y m c m 1 e m g m 0 .
Here, the factor c m 1 (actually m c m 1 with m cancelling) comprises all corrections to an ideal-mixing model that are due to the consideration of finite molecular volumes (except those contained in g m 0 originating from G i n t ).
According to Bothe et al. [15], the CMC can be defined by
d 3 y d x 3 x = X C M C = 0 ,
where X C M C is the total detergent mole fraction at the CMC, while the CMC in molarity units is given by C M C = c t o t X C M C . If X C M C is mall (i. e. CMC < 30 mM) and x remains in the vicinity of X C M C (i. e. c t o t X C M C < 50 mM), then c t o t (which is in the order of 55 M) will not change much and can be considered as constant. Then, c is a constant, too. The exponent in Eq. (34) must not depend on x , as g m 0 refers to a standard state at infinite dilution. This is strictly true for g m * . However, g m 0 depends on Y α based on the definition of μ ν 0 in Eq. (27). One may wonder, whether this connection leads to an indirect dependence of g m 0 on x . Since the volume fractions sum up to unity, they are not all independent. If we choose the volume fraction of water as the dependent variable, all solute volume fractions are independent of each other and Y α does not depend directly on x . It may still depend indirectly on x via c t o t , but with constant c t o t , Y α is a constant, too. So the exponent in Eq. (34) does neither depend on x nor on y . Corresponding difficulties discussed recently [16] are artifacts of the ideal-mixing model and the used form of G i n t .
Under the condition that the exponent is a constant as regards derivatives with respect to x and y , it has been shown by Bothe et al. [15], that Eq. (35) is equivalent to the condition
3 d 2 z d y 2 2 = 1 + d z d y d 3 z d y 3 .
From this condition, the ratio y / x = 2 m 2 m / 2 m 2 2 at the CMC follows (which is the same as found by Bothe et al. for the ideal-mixing model [15]), and the relationship between g m 0 and X C M C can be determined to be
g m 0 = m 1 m ln c X C M C + τ m
with
τ m = 1 m ln 2 m 2 m m m 2 2 m 2 2 m 1 .
Note that τ m is different from the corresponding term obtained by Bothe et al. [15], which is τ ´ m = τ m + m 1 ln m . The various factors and terms depending on m are plotted in Figure S3. For m > 50 , the prefactor ( m 1 ) / m is close to unity and can be neglected, while τ m < 0.085 – albeit clearly smaller than τ ´ m – is not necessarily negligible. We then obtain
Y C M C = v 1 C M C = e g m 0 τ m + 1 ,
where Y C M C is the total volume fraction of detergent at the CMC. Alternatively, one may compute g m 0 from experimentally determined CMC values according to
g m 0 = ln v 1 C M C + τ m + 1 .

2.2.2. Thermodynamic Cycle Approach and Molecular Thermodynamic Modeling

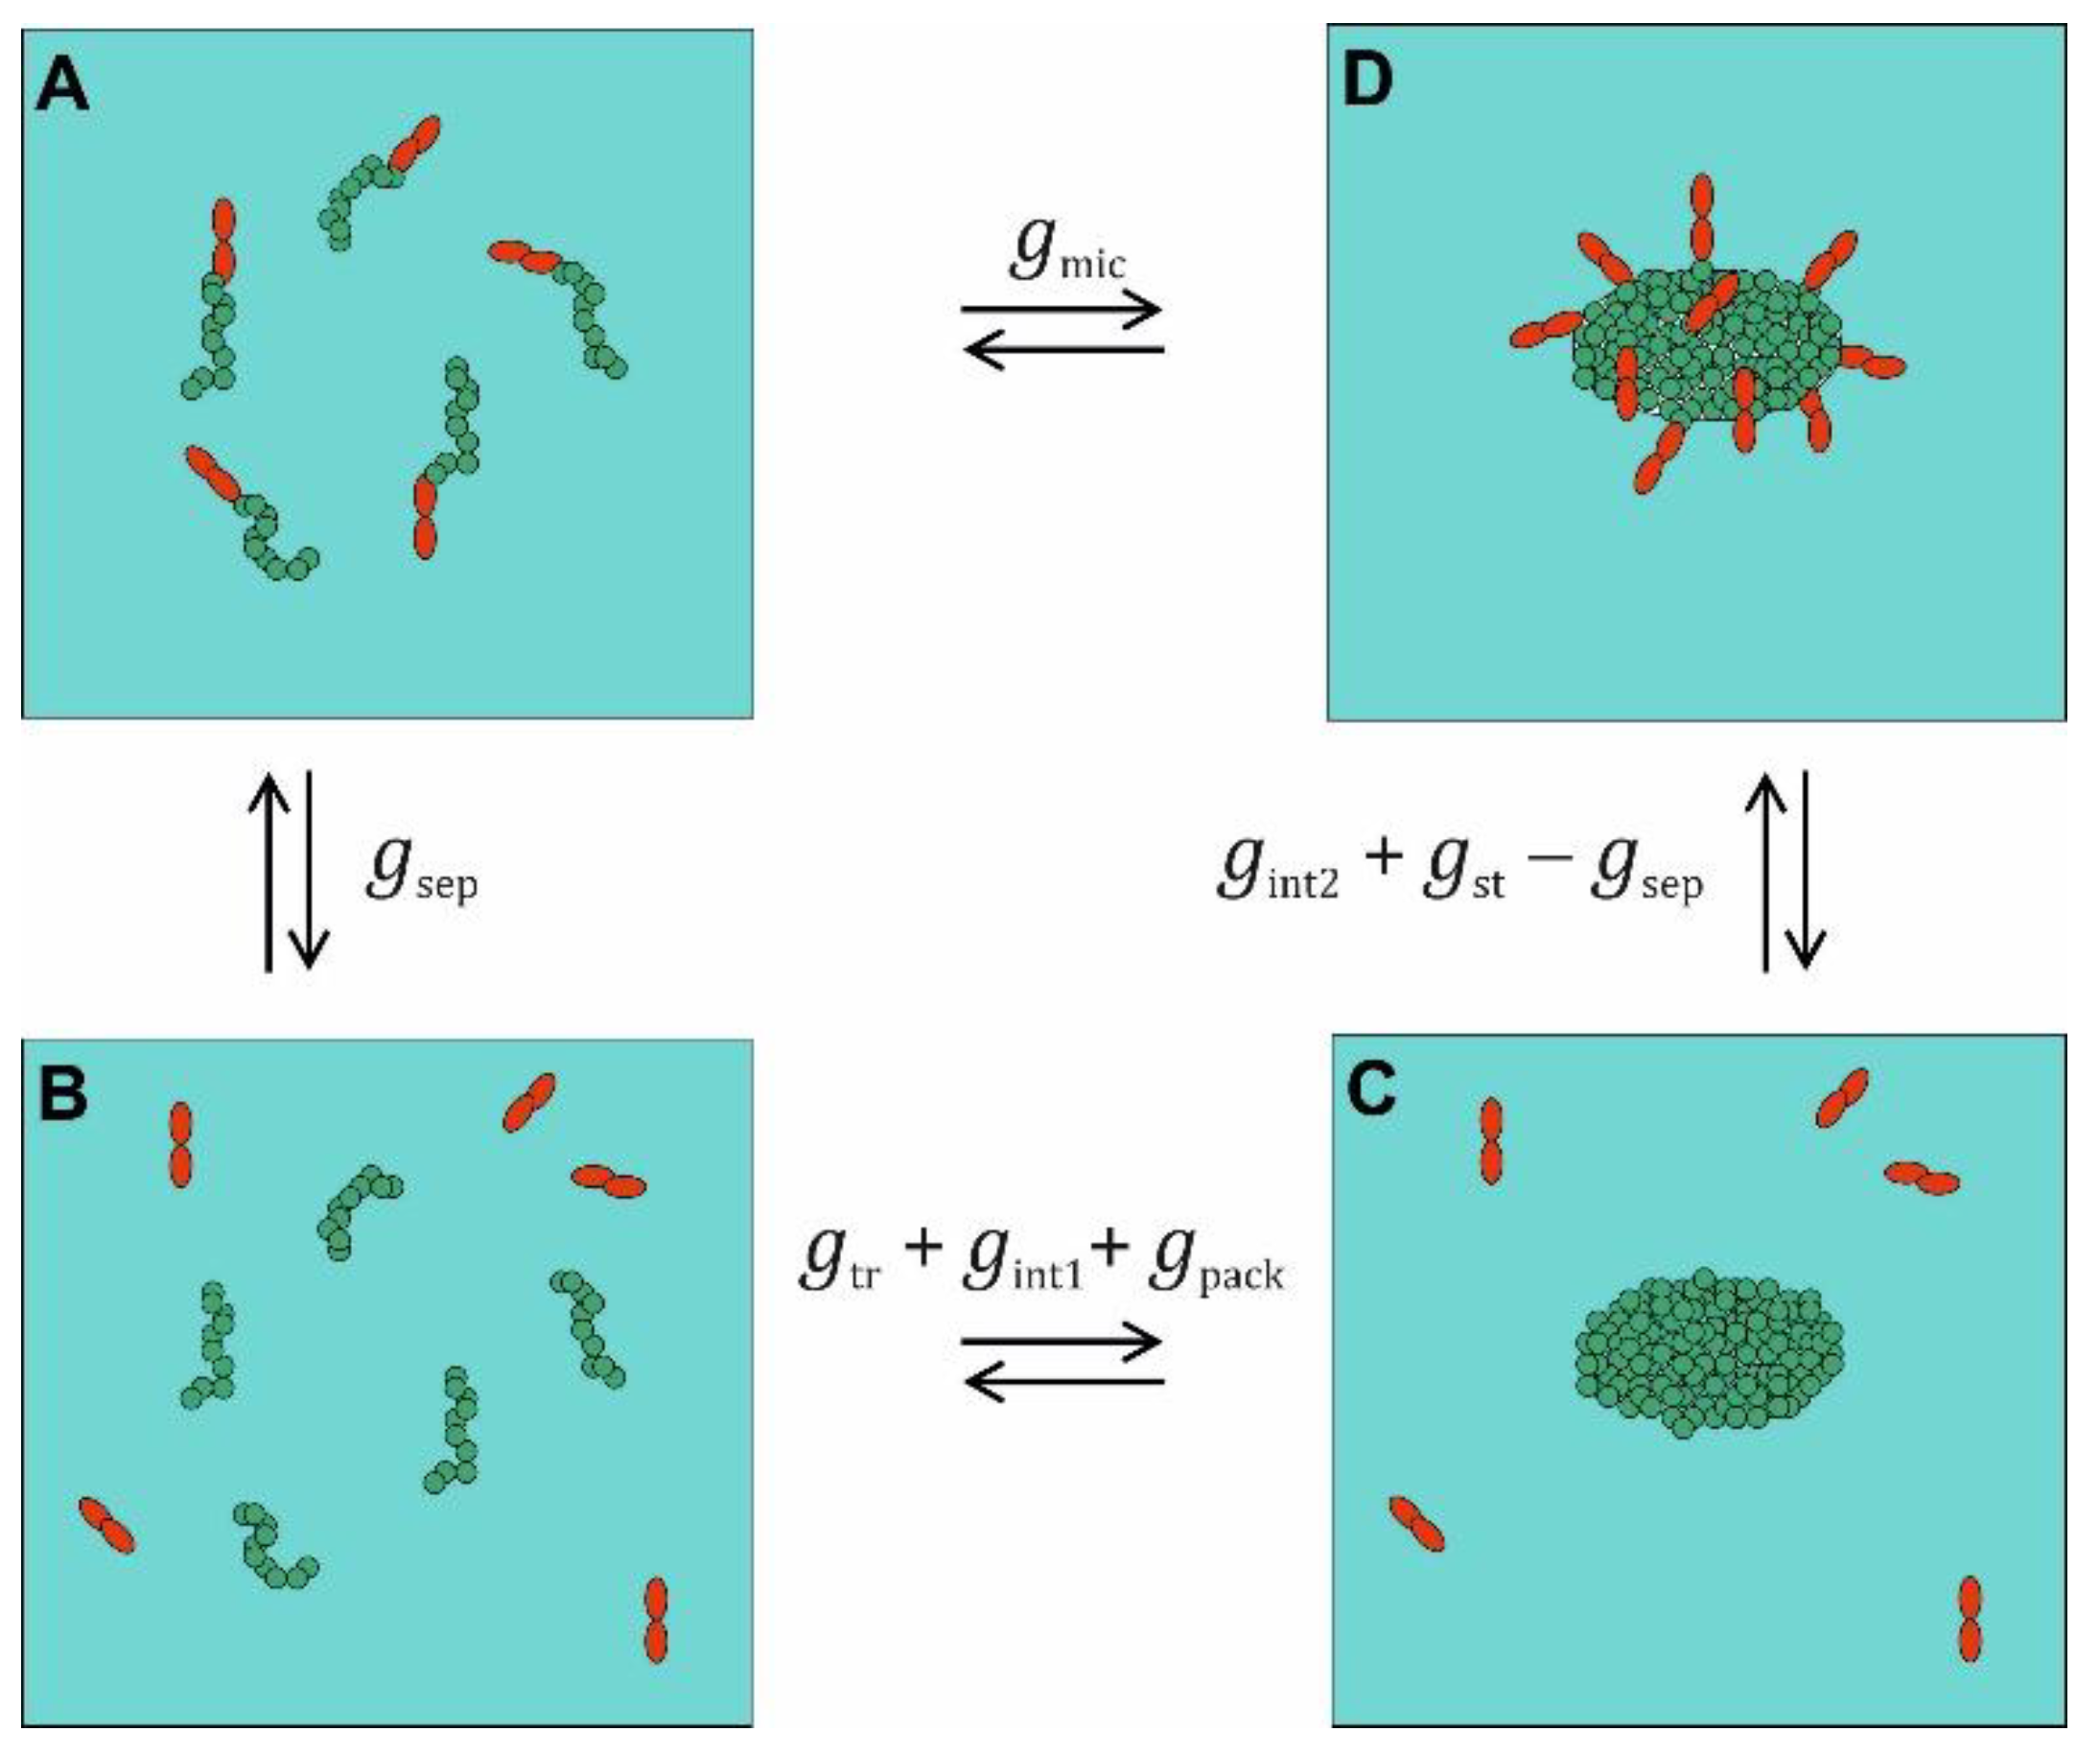
In the following, we will denote the PCP part of g m * or g m 0 , which we wish to model, as g m i c . Thus, g m i c corresponds to a standard free energy difference per detergent molecule in the micelle divided by the thermal energy that is devoid from any contribution from the liberation free energy related to the COM motion of micelles and monomers. The notion of g m i c as a PCP difference is a new aspect of the present paper. In molecular thermodynamic modeling [14,21,24,25], g m i c is decomposed on the basis of a thermodynamic cycle (Figure 2), in which the components, in our notation, are also to be understood as standard free energy difference per detergent molecule divided by the thermal energy. Some of these components may have seemingly contributions from liberation, but these refer to internal DOFs of the micelles and thus do not belong to the liberation free energy separated off in Eq. (33). We will consider only nonionic detergents. The first step in the cycle (A → B) involves the separation of the head groups from the alkyl tails requiring the free energy g s e p and yielding alkane chains in aqueous solution next to head group molecules. Since g s e p is supposed to be recovered in the step C → D and thus cancels out, we need not model it. The step B → C is the condensation of the singly dispersed alkane chains into an alkane droplet becoming the hydrophobic core of the micelle. This process contributes three free energy components. The first is g t r , which corresponds to the transfer free energy of alkanes from a diluted solution in water into a pure alkane phase. This contribution is traditionally modeled on the basis of experimentally determined transfer free energies, which will be the topic of Section 2.3.
When the alkane chains form a droplet, a significant portion of their molecular surfaces become shielded from the aqueous environment. The use of g t r implies assuming the loss of all alkane-water contacts. However, in contrast to a pure alkane phase, an alkane droplet in water still has a certain surface area A (per detergent molecule in the micelle = per alkane molecule in the droplet) that is in contact with water. Therefore, a free energy g i n t 1 = β σ h w A has to be considered, where σ h w is the interfacial tension between a pure hydrocarbon phase (h) and water (w) [21].
The packing of the alkane chains in the droplet is different from that in a pure alkane phase. Furthermore, one end of each alkane chain has to be close to the droplet´s surface to be prepared for the reattachment of the head group (which represents the different packing of alkyl chains in the micelle interior compared to alkane chains in a liquid hydrocarbon). This free energy contribution g p a c k can be modeled based on lattice models of the micelle interior [43,44]. We will use
g p a c k = 3 π 2 R s 2 80 N L 2 ,
which is applicable to spherical or nearly spherical micelles [21]. In Eq. (41), N is the number of segments representing the alkyl chain in the lattice model with length L = 4.9   Å following the lattice definition used by Dill and Flory [44], where N = n + 1 / 3.6 with 3.6 being the number of methylene groups per lattice site and n the number of carbon atoms in the alkyl chain. R s is the radius of the spherical micelle interior. For oblate spheroidal micelles, R s = a b 2 1 / 3 , where a and b are the minor and major radius, respectively, of the spheroidal micelle [14].
In the final step C → D, the head groups are reattached. This makes three contributions to the free energy. The first is that g s e p is recovered and drops out of the free energy balance. The second is that the attached head groups shield a certain portion A 0 of the alkane droplet´s surface from the aqueous phase yielding g i n t 2 = β σ h w A 0 . Note that A 0 is the shielded surface per detergent molecule and thus corresponds to the effective area covered by one head group. Both interfacial contributions can be lumped together:
g i n t = g i n t 1 + g i n t 2 = β σ h w A A 0 .
Finally, the head groups attached to the micelle interact with each other. For non-ionic detergents, it is common to model this interaction by a hard-core repulsion akin to a two-dimensional van-der-Waals gas and similar in spirit to our treatment of the entropy of mixing. As discussed by Bothe et al. [15] based on earlier work [21,22], this free energy contribution can be written as
g s t = ln 1 A p A .
Note that the effective cross-sectional area A p of the polar head group is usually assumed to be different from the effective area A 0 covered by the head group, whereas the surface area A is the same in Eq. (43) as in Eq. (42).
Taking everything together, we have the following decomposition:
g m i c = g t r + g i n t + g p a c k + g s t .

2.2.3. Surface-Based Description of the Transfer Term

It is well known that the transfer free energies of alkanes into water show a nice linear correlation with the alkane´s molecular surface S (see Section 2.3.). Accordingly, it has been proposed [14] to recast the transfer term g t r in the form
g t r = β σ h w S ,
where S is now to be understood as the molecular surface of the alkyl tail of the detergent, and σ h w is the same as in Eq. (42). A problem occurs here, however, as there are several ways of defining the molecular surface [45].
Lee and Richards [46] defined the solvent-accessible surface (SAS) – with the corresponding SAS area referred to as SASA – by rolling a sphere of radius r p (called the probe) over the van-der-Waals surface of a molecule. The latter can be regarded as the net surface of a molecule represented by a set of overlapping spheres M , each having the van-der-Waals radius of the respective atom. According to Sanner et al. [45], the SAS “can also be perceived as the topological boundary of a set of spheres M ´ obtained by increasing the radius of each sphere by the value r p “. Richards [47] defined the molecular surface, consisting of patches lying either on the atoms (contact surface) or on the probe (reentrant surface). Sanner et al. [45] prefer to define it “as the topological boundary of the union of all possible probes having no intersection with M ”. Since this surface literally defines, whether a point in space lies inside or outside the molecule, it is called the solvent-excluded surface (SES) – with the corresponding area referred to as SESA - based on the work of Greer and Bush [48]. Since Connolly [49] provided equations to compute the analytical description of that surface, it is also referred to as Connolly surface.
With reference to Section 2.1.1., we may consider the volume enclosed by the SAS as the excluded volume of the molecule, as the center of the probe is not able to enter this volume. On the other hand, the volume enclosed by the SES can be taken as the actual volume b i of a molecule of type i . Please, don´t confuse the solvent-excluded surface with the excluded volume: The latter is enclosed by the SAS and not the SES. In view of our approximation that the volume v i occupied by a molecule of type i is proportional to b i , one may be tempted to use the volume enclosed by the SAS as an approximation for v i . However, one has to keep in mind that the ratio of the volumes enclosed by the SAS and the SES depend on the molecular species and the proportionality constant ς + 1 is a kind of average over all molecular species that principally may depend on T and P .
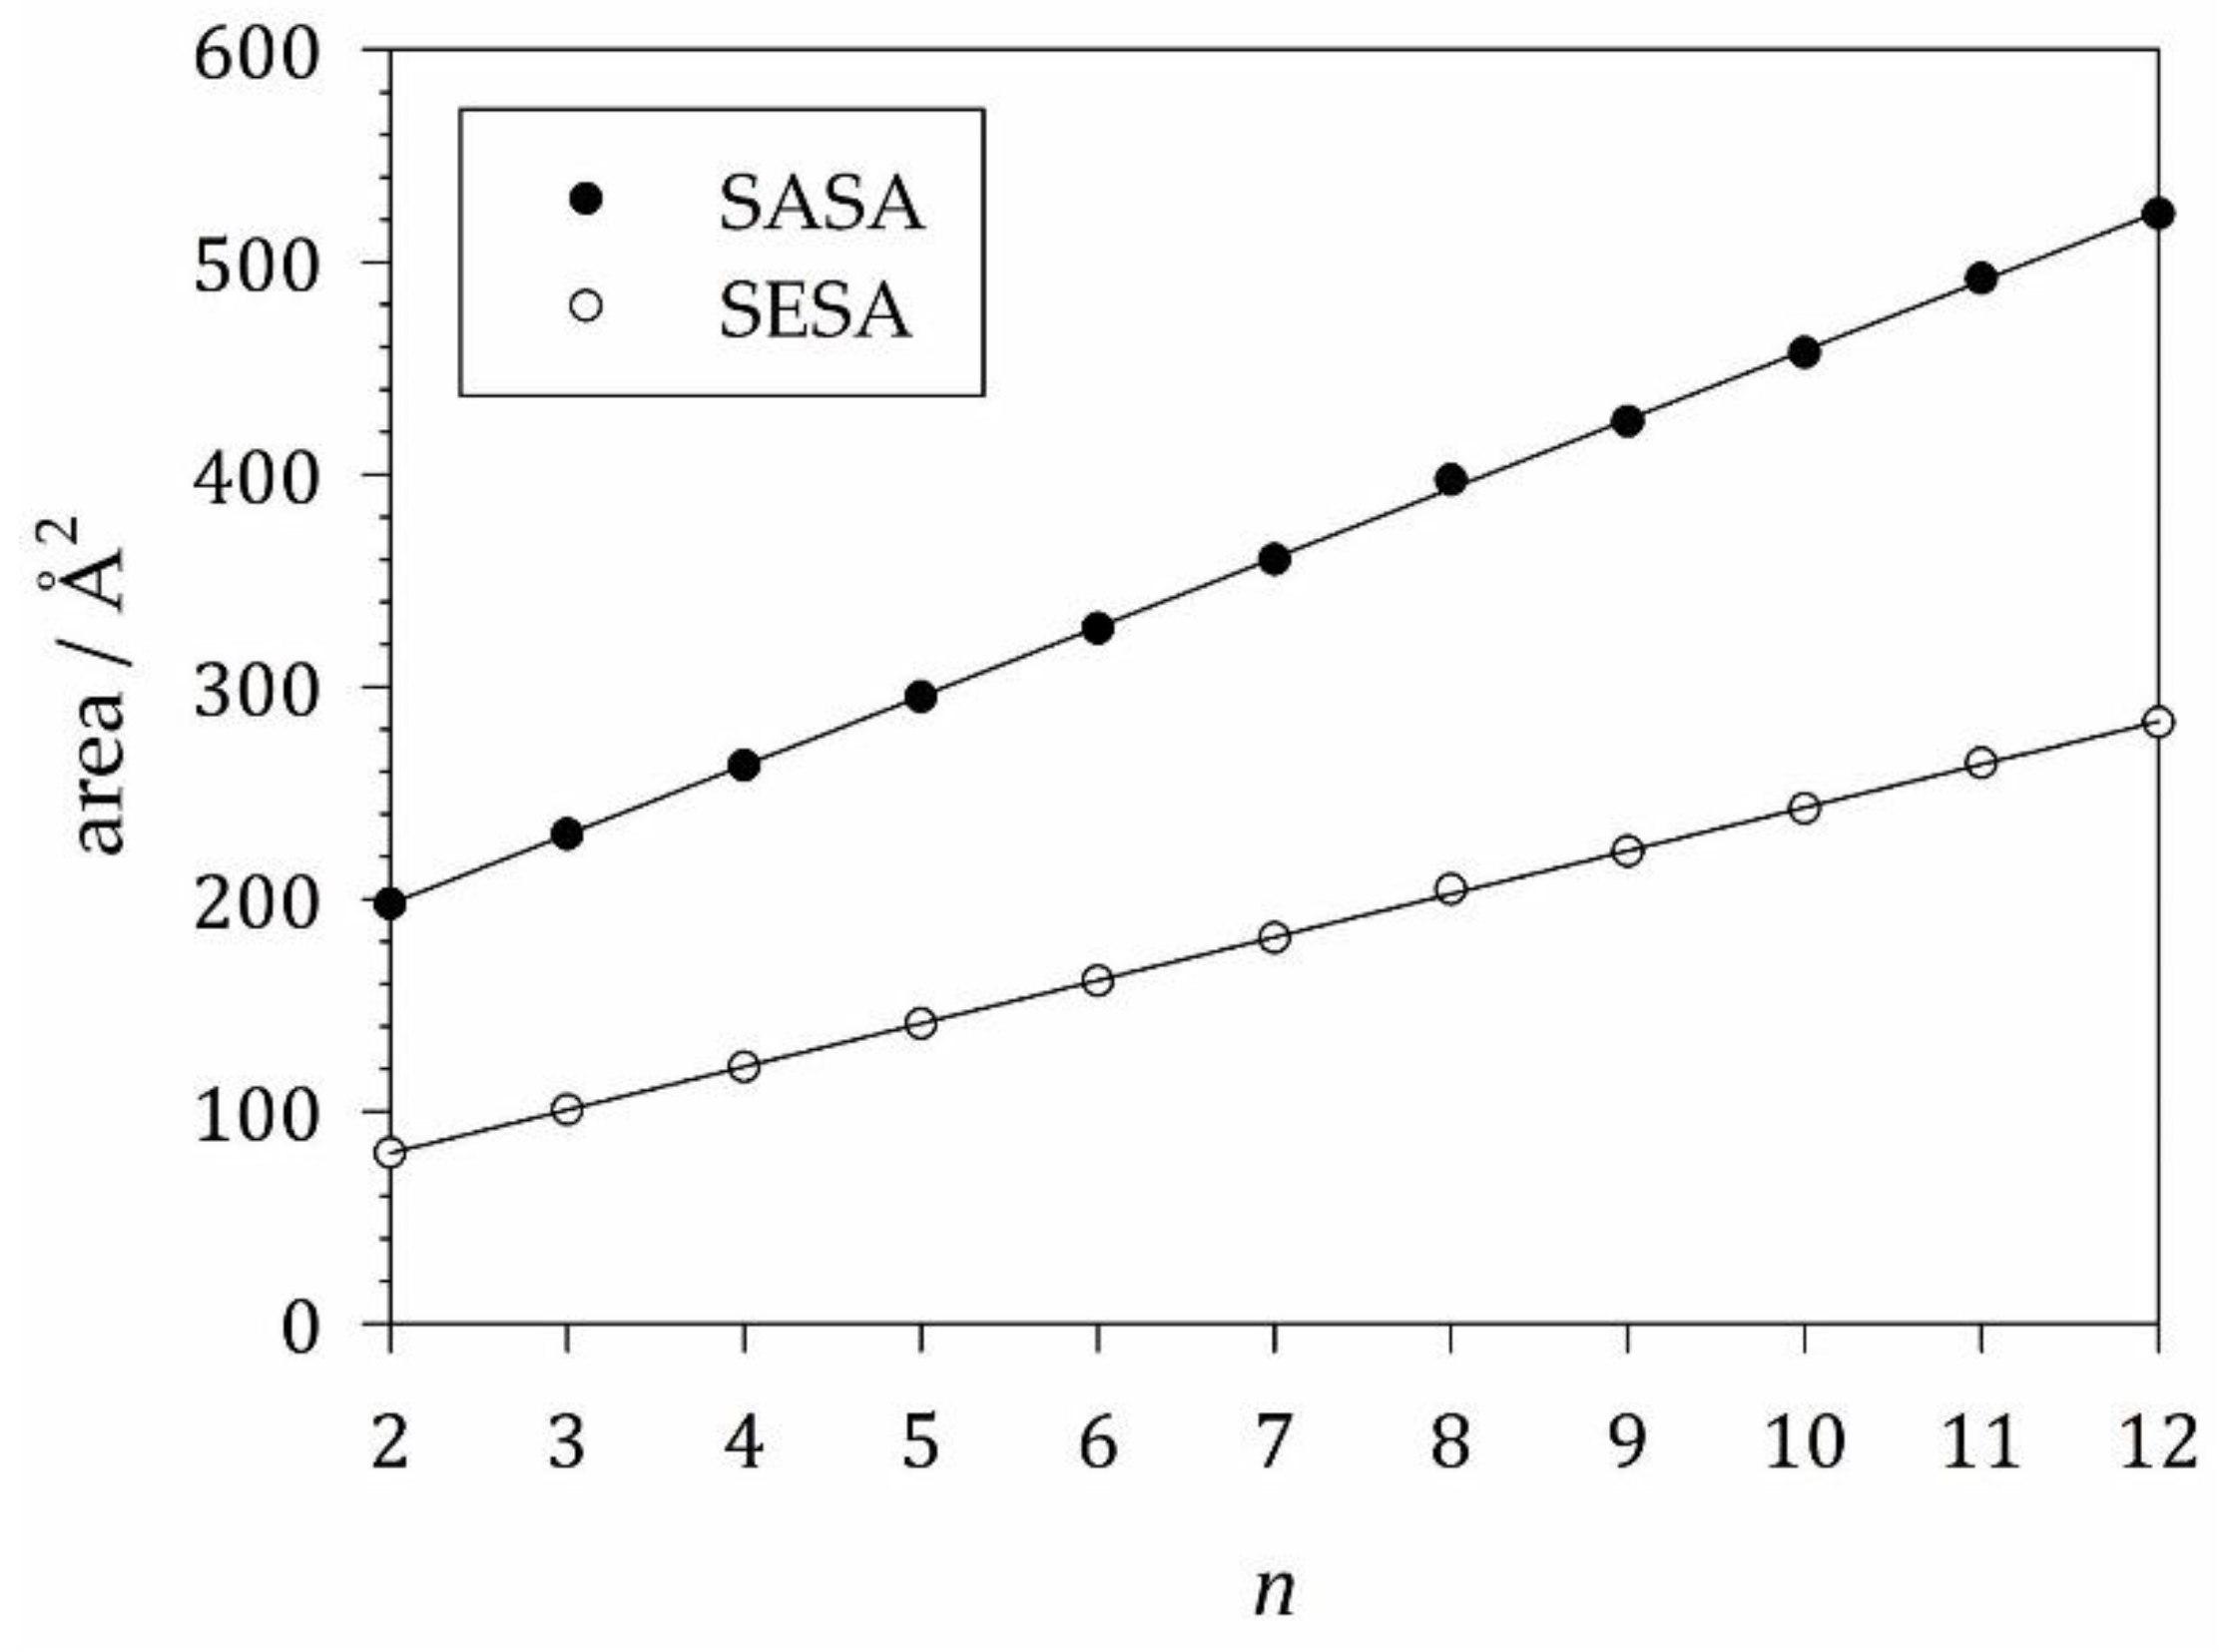
To model g t r , we computed the SASA and SESA for a series of alkanes in the extended conformation with the number of carbon atoms n ranging from 2 to 12 (Table 1; SM S4). Both areas depend linearly on n with slopes of 32.6 ± 0.2 Å2 for the SASA and 20.34 ± 0.08 Å2 for the SESA (Figure 3). These slopes provide the group contributions S 2 S A S A and S 2 S E S A of a methylene group to the SASA and SESA, respectively, of the alkyl tail (where the lower index indicates the number of hydrogen atoms in the methylene group). The group contributions of the final methyl group (with three hydrogen atoms) can be obtained from half the value of ethane ( n = 2 ) and are found to be S 3 S A S A = 98.9 ± 0.2 Å2 and S 3 S E S A = 40.19 ± 0.08 Å2, where we assumed the same errors as for the methylene group contributions. We can then write the transfer term as
g t r = β σ M S 3 M + S 2 M n 1 .
Here, the index M stands for either SASA or SESA. Note that the appropriate value for the interfacial tension σ M depends on the chosen surface (more about this in Section 3.1.).
It has been proposed to merge g t r and g i n t into one term g t r * that describes the free energy contribution due to a net change of the area of hydrophobic molecular surfaces exposed to water [14,15]. Because of the definition of A in Eq. (42) as the molecular surface of the micelle interior (see Section 2.2.2.), it is reasonable to use here the SESA rather than the SASA. Defining the effective area difference of hydrophobic molecular surfaces as
A e f f = A A 0 S 3 S E S A + S 2 S E S A n 1 ,
we obtain
g t r * = β σ S E S A * A e f f
with the appropriate interfacial tension σ S E S A * describing the interaction with water based on the SESA. Then, g m * = g t r * + g p a c k + g s t + g l i b with
g l i b = 5 2 m ln m ln Λ 1 3 ω 1 ,
where we assumed m 1 / m     1 (cf. Eq. (33)). It remains an open question, whether σ S E S A * can be identified with the interfacial tension σ h w of a macroscopic alkane-water interface as traditionally used in molecular thermodynamic modeling [21].
of carbon atoms in the chain. The linear fits serve to determine the group contributions S 2 M and S 3 M for the alkyl tail of a detergent molecule. Figure and linear regressions made with SigmaPlot 13 (© 2014 Systat Software Inc.).
Another problem is that in many applications, cosolutes are present that may modify the solubility of hydrophobic groups in the aqueous phase and hence affect the value of the effective surface tension to be used in Eq. (48). If we assume that the cosolutes do neither change g p a c k nor g s t and also have no influence on the aggregation number m , we can model the cosolute effect by introducing an effective surface tension σ S E S A 0 , so that
g t r 0 = β σ S E S A 0 A e f f ,
g m 0 = g t r 0 + g p a c k + g s t + g l i b . The relationship between σ S E S A 0 and σ S E S A * can be inferred from Eq. (30) as
σ S E S A 0 = σ S E S A * + β m A e f f α Y α j α m .
In the present paper, we do not specify the interaction constants j α m . Eq. (51) merely serves to give the difference between σ S E S A 0 and σ S E S A * a molecular interpretation.

2.3. Alkane Partitioning and Transfer Free Energy

2.3.1. Alkane Solubility in Water and the Transfer Free Energy as PCP Difference

At the heart of the traditional molecular thermodynamics modeling approach is the use of alkane solubility data to infer g t r in Eq. (44) [21]. To understand alkane solubility in water, we consider a liquid n-alkane phase in contact with liquid water at room temperature (298.15 K) and neglect the penetration of water molecules into the alkane phase. At equilibrium, we have to equate the chemical potential of the alkane (index H for hydrocarbon) in the pure alkane phase (index h)
μ H h = μ ~ H h + β 1 ln Λ H 3 ω H
with the chemical potential of the same alkane in a purely aqueous environment (index aq)
μ H a q = μ ~ H a q + β 1 ln N H Λ H 3 V N W b W N H b H
where N H and N W are the numbers of alkane and water molecules, respectively, in the aqueous phase, and V is the volume of this phase. The PCPs are given by
μ ~ H h = β 1 ln q H h β 1 ln e β B H h h
μ ~ H a q = β 1 ln q H a q β 1 ln e β B H a q a q
Note that both the internal partition functions q H h , q H a q of the alkane and the interaction energies B H h , B H a q of an alkane molecule added at a fixed position with the surrounding medium differ in general in the two phases h and aq. The averages h and a q are over all configurations of the particles in the respective phase at constant T and P except for the newly added alkane particle (cf. Appendix D). From μ H h = μ H a q , it follows that
μ ~ H a q μ ~ H h = β 1 ln V N W b W N H b H N H ω H   .
With the assumption that the aqueous phase is additive and the free volume of the alkane molecule is the same in both phases and proportional to its molecular volume, we arrive at:
β μ ~ H a q μ ~ H h = ln Y H ,
where Y H is the volume fraction of alkane in the aqueous phase at saturation.
The easiest way to arrive at an ideal mixing model is not to ignore the molecular volumes, but to assume that the ratio ϕ = v H / v W of molar volumes of alkane and water equals unity. As shown in Section 2.3.2., the volume fraction Y H then goes over into the mole fraction X H , and we obtain
β μ ~ H a q μ ~ H h = ln X H ,
To understand how the present treatment of alkane solubility is related to the work of Sharp et al. [31], it is useful to look at the problem from a slightly different angle. This is done in SM S5.

2.3.2. Linking Alkane Solubility Mass Ratios to Volume and Mole Fractions

The available solubility data of liquid alkanes are given as the mass ratio ξ = m H / m W of alkane to water in the saturated aqueous phase [50]. To exploit Eqs. (57) and (58), we have to express Y H and X H as a function of ξ . To this end, we introduce the ratio of molar volumes ϕ = v H / v W and the ratio of molar masses ζ = M H / M W . While M W = 18.015 g/mole, M H depends on the number of carbon atoms n in the alkane according to
M H = 2 M 3 + n 2 M 2
with M 2 =14.027 g/mole and 2 M 3 = 30.07 g/mole. The molar volumes can be calculated as the ratio of the molar mass to the mass density ρ . For water, ρ W = 0.9973 (see [16] and references therein), yielding v W = 18.064 cm3/mole. The densities of liquid alkanes at 298.15 K are given in Table 2 and were taken from Aucejo et al. [51]. As expected, the resulting molar volumes at 298.15 K are slightly larger than those at 293.15 K reported by McAuliffe [50]. Since we have to restrict the analysis to liquid alkanes, for which solubility data are available [50], we consider here only alkanes from n-pentane to n-octane.
With the introduced quantities, we can express the volume fraction as
Y H = Υ 1 + Υ           ,           Υ = ξ ϕ ζ
and the mole fraction as
X H = χ 1 + χ           ,           χ = ξ ζ
A comparison of Eqs. (60) and (61) shows that X H is obtained from Y H by setting ϕ = 1 . Due to the low solubility of the alkanes in water, it holds that practically Y H = Υ and X H = χ , as can be seen from Table 2.

3. Results

3.1. Surface-Based Analysis of Alkane Solubility

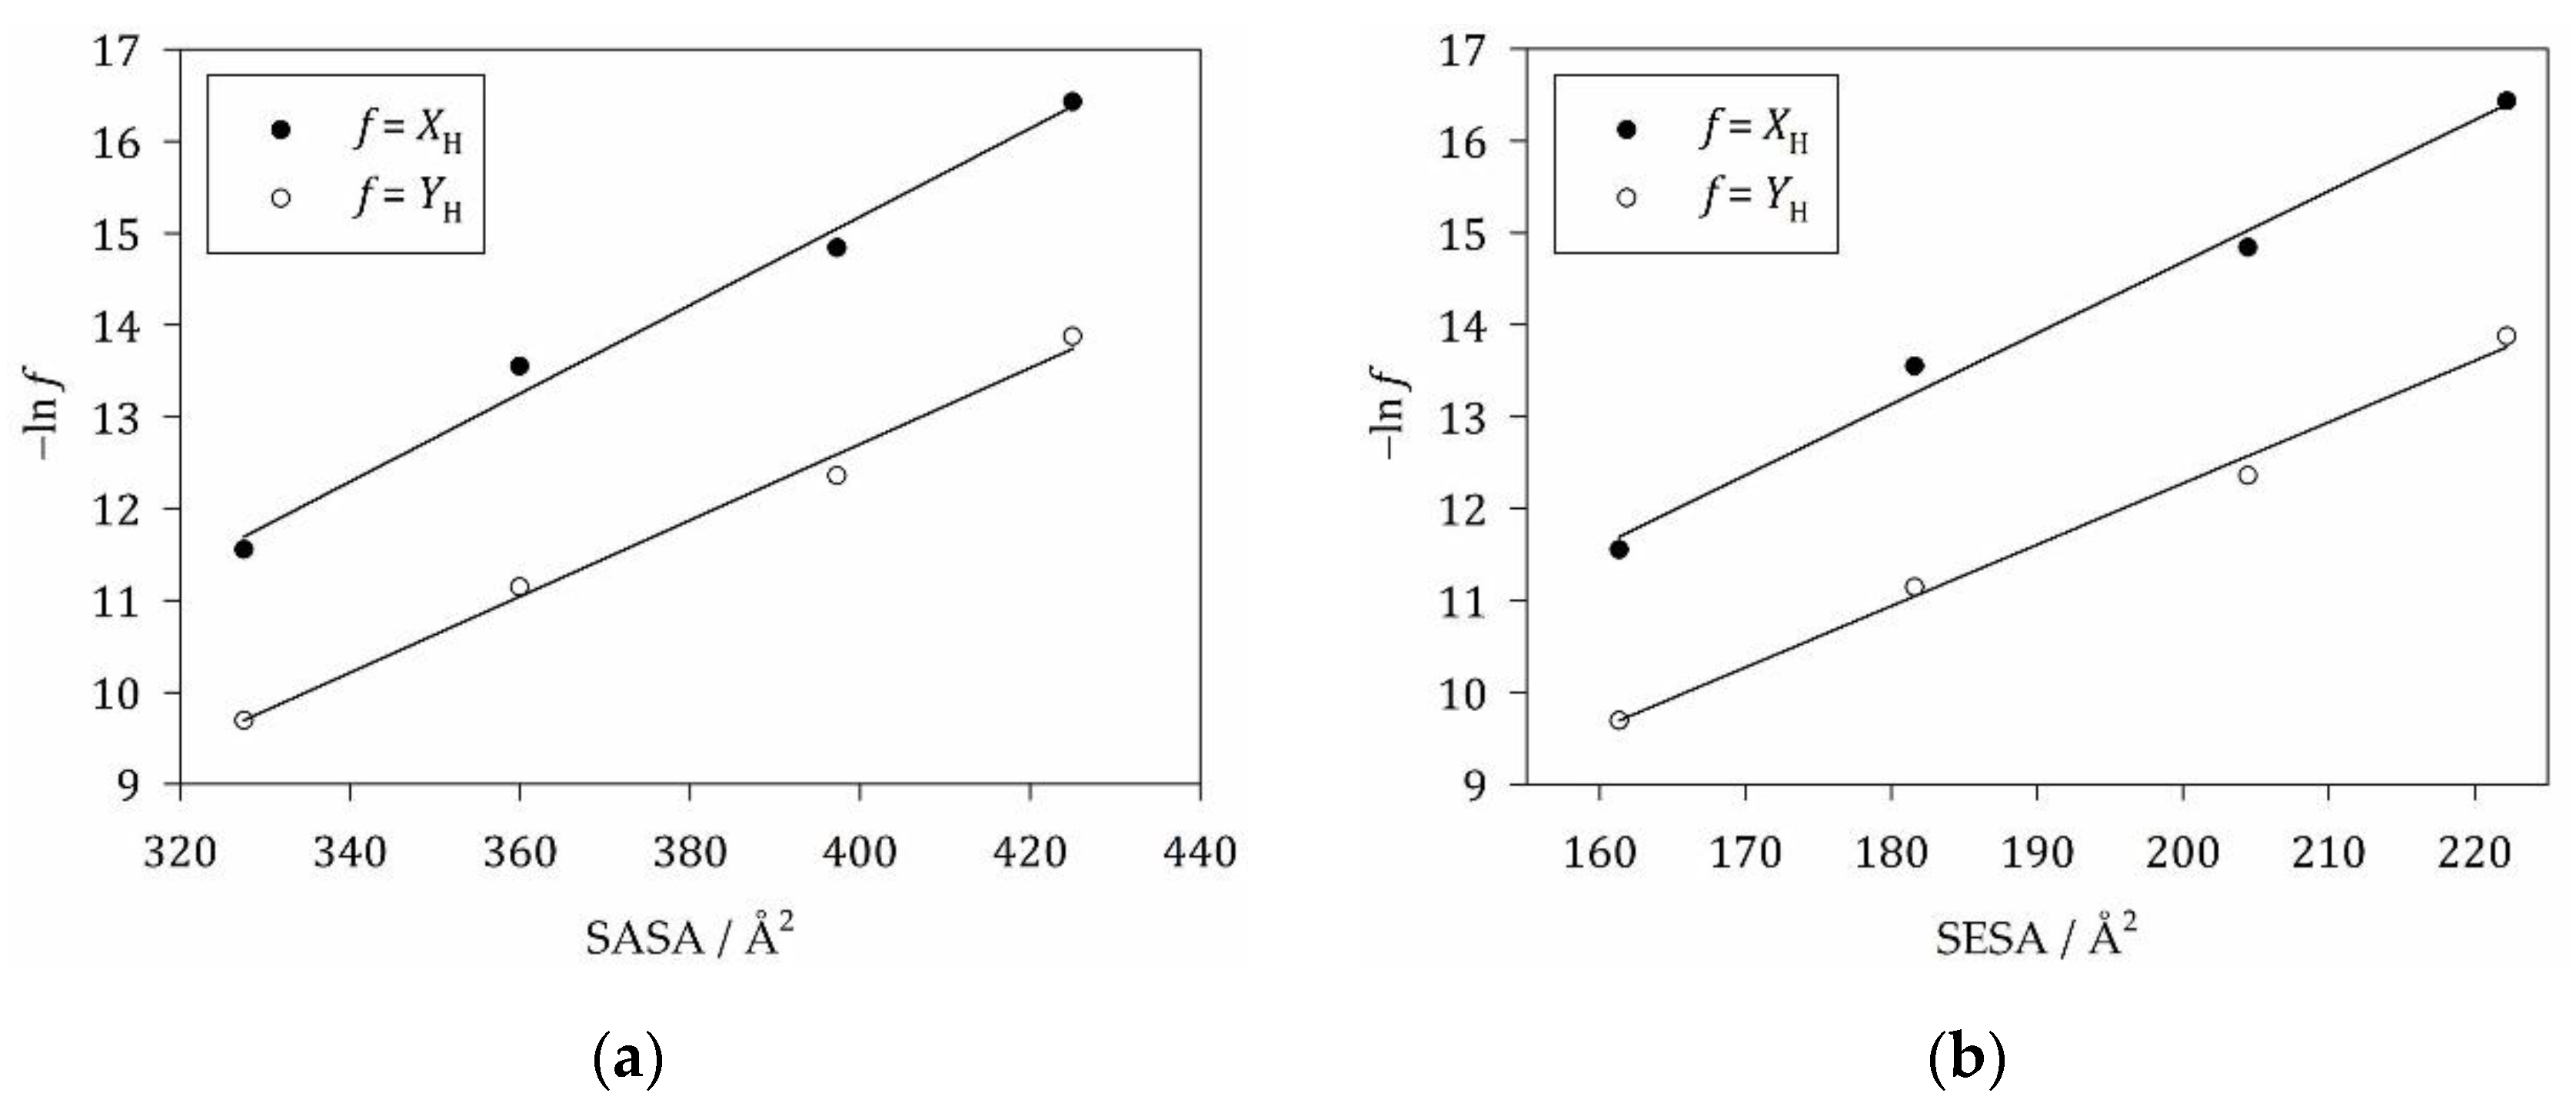
To obtain g t r in terms of molecular surfaces, we have to correlate β μ ~ H a q μ ~ H h either in the form ln X H (ideal mixing model) or in the form ln Y H (Flory-Huggins model) with the molecular surface areas, which can be the SASA or the SESA (Figure 4). The value of σ M obtained from linear regression for the ideal mixing model based on the SASA (Table 3) is in good agreement with literature data [31,36,52]. Note that our value of 19.8 mN/m corresponds to 28 cal/(mole Å2), which has to be compared to 29 cal/(mole Å2) reported by De Young and Dill [52] and to 31 cal/(mole Å2) found by Sharp et al. [31]. Our value is systematically smaller, since we used slightly larger values of the van-der-Waals radii to compute the SASA. Another possible source of discrepancy is the use of a smaller data set for the alkane solubilities employed in the present work. We used only values for liquid n-alkanes reported directly by McAuliffe [50] to be consistent with our theory and to avoid any possible bias from a processing of the data by others. Altogether, the agreement is very satisfactory.
Our value of σ M obtained for the Flory-Huggins model based on the SASA (Table 3) corresponds to 25 cal/(mole Å2) and is consistently slightly smaller than the value of 27 cal/(mole Å2) determined by De Young and Dill [52]. Thus, we confirm that the use of volume fractions instead of mole fractions causes only a small decrease of σ S A S A . The values of σ S E S A are consistently larger by a factor of 1.6 for both models, which is due to the SESA being correspondingly smaller than the SASA (cf. Table 1).
In the above analysis, we interpret the PCP difference μ ~ H a q μ ~ H h as the transfer free energy. More precisely, the PCP difference corresponds to the free energy change due to taking out an alkane molecule from a fixed position in the alkane phase and putting it at a fixed position into the aqueous phase. Thus, it is devoid of any contributions from liberation. The latter would depend on the volumes of the two phases, and including them into the analysis would obscure the determination of the partition coefficient. Instead, the PCP difference encompasses all changes that the alkane molecule experiences when going from one phase to the other, which includes changes of the internal partition function (represented by q H h and q H a q ) and changes of the alkane-environment interaction (represented by B H h and B H a q ; cp. Eqs. (53) and (54)). This free energy difference is also referred to as contact free energy. In the words of Chan and Dill [36], it is “the free energy of swapping environments of the solute.” It is precisely this contact free energy that we have to correlate with molecular surfaces, if we want the corresponding surface tension σ M to be a meaningful descriptor of the alkane-water contact and a measure of hydrophobic solvation. Note that the contact free energy is temperature dependent and has an entropic contribution.
Sharp et al. [31] advocated the use of a different equation (Eq. (S43) for the alkane partitioning problem), which we re-derived in SM S5 and which De Young and Dill [52] refer to as “FH corrected”. Note that some authors call this “corrected” version “Flory-Huggins (FH) theory”. This is not the case in the present paper. We refer to the use of a volume-fraction-based entropy of mixing according to Eq. (10) as Flory-Huggins theory. When we apply the “corrected” version (see Figure S1), we obtain σ S A S A = 28.1 mN/m (Table S1), which corresponds to 40 cal/(mole Å2) and has to be compared to 43 cal/(mole Å2) reported by De Young and Dill [52] and to 47 cal/(mole Å2) found by Sharp et al. [31]. Again, the agreement is satisfactory given the different van-der-Waals radii underlying the SASA and the smaller set of solubility data used in the present work. Thus, we confirm that employing the “FH corrected volume fraction” yields larger surface tension values.
Tuñón et al. [53] combined the “FH corrected” theory with the SESA and obtained σ S E S A = 67 cal/(mole Å2). This value is fairly close to 50 mN/m (72 cal/(mole Å2)) for the macroscopic interfacial tension σ h w of an alkane-water interface [14,21]. We basically confirm this result with our value of 44.8 mN/m (64.6 cal/(mole Å2); Table S1). These results seem to suggest using the “FH corrected” theory in combination with the SESA and the macroscopic interfacial tension. However, as we shall see, this procedure does not work in the modeling of micelle formation.

3.2. Application to Alkyl Maltosides

In the following, we will analyze the same experimental CMC data for n-alkyl-ß-D-maltosides that have been investigated recently by Bothe et al. [15] based on an ideal mixing model. These data were obtained with a fluorescence technique [2,14,54] that has been shown [15] to be compatible with the definition of the CMC by Eq. (35). The two data sets from [14,15] and [2,54] will be referred to as “Bothe et al.” and “Alpes et al.“, respectively.
To analyze the experimental data, we recast Eq. (40) in the form
g m 0 = ln C M C c t o t + ln v 1 c t o t + τ m + 1 ,
where C M C / c t o t = X C M C . Then, we define the quantities
γ = ln Λ 1 3 ω 1 ,
Γ = ln X C M C + ln v 1 c t o t + τ m + 1 + 5 2 m ln m g p a c k + g s t γ ,
and
Φ = β A e f f ,
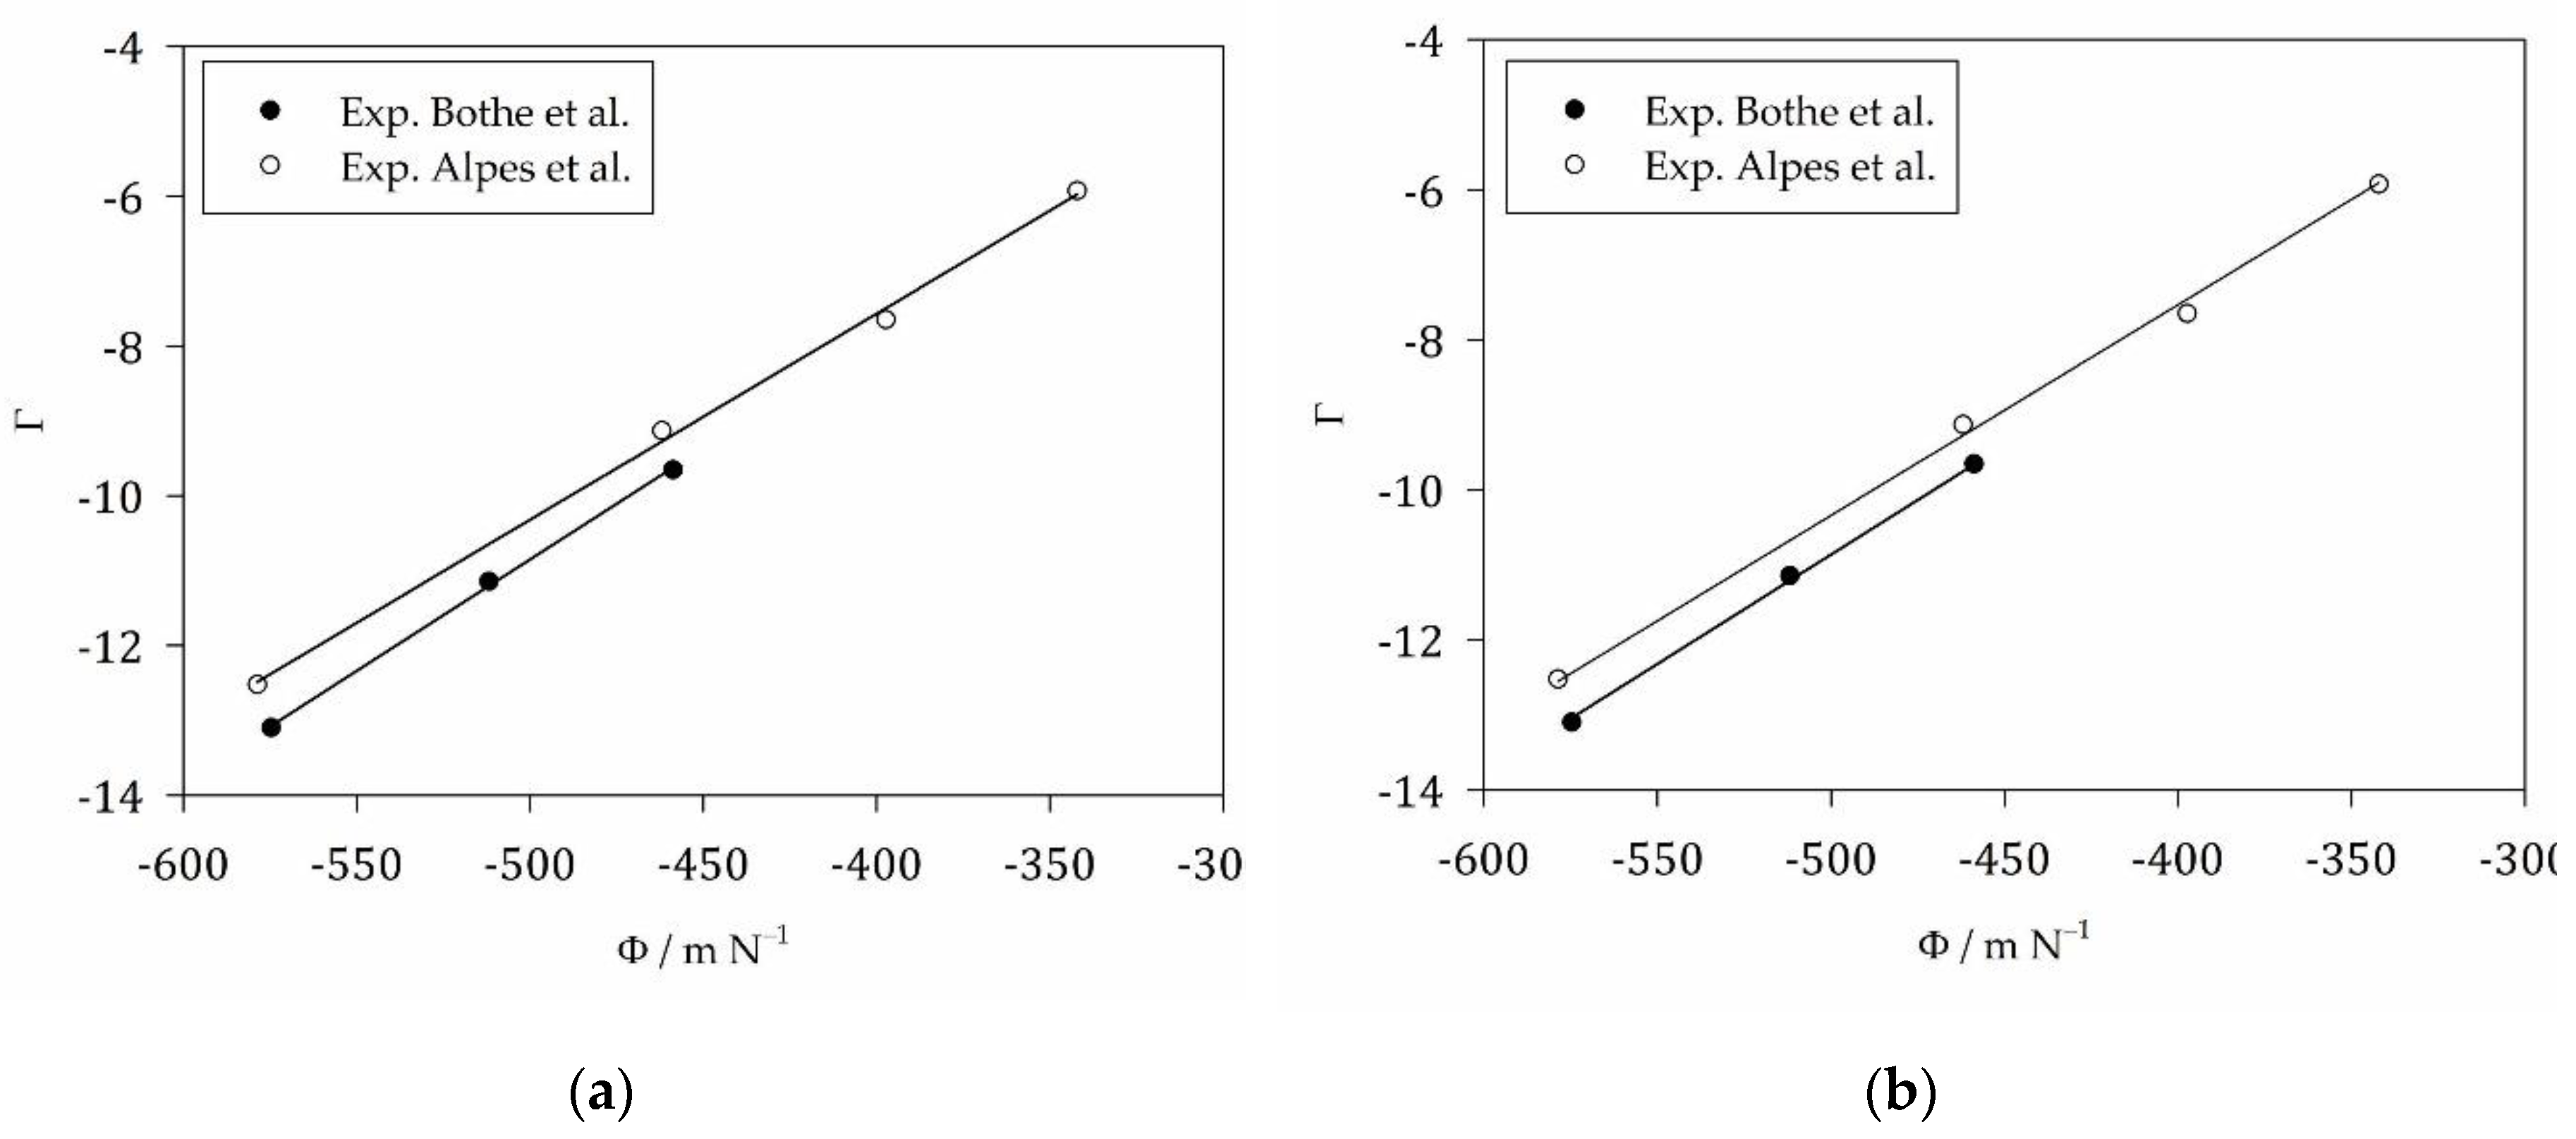
so that Γ = σ Φ , where σ is the searched for surface tension. The latter can be obtained from a linear regression of Γ versus Φ for a set of detergents with the same head group, but different numbers n of carbon atoms in the alkyl tail, provided that we capture the n -dependence of the various terms in Γ correctly. As in [14], we do not aim at a prediction of aggregation numbers, but use values from the literature. These values, their sources as well as the limitations of this approach have been discussed by Bothe et al. [15]. Likewise, we take values for g p a c k and g s t from this earlier work, whereas values of A e f f are computed from the group contributions determined in Section 2.2.3. together with previously reported values for A and A 0 . All necessary data and their sources are compiled in Tables S2 and S3. The determination of the molar volumes v 1 of detergent monomers is described in SM S6.
A problem is that we do not know γ . The results of Bothe et al. [15] show that when using the model parameters A , g p a c k , and g s t from the ideal-mixing model (see Table S2), Γ ´ = ln X C M C + τ ´ m g p a c k + g s t correlates linearly with Φ with zero intercept. Thus, the data suggest that Σ γ = 0 with
Σ = ln v 1 c t o t + 1 + 3 2 m ln m .
Indeed, this turns out to be approximately correct.
In Figure 5, we show the correlation of
Γ = ln X C M C + ln v 1 c t o t + τ m + 1 + 5 2 m ln m g p a c k + g s t
(i. e. leaving γ aside) with Φ . The result for both experimental data sets is a linear correlation with a slope being close to the expected surface tension (cp. the slope values in Table 4 with 27.4 mN/m from Table 3) and an intercept in the order of 4 (Figure 5a). The difference in intercepts is not significant based on the errors from linear regression, so that equally satisfactory fits can be obtained by fixing the intercept to the same value for both data sets (Figure 5b). The basic result is that we confirm that it is the “microscopic” surface tension that has to be used in the modeling of micelle formation. This “microscopic” surface tension is obtained from an analysis of alkane solubility based on the same theoretical framework, which is Flory-Huggins theory.
For the detergents studied, the quantity Σ defined in Eq. (66) varies slightly from 4.1 to 4.2 when going from n = 8 to n = 12 . If Σ γ , the weak n -dependence of Σ can explain, why the correlation can be described well with a constant intercept. Taking γ between 3.0 and 4.2, we can estimate from Eq. (63) that the ratio ω 1 / Λ 1 3 of the free volume of the detergent monomer to its thermal deBroglie wavelength to the power of 3 is between 20 and 67.
The experimental CMC data refer to micelle formation in aqueous solutions containing salt and buffer (specifically, [14,15]: 100 mM piperazine-1,4-bis-(2-ethanesulfonic acid), pH = 7.0, 5 mM CaCl2, c t o t = 54.65 M; [2,54]: 150 mM KCl, c t o t = 55.32 M). It is possible that the values for σ S E S A found from fitting the CMC data is larger than that found from the alkane solubility data, because the surface tension is increased by the cosolutes. However, the differences are within the error margins, so that we cannot draw any viable conclusions about the cosolute effects. Irrespectively, to predict the CMC of the detergents in pure water ( c t o t = 55.56 M), we used the value σ S E S A = 27.4 mN/m suggested by the alkane solubility data and an intercept correction of 3.2, assuming that there is a correlated effect of the cosolutes (or their absence) on slope and intercept. In addition, there might be an effect due to the slight temperature differences, which were taken into account in the computation of Φ . It turns out that experimental CMC data from the literature can well be reproduced in this way (Table S4).

4. Discussion

In the present work, we sought to solve a problem in the modeling of the self-assembly of amphiphiles into micelles that is related to the change of the contact free energy of hydrophobic molecular surfaces in contact with the aqueous phase. Following traditional approaches, we modeled the contact free energy in terms of molecular surfaces and an associated surface tension. In agreement with earlier findings [29,30,36,52], we found the appropriate surface tension value ( σ S E S A = 27-30 mN/m, Table 3 and Table 4) to be significantly smaller than the value typically associated with macroscopic alkane-water interfaces (50-53 mN/m [14,21,28]), which cannot be explained with the effects of cosolutes [28]. Apart from the problem of using different surface definitions (SASA vs. SESA), there has been the proposal in the literature that the discrepancy in surface tension values is due to the neglect of molecular volume differences between solvent and solute [31]. Since a proposed solution to this issue [31] is based on a variant of Flory-Huggins theory, we approached the subject by deriving a Flory-Huggins type of theory for the micellization problem. It should be noted that the use of such a theory in the context of micellar solutions is not new. In a study of entropy models related to micelle formation and phase separation in surfactant solutions – which to our knowledge is the only one of this sort available in the literature – Nagarajan [23] also tested a Flory-Huggins model. In fact, his Eq. (25) for the micellar size distribution is essentially the same as our Eq. (29). However, Nagarajan did not say anything about the derivation of this equation. So we had to start from scratch. The advantage of this line of action was that we learned about the implications of Flory-Huggins theory. In particular, we did not derive it from a lattice model, but based on approximations suggested earlier by Hildebrand [35].
The starting point of Hildebrand´s approach is Eq. (7), which formulates the entropy of mixing in terms of changes of the free volume for each molecular species including solute and solvent. In the derivation of this equation from classical statistical mechanics, we had to assume that the integration over the spatial coordinates in the partition function yields the free volume (Appendix A). This is actually wrong given our definition of the free volume (see below). To obtain Eq. (A3) from Eq. (A2), we have to integrate over the empty space not occupied by molecules. However, the integration variables q 1 and q 2 are the COM positions of the molecules, which can sample the empty space only, if we neglect their volumes b i . So, there is a contradiction. We encounter here an old problem in condensed matter physics. As discussed by Barrat and Hansen [55] for the case of spherical molecules, it is “important to realize that, while the excluded volume associated with each individual sphere is v e x , the total volume V e x from which the centre of a test sphere is excluded is less then N × v e x , since the exclusion spheres of neighbouring particles can overlap” (English spelling from the original). This problem makes the determination of the volume accessible to the COM of a molecule practically impossible, if not determined numerically. In fact, one may use Monte-Carlo (MC) or molecular dynamics (MD) techniques to gain insight into the accessible volume. In contrast, the free volume in Hildebrand´s theory – as it is perceived by Flory – “is considered to represent the difference between the actual volume of the liquid (or the amorphous polymer) and the minimum volume which it would occupy if its molecules were packed firmly in contact with each other. Incompressible molecules with rigid dimensions are implied in this definition of a free volume. The unrealistic nature of this implication undermines precise determination, or even an exact definition, of the free volume. The concept has proved useful nevertheless“ (see footnote on p. 506 of [34]; italics by the present author). In view of these difficulties, we rigorously defined the free volume by the space not occupied by molecules. Then, in order to base Eq. (7) on statistical mechanics, which mainly serves to underscore that G m i x is a free energy difference, we have to temporarily reinterpret the integration variables in Eq. (A2) in order to get the right results. This bold step might be justified by the fact that subsequent approximations necessary to arrive at Flory-Huggins theory mitigate the inconsistency. The definition of the free volume by V     N i b i is necessary to have the actual volume b i of a molecule as reference for the subsequent approximations.
As pointed out by Barrat and Hansen [55], each particle in a condensed liquid is trapped on average in a cage of neighboring molecules. Leaving large-sale diffusion aside, it is then useful to ask for the volume that the COM of a molecule can sample while it rattles in its solvent cage. In a hard-core description, where we neglect the subtleties of intermolecular interactions, the SES of each molecule and its neighbors define the ultimate limits of the molecular motion in the cage. The volume of the cage – on average – is in fact v i , which is related to the molar volume by v i = N A v i and can in principle, at least for pure substances, be determined experimentally (cf. the molar volumes of alkanes in Table 2). If we imagine the molecule moving in its cage, it is reasonable to assume that the volume sampled by the COM of the molecule is at least approximately determined by the difference between the volume of the cage and the volume of the molecule itself. This is the basic idea of introducing the free volume as ω i = v i b i . Whatever the quality of this approximation is, it allows for a consistent treatment in statistical mechanics, since now it is the integration over the COM coordinate of each molecule that determines ω i . Therefore, the partition function given for the pure substance in Eq. (A4) is consistent. Introducing the concept of an additive solution then allows carrying over this consistency to the mixture, so that Eq. (8) for the entropy of mixing, albeit approximate and unable to account for excess volumes, is more firmly rooted in statistical mechanics than Eq. (7).
The next bold step in Hildebrand´s approach is to assume that ω i is proportional to b i with the same proportionality constant for all molecule types. This assumption entails a corresponding proportionality between v i and b i . Only with this trick are we able to convert the ratio of free volumes between the pure substances and the mixture into the volume fraction according to Eq. (9). After all, it is not surprising that restrictive conditions are required to formulate a theory that has been derived before on the basis of a lattice model. Nonetheless, Hildebrand´s approach is instructive, since it allows us to learn more about the implications of Flory-Huggins theory. In the context of micelle formation, we learn from Eq. (17) that we cannot model the volume difference between a micelle with aggregation number m and m detergent monomers in water.
The further consequences of Flory-Huggins theory become more transparent, when we consider the concept of the PCP [37,38]. We see that the micellization free energy modeled in the TMT approach is actually a PCP difference, which is, however, not sufficient to model micelle formation. In contrast to the alkane partitioning problem, where according to Section 2.3.1., the kinetic energy contribution cancels out, so that the PCP difference is related to the volume fraction in a simple way within Flory-Huggins theory (see Eq. (57)), there is a contribution from kinetic energy and free volume changes in a self-assembly problem. Curiously, this contribution is found to be largely canceled by the terms necessary to convert mole fractions into volume fractions. This seems to indicate that the parameters of the TMT model taken over from ideal-mixing approaches work well only because of error compensation. On the other hand, assuming that these parameters are actually good enough and the cancelation is not merely due to error compensation, we estimated the ratio ω 1 / Λ 1 3 of the free volume of the detergent monomer to its thermal deBroglie wavelength to the power of 3. The result is that the characteristic length scale for the rattling of the COM position of a detergent monomer in its solvent cage is between 3 to 4 times the thermal deBroglie wavelength. Given that the latter is on the order of 0.046 Å for the detergents studied here, this would imply a COM motion amplitude on the order of 0.14 to 0.18 Å. At present, we cannot say, whether this is a realistic value. Future research should reevaluate the parameters from TMT modeling, before any conclusions about the free volume can be drawn.
The correlation plots in Figure 5 indicate that those parts of the micellization free energy that depend on the contact of hydrophobic molecular surfaces with the aqueous environment can well be modeled with a surface tension that is similar to that obtained from the analysis of alkane solubility in water. The crucial point is here that the transfer free energy involves the full PCP including the part due to the free volume η . This makes sense, because besides the hydrocarbon-water interaction, the change of the free volume in the aqueous phase, matters in both the transfer of the alkane from water into the pure alkane phase (or vice versa) and the transfer of the detergent´s alkyl tail from water into the micelle interior. Accordingly, the same surface tension has to be used in both cases, if the transfer free energy is related to the SESA of the respective hydrocarbon. And the corresponding surface tension value is the one referred to as “microscopic”.
In contrast, Sharp et al. [31] for the SASA and Tuñón et al. [53] for the SESA found higher surface tension values from a correlation of the quantity μ ¯ i in Eq. (D2), which we confirmed (Figure S2, Table S1). Our analysis reveals that the “microscopic” and “macroscopic” surface tensions differ, because the latter does not take into account the free volume contribution η . This could make sense either, because the free volume change due to incorporation of an alkane molecule into the aqueous phase is not of relevance for the interfacial energy of a macroscopic alkane surface in contact with water. In other words: The molecular volume ratio of alkane and water is relevant for the solvation of the alkane in water, but not for the alkane molecules at the macroscopic interface.
This seems to be bad news for our attempts to model cosolute effects in a simple way. If the “microscopic” surface tension is relevant for the micellization free energy, what is then the relevance of measured macroscopic alkane-aqueous electrolyte interfacial tensions? First of all, we have to note that we cannot yet draw any conclusions about cosolute effects due to the error margins in the present analysis of experiments. Irrespectively, the connection between μ ~ i and μ ¯ i via η i in Eq. (D2) could be a means to derive reasonable values of the “microscopic” surface tension for electrolyte solutions or buffer solutions from experiment.
Finally, we have to discuss an error source that could cause different slopes in the alkane partitioning plots in Figure 4 compared to the micellization plots in Figure 5. In the latter, the surface tension is not related to a pure SESA, but to A e f f , which results from lumping together g t r and g i n t (see Eq. (47) in Section 2.2.3.). The effective area A e f f contains the surface area A of the micellar core per detergent molecule, so that the actual surface area of the core is mA. The surface of the core is defined as the smooth surface of an oblate spheroid [14]. Yet, the problem is not necessarily the surface itself, but the meaning of the free energy contribution. Since the free-volume effect of partitioning of the alky tail into water is already accounted for in g t r , it is possibly not relevant for g i n t . Therefore, it might be necessary to use the “macroscopic” surface tension in g i n t . So, was the merging of g t r and g i n t premature? This is one of the many questions that will have to be answered in future work.

5. Conclusions

In an attempt to achieve the “extreme simplicity” in the modeling of micelle formation claimed by Israelachvili et al. [10], we devised a theory, in which all contacts between hydrophobic molecule parts and water are modeled by the SESA and an appropriate surface tension [14,15]. This surface tension turns out to be smaller by a factor of about 3/5 than the interfacial tension of a macroscopic alkane-water interface. It has been suggested that this discrepancy is due to the neglect of volume differences between solute and solvent in the theory [31]. Therefore, we re-derived a formalism that combines Flory-Huggins theory [32,33,34] – the simplest way to incorporate molecular volume differences – with the TMT approach [21,24]. This theory practically replaces the description of the solution in terms of mole fractions (ideal mixing) by one in terms of volume fractions, which can be seen in particular from the expression for the entropy of mixing in Eq. (10). The derivation was based on ideas published some time ago by Hildebrand [35], which shed light on the implications of Flory-Huggins theory beyond lattice models. Further insight was gained by considering the concept of the PCP introduced by Ben-Naim [37,38]. It turned out that the traditionally modeled micellization free energy corresponds to a PCP difference between micelles and monomers and has to be complemented by a term describing the liberation free energy difference. The neglect of the latter in earlier treatments might be the reason for the observed failure of Flory-Huggins theory in predicting CMCs [23]. It remains to be clarified, to what extent earlier models based on mole fractions depend on error compensation.
The difference between “microscopic” and “macroscopic” surface tension is not due to the neglect of molecular volume ratios. In fact, incorporating molecular volume effects via Flory-Huggins theory slightly decreases the value of the surface tension. The reason for the high surface tension found by Sharp et al. [31] for the SASA and by Tuñón et al. [53] for the SESA is the separation of the term 1 v H / v W (cf. Figure S1). Here, v H / v W is the molecular volume ratio of hydrocarbon and water. This term is part of the PCP difference Δ μ ~ in the transfer problem, which is the same for the transfer of the detergent´s alkyl tail into the micelle as for the transfer of an alkane molecule from water into a pure liquid alkane phase. It describes the free energy change due incorporation of a voluminous alkane molecule into the aqueous phase (change of the free volume) and consequently depends on the ratio v H / v W . In contrast, the quantity relevant to describe the contact free energy at a macroscopic alkane-water interface is Δ μ ¯ = Δ μ ~ β 1 1 v H / v W (cf. Eq. (S43)), which (approximately) does not contain contributions from the incorporation of alkane into the aqueous phase. Curiously, the ratio of surface tensions obtained from analyzing Δ μ ¯ compared to Δ μ ~ is 44.8/27.4 ≈ 1.6, which is accidentally the same as the SASA/SESA ratio. This together with the fact the conversion factor from mN/m to cal/(mole Å2) is similar (~1.4) led to some confusion in the past [15].
Since cosolutes (salts, buffer) influence the solubility of hydrophobic substances in water, the idea was put forward that modified surface tension values could be used to model the influence of cosolutes on micelle formation [15,26]. The problem is here that the “microscopic” surface tension has to be used, which is not generally available for buffered solutions, if not based on fits to solubility data that are likewise not generally available. There is hope, however, that one could use measured macroscopic surface tension data corrected by the term 1 v H / v W (or simply a factor 3/5) for this purpose. In this way, we could – after some struggle with the subtleties of condensed matter physics – get back to simplicity.

Supplementary Materials

The following supporting information can be downloaded at: www.mdpi.com/xxx/s1, Table S1: Surface tension from fit to Eq. (S43); Table S2: Parameters used in molecular thermodynamic modeling; Table S3: Model parameters derived from experimental CMC values; Table S4: Predicted CMC values in water compared to literature data; Figure S1: Correlation plots related to Eq. (S43); Figure S2: Correlation of molar volumes of alkanes with the chain length; Figure S3: Illustration of m -dependent terms in the relation between CMC and micellization free energy; Text S1: Evaluation of the partial derivative in Eq. (12); Text S2: The pseudo-chemical potential at constant T and P ; Text S3: Alternative derivation of Eqs. (C7) and (C11); Text S4: Computation of SASA and SESA values of alkanes; Text S5: Partitioning of a solute between two phases; Text S6: Determination of the molar volume of detergent monomers; Supplementary references.

Funding

This research was supported by the Austrian Science Fund (FWF) in conjunction with the district of Upper Austria (project P 33154-B).

Data Availability Statement

No new experimental data were created or analyzed in this study. All relevant theoretical data are contained in the article or in the Supplementary Material.

Acknowledgments

The author is indebted to A. Ben-Naim, whose books are very inspiring.

Conflicts of Interest

The author declares no conflicts of interest.

Appendix A: Statistical Mechanics of the Entropy of Mixing

In the framework of classical statistical mechanics, the canonical partition function of a mixture of N 1 molecules of type 1 and N 2 molecules of type 2 is given by
Q N = 1 N 1 ! N 2 ! h 3 N d p 1 d q 1 d p 2 d q 2 exp β H p 1 , q 1 , p 2 , q 2 ,  
where N = N 1 + N 2 and h is Planck´s constant. The vectors p i and q i ( i = 1,2 ) are 3 N i -dimensional and contain the components of the momenta and the COM positions, respectively, of the molecules of type i . H p 1 , q 1 , p 2 , q 2 is the Hamiltonian of the system, and the integration goes over the allowed phase space. To work out the contribution of translational motion to the entropy, we consider non-interacting molecules with a finite volume and neglect internal DOFs. Then, H p 1 , p 2 contains only the COM kinetic energy, and the integration over the momenta can be carried out:
Q N = 1 N 1 ! N 2 ! Λ 1 3 N 1 Λ 2 3 N 2 d q 1 d q 2 .
Here, Λ i is the thermal deBroglie wavelength of particle type i . If we assume that the integration over the COM coordinates yields the free volume (which requires a further discussion; see Section 4), we obtain
Q N = V N 1 b 1 N 2 b 2 N N 1 ! N 2 ! Λ 1 3 N 1 Λ 2 3 N 2 .
For the pure phases, we obtain accordingly
Q N i = N i ( v i b i ) N i N i ! Λ i 3 N i       ,       i = 1,2 .
Then, the free energy of mixing becomes
F m i x = β 1 ln Q N ln Q N 1 Q N 2 = β 1 N 1 ln V N 1 b 1 N 2 b 2 N 1 ( v 1 b 1 ) + N 2 ln V N 1 b 1 N 2 b 2 N 2 ( v 2 b 2 ) .
With S m i x = F m i x / T , we obtain Eq. (7). We assume here, that for a liquid, F m i x is roughly equivalent to G m i x (cf. SM S2).

Appendix B: Lattice Model for the Entropy of Mixing

We consider a hypothetical solution, in which there is only solvent (water) and one type of micelle with aggregation number m (i. e. there are no monomers if m > 1 ). To keep the lattice model simple, we assume that a detergent monomer has the same size as a solvent molecule. We assume that one lattice site can accommodate one and only one water molecule or one detergent monomer. Accordingly, a micelle with aggregation number m occupies m lattice sites. An example for m = 5 is shown in Figure B1.
If there are N 1 water molecules and N 2 micelles, the total number of lattice sites is M 0 = N 1 + m N 2 and the site fractions (being equivalent to volume fractions in the lattice model) are:
Y 1 = N 1 N 1 + m N 2 ,       Y 2 = m N 2 N 1 + m N 2 ,       Y 1 + Y 2 = 1 .
Let Ω ( N 1 , N 2 ) be the number of possible arrangements of N 1 solvent molecules and N 2 micelles on M 0 lattice sites. As a reference, we consider a hypothetical “pure micelle phase” with Ω ( 0 , N 2 ) being the number of possible arrangements of N 2 micelles on m N 2 sites. Since Ω = 1 for the pure solvent, the entropy of mixing is
Δ S = k B ln Ω ( N 1 , N 2 ) Ω ( 0 , N 2 ) .
Figure A1. A lattice with four micelles with aggregation number m = 5 . The lattice sites not occupied by a blue ball are supposed to be occupied with solvent (water) molecule s .
Preprints 118957 g0a1
To find Ω ( N 1 , N 2 ) , we follow Hill [12] and first notice that the number Ω ( N 1 , N 2 ) is equal to the number of ways of arranging N 2 micelles on M 0 sites, because after we placed the micelles, there is only one way left to place the solvent molecules on the remaining sites. Next, we number the micelles serially from 1 to N 2 and put them one after the other into the lattice. Let ξ i be the number of ways of putting the i th micelle into the lattice with i 1 micelles being already there, placed randomly. Then,
Ω ( N 1 , N 2 ) = 1 N 2 ! i = 1 N 2 ξ i .
The factor N 2 ! 1 has to be included, since the micelles are actually indistinguishable. However, this factor drops out in the calculation of Δ S .
With i micelles already in the lattice, the fraction of sites filled is f i = m i / M 0 . What is the number of possible locations for the ( i + 1 ) th micelle? Similar to the case of flexible polymer chains considered by Flory and Huggins [34], we will add the ( i + 1 ) th micelle “monomer by monomer”. In this case, we have M 0 m i possibilities to add the first monomer. Then, there are m 1 possibilities to place the second monomer in the vicinity of the first. However, to avoid clashes of micelles, we have to take into account that only a fraction ( 1 f i ) of the cells in the vicinity of the first monomer is not occupied by the original i micelles. So we have m 1 ( 1 f i ) possibilities to place the second monomer. For the third monomer (and all remaining ones), we assume that the factor ( 1 f i ) is approximately valid, so that we have m 2 ( 1 f i ) possibilities to place the third monomer, m 3 ( 1 f i ) possibilities to place the fourth monomer etc. Thus, we obtain:
ξ i + 1 = M 0 m i m 1 ! ( 1 f i ) m 1 = M 0 m i m m 1 ! M 0 ( m 1 ) .
Next, we have to evaluate the logarithm of the product in Eq. (B3):
ln i = 1 N 2 ξ i = i = 1 N 2 ln ξ i = i = 0 N 2 1 ln ξ i + 1 = i = 0 N 2 1 ln M 0 m i m m 1 ! M 0 ( m 1 ) .
We approximate the sum by an integral [12]:
i = 0 N 2 1 ln M 0 m i m m 1 ! M 0 ( m 1 ) 0 N 2 d i ln M 0 m i m m 1 ! M 0 ( m 1 ) = 1 m N 1 M 0 d u   m ln u + N 2 ln m 1 ! M 0 m 1 = M 0 ln M 0 M 0 N 1 ln N 1 + N 1 + N 2 ln m 1 ! M 0 m 1 .
Applying Eqs. (B2) and (B3), we obtain
Δ S k B = M 0 ln M 0 M 0 N 1 ln N 1 + N 1 + N 2 ln m 1 ! M 0 m 1 m N 2 ln m N 2 + m N 2 N 2 ln m 1 ! m N 2 m 1 = N 1 ln M 0 N 1 + m N 2 ln M 0 m N 2 m 1 N 2 ln M 0 m N 2 = N 1 ln Y 1 + N 2 ln Y 2 .

Appendix C: The Pseudo-Chemical Potential

We follow Ben-Naim [37,38] and compute the chemical potential of the solute μ 2 as the work (here, for simplicity, at constant T and V ) associated with the addition of one particle of type 2 to a mixture of N 1 particles of type 1 (solvent) and N 2 particles of type 2 (solute):
μ 2 = F T , V , N 1 , N 2 + 1 F T , V , N 1 , N 2 .
Here, we will define the PCP for the system of non-interacting particles with finite volume and no internal DOFs from Appendix A and denote it by η . For particles of type 2, η 2 refers to the work associated with the addition of one such particle to a fixed position in the solution ( R 0 in Figure 1):
η 2 = F T , V , N 1 , N 2 + 1 ; R 0 F T , V , N 1 , N 2 .
Using Eqs. (A2) and (A3), we obtain with N = N 1 + N 2 :
e β μ 2 = Q N 1 , N 2 + 1 Q N 1 , N 2 = N 1 ! N 2 ! Λ 1 3 N 1 Λ 2 3 N 2 N 1 ! N 2 + 1 ! Λ 1 3 N 1 Λ 2 3 N 2 + 1 Ω ´ d q 1 d q ~ 2 Ω d q 1 d q 2 = V N 1 b 1 N 2 + 1 b 2 N + 1 N 2 + 1 Λ 2 3 V N 1 b 1 N 2 b 2 N .
where q ~ 2 is a 3 ( N 2 + 1 ) -dimensional vector and Ω ´ and Ω are, respectively, the free volumes of the N + 1 - and N -particles systems, over which the position integration is carried out. (Please, refer to Section 4 for a critical discussion of this integration.) In the case of η 2 – as a consequence of the fact that we add the particle at a fixed position – there is no contribution from the kinetic energy of the particle to the partition function, and we have:
e β η 2 = N 1 ! N 2 ! Λ 1 3 N 1 Λ 2 3 N 2 N 1 ! N 2 ! Λ 1 3 N 1 Λ 2 3 N 2 Ω ´ d q 1 d q 2 Ω d q 1 d q 2 = V N 1 b 1 N 2 + 1 b 2 N V N 1 b 1 N 2 b 2 N .
Note also that we can distinguish the added particle from the other particles of type 2, so that there is no factor N 2 + 1 ! in Eq. (C4). Furthermore, since the added particle does not move, the integration in the enumerator is over d q 2 rather than d q ~ 2 . The free volume, however, is reduced by the addition of the particle. We then arrive at the relationship
μ 2 = η 2 + β 1 ln N 2 + 1 Λ 2 3 V N 1 b 1 N 2 + 1 b 2 .
The process of removing the constraint to a fixed position from the added particle is often referred to as liberation (not to be confused with libration). According to the second term on the rhs of Eq. (C5), there are three independent contributions to the liberation free energy: (i) The particle acquires momentum, which contributes the free energy β 1 ln Λ 2 3 . (ii) The released particle accesses the entire free volume, which contributes the free energy β 1 ln V N 1 b 1 N 2 + 1 b 2 . (iii) The particle becomes indistinguishable from the other N 2 particles of the same type, which contributes the free energy β 1 ln N 2 + 1 . Note that the liberation free energy is always negative in classical statistics.
To make contact with our derivation of the chemical potential in Section 2.1., we have to formulate the PCP in terms of a differentiation rather than a difference. To this end, we take Eq. (A3) and compute:
μ 2 = F T , V , N 1 , N 2 N 2 T , V , N 1 = β 1 N 2 ln Q N = β 1 ln N 2 Λ 2 3 V N 1 b 1 N 2 b 2 + N b 2 V N 1 b 1 N 2 b 2 .
Since the first term on the rhs of Eq. (C6) corresponds to the liberation free energy (where now N 2 + 1 is replaced by N 2 + d N 2 N 2 ), we come to the conclusion that
η 2 = β 1 N b 2 V N 1 b 1 N 2 b 2 .
Thus, η 2 is obtained by taking only the derivative of the logarithm of the free volume with respect to N 2 :
η 2 = β 1 N N 2 ln V N 1 b 1 N 2 b 2 .
Note again that this is the special case of featureless, non-interacting particles with finite volume.
To understand, how the PCP is related to Eq. (22), we have to invoke the approximation of an additive solution (cf. Section 2.1.1.). This approximation requires that we change to constant-pressure conditions (i. e. the isothermal-isobaric ensemble), since by definition, we cannot add a particle to an additive solution without changing the volume. However, as discussed in SM S2, the additional assumption that the volume occupied by a molecule is proportional to its actual volume makes the distinction between constant-pressure and constant-volume conditions redundant, so that we can continue working with the canonical partition function. In this approximation,
Q N = ς N N 1 b 1 + N 2 b 2 N N 1 ! N 2 ! Λ 1 3 N 1 Λ 2 3 N 2 ,
from which it follows that
μ 2 = β 1 ln N 2 Λ 2 3 ς N 1 b 1 + N 2 b 2 N v 2 V .
Since the first term on the rhs of Eq. (C10) corresponds to the liberation free energy, we conclude that
η 2 = β 1 N v 2 V .
Eq. (C11) also follows from Eq. (C8) in the appropriate approximation:
η 2 = β 1 N N 2 ln N 1 ω 1 + N 2 ω 2 = β 1 N ω 2 N 1 ω 1 + N 2 ω 2 = β 1 N ς b 2 ς N 1 b 1 + N 2 b 2 = β 1 N ς + 1 b 2 ς + 1 N 1 b 1 + N 2 b 2 = β 1 N v 2 V .
Next, we do the same for a pure substance (indicated by the symbol “ * ”) consisting of particles of type 2, for which the corresponding approximation to Eq. (A4) reads
Q N 2 = ς N 2 b 2 N 2 N 2 ! Λ 2 3 N 2 .
Then, we obtain
μ 2 * = β 1 N 2 ln Q N 2 = β 1 ln N 2 Λ 2 3 N 2 ω 2 1 .
Since again the first term on the rhs of Eq. (C14) corresponds to the liberation free energy, we arrive at the remarkable result η 2 * = β 1 for our special case. Taking finally the difference between the solution and the pure substance, we obtain:
Δ η 2 = η 2 η 2 * = β 1 1 N v 2 N 1 v 1 + N 2 v 2 = β 1 1 N v 2 V .
Note that in Eq. (22), N ¯ and v ν take over the roles of N and v 2 , respectively.
It is instructive to consider the case of an ideal-mixing model, where the volumes of the molecules are neglected. If these molecules do not interact and have no internal DOFs, they only have kinetic energy. Thus, if we add a molecule at a fixed position under these conditions, the PCP is necessarily zero. The system gains free energy only by liberation. Viewed from another angle, the only effect that a non-interacting particle with no internal DOFs can have, when placed at a fixed position, is to reduce the free volume. However, if b 2 = 0 , it follows immediately from Eq. (C8) that η 2 = 0 . This is the reason, why terms like Δ η 2 in Eq. (C15) do not occur in ideal-mixing models.
Finally, it is also instructive to discuss the case of interacting particles and the limit of hard-core interactions, which is done in SM S3 and results in alternative derivations of Eqs. (C7) and (C11).

Appendix D: The Pseudo-Chemical Potential with Internal Degrees of Freedom

In contrast to Appendix C and SM S3, we will consider here the internal DOFs of the solutes. The PCP then contains a contribution from the internal partition function q i of species i . We follow Ben-Naim [37] and denote the complete pseudo-chemical potential of species i by μ ~ i . Then,
μ ~ i = β 1 ln e β B i ( R 0 ) 0 β 1 ln q i .
Here, B i ( R 0 ) is the potential energy due to the interaction of the new particle added at the fixed (arbitrary) position R 0 with all other particles present in the solution, while 0 denotes the average over all configurations of the particles at constant T and P except the newly added particle (cf. SM S3). For an aqueous micellar solution, B i comprises detergent-water as well as – if present – detergent-cosolute interactions.
For the discussion of the micellization free energy in the framework of Flory-Huggins theory and its connection to the analysis of transfer free energies by Sharp et al. [31], it is convenient to introduce the quantity
μ ¯ i = μ ~ i η i ,
which is the difference between the full PCP and the hard-core (or free volume) part discussed in Appendix C (see also SM S5).

References

  1. Wycisk, V.; Wagner, M. C.; Urner, L. H. , Trends in the Diversification of the Detergentome. ChemPlusChem 2024, 89, e202300386. [Google Scholar] [CrossRef] [PubMed]
  2. Alpes, H.; Allmann, K.; Plattner, H.; Reichert, J.; Riek, R.; Schulz, S. , Formation of Large Unilamellar Vesicles Using Alkyl Maltoside Detergents. Biochim. Biophys. Acta Biomembr. 1986, 862, 294–302. [Google Scholar] [CrossRef]
  3. Otzen, D. , Protein-surfactant interactions: A tale of many states. Biochim. Biophys. Acta Proteins Proteomics 2011, 1814, 562–591. [Google Scholar] [CrossRef] [PubMed]
  4. Angerer, N.; Piller, P.; Semeraro, E. F.; Keller, S.; Pabst, G. , Interaction of detergent with complex mimics of bacterial membranes. Biophys. Chem. 2023, 296, 107002. [Google Scholar] [CrossRef]
  5. Dwars, T.; Paetzold, E.; Oehme, G. , Reactions in micellar systems. Angew. Chem. Int. Ed. 2005, 44, 7174–7199. [Google Scholar] [CrossRef] [PubMed]
  6. Privé, G. G. , Detergents for the stabilization and crystallization of membrane proteins. Methods 2007, 41, 388–397. [Google Scholar] [CrossRef]
  7. Thonghin, N.; Kargas, V.; Clews, J.; Ford, R. C. , Cryo-electron microscopy of membrane proteins. Methods 2018, 147, 176–186. [Google Scholar] [CrossRef]
  8. Golub, M.; Kölsch, A.; Feoktystov, A.; Zouni, A.; Pieper, J. , Insights into Solution Structures of Photosynthetic Protein Complexes from Small-Angle Scattering Methods. Crystals 2021, 11, 203. [Google Scholar] [CrossRef]
  9. Golub, M.; Gatcke, J.; Subramanian, S.; Kölsch, A.; Darwish, T.; Howard, J. K.; Feoktystov, A.; Matsarskaia, O.; Martel, A.; Porcar, L.; Zouni, A.; Pieper, J. , "Invisible" Detergents Enable a Reliable Determination of Solution Structures of Native Photosystems by Small-Angle Neutron Scattering. J. Phys. Chem. B 2022, 126, 2824–2833. [Google Scholar] [CrossRef]
  10. Israelachvili, J. N.; Mitchell, D. J.; Ninham, B. W. , Theory of Self-Assembly of Hydrocarbon Amphiphiles into Micelles and Bilayers. J. Chem. Soc. Faraday Trans. 2 1976, 72, 1525–1568. [Google Scholar] [CrossRef]
  11. Parsegian, V. A. , Long-Range Physical Forces in the Biological Milieu. Annu. Rev. Biophys. Bioeng. 1973, 2, 221–255. [Google Scholar] [CrossRef] [PubMed]
  12. Hill, T. L. , An Introduction to Statistical Thermodynamics. Dover: New York, 1960, 1986.
  13. Müh, F.; Zouni, A. , Micelle formation in the presence of photosystem I. Biochim. Biophys. Acta Biomembr. 2008, 1778, 2298–2307. [Google Scholar] [CrossRef] [PubMed]
  14. Müh, F.; DiFiore, D.; Zouni, A. , The influence of poly(ethylene glycol) on the micelle formation of alkyl maltosides used in membrane protein crystallization. Phys. Chem. Chem. Phys. 2015, 17, 11678–11691. [Google Scholar] [CrossRef] [PubMed]
  15. Bothe, A.; Zouni, A.; Müh, F. , Refined definition of the critical micelle concentration and application to alkyl maltosides used in membrane protein research. RSC Adv. 2023, 13, 9387–9401. [Google Scholar] [CrossRef]
  16. Müh, F.; Bothe, A.; Zouni, A. , Towards understanding the crystallization of photosystem II: influence of poly(ethylene glycol) of various molecular sizes on the micelle formation of alkyl maltosides. Photosynth. Res. 2024. [Google Scholar] [CrossRef]
  17. Kermani, A. A. , A guide to membrane protein X-ray crystallography. FEBS J. 2021, 288, 5788–5804. [Google Scholar] [CrossRef] [PubMed]
  18. Golub, M.; Hussein, R.; Ibrahim, M.; Hecht, M.; Wieland, D. C. F.; Martel, A.; Machado, B.; Zouni, A.; Pieper, J. , Solution Structure of the Detergent-Photosystem II Core Complex Investigated by Small-Angle Scattering Techniques. J. Phys. Chem. B 2020, 124, 8583–8592. [Google Scholar] [CrossRef]
  19. Birch, J.; Axford, D.; Foadi, J.; Meyer, A.; Eckhardt, A.; Thielmann, Y.; Moraes, I. , The fine art of integral membrane protein crystallisation. Methods 2018, 147, 150–162. [Google Scholar] [CrossRef]
  20. Ostermeier, C.; Michel, H. , Crystallization of membrane proteins. Curr. Opin. Struct. Biol. 1997, 7, 697–701. [Google Scholar] [CrossRef]
  21. Nagarajan, R.; Ruckenstein, E. , Theory of Surfactant Self-Assembly - a Predictive Molecular Thermodynamic Approach. Langmuir 1991, 7, 2934–2969. [Google Scholar] [CrossRef]
  22. Nagarajan, R. , Micellization, Mixed Micellization and Solubilization - the Role of Interfacial Interactions. Adv. Colloid Interface Sci. 1986, 26, 205–264. [Google Scholar] [CrossRef]
  23. Nagarajan, R. , Modeling Solution Entropy in the Theory of Micellization. Colloids Surfaces A 1993, 71, 39–64. [Google Scholar] [CrossRef]
  24. Puvvada, S.; Blankschtein, D. , Molecular-Thermodynamic Approach to Predict Micellization, Phase-Behavior and Phase-Separation of Micellar Solutions. I. Application to Nonionic Surfactants. J. Chem. Phys. 1990, 92, 3710–3724. [Google Scholar] [CrossRef]
  25. Iyer, J.; Blankschtein, D. , Are Ellipsoids Feasible Micelle Shapes? An Answer Based on a Molecular-Thermodynamic Model of Nonionic Surfactant Micelles. J. Phys. Chem. B 2012, 116, 6443–6454. [Google Scholar] [CrossRef]
  26. Carale, T. R.; Pham, Q. T.; Blankschtein, D. , Salt Effects on Intramicellar Interactions and Micellization of Nonionic Surfactants in Aqueous Solutions. Langmuir 1994, 10, 109–121. [Google Scholar] [CrossRef]
  27. Menger, F. M. , On the Structure of Micelles. Acc. Chem. Res. 1979, 12, 111–117. [Google Scholar] [CrossRef]
  28. Aveyard, R.; Saleem, S. M. , Interfacial Tensions at Alkane-Aqueous Electrolyte Interfaces. J. Chem. Soc. Faraday Trans. I 1976, 72, 1609–1617. [Google Scholar] [CrossRef]
  29. Hermann, R. B. , Use of Solvent Cavity Area and Number of Packed Solvent Molecules around a Solute in Regard to Hydrocarbon Solubilities and Hydrophobic Interactions. Proc. Natl. Acad. Sci. U. S. A. 1977, 74, 4144–4145. [Google Scholar] [CrossRef]
  30. Reynolds, J. A.; Gilbert, D. B.; Tanford, C. , Empirical Correlation between Hydrophobic Free Energy and Aqueous Cavity Surface-Area. Proc. Natl. Acad. Sci. U. S. A. 1974, 71, 2925–2927. [Google Scholar] [CrossRef]
  31. Sharp, K. A.; Nicholls, A.; Fine, R. F.; Honig, B. , Reconciling the Magnitude of the Microscopic and Macroscopic Hydrophobic Effects. Science 1991, 252, 106–109. [Google Scholar] [CrossRef]
  32. Flory, P. J. , Thermodynamics of high polymer solutions. J. Chem. Phys. 1941, 9, 660–661. [Google Scholar] [CrossRef]
  33. Huggins, M. L. , Solutions of long chain compounds. J. Chem. Phys. 1941, 9, 440. [Google Scholar] [CrossRef]
  34. Flory, P. J. , Principles of Polymer Chemistry. Cornell University Press: New York, 1953.
  35. Hildebrand, J. H. , The Entropy of Solution of Molecules of Different Size. J. Chem. Phys. 1947, 15, 225–228. [Google Scholar] [CrossRef]
  36. Chan, H. S.; Dill, K. A. , Solvation: How to obtain microscopic energies from partitioning and solvation experiments. Annu. Rev. Biophys. Biomol. Struct. 1997, 26, 425–459. [Google Scholar] [CrossRef] [PubMed]
  37. Ben-Naim, A. , Standard Thermodynamics of Transfer. Uses and Misuses. J. Phys. Chem. 1978, 82, 792–803. [Google Scholar] [CrossRef]
  38. Ben-Naim, A. , Molecular Theory of Solutions. Oxford University Press: New York, 2006.
  39. Ott, J. B.; Boerio-Goates, J. , Chemical Thermodynamics - Principles and Applications. Academic Press: San Diego, USA, 2000.
  40. Moore, W. J. , Physical Chemistry. Longmans: London, 1962.
  41. Özcan, M. , Why Equilibrium Constants Are Unitless. J. Phys. Chem. Lett. 2022, 13, 3507–3509. [Google Scholar] [CrossRef]
  42. Phillips, J. N. , The Energetics of Micelle Formation. Trans. Faraday Soc. 1955, 51, 561–569. [Google Scholar] [CrossRef]
  43. Semenov, A. N. , Contribution to the Theory of Microphase Layering in Block-Copolymer Melts. Sov. Phys. JETP 1985, 61, 733–742. [Google Scholar]
  44. Dill, K. A.; Flory, P. J. , Molecular-Organization in Micelles and Vesicles. Proc. Natl. Acad. Sci. U. S. A. 1981, 78, 676–680. [Google Scholar] [CrossRef]
  45. Sanner, M. F.; Olson, A. J.; Spehner, J. C. , Reduced surface: An efficient way to compute molecular surfaces. Biopolymers 1996, 38, 305–320. [Google Scholar] [CrossRef]
  46. Lee, B.; Richards, F. M. , Interpretation of Protein Structures: Estimation of Static Accessibility. J. Mol. Biol. 1971, 55, 379–400. [Google Scholar] [CrossRef] [PubMed]
  47. Richards, F. M. , Areas, Volumes, Packing, and Protein-Structure. Annu. Rev. Biophys. Bioeng. 1977, 6, 151–176. [Google Scholar] [CrossRef] [PubMed]
  48. Greer, J.; Bush, B. L. , Macromolecular Shape and Surface Maps by Solvent Exclusion. Proc. Natl. Acad. Sci. U. S. A. 1978, 75, 303–307. [Google Scholar] [CrossRef]
  49. Connolly, M. L. , Analytical Molecular Surface Calculation. J. Appl. Cryst. 1983, 16, 548–558. [Google Scholar] [CrossRef]
  50. McAuliffe, C. , Solubility in Water of Paraffin, Cycloparaffin, Olefin, Acetylene, Cycloolefin, and Aromatic Hydrocarbons. J. Phys. Chem. 1966, 70, 1267–1275. [Google Scholar] [CrossRef]
  51. Aucejo, A.; Burguet, M. C.; Munoz, R.; Marques, J. L. , Densities, Viscosities, and Refractive Indices of Some n-Alkane Binary Liquid Systems at 298.15 K. J. Chem. Eng. Data 1995, 40, 141–147. [Google Scholar] [CrossRef]
  52. De Young, L. R.; Dill, K. A. , Partitioning of Nonpolar Solutes into Bilayers and Amorphous n-Alkanes. J. Phys. Chem. 1990, 94, 801–809. [Google Scholar] [CrossRef]
  53. Tunón, I.; Silla, E.; Pascual-Ahuir, J. L. , Molecular Surface Area and Hydrophobic Effect. Prot. Eng. 1992, 5, 715–716. [Google Scholar] [CrossRef]
  54. De Grip, W. J.; Bovee-Geurts, P. H. M. , Synthesis and Properties of Alkylglucosides with Mild Detergent Action: Improved Synthesis and Purification of β-1-Octyl-, -Nonyl-, and -Decyl-Glucose. Synthesis of β-1-Undecylglucose and β-1-Dodecylmaltose. Chem. Phys. Lipids 1979, 23, 321–335. [Google Scholar] [CrossRef]
  55. Barrat, J.-L.; Hansen, J.-P. Basic Concepts for Simple and Complex Liquids. Cambridge University Press: Cambridge, UK, 2003. [Google Scholar]
Figure 1. Illustration of the pseudo-chemical potential (PCP) concept according to Ben-Naim [37,38]: The process of adding a micelle to a solution of micelles is carried out in two steps. First, a micelle is inserted at a fixed position R 0 . Second, the micelle is released and allowed to wander in the entire solution. The difference μ η is the liberation free energy. (a) Case of a pure phase of micelle hydrates (red with blue hydration shells). The phase is probably more condensed than suggested by the figure, but the micelle hydrates are not allowed to interact. (b) Case of micelles (red) in an aqueous solution (water, blue background) containing cosolutes (yellow). In this phase, the solutes are probably less condensed in reality than suggested by the figure.
Preprints 118957 g001
Figure 2. Thermodynamic cycle for the formation of a micelle (D) from detergent monomers (A) via the virtual intermediate states (B) and (C) corresponding to monomers with separated head groups (red) and an alkane droplet in water, respectively.
Preprints 118957 g002
Figure 3. Dependence of SASA and SESA values for alkanes (Table 1) on the number n
Preprints 118957 g003
Figure 4. Correlation of β μ ~ H a q μ ~ H h representing the solubility of alkanes from n-pentane to n-octane in water ( T = 298.15 K) with (a) the SASA or (b) the SESA of the alkane molecules (cf. Table 1). f = X H corresponds to an ideal mixing model and f = Y H to a Flory-Huggins model for the alkane in water. Figures and linear regressions made with SigmaPlot 13 (© 2014 Systat Software Inc.).
Preprints 118957 g004
Figure 5. Correlation of Γ and Φ defined in Eq. (67) and (65), respectively. The slope corresponds to the surface tension σ S E S A representing the contact of hydrophobic molecular surfaces with water. (a) Linear regression with free intercept. (b) Linear regression with the intercept fixed to 3.7. Figures and linear regressions made with SigmaPlot 13 (© 2014 Systat Software Inc.).
Preprints 118957 g005
Table 1. SASA and SESA values (Å2) for alkanes with n carbon atoms computed with the MSMS program [45] (for details, see SM S4).
n SASA SESA
2 197.708 80.386
3 230.336 100.662
4 262.777 120.903
5 295.248 141.159
6 327.515 161.338
7 359.942 181.592
8 397.300 204.457
9 425.002 222.204
10 457.362 242.415
11 492.184 263.975
12 522.711 283.188
Table 2. Data of linear alkanes (H) with n
n ρ H ing/cm3 a M H ing/mole b v H incm3/mole c ϕ = v H v W d ζ = M H M W e ξ · 10 6 f Υ · 10 6 χ · 10 6 Y H · 10 6 X H · 10 6
5 0.62124 72.151 116.140 6.429 4.005 38.5 ± 2.0 61.802 9.613 61.798 9.613
6 0.65507 86.178 131.555 7.283 7.283 9.5 ± 1.3 14.462 1.304 14.462 1.304
7 0.67965 100.205 147.436 8.162 8.162 2.93 ± 0.20 4.300 0.359 4.300 0.359
8 0.69842 144.232 163.558 9.054 9.054 0.66 ± 0.942 0.942 0.073 0.942 0.073
a Mass density of pure liquid alkane at 298.15 K; data from [51]. b Molar mass of alkane. c Molar volume of liquid alkane at 298.15 K. d Molar volume ratio. e Molar mass ratio. f Experimentally determined mass ratio in saturated aqueous solution at 298.15 K; data from [50].
Table 3. Values for the surface tension σ M (in mN/m) obtained from correlating β μ ~ H a q μ ~ H h representing the solubility of alkanes from n-pentane to n-octane in water ( T = 298.15 K) with the SASA or the SESA of the alkane molecules. If s is the slope of the corresponding line in Figure 4, then σ M = s / β . The errors originate from linear regression.
β μ ~ H a q μ ~ H h SASA SESA
ln X H 19.8 ± 1.6 31.9 ± 2.4
ln Y H 17.1 ± 1.2 27.4 ± 1.7
Table 4. Values for the surface tension σ S E S A (in mN/m, slope) obtained from correlating experimental CMC values with the SESA difference due to micelle formation. The errors originate from linear regression.
Source of experimental CMC data Slope / mN m−1 Intercept Slope with intercept fixed to 3.7 / mN m−1
[14,15] 29.8 ± 0.8 4.0 ± 0.5 29.1 ± 0.1
[2,54] 27.5 ± 0.9 3.4 ± 0.5 28.1 ± 0.2
Disclaimer/Publisher’s Note: The statements, opinions and data contained in all publications are solely those of the individual author(s) and contributor(s) and not of MDPI and/or the editor(s). MDPI and/or the editor(s) disclaim responsibility for any injury to people or property resulting from any ideas, methods, instructions or products referred to in the content.
Copyright: This open access article is published under a Creative Commons CC BY 4.0 license, which permit the free download, distribution, and reuse, provided that the author and preprint are cited in any reuse.
Prerpints.org logo

Preprints.org is a free preprint server supported by MDPI in Basel, Switzerland.

Subscribe

© 2024 MDPI (Basel, Switzerland) unless otherwise stated