Submitted:
23 September 2024
Posted:
24 September 2024
You are already at the latest version
Abstract
Keywords:
1. Introduction
2. Experimental Methods
- (1).
- To minimize the presence of impurities and other elements, the selected raw materials are high-purity metals with a purity of more than 99.9%. To account for the volatility of Al during the smelting process, additional 1% of Al is added to the batch to compensate for any losses.
- (2).
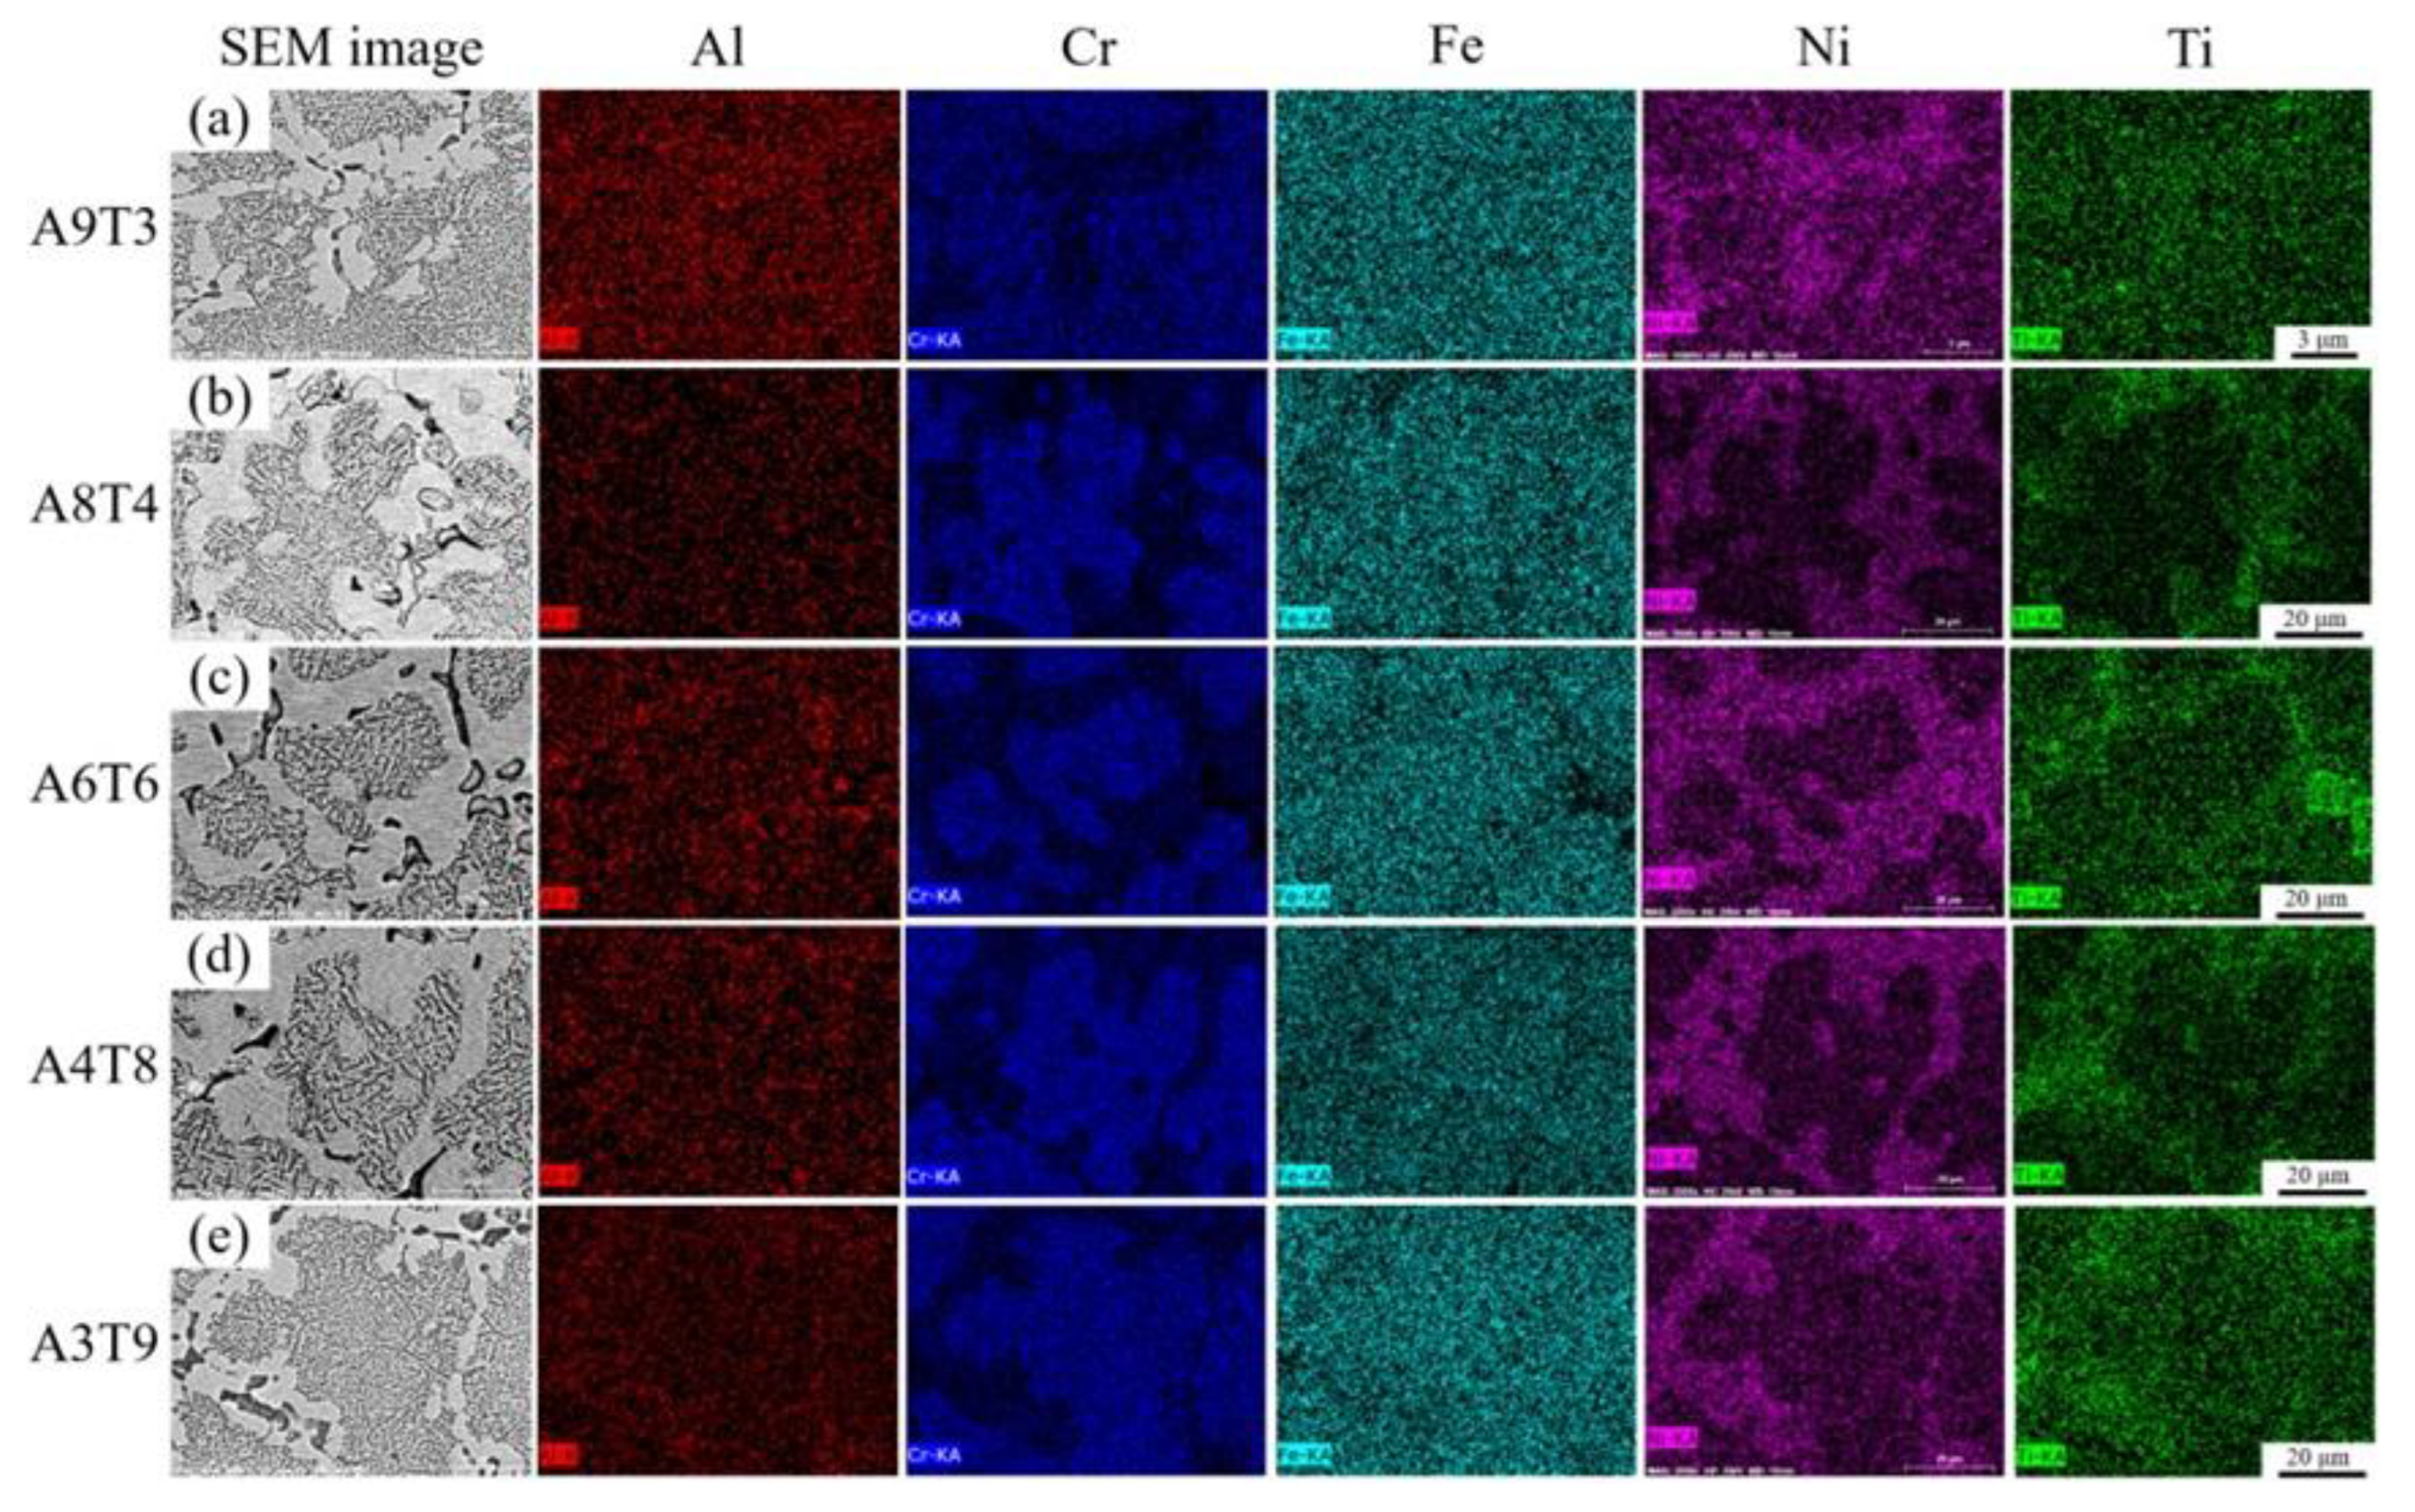
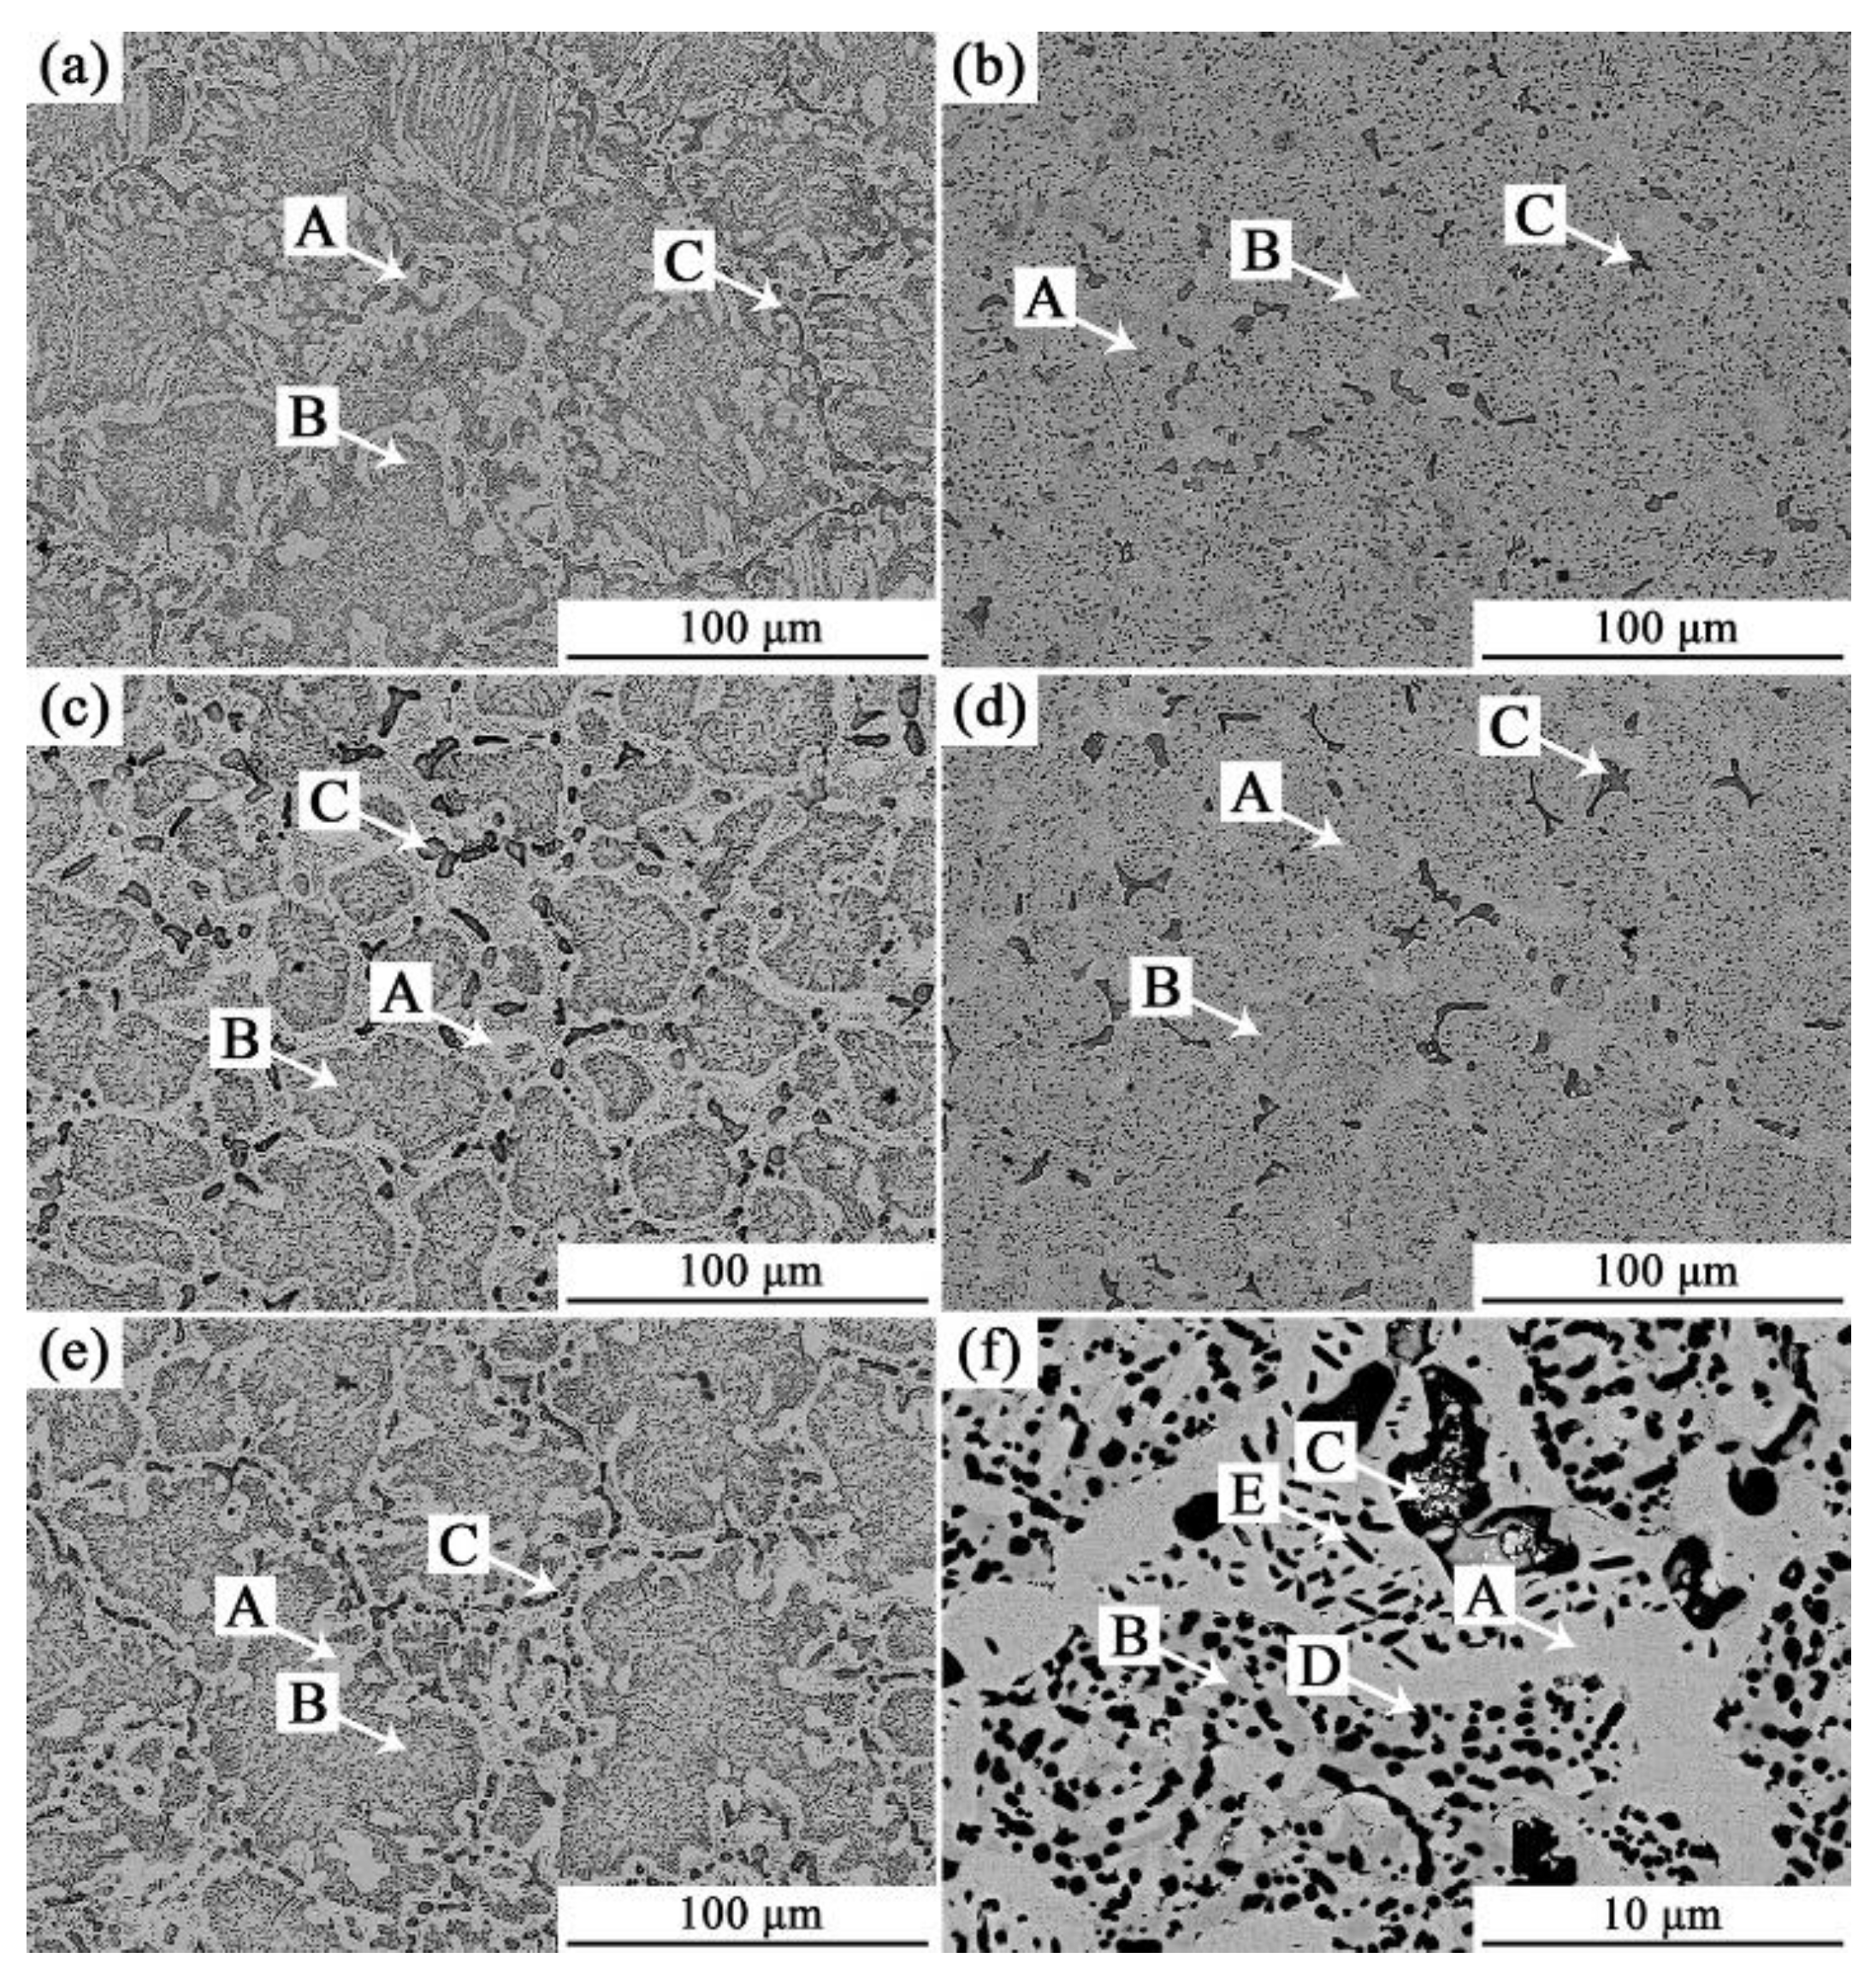
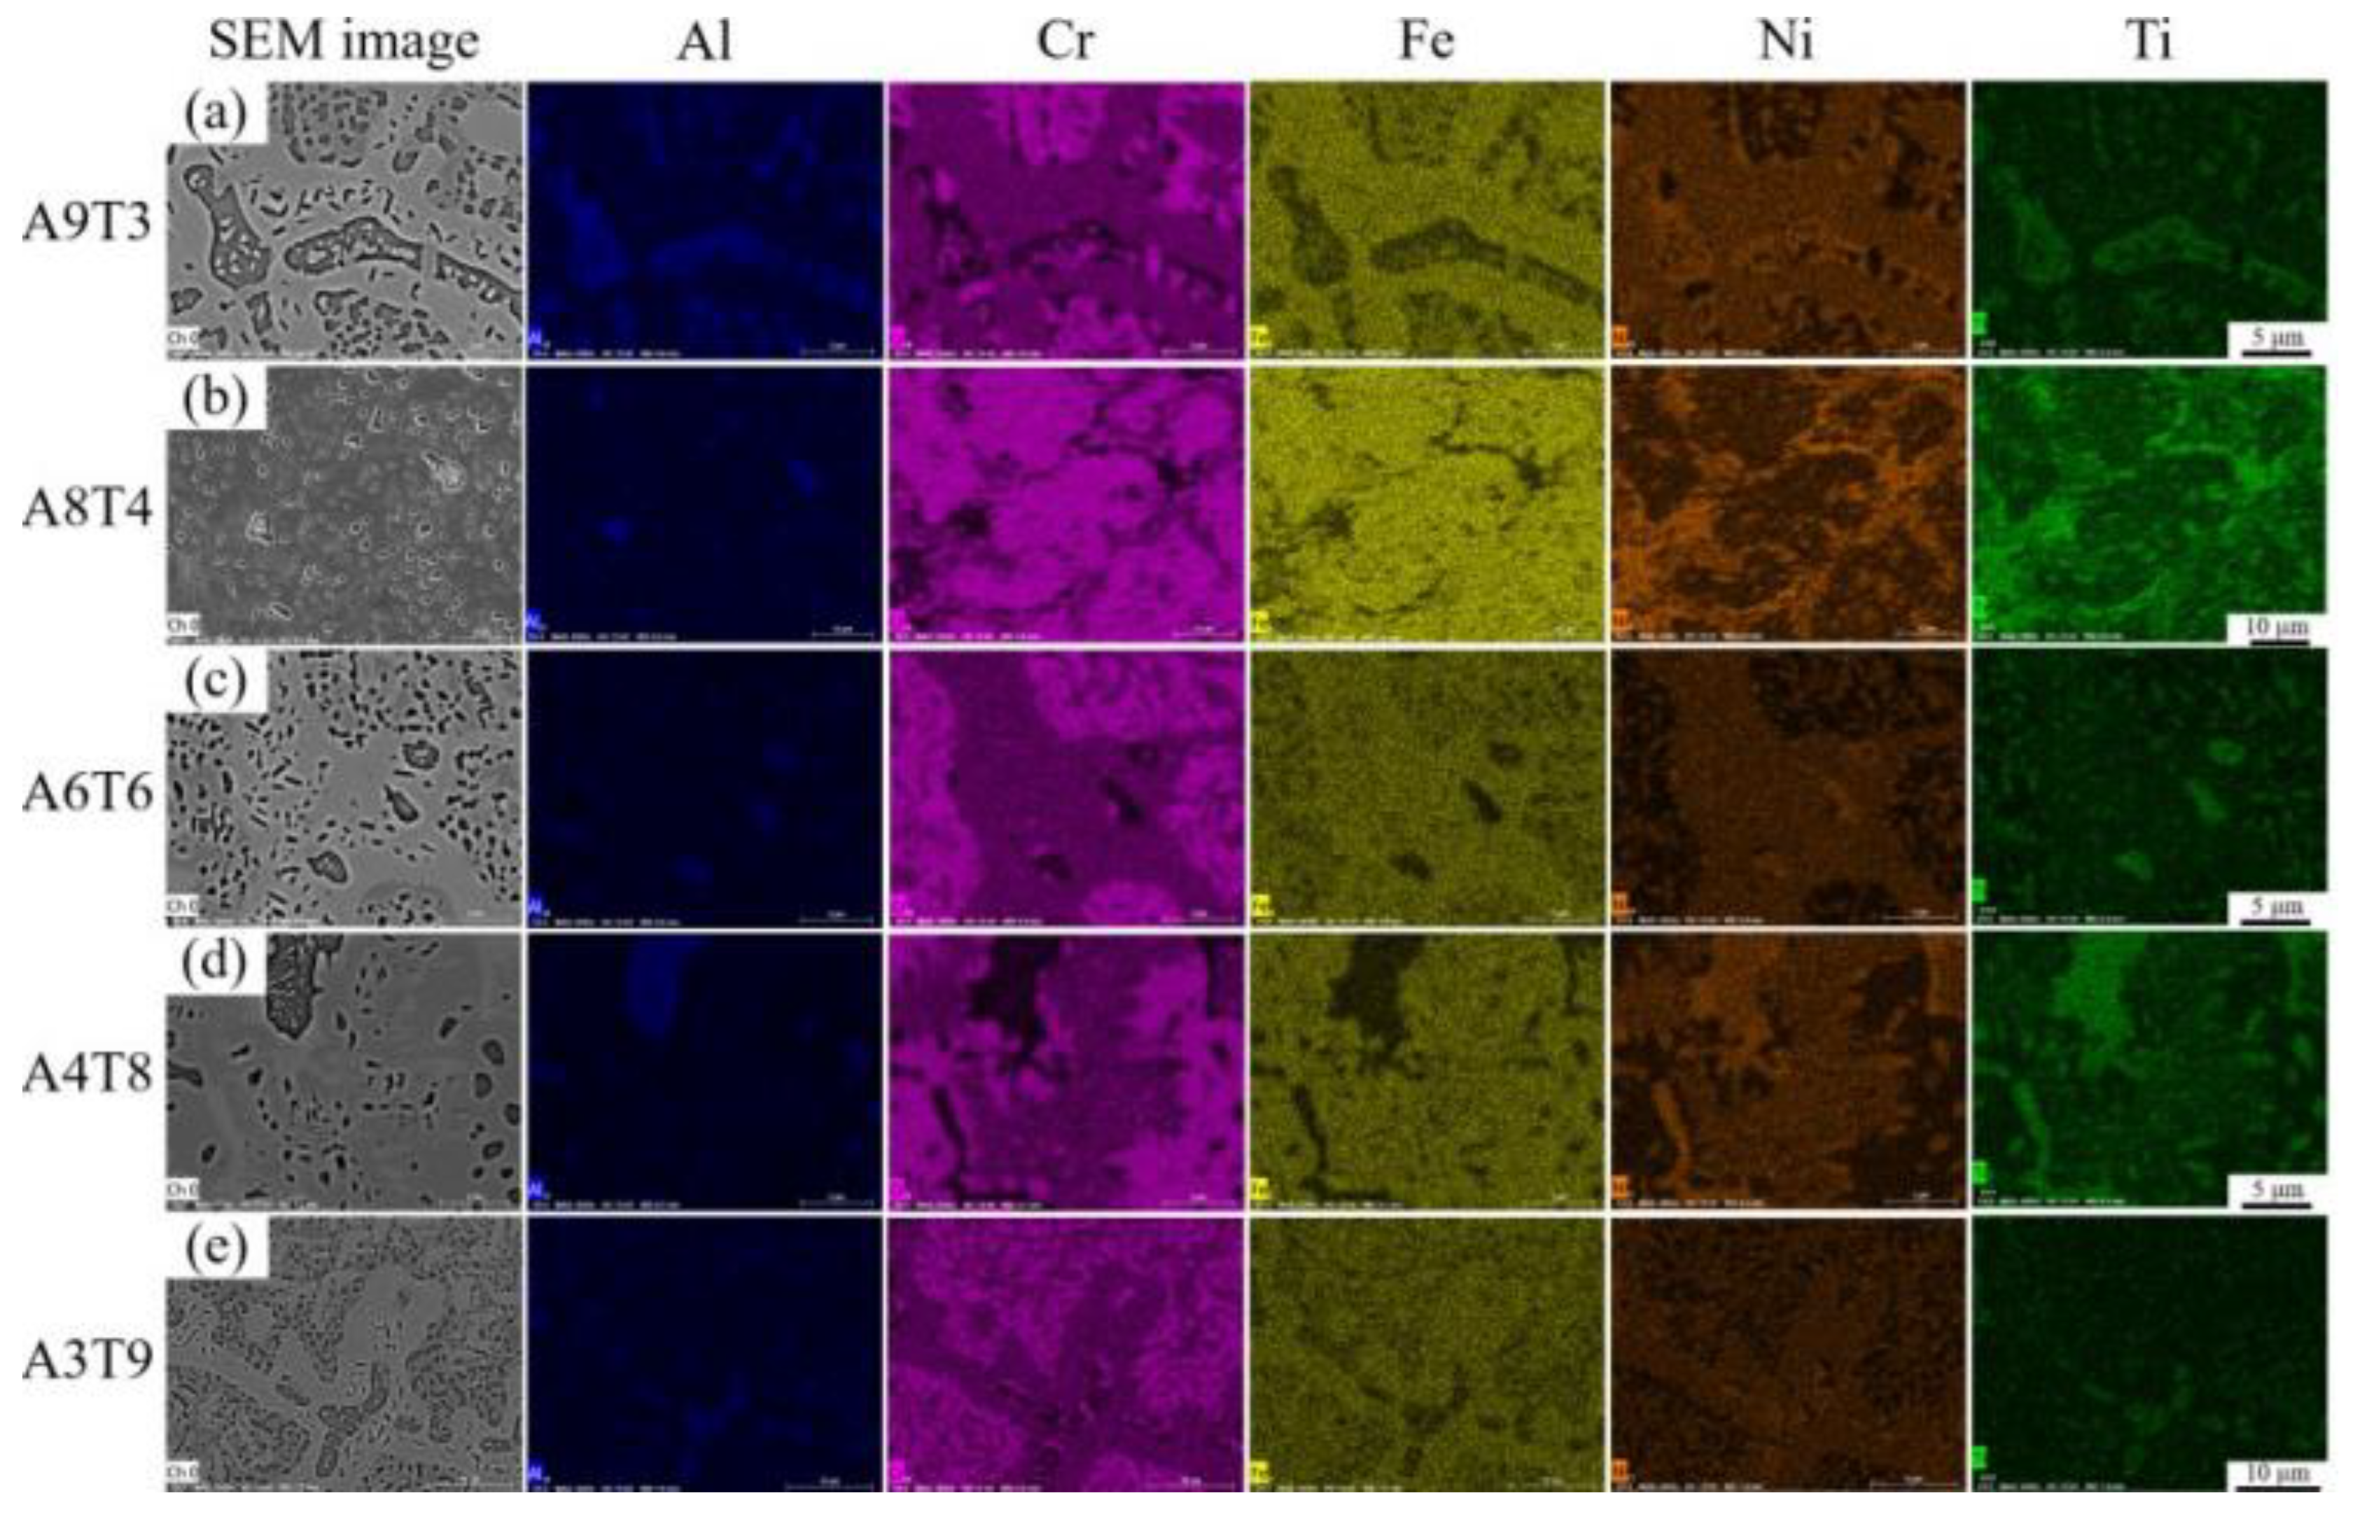
- The proportioning of the metal elements is baseed on the molar ratio, with the molar content of Al and Ti in the alloy adjusted while maintaining the constant ratio of Cr-Fe-Ni. Alx(CrFeNi)88Ti(12-x)(x=9,8,6,4,3) is abbreviated as A9T3, A8T4, A6T6, A4T8, and A3T9 in the following context. This study investigates the influence law of Al and Ti dual element alloying on the microstructure and compressive properties of the Cr-Fe-Ni medium-entropy alloy.
- (3).
- This study examines the impact of intermediate temperature annealing on the microstructure and compressive properties of the Cr-Fe-Ni medium-entropy alloy, and attempting to clarify the strengthening and deformation mechanisms of alloy.
- (4).
2.1. Alloy Sample Preparation Method
2.2. Homogenization Annealing
2.3. X-ray Diffraction Analysis
2.4. Scanning Electron Microscopy Analysis
2.5. Transmission Electron Microscopy Observation
2.6. Compression Performance Evaluation of Alloy at Room Temperature
3. Results and Discussions
3.1. Analysis of Phase and Surface Morphology
3.2. Analysis of Compressive Properties at Room Temperature
4. Conclusions
- 1)
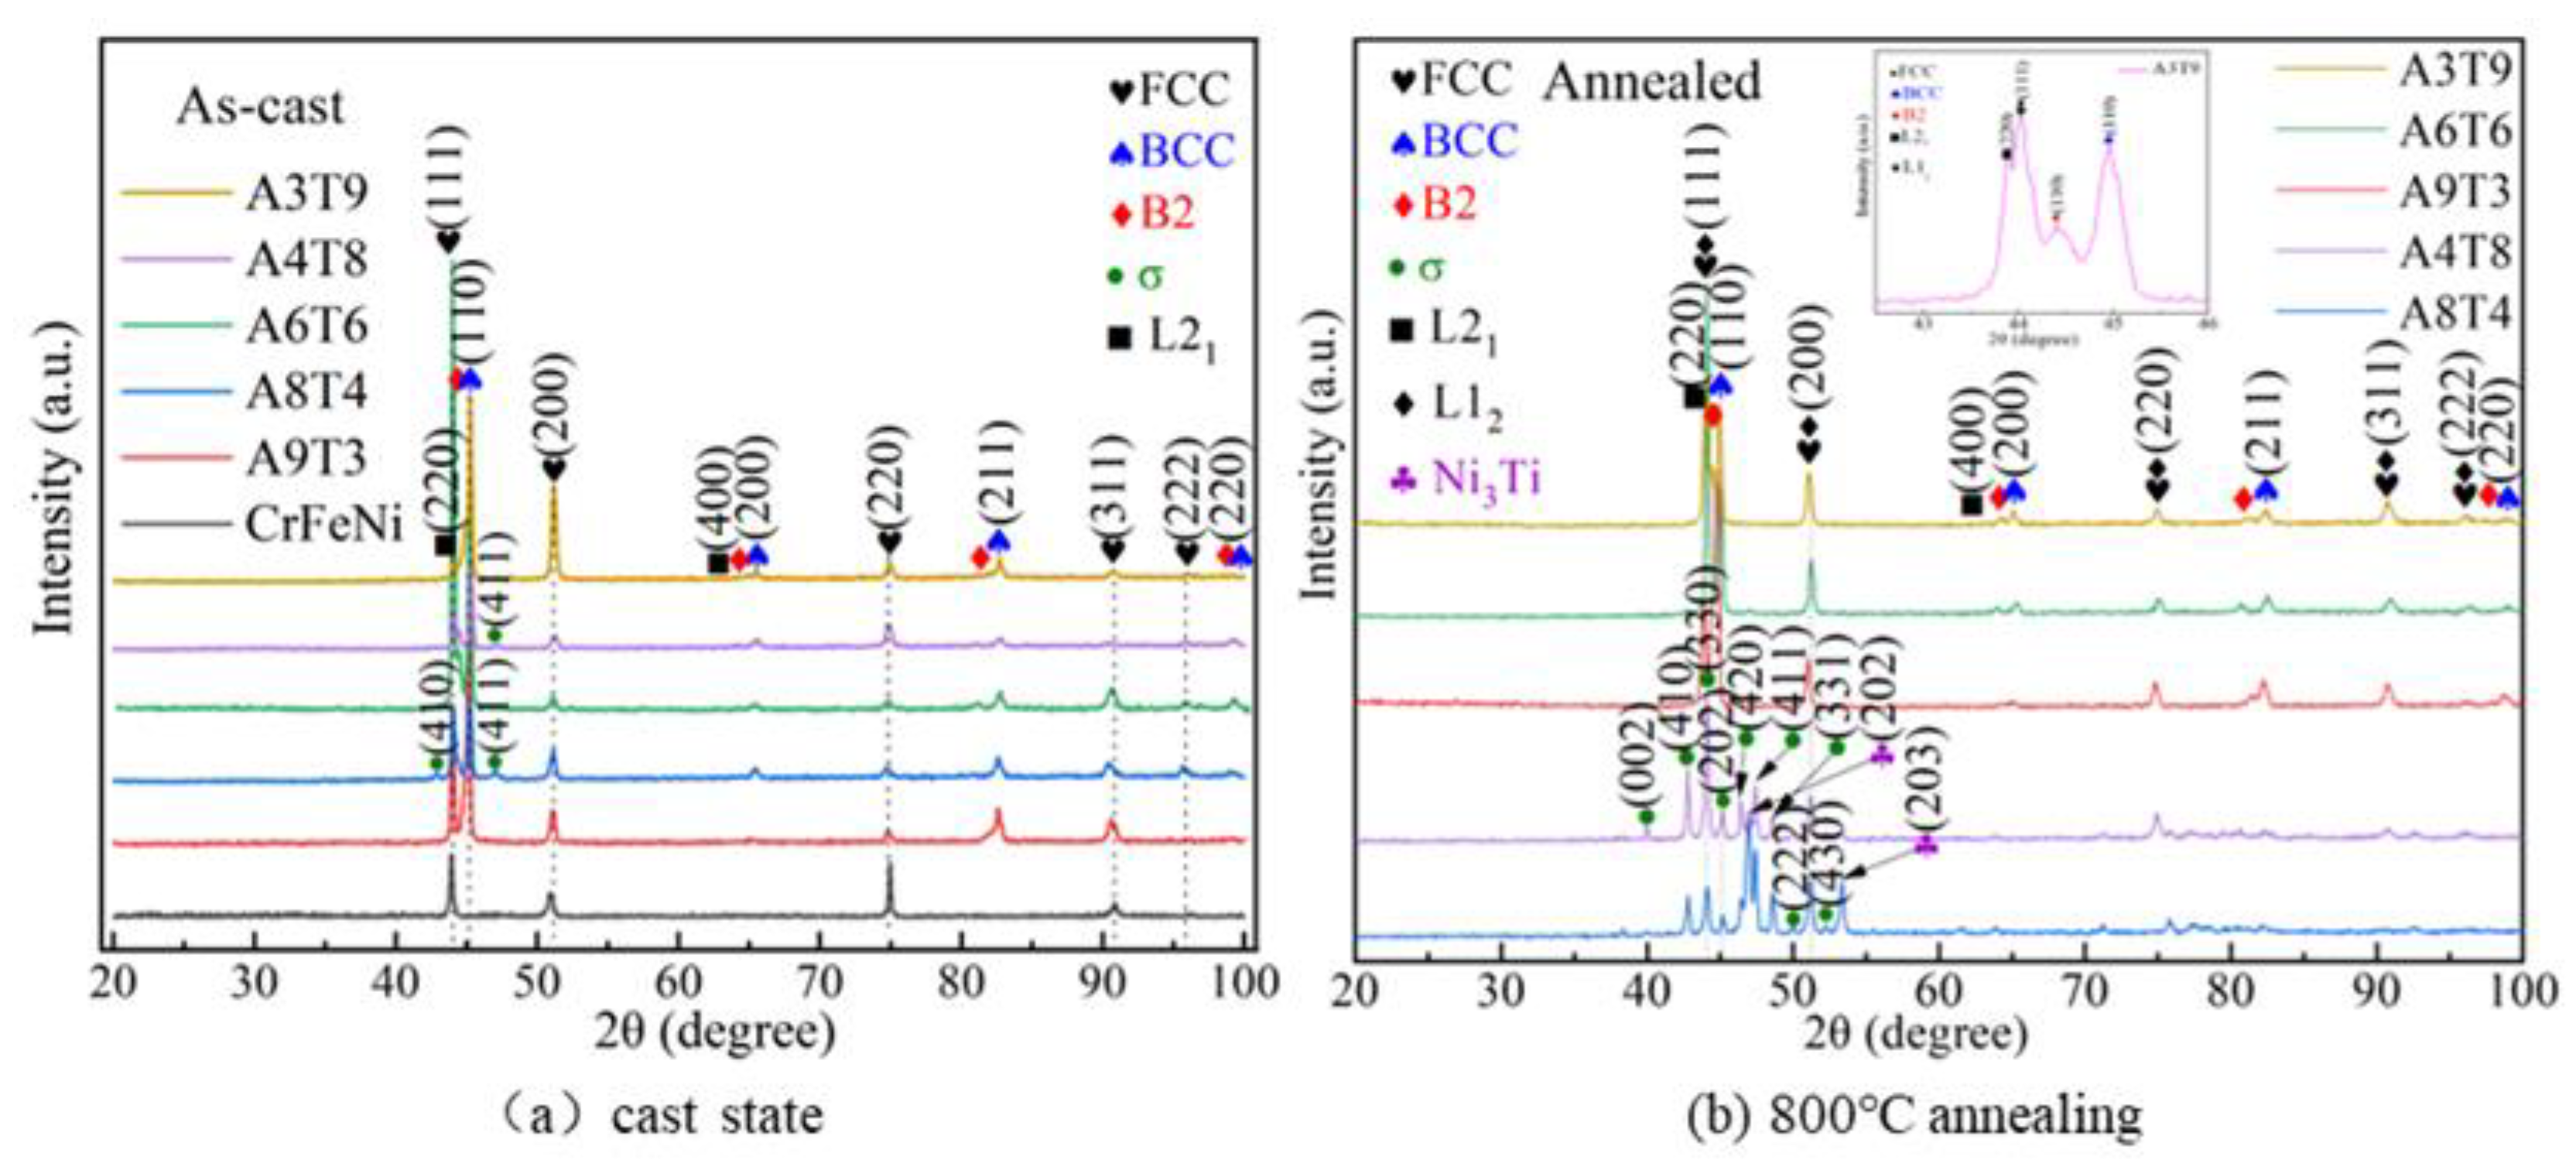
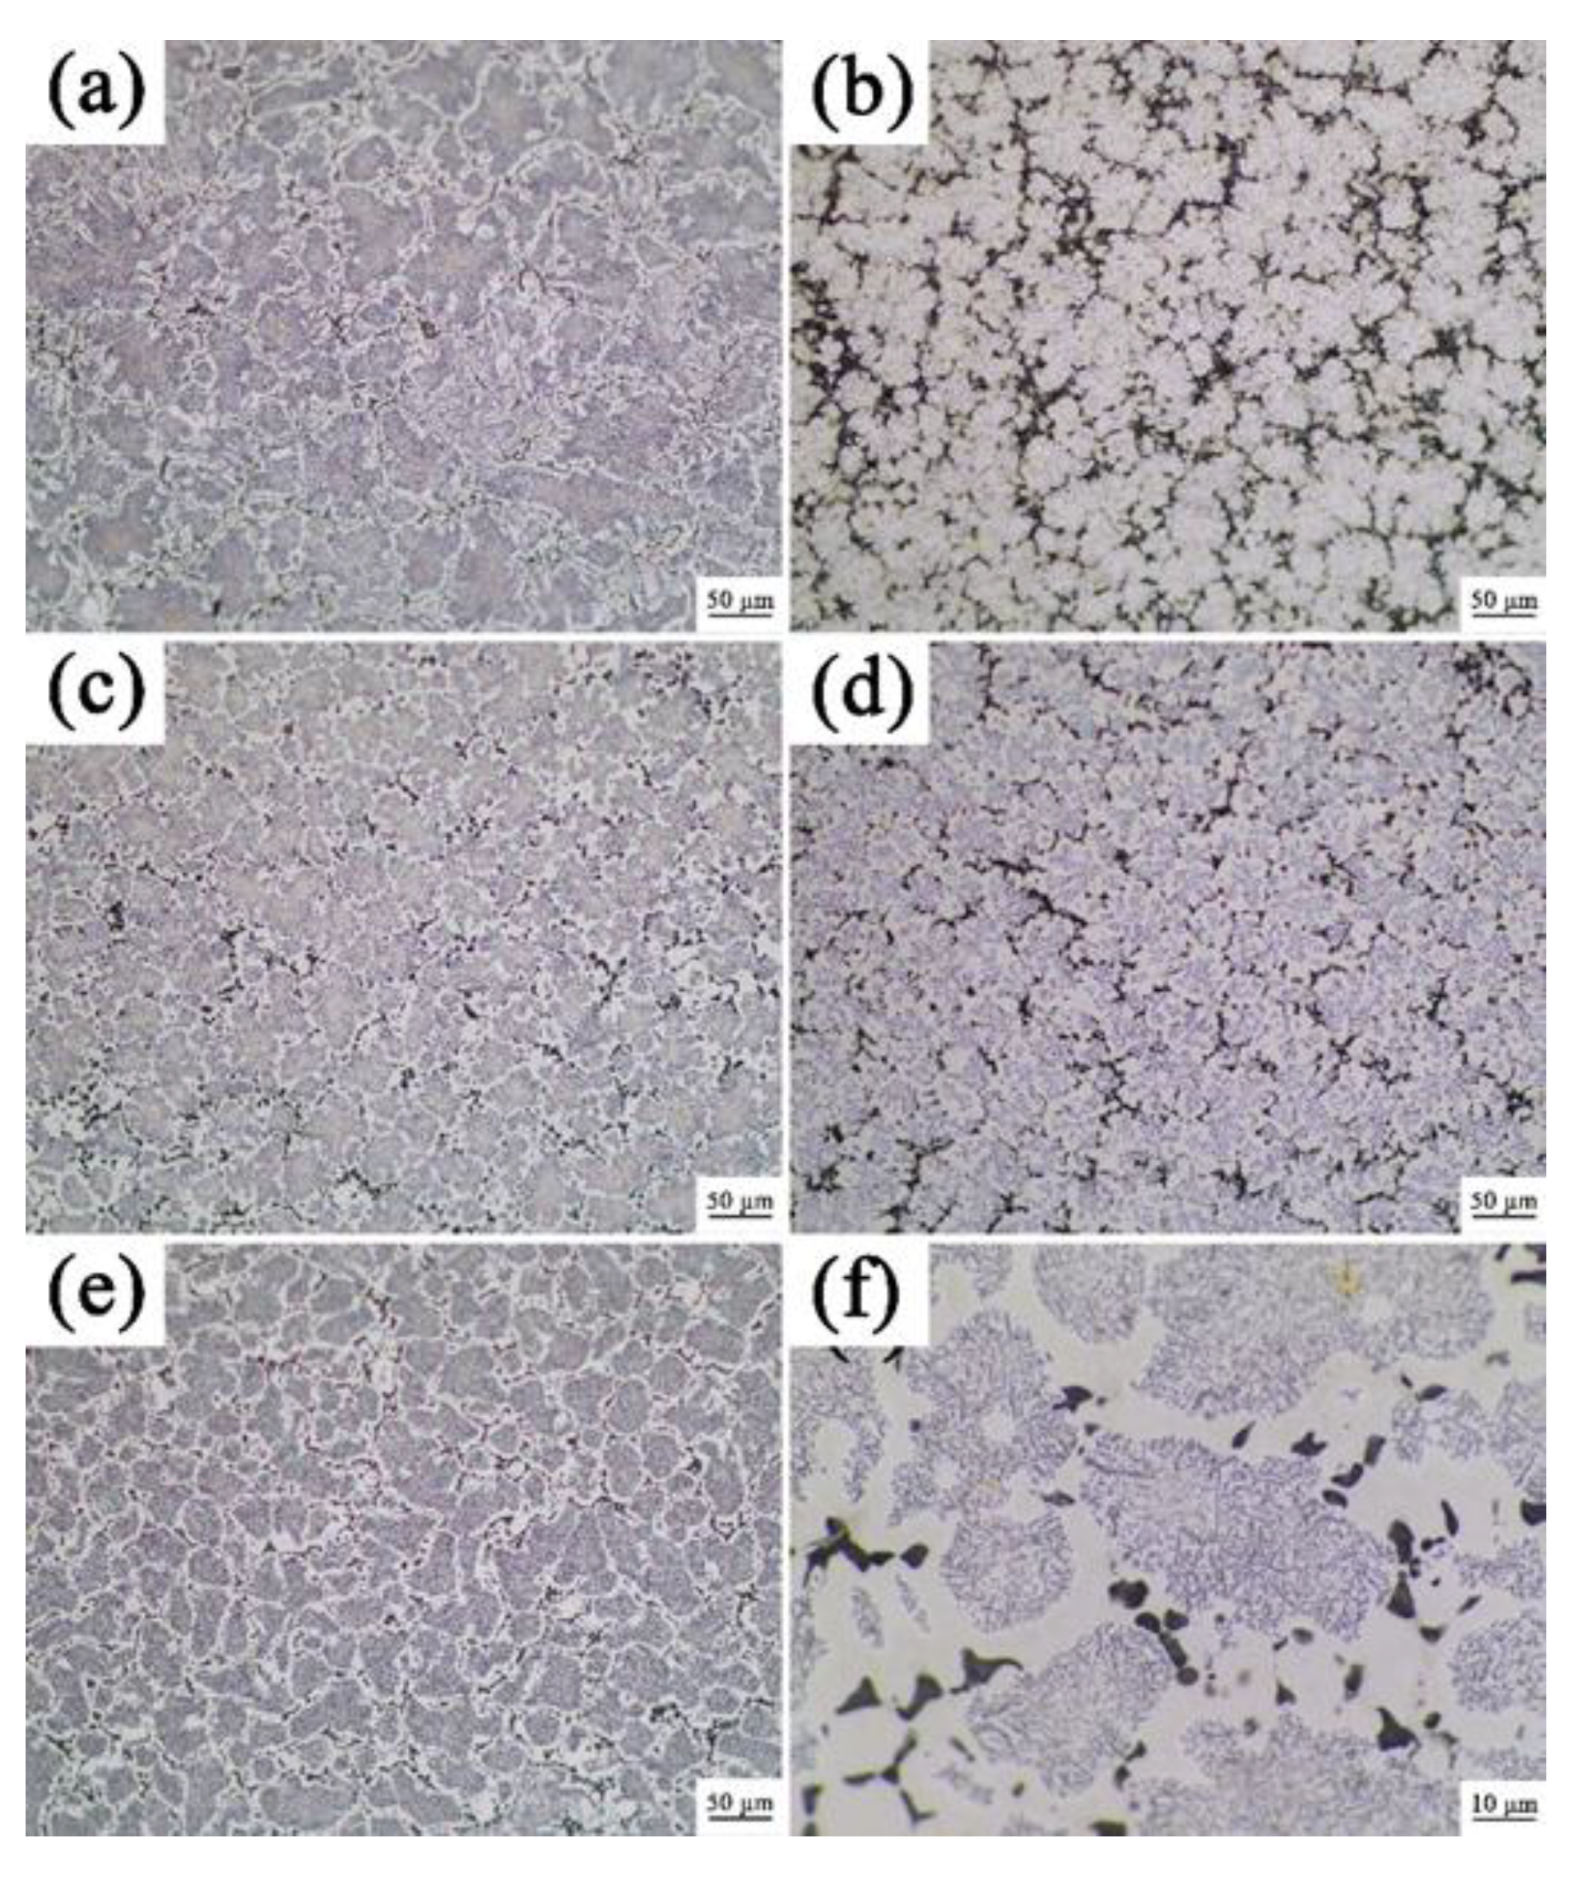
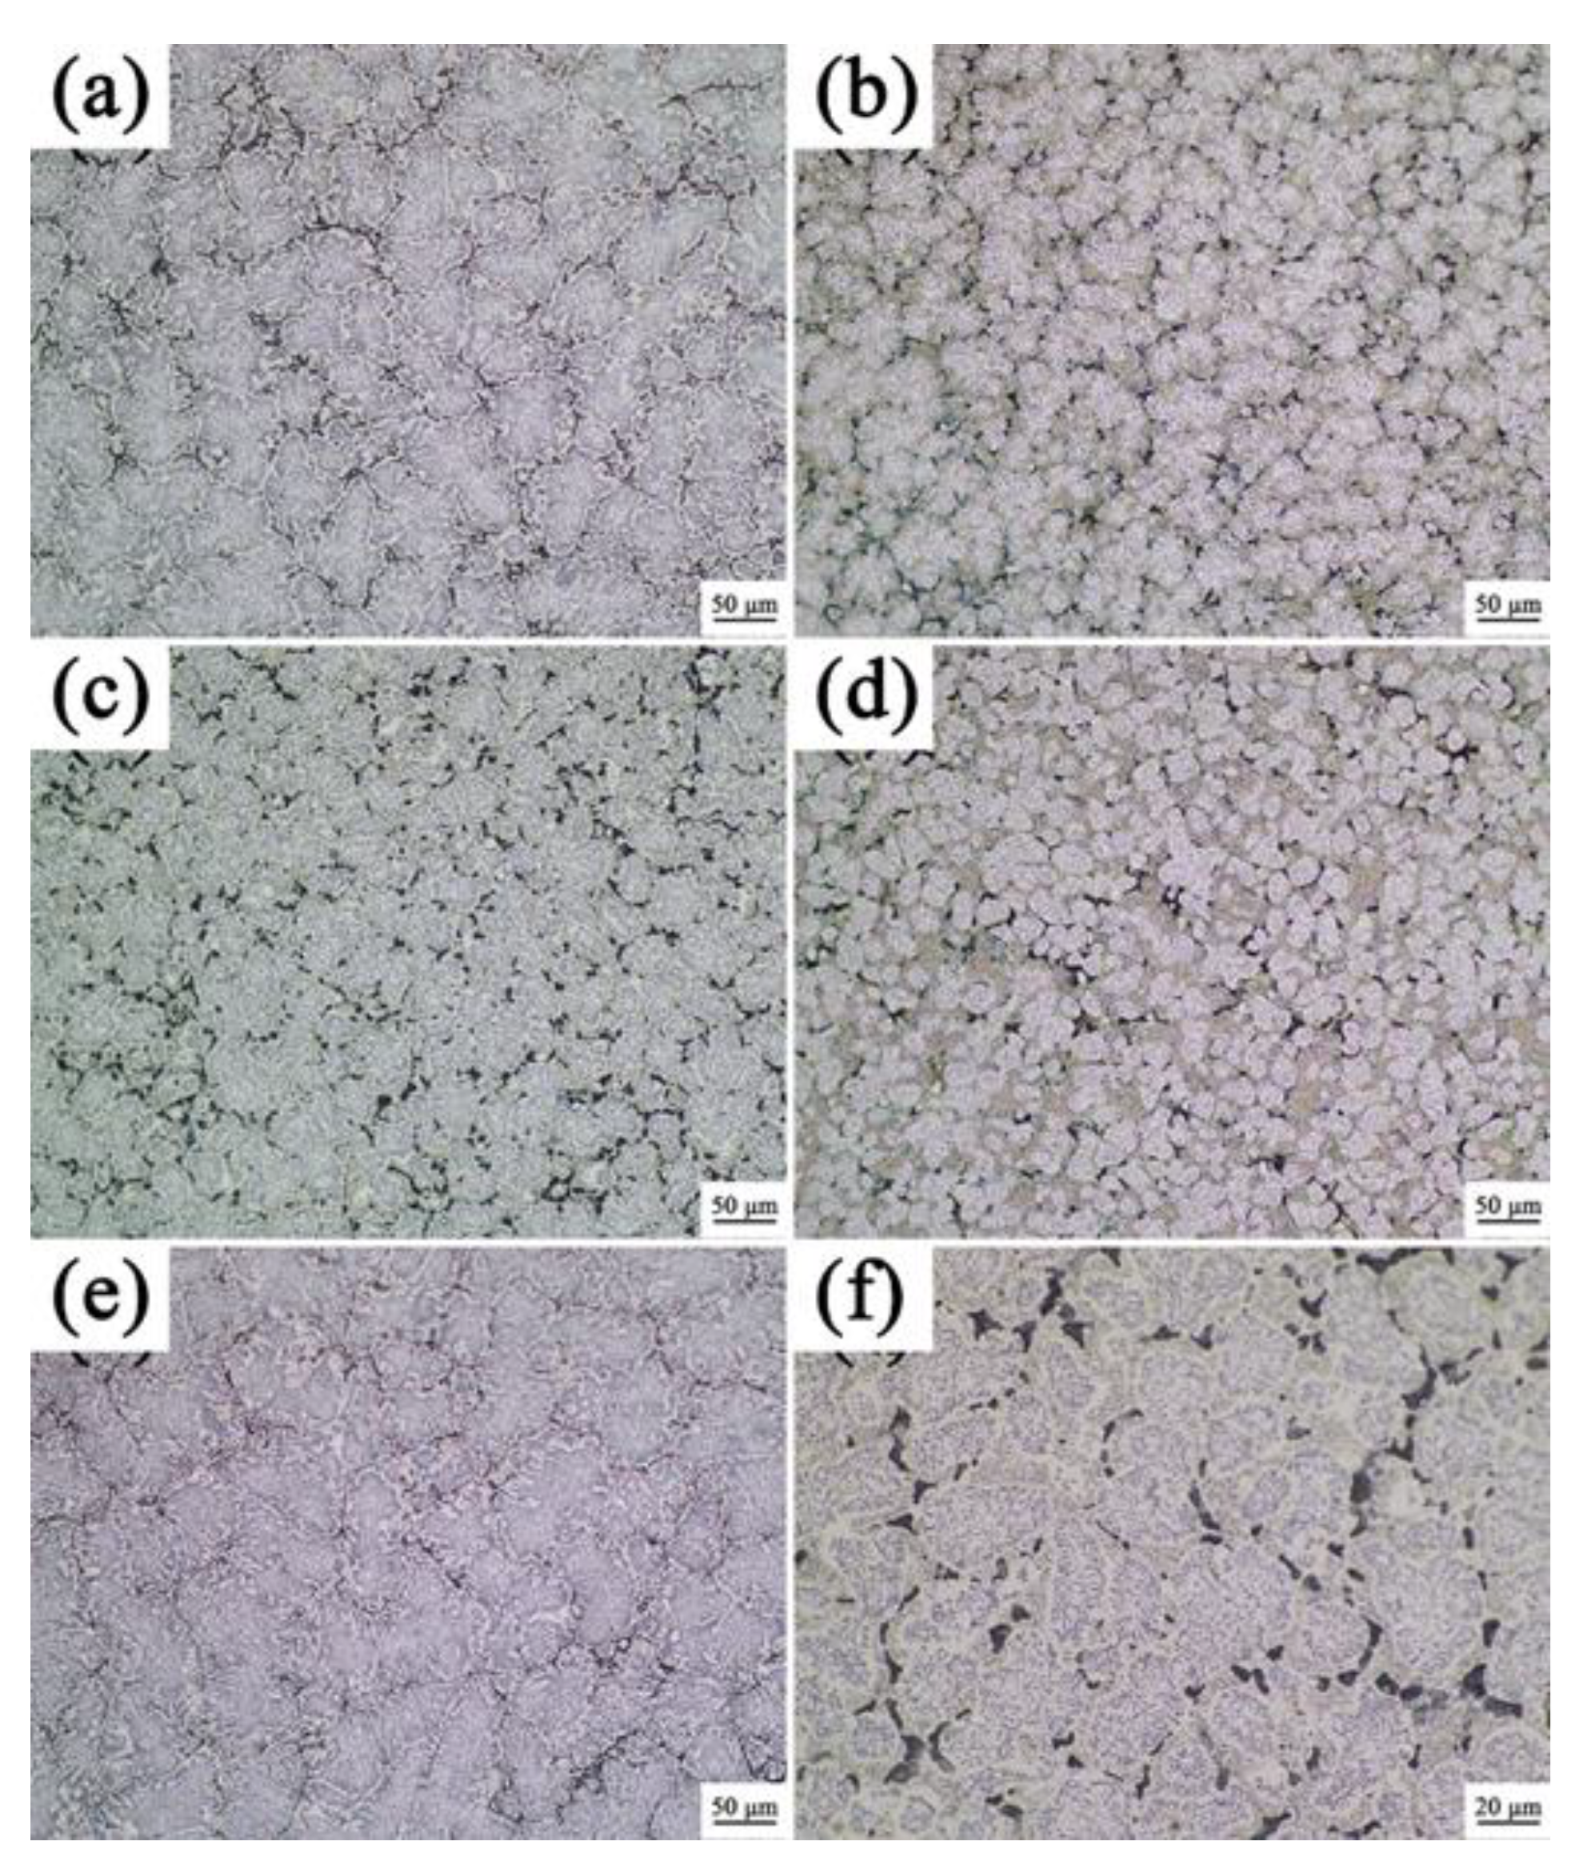
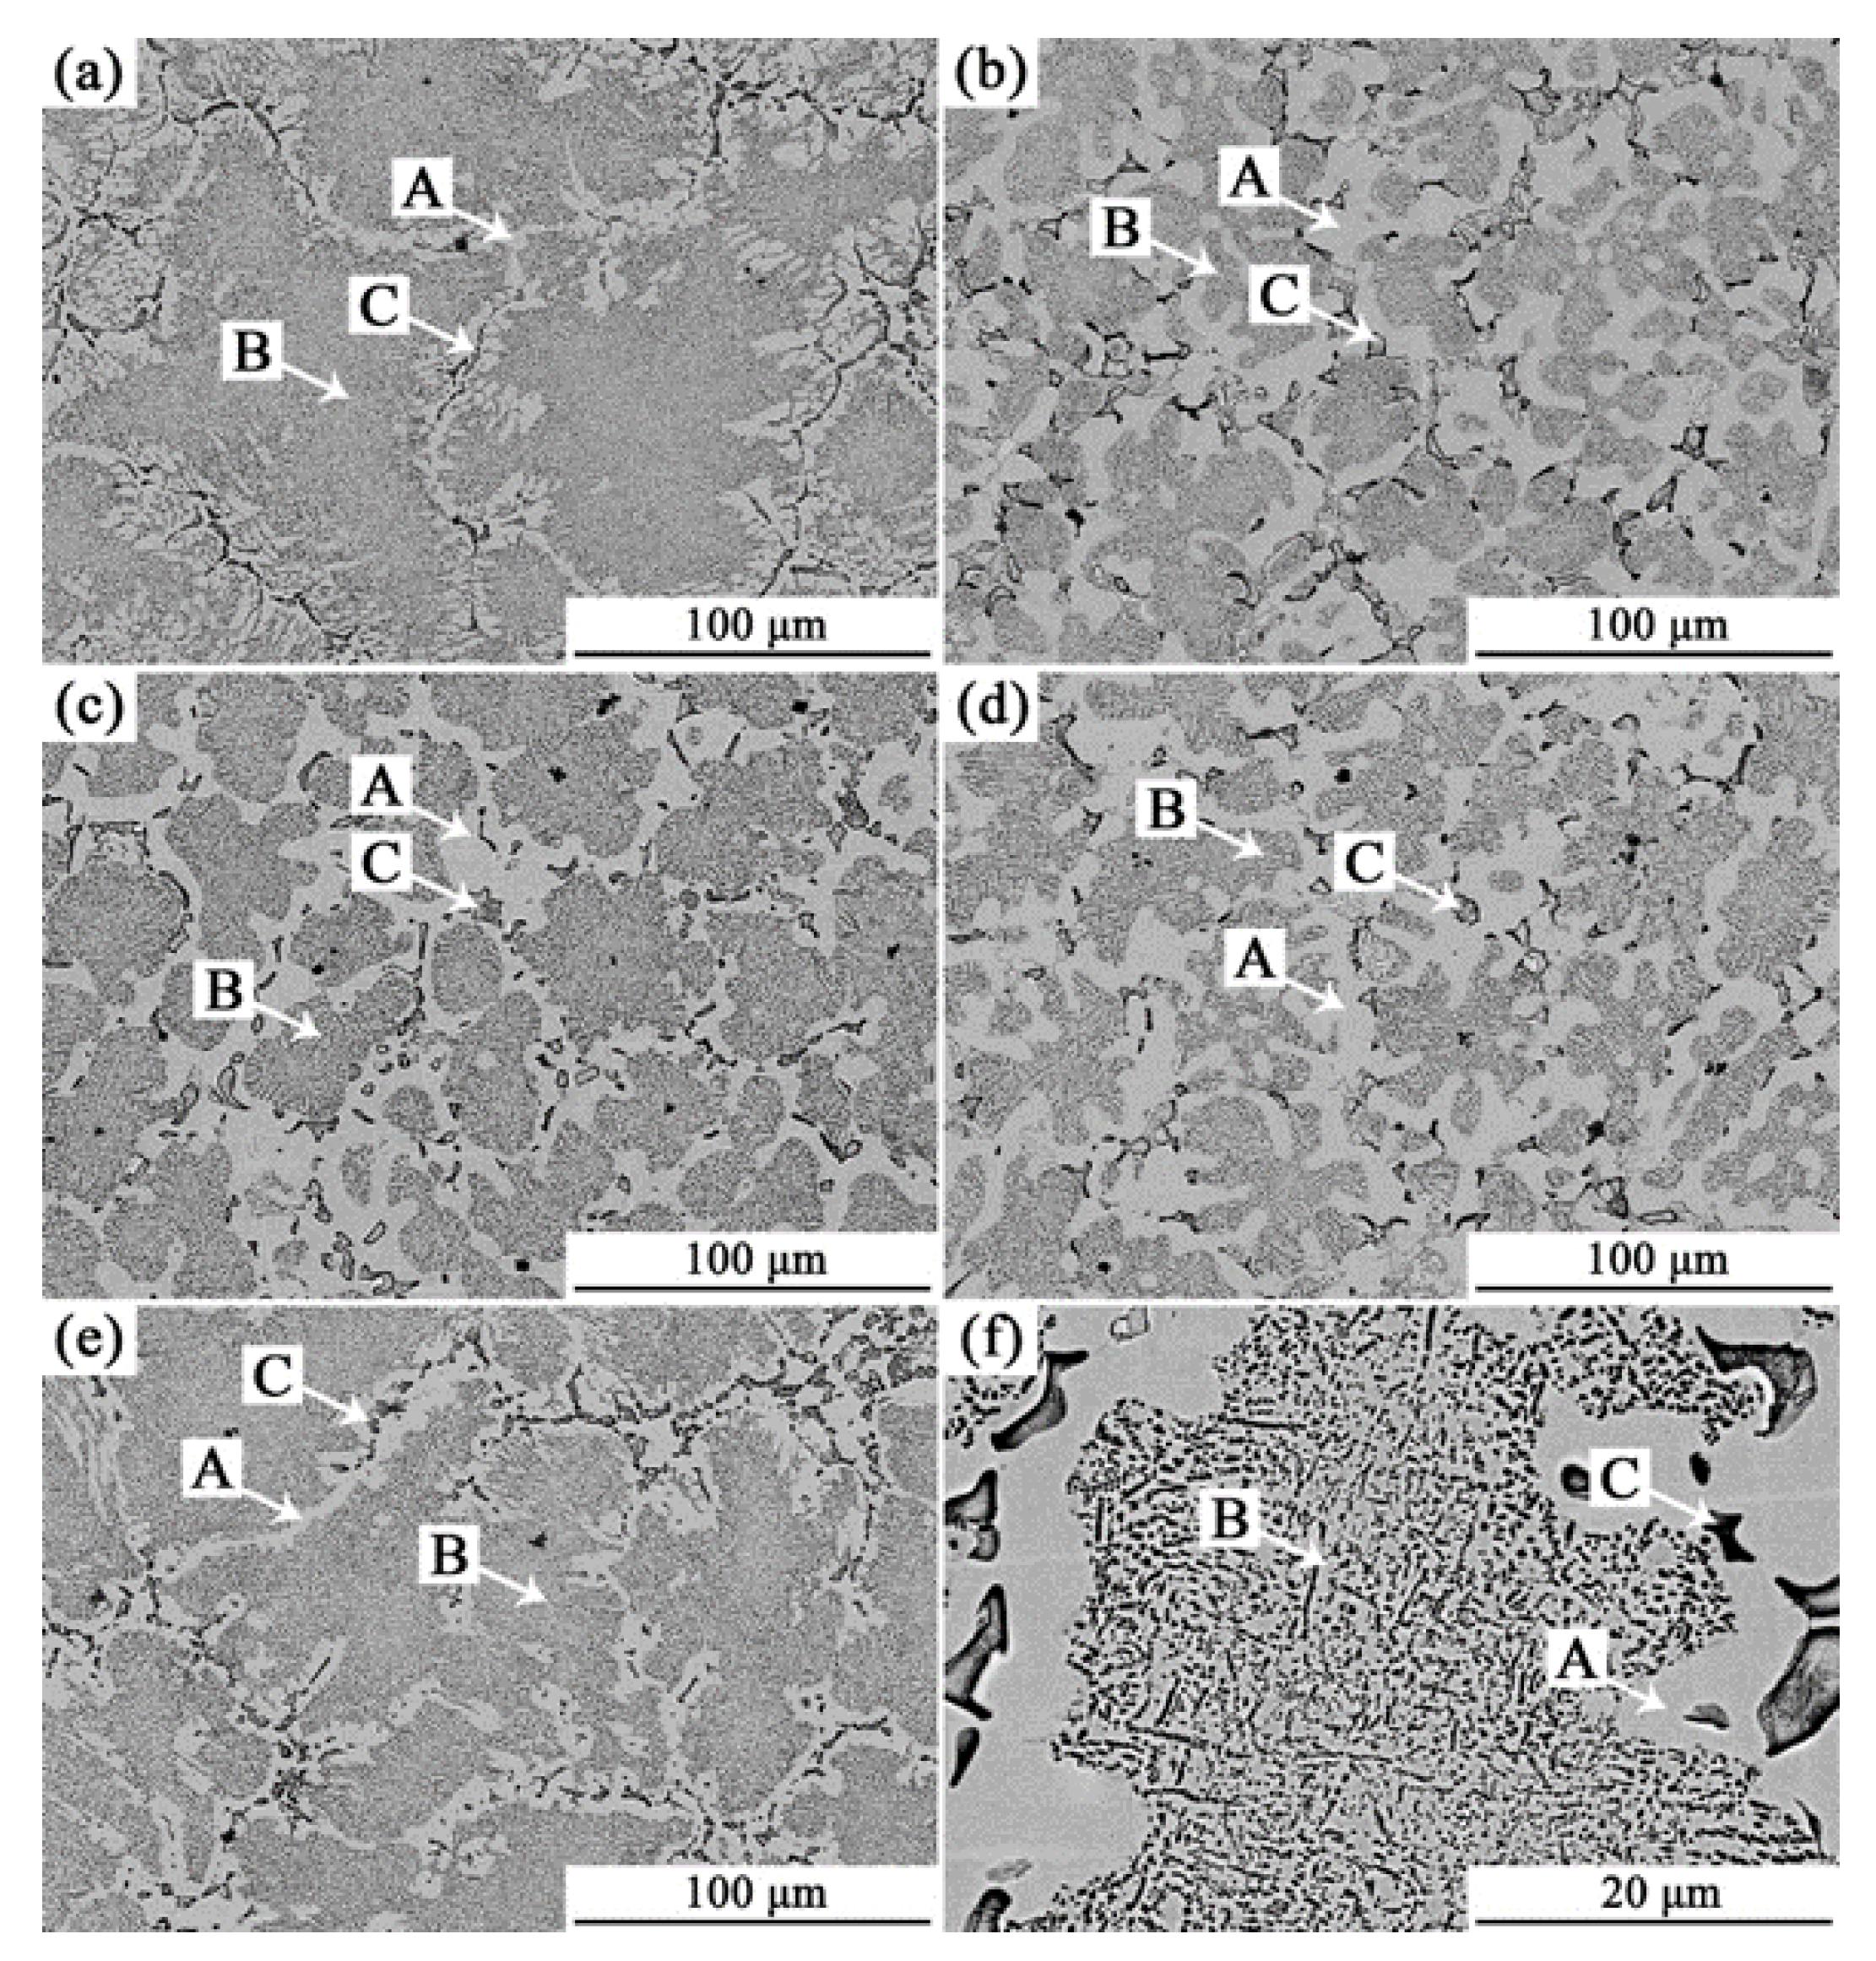
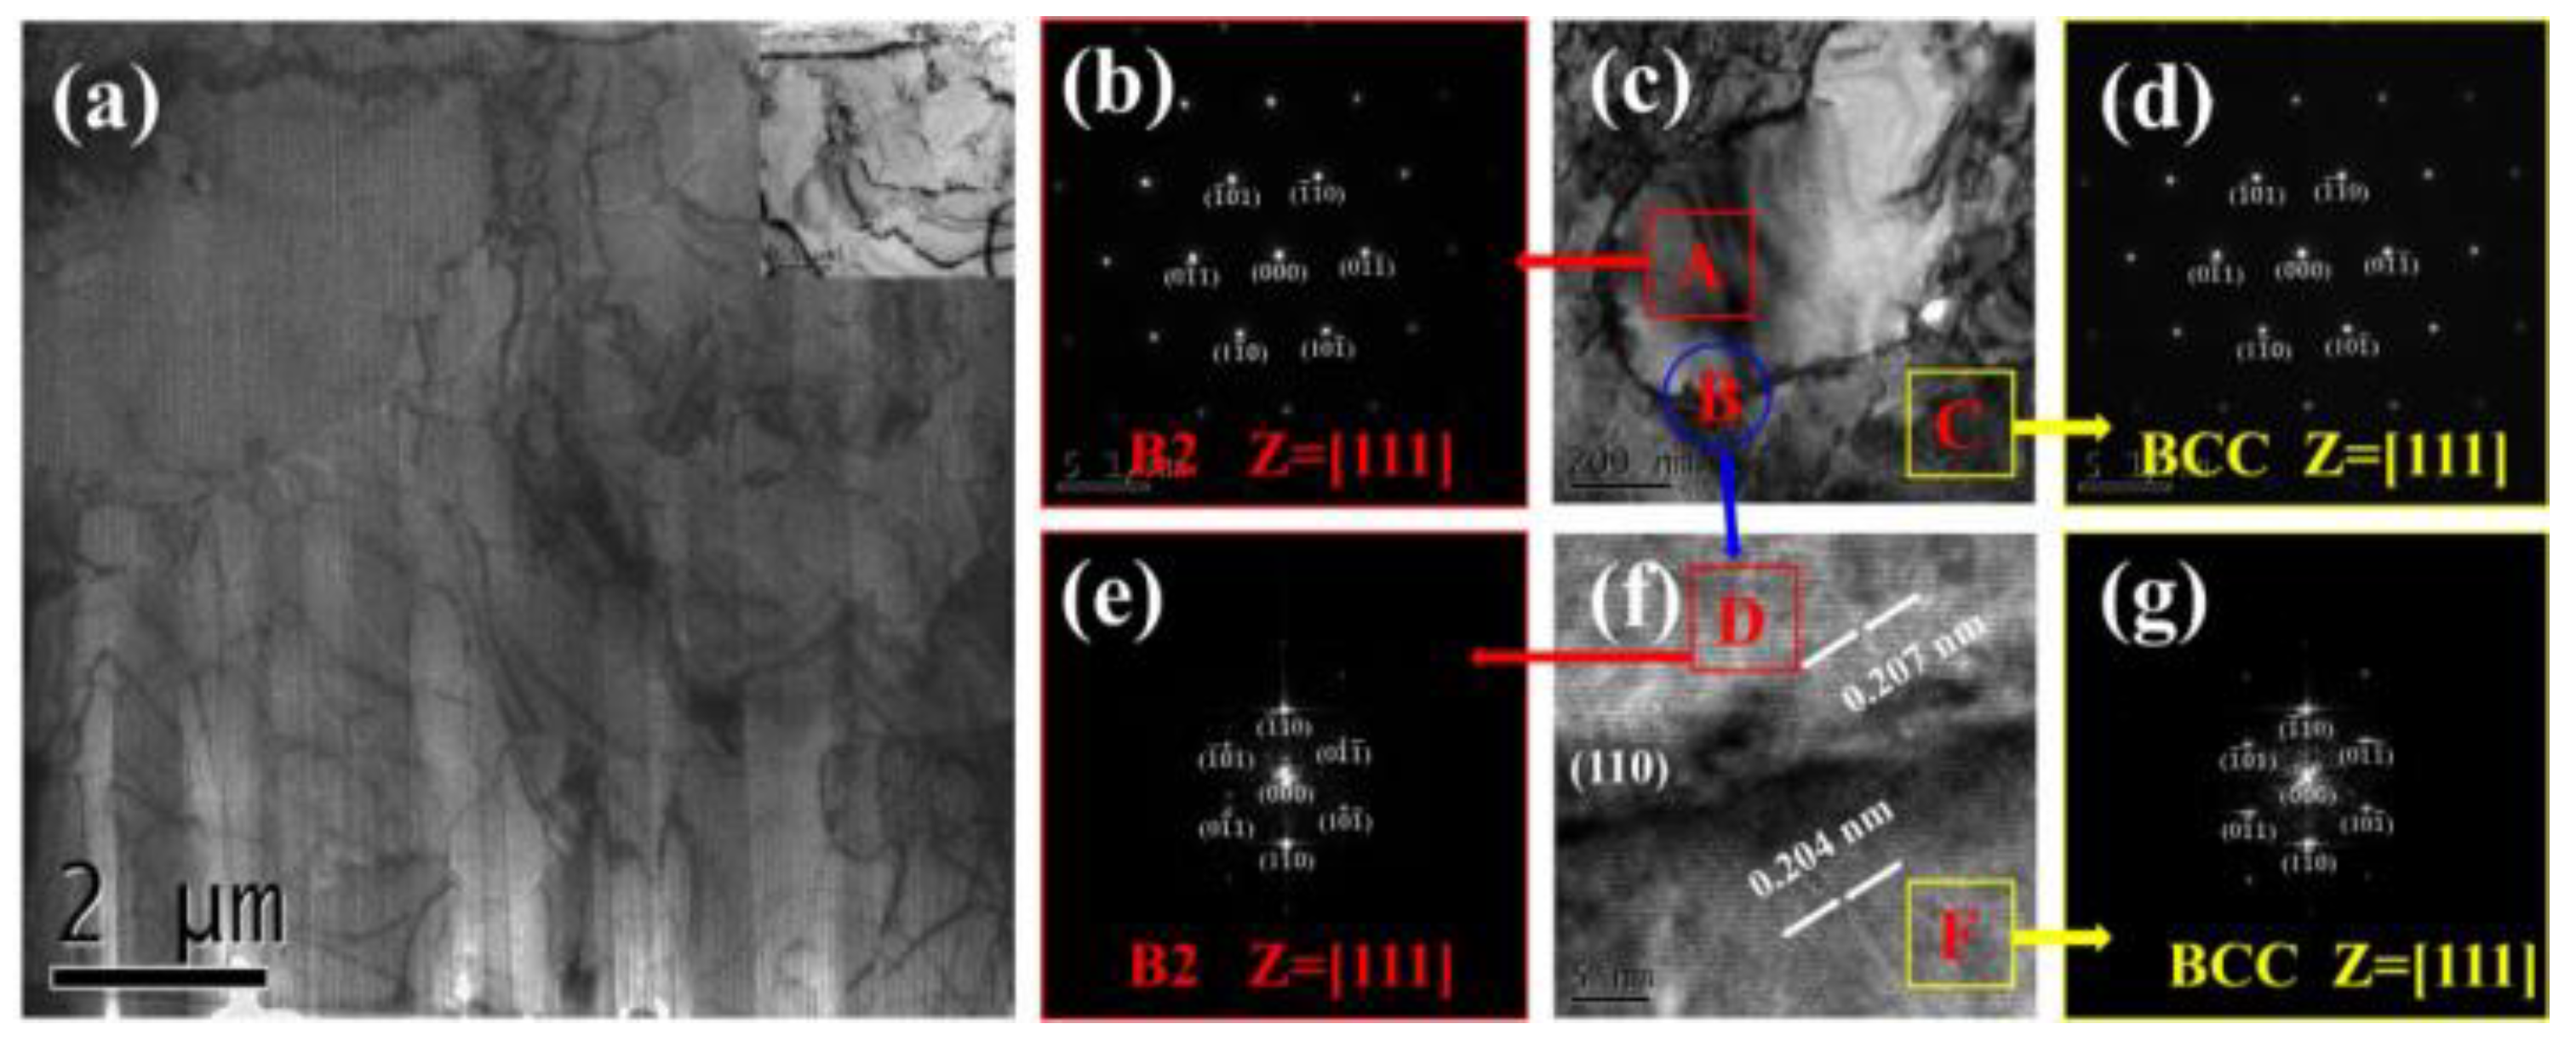
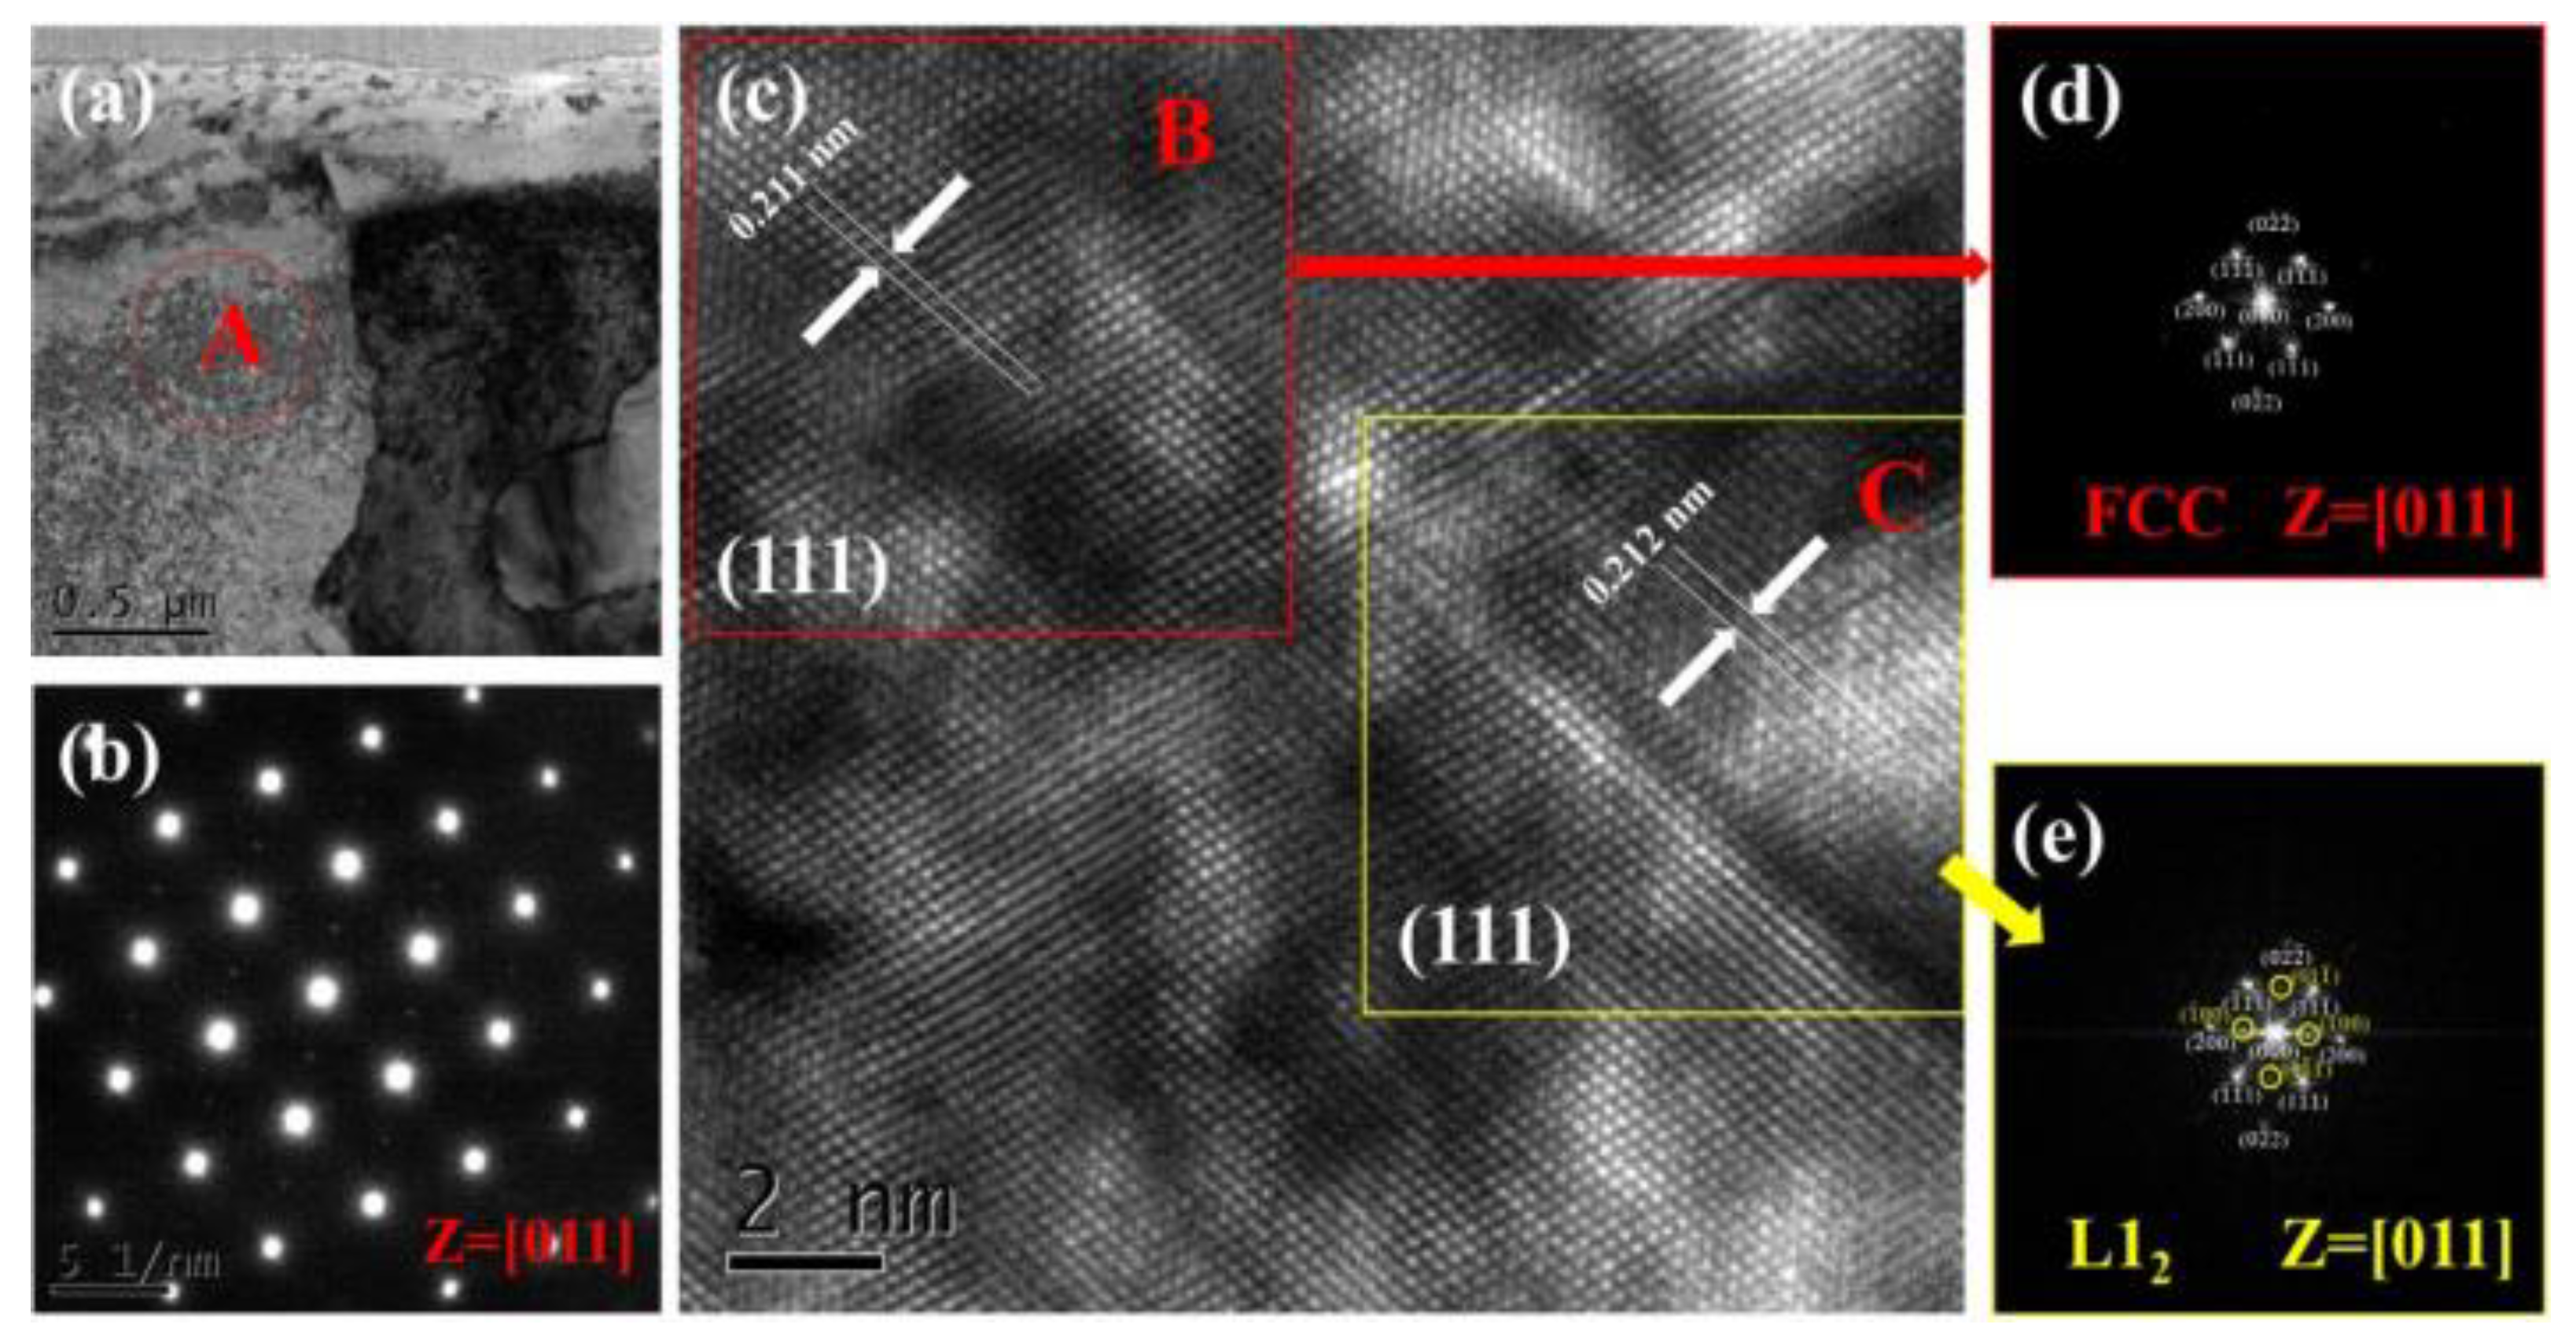
- The as-cast Alx(CrFeNi)88Ti(12-x) alloy is primarily composed of BCC, FCC , B2 , and L21 phase and exhibits a typical dendrite structure, which remains unchanged even after prolonged annealing.
- 2)
- When the volume fraction of FCC phase in the cast alloy is high, the alloy tends to form σ Phase+Ni3Ti phase after annealing. When the volume fraction of FCC phase is low, it will desolve and precipitate in a more stable L12 phase.
- 3)
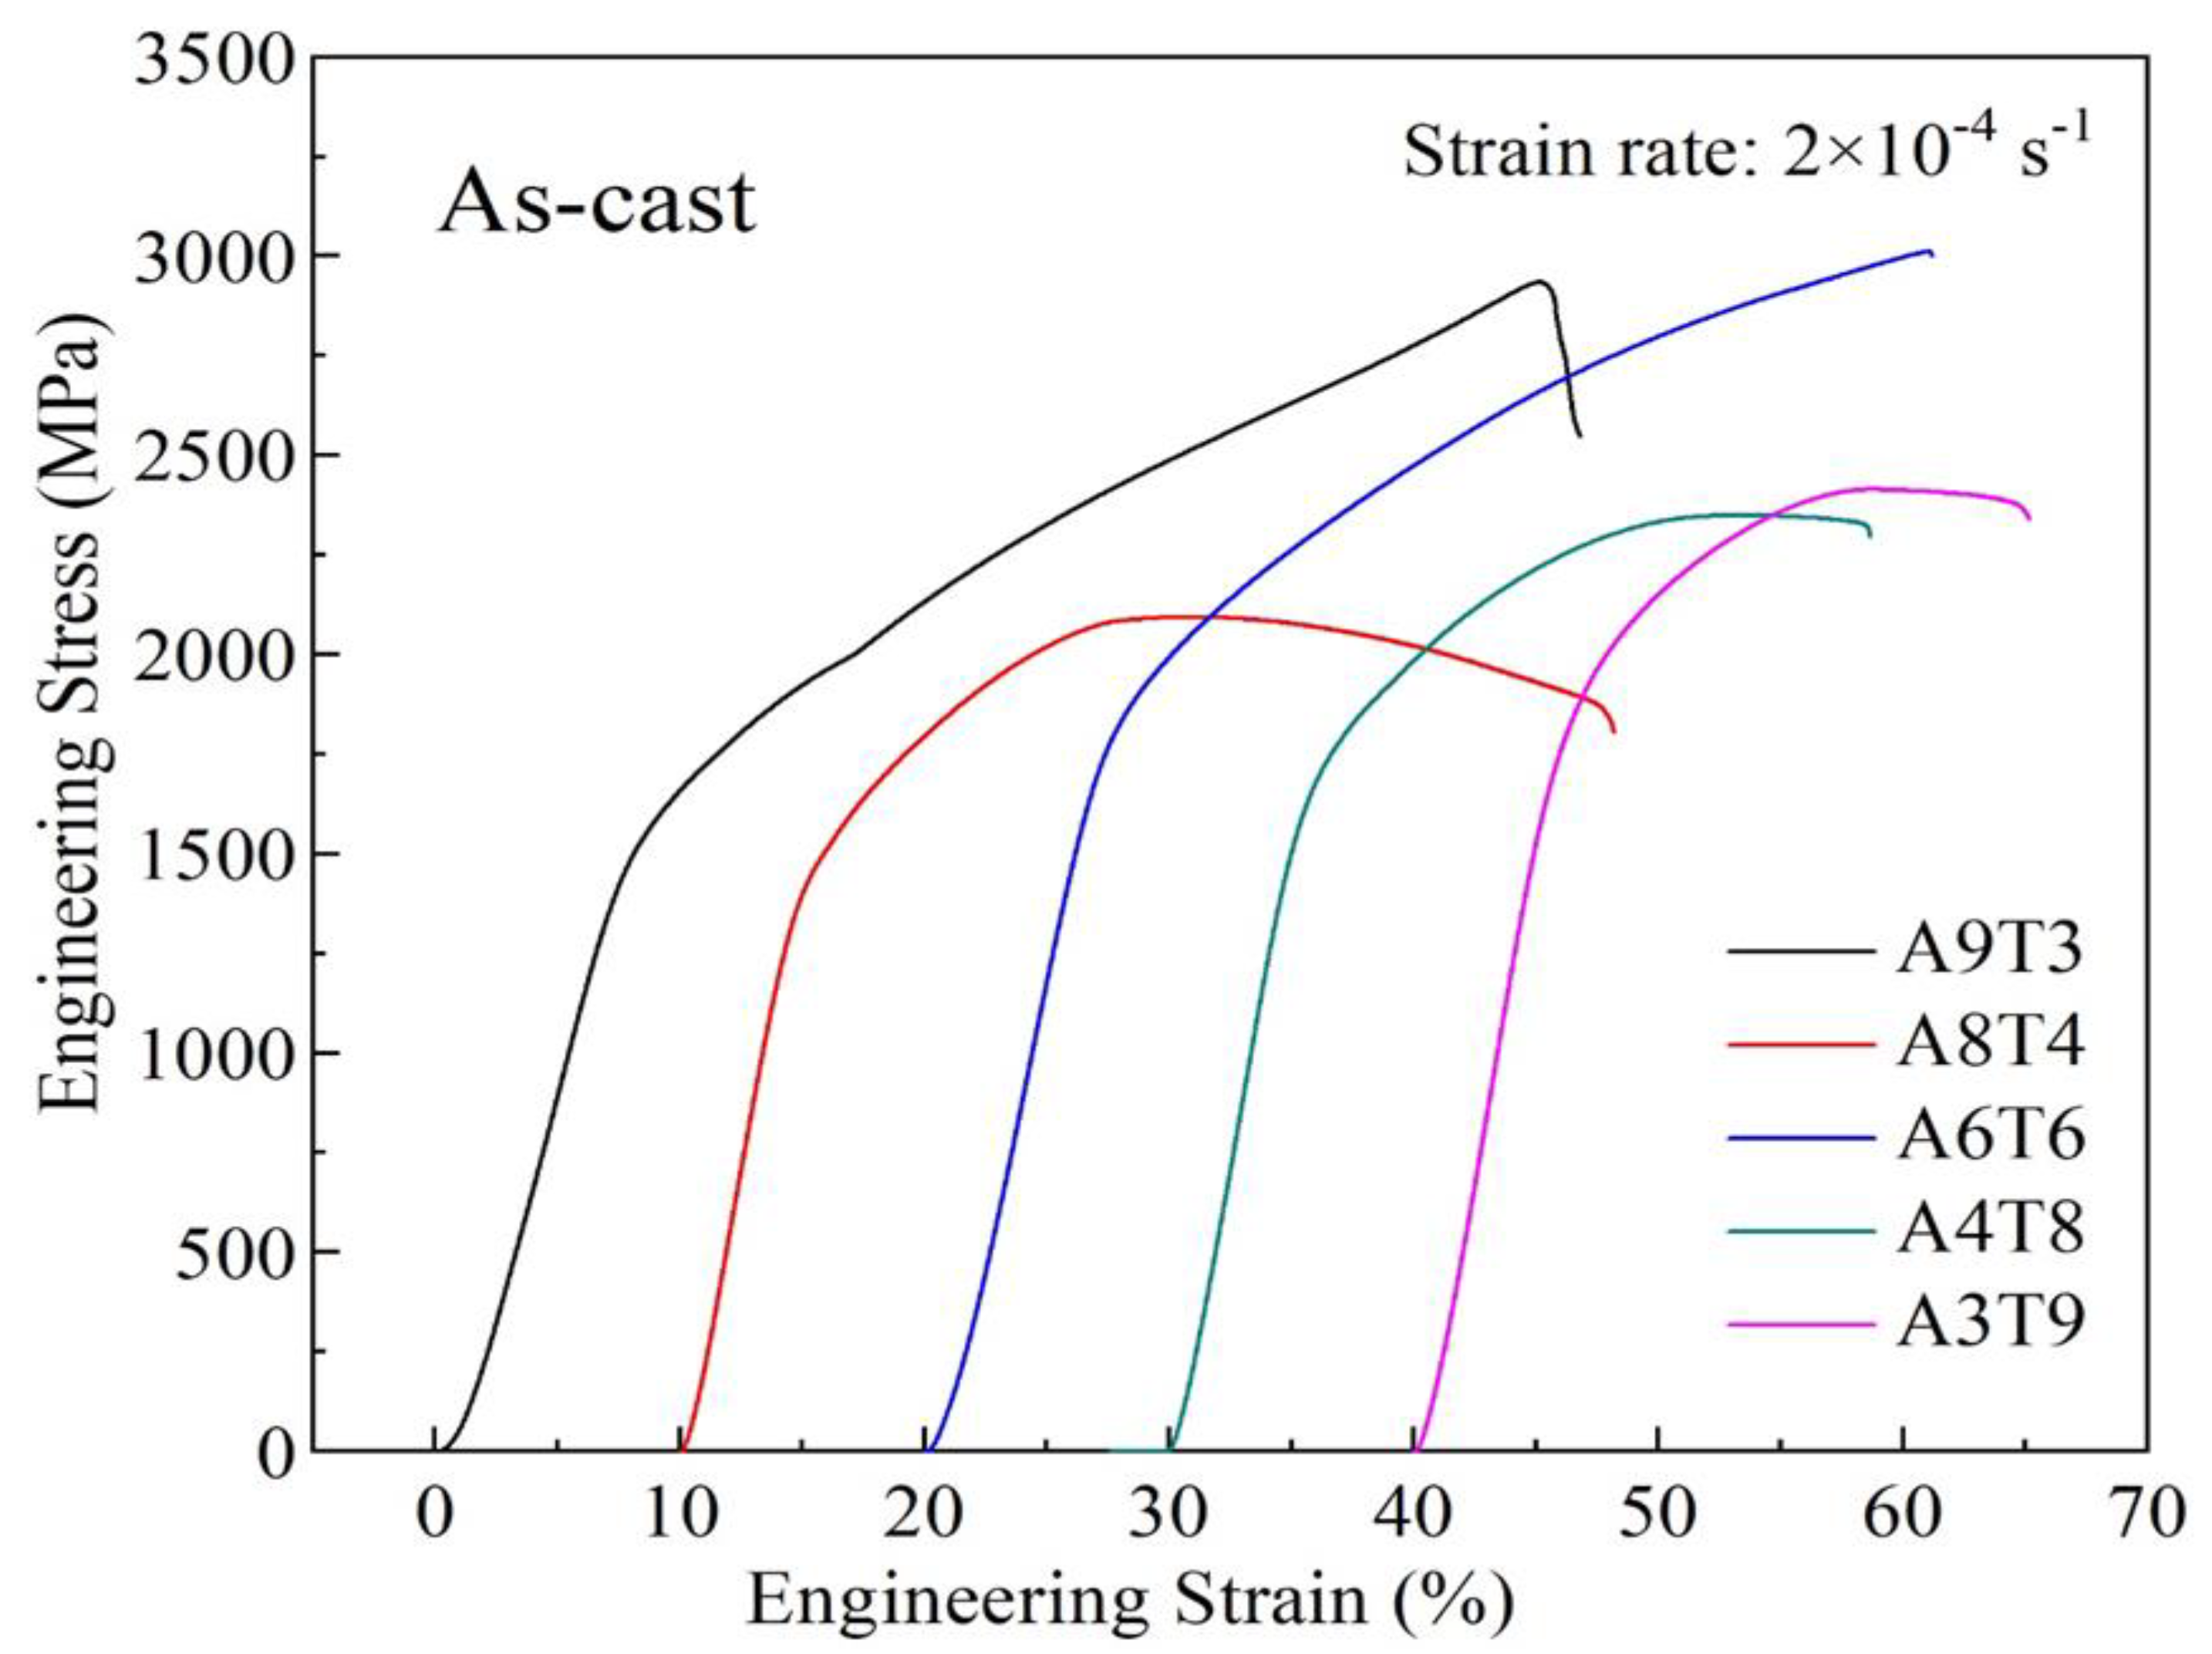
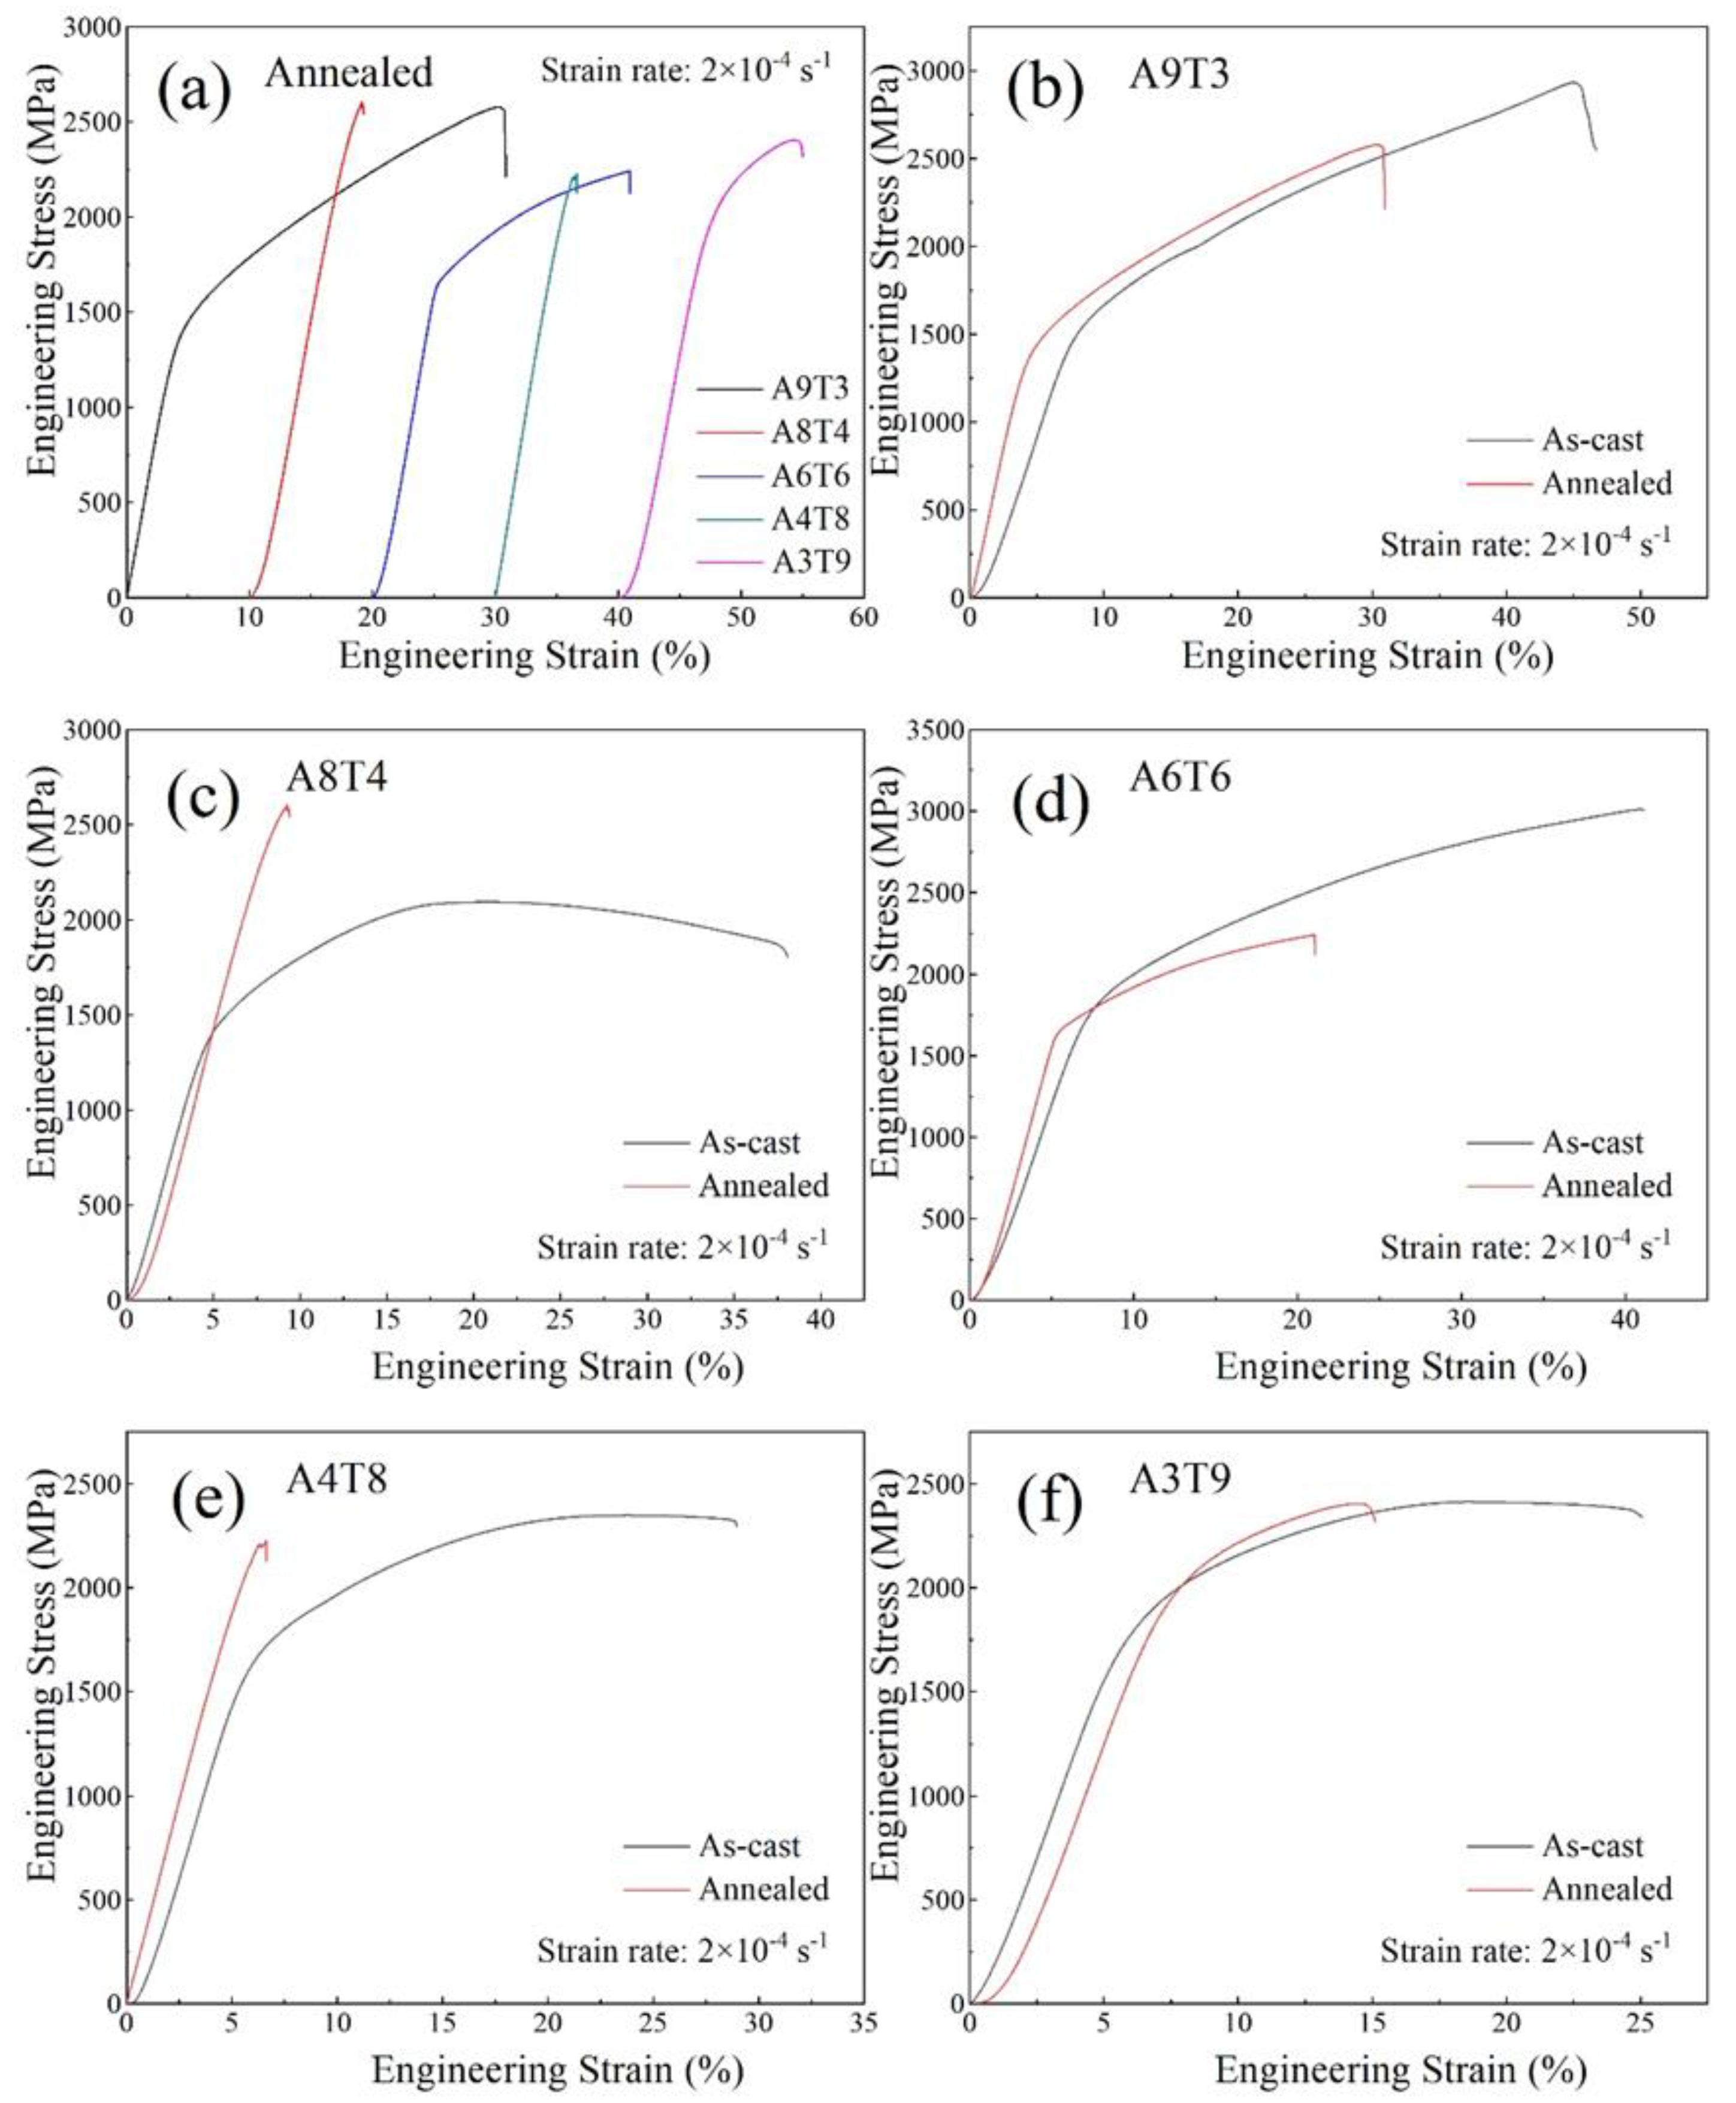
- The addition of Ti to the as-cast alloy improves its strength and reduceds its plasticity, leading to a multiplication in yield strength from 1338.13 MPa to 1707.41 MPa and a decrease in plasticity from 45.11% to 18.71%. However, after annealing, the compressive properties of the alloy deteriorate, with only the yield strength increasing while both the fracture strength and plasticity decrease.
Author Contributions
Data Availability
Acknowledgments
Conflicts of Interest
References
- Joseph, J.; Senadeera, M.; Chao, Q.; Shamlaye, K.; Rana, S.; Gupta, S.; Venkatesh, S.; Hodgson, P.; Barnett, M.; Fabijanic, D. Computational design of thermally stable and precipitation-hardened Al-Co-Cr-Fe-Ni-Ti high entropy alloys. J. Alloy. Compd. 2021, 888. [Google Scholar] [CrossRef]
- Kim, M.J.; Kang, G.C.; Hong, S.H.; Park, H.J.; Mun, S.C.; Song, G.; Kim, K.B. Understanding microstructure and mechanical properties of (AlTa0.76)xCoCrFeNi2.1 eutectic high entropy alloys via thermo-physical parameters. J. Mater. Sci. Technol. 2020, 57, 131–137. [Google Scholar] [CrossRef]
- Makhmutov, T.; Razumov, N.; Kim, A.; Ozerskoy, N.; Mazeeva, A.; Popovich, A. Synthesis of CoCrFeNiMnW0.25 High-Entropy Alloy Powders by Mechanical Alloying and Plasma Spheroidization Processes for Additive Manufacturing. Met. Mater. Int. 2020, 27, 50–54. [Google Scholar] [CrossRef]
- Yang Cheng-bo, Zhang Jing, Li Meng, Liu Xue-jian. Soft-magnetic high-entropy AlCoFeMnNi alloys with dual-phase microstructures induced by annealing. Acta Metallurgica Sinica 2020, 33, 1124–1134. [Google Scholar]
- Zhang Y P, Shen Q K, Chen X Z, et al. Strengthening Mechanisms in CoCrFeNiX0.4 (Al, Nb, Ta) High Entropy Alloys Fabricated by Powder Plasma Arc Additive Manufacturing. Nanomaterials 2021, 11, 721. [Google Scholar] [CrossRef]
- Peng Jian, Li Zi-yong, Ji Xin-bo, Sun Yan-le, Fu Li-ming, Shan Ai-dang. Decomposition kinetics of carbon-doped FeCoCrNiMn high-entropy alloy at intermediate temperature. Trans. Nonferrous Met. Soc. China 2020, 30, 1884–1894. [Google Scholar] [CrossRef]
- Jiang H, Qiao D X, Jiao W N, et al. Tensile deformation behavior and mechanical properties of a bulk cast Al0.9CoFeNi2 eutectic high-entropy alloy. J. Mater. Sci. Technol. 2021, 61, 119–124. [Google Scholar] [CrossRef]
- Jiang Hui, Qiao Dong-xu, Jiao Wen-na, Han Kai-ming, Lu Yi-ping, Liaw P K. Tensile deformation behavior and mechanical properties of a bulk cast Al0.9CoFeNi2 eutectic high-entropy alloy. J. Mater. Sci. Technol. 2021, 61, 119–124. [Google Scholar] [CrossRef]
- Yuan, Y.; Wang, J.; Wei, J.; Chen, W.; Yan, H.; Jia, N. Cu alloying enables superior strength-ductility combination and high corrosion resistance of FeMnCoCr high entropy alloy. J. Alloy. Compd. 2024, 970. [Google Scholar] [CrossRef]
- Zhang, Z.; Li, X.; Yi, H.; Xie, H.; Zhao, Z.; Bai, P. Clarify the role of Nb alloying on passive film and corrosion behavior of CoCrFeMnNi high entropy alloy fabricated by laser powder bed fusion. Corros. Sci. 2023, 224. [Google Scholar] [CrossRef]
- Liu, B.; Li, J.; Peterlechner, M.; Zhang, H.; Wu, Y.; Wilde, G.; Ye, F. Microstructure and mechanical properties of Si micro-alloyed (Ti28Zr40Al20Nb12)100-xSix (x=0, 0.1, 0.2, 0.5) high entropy alloys. Intermetallics 2023, 161. [Google Scholar] [CrossRef]
- Gao Shuo, Kong Teng, Zhang Man, Chen Xiao, Sui Yan-wei, Ren Yao-jian, Qi Ji-qiu, WeI Fu-xiang, He Ye-zeng, Meng Qing-kun, Sun Zhi. Effects of titanium addition on microstructure and mechanical properties of CrFeNiTix (x=0.2−0.6) compositionally complex alloys, Journal of Materials Research, 2019, 34(5) 819−828.
- Wang L L, Zhou J Q, Liu H X, et al. Severe grain rotation behavior of L12-B2 nano lamellar eutectic structure. Mater. Lett. 2021, 302, 130393. [Google Scholar] [CrossRef]
- Cao Yuan-kui, Liu Yong, Liu Bin, Zhang Wei-dong, Wang Jia-wen, Du Meng. Effects of Al and Mo on high temperature oxidation behavior of refractory high entropy alloys. Trans. Nonferrous Met. Soc. China 2019, 29, 1476–1483. [Google Scholar] [CrossRef]
- Guo, R.; Pan, J.; Liu, L. Achieving dual-phase structure and improved mechanical properties in AlCoCrFeTi0.5 high-entropy alloys by addition of Ni. Mater. Sci. Eng. A 2022, 831, 142194. [Google Scholar] [CrossRef]
- Abhishek, M.; Yong, H.S. Fundamental Core Effects in Transition Metal High-Entropy Alloys: “High-Entropy” and “Sluggish Diffusion” Effects. Diffus. Found. 2021, 29, 75–93. [Google Scholar]
- Cai YC, Zhu LS, Cui Y, et al. Influence of high-temperature condition on the microstructure and properties of FeCoCrNiAl0.3 and FeCoCrNiAl0.7 high-entropy alloy coatings. Surf. Eng. 2021, 37, 179–187. [Google Scholar] [CrossRef]
- Gong, X.; Xiang, C.; Auger, T.; Chen, J.; Liang, X.; Yu, Z.; Short, M.P.; Song, M.; Yin, Y. Liquid metal embrittlement of a dual-phase Al0.7CoCrFeNi high-entropy alloy exposed to oxygen-saturated lead-bismuth eutectic. Scr. Mater. 2021, 194, 113652. [Google Scholar] [CrossRef]
- Wen, X.; Cui, X.; Jin, G.; Liu, Y.; Zhang, Y.; Fang, Y. In-situ synthesis of nano-lamellar Ni1.5CrCoFe0.5Mo0.1Nbx eutectic high-entropy alloy coatings by laser cladding: Alloy design and microstructure evolution. Surf. Coatings Technol. 2021, 405, 126728. [Google Scholar] [CrossRef]
- Feng S, Fu H D, Zhou H Y, et al. A general and transferable deep learning framework for predicting phase formation in materials. Comput. Mater. 2021, 7, 1–10. [Google Scholar]
- Yan Y R, Fang L Y, Tan Y K, Tao X M, Ouyang Y F, Du Y. Mechanical properties and corrosion resistance of AlxCoCuFeMn high-entropy alloys. J. Mater. Res. Technol. 2023, 24, 5250–5259.
- Zhang M D, Ma Y M, Dong W Q, et al. Phase evolution, microstructure, and mechanical behaviors of the CrFeNiAlxTiy medium-entropy alloys, Materials Science and Engineering: A, 2020, 771 138566.
- Kao W H, Su Y L, Horng J H, et al. Mechanical, tribological, anti-corrosion and anti-glass sticking properties of high-entropy TaNbSiZrCr carbide coatings prepared using radio-frequency magnetron sputtering. Mater. Chem. Phys. 2021, 268, 124741.
- Li Y T, Wang C T, Ma D L, et al. Nano dual-phase CuNiTiNbCr high entropy alloy films produced by high-power pulsed magnetron sputtering. Surf. Coat. Technol. 2021, 420, 127325.
- Kumar, A.; Singh, A.; Suhane, A. A critical review on mechanically alloyed high entropy alloys: processing challenges and properties. Mater. Res. Express 2022, 9, 052001. [Google Scholar] [CrossRef]
- Zhang G Z, Liu H, Tian X H, et al. Microstructure and Properties of AlCoCrFeNiSi High-Entropy Alloy Coating on AISI 304 Stainless Steel by Laser Cladding. J. Mater. Eng. Perform. 2020, 29, 278–288. [Google Scholar] [CrossRef]
- Qiu H, Zhu H G, Zhang J F, et al. Effect of Fe content upon the microstructures and mechanical properties of FexCoNiCu high entropy alloys. Mater. Sci. Eng. A 2020, 769, 138514. [Google Scholar] [CrossRef]
- Wang H J, Wu Z Y, Wu H, et al. In Situ TiC Particle-Reinforced FeCoCrNiCu High Entropy Alloy Matrix Composites by Induction Smelting. Trans. Indian Inst. Met. 2021, 74, 267–272. [Google Scholar] [CrossRef]
- Jin, B.-Q.; Zhang, N.-N.; Zhang, Y.; Li, D.-Y. Microstructure, phase composition and wear resistance of low valence electron concentration AlxCoCrFeNiSi high-entropy alloys prepared by vacuum arc melting. J. Iron Steel Res. Int. 2020, 28, 181–189. [Google Scholar] [CrossRef]
- Suprianto, Chen C L. Study of (Ni, Cr) pre-milling for synthesis of CoFe(NiCr)Mn high entropy alloy by mechanical alloying. Mater. Sci. Eng. A 2021, 807, 140810. [Google Scholar] [CrossRef]
- Hansol S, Seungjin N, Hyunjoo C. Development of porous high-entropy alloys by mechanical alloying and chemical de-alloying. Powder Metall. 2021, 64, 211–218. [Google Scholar] [CrossRef]
- Wu, X.; Mayweg, D.; Ponge, D.; Li, Z. Microstructure and deformation behavior of two TWIP/TRIP high entropy alloys upon grain refinement. Mater. Sci. Eng. A 2021, 802, 140661. [Google Scholar] [CrossRef]
- Marianac, Jithin V, Pramote T, et al. Tailoring biocompatible Ti-Zr-Nb-Hf-Si metallic glasses based on high-entropy alloys design approach, Materials science & engineering C, Materials for biological applications, 2021, 121: 111733.
- Miklós K D, Nikolett M P, Éva F. Examination of microstructure and corrosion properties of novel AlCoCrFeNi multicomponent alloy, Materials Today: Proceedings, 2021, 45(5) 4250- 4253.
| element | Al | Cr | Fe | Ni |
| atomic weight, g/mol | 26.98 | 52 | 55.85 | 58.69 |
| atomic radius | 1.432 | 1.249 | 1.241 | 1.246 |
| melting point, °C | 660.25 | 1857 | 1535 | 1453 |
| Crystal Structure (Low Temperature) | FCC | BCC | BCC | FCC |
| Crystal Structure (High Temperature) | FCC | BCC | BCC | FCC |
| alloy | Al/wt. % | Cr/wt. % | Ti/wt. % | Fe/wt. % | Ni/wt. % | Theoretical melting point |
| Al9(CrFeNi)88Ti3 | 5 | 29 | 3 | 31 | 33 | 1795.21 K |
| Al8(CrFeNi)88Ti4 | 4 | 29 | 4 | 31 | 33 | 1802.48 K |
| Al6(CrFeNi)88Ti6 | 3 | 29 | 5 | 31 | 32 | 1817.02 K |
| Al4(CrFeNi)88Ti8 | 2 | 28.37 | 7.12 | 30.46 | 32 | 1831.56 K |
| Al3(CrFeNi)88Ti9 | 1.499 | 28.26 | 7.988 | 30.351 | 31.90 | 1838.83 K |
| alloy | △Hmix | △Smix | δ/% | VEC | Ω | Tm/k |
| Al9(CrFeNi)88Ti3 | -10.383 | 11.649 | 4.7 | 7.43 | 1.6 | 1795.21 K |
| Al8(CrFeNi)88Ti4 | -10.631 | 11.723 | 4.7 | 7.44 | 1.635 | 1802.48 K |
| Al6(CrFeNi)88Ti6 | -11.055 | 11.78 | 4.8 | 7.46 | 1.705 | 1817.02 K |
| Al4(CrFeNi)88Ti8 | -11.382 | 11.723 | 4.9 | 7.48 | 1.778 | 1831.56 K |
| Al3(CrFeNi)88Ti9 | -11.51 | 11.649 | 4.9 | 7.49 | 1.817 | 1838.83 K |
| Mixing enthalpy | Ti | Cr | Al | Fe | Ni |
| Ti | 0 | -7 | -30 | -17 | -35 |
| Cr | 0 | -10 | -1 | -7 | |
| Al | 0 | -11 | -22 | ||
| Fe | 0 | -2 | |||
| Ni | 0 |
| alloy | σ0.2(MPa) | σb(MPa) | εp(%) |
| Al9(CrFeNi)88Ti3 | 1435.93 | 2934.41 | 45.11 |
| Al8(CrFeNi)88Ti4 | 1338.13 | 2093.71 | 37.68 |
| Al6(CrFeNi)88Ti6 | 1707.41 | 3010.29 | 41.05 |
| Al4(CrFeNi)88Ti8 | 1574.33 | 2348.89 | 26.12 |
| Al3(CrFeNi)88Ti9 | 1698.07 | 2413.99 | 18.71 |
| alloy | σ0.2(MPa) | σb(MPa) | εp(%) |
| Al9(CrFeNi)88Ti3 | 1302.66 | 2578.01 | 30.22 |
| Al8(CrFeNi)88Ti4 | 2361.22 | 2602.28 | 9.17 |
| Al6(CrFeNi)88Ti6 | 1655.13 | 2242.45 | 20.94 |
| Al4(CrFeNi)88Ti8 | 1965.41 | 2227.09 | 6.63 |
| Al3(CrFeNi)88Ti9 | 1917.49 | 2404.25 | 14.24 |
Disclaimer/Publisher’s Note: The statements, opinions and data contained in all publications are solely those of the individual author(s) and contributor(s) and not of MDPI and/or the editor(s). MDPI and/or the editor(s) disclaim responsibility for any injury to people or property resulting from any ideas, methods, instructions or products referred to in the content. |
© 2024 by the authors. Licensee MDPI, Basel, Switzerland. This article is an open access article distributed under the terms and conditions of the Creative Commons Attribution (CC BY) license (http://creativecommons.org/licenses/by/4.0/).


