Submitted:
23 September 2024
Posted:
24 September 2024
You are already at the latest version
Abstract

Keywords:
1. Introduction
2. Materials and Methods
2.1. Reagents
2.2. Equipment, Consumables and Software
2.3. Preparation of Stock Standards, Calibration Standards and Quality Control Samples
2.4. HPLC-PDA Analysis
2.5. Sample Preparation
3. Results and Discussion
3.1. Chromatographic Method Development
3.2. Linearity Evaluation
3.3. Accuracy and Precision
3.4. Robustness Evaluation
3.5. Application to the Analysis of Real Samples
3.6. Comparison with Other Analytical Methods
4. Conclusions
References
- Nitulescu, G.; Lupuliasa, D.; Adam-Dima, I.; Nitulescu, G.M. Ultraviolet Filters for Cosmetic Applications. Cosmetics 2023, 10, 101. [Google Scholar] [CrossRef]
- Sabzevari, N.; Qiblawi, S.; Norton, S.A.; Fivenson, D. Sunscreens: UV filters to protect us: Part 1: Changing regulations and choices for optimal sun protection. Int. J. Womens Dermatol. 2021, 7, 28. [Google Scholar] [CrossRef] [PubMed]
- UV Filters in Cosmetics Services Market (2024-2030). Virtue Market Research, Published: 2024 – April, Report Code: VMR-16723.
- Ekstein, S.F.; Hylwa, S. Sunscreens: A Review of UV Filters and Their Allergic Potential. Dermatitis 2023, 34, 176. [Google Scholar] [CrossRef] [PubMed]
- Yang, C.; Lim, W.; You, S.; Song, G. 4-Methylbenzylidene-camphor inhibits proliferation and induces reactive oxygen species-mediated apoptosis of human trophoblast cells. Reprod. Toxicol. 2019, 84, 49–58. [Google Scholar] [CrossRef]
- Cahová, J.; Blahová, J.; Plhalová, L.; Svobodová, Z.; Faggio, C. Do Single-Component and Mixtures Selected Organic UV Filters Induce Embryotoxic Effects in Zebrafish (Danio rerio)? Water 2021, 13, 2203. [Google Scholar] [CrossRef]
- Santander Ballestín, S.; Luesma Bartolomé, M.J. Toxicity of Different Chemical Components in Sun Cream Filters and Their Impact on Human Health: A Review. Appl. Sci. 2023, 13, 712. [Google Scholar] [CrossRef]
- Rehfeld, S.; Dissing, S.; Skakkebæk, N.E. Chemical UV Filters Mimic the Effect of Progesterone on Ca2+ Signaling in Human Sperm Cells. Endocrinology 2016, 157, 4297–4308. [Google Scholar] [CrossRef]
- Li, V.W.T.; Tsui, M.P.M.; Chen, X.; et al. Effects of 4-Methylbenzylidene Camphor (4-MBC) on Neuronal and Muscular Development in Zebrafish (Danio rerio) Embryos. Environ. Sci. Pollut. Res. 2016, 23, 8275–8285. [Google Scholar] [CrossRef]
- Breakell, T.; Kowalski, I.; Foerster, Y.; Kramer, R.; Erdmann, M.; Berking, C.; Heppt, M.V. Ultraviolet Filters: Dissecting Current Facts and Myths. J. Clin. Med. 2024, 13, 2986. [Google Scholar] [CrossRef]
- Matta, M.K.; Florian, J.; Zusterzeel, R.; Pilli, N.R.; Patel, V.; Volpe, D.A.; Yang, Y.; Oh, L.; Bashaw, E.; Zineh, I.; et al. Effect of Sunscreen Application on Plasma Concentration of Sunscreen Active Ingredients: A Randomized Clinical Trial. JAMA 2020, 323, 256–267. [Google Scholar] [CrossRef]
- Cosmetics Directive. Allowed UV Filters: Annex VI, Regulation 1223/2009/EC on Cosmetic Products, as Amended by Regulation (EU)2022/2195, OJ L 292; Publication Office of the European Union: Luxembourg, 2022.
- Australian Regulatory Guidelines for Sunscreens (ARGS)|Therapeutic Goods Administration (TGA).
- CFR—Code of Federal Regulations Title 21, Chapter I Subchapter D Part 352 Subpart B §352.10.
- Primary Sunscreen Monograph. Health Canada, 25/11/2022. Available online: https://webprod.hc-sc.gc.ca/nhpid-bdipsn/atReq?atid=sunscreen-ecransolaire&lang=eng (accessed on 15 August 24).
- Raikou, V.; Kalogria, E.; Varvaresou, A.; Tsirivas, E.; Panderi, I. Quantitation of Acetyl Hexapeptide-8 in Cosmetics by Hydrophilic Interaction Liquid Chromatography Coupled to Photo Diode Array Detection. Separations 2021, 8, 125. [Google Scholar] [CrossRef]
- Papageorgiou, S.; Varvaresou, A.; Panderi, I.; Giannakou, M.; Spiliopoulou, C.; Athanaselis, S. Development and validation of a reversed-phase high-performance liquid chromatographic method for the quantitation and stability of α-lipoic acid in cosmetic creams. Int. J. Cosmet. Sci. 2020, 42, 221–228. [Google Scholar] [CrossRef] [PubMed]
- Rastogi, S.C.; Jensen, G.H. Identification of UV filters in sunscreen products by high performance liquid chromatography–diode-array detection. J. Chromatogr. A. 1998, 828, 311–316. [Google Scholar] [CrossRef]
- Salvador, A.; Chisvert, A. An environmentally friendly (“green”) reversed-phase liquid chromatography method for UV filters determination in cosmetics. Anal. Chim. Acta 2005, 537, 15–24. [Google Scholar] [CrossRef]
- Wharton, M. , Geary, M., O’Connor, N., Curtin, L., Ketcher, K. Simultaneous Liquid Chromatographic Determination of 10 Ultra-Violet Filters in Sunscreens. J. Chromatogr. Sci. 2015, 53, 1289–1295. [Google Scholar] [CrossRef] [PubMed]
- Hauri, U.; Lütolf, B.; Hohl, C. Determination of organic sunscreen filters in cosmetics with HPLC/DAD, Mitt. Lebens. Hyg. 2003, 94, 80–92. [Google Scholar]
- Schakel, D.J.; Kalsbeek, D.; Boer, K. Determination of Sixteen UV Filters in Suncare Formulations by High-Performance Liquid Chromatography. J. Chromatogr. A. 2004, 1049, 127–130. [Google Scholar] [CrossRef]
- De Orsi, D.; Giannini, G.; Gagliardi, L.; et al. Simple Extraction and HPLC Determination of UV-A and UV-B Filters in Sunscreen Products. Chroma 2006, 64, 509–515. [Google Scholar] [CrossRef]
- Escamilla, P.C.; Balaguer, A.; Duran Giner, E.; Talamentes, S. Rapid LC Determination of UV Filters in Cosmetics Using Ethanol as the Mobile Phase. LCGC Eur. 2009, 22, 562–568. [Google Scholar]
- Kim, K.; Park, Y.-B.; Jung, H.-R.; Kang, S.-H.; Yoon, M.-H.; Lee, J.-B.; Mueller, J. Simultaneous Determination of Nine UV Filters and Four Preservatives in Suncare Products by High-Performance Liquid Chromatography. J. Chromatogr. Sci. 2011, 49, 554–559. [Google Scholar] [CrossRef]
- Scalia, S. Determination of Sunscreen Agents in Cosmetic Products by Supercritical Fluid Extraction and High-Performance Liquid Chromatography. J. Chromatogr. A. 2000, 870, 199–205. [Google Scholar] [CrossRef]
- Sherma, J.; Rabel, F. Thin-Layer Chromatography in the Analysis of Sunscreens. J. Liq. Chromatogr. Relat. Technol. 2018, 41, 73–82. [Google Scholar] [CrossRef]
- Kawaguchi, M.; Ito, R.; Honda, H.; Endo, N.; Okanouchi, N.; Saito, K.; Seto, Y.; Nakazawa, H. Simultaneous Analysis of Benzophenone Sunscreen Compounds in Water Sample by Stir Bar Sorptive Extraction with in Situ Derivatization and Thermal Desorption–Gas Chromatography–Mass Spectrometry. J. Chromatogr. A. 2008, 1200, 260–263. [Google Scholar] [CrossRef]
- Cheng, J.; Li, Y.S.; Roberts, L.; Walker, G. Analysis of 2-Ethylhexyl-p-Methoxycinnamate in Sunscreen Products by HPLC and Raman Spectroscopy. Talanta 1997, 44, 1807–1813. [Google Scholar] [CrossRef]
- Townshend, A.; Wheatley, R.A.; Chisvert, A.; Salvador, A. Flow Injection-Chemiluminescence Determination of Octyl Dimethyl PABA in Sunscreen Formulations. Anal. Chim. Acta 2002, 462, 209–215. [Google Scholar] [CrossRef]
- Nitulescu, G.; Lupuliasa, D.; Adam-Dima, I.; Nitulescu, G.M. Ultraviolet Filters for Cosmetic Applications. Cosmetics 2023, 10, 101. [Google Scholar] [CrossRef]
- Commission Regulation (EU) 2024/996 amending Regulation (EC) No 1223/2009 of the European Parliament and of the Council as regards the use of Vitamin A, Alpha-Arbutin and Arbutin and certain substances with potential endocrine disrupting properties in cosmetic products. 3 April 2024.
- Tarras-Wahlberg, N.; Rosén, A.; Stenhagen, G.; Larkö, O.; Wennberg, A.-M.; Wennerström, O. Changes in Ultraviolet Absorption of Sunscreens After Ultraviolet Irradiation. J. Invest. Dermatol. 1999, 113, 547–553. [Google Scholar] [CrossRef]
- Couteau, C.; Philippe, A.; Galharret, J.M.; et al. UV Filters in Everyday Cosmetic Products, a Comparative Study. Environ. Sci. Pollut. Res. 2024, 31, 2976–2986. [Google Scholar] [CrossRef]
- Pniewska, A.; Kalinowska-Lis, U. A Survey of UV Filters Used in Sunscreen Cosmetics. Appl. Sci. 2024, 14, 3302. [Google Scholar] [CrossRef]
- Chaiyabutr, C.; Sukakul, T.; Kumpangsin, T.; et al. Ultraviolet Filters in Sunscreens and Cosmetic Products—A Market Survey. Contact Dermatitis 2021, 85, 58–68. [Google Scholar] [CrossRef]
- Dams, R.; Lambert, W.E.; Clauwaert, K.M.; De Leenheer, A.P. Comparison of phenyl-type columns in the development of a fast liquid chromatographic system for eighteen opiates commonly found in forensic toxicology. J. Chromatogr. A. 2000, 896, 311–319. [Google Scholar] [CrossRef] [PubMed]
- Jesus, A.; Sousa, E.; Cruz, M.T.; Cidade, H.; Lobo, J.M.S.; Almeida, I.F. UV Filters: Challenges and Prospects. Pharmaceuticals 2022, 15, 263. [Google Scholar] [CrossRef] [PubMed]
- Mbah, C.J. Degradation Kinetics of Butylmethoxydibenzoylmethane (Avobenzone) in Aqueous Solution. Pharmazie 2007, 62, 747–749. [Google Scholar] [PubMed]
- European Medicines Agency (EMA). Guideline on bioanalytical method validation, 21 July 2011, Committee for Medicinal Products for Human Use (CHMP). EMEA/CHMP/EWP/192217/2009 Rev.1 Corr.2**.
- European Pharmacopoeia (Ph. Eur.) 11th edition, January 2023.
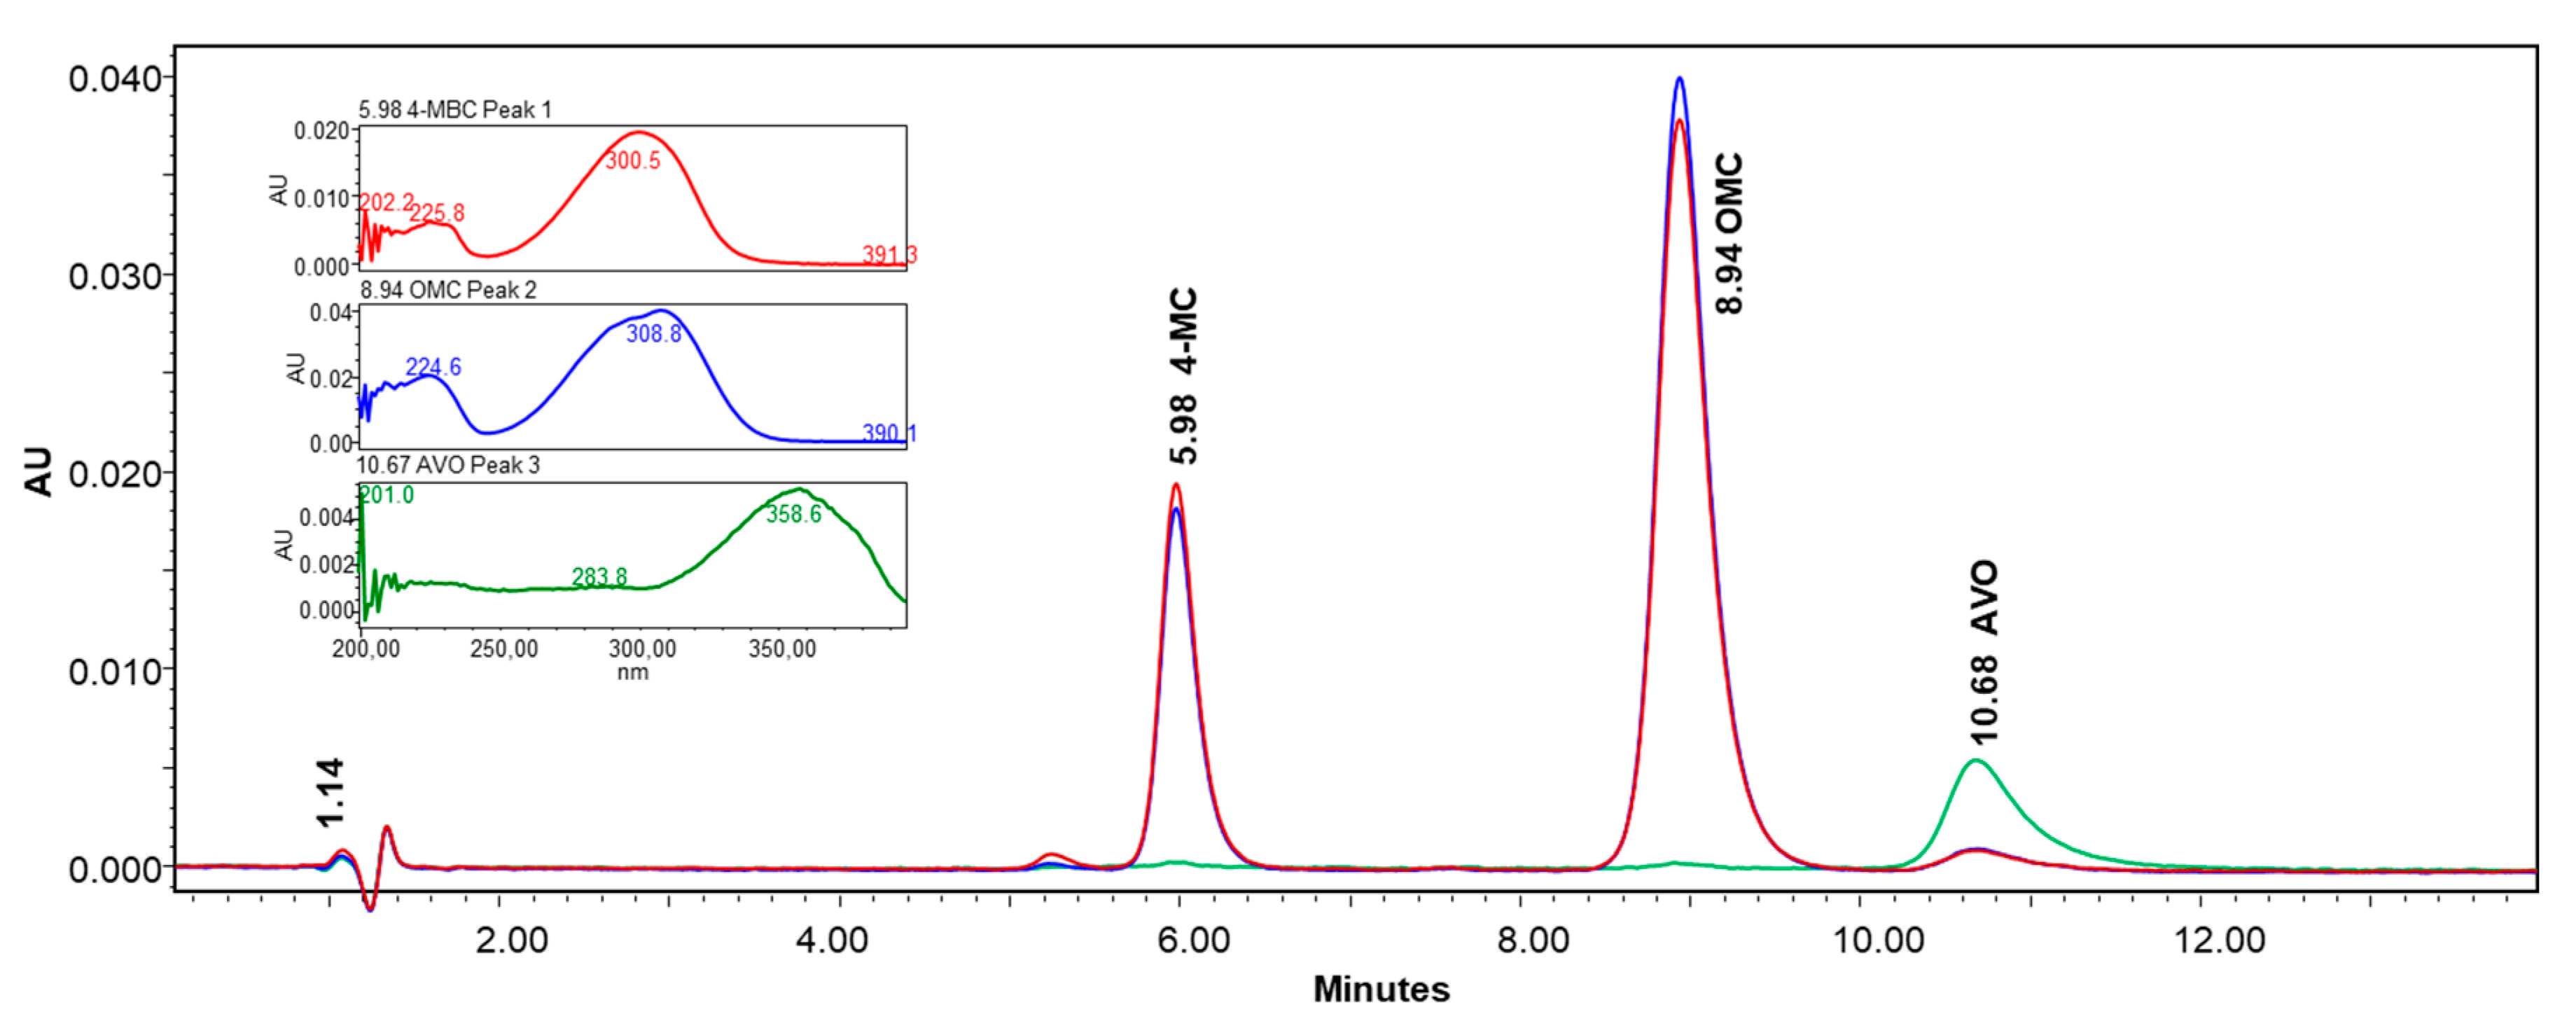
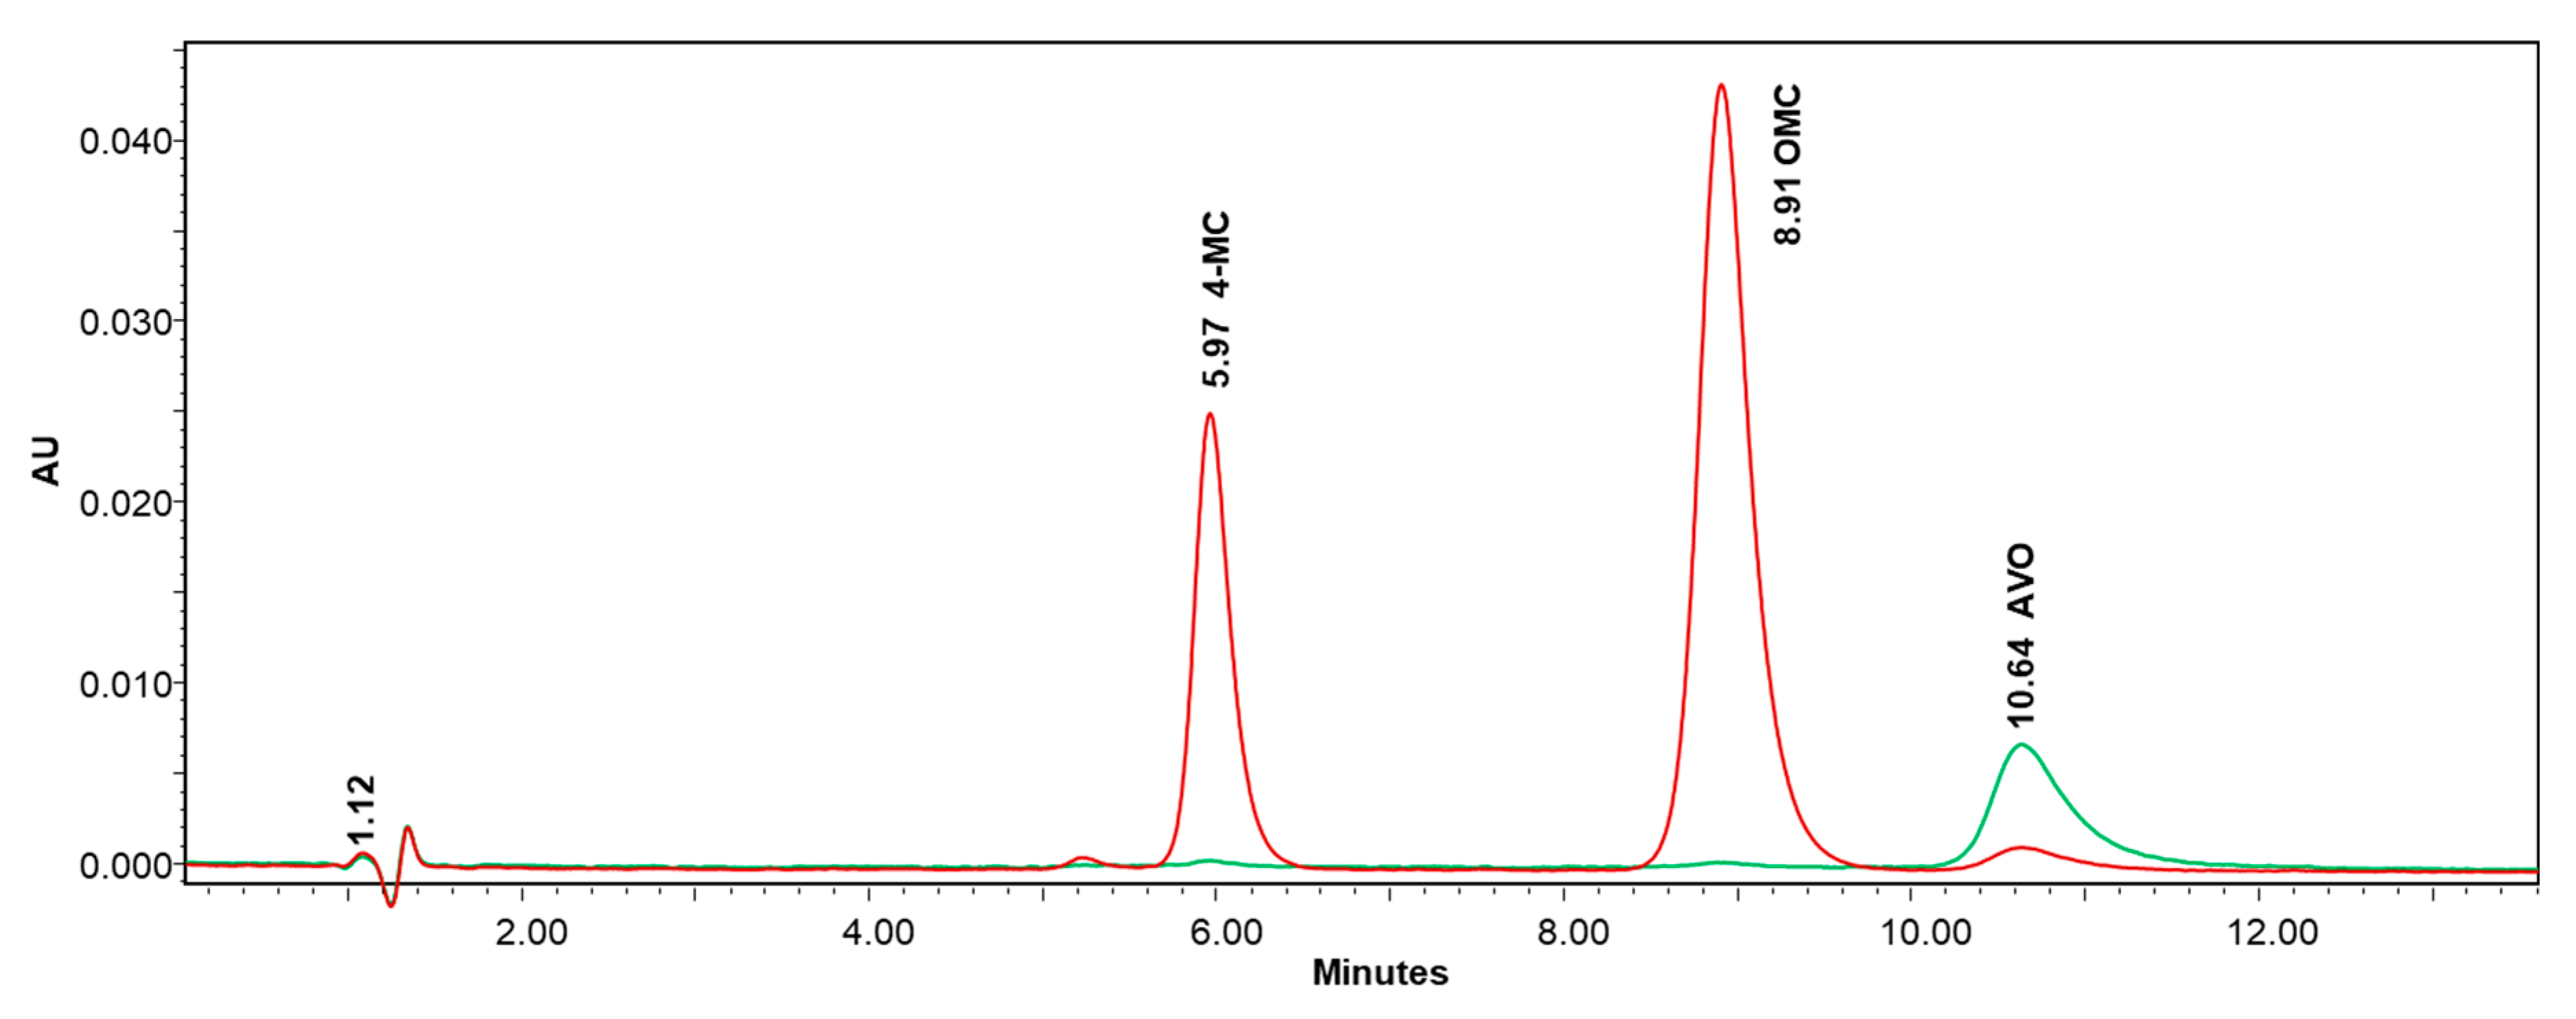
| Compound | System suitability parameter (±SD)1 | |||
|---|---|---|---|---|
| Rt | Resolution2 | Symmetry Factor | N3 | |
| t0 | 1.052 (±0.032) | |||
| 4-MBC | 6.01 (±0.17) | 13.76 (±0.43) | 1.23 (±0.03) | 3800 (±99) |
| OMC | 9.00 (±0.33) | 6.34 (±0.16) | 1.23 (±0.03) | 4243 (±156) |
| AVO | 10.72(±0.41) | 2.85 (±0.14) | 1.26 (±0.11) | 4454 (±173) |
| Analyte 1 | Linearity Range (μg/mL) | Linear Equation 2 | R 3 | Standard Deviation | Sr 4 | texp 5 | |
|---|---|---|---|---|---|---|---|
| Slope | y-intercept | ||||||
| 4-MBC | 0.8–4.0 | SMBC=161660 × CMBC-931 | 0.9997 | 2291 | 5407 | 5709 | 0.172 |
| OMC | 2.4–12.0 | SOMC=132599 × COMC-4556 | 0.9997 | 1880 | 13314 | 14057 | 0.342 |
| AVO | 0.64–3.20 | SAVO=127784 × CAVO-9396 | 0.9992 | 2958 | 868 | 5585 | 1.68 |
| Compound | Concentration Level (μg/mL) |
Intra-run Precision (CV%) 1 | Total Precision (CV%) 1 |
Mean Concentration (μg/mL) |
Total Accuracy (Recovery %) |
|---|---|---|---|---|---|
| 4-MBC | 0.8 | 3.8 | 4.1 | 0.790 | 98.8 |
| 2.0 | 2.8 | 3.6 | 1.988 | 99.4 | |
| 4.0 | 2.6 | 3.2 | 3.973 | 99.3 | |
| OMC | 2.4 | 3.3 | 4.2 | 2.366 | 98.6 |
| 6.0 | 2.4 | 3.5 | 5.99 | 99.9 | |
| 12.0 | 2.6 | 4.3 | 12.04 | 100.4 | |
| AVO | 0.64 | 2.9 | 4.6 | 0.636 | 99.4 |
| 1.6 | 2.4 | 3.6 | 1.606 | 100.4 | |
| 3.2 | 2.7 | 3.5 | 3.198 | 99.9 | |
| Factors | [AMF]1 45 ± 1 mM |
λ2 λ ± 1 nm |
[ACN]3 57 ± 1 % |
||||||
|---|---|---|---|---|---|---|---|---|---|
| Analyte | Average | SDn=3 | %CV | Average | SDn=3 | %CV | Average | SDn=3 | %CV |
| 4-MBC | 99.2 | 1.8 | 1.78 | 99.2 | 1.8 | 1.78 | 99.1 | 1.8 | 1.77 |
| OMC | 102.5 | 0.6 | 0.54 | 102.4 | 1.2 | 1.15 | 100.8 | 2.0 | 1.96 |
| AVO | 99.5 | 0.2 | 0.20 | 99.7 | 0.4 | 0.40 | 100.1 | 0.8 | 0.82 |
| Lot Number |
Analyte | (% w/w) Mean ± SD (n=3) |
Recovery (%) Mean ± SD (n=3) |
|---|---|---|---|
| 1 | 4-MBC | 2.474 ± 0.042 | 98.2 ±1.3 |
| OMC | 7.36 ± 0.17 | 98.1 ± 2.3 | |
| AVO | 1.893 ± 0.061 | 94.6 ± 3.1 | |
| 2 | 4-MBC | 2.422 ± 0.097 | 96.9 ± 3.9 |
| OMC | 7.483 ± 0.049 | 99.8 ± 0.66 | |
| AVO | 1.893 ± 0.049 | 94.7 ± 2.5 |
Disclaimer/Publisher’s Note: The statements, opinions and data contained in all publications are solely those of the individual author(s) and contributor(s) and not of MDPI and/or the editor(s). MDPI and/or the editor(s) disclaim responsibility for any injury to people or property resulting from any ideas, methods, instructions or products referred to in the content. |
© 2024 by the authors. Licensee MDPI, Basel, Switzerland. This article is an open access article distributed under the terms and conditions of the Creative Commons Attribution (CC BY) license (http://creativecommons.org/licenses/by/4.0/).


