1. Introduction
Geothermal energy resources offer a sustainable and eco-friendly form of power generation. However, the efficiency and lifespan of geothermal power plants are often compromised by the phenomena of corrosion and scaling, which can lead to significant operational challenges. Corrosion can take place due to wrong materials selection processes or inadvertent changes in the chemistry of the geothermal brine. Scaling occurs when dissolved minerals precipitate from the geothermal fluid and deposit on the surfaces of pipes and equipment, causing blockages and increasing maintenance costs.
Calcium carbonate (CaCO₃) is one of the most common scaling minerals encountered in geothermal operations. The scaling mechanism is typically related to boiling, which leads to the transfer of CO
2 from the liquid to the vapour phase. This reduces the equilibrium partial pressure of CO
2 in the liquid, increases the pH, and results in a significant increase in the concentration of carbonate (CO
32-) ions in the aqueous fluid [
1,
2] . However, the formation of the scales is influenced by various factors, including temperature, pressure, flow rate, and the chemical composition of the geothermal fluid (including inhibitor additives). For example, Muryanto et al. found in their experiments that scaling increased with an increase in flow rate in the laminar regime due to insufficient shear forces to generate detachment [
3]. Additionally, research in the topic [
4,
5] demonstrated that the same factors mentioned above (which will also play a role in the corrosion of the materials exposed to the brine) have an impact on the type of scaling (stoichiometry, crystalline structure, morphology among others), highlighting the complex interplay of operational parameters in scaling processes.
The materials used in geothermal systems, such as stainless steel, carbon steel, and duplex stainless steel, play an intermixed role in the corrosion-scaling behaviour in components exposed to the geothermal brine [
6], i.e., scaling can reduce corrosion rate. Temperature and some species in the geothermal brine such as CO
2, chlorides, H
2S, ammonia and hydrogen ions (pH) are found to be key players in the corrosion processes [
7,
8]. The selection of appropriate materials can mitigate the adverse effects of corrosion, with some coatings being found to be useful to mitigate scaling as well [
9]. However, no simple rule of thumb exists to define a material selection against a specific geothermal brine, i.e., carbon steel alloys tend to be used in mild environments when thick wall components are allowed, however, corrosion rate can increase significantly when pH is below 6, or on oxygen ingress into the system, or when chloride concentration is above 2% [
7]. Stainless steels are more prone to localized corrosion attack modes, such as stress corrosion cracking, pitting or crevice, than to uniform corrosion when exposed to geothermal brines, with duplex grades being in general more suitable for more demanding environments. In stainless grades, temperature and chlorides are relevant parameters to consider for materials selection. Extensive work towards the selection of materials for geothermal application have been published by DeBerry and Ellis [
7,
10,
11]. Non-metallic materials are also of use in some geothermal applications, i.e., concrete polymer composites or fiber-reinforced laminates, in some cases due to the natural advantage of some polymers over metals in relation to corrosion resistance, however, some non-metallic materials have been used to reduce scaling, as shown in the next paragraph.
To address scaling, various methods are currently used in geothermal systems. For example, operational strategies such as controlling fluid temperature can influence scaling tendencies [
12]. Experiments have shown that maintaining optimal operational parameters can reduce the rate of scale deposition. Chemical treatments, such as the addition of scale inhibitors, have been widely employed. For example, specific inhibitors like phosphorous-free polyaspartic acids have shown effectiveness in preventing CaCO₃ scale formation [
13]. Research into novel materials and coatings for geothermal components continues to advance, with promising developments in coating materials that resist scaling more effectively, such as polytetrafluoroethylene (PTFE)-blended (polyphenylenesulfide) PPS coating [
14].
Another non-traditional alternative to mitigate scaling is being studied in this research. It is the use of a scaling retention system, which is a vessel within the geothermal plant specifically built to allow scaling in order to take advantage of the full thermal energy provided by the geothermal brine. In this equipment, materials that can promote scaling are of advantage.
The work presented in this document is part of GeoSmart, a European Collaborative project designed to test solutions to improve the flexibility and efficiency of geothermal heat and power systems. Specifically, this research paper is part of a larger study involving the development of a scaling retention system in Kızıldere 2 geothermal power plant in Turkiye [
15,
16]. This paper aims to explore the behaviour of materials in a simulated geothermal brine using flow conditions that approximated the predicted flow conditions within the geothermal brine. Due to the nature of the application, both scale promoters, and scale preventer materials are of interest in this study. In a second part of this research, coupons made of the same materials presented in this paper were introduced in the retention tank installed in Kızıldere 2; the assessment of these will be performed using the same methodology presented here, and the results will be contrasted in the future part of this investigation.
2. Materials and Methods
2.1. Simulation of Environmental Conditions and Corrosion Tests
2.1.1. Overview of Test Strategy
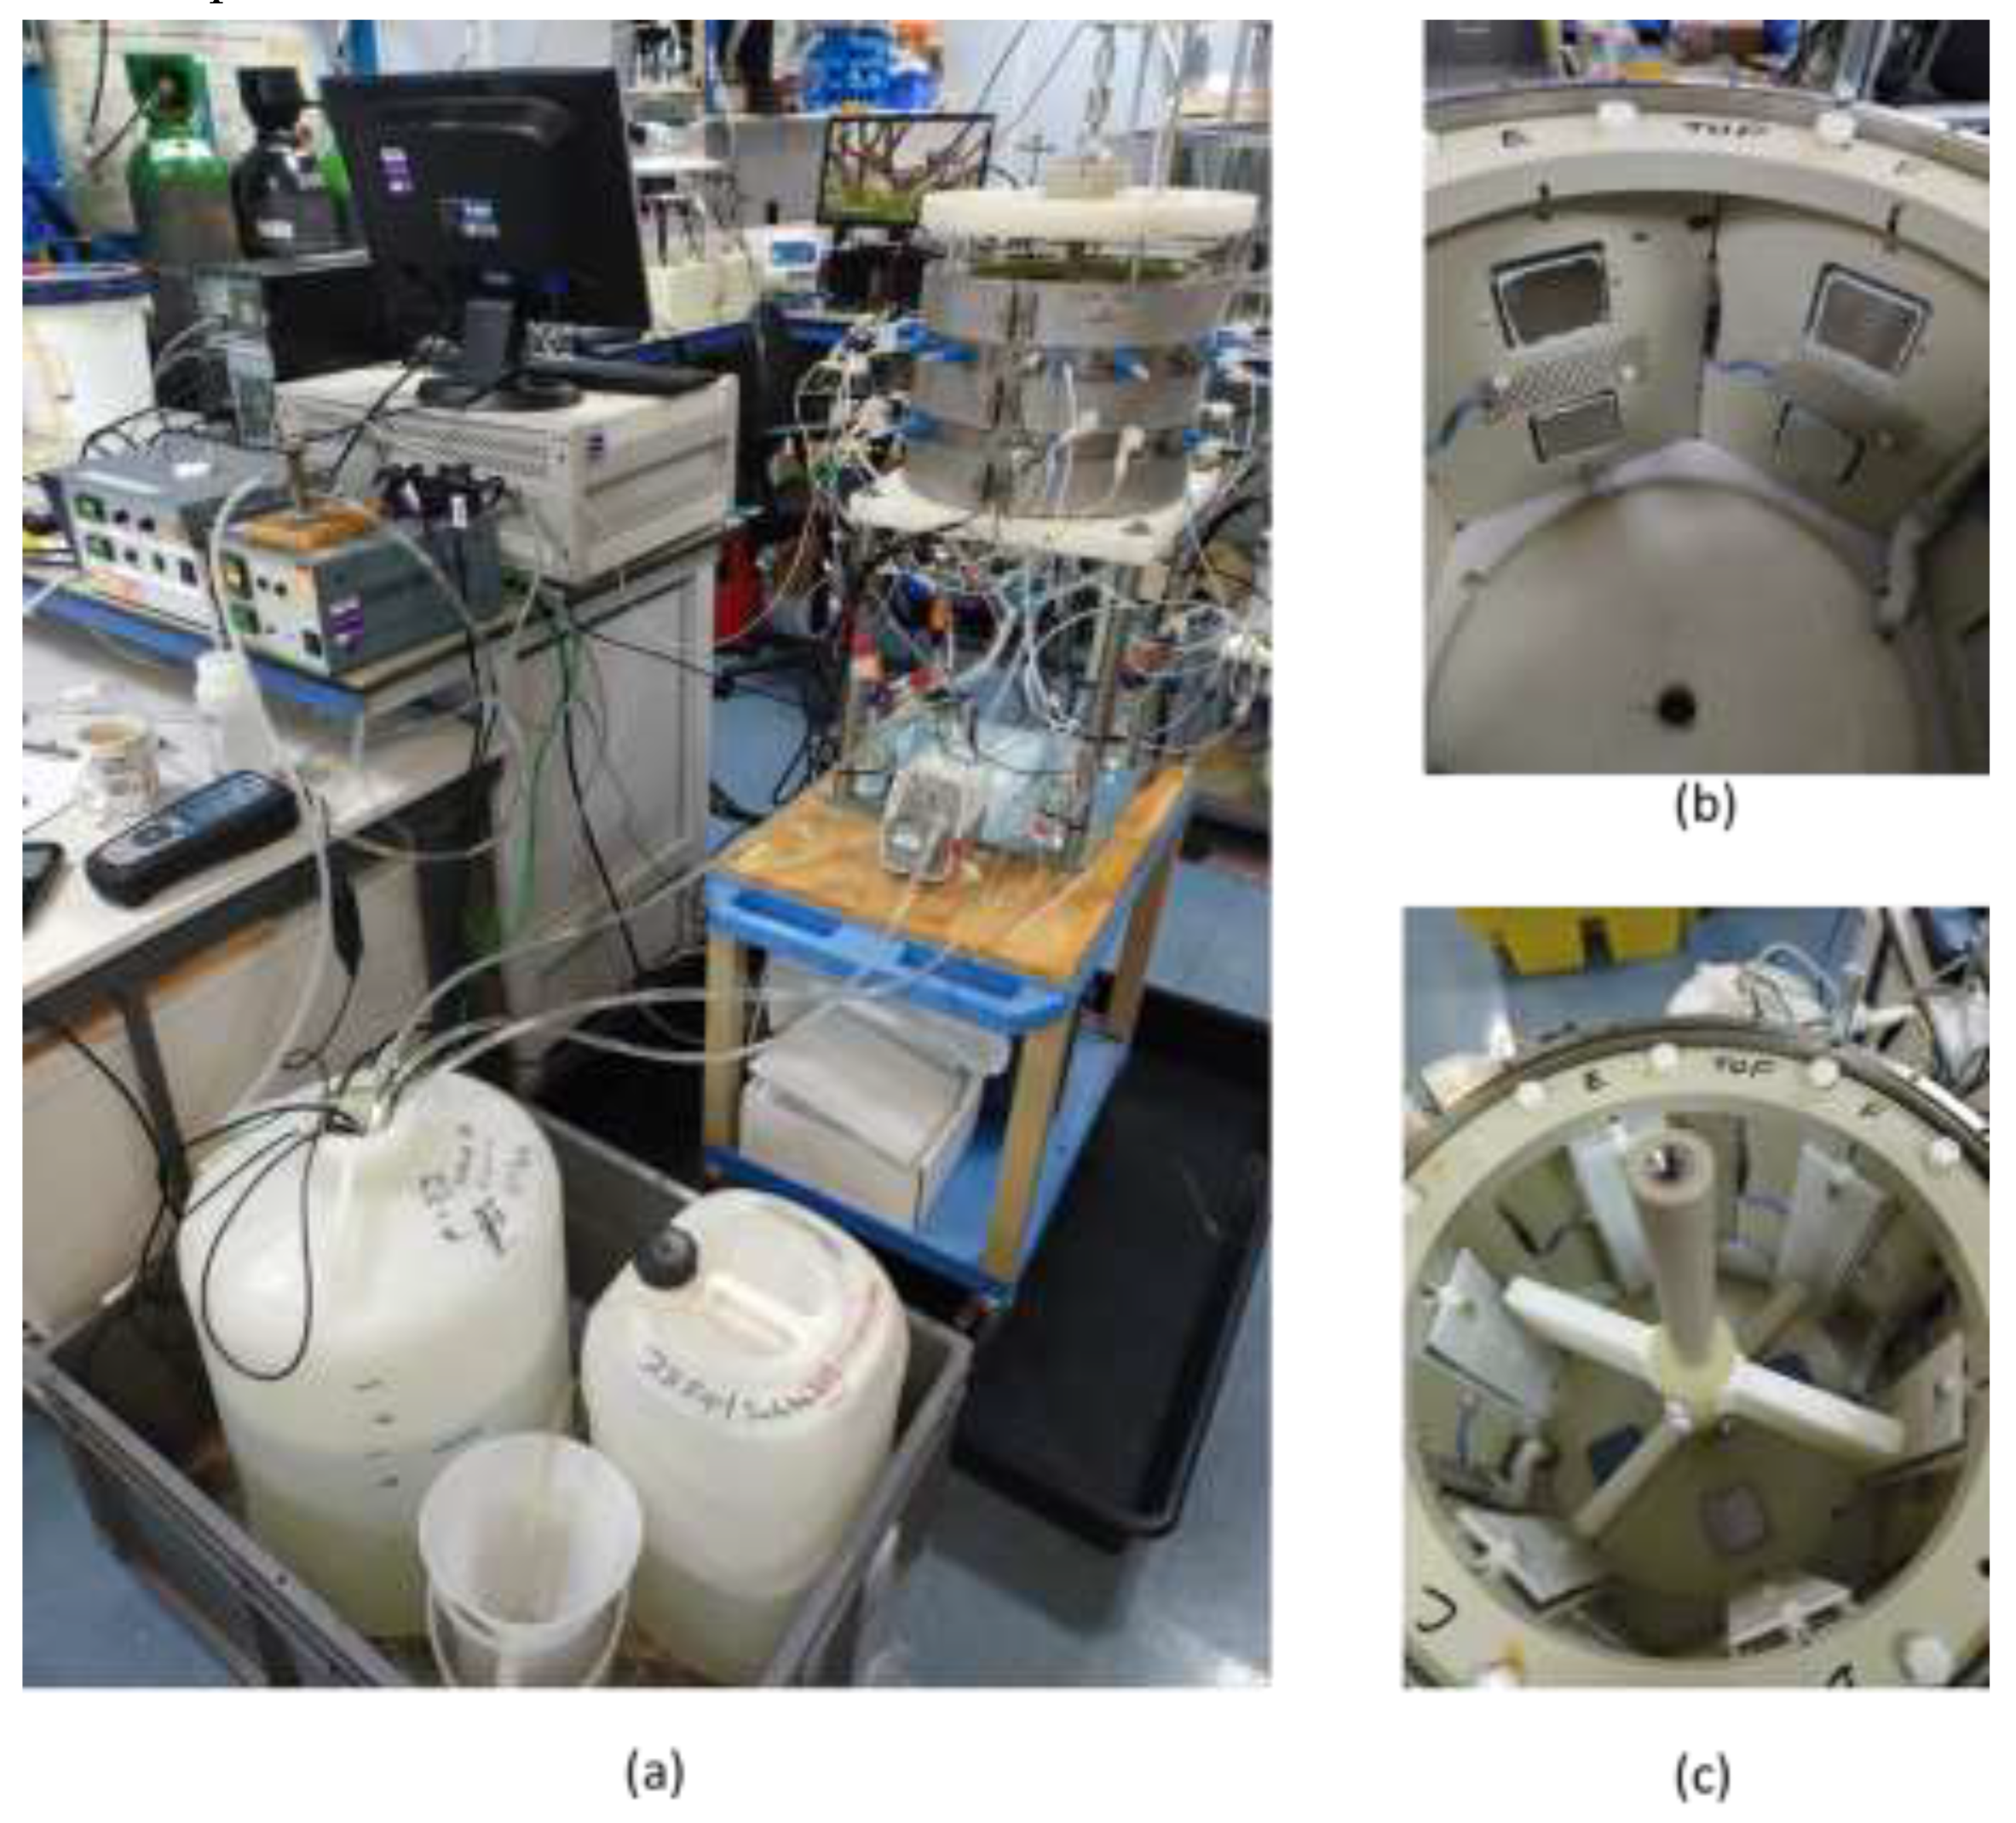
In this investigation, the fluid dynamics and chemical conditions present in geothermal site of interest were simulated, and coupons of different materials were exposed to these simulated conditions in order to investigate materials’ environmental degradation (corrosion tests). To achieve this objective, a small-scale vessel with rotating paddles was built, the coupons inserted in this vessel were instrumented to measure electrochemical activity (
Figure 1 shows images of the built test rig). The targeted component within the geothermal site for the simulation of the flow conditions was the retention tank, which is used for extraction of scaling products from the brine that could cause blockages in the system. The small-scale laboratory testing permitted variables such as material type to be more rapidly assessed than was possible in the demonstration full-scale retention tank on site in the geothermal plant.
2.1.2. Simulation of Flow Conditions
Specifically, the modeling aimed to approximate turbulence levels within the scaling reactor (retention tank) within the fabricated small-scale vessel. Computational Fluid Dynamics (CFD) analysis was used to understand metrics indicating turbulent mixing in the scaling tank: parameters such as the turbulent intensity, viscosity ratio and kinetic energy were taken into account. In order to confidently achieve a robust and sensible solution, mesh grid independence studies were undertaken for each geometry. This was primarily carried out by increasing the total number of volume elements in the grid domain and reducing the size of face elements in the regions of interest, particularly near the relevant solid walls. The following assumptions were used for the model: (i) Steady state flow, (ii) The Reynolds-Averaged-Navier-Stokes (RANS) approach was adopted, in order to determine the best possible approximation of the velocity and pressure fields around the scaling reactor and small-scale vessel prototypes (iii) The temperature was assumed to be constant and uniform and (iv) Tetrahedral mesh elements were selected, due to their capability to reasonably capture the fluid flow behaviour in complex geometries.
Finally, due to the challenges in fully replicating the flow complexities from the large simulation tank to the small-scale vessel, a one-to-one correlation in flow conditions was not achieved. Specifically, in the small-scale vessel, the main flow-field mechanism is swirling, whereas in the retention tank, separated flow is more common. Wall shear stress (calculated to be at 3.1 mPa in the coupons in the retention tank) was chosen as the key metric for the simulation, as it reflects the tangential mechanical action of the fluid on a solid wall immersed in a flow field. It should be noted that the output of this analysis was the rotation speed of the paddles. Further details of this study can be found in reference [
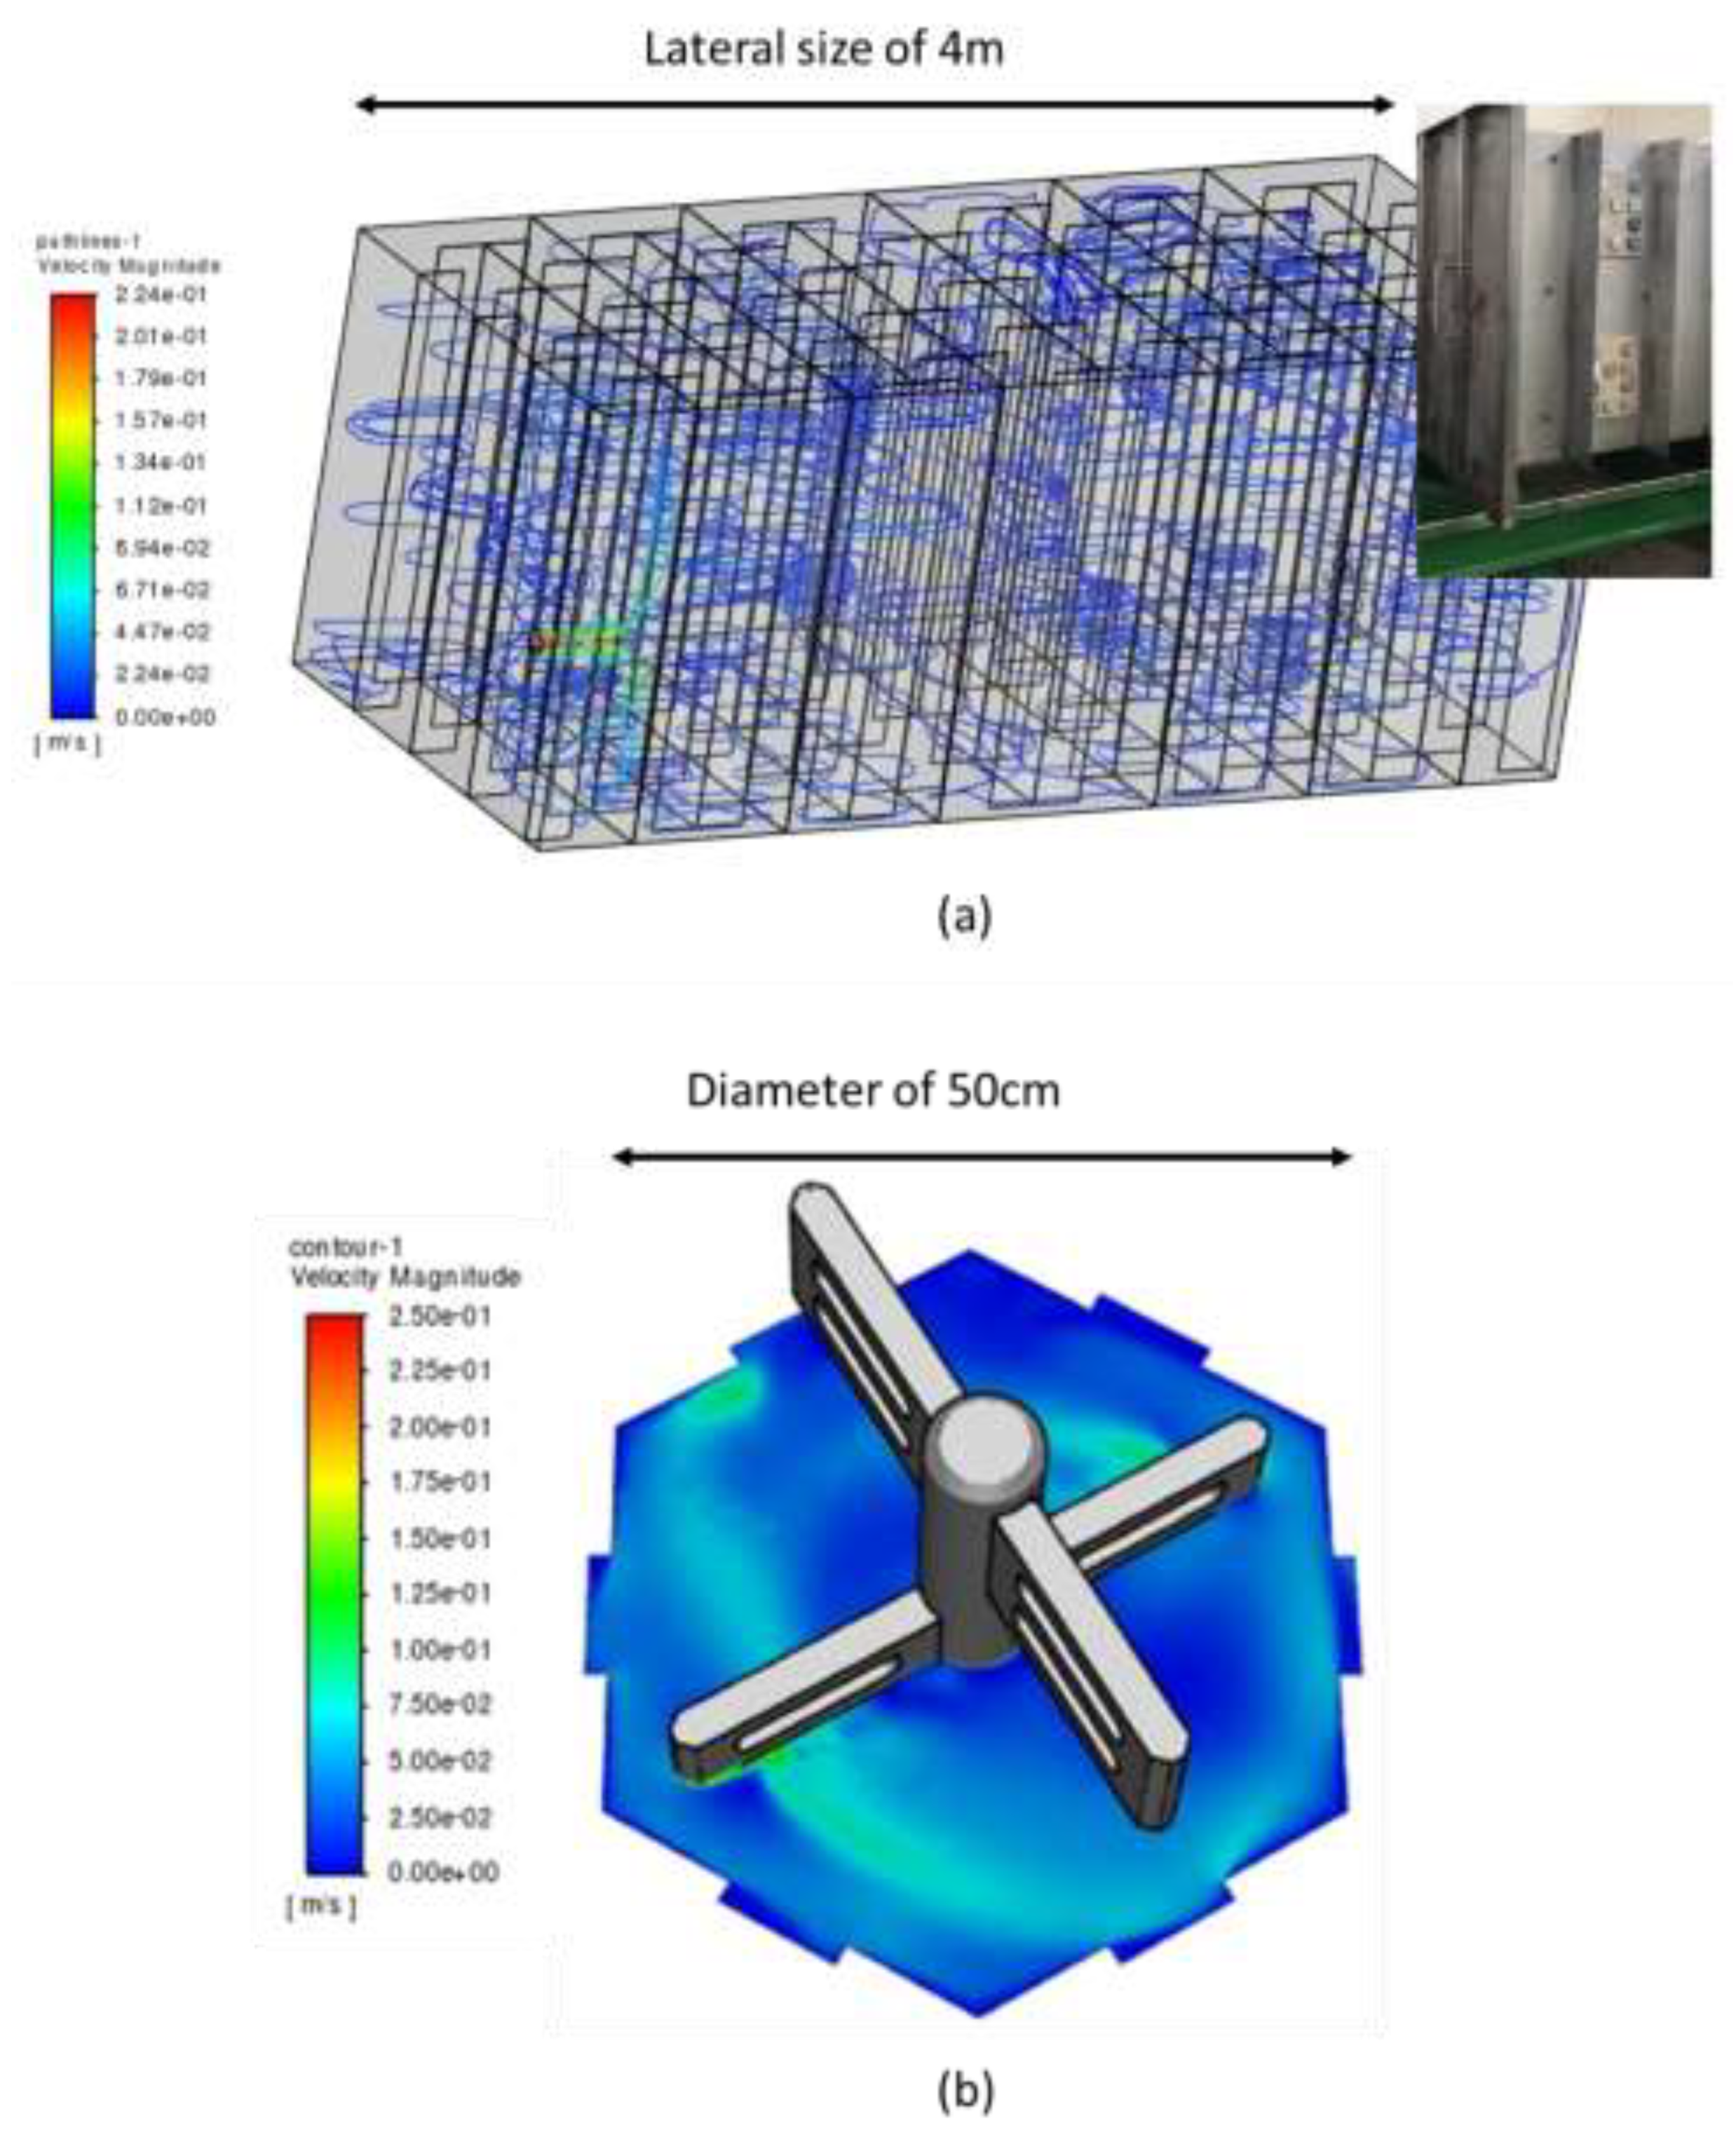
17]. Note: As an indication of the differences in size and geometry of the retention tank and the small scale vessel, images generated from the software used to perform the CFD are shown in
Figure 2.
2.1.3. Brine Chemistry
The chemistry used in the simulated environment was based on the field conditions that were measured at the Kizildere II geothermal power plant after the low pressure separator, see
Table 1. The solution composition for the tests was chosen to include the elements that would be corrosive to the metals and alloys (chloride, CO
2) and/or would be involved in the scaling (Ca, Mg, SiO
2).
The testing temperature was 50oC, which is in the operating temperature in the targeted geothermal system, and should represent a good compromise between scaling and corrosion. Note: This is the temperature which will generate the maximum thermal efficiency in the system as it can assist in increasing the temperature range of heat energy extraction. Conversely, at this temperature, the scaling tendency should be higher than at higher temperature, and therefore supports the objective of the scaling retention tank.
For the preparation of the solution, 2 g of NaOH were added to 500 ml of deionized water (DI) water to make a solution of 0.1M NaOH. Following this, 1.804g of SiO2 were added to the 500 ml solution of NaOH (this was called solution 1). In another flask, 24.2g of NaHCO3 and 7.64 g NaCO3 were diluted in 2 l of DI water (this was called solution 2). When the SiO2 was completely dissolved in solution 1, this was mixed with solution 2. Subsequently, 0.5388 g of Calcium Chloride Dihydrate (CaCl2∙2H2O) and 0.7398 g of Magnesium chloride hexahydrate (MgCl2.6H2O) were added to the mixed solution (solution 1 + 2). Finally, the final solution was diluted in DI water to give a total of 4 l and drops of 5M NaOH were added to adjust the pH to 9.7, while at room temperature.
A 50 l solution reservoir was used for the tests, and the solution in this reservoir was transported to the testing tank using a peristaltic pump.
2.1.4. Materials
For this investigation, metallic alloys and different type of coatings were exposed to the brine to determine the effects of the environment. The materials used were: carbon steel S355JR, austenitic stainless steel 304L stainless steel, lean duplex stainless steel SS LD24 (, and the following coatings, defined as: Epoxy type coating A (anti-scale promoter), Epoxy type B coating (scale promoter) and thermally sprayed aluminium (TSA). The substrate for the coated samples was carbon steel S355JR. The size of the coupons was 40 mm x 40 mm, with a thickness of 5 mm. They were fixed inside the small-scale vessel in two orientations: vertical (i.e., on the vessel wall) and horizontal (i.e., on the vessel base). Only the vertical coupons were instrumented for electrochemical measurements.
2.1.5. Electrochemical Measurements
The monitoring of corrosion activity in the test vessel was carried out using open circuit potential (OCP) and linear polarization resistance (LPR) measurements. The measurements were conducted using a standardized 3 electrode cell set-up. For the reference electrode, an Ag/AgCl reference electrode was used via a salt bridge to the small scale vessel, and for the counter electrode, multiple platinized titanium mesh of approximately 40mm x 70mm were used. The temperature was regulated in the solution reservoir using a Grant Instruments™ TX-150 heater. Temperature measurements were carried out in the solution reservoir and in the small scale vessel. An ACM potentiostat was employed for the monitoring and controlling of current and voltage to carry out the electrochemical testing.
The LPR measurements were conducted every hour and the polarization resistance (Rp) was obtained by polarizing the working specimens by ±20mV vs. the Open Circuit Potential (OCP). Potentiodynamic polarization scans were carried out in order to determine the values of the Tafel slopes for the determination of the corrosion rate based on the LPR measurements. Further details about the procedure for determination of the corrosion rate based on the polarization resistance can be found in ASTM G59 – 97 [
18].
2.1.6. Protocol of Post-Test Examination of the Coupons
After completion of the test, after approximately 12 days of immersion, the samples were inspected visually to determine either scaling or corrosion events. Following this, the samples were examined in the scanning electron microscope in order to obtain high magnification imaging of the samples and using energy-dispersive X-ray spectroscopy (EDX) to perform elemental analyses. Following this, the samples were examined by X-ray diffraction (XRD).
3. Results
3.1. Electrochemical Measurments on the Vertical Coupons
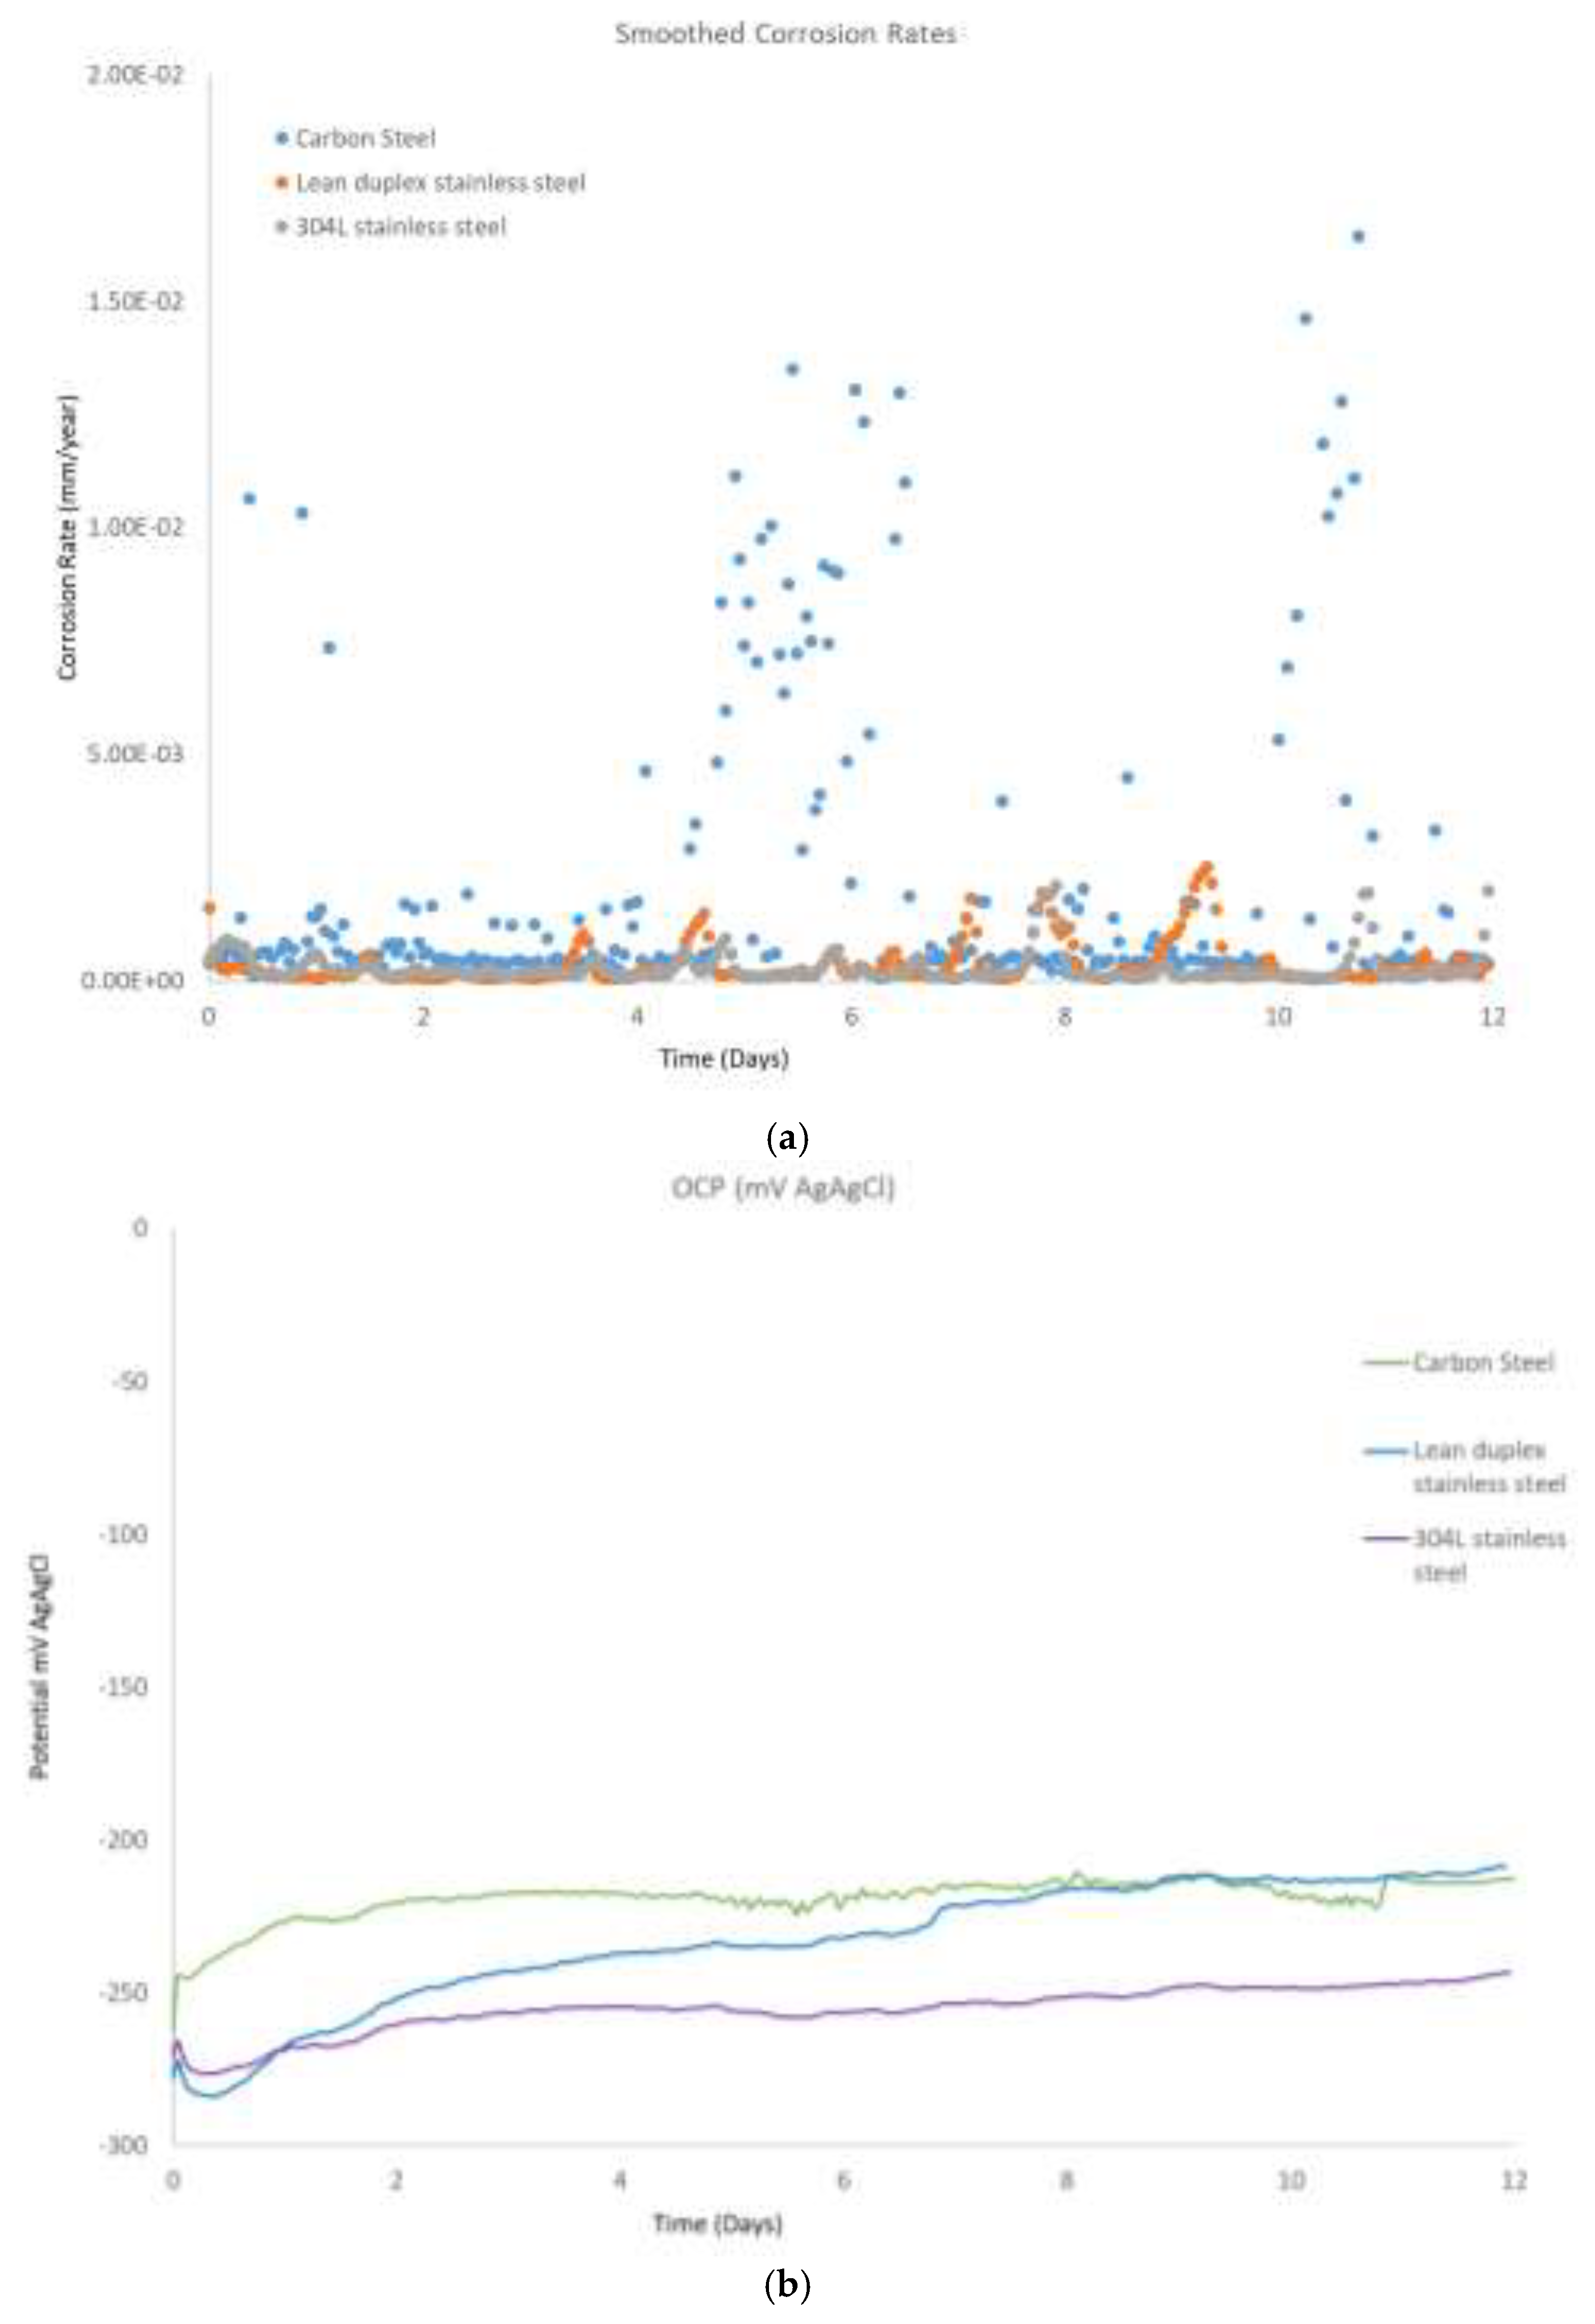
Figure 3a shows representative examples of the corrosion rates calculated for coupons of carbon steel, stainless steel and from the LPR measurements. As observed from the curves, the corrosion rate tends to be higher in the carbon steel specimen, as expected - this tended to be in the range below 0.002mm/year, with no peak above 0.015mm/year. The first peak (between day 5 and 6), was attributed to the very small addition of diluted HCl, this was used to keep the pH at 9.7, as an increase in pH was noted by day 5 of testing, the reason behind the second peak is unknown. For carbon steel, depending on the application, different corrosion rate acceptability criteria (corrosion allowance) have been established (user defined) [
19], however, the numbers obtained from tests are indicative, in general, of low corrosion rate. Regarding the OCP measurements,
Figure 3b, it can be seen that the initial OCP value was similar for all the materials at around -260mV vs Ag/AgCl (silver chloride) electrode at the beginning of the tests, and in the case of the carbon steel coupons, this did not show a particular trend throughout the duration of the tests. In the case of the stainless steel and the lean duplex stainless steel sample, this shifted to a slightly more positive potential by the end of the 12 days testing, this variation reflects a change in the cathodic and/or anodic reactions occurring on the surface of the coupons i.e. formation of scale on the surface of the samples. In the case of the TSA coupons,
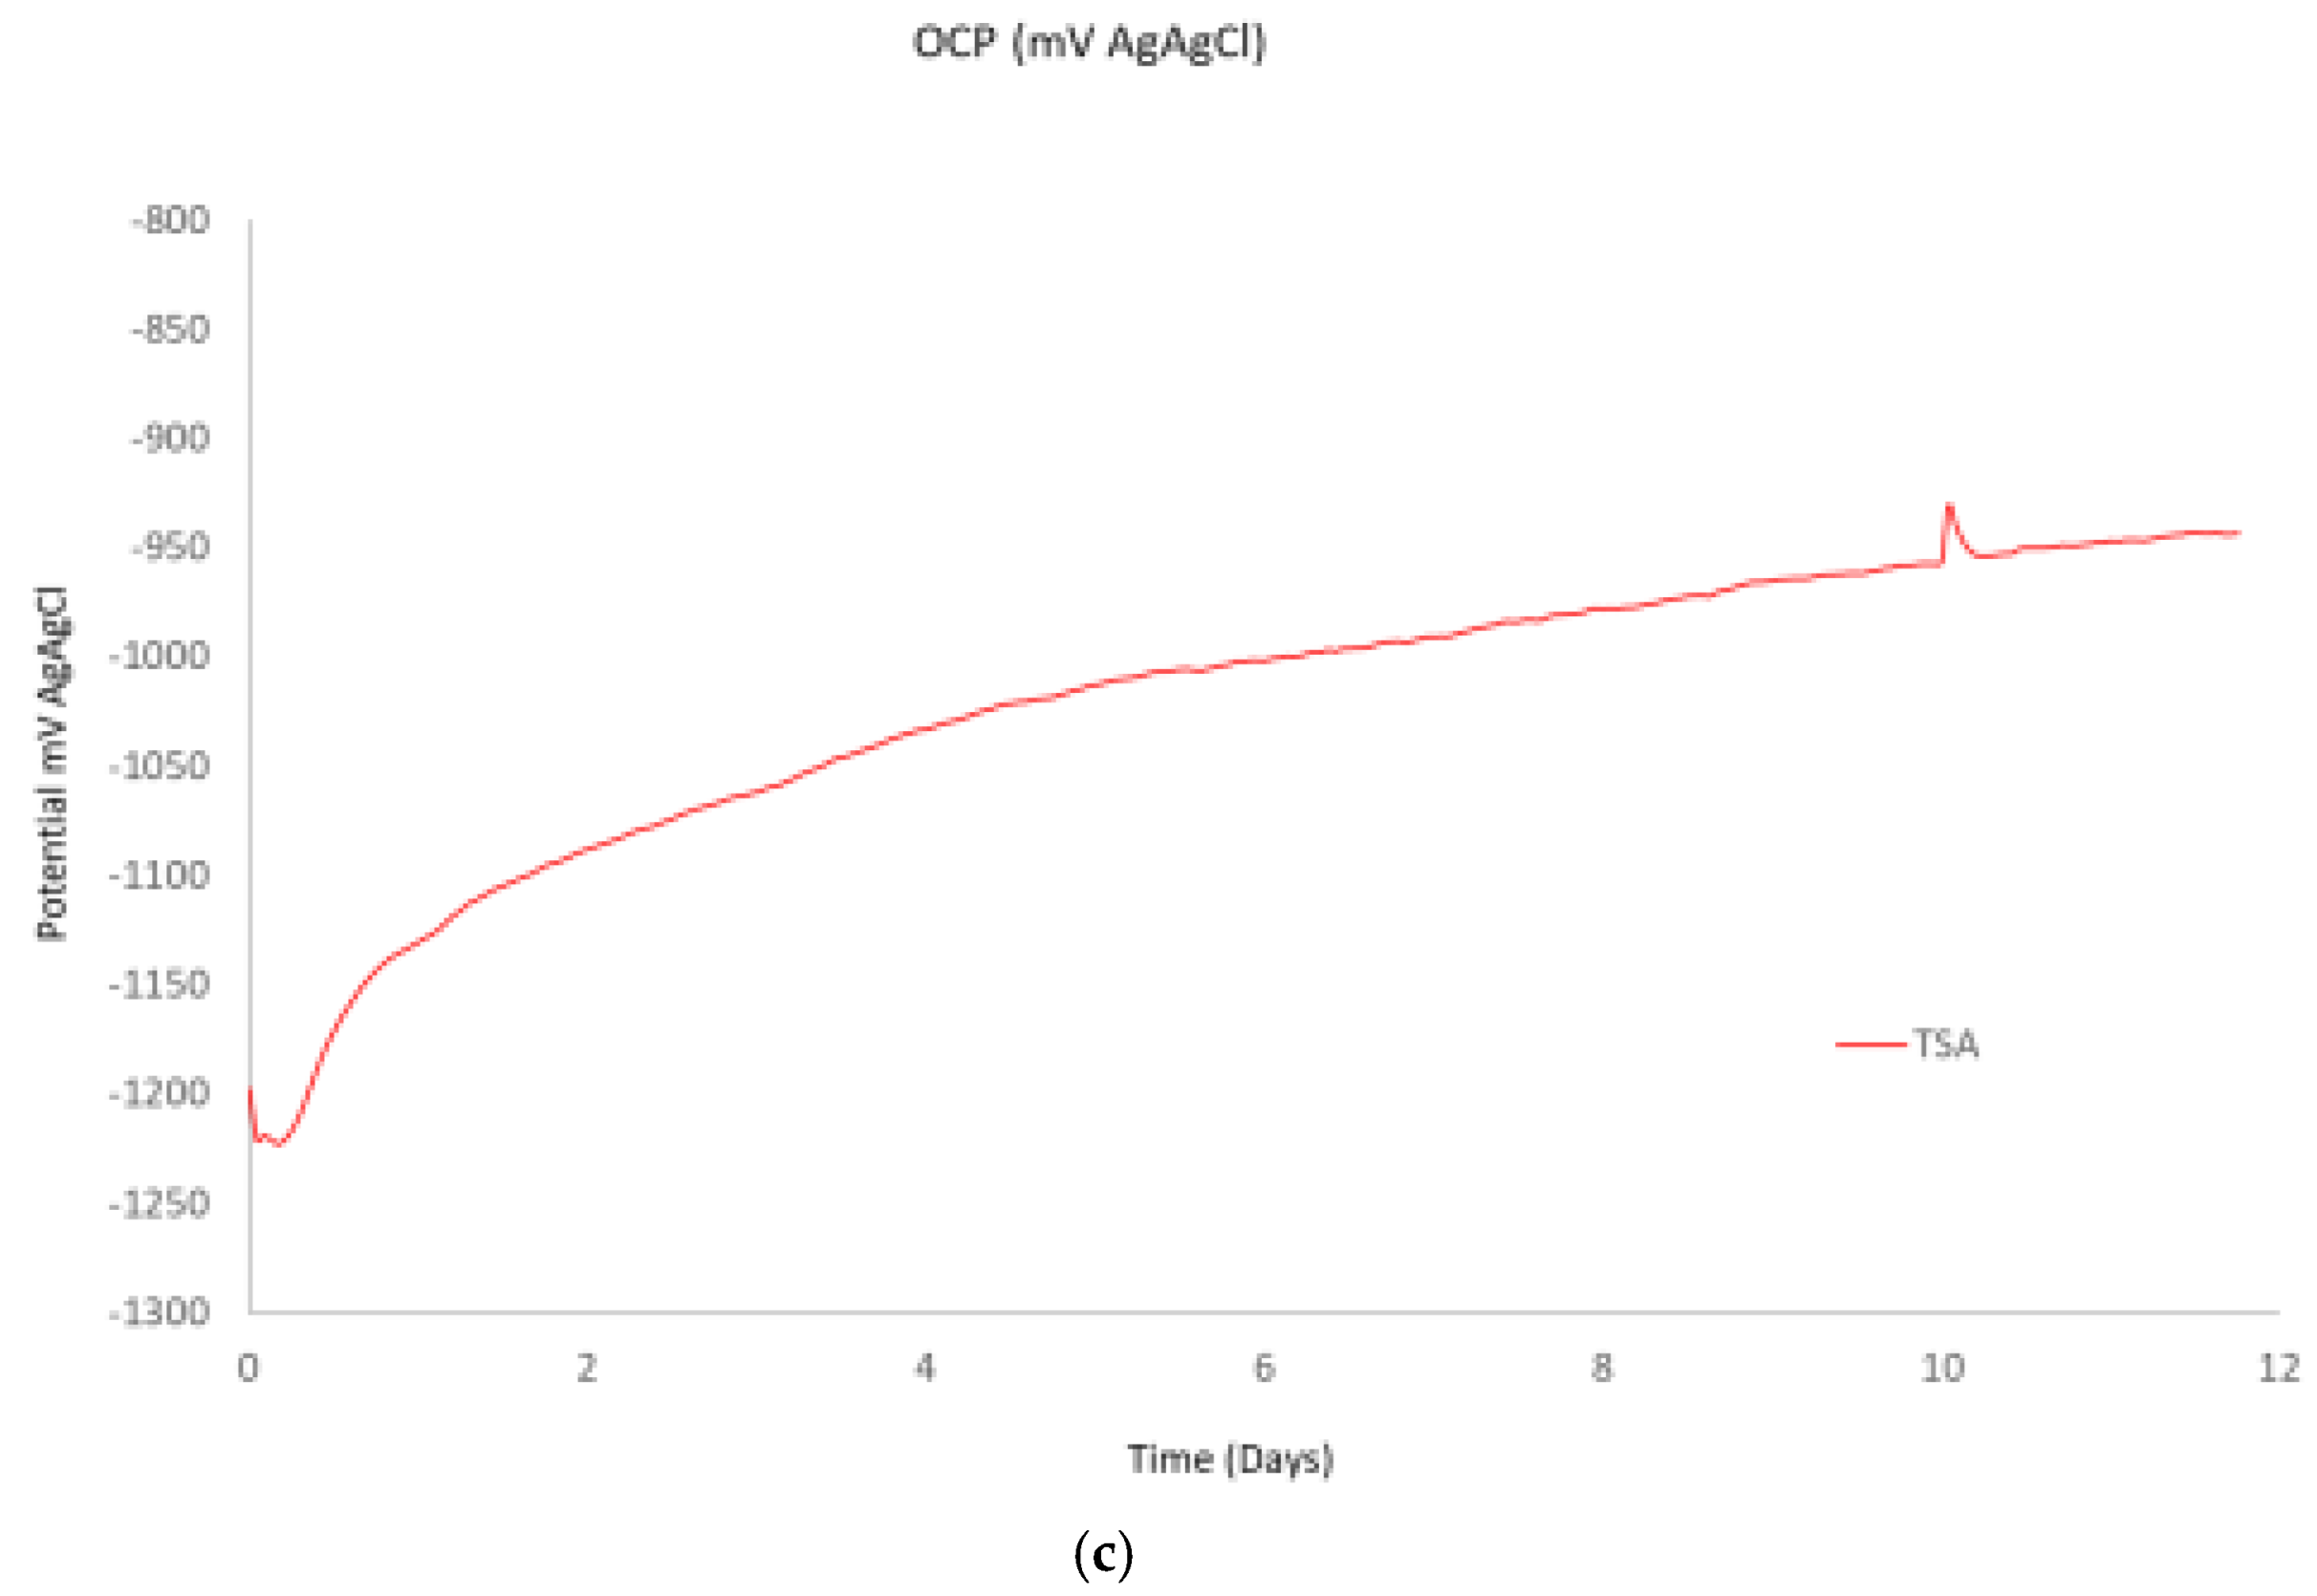
Figure 3c, the OCP measurements showed an initial drop in potential (more negative), in the first few hours, followed by an increase during the subsequent next 12 days. In the case of TSA, it should be noted that due to the pores structure of the coating, if electrolyte penetrates through the coating, the OCP could be mixed potential of the aluminum coating and the carbon steel substrate. In particular, investigation of TSA in the literature have revealed that the initial drop in potential could be attributed to dissolution of the air formed film, while the subsequent increase could be attributed to the formation of protective corrosion products or calcareous deposits [
20].
In the case of the Epoxy coated specimens, the slope of the LPR measurements was consistent with very low corrosion rates, and another feature of these measurements was that the OCP data acquired were noisy - these two features are indicative of no electrochemical activity on the substrate material.
3.2. Visual Examination of the Coupons after Testing
After completion of the 12 days of testing, the samples were removed from the small-scale vessel, rinsed with deionized water, and allowed to dry in air. Visual comparison of the vertical coupons before and after testing revealed no significant differences in the appearance of the samples, apart from a minor level of scaling on the surface and that the samples appeared to be more opaque in comparison with the initial shiny appearance of these surfaces (see
Figure 4), this opaqueness could also suggest that the changes in OCP could not be attributed only to scaling, but, also to the influence of the brine in the passive/ air formed layer of the materials. For the Epoxy coated samples, the level of scaling on Epoxy type B appeared higher than on Epoxy type A. In contrast, the entire surface of the horizontal coupons were covered with scales of white coloured appearance.
Figure 3 provides images of all analyzed coupons. As noted from the images, due to the colour of the deposited scales and colour and texture of the TSA sample, it was not possible to fully confirm the absence of scales in this sample, however, it would appear that no scaling occurred on this sample.
Furthermore, either based on the visual appearance of the substrate-surface of the specimen, i.e., the absence of events of localized corrosion or coating peeling, or based on the colour of the deposited scales, it was considered that the materials used in the tests were not prone to corrosion after the exposed period.
3.3. SEM Examination of the Coupons
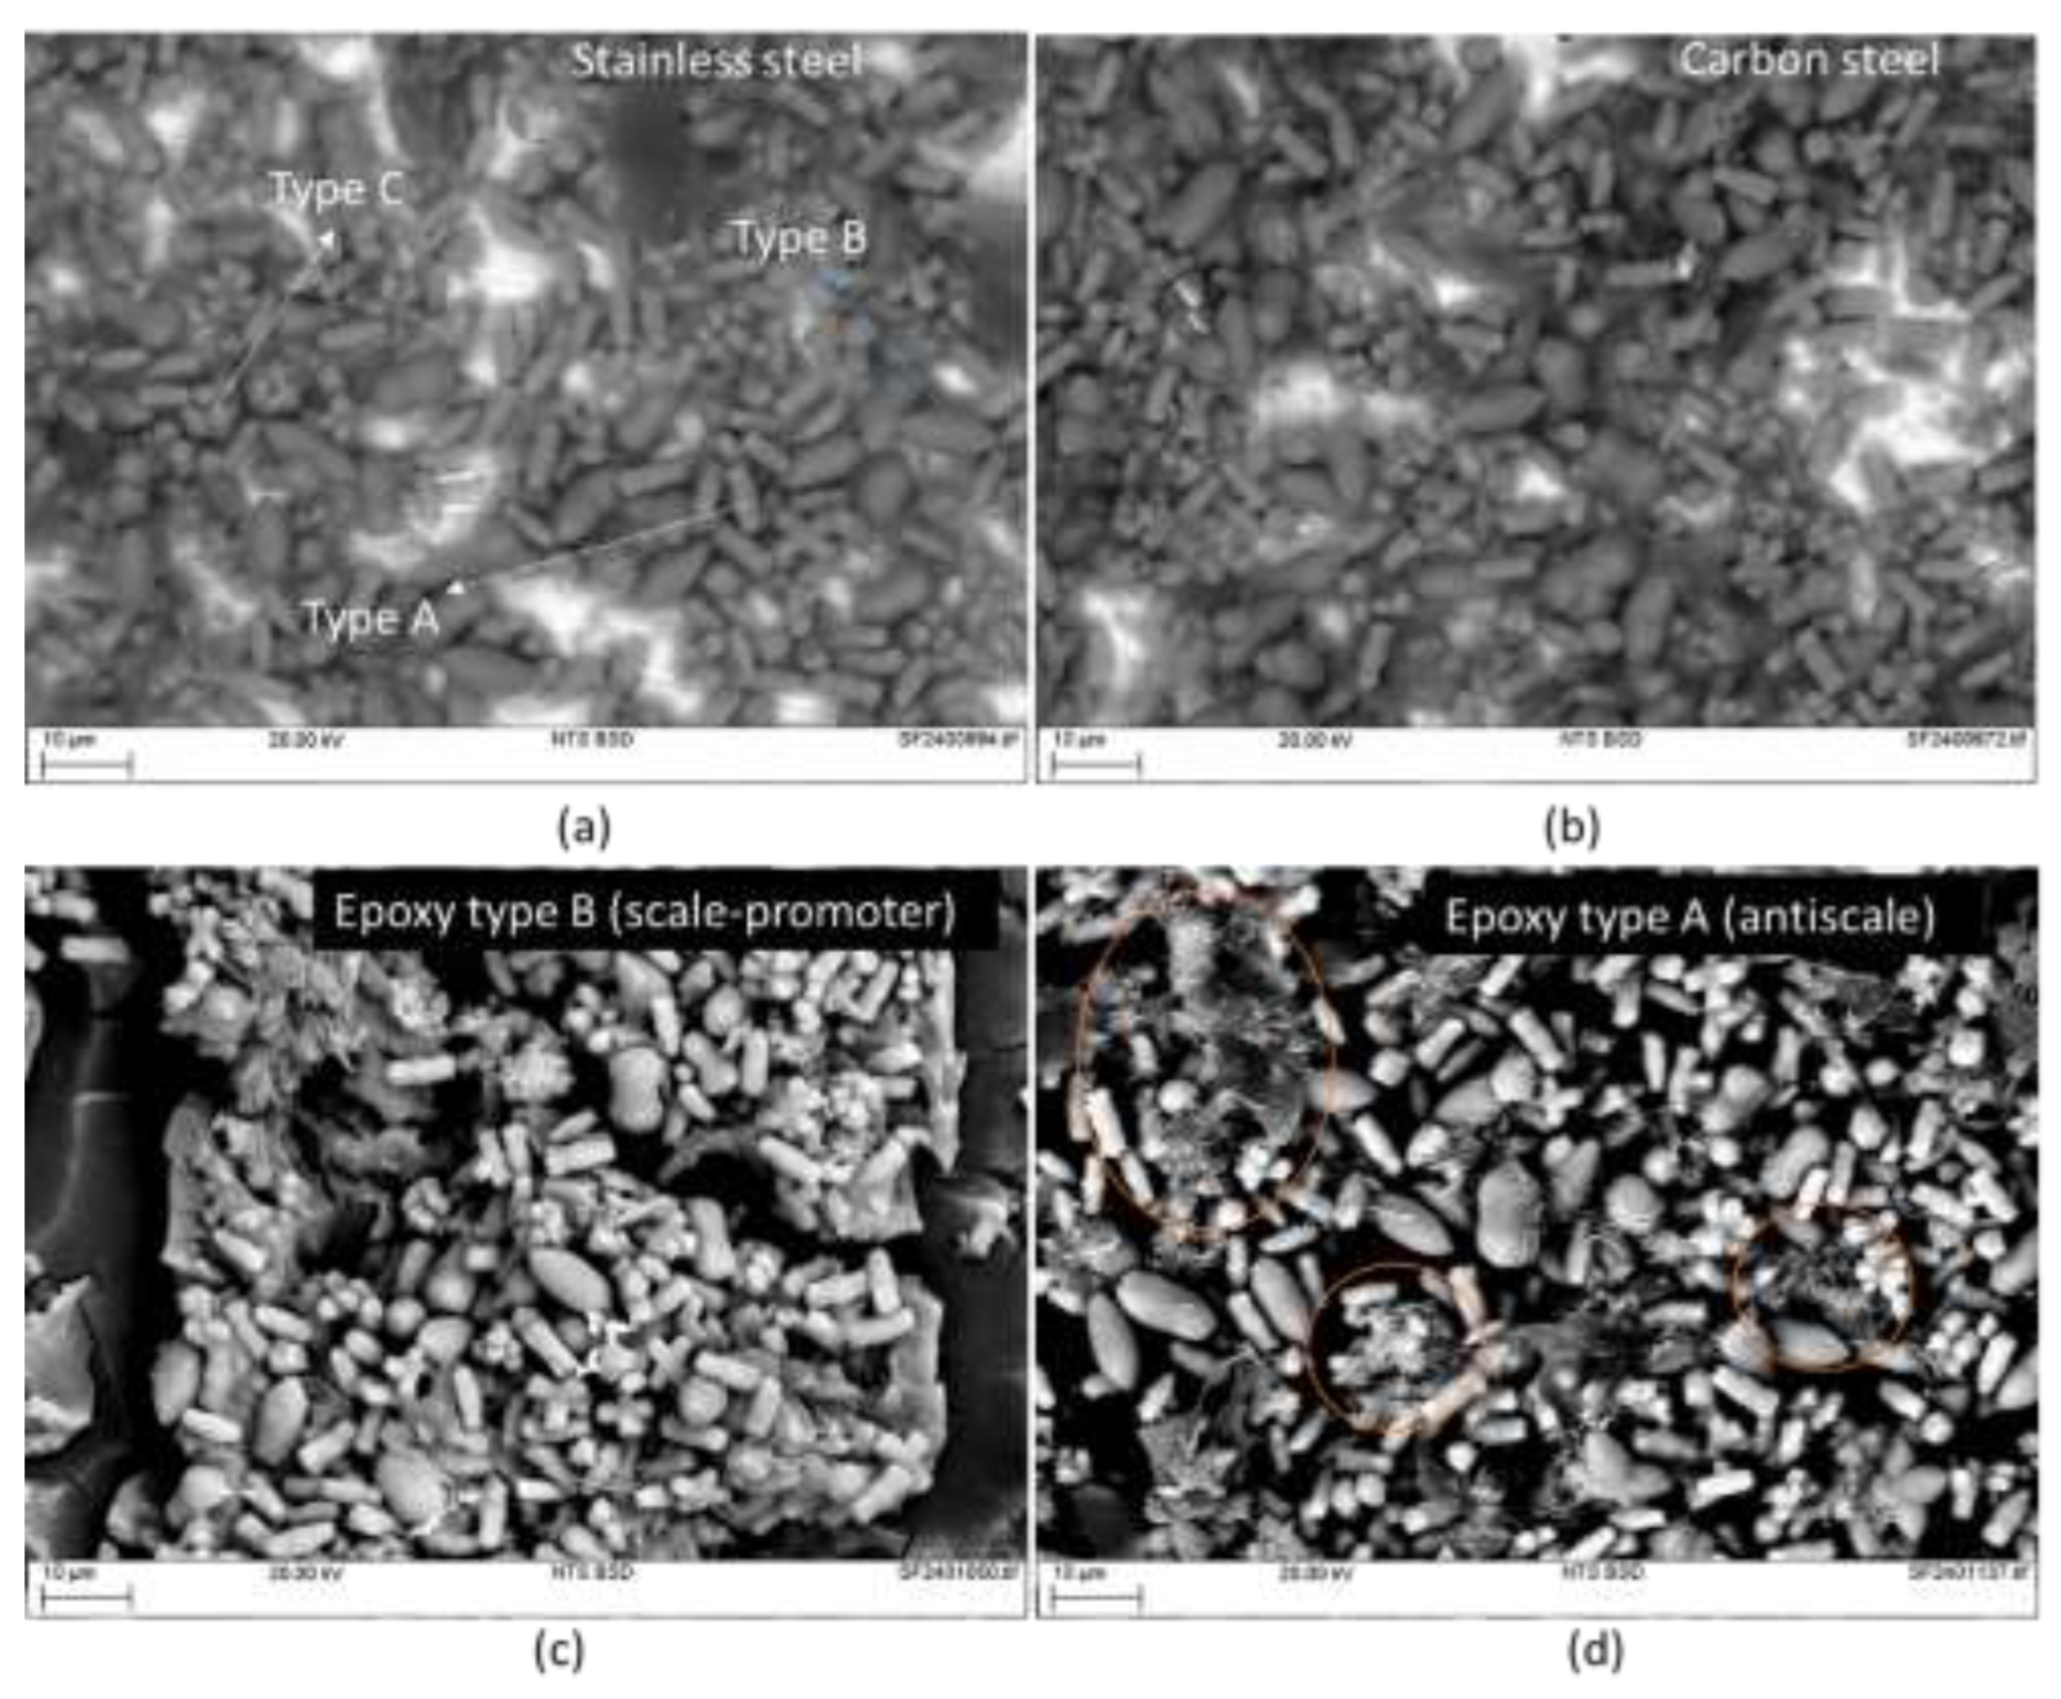
Figure 5 shows SEM images of the scales in two different coupons, carbon steel (
Figure 5a) and 304 stainless steel (
Figure 5b). The scales formed on both surfaces looked very similar, these were composed of features with very specific morphologies, which could be described as cylindrical curvy shape (Type A in
Figure 5a), a prolate spheroid “rugby ball” shape (type B in
Figure 5a) and a multi-prong shape (type C in
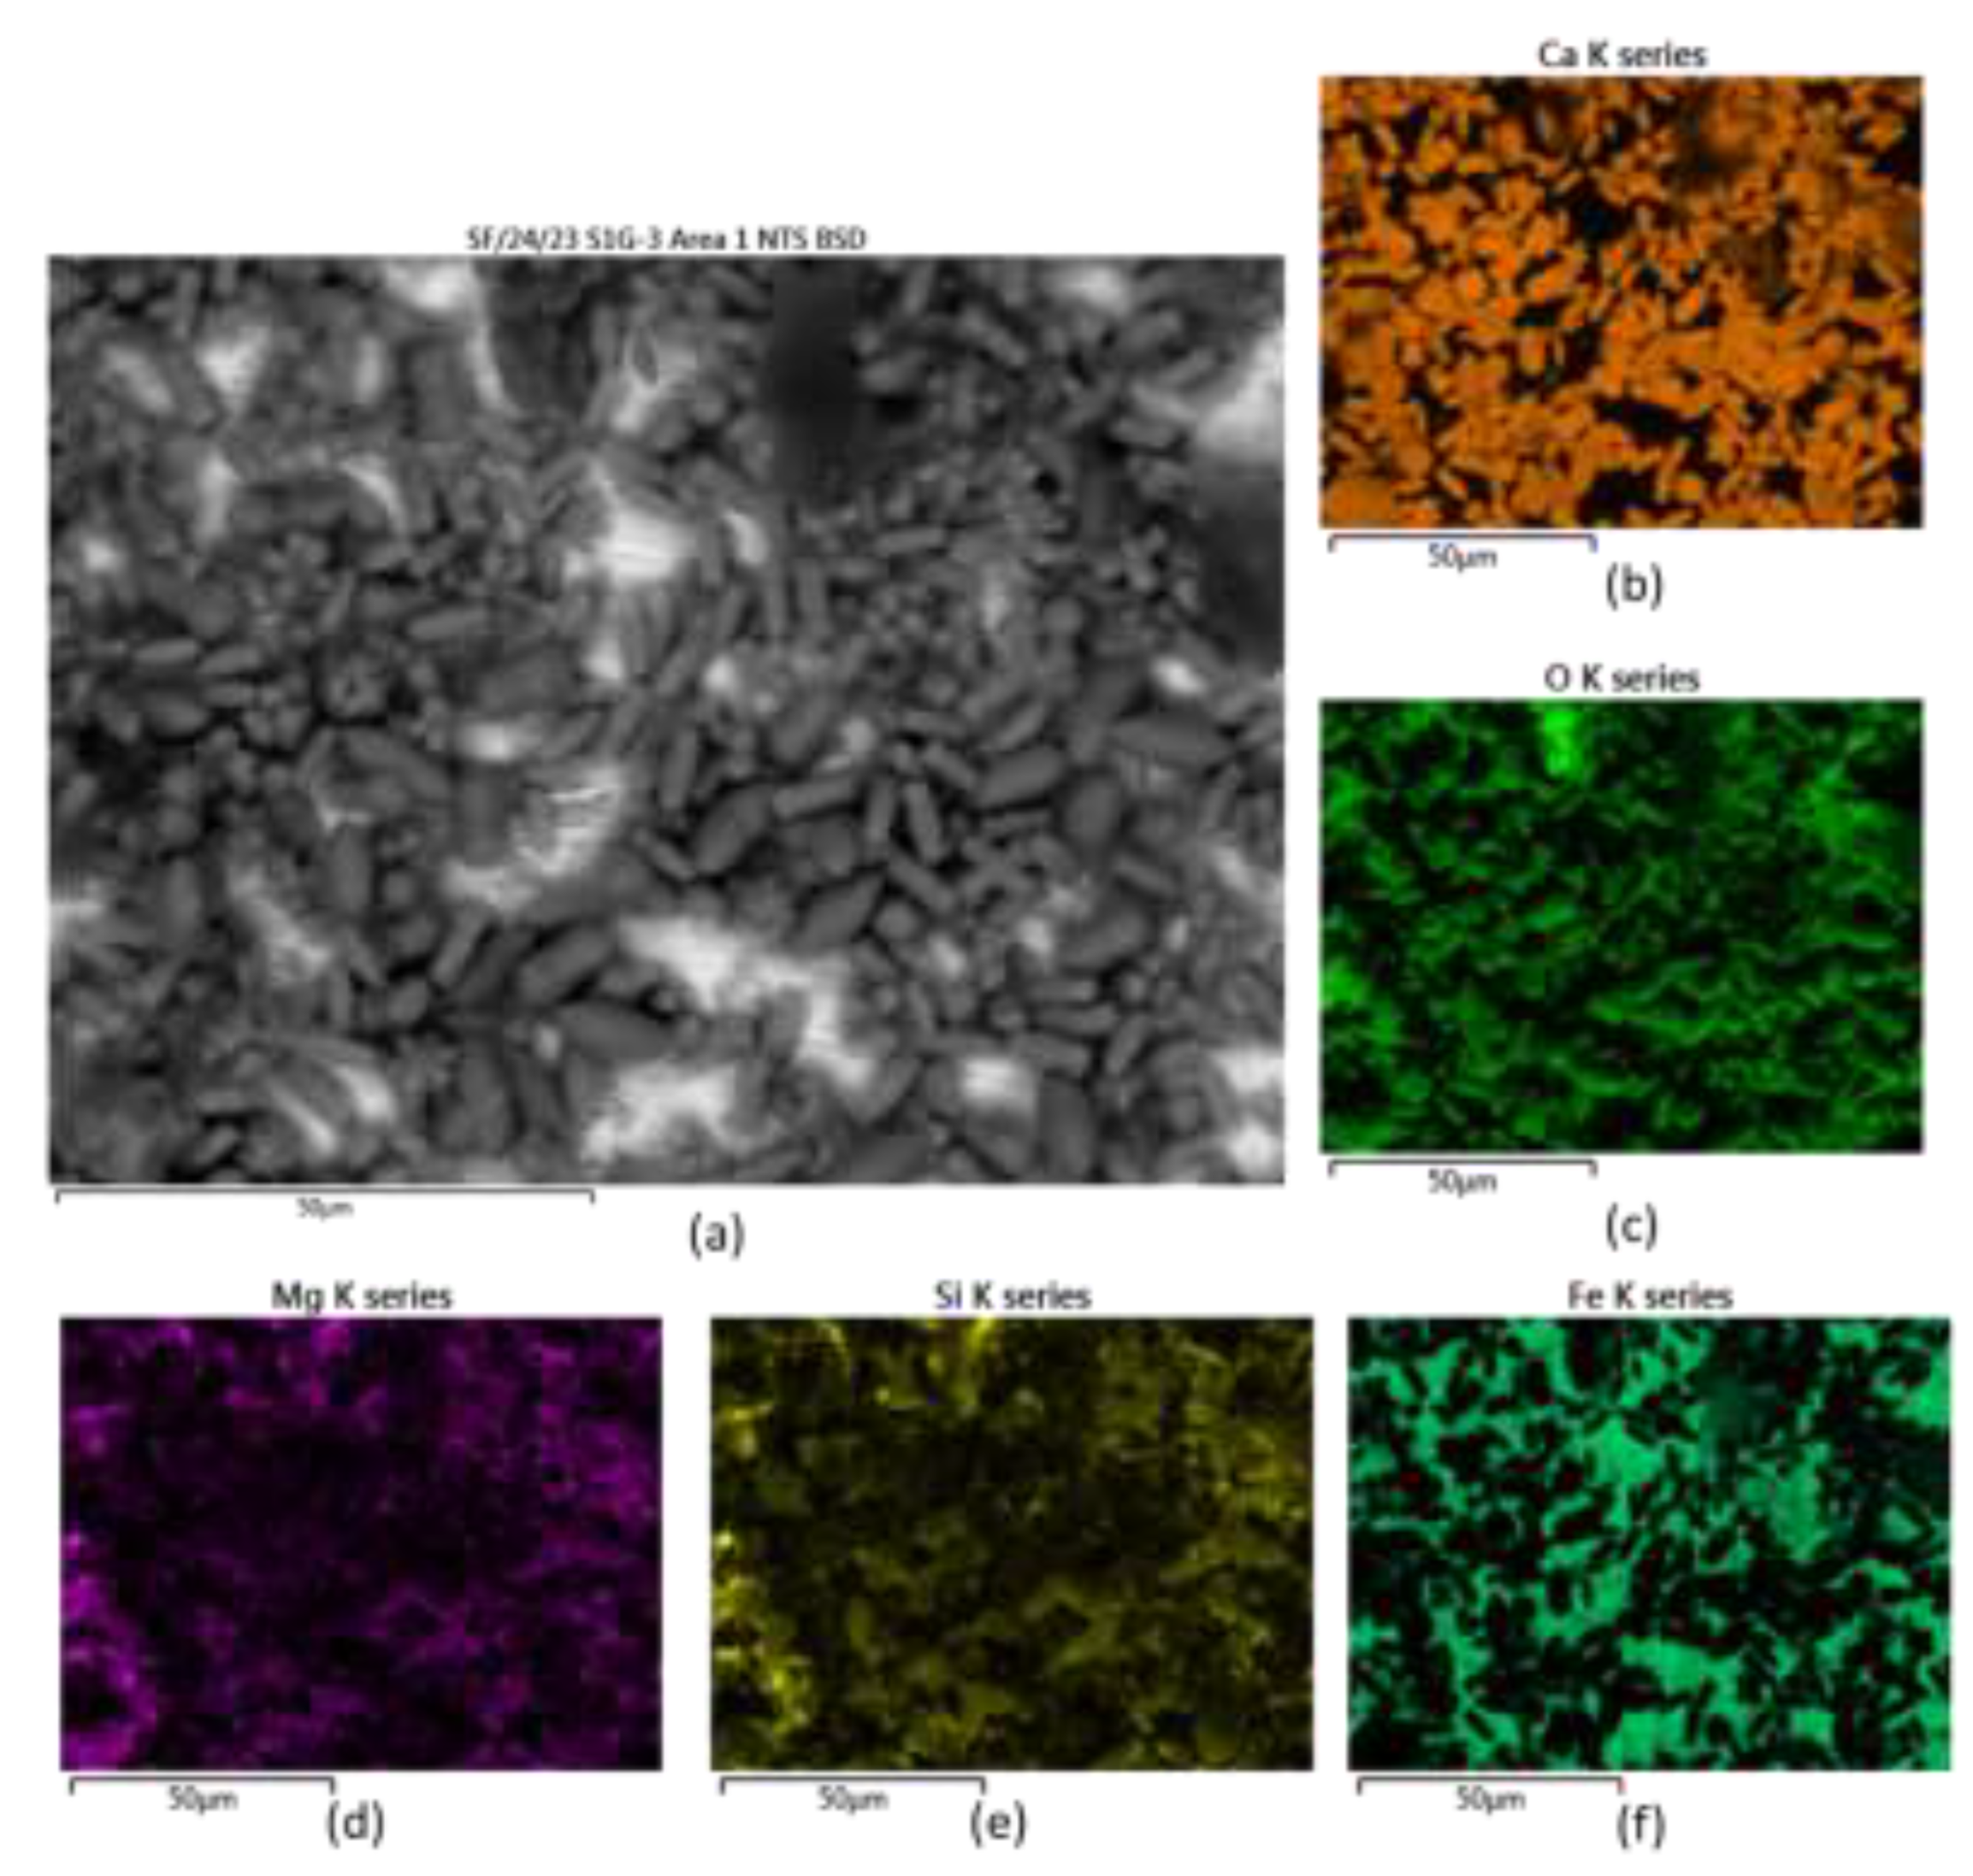
Figure 5a). The chemical identification of this from EDX mapping showed that the main elements in the scales were calcium and oxygen (it should be noted that carbon was not included in the maps due to the influence of contaminant elements enriched with this element that could appear in the map). Regarding the presence of silicon in the different types of scales on the surface, it would appear that this element can draw better the silhouette of the type B shape suggesting Si is associated with type B scales; this is the same case for magnesium. EDX maps exemplifying the behaviour described above can be seen in
Figure 6.
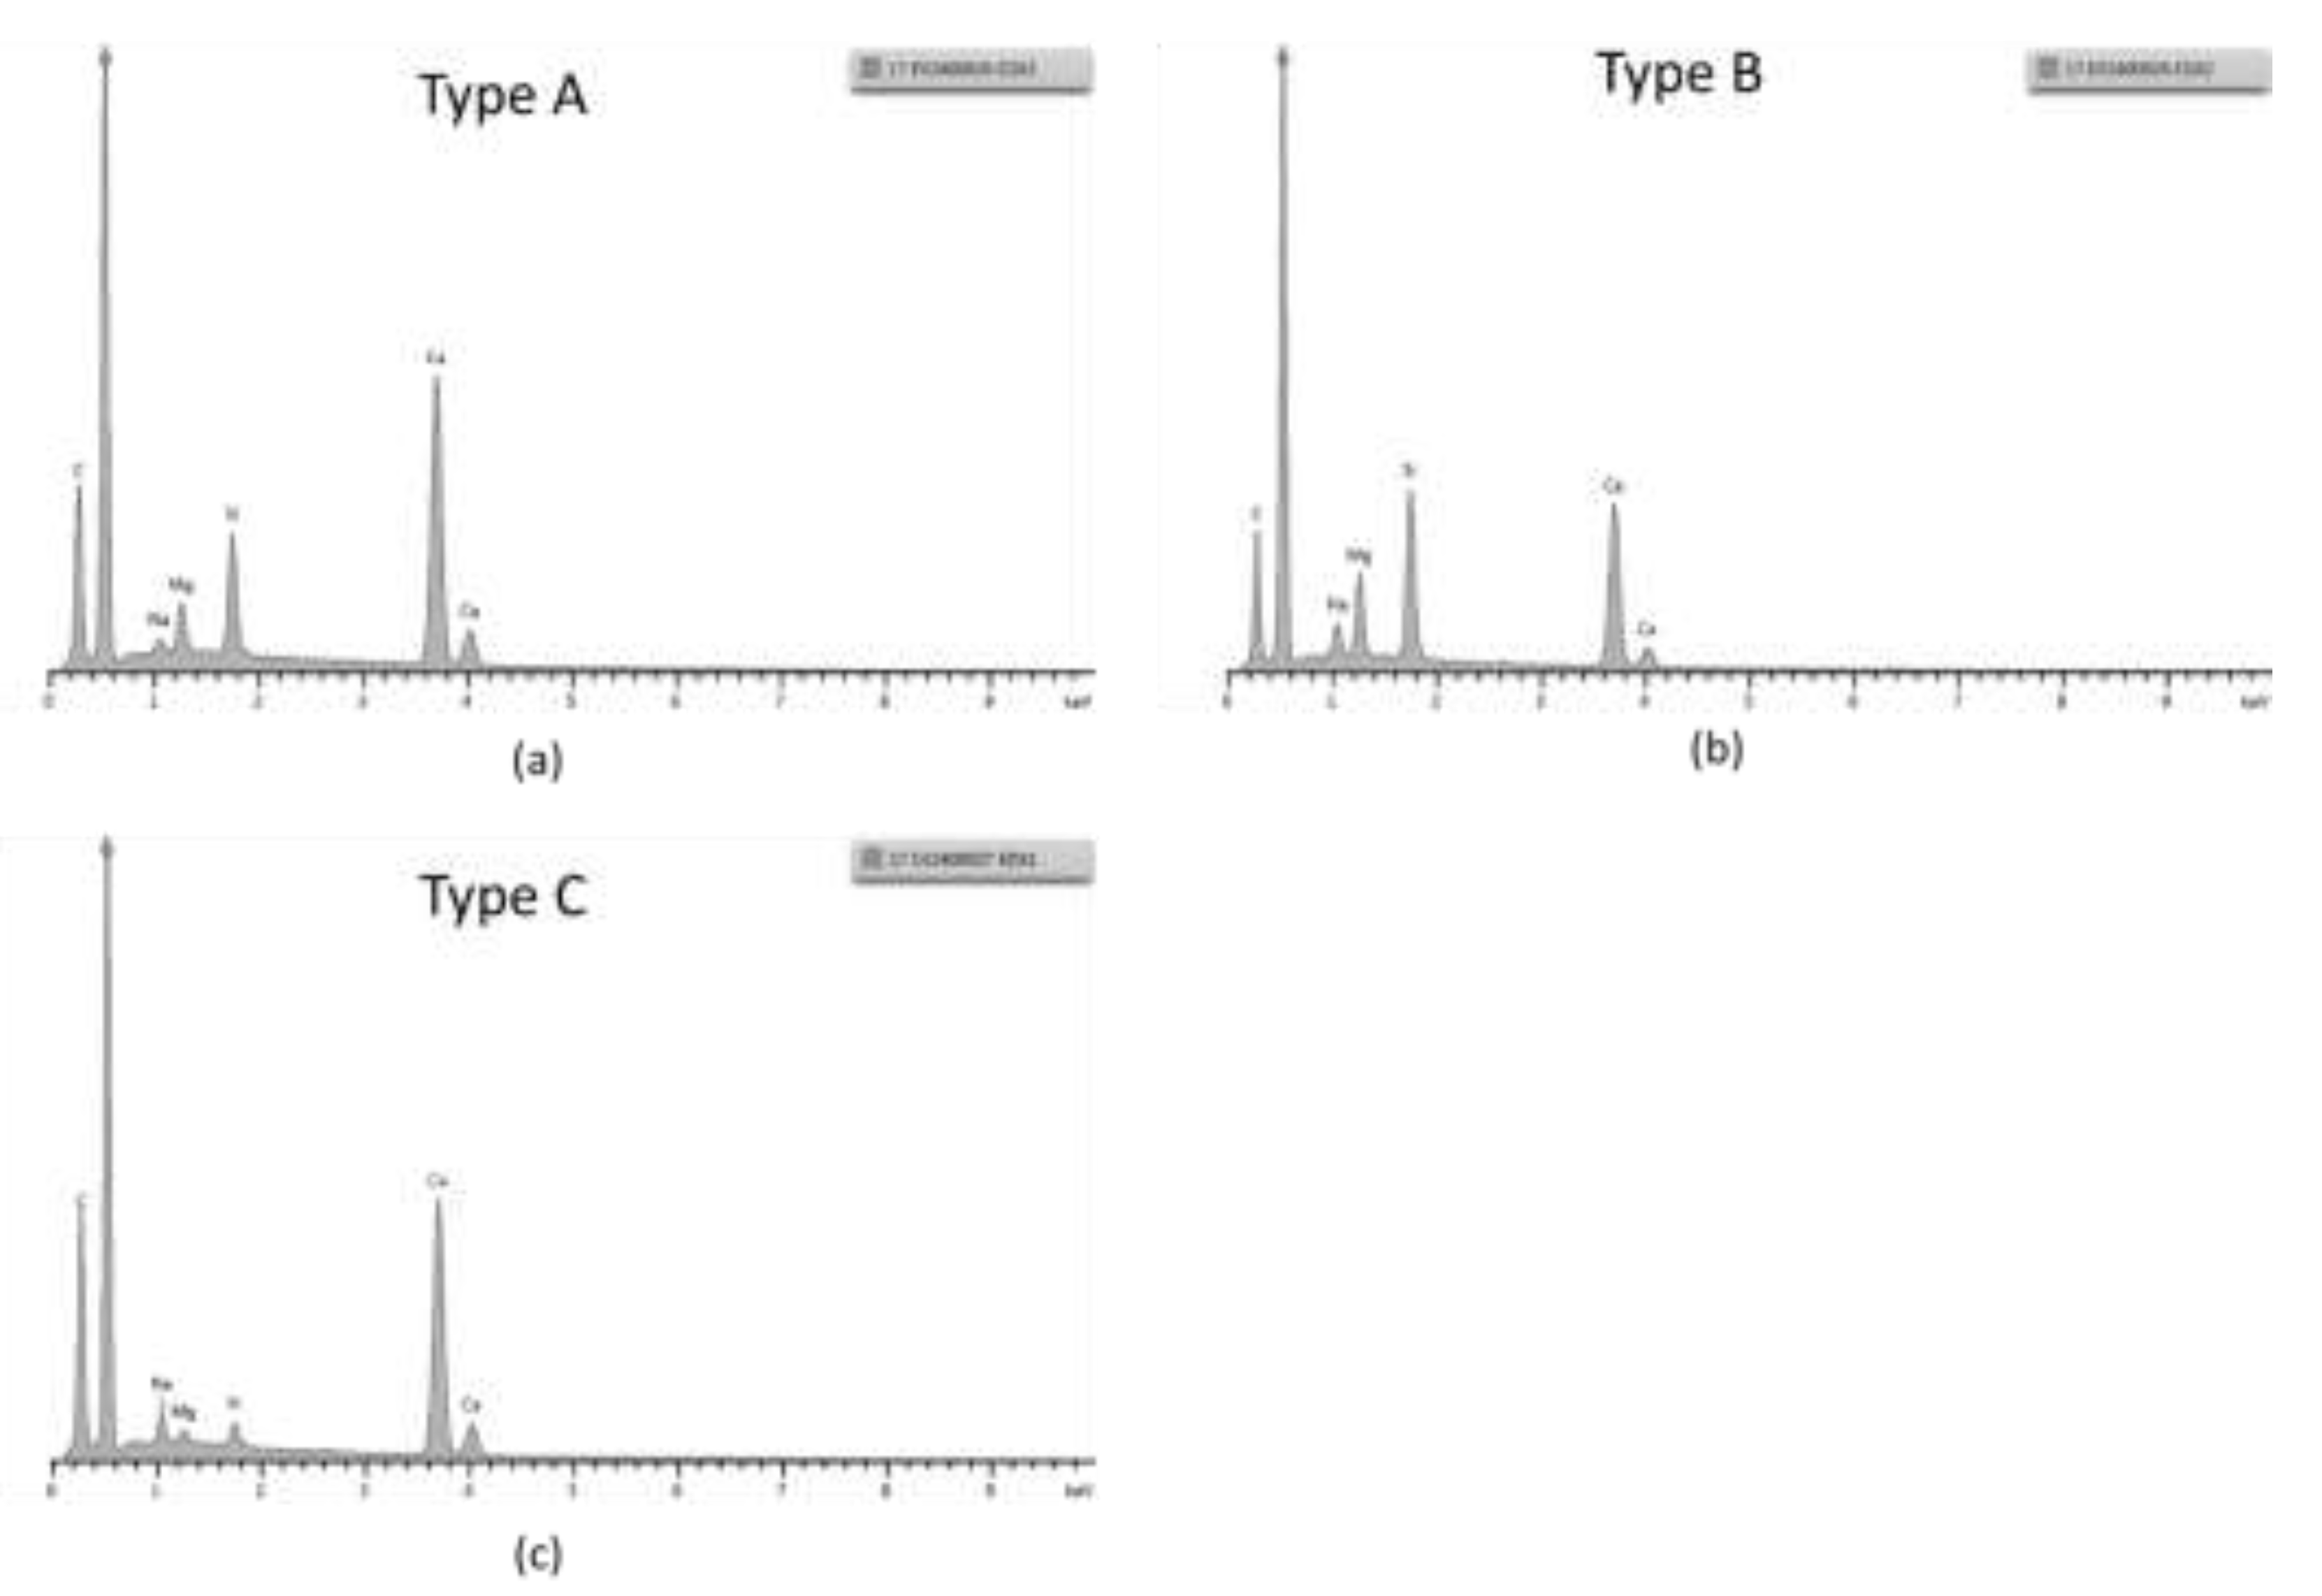
EDX point spectrum were taken from each of the scale types, and the spectra confirmed these observations, see
Figure 7. Given the absence of iron in the scales or other products from the metallic substrate, we could infer that the scales formation is only associated with the chemistry of the brine and not related to electrochemical reactions in the system e.g. corrosion. Based on the chemistry of the scales, we could infer that the deposit observed in the surface is a carbonate scale.
Regarding the scales on the coated samples, the precipitates were similar to observed in the metallic coupons, see examples in
Figure 5c for epoxy type B. For the Epoxy type A, it appeared that although the morphologies described previously for the metallic coupons were present, some new hairier features can be seen, see high-lighted regions in
Figure 5d. Regarding the epoxy itself, it appears that in both cases, the exposure to the solution caused cracking on the surface of these. This is attributed to the water absorption on the surface of the coatings and due to differences in stresses with respect to the remaining coating and substrate, cracking occurred. This effect was significantly more pronounced in the epoxy type B (scale promoter coating).
3.4. XRD Characterization of the Surface of the Coupons
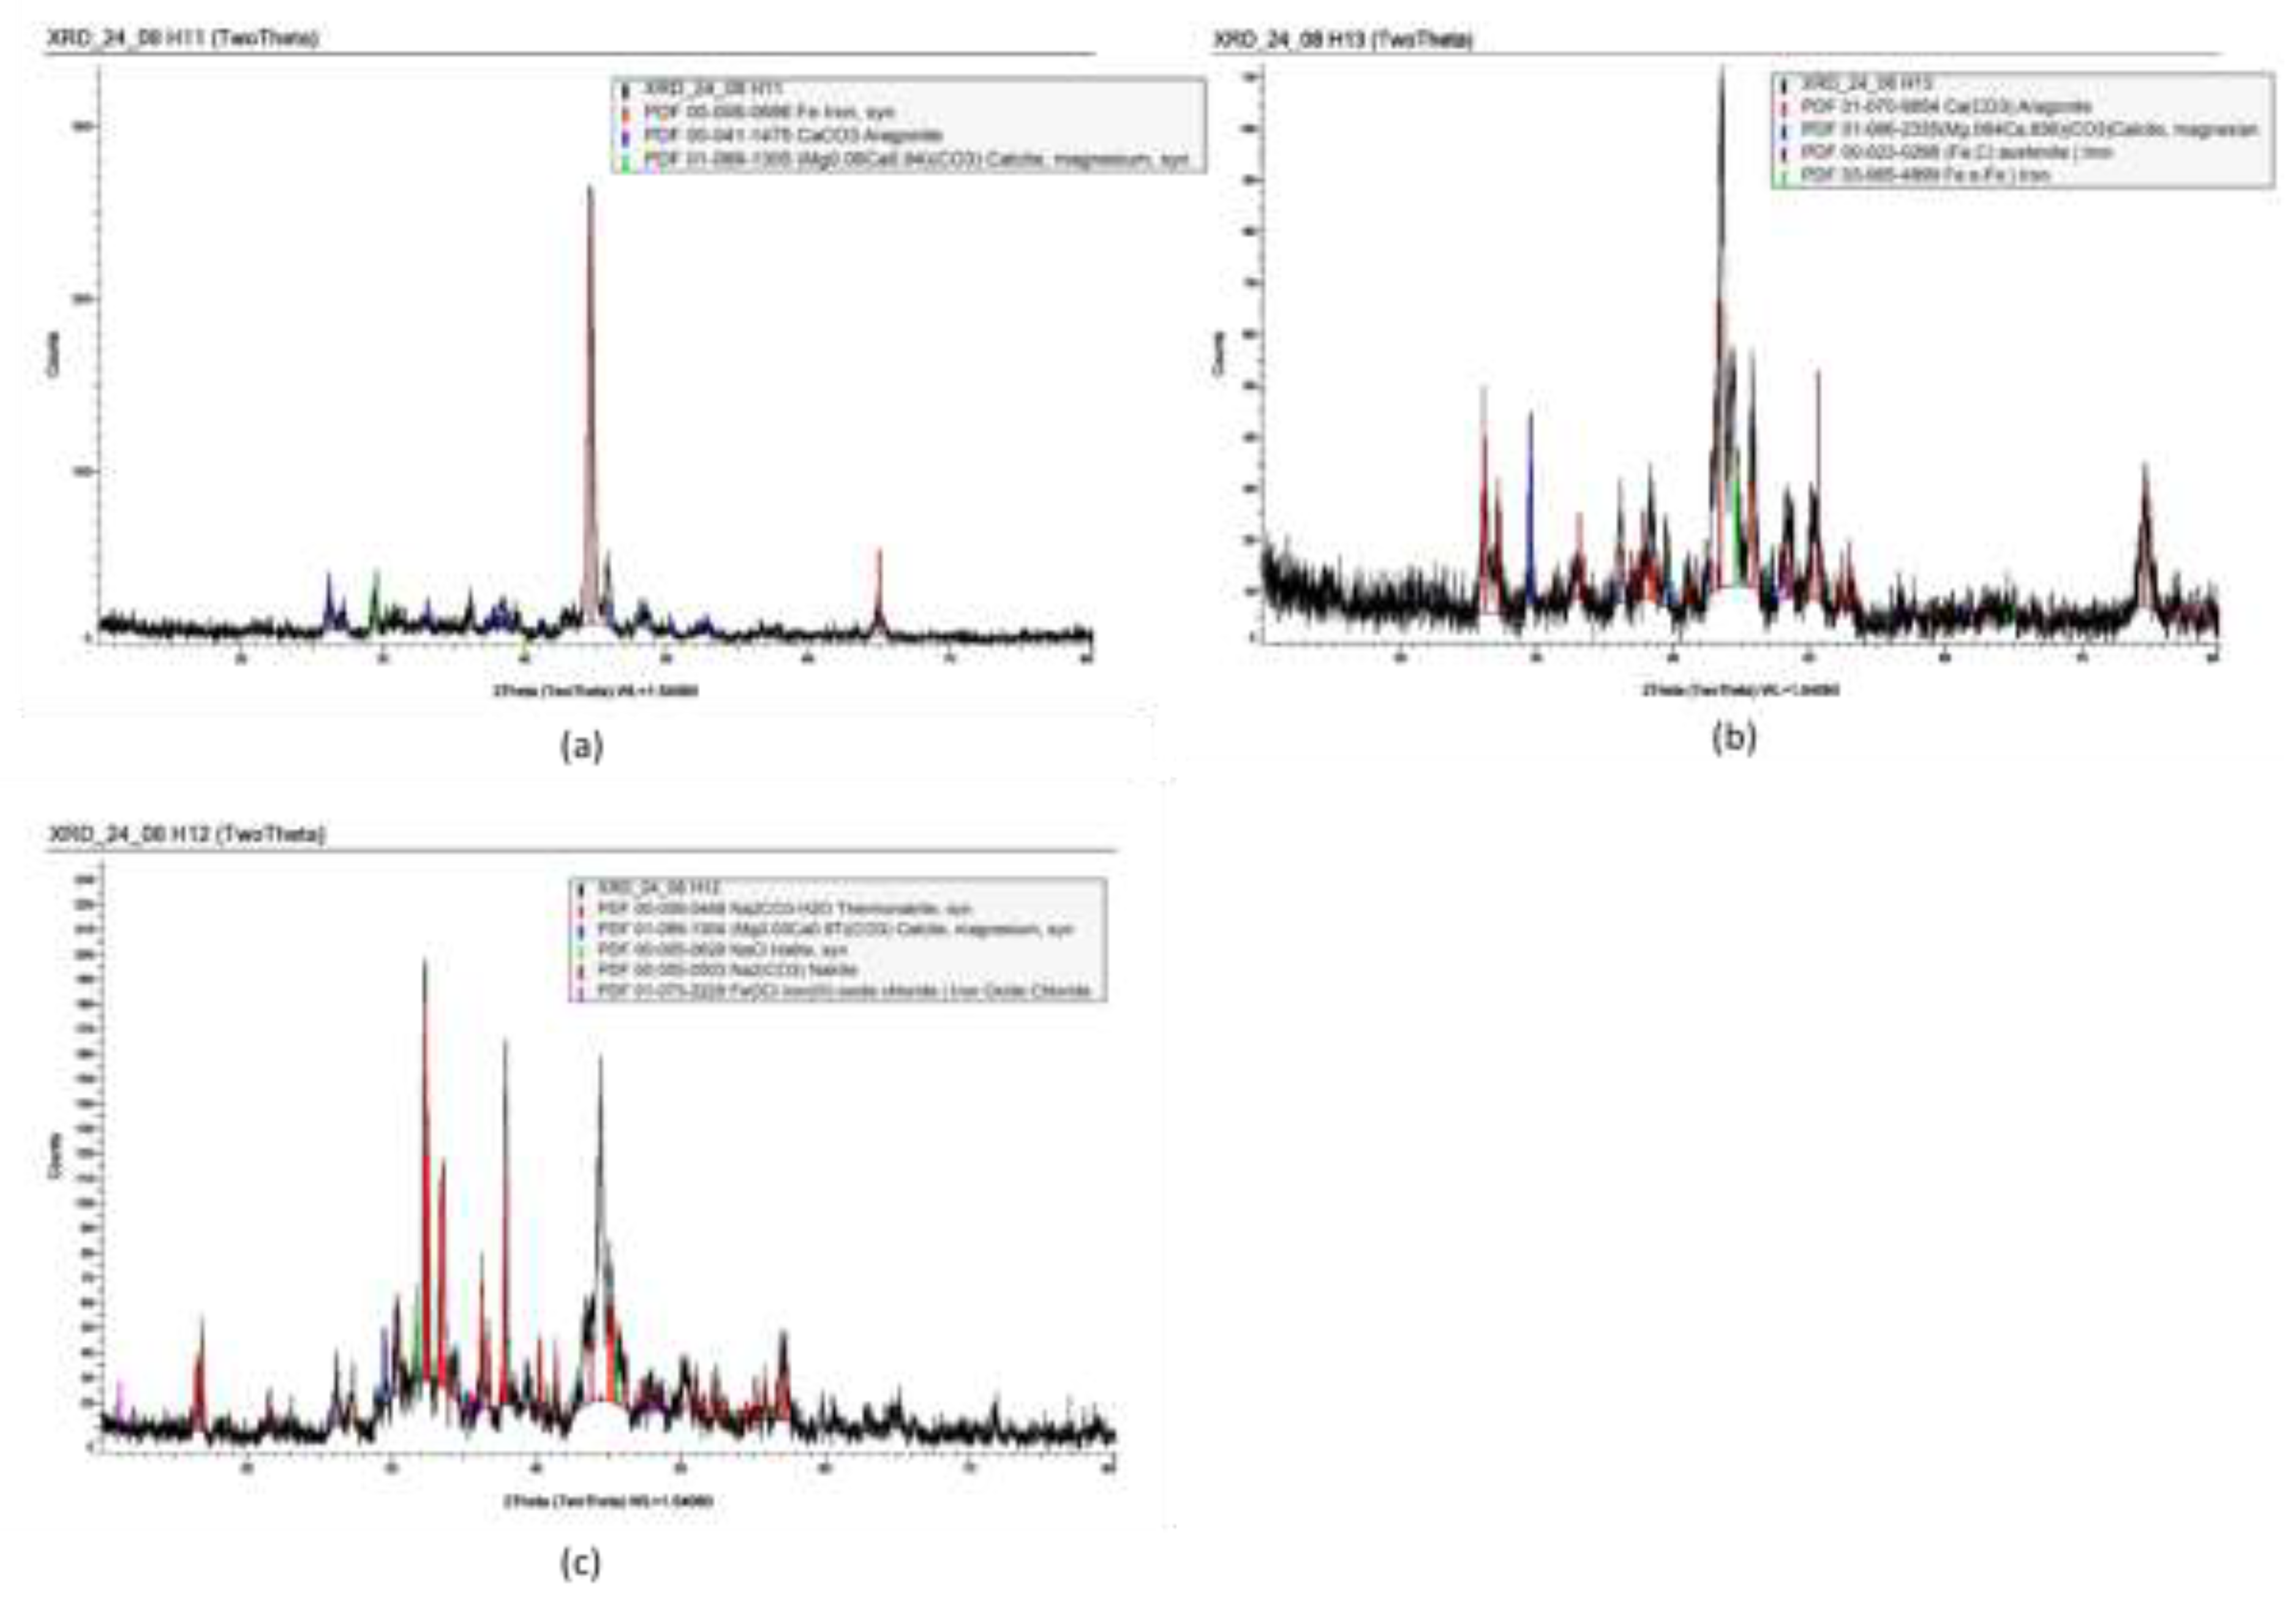
Spectra of the XRD data collected on the horizontal uncoated samples is shown in
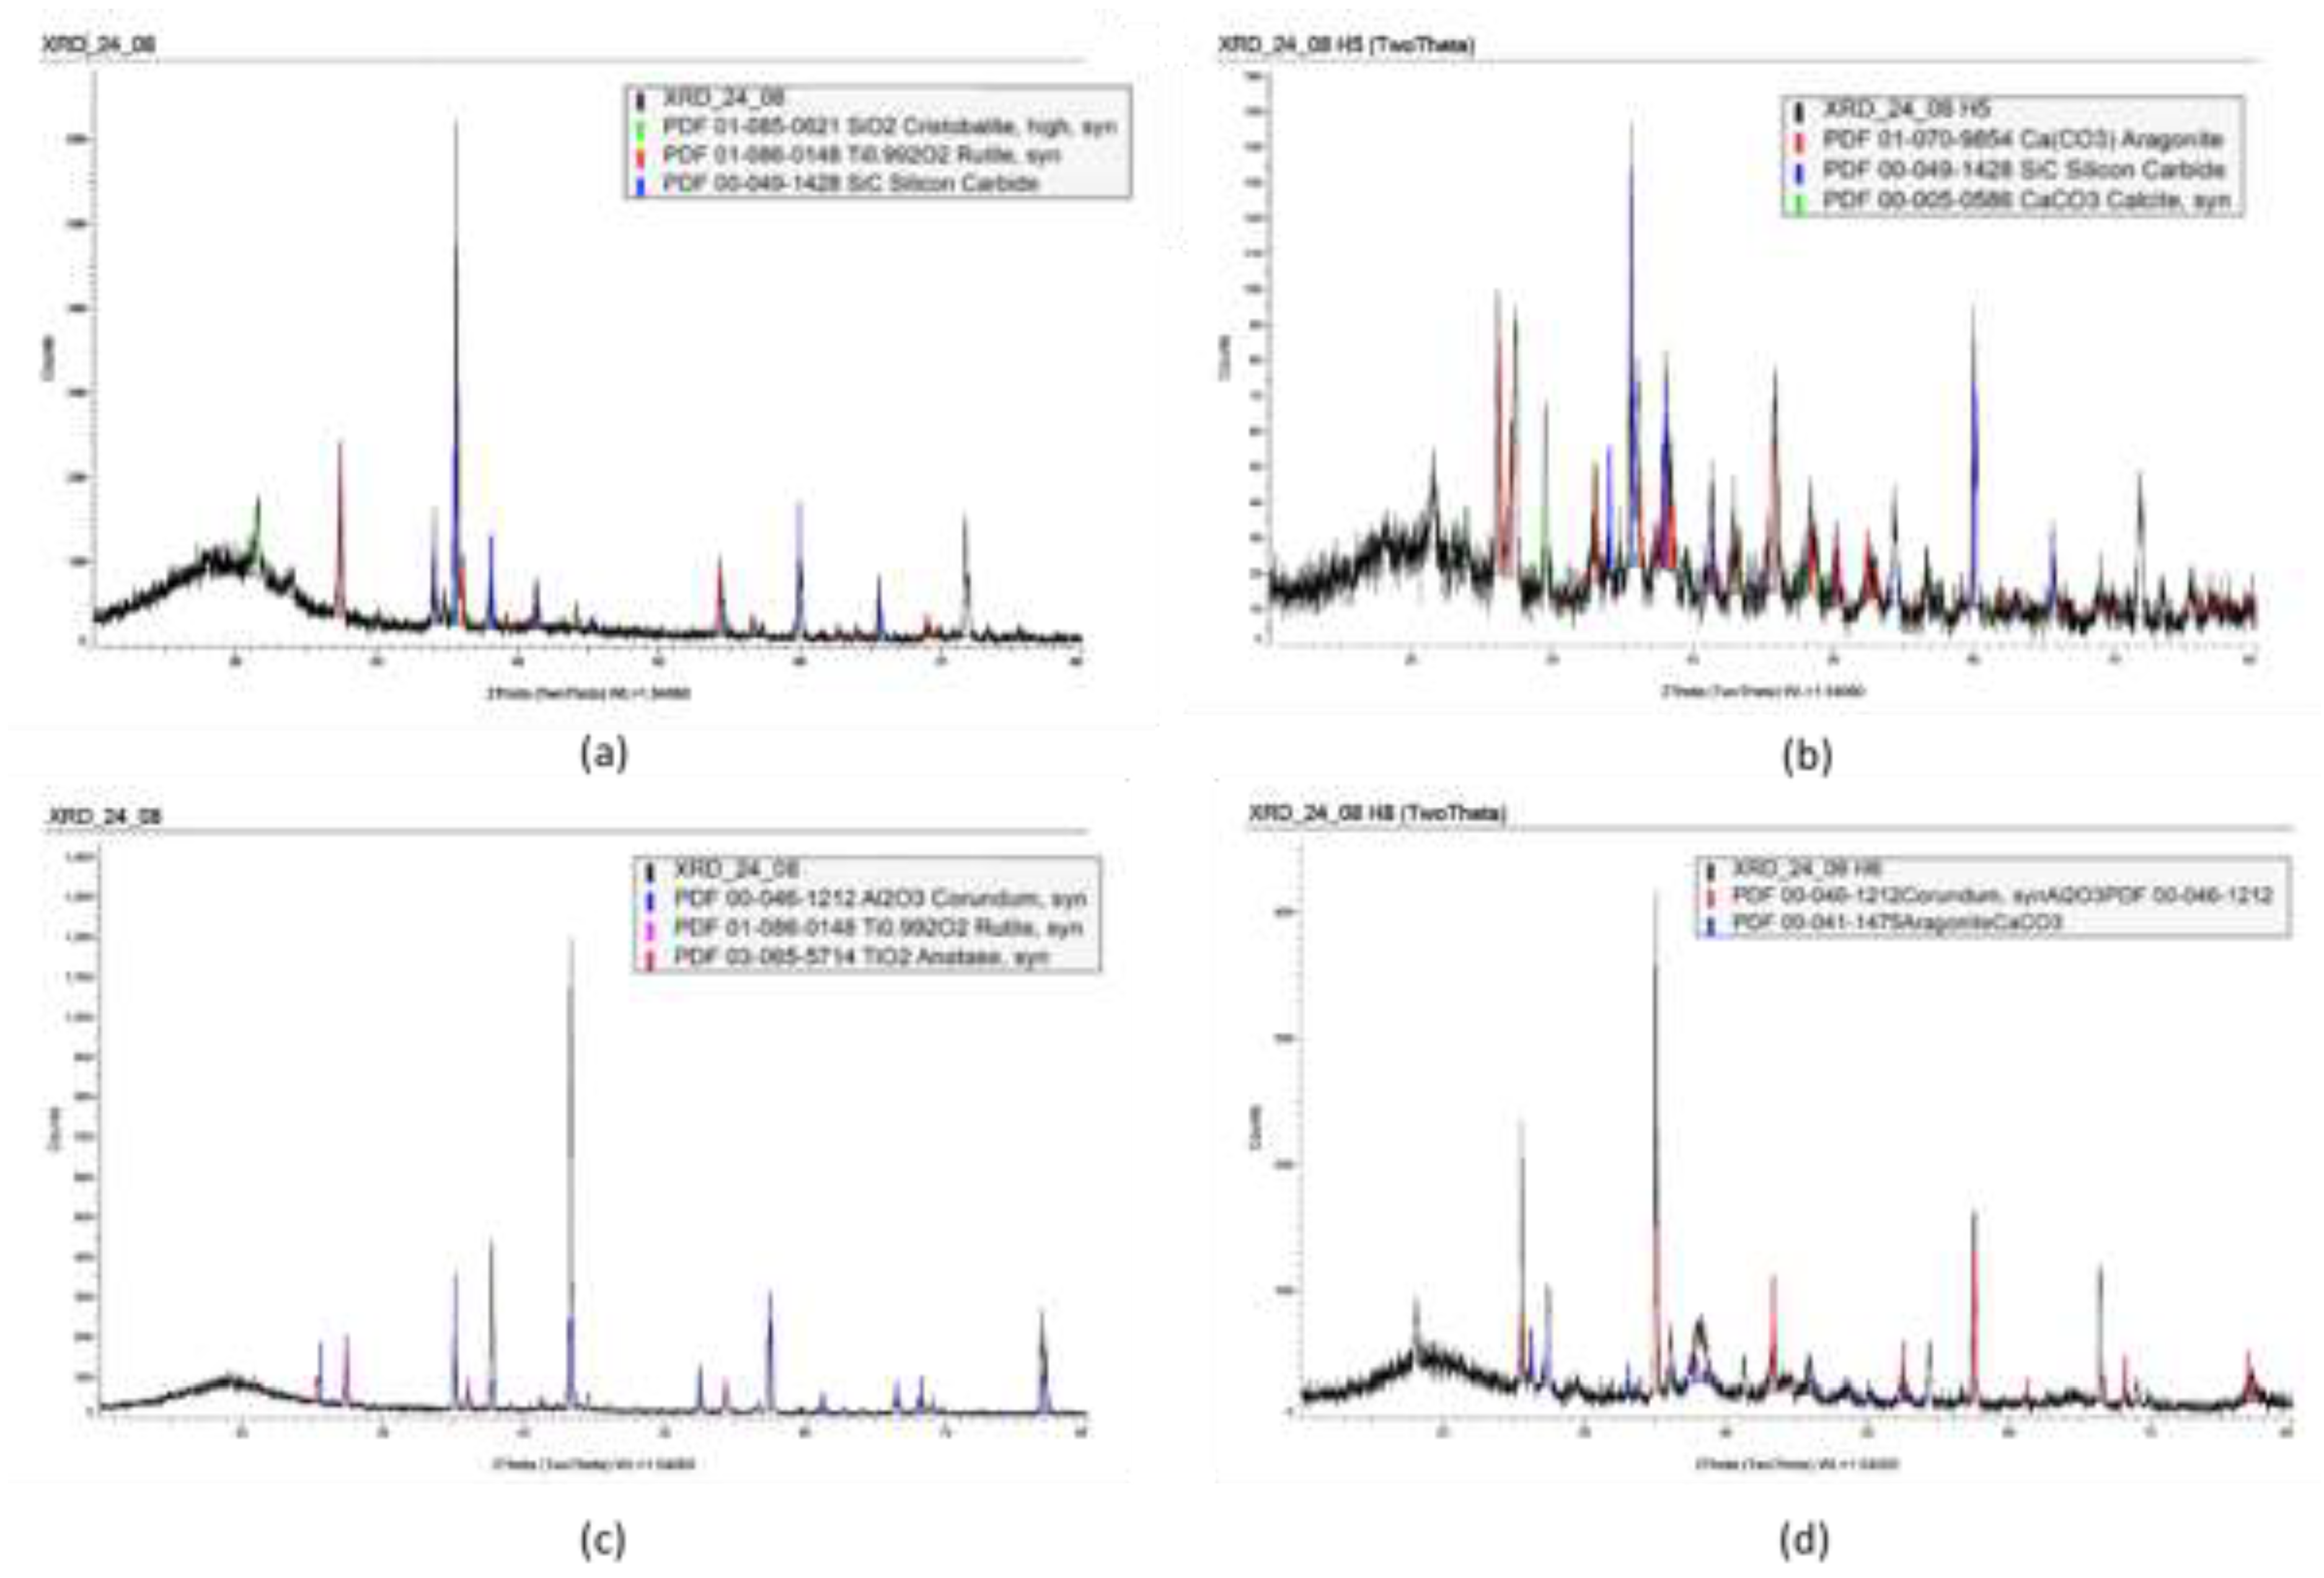
Figure 8. For the carbon steel, this displays the expected peaks of ferrite, along with peaks that matched aragonite and calcite, these are typical calcium carbonate scales. It is observed that in the case of calcite, this is matching a magnesium-containing calcite. Based on this information, it could be speculated that calcite corresponded to the type B scale, while aragonite corresponded to the type C scale. In the case of the spectra obtained from the lean duplex stainless steel coupons, the phase Thermonatrite was also found (see
Figure 8c).
On the coated samples, in order to assist with the interpretation of the data, XRD measurements were performed on un-scaled samples, with the objective being to determine which peaks belonged to the coating substrate. In Epoxy type A, the peaks appearing on the scaled sample that did not appear on the substrate sample were highlighted with a star in
Figure 9. It was found that all these peaks could be correlated with either aragonite or calcite. In the case of Epoxy type B, some peaks appearing in the XRD spectrum of the un-scaled sample did not appear in the scaled sample, the reason for this is unknown, however, importantly, the peaks appearing in the scaled epoxy spectrum that did not appear in the substrate specimen, were correlated with either calcite or aragonite, indicating that the substrate did not influence the type of scale on the specimens.
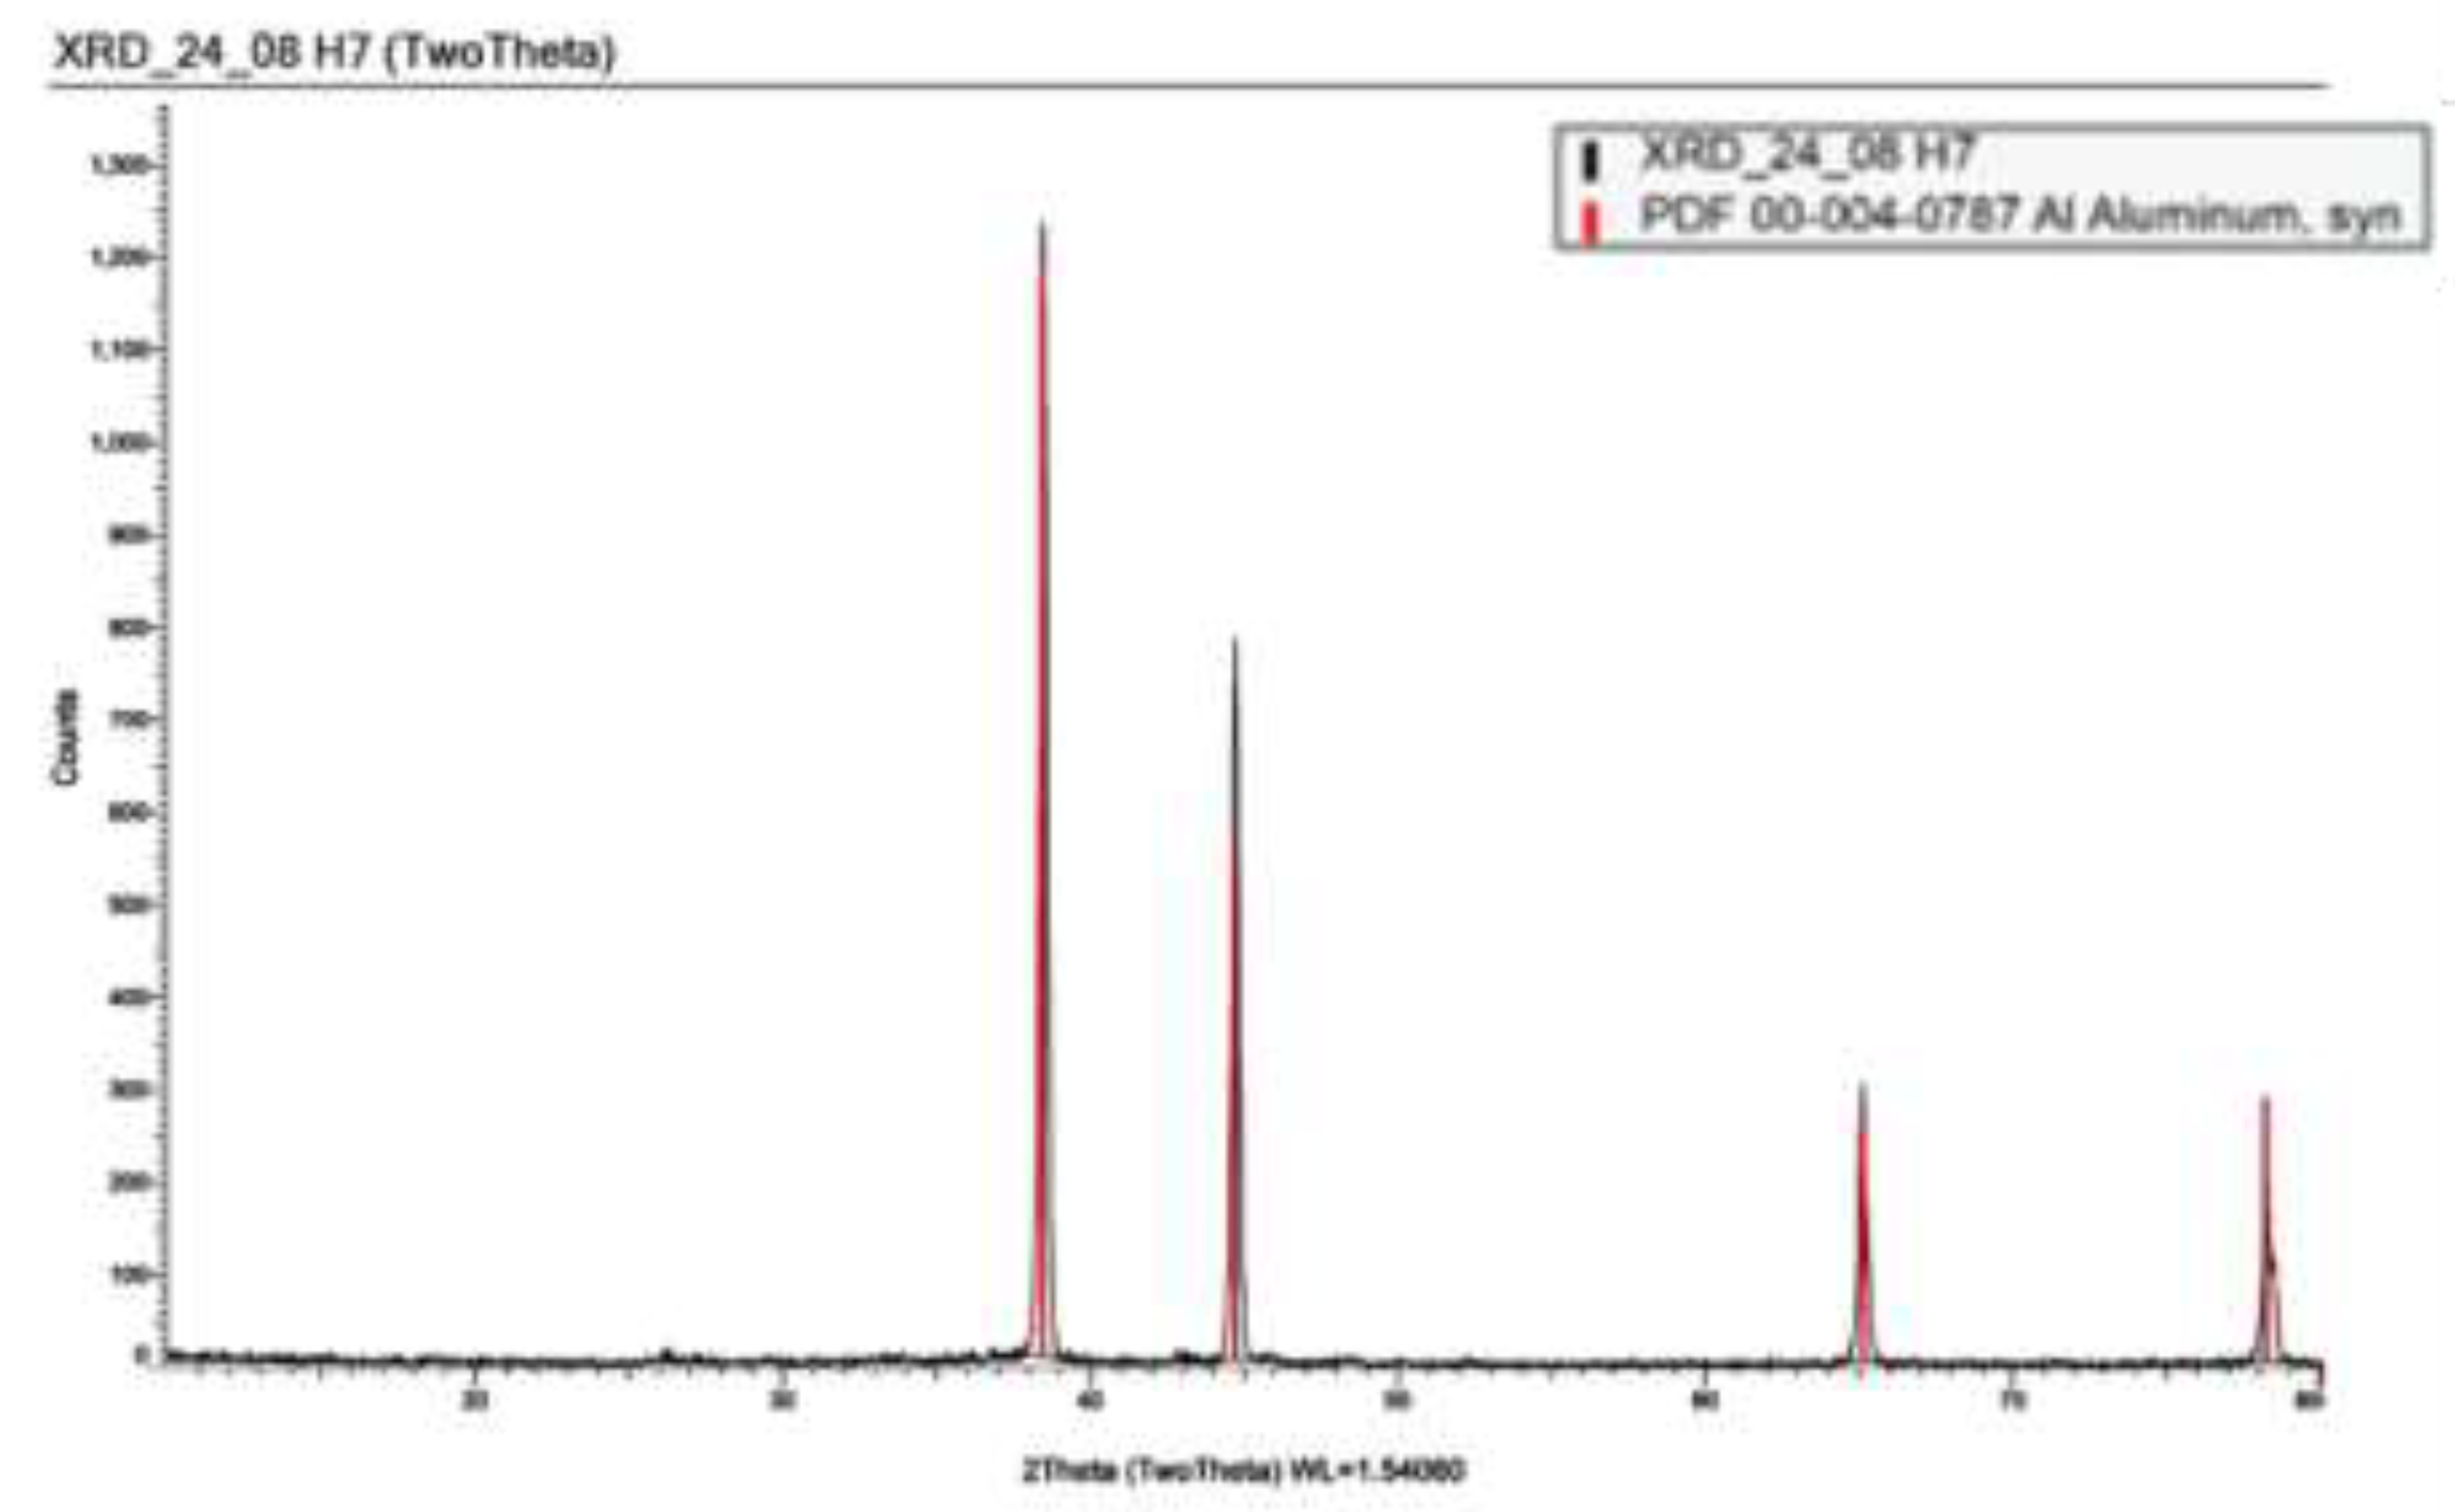
The TSA XRD spectrum only showed peaks corresponding to aluminum, suggesting no scaling had occurred on the surface of this sample (see
Figure 10).
4. Discussion
4.1. Solution Chemistry and Precipitation
The chemistry of the geothermal brine was modeled using the GEM-Selektor software package [
21,
22] employing the PSI-Nagra 12/07 thermodynamic database [
23]. The modeling calculations used the chemical composition of the brine listed in
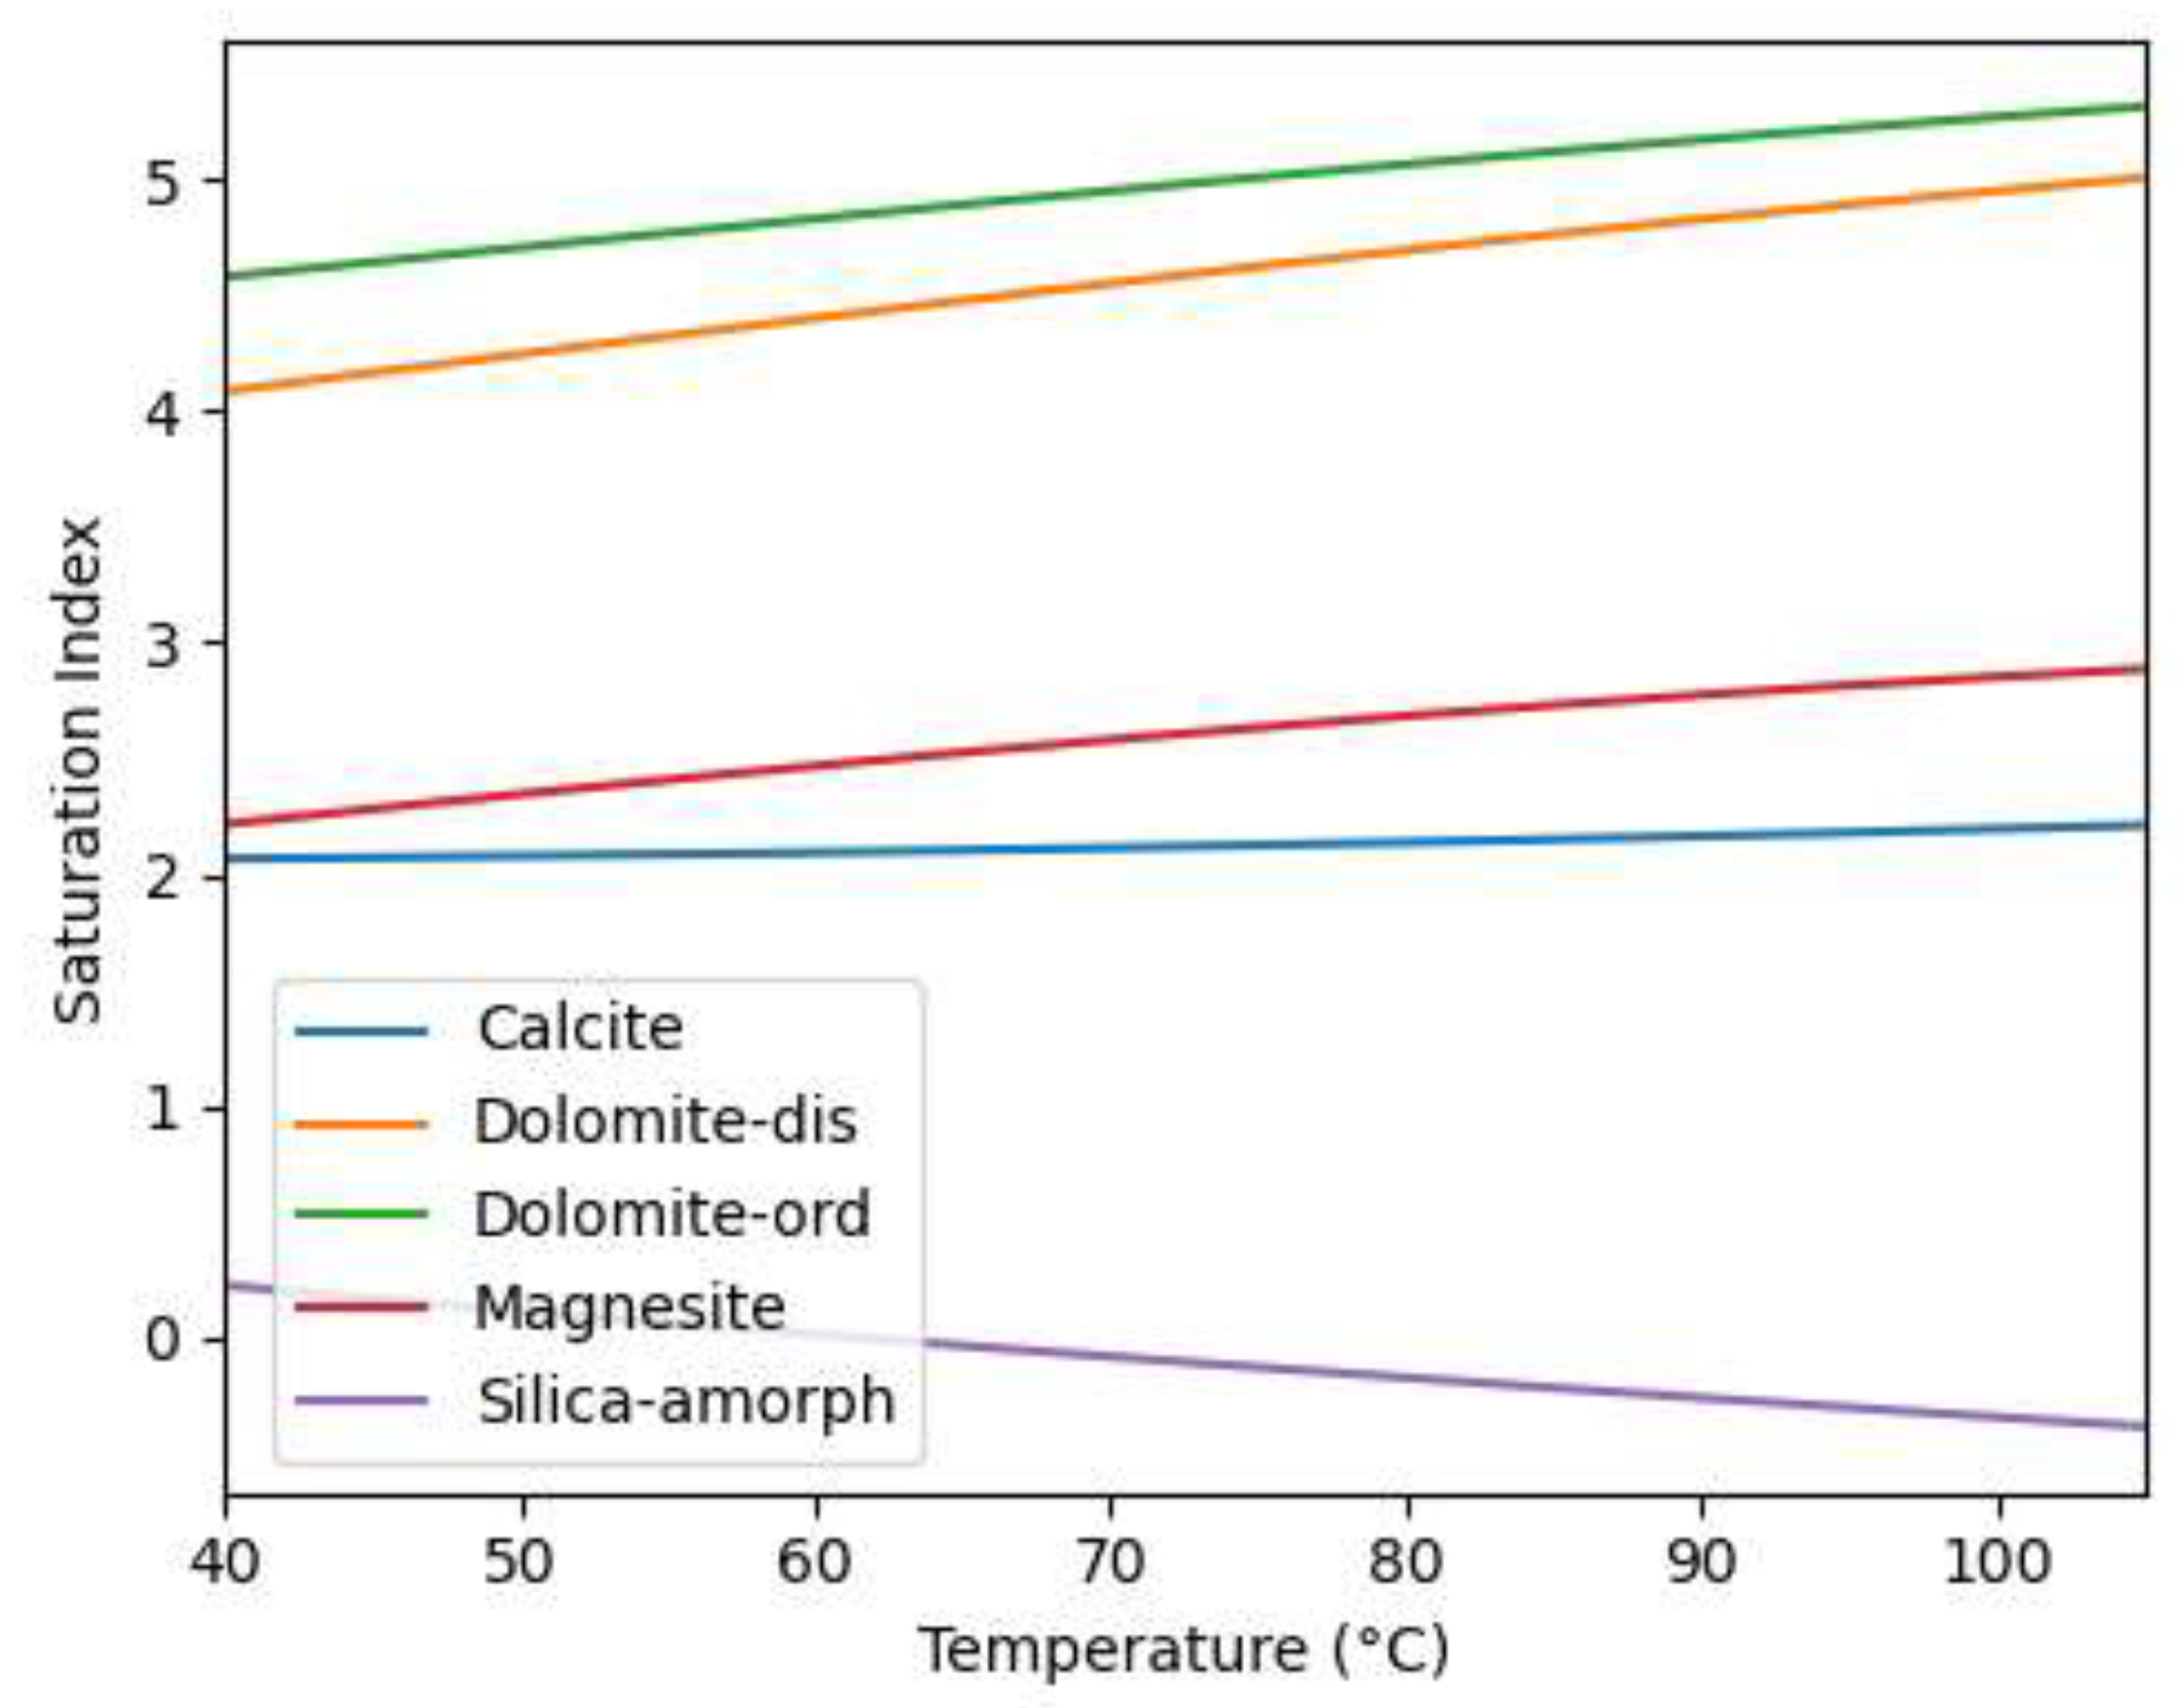
Table 1, and aimed to predict the saturation state of various scaling minerals under the simulated geothermal conditions.
As illustrated in
Figure 10, the modeling results indicate that several carbonate minerals, such as calcite, dolomite, and magnesite, are expected to be supersaturated under the experimental conditions, as reflected by their positive saturation indices. This modeling result aligns well with the experimental results indicating calcium carbonate scale formation. It is noteworthy that the saturation index for amorphous silica is only slightly positive at the experimental temperature of 40 °C, indicating a low propensity for silica precipitation. While this is somewhat unexpected, given the typically high concentrations of silica in geothermal brines and its common association with scaling issues, the lack of significant silica precipitation observed in our study could be attributed to the elevated pH of the geothermal brine, which leads to significant hydrolysis of silicic acid and increases the solubility of silica in solution [
15]. While the saturation index for amorphous silica becomes negative with increasing temperature, indicating temperature, the observed trend of increasing saturation index with increasing temperature for the carbonate minerals supports the likelihood of carbonate scaling also under higher temperature conditions.
The work of lovering suggest that the formation of dolomite is a function of the ratio of calcium to magnesium and temperature [
24]. The results presented in section 3.3 and 3.4 suggest that the calcite precitated in the coupons is rich in magnesium, therefore altering the ratio of calcium and magnesium in the ystem, this is perhaps the reason why the slight difference between the geochemical modelling and laboratory test results.
4.2. Materials Corrosion Behaviour
The tests conducted in this program, and described above, have revealed that the brine used for testing does not produce significant corrosion of the materials tested: resulting in either low corrosion rate in the case of the carbon steel, and no corrosion events in the case of the stainless steel materials, with no visible degradation in the coated specimens. Note: in the case of the carbon steel specimens, due to scaling of the specimens, which might cause a reduction of the effective area exposed to the electrolyte, it is not simple to say that the corrosion rate remained constant throughout the test duration, as suggested in
Figure 2a, but, in any case, the current measurements and associated corrosion of the specimens were low.
A point to consider is that the tests performed during the investigation were conducted at the retention tank/scaling reactor`s intended operating temperature (50°C). However, the system may face more severe conditions, especially concerning corrosion. For instance, the inlet temperature to the retention tank could be up to approximately 104°C, and the pH of the fluid could be altered to increase or decrease the scaling tendency as function of the brine re-injection conditions. To fully understand the expected level of corrosion into the materials used for this system and the influence of the brine, some further corrosion tests were conducted.
Table 2 shows a summary of some of these tests. The results reveal that even at more aggressive conditions, for example, lower pH or higher temperature, the susceptibility to corrosion of the materials tested is not significantly higher. No tests are presented from the other metallic samples, as duplex stainless steels tend to have better corrosion resistance than the conventional austenitic stainless grades, such as 304L. For carbon steel, it is expected that the extent of the corrosion rate increase with temperature.
Two possible scenarios could be perceived to explain the reduced corrosion in the materials tested. It could be that the concentrations of ions, particularly chloride, were very low in this solution, and no corrosion should be expected, or the case that brine solution itself could be acting as a “corrosion inhibitor”. It should be noted that this two hypothesis reflect a very simplified scenario of the complex corrosion pitting mechanism in stainless steel, where the different testing variables could affect distinctively the pitting behavior i.e. the shape of the pits, the potential for stable pit grow vs re-passivation, the frequency of pitting, the pitting grow rate, among others [
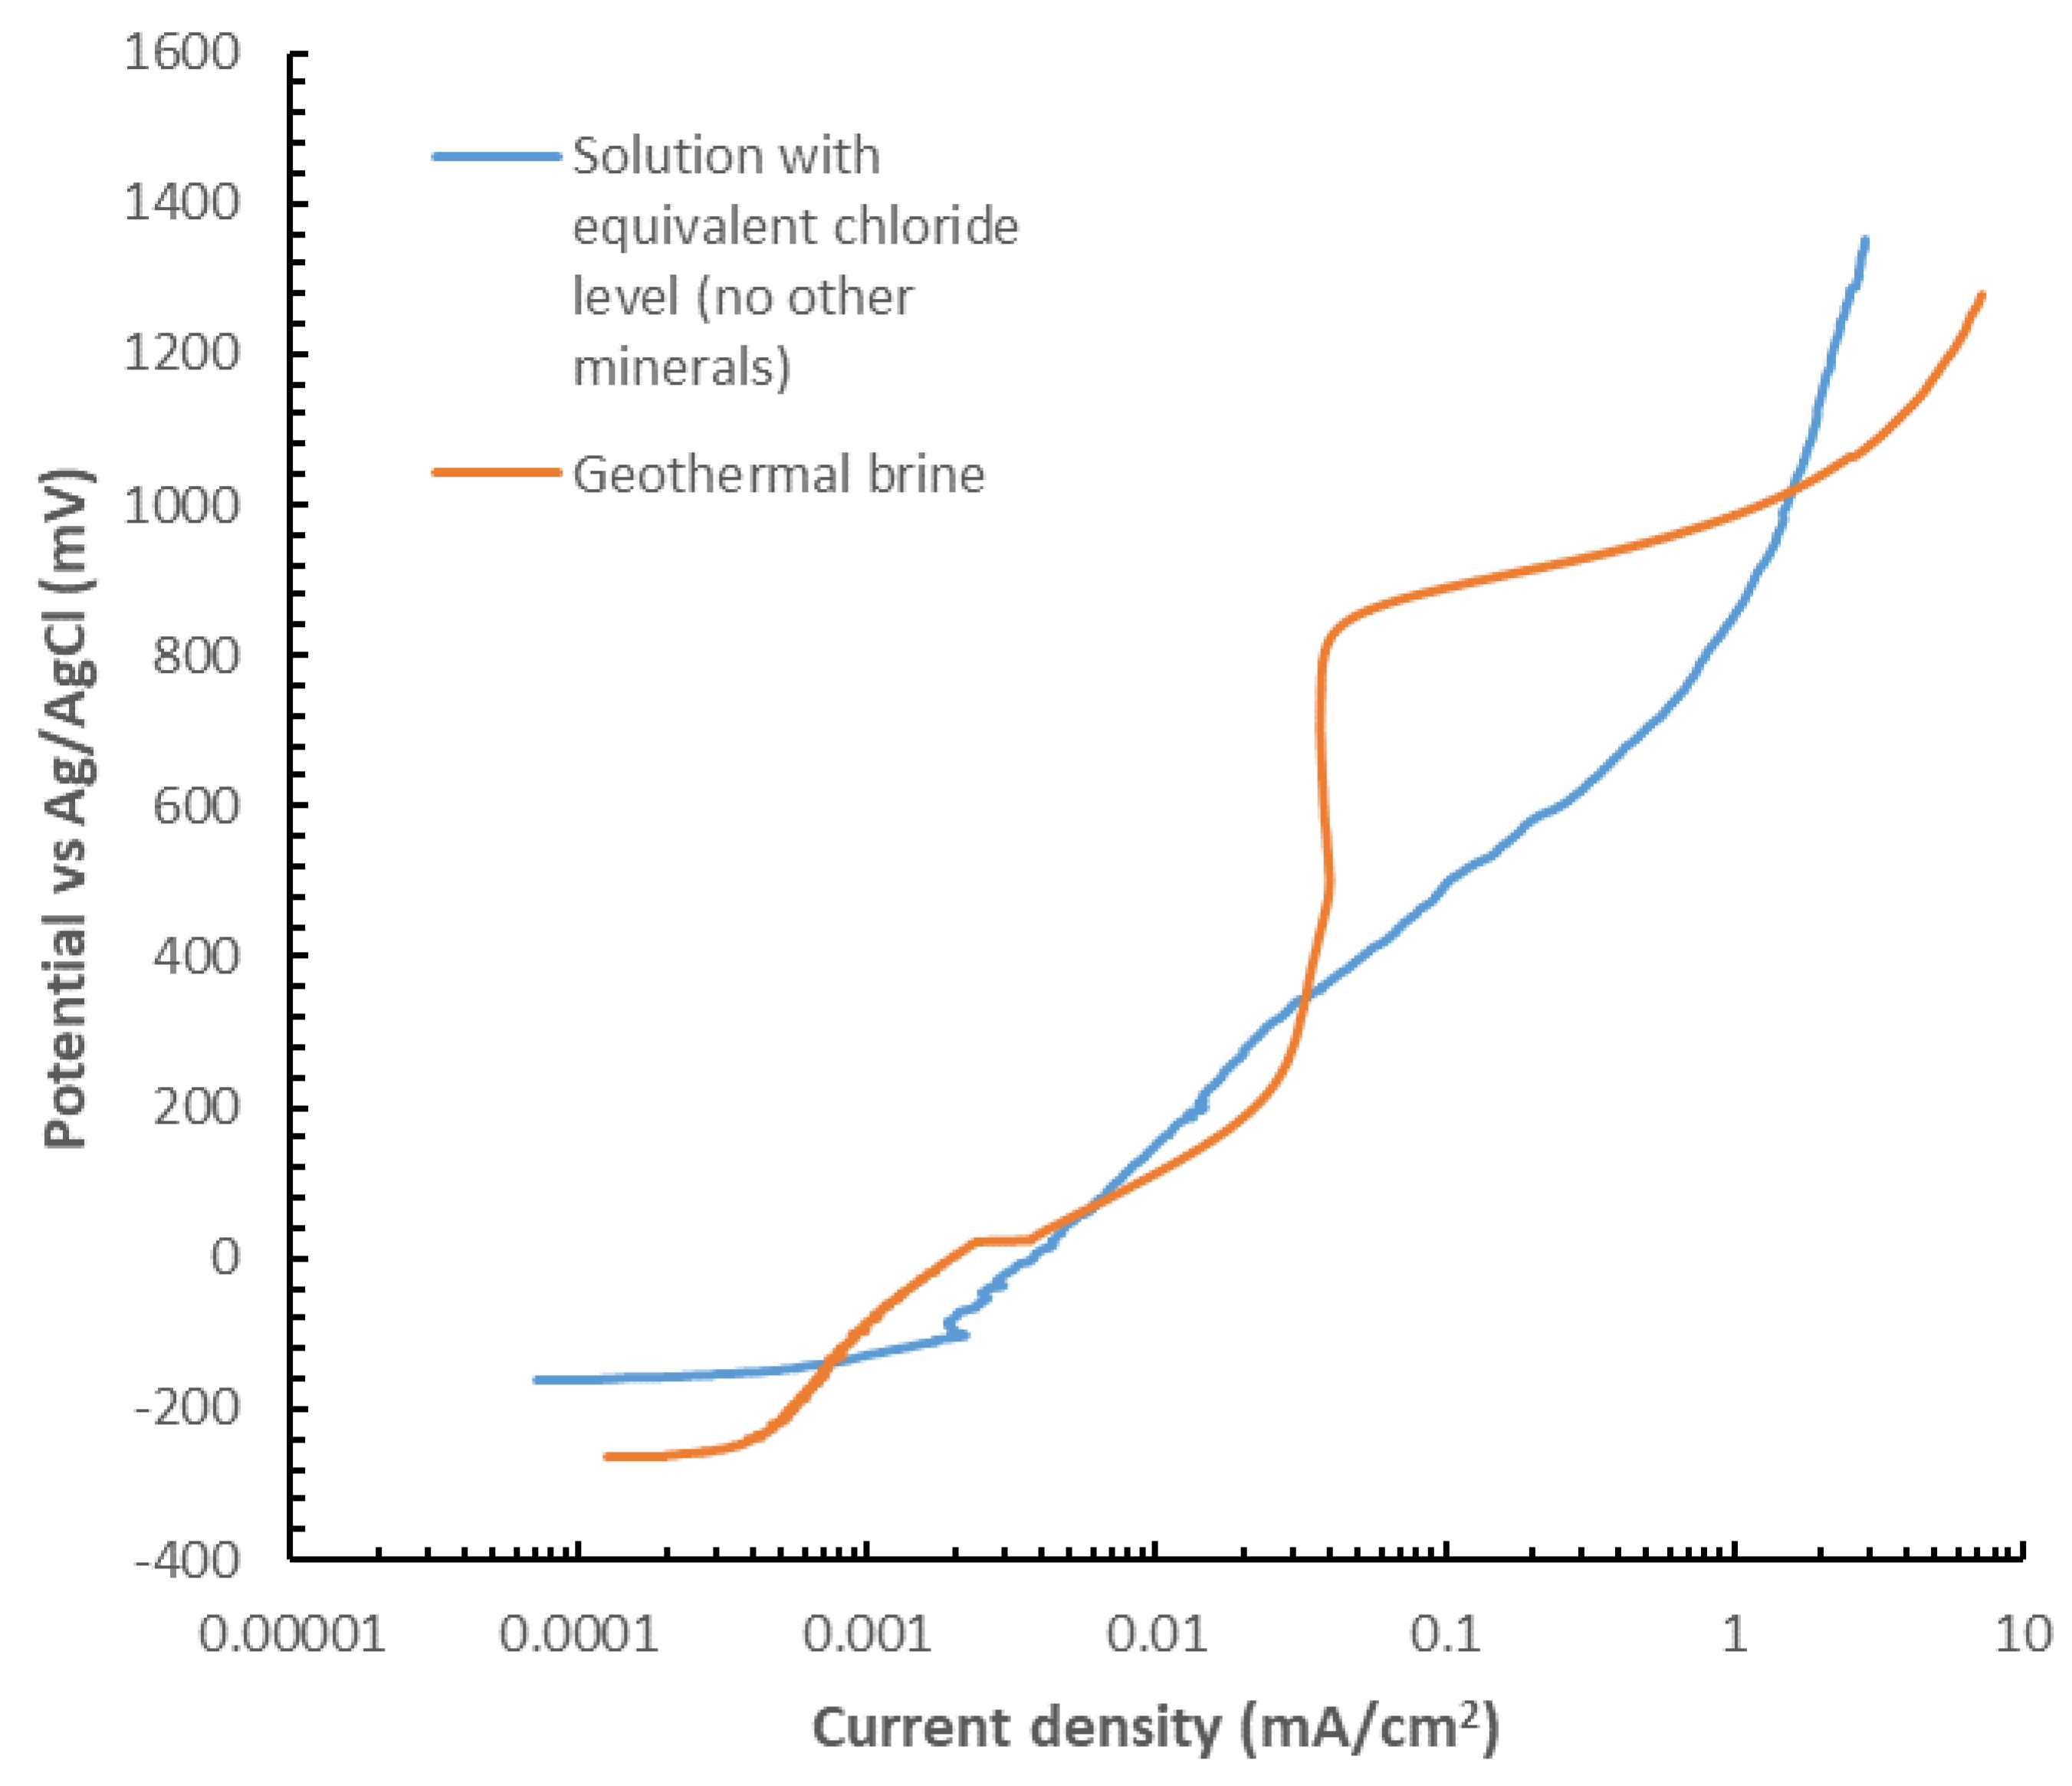
25]. The main objective of this exercise is to have a screening view of the role towards corrosion of chlorides vs the other elements in the brine. In order to prove this second hypothesis, tests were conducted at the same conditions using the simulated brine, as detailed in section 2.1.3, and other tests in a solution with an equivalent level of chlorides, without further other elements. For these tests, potentiodynamic tests of crevice samples were performed for the 304L stainless steel. The results are shown in
Figure 11. The test were performed in samples with crevice formers. From these curves, it can be seen that apart from a bump in the range from ≈120mV vs SCE un to ≈300mV vs SCE, the current is typically higher in the solution containing only chlorides, and in fact, the geothermal brine, the material display a semi-passive region. These results suggest that minerals in the brine play an inbitor role in the localized corrosion of the 304L stainless steel.
4.3. Undertanding Role of Materials into Scaling
Further examination of the scales was carried out in order to determine the adhesion strength of the scale to the material’s surface. This exercise was carried out using standard coating adhesion protocols, such as the tape adhesion or the pull off testing, however, these trials were not fully successful. From these, it was noted that the scales were not strongly adhered to the samples. Taking advantage of this, for some horizontal coupons, the scales were carefully removed (to avoid damaging the substrate) in order to identify scale thickness, as a method to compare scaling tendency between the different materials. These measurements were performed on the horizontal coupons, and the results are presented in
Table 2. Although some differences were observed, these were not statistically significant, apart from stainless steel. The analysis of the horizontal coupons suggest that once a scale starts to form, this will continue with a smaller role of the substrate. The smaller thickness in the scale of the 304L stainless steel, which in agreement with the lower variation in OCP through the testing, compared to the lean duplex stainless steel, it might suggest that electrochemical interactions (or surface local chemistry variations in the brine) play a role in the formation of the scale (at least when scaling thickness is still in the short range).
From the visual observations of the vertical coupons, it was noted that the scaling tendency across the different coupons changed. In order to identify a possible reason for this, wettability measurements were performed (water contact angle measurements), and the results are presented in table 4. Although no one to one correlation was found between scaling tendency and water contact angle. For the Epoxy coated samples, the Epoxy type A (which displayed higher water contact angle after testing) had less scaling tendency than the Epoxy type B. In the stainless materials, the contact angle reduced after exposure to the solution, in agreement with the scaling tendency of the materials, which show that the scaling tendency of the stainless materials is similar to the epoxy type B, despite the initially higher water contact angle. In the case of TSA, it should be noted that the results suggest that at the beginning of the tests, the water contact angle was very high, and this was attributed to the presence of a high temperature oxide, following the thermal spraying process, and then the subsequent, much lower, contact angle was attributed to hydrolysis of this oxide [
26]. Therefore the wettability of the surface could not be used to explain the low scaling tendency in the TSA samples. In addition to this, literature in the topic suggest that TSA tends to be a location of frequent encounter of calcareous deposits in subsea applications due to the oxygen reduction (cathodic reaction that causes local increase in pH) associated to the substrate material [
27]. It is unknown the reason why the measurements performed in this investigation did not show scaling in the TSA specimens, and it is possible that this is simply a short term effect, longer testing, as will be carried out in part 2 of this research in the field coupon tests, should be carried out to corroborate this observation.
According to literature, there are other mechanisms and parameters, apart from wettability (surface tension), that can affect the scaling tendency of material. In 2023, Fanichia and Karlsdottir published a comprehensive review coatings and paints in geothermal systems [
28]. In epoxy systems, it was found by Boersma et al. [
29] that scaling is governed by young modulus, surface tension (wettability) and roughness. Wang et al. found in their tests, that the scaling tendency was reduced due to the release from epoxy coating surface of metallic ions that could combine with the other elements in the brine, causing precipitation of the elements producing scaling in the brine itself, rather than on the surface of the coatings. It is not possible to asses these hypothesis in this work. However, it is curious to find that in other systems, scaling increase with increasing in roughness contrary to the case of TSA if our investigation [
30].
Table 4.
Measurements of the average scaling height for the different coupons.
Table 4.
Measurements of the average scaling height for the different coupons.
| Specimen ID |
Water contact angle (o) |
| Before |
After |
| Carbon steel |
38.5 |
38.6 |
| Epoxy type A |
83.0 |
72.2 |
| Epoxy type B |
79.2 |
48.3 |
| Stainless |
104.3 |
61.9 |
| Duplex |
97.5 |
47.8 |
| TSA |
131.4 |
0 |
5. Conclusions
In this investigation, the impact of a geothermal brine in 5 different materials was investigated. Under the studied conditions, it was found that the main issue was the scaling of carbonate scales. Under more severe conditions (higher temperature and lower pH), stainless steel 304L could suffer pitting. It was identified that the minerals in the could decrease the corrosion current. In terms of scaling, it was noted that this could be controlled through the use of different materials. For example, epoxies with targeted chemistry can be used as scale promoter materials. It should be noted that gravitational effects play a significant role in scaling. There was a good correlation between scaling precipitates from laboratory tests and geochemical modelling, which could be used to explain the absence of silica scaling under studied conditions.
Author Contributions
Conceptualization: D.F. Martelo, B. Holmes, N. Kale and S. Paul; method-ology: D.F. Martelo, B. Holmes, N. Kale and S. Paul; software: S.W. Scott; validation: D.F. Martelo, B. Holmes, S.W. Scott and S. Paul; formal analysis: D.F. Martelo, B. Holmes, S.W. Scott and S. Paul; investigation: D.F. Martelo, B. Holmes, S.W. Scott and S. Paul; resources: N. Kale; data curation: D.Martelo; writing—original draft preparation: D. Martelo; writing—review and editing: B. Holmes, S.W. Scott and S. Paul; supervision: B. Holmes, N. Kale and S. Paul; visualization: D.Martelo, S.W. Scott; project administration: N. Kale; funding acquisition: B. Holmes, N. Kale and S. Paul. All authors have read and agreed to the published version of the manuscript.”
Funding
The project is funded by European Union’s H2020 research programme under Grant agreement no. 818576.
Data Availability Statement
Data available on request.
Acknowledgments
The authors would like to acknowledge all the members of the GeoSmart consortium. Special thanks to M. Bennet who fabricated the lab scale vessel and to C. Lee who conducted part of the corrosion investigation at high temperature in TWI. And to Paolo Taddei from Spike renewables who are responsible for the fabrication of the scaling reactor/retention tank system.
Conflicts of Interest
The authors declare no conflicts of interest.
References
- de Paula Cosmo, R.; Pereira, F. D. A. R.; Soares, E. J.; & Ferreira, E. G. Addressing the root cause of calcite precipitation that leads to energy loss in geothermal systems. Geothermics, 2022, vol. 98, p. 102272. [CrossRef]
- Bu, X.; Jiang, K.; Wang, X.; Liu, X.; Tan, X.; Kong, Y.; & Wang, L. Analysis of calcium carbonate scaling and antiscaling field experiment. Geothermics, 2022, vol. 104, p. 102433. [CrossRef]
- Muryanto, S.; Bayuseno, A. P.; Ma’Mun, H.; & Usamah, M. J. P. C. Calcium carbonate scale formation in pipes: effect of flow rates, temperature, and malic acid as additives on the mass and morphology of the scale. Procedia Chemistry, 2014, vol. 9, p. 69-76. [CrossRef]
- Tarcan, G.; Özen, T.; Gemici, Ü.; Çolak, M.; & Karamanderesi, İ. H. Geochemical assessment of mineral scaling in Kızıldere geothermal field, Turkey. Environmental Earth Sciences, 2016, vol. 75, p. 1-19.
- Arnórsson, Stefán. Deposition of calcium carbonate minerals from geothermal waters—theoretical considerations. Geothermics, 1989, vol. 18, no 1-2, p. 33-39. [CrossRef]
- Mundhenk, N.; Huttenloch, P.; Sanjuan, B.; Kohl, T.; Steger, H.; & Zorn, R. Corrosion and scaling as interrelated phenomena in an operating geothermal power plant. Corrosion Science, 2013, vol. 70, p. 17-28. [CrossRef]
- Conover, Marshall; Curzon, A.; Ellis, P. Material Selection Guidelines for Geothermal Power Systems--An Overview. ASTM International, 1980.
- Nogara, James; Zarrouk, Sadiq J. Corrosion in geothermal environment: Part 1: Fluids and their impact. Renewable and Sustainable Energy Reviews, 2018, vol. 82, p. 1333-1346. [CrossRef]
- Gawlik, K.; Sugama, T.; Jung, D. Organometallic polymer coatings for geothermal-fluid-sprayed air-cooled condensers. National Renewable Energy Lab., Golden, CO.(US), 2002.
- DeBerry, David W.; Ellis, Peter F.; Thomas, Colin C. Materials selection guidelines for geothermal power systems. Radian Corp., Austin, TX (USA), 1978.
- Ellis, I. I.; & Conover, M. F. Materials selection guidelines for geothermal energy utilization systems. Radian Corp., Austin, TX (US), 1981.
- Pardelli, P. T.; Tempesti, C.; Mannelli, A.; Kravos, A.; Sabard, A.; Fanicchia, F.; & Galeczka, I. M. Design of a scaling reduction system for geothermal applications. En E3S Web of Conferences. EDP Sciences, 2021. p. 01014.
- Quan, Z; Chen, Y.; Wang, X.; Shi, C.; Liu, Y.; Ma, C.; Experimental study on scale inhibition performance of a green scale inhibitor polyaspartic acid. Science in China Series B: Chemistry, 2008, vol. 51, no 7, p. 695-699. [CrossRef]
- Sugama, Toshifumi; Gawlik, Keith. Anti-silica fouling coatings in geothermal environments. Materials Letters, 2002, vol. 57, no 3, p. 666-673. [CrossRef]
- Scott, S.; Galeczka, I. M.; Gunnarsson, I.; Arnórsson, S.; & Stefánsson, A. Silica polymerization and nanocolloid nucleation and growth kinetics in aqueous solutions. Geochimica et Cosmochimica Acta, 2024, vol. 371, p. 78-94. [CrossRef]
- GEOSMART Project. Available online. URL: https://www.geosmartproject.eu (accessed on 4th of September of 2024).
- GEOSMART Project. Periodic report #2, Periodic technical report Part B (confidential report, prepared for funders).
- ASTM G59-97. Standard test method for conducting potentiodynamic polarization resistance measurements. En American Society for Testing and Materials. West Conshohocken, PA, USA: ASTM, 2014.
- API. API 510: Pressure vessel inspection code: in-service inspection, rating, repair, and alteration. American Petroleum Institute, 2006.
- Castro Vargas, Adriana; Paul, Shiladitya. In-situ imaging and electrochemical monitoring of damaged thermal spray aluminium coating in synthetic seawater. Electrochimica Acta, 2023, vol. 464, p. 142847.
- Kulik, D. A.; Wagner, T.; Dmytrieva, S. V.; Kosakowski, G.; Hingerl, F. F.; Chudnenko, K. V.; & Berner, U. R. GEM-Selektor geochemical modeling package: revised algorithm and GEMS3K numerical kernel for coupled simulation codes. Computational Geosciences, 2013, vol. 17, p. 1-24.
- Wagner, T.; Kulik, D. A.; Hingerl, F. F.; & Dmytrieva, S. V. GEM-Selektor geochemical modeling package: TSolMod library and data interface for multicomponent phase models. The Canadian Mineralogist, 2012, vol. 50, no 5, p. 1173-1195. [CrossRef]
- Thoenen, Tres; Kulik, Dmitrii. Nagra/PSI chemical thermodynamic data base 01/01 for the GEM-Selektor (V. 2-PSI) Geochemical Modeling Code: Release 28-02-03. Villigen, Switzerland: Paul Scherrer Institut, 2003.
- Lovering, Thomas Seward. The origin of hydrothermal and low temperature dolomite. Economic Geology, 1969, vol. 64, no 7, p. 743-754. [CrossRef]
- Malik, A. U.; Kutty, P. M.; Siddiqi, N. A.; Andijani, I. N.; & Ahmed, S. The influence of pH and chloride concentration on the corrosion behaviour of AISI 316L steel in aqueous solutions. Corrosion science, 1992, vol. 33, no 11, p. 1809-1827. [CrossRef]
- Khajavian, E.; Attar, M. R.; Zahrani, E. M.; Liu, W.; Davoodi, A.; & Hosseinpour, S. Tuning surface wettability of aluminum surface and its correlation with short and long term corrosion resistance in saline solutions. Surface and Coatings Technology, 2022, vol. 429, p. 127950. [CrossRef]
- Syrek-Gerstenkorn, Berenika; Paul, Shiladitya; Davenport, Alison J. Sacrificial thermally sprayed aluminium coatings for marine environments: A review. Coatings, 2020, vol. 10, no 3, p. 267. [CrossRef]
- Fanicchia, Francesco; Karlsdottir, Sigrún Nanna. Research and Development on Coatings and Paints for Geothermal Environments: A Review. Advanced Materials Technologies, 2023, vol. 8, no 18, p. 2202031. [CrossRef]
- Boersma, A.; Vercauteren, F.; Fischer, H.; & Pizzocolo, F. Scaling assessment, inhibition and monitoring of geothermal wells. En 43rd Workshop on Geothermal Reservoir Engineering. 2018. p. 1-13.
- Gunn, D. J. Effect of surface roughness on the nucleation and growth of calcium sulphate on metal surfaces. Journal of crystal growth, 1980, vol. 50, no 2, p. 533-537. [CrossRef]
Figure 1.
Photographs of the test rig used for the scaling tests: (a) image showing a general view of the rig, with solution reservoirs, small scale (flow) vessel and elements required for the electrochemical measurements, such as potentiostat and reference electrodes, (b) inside of the flow vessel, showing the location of the coupons and counter electrodes and (c) inside the small scale vessel showing the rotating paddle.
Figure 2.
Images generated from software used for CFD calculations: (a) Pathline plot of velocity magnitude through the full three-dimensional domain of the scaling reactor (along with a picture of the coupons installed in the scaling reactors for the field conditions testing) and (b) Contour plot of velocity magnitude (m/s) in the small-scale vessel.
Figure 3.
Evolution of the electrochemical measurements across the 12 days of testing in the vertical coupons for the carbon steel, stainless steel, lean duplex stainless steel and TSA. (a) Corrosion rates obtained from the linear polarization scans. (b) Open circuit potential measurements versus a silver chloride reference electrode and (c) Open circuit potential measurements versus a silver chloride reference electrode for the TSA sample.
Figure 4.
Visual inspections of samples subjected to the exposure tests after 7 days. Starting from carbon steel and stainless steel, followed by lean duplex stainless steel and TSA and finally the coupons coated with Epoxy type B and Epoxy type A.
Figure 4.
Visual inspections of samples subjected to the exposure tests after 7 days. Starting from carbon steel and stainless steel, followed by lean duplex stainless steel and TSA and finally the coupons coated with Epoxy type B and Epoxy type A.
Figure 5.
SEM images of the scales, these were taken at a magnification that allowed identification of the individual morphology of the components of the scale: (a) scales on the stainless steel sample, (b) scales on the steel sample, (c) scales on the Epoxy type B and (d) scales on the Epoxy type A. .
Figure 6.
SEM-EDX information obtained from different scales. SEM image and the EDX maps corresponding to the scale on the stainless steel sample: (a) backscatter SEM image of the scale, along with EDX maps of: (b) Calcium, (c) Oxygen, (d) Magnesium, (e) Silicon and (f) Iron.
Figure 6.
SEM-EDX information obtained from different scales. SEM image and the EDX maps corresponding to the scale on the stainless steel sample: (a) backscatter SEM image of the scale, along with EDX maps of: (b) Calcium, (c) Oxygen, (d) Magnesium, (e) Silicon and (f) Iron.
Figure 7.
EDX point spectra from scales, from the horizontal coupon in 304: (a) from type A scale from
Figure 5a, (b) from type B scale in
Figure 5a and (c) from type C scale from
Figure 5a.
Figure 7.
EDX point spectra from scales, from the horizontal coupon in 304: (a) from type A scale from
Figure 5a, (b) from type B scale in
Figure 5a and (c) from type C scale from
Figure 5a.
Figure 8.
Glancing angle XRD spectra from the surface of the horizontal samples. The black spectrum was the obtained experimental data, with library database peaks shown in colour. (a) from carbon steel, (b) from stainless steel and (c) horizontal sample from lean duplex stainless steel.
Figure 8.
Glancing angle XRD spectra from the surface of the horizontal samples. The black spectrum was the obtained experimental data, with library database peaks shown in colour. (a) from carbon steel, (b) from stainless steel and (c) horizontal sample from lean duplex stainless steel.
Figure 9.
Glancing angle XRD spectra from the surface of Epoxy coated samples. The black spectrum was the obtained experimental data, with library database peaks shown in colour. (a) from virgin Epoxy type A, (b) from horizontal immersed coupon of Epoxy type A, (c) from virgin Epoxy type B and (d) from horizontal immersed coupon of Epoxy type B.
Figure 10.
Glancing angle XRD spectra from the surface of the horizontal TSA coated sample. The black spectrum was the obtained experimental data, with library database peaks shown in colour.
Figure 10.
Glancing angle XRD spectra from the surface of the horizontal TSA coated sample. The black spectrum was the obtained experimental data, with library database peaks shown in colour.
Figure 10.
Saturation indices of selected minerals as a function of temperature for the simulated geothermal brine. The saturation index (SI) is defined as SI = log10(Q/K), where Q is the ion activity product of the mineral in solution, and K is the equilibrium constant for the mineral's dissolution reaction. A positive SI value indicates that the mineral is supersaturated and likely to precipitate, while a negative SI value suggests under saturation.
Figure 11.
Potentiodynamic polarization curves of alloy 304L with non-metallic crevice formers in two different solutions at 50oC and pH 9.7. Solution 1: geothermal brine as described in table 1. And Solution 2: prepared using only NaCl (apart from the NaOH to increase pH to 9.7) to obtain the same levels of chlorides that shown in table 1.
Table 1.
Basis of brine composition for corrosion tests.
Table 1.
Basis of brine composition for corrosion tests.
| Constituent |
Brine, mg/l |
| pH/23°C |
9.7 |
| SiO2
|
451 |
| Na |
2773.2 |
| Ca |
36.7 |
| Mg |
22.1 |
| Cl |
129.4 |
| CO2 |
1081.9 |
Table 2.
Electrochemical immersion tests. Assessment of crevice and stress corrosion cracking in geothermal brine in 304L stainless steel.
Table 2.
Electrochemical immersion tests. Assessment of crevice and stress corrosion cracking in geothermal brine in 304L stainless steel.
| Testing |
Material |
Brine |
Temperature |
Results |
|
| Exposure tests |
304L |
Simulated geothermal brine – 5bar no oxygen |
104oC |
No corrosion events |
|
| U-bend tests |
304L |
Simulated geothermal brine – 5bar no oxygen – pH 5 and pH 9.7 |
104oC |
No SCC -Only few pits were seen in the sample |
|
| Crevice tests |
304L |
Simulated geothermal brine – 5bar no oxygen |
104oC |
No crevice corrosion, only some pits were found in the specimens |
|
Table 3.
Measurements of the average scaling height for the different coupons.
Table 3.
Measurements of the average scaling height for the different coupons.
| Specimen ID |
Step Height |
Average |
Ra |
| M1 |
M2 |
M3 |
| Carbon steel |
8.06 |
8.17 |
5.42 |
7.22 |
1.55 |
| Epoxy type A |
4.87 |
6.13 |
7.44 |
6.14 |
|
| Epoxy type B |
3.63 |
7.27 |
14.28 |
8.39 |
5.41 |
| Stainless |
4.45 |
3.15 |
3.01 |
3.54 |
0.79 |
| Duplex |
7.71 |
12.08 |
9.15 |
9.65 |
2.23 |
| TSA |
Could not distinguish between scaled and cleaned regions, surface roughness is quite high |
|
Disclaimer/Publisher’s Note: The statements, opinions and data contained in all publications are solely those of the individual author(s) and contributor(s) and not of MDPI and/or the editor(s). MDPI and/or the editor(s) disclaim responsibility for any injury to people or property resulting from any ideas, methods, instructions or products referred to in the content. |
© 2024 by the authors. Licensee MDPI, Basel, Switzerland. This article is an open access article distributed under the terms and conditions of the Creative Commons Attribution (CC BY) license (http://creativecommons.org/licenses/by/4.0/).
