1. Introduction
During the pad stage in hydraulic fracturing, hydraulic fracturing fluid, predominantly water, is injected into the reservoir to breakdown the formation and create hydraulic fractures. In the Bakken, operators are beginning to rely heavily on the use of treated produced water in the pad stage of hydraulic fracturing (Tomomewo et al., 2023). The produced water utilized for this purpose is laden with fine suspended particles. Despite efforts to treat the produced water up to the point of eliminating most of the fine particles contained in it(Nath, F., Chowdhury, M.O. S., & Rahaman, M.M., 2023), cost considerations have not permitted the oil industry to achieve this goal(Boschee, 2014, Bennion et al., 2001), and fine particles persist in treated produced water used at the pad stage of the hydraulic fracturing operation(Mantell, M.E. 2011). The presence of agglomerate particles in produced water is critical, as their size and stability influence the formation of particle bridges across pore throats and narrow aperture hydraulic fractures when they come into direct contact with reservoir rock(Ramachandran V, Fogler HS., 1999).Pursuant to this contact, clogging of pore throats by migration of free fragmented fine particles causes a major operational issue during drilling and hydraulic fracturing of tight reservoirs because this constitutes a source of formation damage(Bortal-Nafaa and Gouvenot ,2002).
During the pad stage of hydraulic fracturing, the particles remaining in treated produced water used in undergo degradation due to mechanical forces, particularly from mechanical pump action. This degradation occurs through three main mechanisms: interaction with the flowing fluid, interparticle collisions, and contact with pore throat surfaces as can be seen in Fig.1( Yili Kang et al., 2018).
Figure 1.
(a) breakage caused by the interaction of particles with flowing fluid; (b) breakage caused by interparticle interaction; (c) breakage caused by interaction of particle with boundary of pore throat surface.
Figure 1.
(a) breakage caused by the interaction of particles with flowing fluid; (b) breakage caused by interparticle interaction; (c) breakage caused by interaction of particle with boundary of pore throat surface.
The degradation in size of these fine particles enables them to invade pores. Fine particle invasion into these pores can impair reservoir performance by blocking major fluid pathways, making size reduction a detrimental process. Degradation of these particles facilitates their penetration into the pore spaces, increasing the risk of reservoir damage(Kang et al., 2016) and posing a significant operational challenge in hydraulic fracturing. The size of these particles is therefore critical, as particle size distribution (PSD) will significantly impact reservoir deliverability during hydraulic fracturing or water flooding.
When the particles generated after degradation are larger than 1/3 of the average pore size of the rock encountered, they will develop an external filter cake (Vitthal and McGowen, 1996) on the surface of the rock (Pautz et al. 1989, Al-Abduwani et al., 2005; Ochi et al., 1999; Vitthal and McGowen, 1996 ) .When the particle sizes further reduce to 1/7th of the size of the pore throat or fracture aperture, the strength of the bridges formed by particles across them become greatly weakened(Oort, E.V., Van Velzen, J.F. G., & Leerlooijer, K. (1993)., Bedrikovetsky, P., 2008) and break into single particles which then sieve through the pore throats into the pore space and while there, form an internal filter cake. This internal filter cake greatly reduces the permeability of the formation, hence damaging it(Li and Civan , 199 ., Y. Kang et al., 2014).
The degree of this degradation is thus very necessary as it provides an indication of the potential risk of formation damage based on the type of cake formed. This study focuses on understanding the degree of particle degradation using the d90 rule, a classical theory for optimal particle size in a particle size distribution and evaluates how different pump speeds contribute to this degradation process.
The size degradation rate R
90 (%) of the coarse or agglomerate particles in the produced water during hydraulic fracturing can be calculated through the equation
Where
is the agglomerate particle size degradation rate, %
is the dynamic viscosity of the pad stage fracking produced water (mPa.s) = 0.27545 mPa.s@ 123 degrees centigrade (average temperature of the middle Bakken)
N is the pump speed used for hydraulic fracturing(rpm)
t is the time (minutes)
is the agglomerate particle size (microns)
2. Material and Methods
2.1. Materials
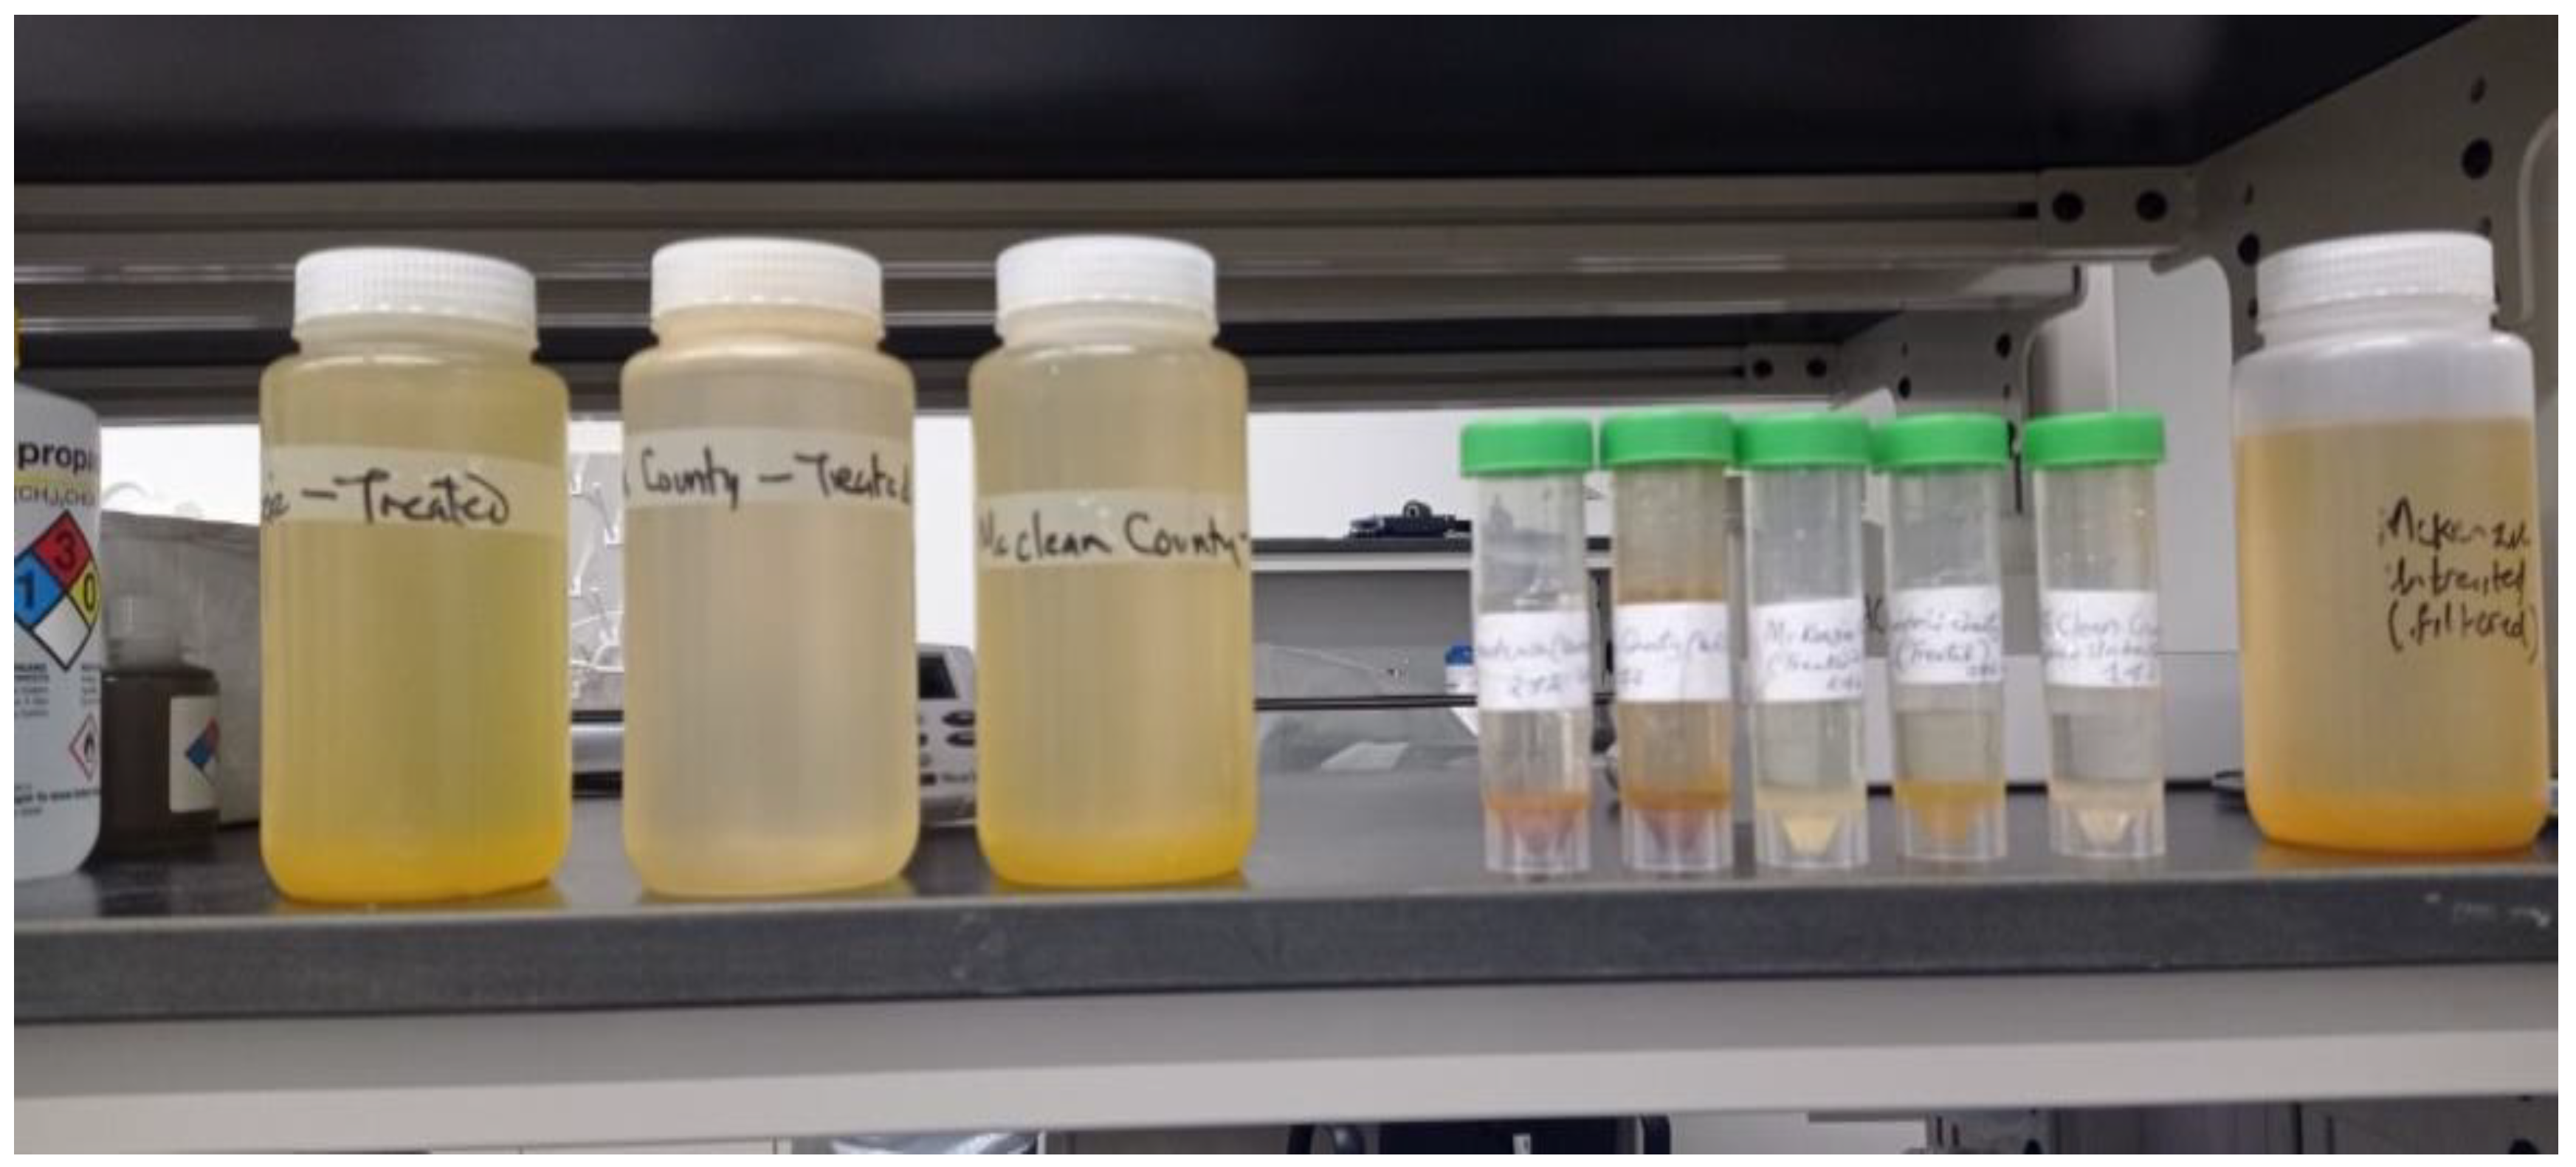
Samples of treated and untreated produced water were collected from different well sites within the Bakken Formation.
Figure 1.
Produced Water Samples.
Figure 1.
Produced Water Samples.
The particle size distribution from these samples were measured using the Laser Diffraction technique. The d90 values, representing the particle size below which 90% of the sample's mass resides, were determined for each sample. To assess the impact of pump speed on particle degradation, pump speeds from various manufacturers used for fracturing process were considered.
These variables were then inserted into the agglomerate particle size degradation rate equation above to quantify the extent of particle size reduction as a percentage of the initial particle size (
d90) with time. For each produced water sample and its corresponding agglomerate particle
d90 value, the size reduction rate was calculated for each of the maximum operational pump rates in
Table 1. above.
3.2. Results
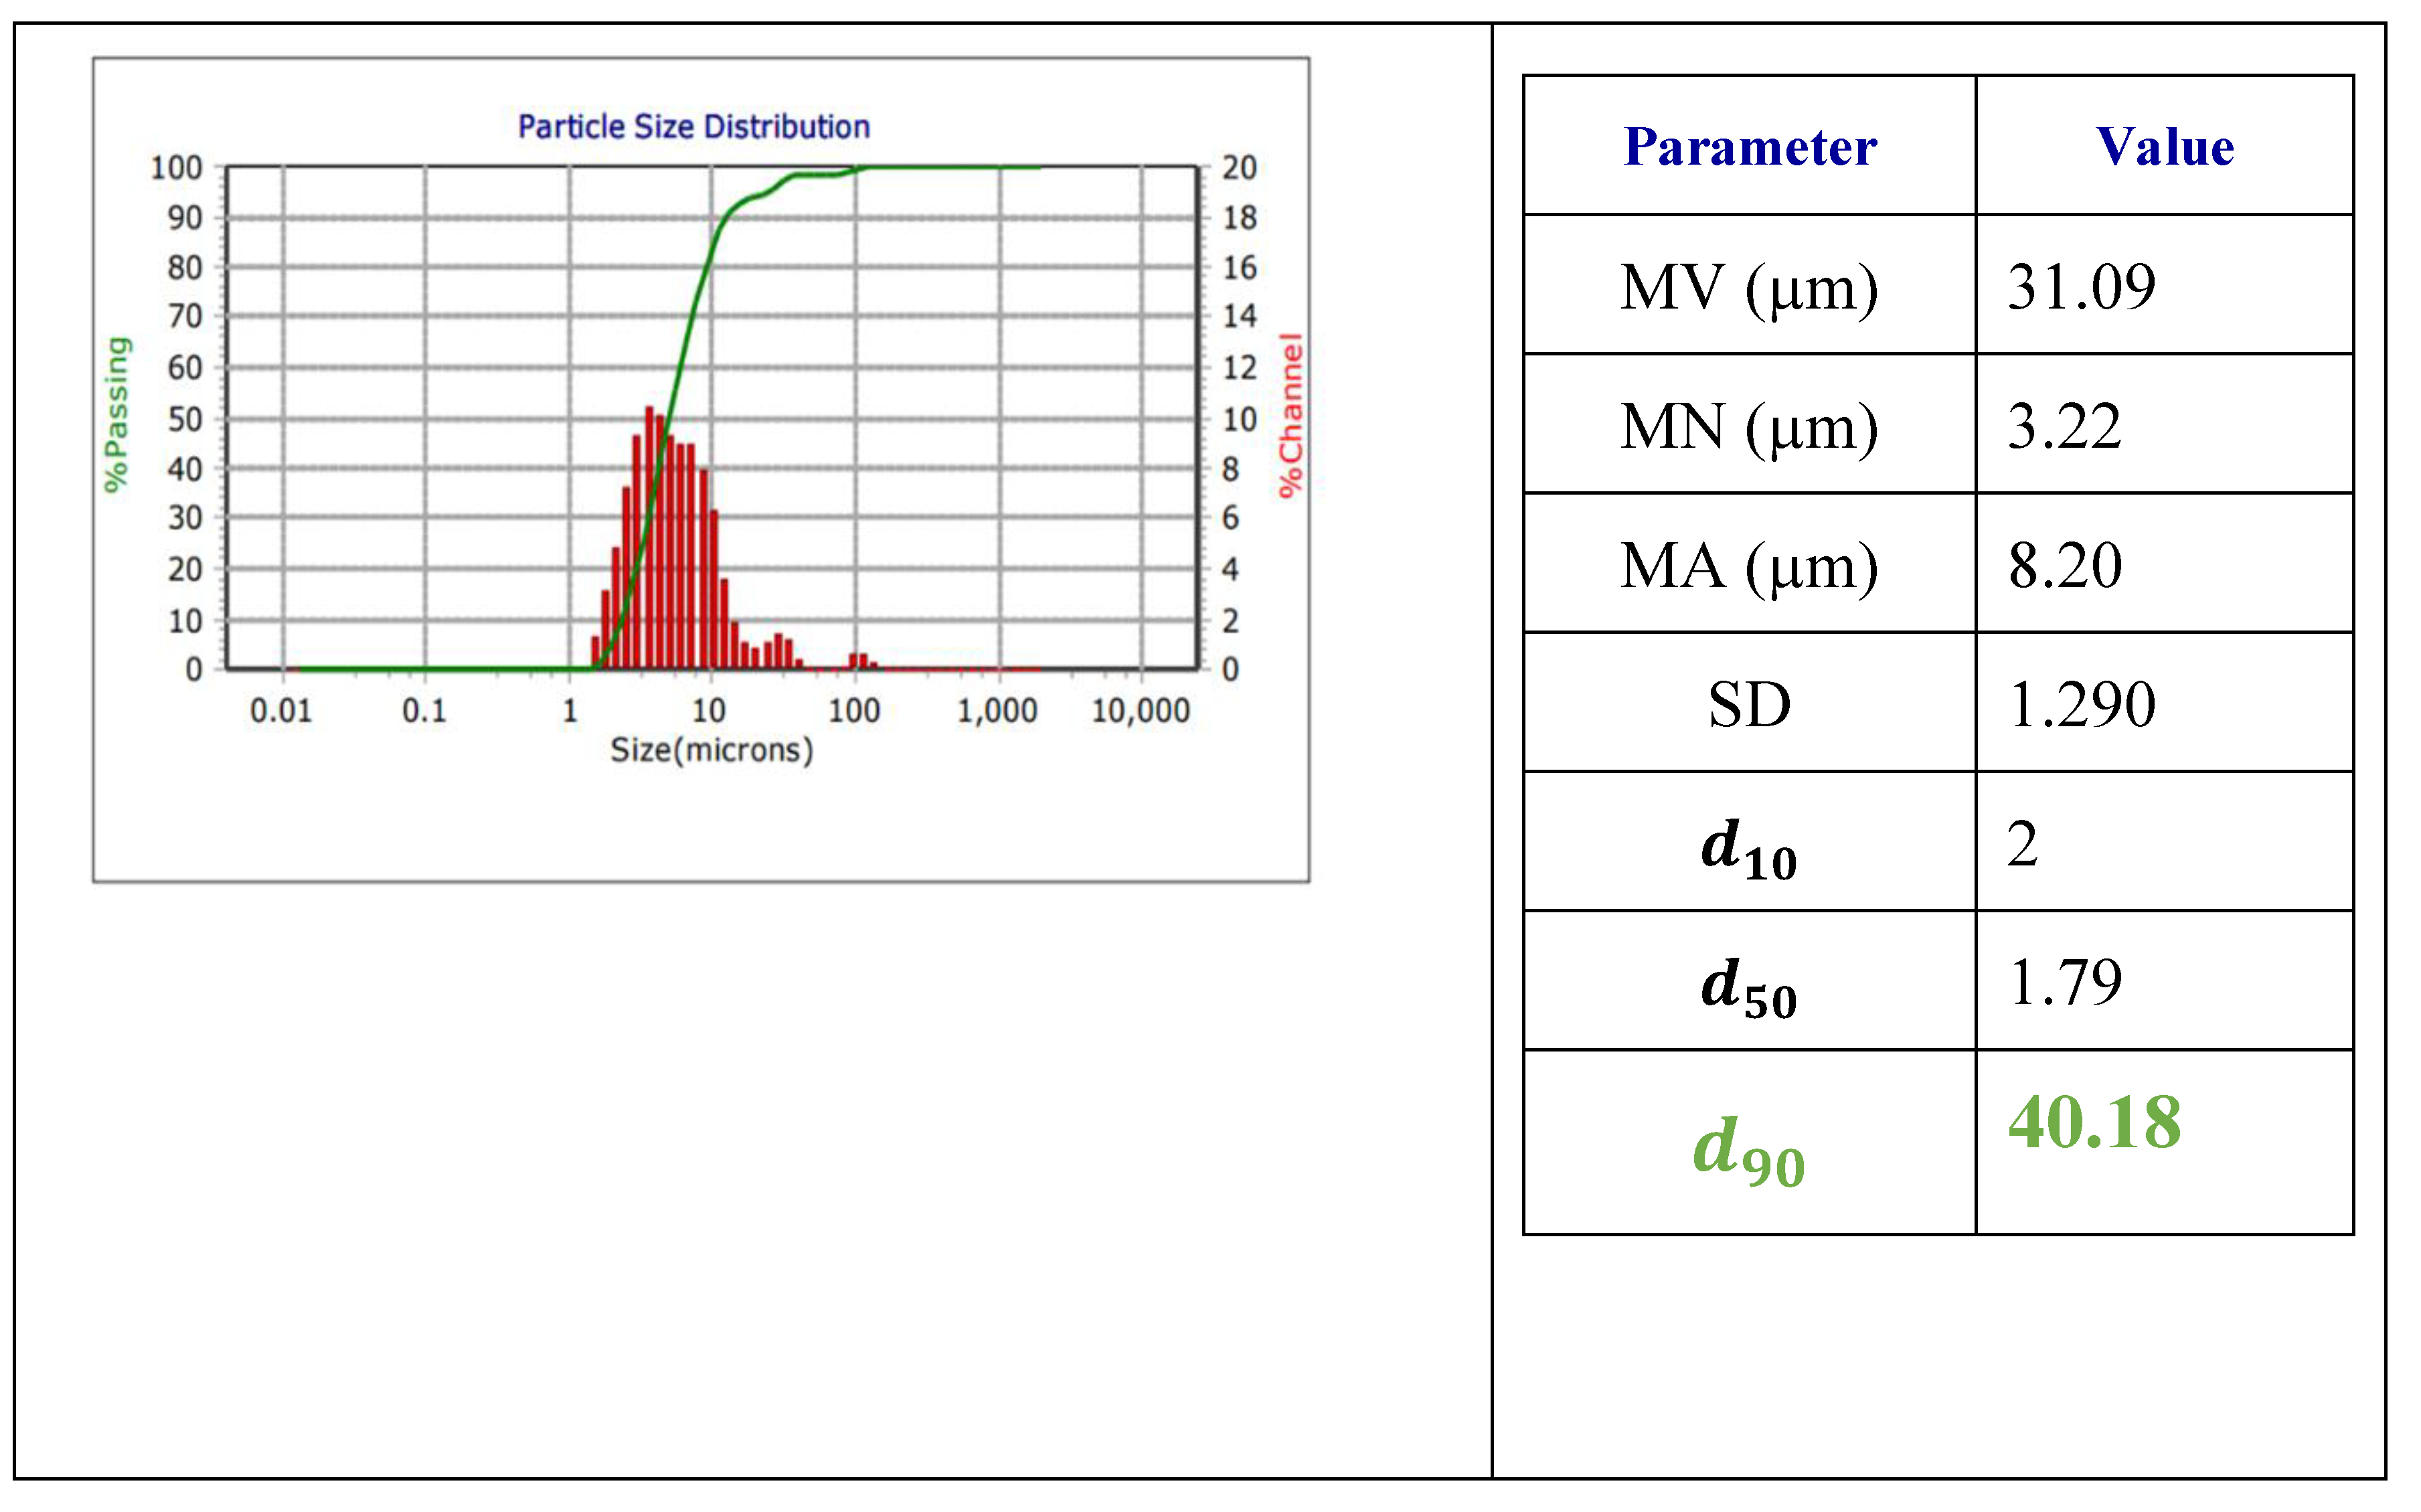
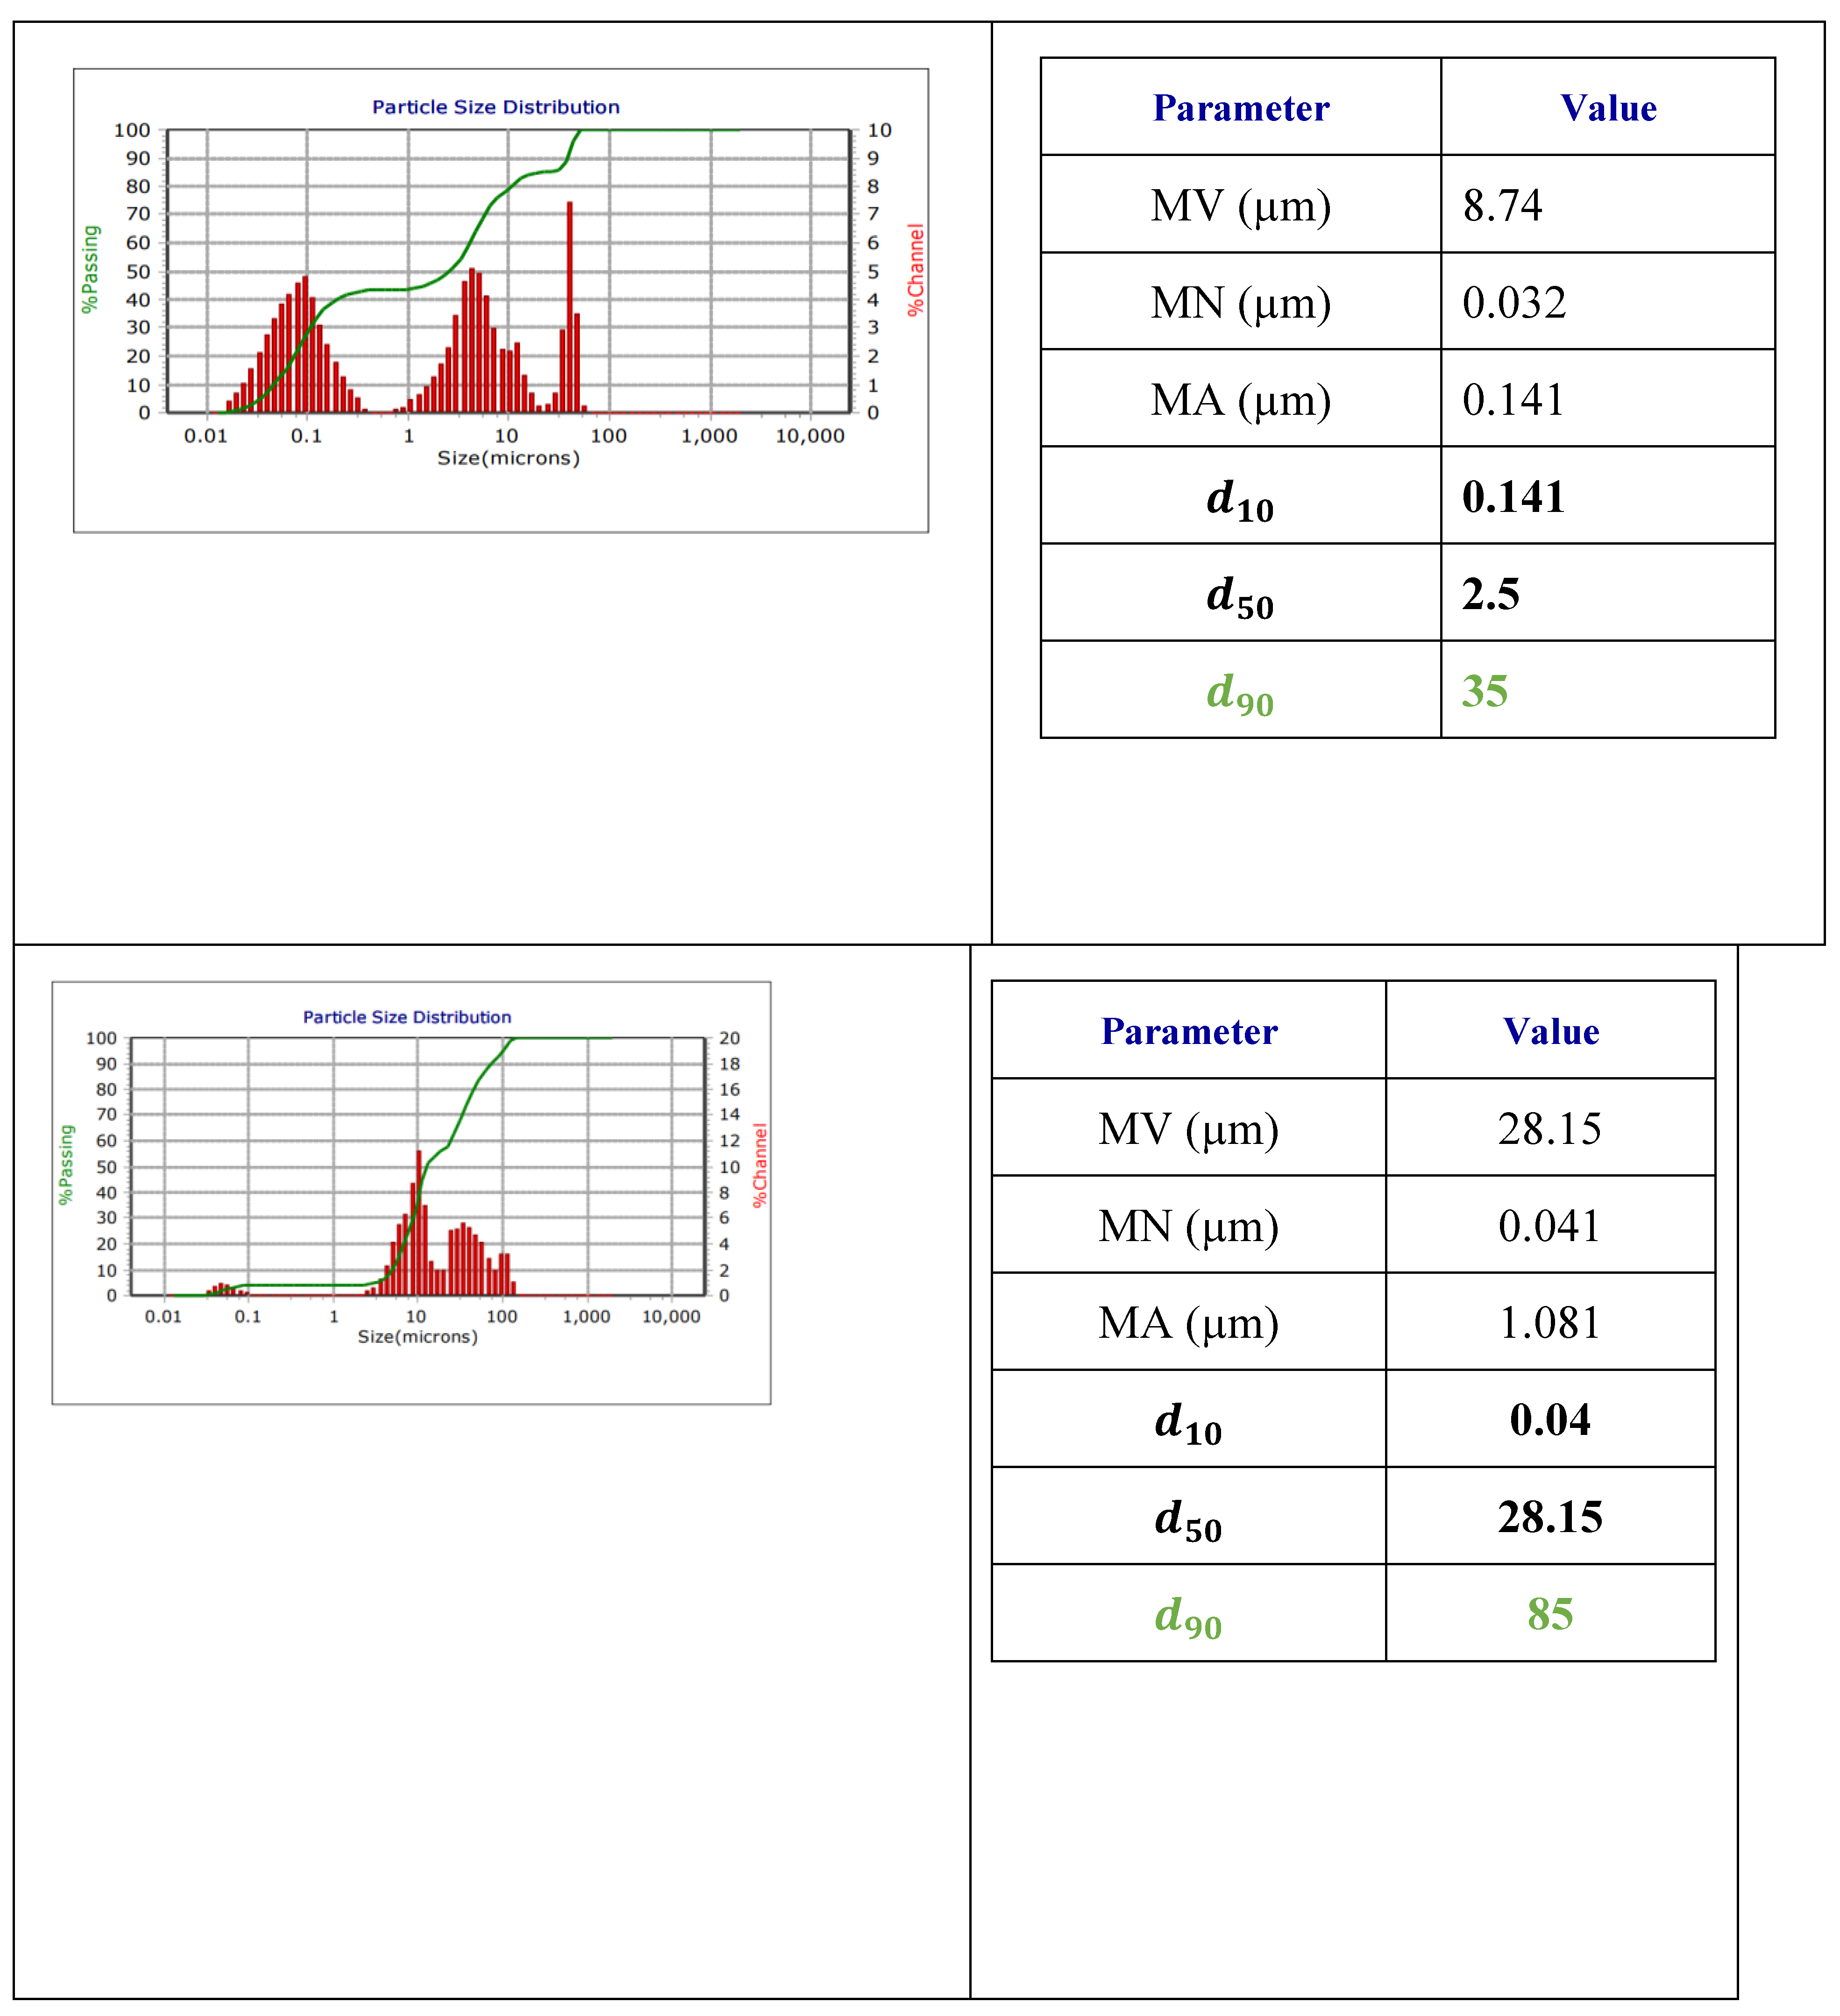
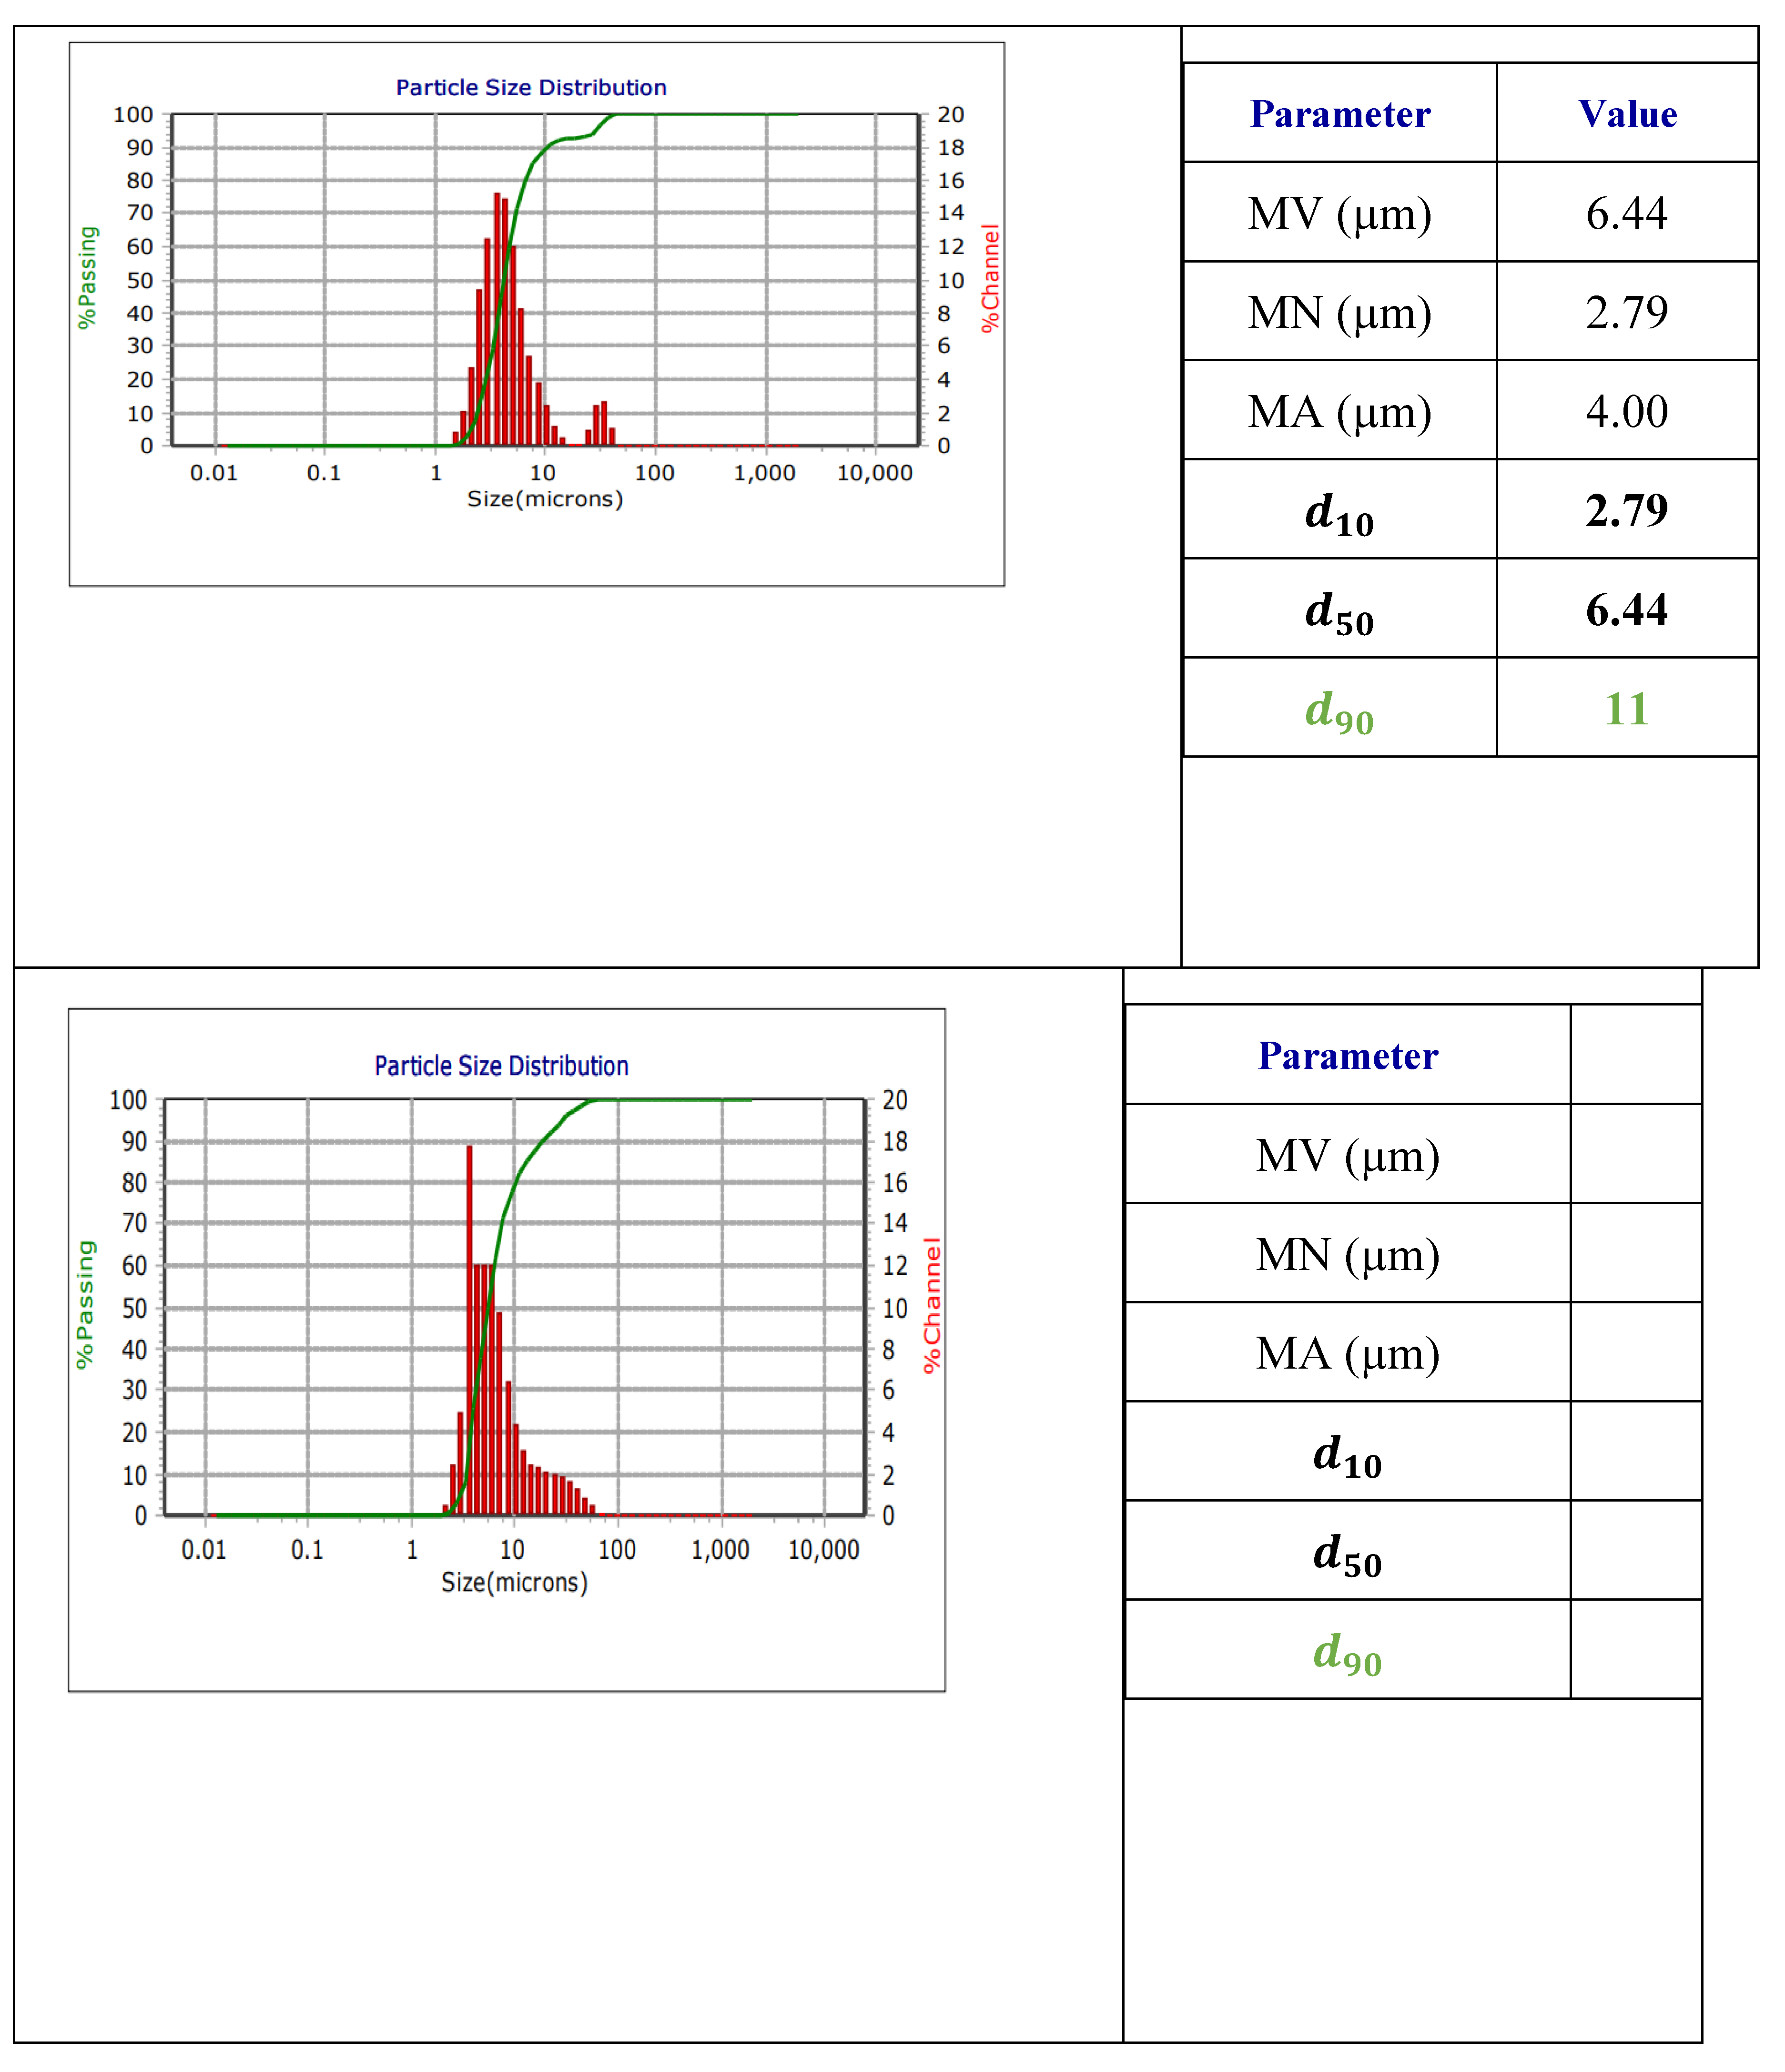
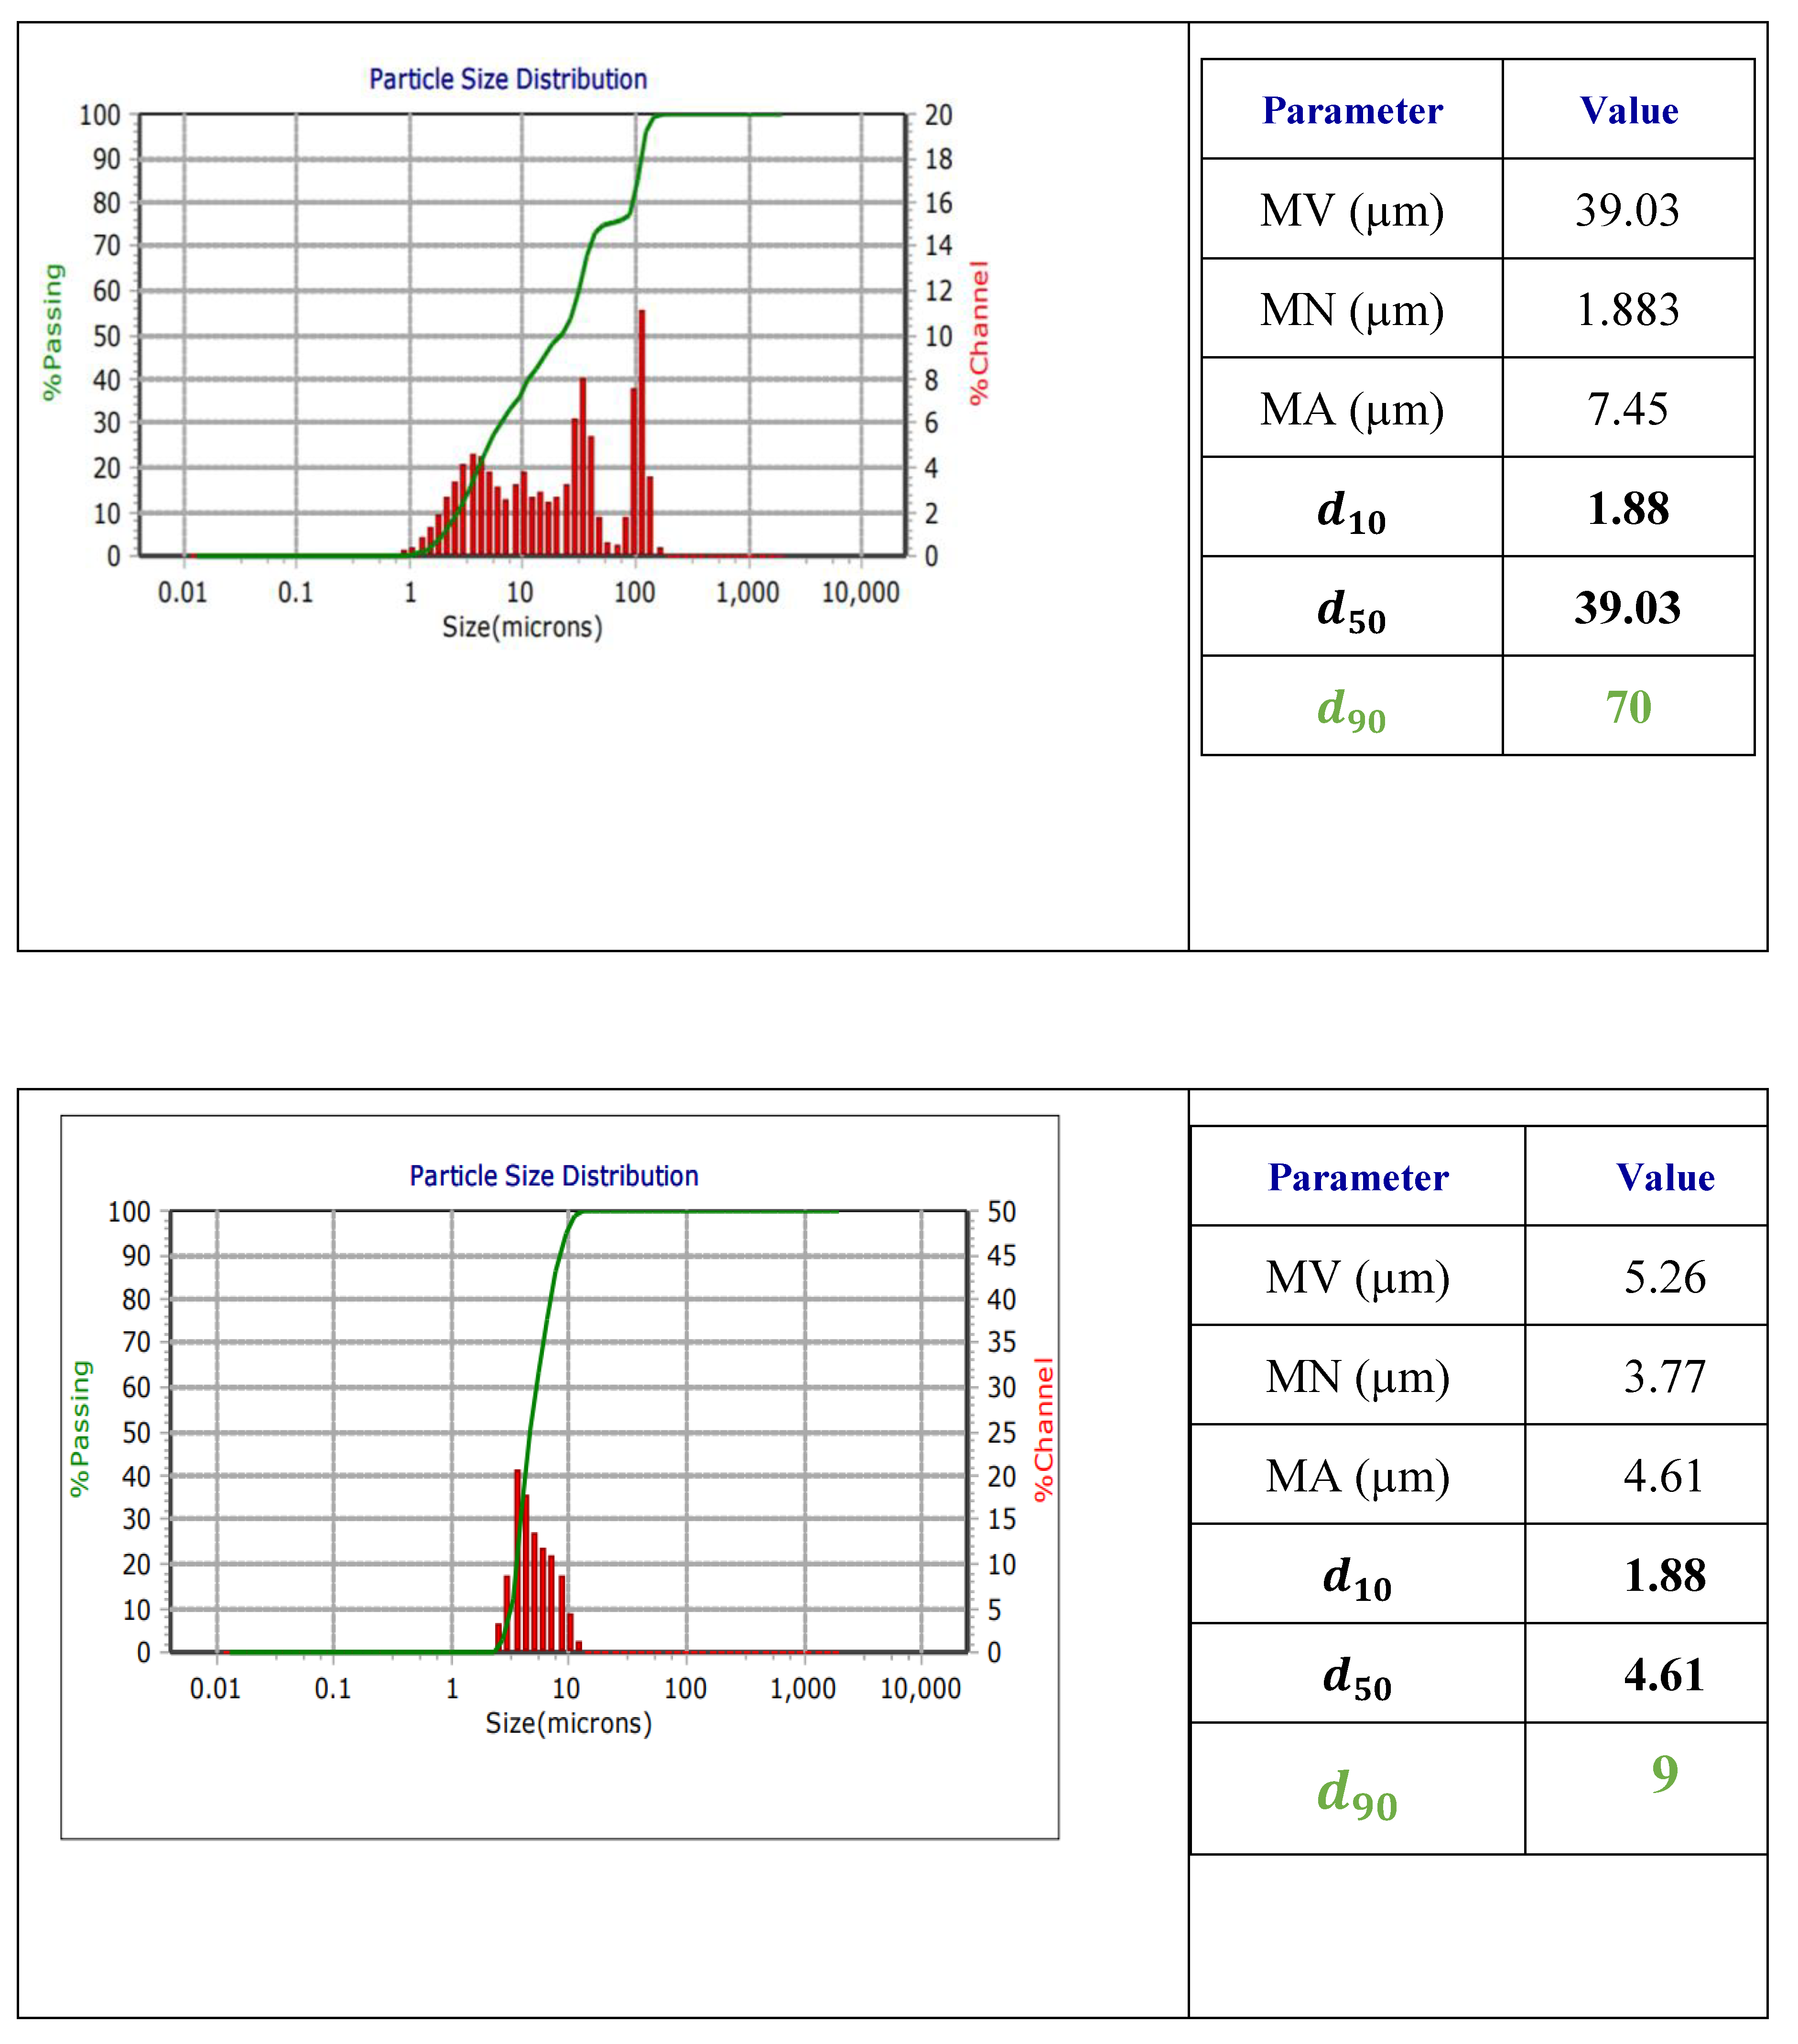
The particle size distributions and the associated particle statistical parameters were calculated by algorithms embedded in the Laser Diffraction particle analysis machine. These are found in the figures 3(a) to 3(o) below. The results show that the distributions are not symmetrical and only the relevant statistical parameters are used.
Figure 3.
(a) Particle size distribution for McClean Untreated produced water; (b) Particle Statistics for McClean Untreated produced water; (c) Particle size distribution for McClean treated produced water;(d) Particle Statistics for McClean treated produced water(f) Particle size distribution for McKenzie Untreated Filtered;(g) Particle Statistics for McKenzie Untreated Filtered; (h) Particle size distribution for McKenzie treated filtered;(i) Particle Statistics for McKenzie treated filtered;(j) Particle size distribution for William untreated; (k) Particle Statistics William untreated. (l)Particle size distribution for Williams Treated; (m) Particle Statistics for Williams Treated; (n) Particle size distribution for Mountrail County Treated Produced Water; (o). Particle Statistics for Mountrail County Treated Produced Water.
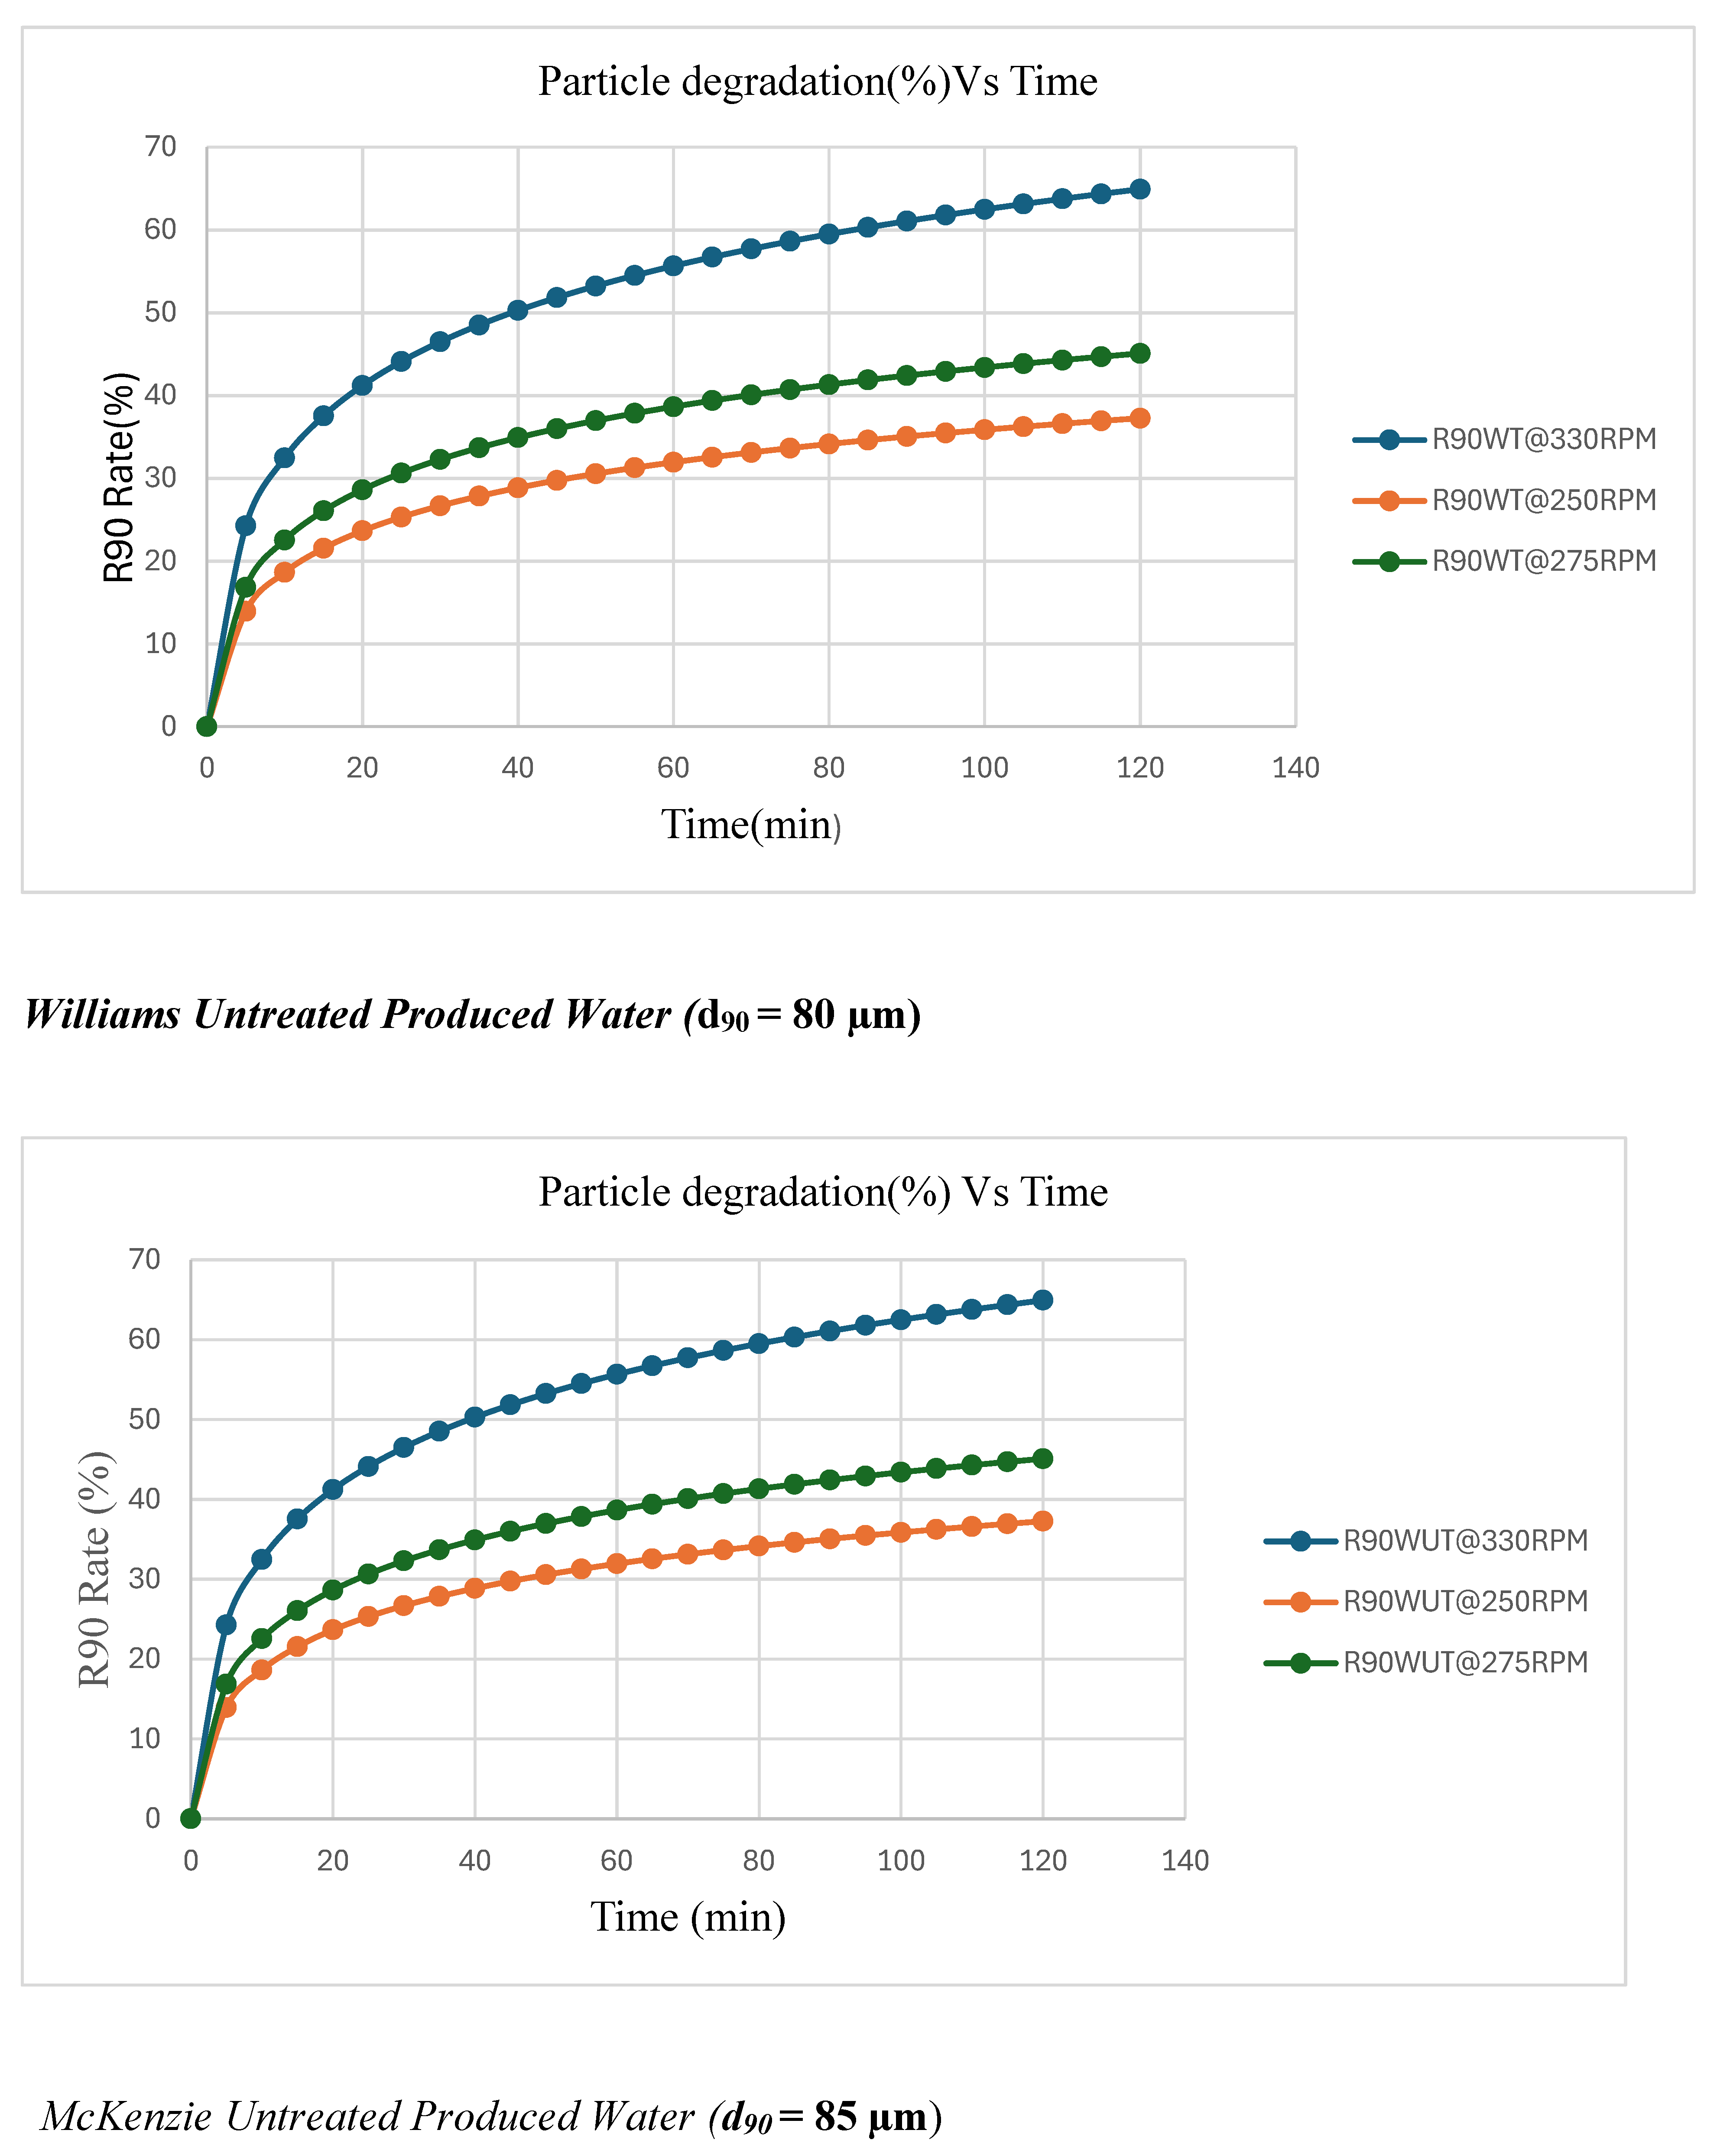
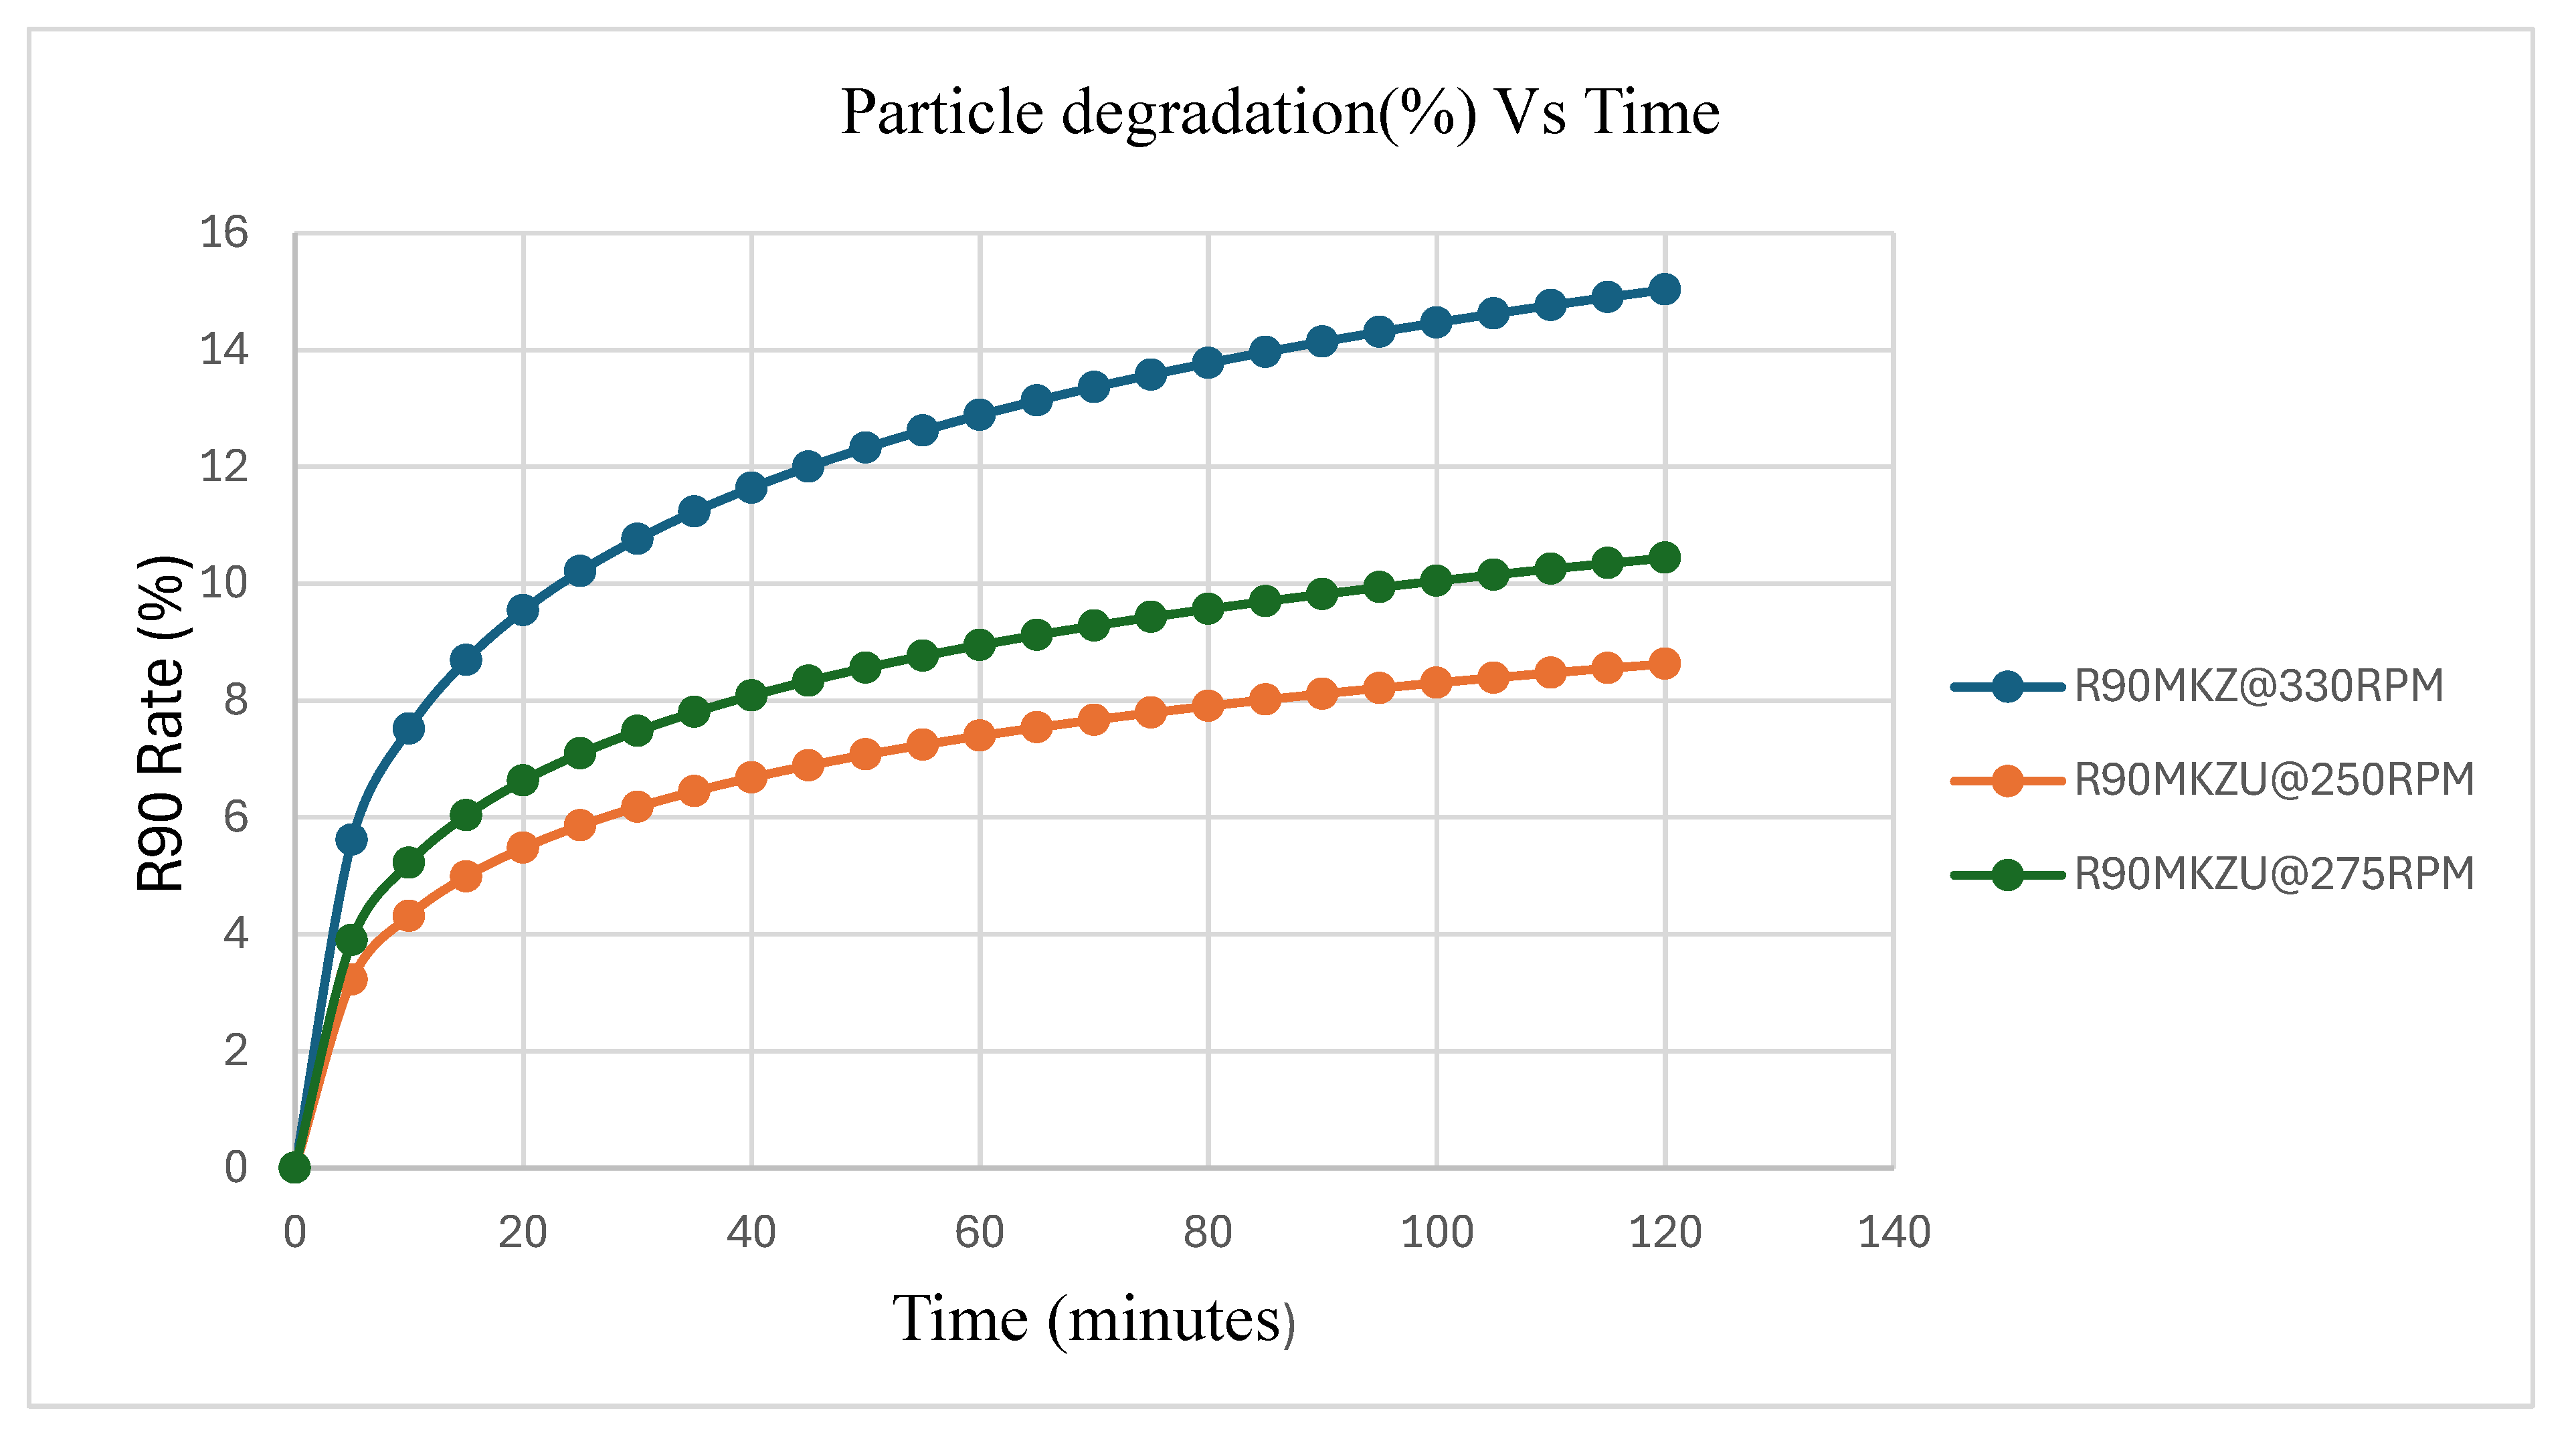
The d90 analysis revealed significant variability in particle size degradation across the five samples. Higher pump speeds were correlated with greater particle size reduction, leading to a shift in the particle size distribution towards smaller diameters. The degradation rate equation highlighted a critical threshold where particle sizes dropped below the optimal range, potentially compromising the efficiency of the fracturing fluid.
4. Discussion
The findings suggest that pump speed as well as the initial particle size of the aggregate or agglomerate is a key factor in particle size degradation during hydraulic fracturing. While higher pump speeds may enhance fluid delivery, they also contribute to the breakdown of agglomerate particles, which could negatively impact the permeability of the reservoir through pore throat blockage and internal filter cake formation by the broken-down particles. By optimizing pump speeds and adjusting fracturing fluid formulations based on d90 metrics, operators can mitigate the risks associated with formation damage via particle degradation during hydraulic fracturing.
5. Conclusions
This study underscores the importance of understanding and monitoring agglomerate particle degradation in treated produced water used for hydraulic fracturing. The use of d90 values and pump speed provides a straightforward approach to estimating particle size reduction rates and the direct impact this has on formation damage during hydraulic fracturing in the Bakken.
Initial particle size of suspended particles plays a significant role in size degradation. The extent of size degradation increases sharply with increasing initial size.
The rate of particle degradation is highest within the first 5 minutes of pump action and declines with time thereafter. It can thus be inferred that formation pore clogging is more rapid at the beginning of the pad stage of hydraulic fracturing.
To mitigate the formation damage and overcome the effect of size degradation on formation damage, it is strongly recommended to properly scale-up the particle size and proportion of coarser particles in the suspension. This information can be obtained from a particle size distribution analysis of a treated water sample used for hydraulic fracturing. The coarser particles the particles there are in the distribution, the greater the risk of a rapid degradation at high pump speeds and eventual formation of an internal filter cake that may damage the formation early in the fracturing process. It is desired to reduce the formation internal filter cakes and therefore a comparison of the pore throat size and the particle size is important. Smaller particles on the other hand may quickly penetrate the pores and contribute to the formation of internal filter cakes. Therefore, the appropriate pump speed should be chosen for the operation. High pump speeds may degrade the particles to the point where the formation of internal filter cakes is favored.
In summary, understanding the particle size distribution of produced water used as base fluid for hydraulic fracturing is crucial for predicting its potential to block pore spaces. Larger particles can reduce porosity, hindering fluid flow and possibly preventing fluids from reaching a conductive fracture or the wellbore. Conversely, smaller particles can form internal filter cakes, as mentioned earlier. Incorrect particle sizes may compromise the formation’s permeability, lowering production and profitability. Therefore, it is advisable to use less coarse suspended particles and lower pump speeds during the initial stages of fracturing to avoid formation damage caused by the excessive penetration of degraded particles into pore throats. Additionally, filter cakes formed by coarser particles are easier to remove than internal filter cakes..
Nomenclature
| d10 |
signifies the point in the size distribution, up to and including which, 10% of the total volume of material in the sample is found (µm). |
| d50 |
signifies the point in the size distribution, up to and including which, 50% of the total volume of material in the sample is found (µm). |
| d90 |
signifies the point in the size distribution, up to and including which, 90% of the total volume of material in the sample is found (µm). |
| MV |
Median Particle Size measured in Volume mode. |
| MA |
Surface area equivalent from volume distribution(MV) value. |
| MN |
Number equivalent from volume distribution(MV) value. |
| MA and MN values are only valid for symmetrical particle size distributions. The particle size distributions obtained from the water analysis are not symmetrical. |
| RPM |
pump speed, revolutions per minute( rpm). |
| D90 |
particle degradation rate (%) |
| µ (mPa.s) |
viscosity of Water at 123 degrees centigrade. |
Acknowledgement
We thank the Department of Petroleum Engineering of the University of North Dakota for providing access to the produced water samples used in this work. We also acknowledge the help of an industrial partner for providing a fracking fluid sample. Financial contributions to accomplish this work were provided by the NDIC( North Dakota Industrial Commission).
Conflicts of Interest
There are no conflicts of interest.
Data Availability
The datasets generated in this work can be obtained from the corresponding author upon request.
References
- Oort, E.V.; Van Velzen, J.F.G; Leerlooijer, K. Impairment by suspended solids invasion: testing and prediction. SPE Production & Facilities 1993, 8, 178–184. [Google Scholar]
- Bedrikovetsky, P. Upscaling of stochastic micro model for suspension transport in porous media. Transport in porous media 2008, 75, 335–369. [Google Scholar] [CrossRef]
- Vogel, L.; Peukert, W. Breakage behavior of different materials—construction of a master curve for the breakage probability. Powder Technology 2003, 129, 101–110. [Google Scholar] [CrossRef]
- Gillies, R.G.; Schaan, J.; Sumner, R.J.; McKibben, M.J.; Shook, C.A. Deposition velocities for Newtonian slurries in turbulent flow. The Canadian Journal of Chemical Engineering 2000, 78, 704–708. [Google Scholar] [CrossRef]
- Ramachandran, V.; Fogler, H.S. Plugging by hydrodynamic bridging during flow of stable colloidal particles within cylindrical pores. J Fluid Mech 1999, 385, 129–156. [Google Scholar] [CrossRef]
- Stanley Tomomewo, Reducing Produced Water Disposal Via Effective Treatments Methods and Re-Use: Proposed Sustainable Application For Bakken, North Dakota, PhD Dissertation.
- Boschee, P. Produced and flowback water recycling and reuse: economics, limitations, and technology. Oil and Gas Facilities 2014, 3, 16–21. [Google Scholar] [CrossRef]
- Mantell, M.E. (2011, March). Produced water reuse and recycling challenges and opportunities across major shale plays. In EPA hydraulic fracturing study technical workshop (Vol. 4, No. 9).
- Nath, F.; Chowdhury, M.O.S.; Rhaman, M.M. Navigating produced water sustainability in the oil and gas sector: A Critical review of reuse challenges, treatment technologies, and prospects ahead. Water 2023, 15, 4088. [Google Scholar] [CrossRef]
- Pautz, J.F.; Crocker, M.E.; Walton, C.G. (1989, March). Relating water quality and formation permeability to loss of injectivity. In SPE Oklahoma City Oil and Gas Symposium/Production and Operations Symposium (pp. SPE-18888). SPE.
- Li, L.; Holt, R.M. Particle scale reservoir mechanics. Oil Gas Sci. Technol. 2002, 57, 525–538. [Google Scholar]
- Liu, X.; Civan, F. Formation damage and filter cake buildup in laboratory core tests: modeling and model-assisted analysis. SPE Form. Eval. 1996, 11, 26–30. [Google Scholar] [CrossRef]
- Bortal-Nafaa, S.; Gouvenot, D. 2002. Fine cement grout injection: discrete numerical modeling, Numerical modeling in micromechanics via particle methods: In: Proceedings of the 1st International PFC Symposium. Taylor and Francis, Gelsenkirchen, Germany.
- Bennion, D.B.; Thomas, F.B.; Imer, D.; Ma, T.B.; et al. B. 2001. Water Quality Considerations Resulting in the Impaired Injectivity of Water Injection and Disposal Wells. Paper SPE 2000-067 presented at the Canadian International Petroleum Conference, Calgary, Alberta, 4–8 June. [CrossRef]
- Al-Abduwani, F.A.H. 2005. Internal filtration and external filter cake build-up in sandstones. PhD thesis, Delft University of Technology, Delft.
- Ochi, J.; Detienne, J.-L.; Rivet, P.; Laborie, Y. 1999. External Filter Cake Properties During Injection of Produced Waters, Paper SPE 54773-MS presented at the SPE European Formation Damage Conference, The Hague, Netherlands, 31 May–1 June. [CrossRef]
- Kang, Y.L. T Experimental Investigation on Size Degradation of Bridging Material in Drilling Fluids. Powder Technology 2019, 342, 54–66. [Google Scholar] [CrossRef]
- Vitthal, S.; McGowen, J.M. 1996. Fracturing fluid leak off under dynamic conditions Part 2: effect of shear rate, permeability, and pressure. In: SPE Annual Technical Conference and Exhibition. [CrossRef]
- Kang, Y.; Huang, F.; You, L.; Li, X.; Gao, B. Study of water locking damage mechanism and water unlocking of low permeability reservoir. Int. J. Coal Geol. 2016, 154, 123–e135. [Google Scholar] [CrossRef]
- Kang, Y.; Xu, C.; You, L.; Yu, H.; Zhang, B. Comprehensive evaluation of formation damage induced byworking fluid loss in fractured tight gas reservoir. J. Nat. Gas Sci. Eng. 2014, 18, 353–359. [Google Scholar] [CrossRef]
|
Disclaimer/Publisher’s Note: The statements, opinions and data contained in all publications are solely those of the individual author(s) and contributor(s) and not of MDPI and/or the editor(s). MDPI and/or the editor(s) disclaim responsibility for any injury to people or property resulting from any ideas, methods, instructions or products referred to in the content. |
© 2024 by the authors. Licensee MDPI, Basel, Switzerland. This article is an open access article distributed under the terms and conditions of the Creative Commons Attribution (CC BY) license (http://creativecommons.org/licenses/by/4.0/).

