1. Introduction
The changing patterns of spatial structure within urban agglomerations have significant guiding effects on urban construction and development direction [
1,
2]. Since the Reform and Opening up policy in 1978, under the background of rapid industrialization and urbanization, the dominant status of urban agglomerations has been continuously elevated, and China has entered a new stage of regional spatial development led by urban agglomerations. As the most active area for urban land expansion [
3], the agglomeration of populations, resource encroachment, and ecological issues within urban agglomeration have become increasingly prominent in these active regions of urban land expansion [
4,
5,
6]. China’s urbanization development is a crucial dimension in achieving the strategic task of Chinese modernization. However, the widespread issues of blind expansion, disorderly spread, and low-quality competition in the current spatial development of Chinese urban agglomeration, which marked by scale inflation and spatial imbalances, pose challenges to the sustainable development of these urban agglomeration. The scale, patterns, and benefits of urban agglomeration expansion affect the overall regional development pattern [
7]. Thus, exploring the characteristics and laws of urban agglomeration land expansion is of great significance for a profound understanding of the development process of urban agglomeration.
Research on urban spatial expansion is currently focused on three main aspects [
8]: the spatial-temporal characteristics and evolutionary analysis of urban spatial expansion [
9,
10,
11], the driving mechanisms behind urban spatial expansion [
12,
13,
14], and the socio-economic and ecological impacts resulting from urban spatial expansion [
15,
16,
17]. Specifically, (1) Quantifying the dynamic spatial and temporal changes in the expansion of urban agglomerations is an effective way to promote high-quality development of urban areas. In terms of research methodology, most scholars analyze various types of data changes within cities by using indicators such as urban expansion rate index, urban expansion intensity index, urban expansion extent index, and urban construction land expansion elasticity coefficient. Some studies use expansion differentiation indices and intensity indices [
18], as well as expansion elasticity coefficients [
19] to analyze the variations in the intensity of urban construction land expansion at different times. Some researchers introduce Center-of-gravity model and space syntax to analyze the spatial morphology of multi-centered urban areas, presenting the structural characteristics of urban spatial areas from the perspectives of attraction intensity, influence range, and spatial accessibility [
20]. Furthermore, some scholars analyze the spatial distribution characteristics and changes, as well as the regularities of urban spatial distribution using spatial center of gravity transfer models and standard deviational ellipse [
21]. (2) In terms of research on driving mechanisms, scholars have conducted factor detection within research areas by constructing regression models and spatial models, such as binary logistic regression model [
22], geodetectors [
23], and space-time geography weighted regression (GTWR) models [
24]. (3) Analysis of the benefits of urban expansion mainly focuses on the changes in regional natural, social, and economic systems triggered by urban expansion, analyzing the coupled and coordinated relationships between urban expansion and population growth, economic development, social security, and ecological construction [
25].
National urban agglomerations are important city alliances that promote regional coordinated development, rational allocation of resources, effective industrial division of labor, and factor mobility. The Beibu Gulf Urban Agglomeration of Guangxi is one of the key national urban agglomerations constructed in China. Compared with single cities, urban agglomerations have a higher level of integrated interactive development in spatial organization and economic links. Therefore, conducting an empirical analysis and interpretation of the spatiotemporal variation patterns, functional attributes of the role of human-land relations, regional integration and spatial heterogeneity of urban land expansion in the Beibu Gulf Urban Agglomeration has important reference value for its high-quality development. However, overall, the exploration of the coupling spatial differentiation and driving factors between urban agglomeration expansion intensity and urbanization benefits is still not deep enough. In view of this, this study compares and analyzes the spatial-temporal characteristics of land use expansion in the Beibu Gulf Urban Agglomeration from 2012 to 2022. By exploring the intensity index of urban expansion, this study discusses the expansion rate and mode of the Beibu Gulf Urban Agglomeration and analyzes the degree of coordination between "population-land", "economy-land", "society-land" and "ecology-land" through the synergy index and Center-of-gravity model. Finally, through the geodetector, this study identifies the main factors affecting the expansion of the Beibu Gulf Urban Agglomeration, aiming to increase the basic understanding of the spatial-temporal variation patterns of the Beibu Gulf Urban Agglomeration’s urban expansion from the perspective of coordination.
2. Research Area Overview and Data Sources
2.1. Overview of the Research Area
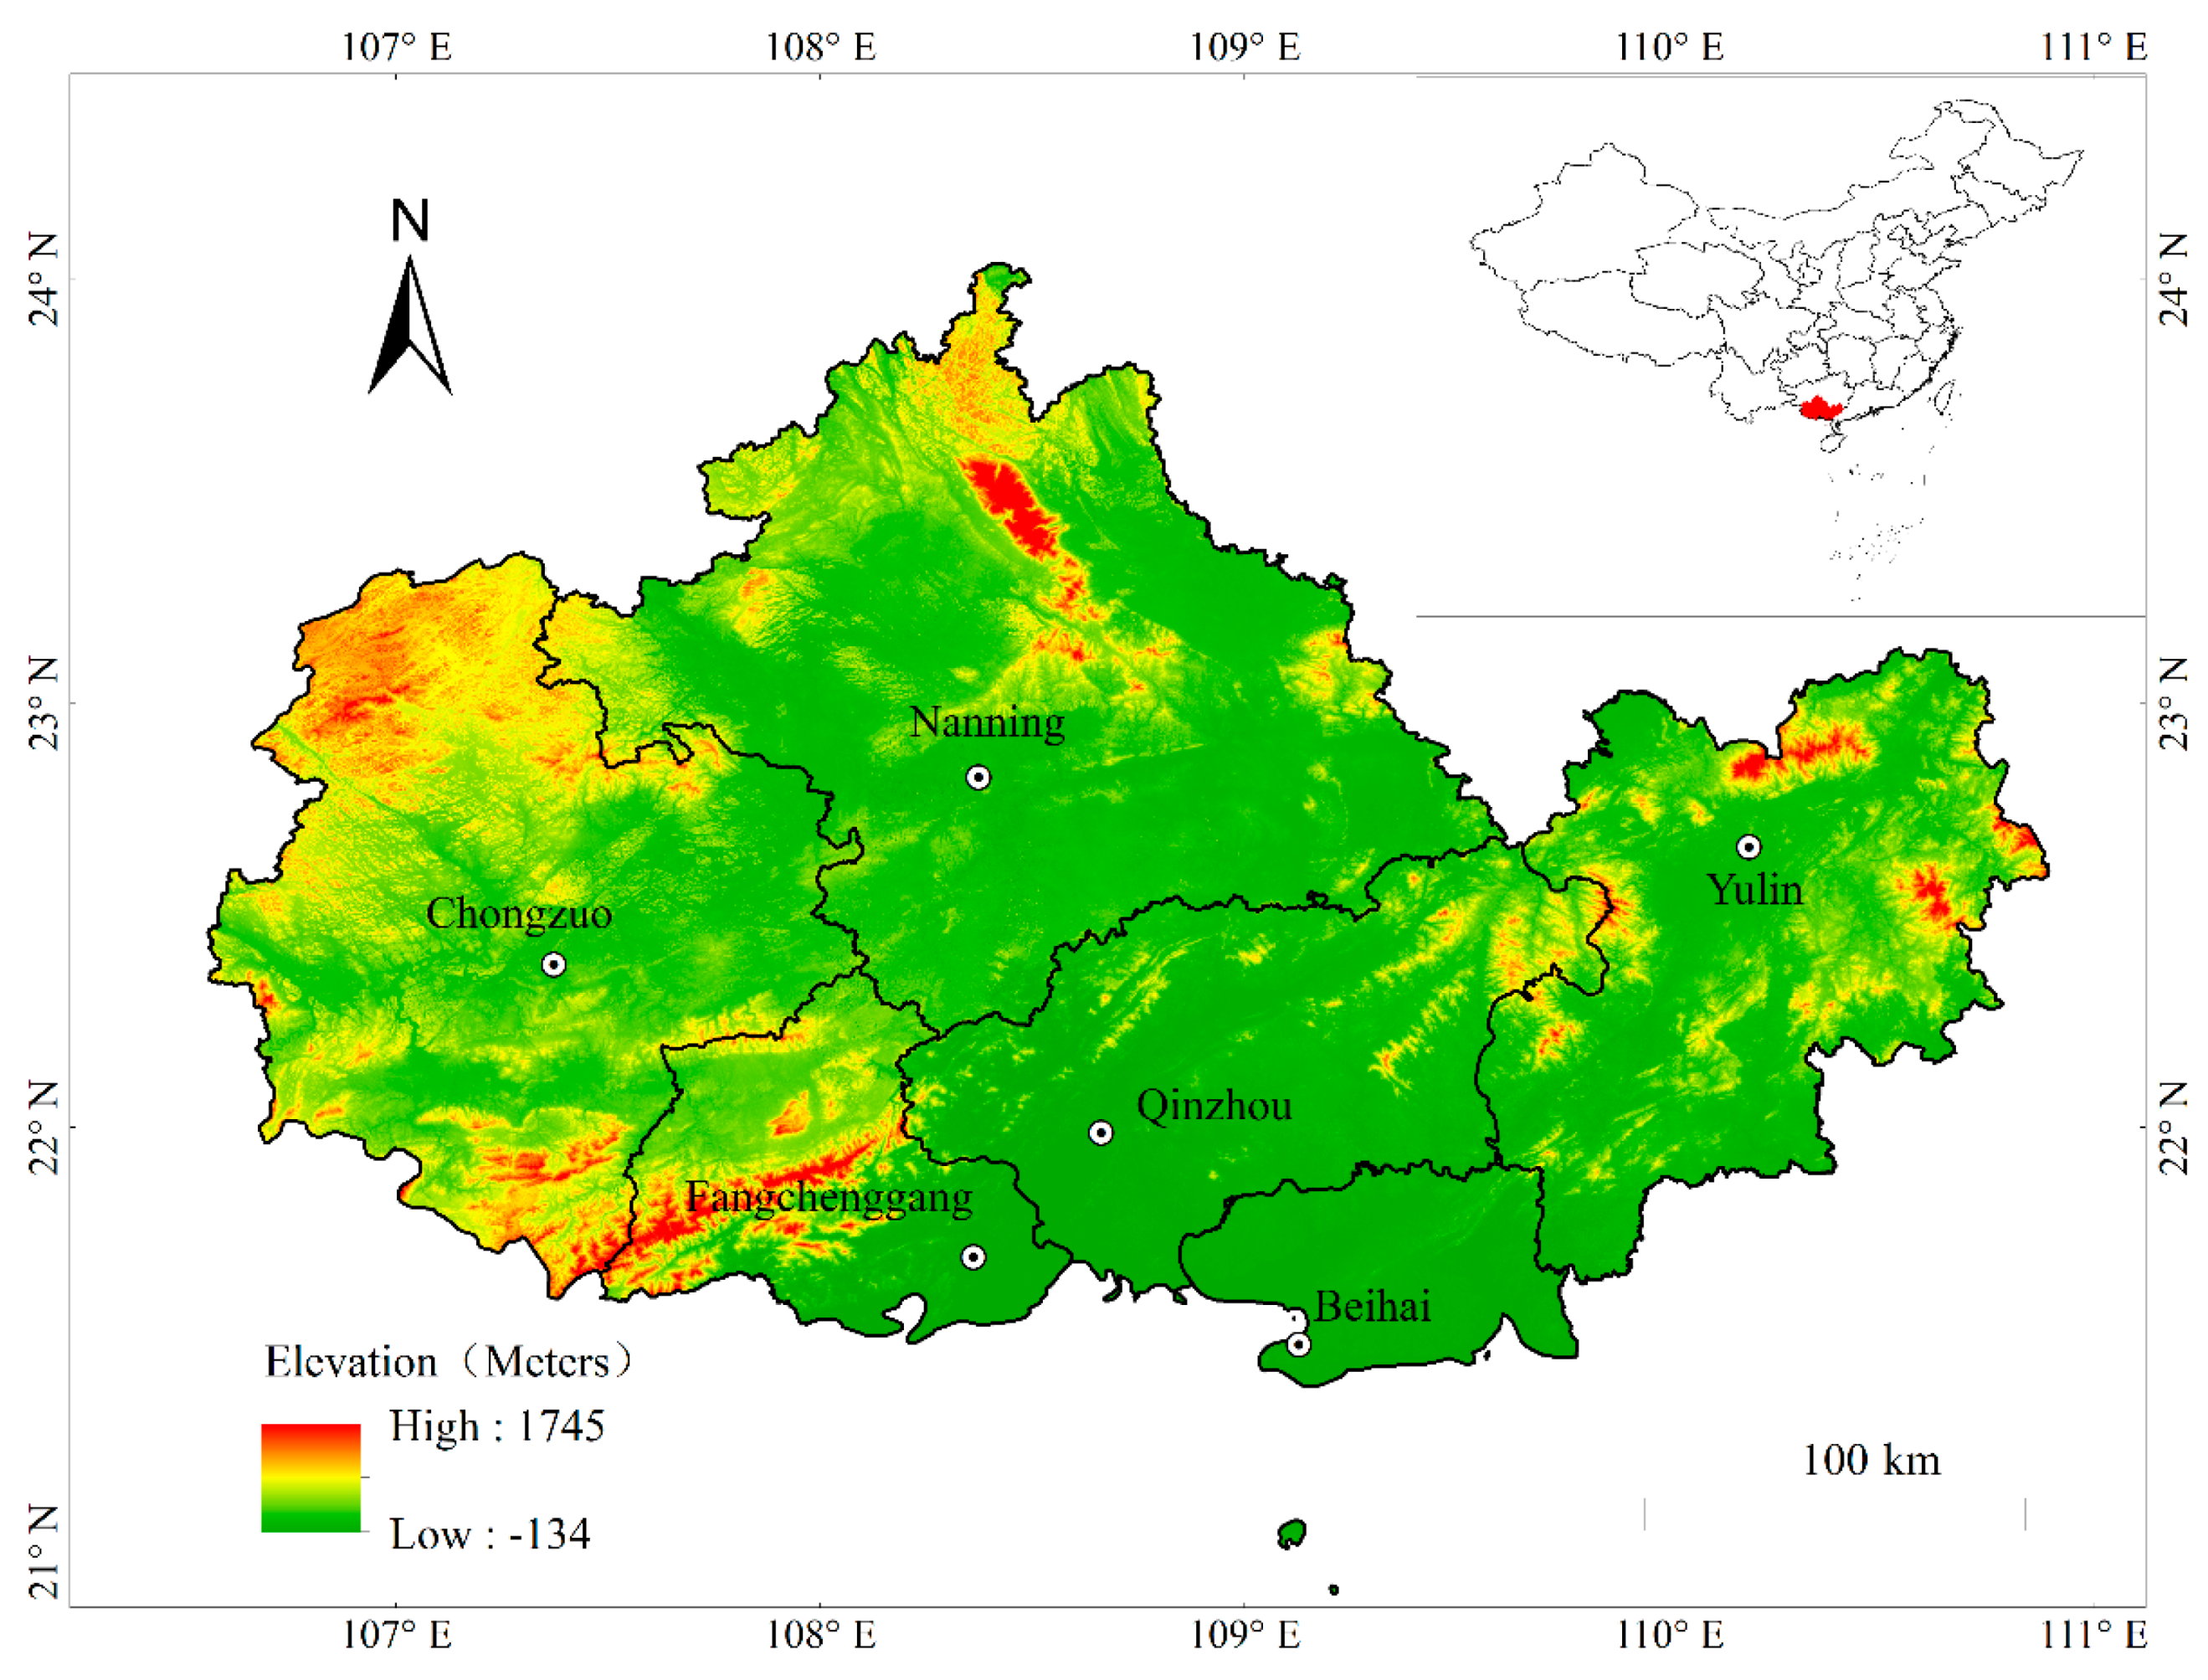
The Beibu Gulf Urban Agglomeration of Guangxi is located between 106°57′—110°87′ E and 21°02′—24°03′ N, serving as a crucial intersection for China’s coastal and border cooperation. It faces the South China Sea, closely connects with Guangdong–Hong Kong–Macao Greater Bay Area, adjacent to Southeast Asia, thus serving as a significant gateway for the 21st Century Maritime Silk Road and the Western Land-Sea New Passage. The urban agglomeration comprises six cities: Nanning, Beihai, Qinzhou, Fangchenggang, Yulin, and Chongzuo, covering a land area of 73,400 km2. Nanning, the capital of Guangxi, serves as the central city of the Beibu Gulf Urban Agglomeration, while the other five cities act as nodal cities, with Fangchenggang, Beihai, and Qinzhou being coastal cities. By the end of 2022, the permanent population was 23.055 million, with a regional GDP of 181.92 billion US dollars, and a total import-export volume of 77.43 billion US dollars, accounting for 45.7%, 49.5%, and 78.4% of Guangxi’s respective figures. The urbanization rate stands at 58.17%, higher than the Guangxi’s average (55.65%) but lower than the national urbanization rate (65.22%). Notably, Nanning has a permanent population of 8.8917 million, with an urbanization rate of 70.36%, whereas Chongzuo has the lowest urbanization rate at only 45%.
Figure 1.
Location of the research area
Figure 1.
Location of the research area
2.2. Data Sources and Processing
Using ArcGIS 10.6, we reclassified and extracted land use data for the Beibu Gulf Urban Agglomeration for 2012, 2017, and 2022 from the GlobalLand30 to reflect the spatiotemporal expansion pattern of the urban agglomeration. Both raster and vector data were sourced from the GlobalLand30 provided by the Resources and Environmental Science Data Platform, China (
www.globallandcover.com). The GlobeLand30 dataset is an important achievement of the Global Land Cover Remote Sensing Mapping and Key Technology Research Project of China’s National High Tech Research and Development Program. The base map data were obtained from the National Geomatics Center of China (
http://www.ngcc.cn/ngcc/). Population, economic, social, and ecological data for each city were derived from the annual
Guangxi Statistical Yearbook and
Guangxi Construction Yearbook. Missing data were supplemented by interpolating using the mean of adjacent year data.
3. Research Methodology
The changes in land use space of urban agglomerations are essential for exploring the developmental patterns of urban agglomerations and determining the crucial foundations for the direction of their development. Relevant studies indicate that the high-quality development of urban agglomerations relies heavily on the highly coordinated dimensions of population, economy, society, and ecology. Specifically, this coordination entails a harmonious relationship between population growth and land expansion, economic development and urban construction, social livelihood and intensive land use, as well as ecological civilization and spatial utilization. (1) Urbanization of Population: Urbanization is prominently characterized by population density, reflecting both the size and concentration of a city’s population, thereby symbolizing its actual and potential scale [
26]; (2) Economic Urbanization: An engine driving urbanization, per capita GDP mirrors the economic benefits brought about by modern production development in cities, signifying the capabilities of urbanization, industrialization, and urban construction levels [
27]; (3) Social Urbanization: Serving as the purpose of urbanization development, indicators such as per capita road mileage reflect the scale of urban transport space and the level of public service construction, representing the degree of urban modernization [
28]; (4) Ecological Urbanization: This aspect provides the spatial carrier and basic resource elements for urbanization development. Guangxi is a typical karst region where land resources are scarce. The per capita arable land area reflects the available agricultural and ecological resources as well as the basic level of food security, indicating the spatial limitations of urban expansion [
29]. Consequently, this study selects urban population density, per capita GDP, per capita road mileage, and per capita arable land area to represent the coordinated factors of population, economy, society, and ecology (
Table 1). After integrating the data, the study calculates the urban expansion intensity index and visualizes spatial representation. It employs the inverse distance weighting interpolation method to investigate the spatial-temporal differentiation patterns of expansion intensity, simulates the trajectory of the transfer of population, economy, society, ecology, and urban expansion centers using the center-of-gravity model, analyzes the disparities in the coordinated development of cities through a synergy model, and ultimately probes the degree of influence of various factors on urban expansion using an collaborative model.
3.1. Spatial Expansion Intensity
Spatial Expansion Intensity refers to the change of urban construction land in a certain period of time, reflecting the drastic degree and rate of change of urban construction land [
2].
where
SEI represents the Spatial Expansion Intensity,
Xb represents the built-up area of the city at the end of the study period,
Xa represents the built-up area of the city at the beginning of the study, and ∆
t represents the time span of the study phase (in years).
3.2. Inverse Distance Weighting
Inverse Distance Weighting (IDW) posits that objects closer together in space tend to possess similar characteristics. The spatial expansion of each observed city is subject to local influence, which diminishes as distance increases. IDW serves to attenuate the mutual impact of spatial expansion variations among cities, thereby accurately predicting the spatial expansion outcomes around the centers of observed cities in the Beibu Gulf Urban Agglomeration based on observational data [
30].
where
Z represents the interpolated value at a point,
Zi represents the attribute value of the
i-th sample,
p represents the power of distance, and
di represents the Euclidean distance between the interpolation point and observation point. The inverse distance weighting interpolation method is implemented through the ArcGIS spatial analysis tool. By selecting the calculation field, the power value is set to 2[
31].
3.3. Center-of-Gravity Model
Center-of-gravity model is an important analytical tool for studying the spatial dynamics of factors in the development process of a region. The objective movement of the factor’s center of gravity objectively reflects the spatial agglomeration and displacement patterns of various elements during the observation period, making it a commonly used analytical model in geography [
32,
33]. Using ArcGIS, we calculated the trajectory of the population, economy, society, ecology, and urban spatial center of gravity shifts and their transfer distances within the Beibu Gulf Urban Agglomeration for the years 2012, 2017, and 2022. The method used to calculate the spatial center of gravity is as follows:
where
Xt and
Yt represent the longitude and latitude coordinates of the gravity center of certain spatial dimension in year
t, respectively. Meanwhile,
Xi and
Yi represents the longitude and latitude coordinates of the gravity center of the
i-th patch in this dimension, where
Sti represents the area of the
i-th patch in this dimension. The calculation method for gravity center offset is as follows:
where
Dmn represents the displacement of the gravity center from year
m to year
n;
C is the coefficient for converting longitude and latitude to planar distance, with a value of 111.111 km;
(Xm,
Ym) and (
Xn,
Yn) represents the gravity center coordinates in years
m and
n.
3.4. Synergy Index
The vital manifestation of high-quality urbanization is the enhancement of land intensification in urban construction. Consequently, a synergistic index is employed to delineate the disparities among the expansion intensity of population, economy, society, ecology and cities in the process of urbanization development [
2].
where
SIijt represents the synergy index of the
i-th factor in the
j-th city.
X and
SEI represent the expansion intensity of population, economy, society, ecology and cities in time
t. Based on this, the synergies of urban spatial expansion can be divided into three categories: (1) contraction type (
SI < 1); (2) synergy type (
SI = 1); (3) expansion type (
SI > 1). A larger
SI value indicates a more significant spillover effect of urban expansion [
6].
3.5. Geodetector
The Geodetector is primarily used to analyze the spatial differentiation characteristics and regularities of geographic features or phenomena, reflecting the spatial dependence and heterogeneity of geographic elements and phenomena as scales vary. It is a novel statistical method for detecting spatial differentiation and revealing its underlying driving factors [
34]. This method can be employed to measure spatial differentiation, detect explanatory factors, and analyze the interrelationships between variables [
35]. The Geodetector as a new powerful tools for driving force and factor analysis, have been fully validated in fields such as land use, regional economy, and ecological environment. The calculation formula is as follows:
where
i represents the number of categories for the independent variable
Y or the dependent variable
X;
Ni and
σi represent the number of spatial units and the variance within category
i, respectively;
N and
σ represents the total number of units and the overall variance of the study object; 0 ≤
q ≤ 1, where a larger
q value indicates a more consistent spatial distribution between the two variables, thus implying a stronger explanatory power of
X for
Y.
4. Research Results and Analyses
4.1. Characteristics of Temporal Changes in Urban Sprawl
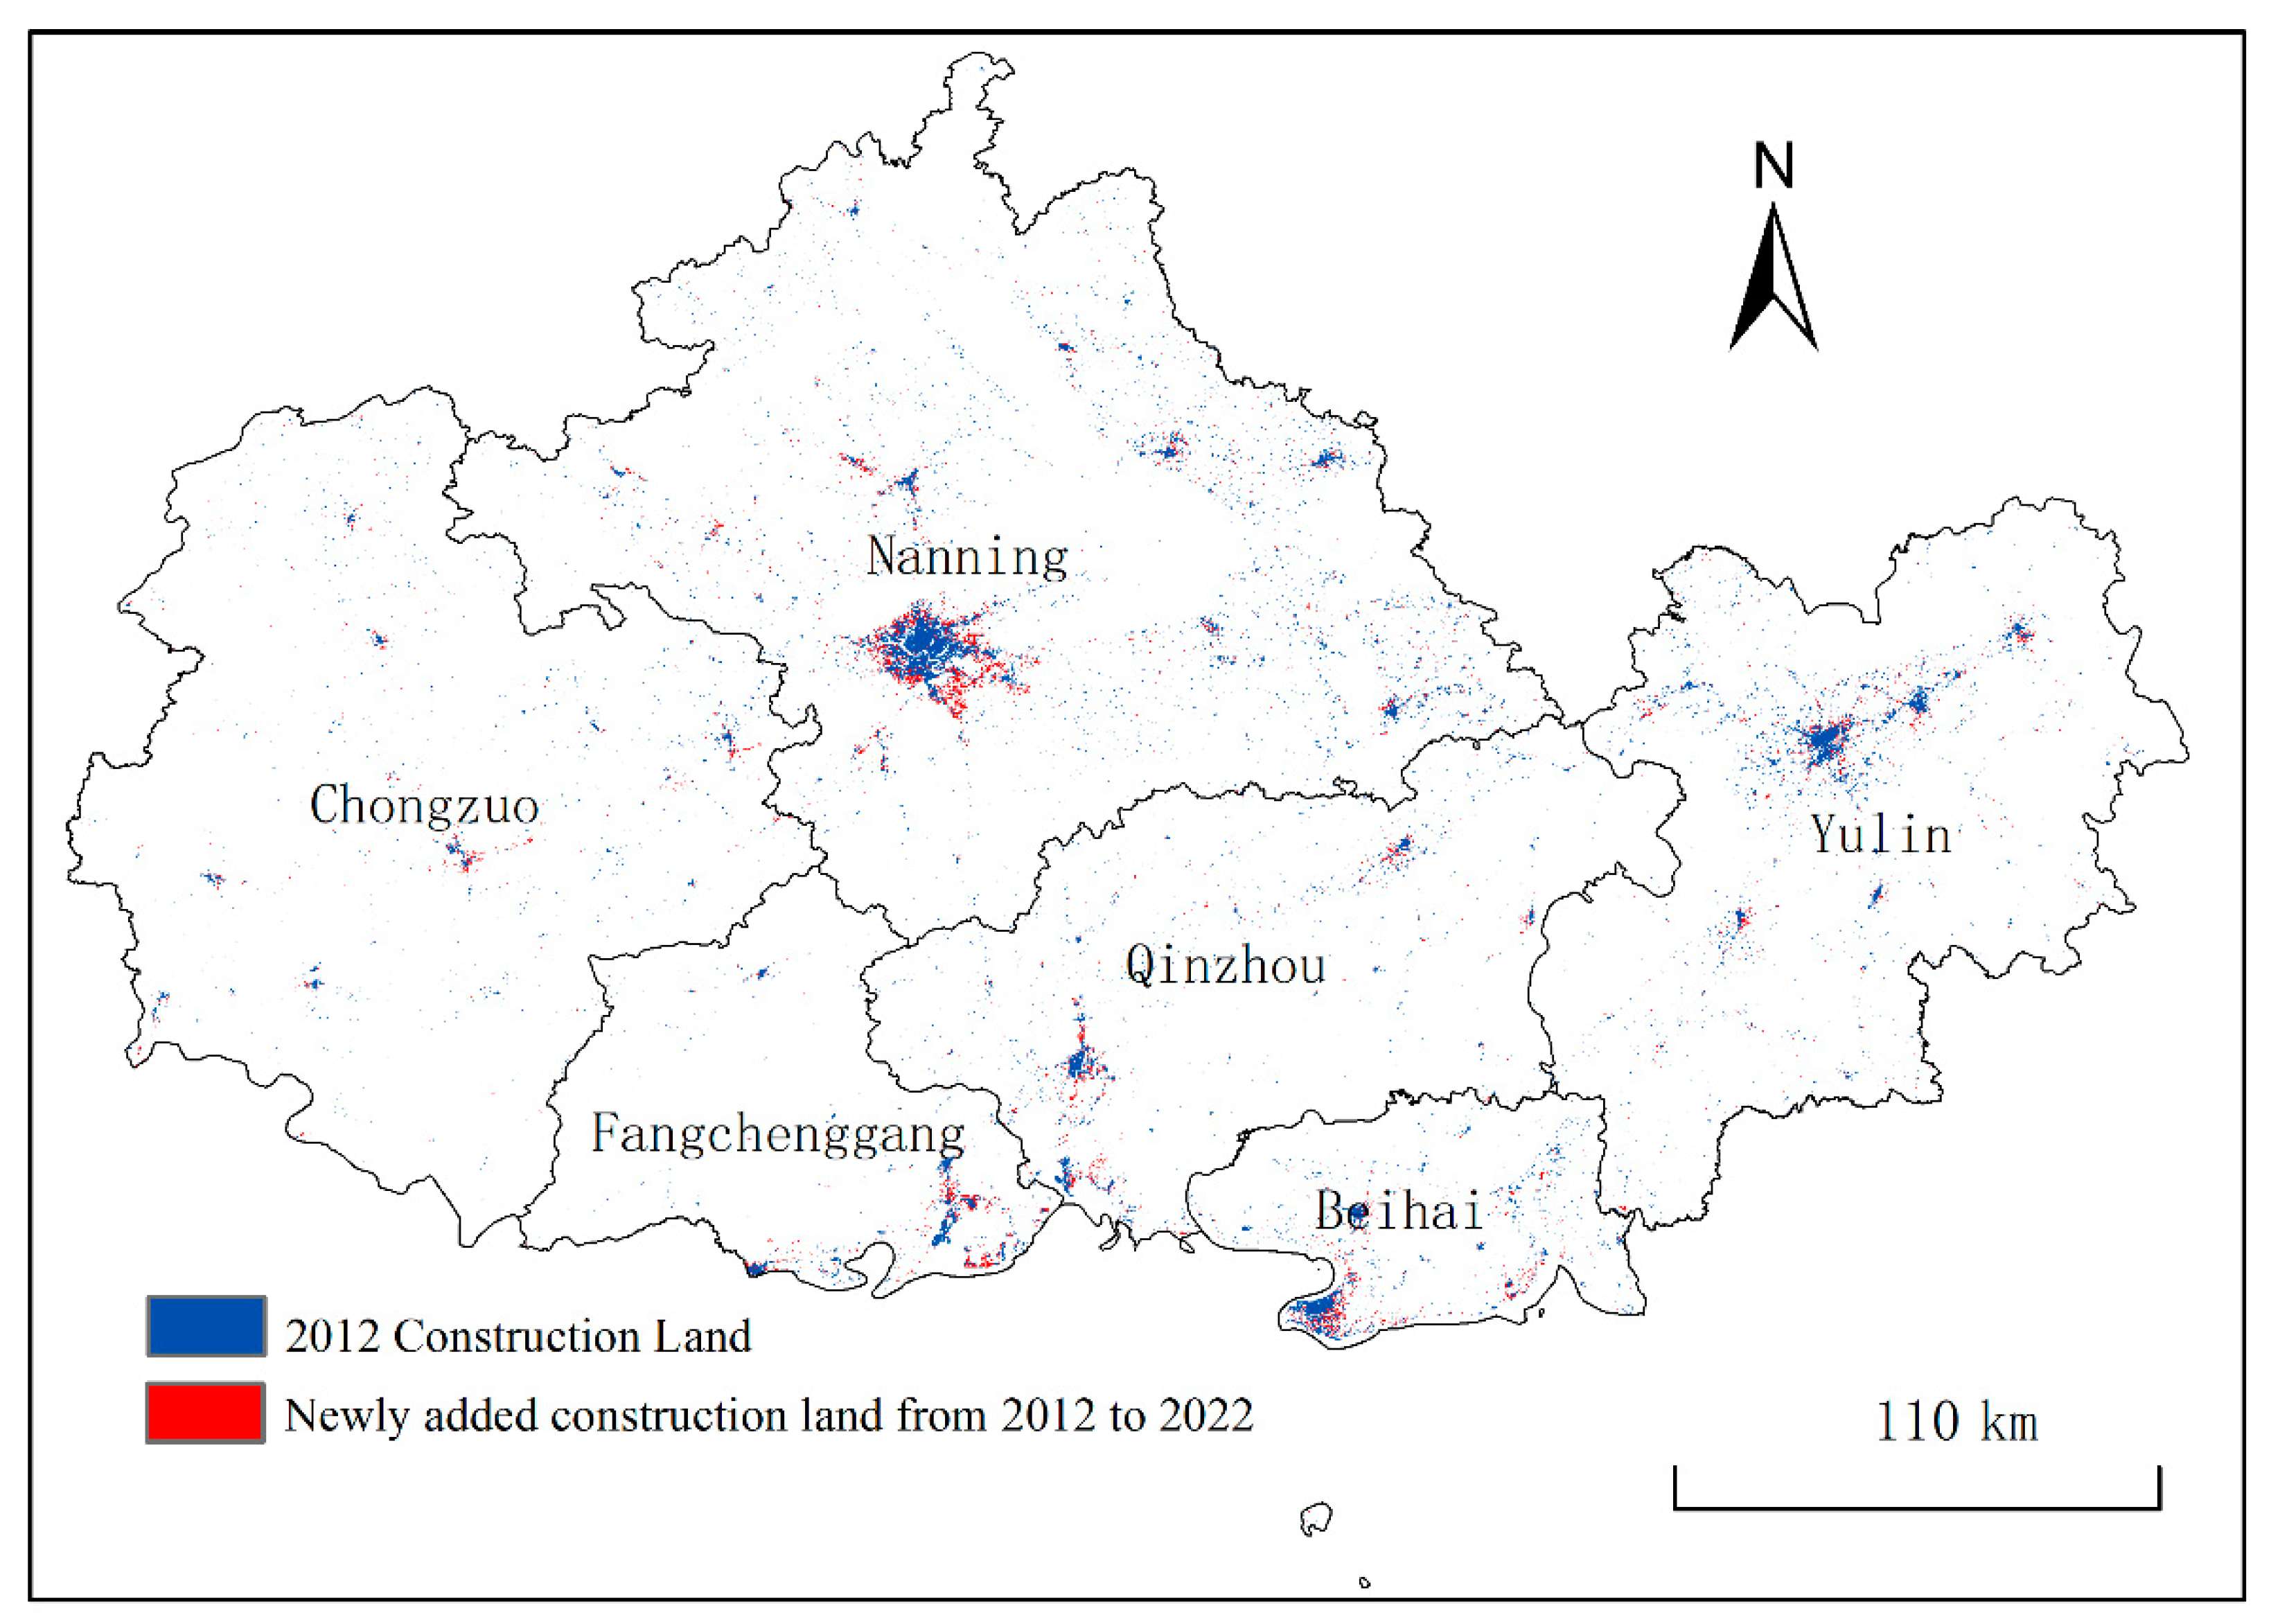
The distribution and expansion of construction land in the Beibu Gulf Urban Agglomeration from 2012 to 2022 are illustrated in
Figure 2. Over this period, the cumulative increase in urban construction land area reached 375.01 km
2, with an average annual growth rate of 13.69%. Notably, Nanning witnessed the largest increment, reaching 162.05 km
2, representing 43.20% of the total increase, while Yulin followed with an increment of 59.78 km
2, constituting 15.94% of the total increase. When examining the specific time frames: (1) From 2012 to 2017, the urban construction land area in the Beibu Gulf Urban Agglomeration expanded by 230.49 km
2, with Nanning experiencing the most significant growth by adding 104.69 km
2, accounting for 45.42% of the total increase. Conversely, Chongzuo saw the smallest increment of only 15.60 km
2, representing 6.77% of the total increase. (2) From 2017 to 2022, the urban construction land area in the Beibu Gulf Urban Agglomeration increased by a total of 144.52 km
2, with Nanning once again leading in incremental growth at 57.36 km
2, while Fangchenggang showed the smallest increment at 14.64 km
2.Overall, over the past decade, the urban construction land area in the Beibu Gulf Urban Agglomeration has shown a general increasing trend, yet with a gradually slowing growth rate. The growth speed and intensity were higher in the first five years than in the latter five years, with the central cities growing faster than the peripheral nodal cities. Notably, the expansion of the capital city, Nanning, is the most significant, accounting for approximately 50% of the total increment, followed by Yulin.
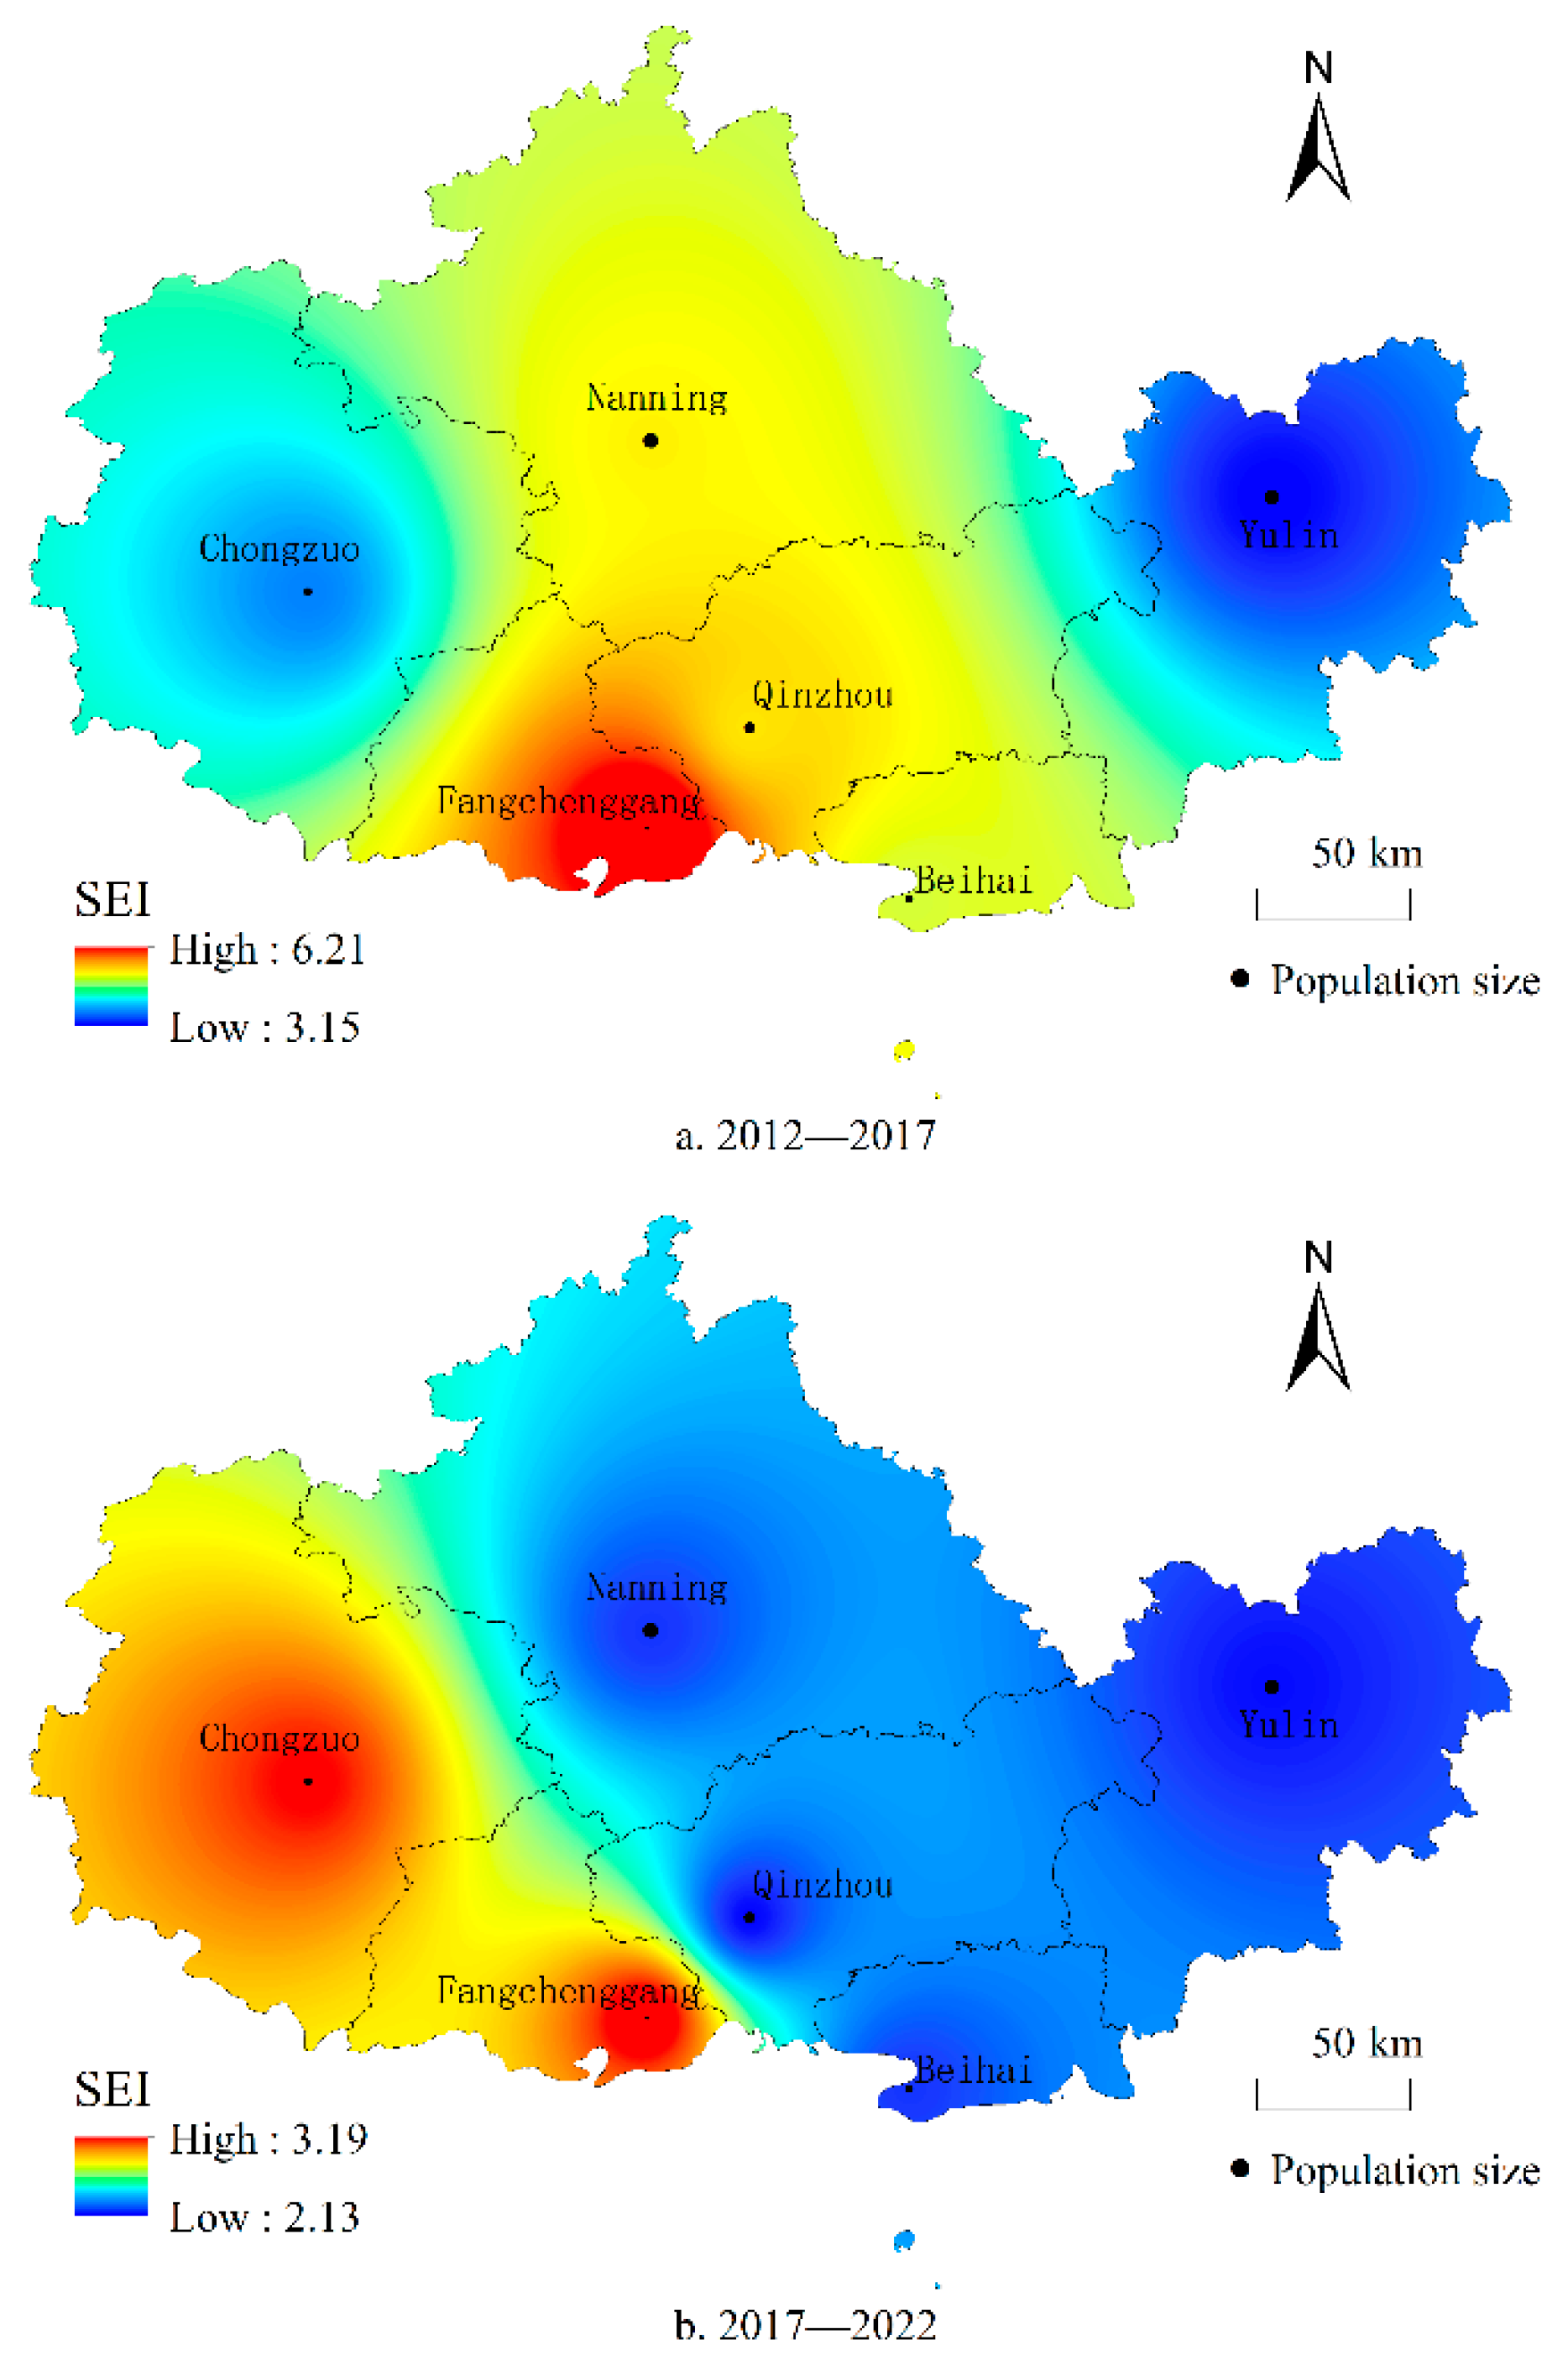
In accordance with Formula (1), the
SEI values of six cities within the Beibu Gulf Urban Agglomeration were calculated. Subsequently, utilizing Formula (2), the intensity of urban expansion was interpolated inversely to produce
Figure 3. From 2012 to 2017, the average
SEI across the Beibu Gulf Urban Agglomeration stood at 4.62%. Notably, Fangchenggang (6.21%), Qinzhou (5.03%), Nanning (4.97%), and Beihai (4.73%) exhibited
SEI values surpassing the average, while Chongzuo and Yulin fell below this mean. Within this period, Fangchenggang constituted a high-value center, with Qinzhou and Nanning forming secondary high-value centers, and Chongzuo and Yulin representing low-value centers. Moving on to the years 2017 to 2022, the average
SEI decreased to 2.49%, marking a substantial decline of 46.10% from the 2012-2017 period. Remarkably, only Fangchenggang (3.19%) and Chongzuo (3.12%) surpassed the average, giving rise to significant high-value centers, while other cities generally displayed low values. The research indicates that over the past decade, the spatial expansion intensity of the central city, Nanning, has weakened in comparison to surrounding cities. High-value centers have shifted from the central city, Nanning, towards peripheral nodal cities, gradually covering the central city, while the spatial expansion intensity of peripheral nodal cities has overtaken that of the central city. The aggregation pattern of land expansion space has waned, leading to a gradual reduction in the polarization effect within the Beibu Gulf Urban Agglomeration. Thus, disparities in spatial expansion among cities have progressively diminished. Consequently, the development dynamics of urban expansion intensity within the Beibu Gulf Urban Agglomeration have transitioned from single-center dominance to dual-center leadership, symbolizing a shift from the "south high, north low" pattern to a "west high, east low" developmental trend.
4.2. Centre of Gravity Offset Analysis
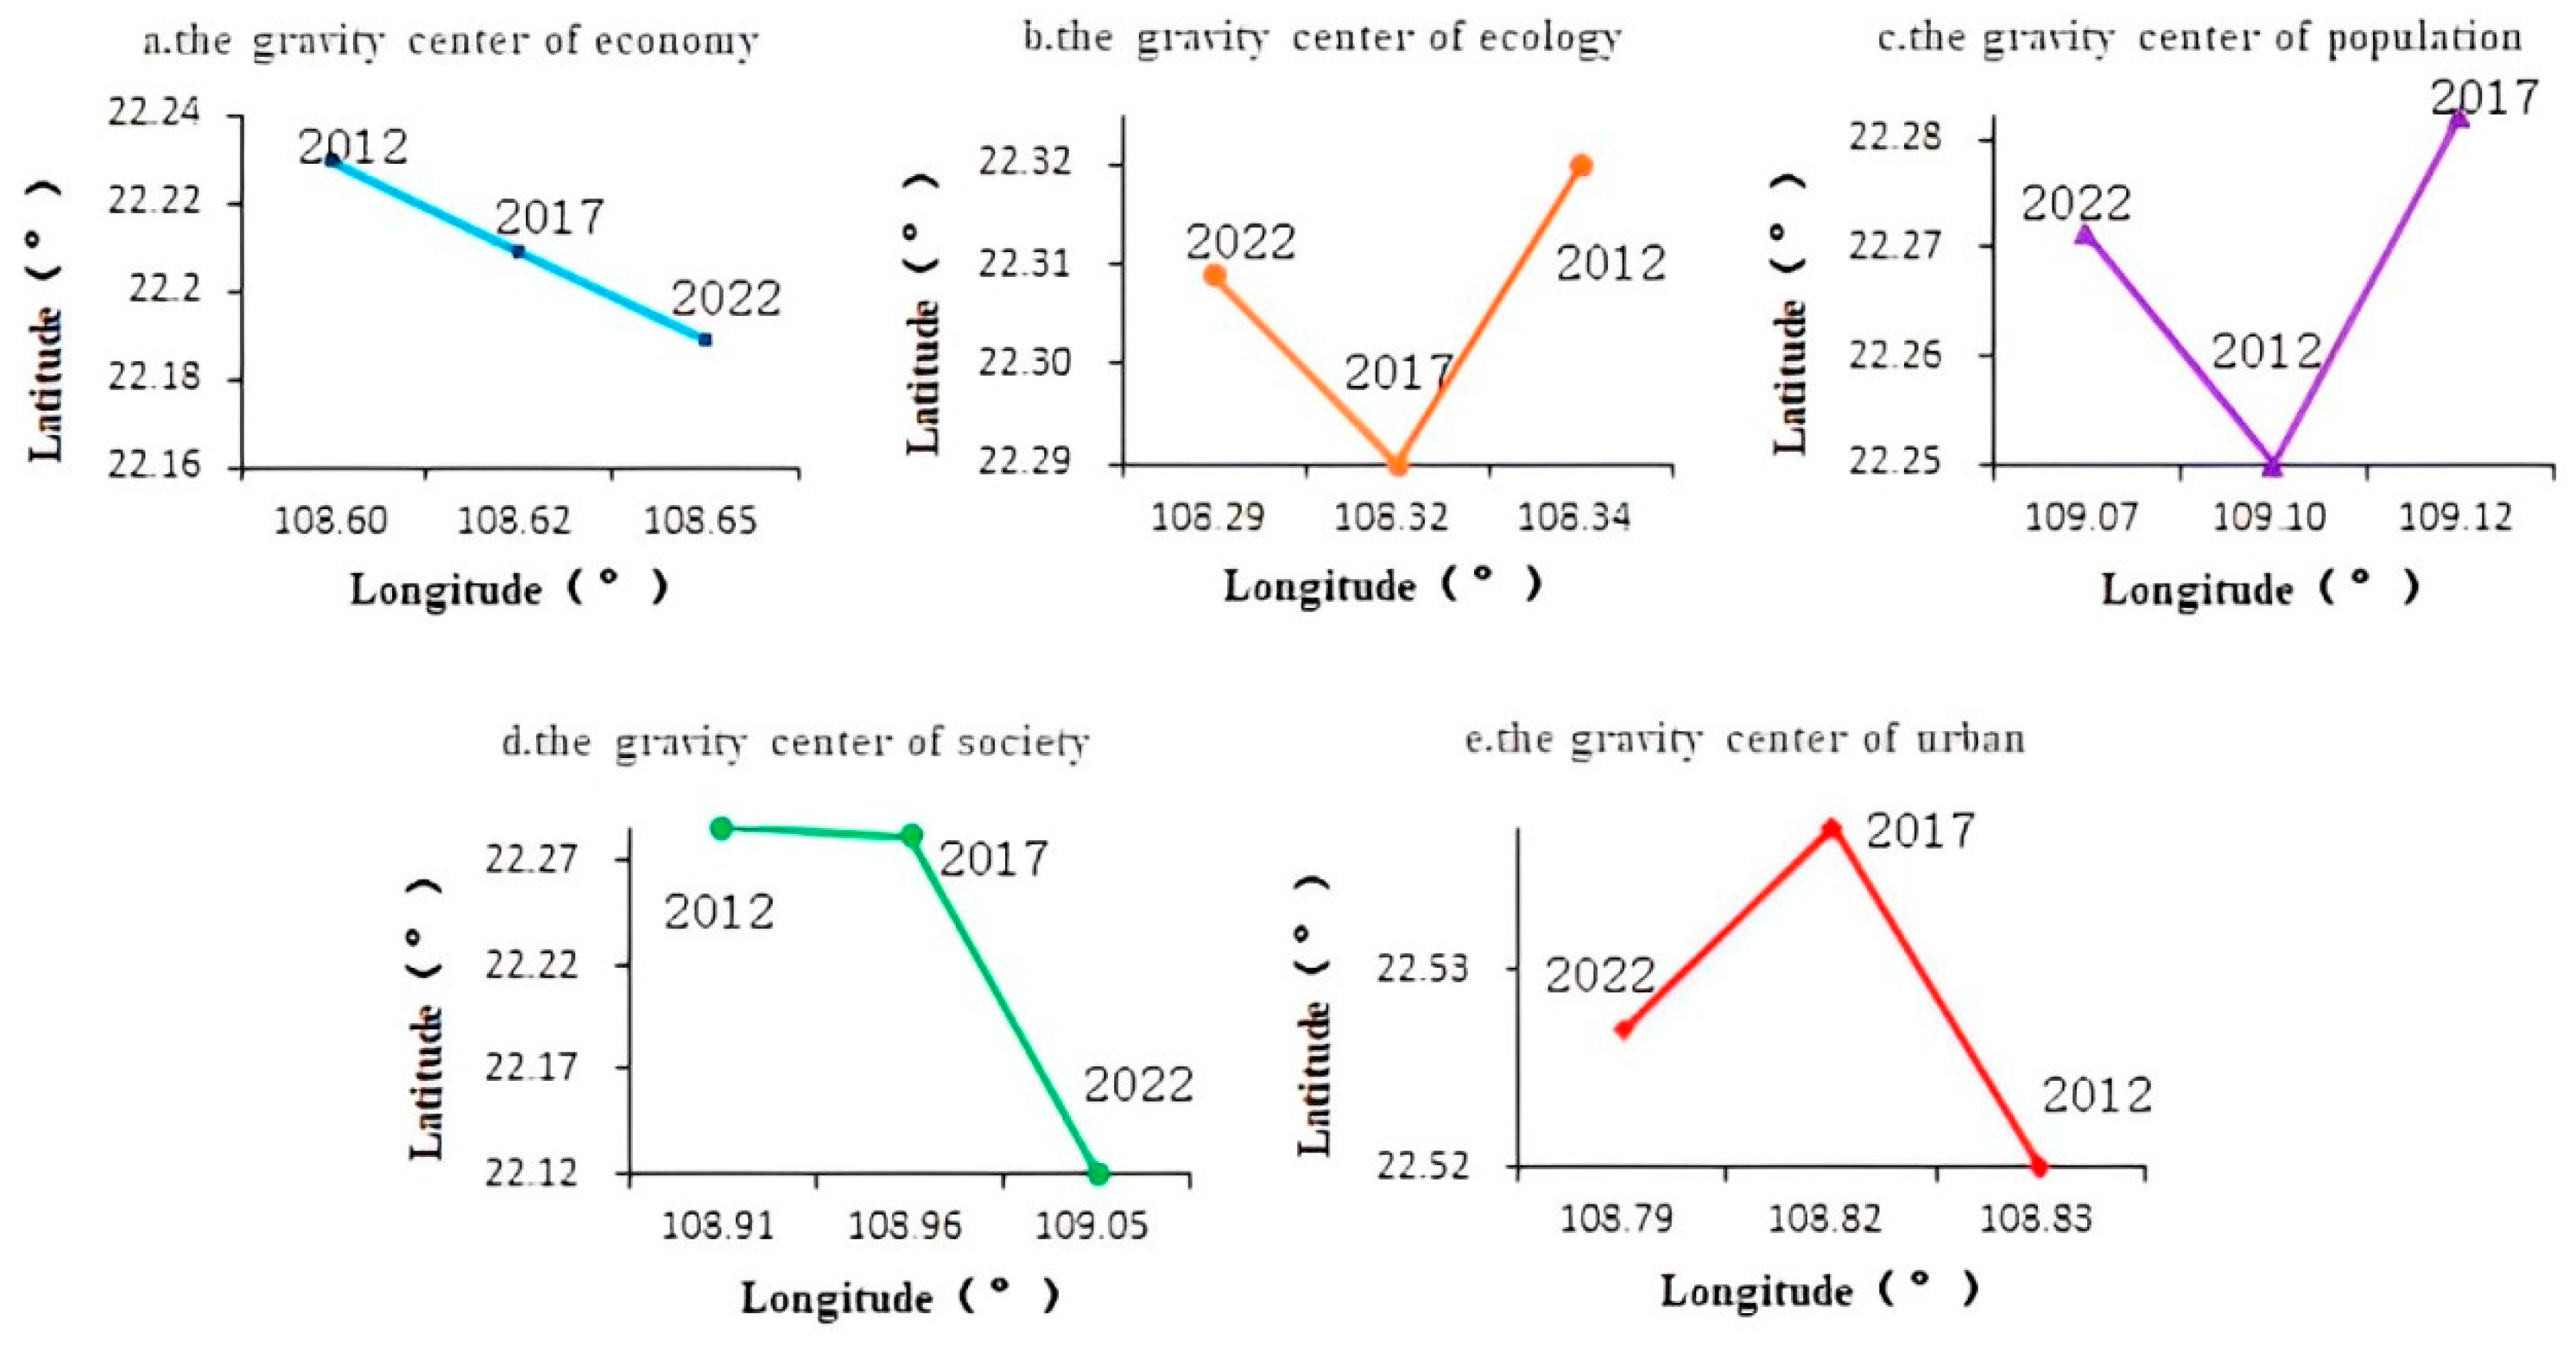
Based on the centers of population, economy, society, ecology and cities of the Beibu Gulf Urban Agglomeration in 2012, 2017, and 2022, the displacement graphs for their centers of gravity were respectively plotted (
Figure 4). Overall, the magnitude of displacement of the center of gravity within the Beibu Gulf Urban Agglomeration from large to small is categorized as society, economy, ecology, cities and population. Due to the relatively rapid socio-economic development, the changes in social and economic displacements are considerable, while ecological, urban, and population displacements remain relatively stable. In terms of gravity centers, from 2012 to 2022, the population, social, and economic gravity centers have all been located in Qinzhou. This indicates that over the past decade, Qinzhou has maintained a significant scale and potential in areas such as population attraction, accelerated economic development, and social progress. As a coastal city, Qinzhou serves as a vital port linking the ASEAN and the international market. Its participation in the construction of "port-industry-city" integration shows vast production and living space capacities. Both the urban center and ecological center are situated in Nanning, signifying that the central city continues to undertake the core task of regional urbanization. The maintenance of the ecological center also demonstrates that Nanning’s status as "China’s Green City" has been further reinforced balancing ecological preservation while promoting urban development. From the gravity center displacement, from 2012 to 2022, there is a tendency for the economic and social gravity centers to shift towards the east and south, contrary to the direction of urban gravity center displacement. This is closely related to regional policies such as the establishment of the Guidong Industrial Transfer Demonstration Zone in 2010, and the comprehensive integration with the Guangdong-Hong Kong-Macao Greater Bay Area in 2019, which have driven rapid economic and social development in the southeastern cities. The economic and social development benefits of cities in the southeast of the Beibu Gulf are significant, but based on the 2012-2022 Urban Expansion IDW interpolation, the trend of urban expansion is tending to converge. The general direction of population gravity center and ecological gravity center displacement is roughly consistent with that of the urban gravity center. The change in population size will inevitably cause changes in the speed of urban expansion. The trend of the displacement of the pivotal point of regional population balance, consistent with the trend of urban gravity center change, indicates that population changes influence the development and construction direction of cities. The trend of ecological gravity center displacement and the direction of urban construction center indicate that the awareness of ecological protection and the concept of ecological continue to take root in people’s minds.
4.3. Analysis of Spatial Expansion Synergies
4.3.1. Population-Land Synergy
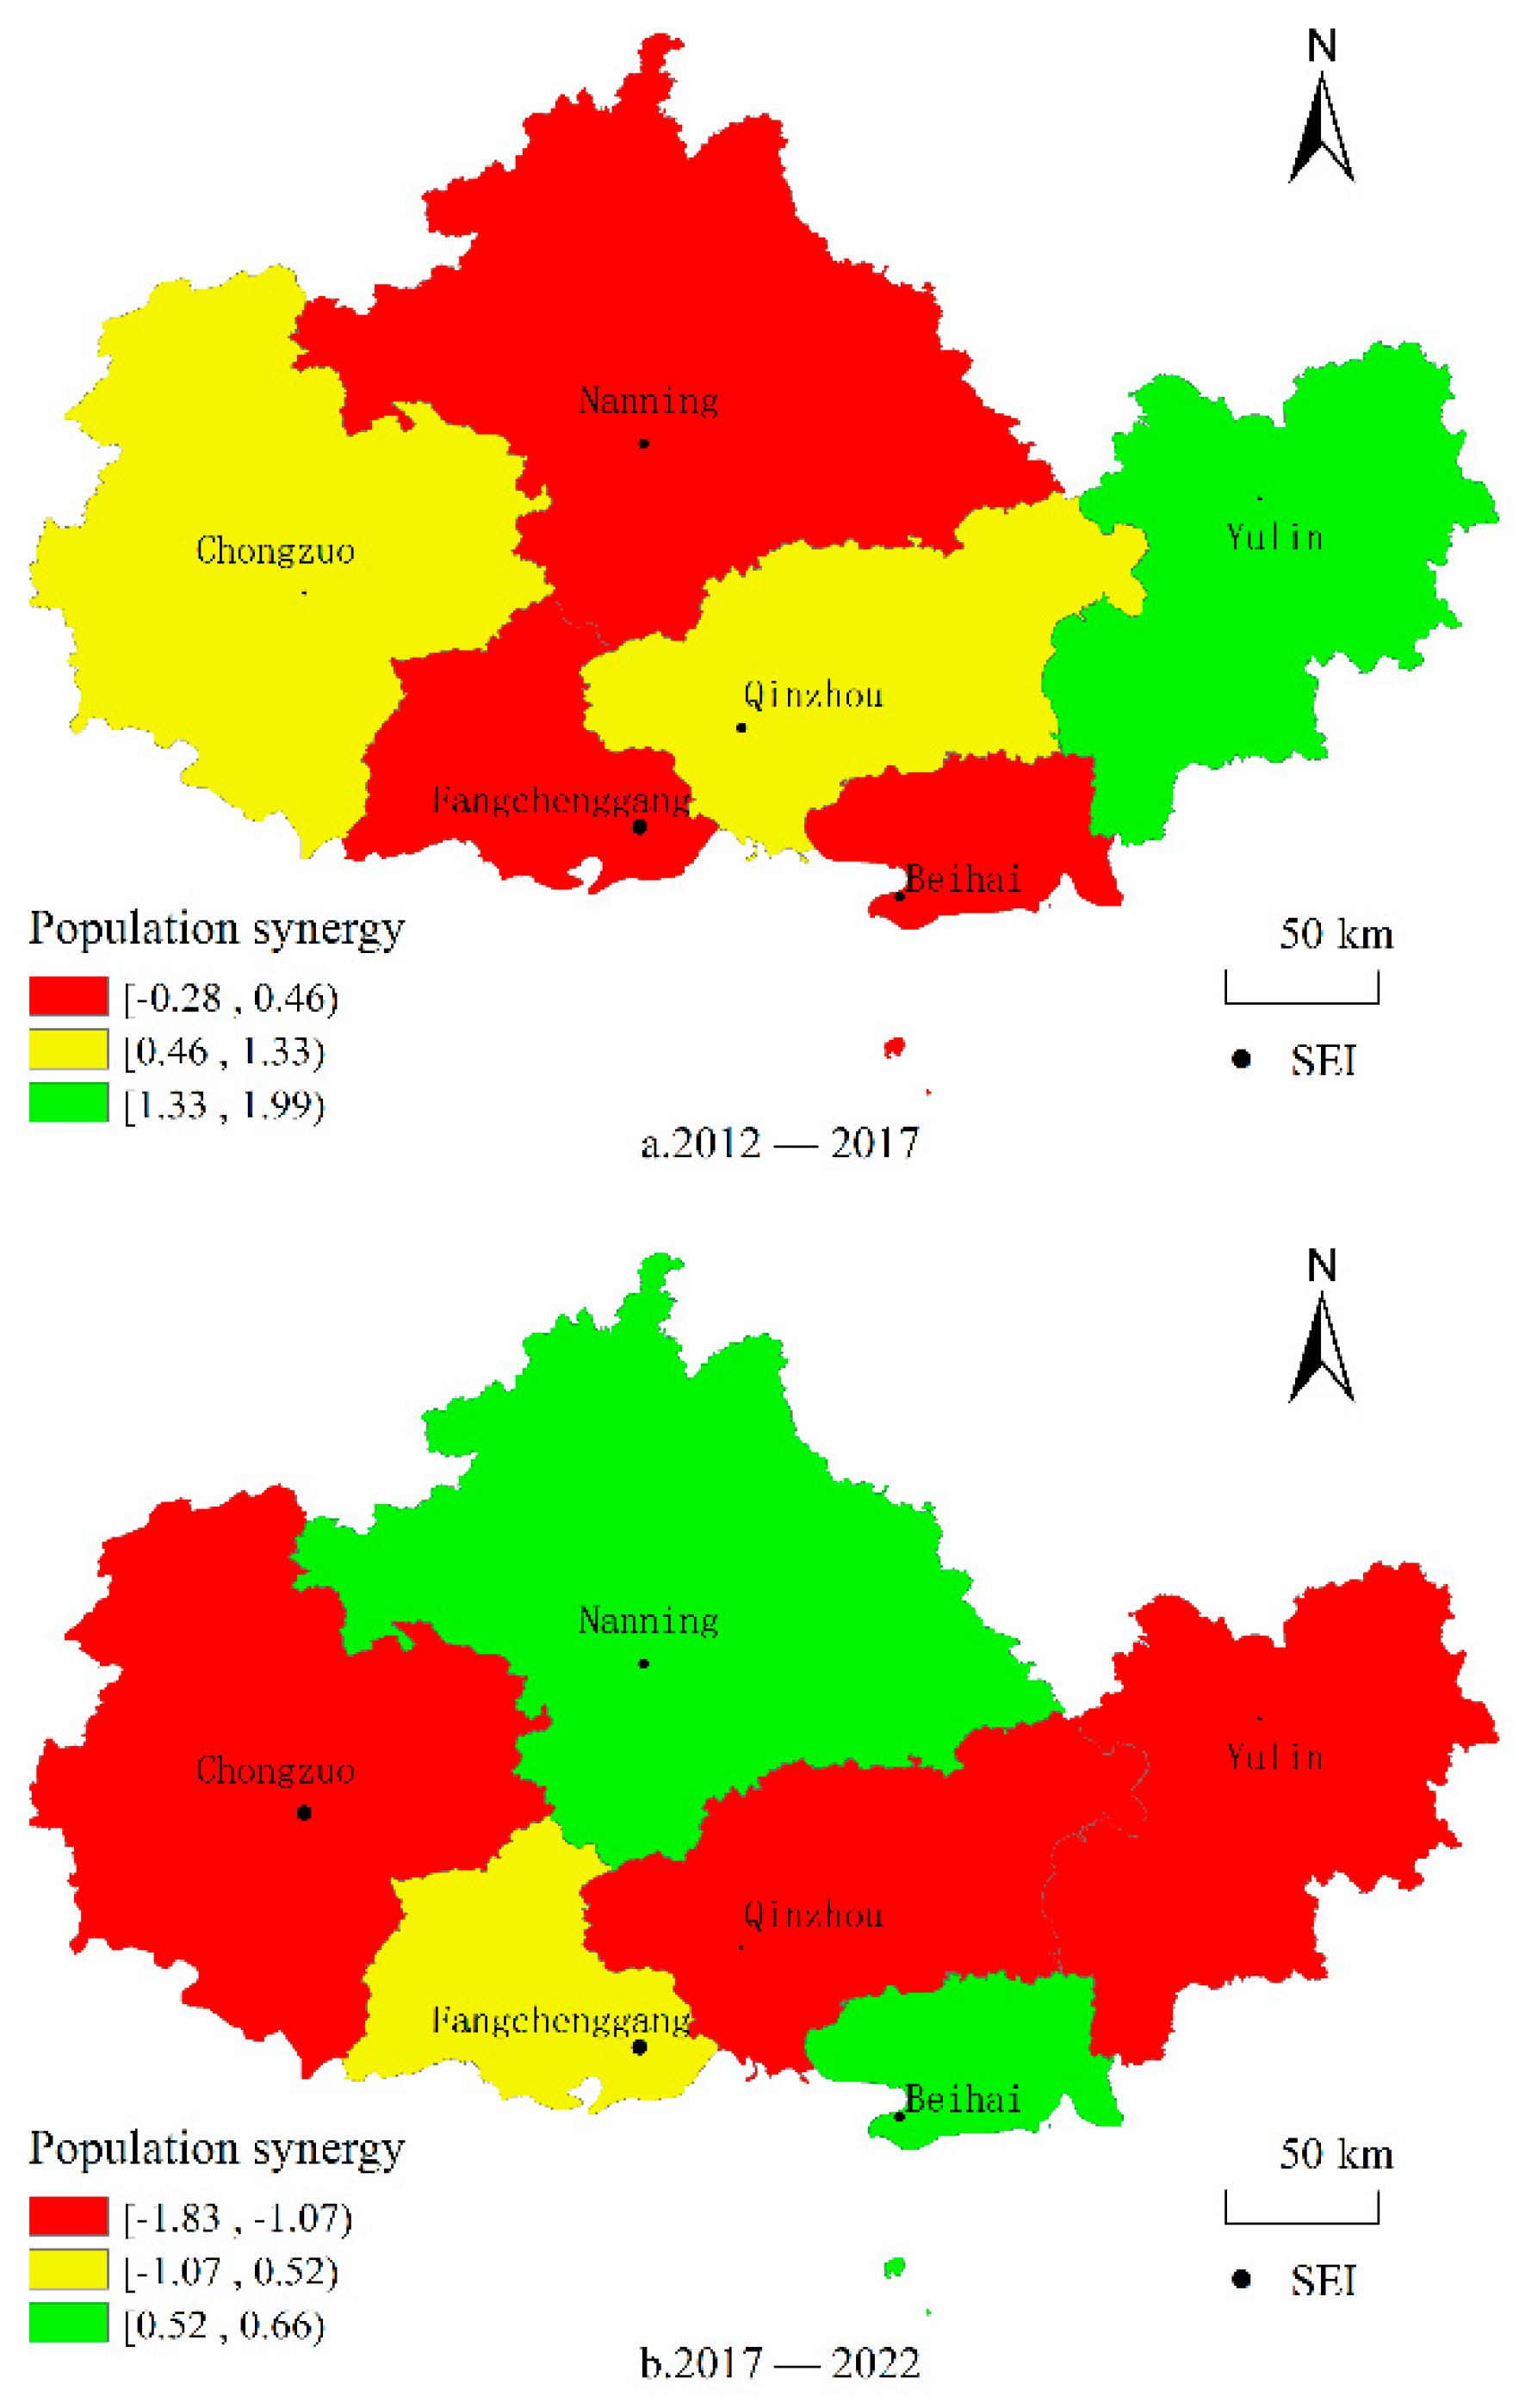
From 2012 to 2017, the average value of the Population Coordination Index (SI) was 0.95. Yulin (1.89), Chongzuo (1.32), and Qinzhou (1.23) all exceeded 1, indicating that the population growth intensity was higher than the urban expansion intensity, and there was a high degree of population concentration in these cities. Beihai (0.49), Fangchenggang (0.33), Nanning (0.46), and Yulin (0.95) had SI values less than 1, indicating that the urban expansion intensity was far greater than the population growth rate. The efficiency of urbanization and population concentration was relatively low in these cities, while the spatial differences in population coordination were small. From 2017 to 2022, the SI values were all less than 1, showing a downward trend compared with 2012-2017. Specifically, Yulin (-0.48), Chongzuo (-1.07), Qinzhou (-1.83), and Nanning (-1.80) had negative SI values, indicating that after experiencing rapid population agglomeration in the previous period, the trend of urban population growth has slowed down. The spillover effect of population urbanization has decreased, and the interannual fluctuations in urban population have become larger. In the past decade, there has been a significant difference between the population growth and spatial expansion intensity of the Beibu Gulf urban agglomeration. The spatial differences in population coordination among cities are apparent. The urban population density and carrying capacity have tended to decline, and the driving force of population concentration in the central city is insufficient, leading to slower development in peripheral node cities. Therefore, it is necessary to continuously enhance the attractiveness of the central city’s population and strengthen its radiating effect.
Figure 5.
Population-land synergy spatio-temporal differentiation
Figure 5.
Population-land synergy spatio-temporal differentiation
4.3.2. Economic-Land Synergies
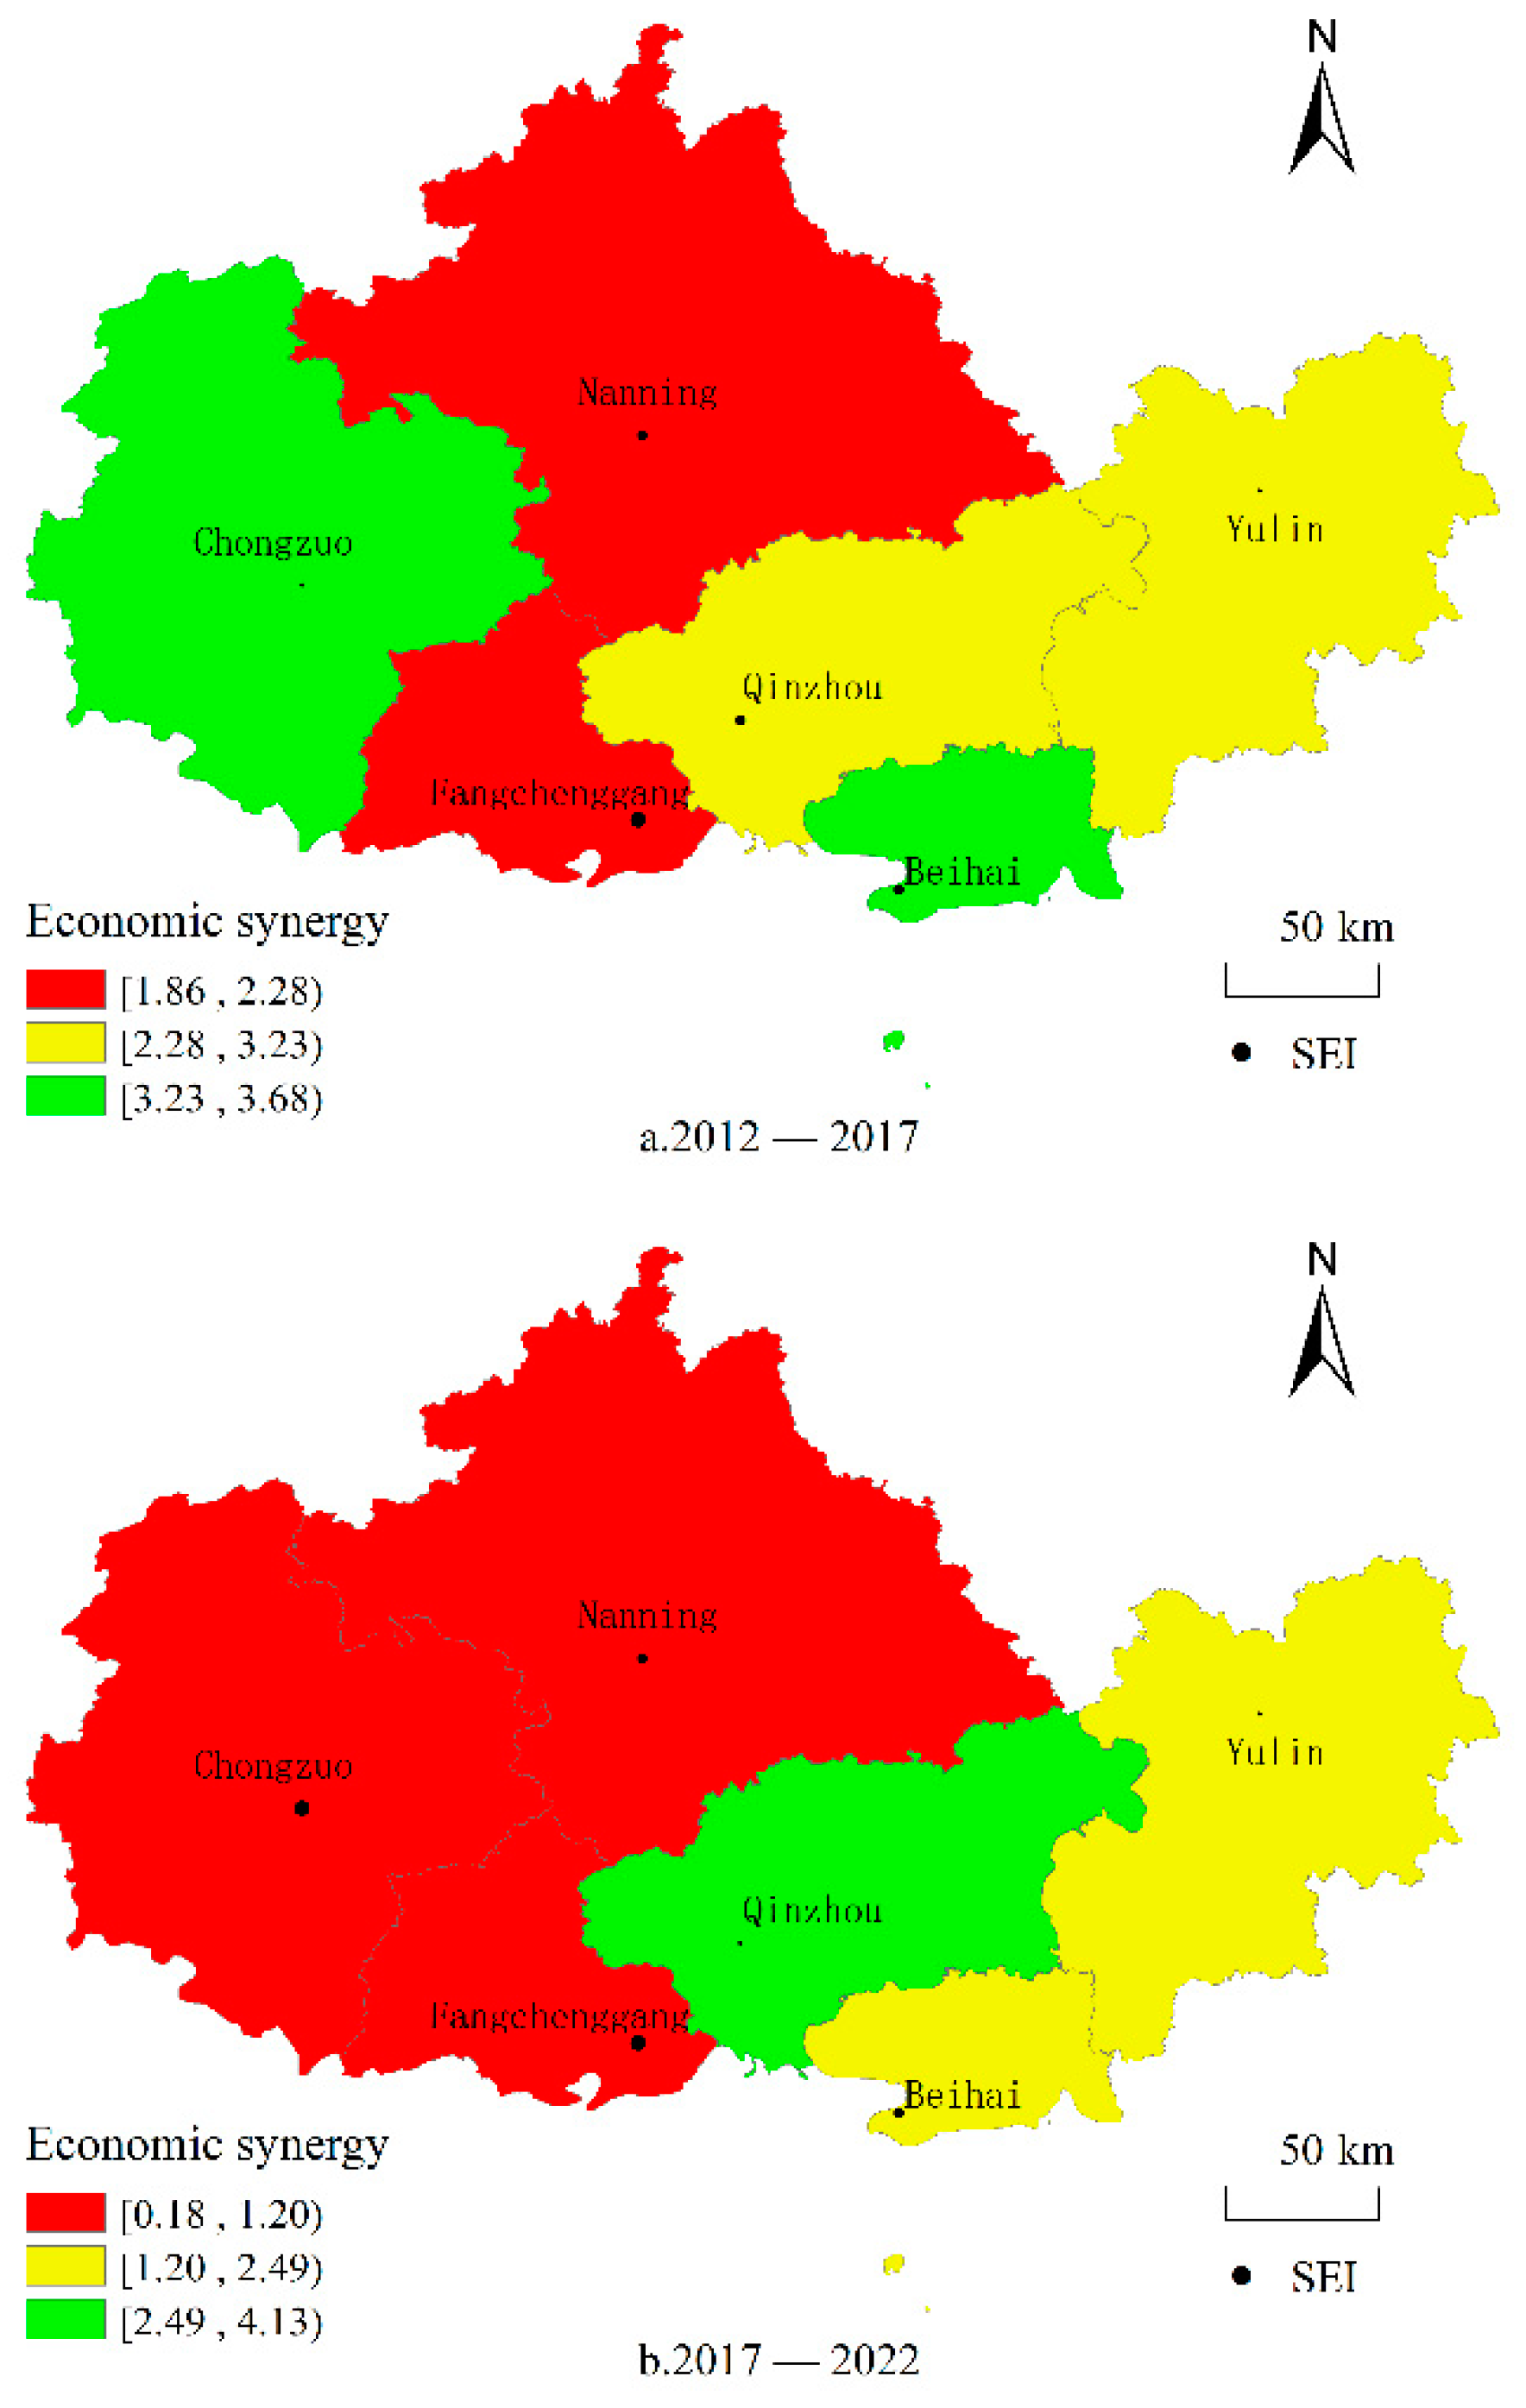
From 2012 to 2017, the average Economic Coordination Index (SI) of the Beibu Gulf Urban Agglomeration was 2.83. Nanning (2.61) and Fangchenggang (1.93) did not reach the average level. From 2017 to 2022, the average Economic Coordination Index rose to 4.89, showing a considerable increase compared to the period from 2012 to 2017. Beihai (5.51), Qinzhou (7.09), and Yulin (5.29) surpassed the average. Over the past decade, the SI values of the Beibu Gulf Urban Agglomeration have consistently been greater than 1, indicating that economic growth has outpaced urban expansion during the process of urbanization. The economic strength of cities has continued to grow, accompanied by ongoing urban development. The significant economic benefits of urbanization have led to a reduction in spatial differences in economic coordination. Overall, the economic benefits of urban expansion have shown a positive trend. Thus, the economic benefits of urbanization in central cities are relatively limited, and the economic coordination capacity of central cities is weakening. Conversely, coastal cities have experienced a continuous strengthening of the economic benefits of urbanization. During the ongoing stage of urbanization, it is vital to continually enhance the "siphon effect" of central cities, leverage the connectivity role of nodal cities, aggregate high-quality resources, and continuously expand the driving force of central cities.
Figure 6.
Economic-land synergy spatial and temporal differentiation
Figure 6.
Economic-land synergy spatial and temporal differentiation
4.3.3. Socio-Land Synergies
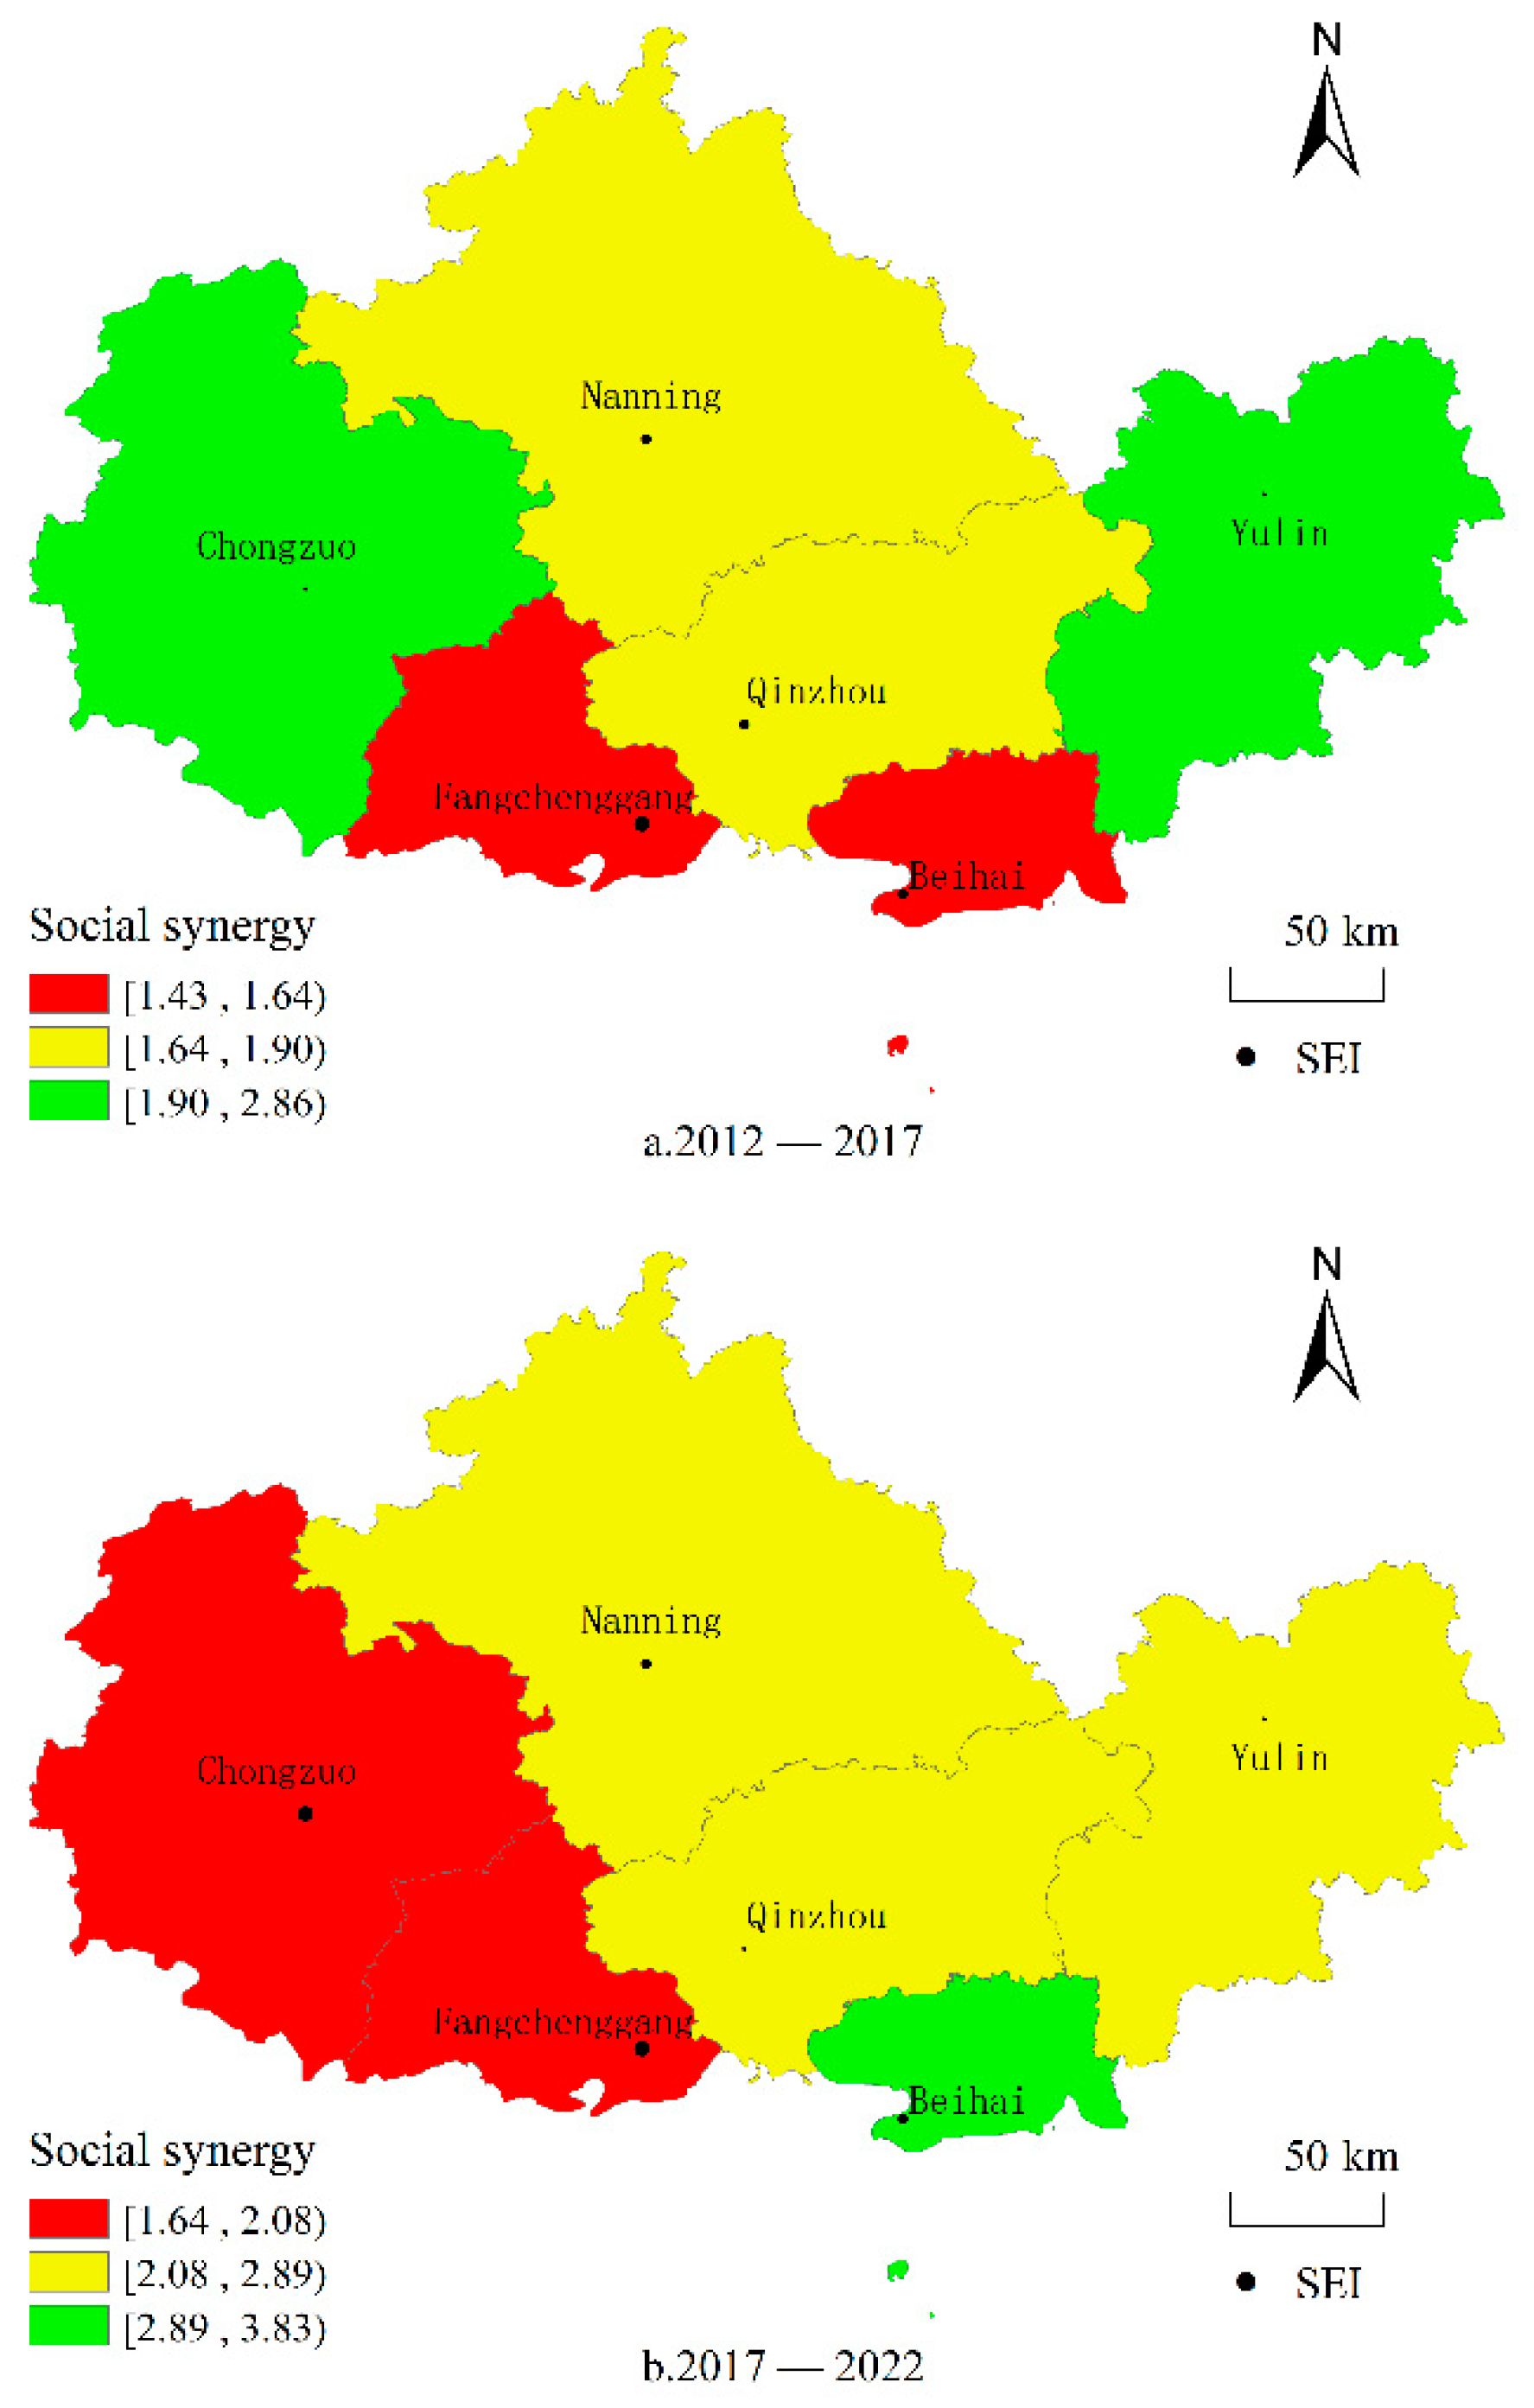
From 2012 to 2017, the social collaboration index (SI) of six cities in the Beibu Gulf urban agglomeration was all above 1, with an average of 2.06. Yulin (2.86) and Chongzuo (2.71) both exceeded the mean value, indicating that the social development of the six cities progressed faster than urban land expansion. From 2017 to 2022, the SI of all six cities remained above 1, with an average of 2.63. Beihai (3.83), Qinzhou (2.89), and Yulin (2.73) all surpassed the mean value, and the overall level has slightly improved compared to the previous period. In the past decade, the social urbanization of the Beibu Gulf Urban Agglomeration has shown an expanding trend, with social development of cities outpacing land expansion, and the spillover effect of urbanization on social benefits has been increasing. The spatial differences in social collaboration have gradually decreased, but the growth momentum has slowed down. The service capacity of node cities has become stronger while that of central cities has gradually weakened. The radiation-driven capacity of central cities in the coordinated development of urbanization and society has not been significant.
Figure 7.
Spatial and temporal differentiation of socio-land synergies
Figure 7.
Spatial and temporal differentiation of socio-land synergies
4.3.4. Ecological-Land Synergies
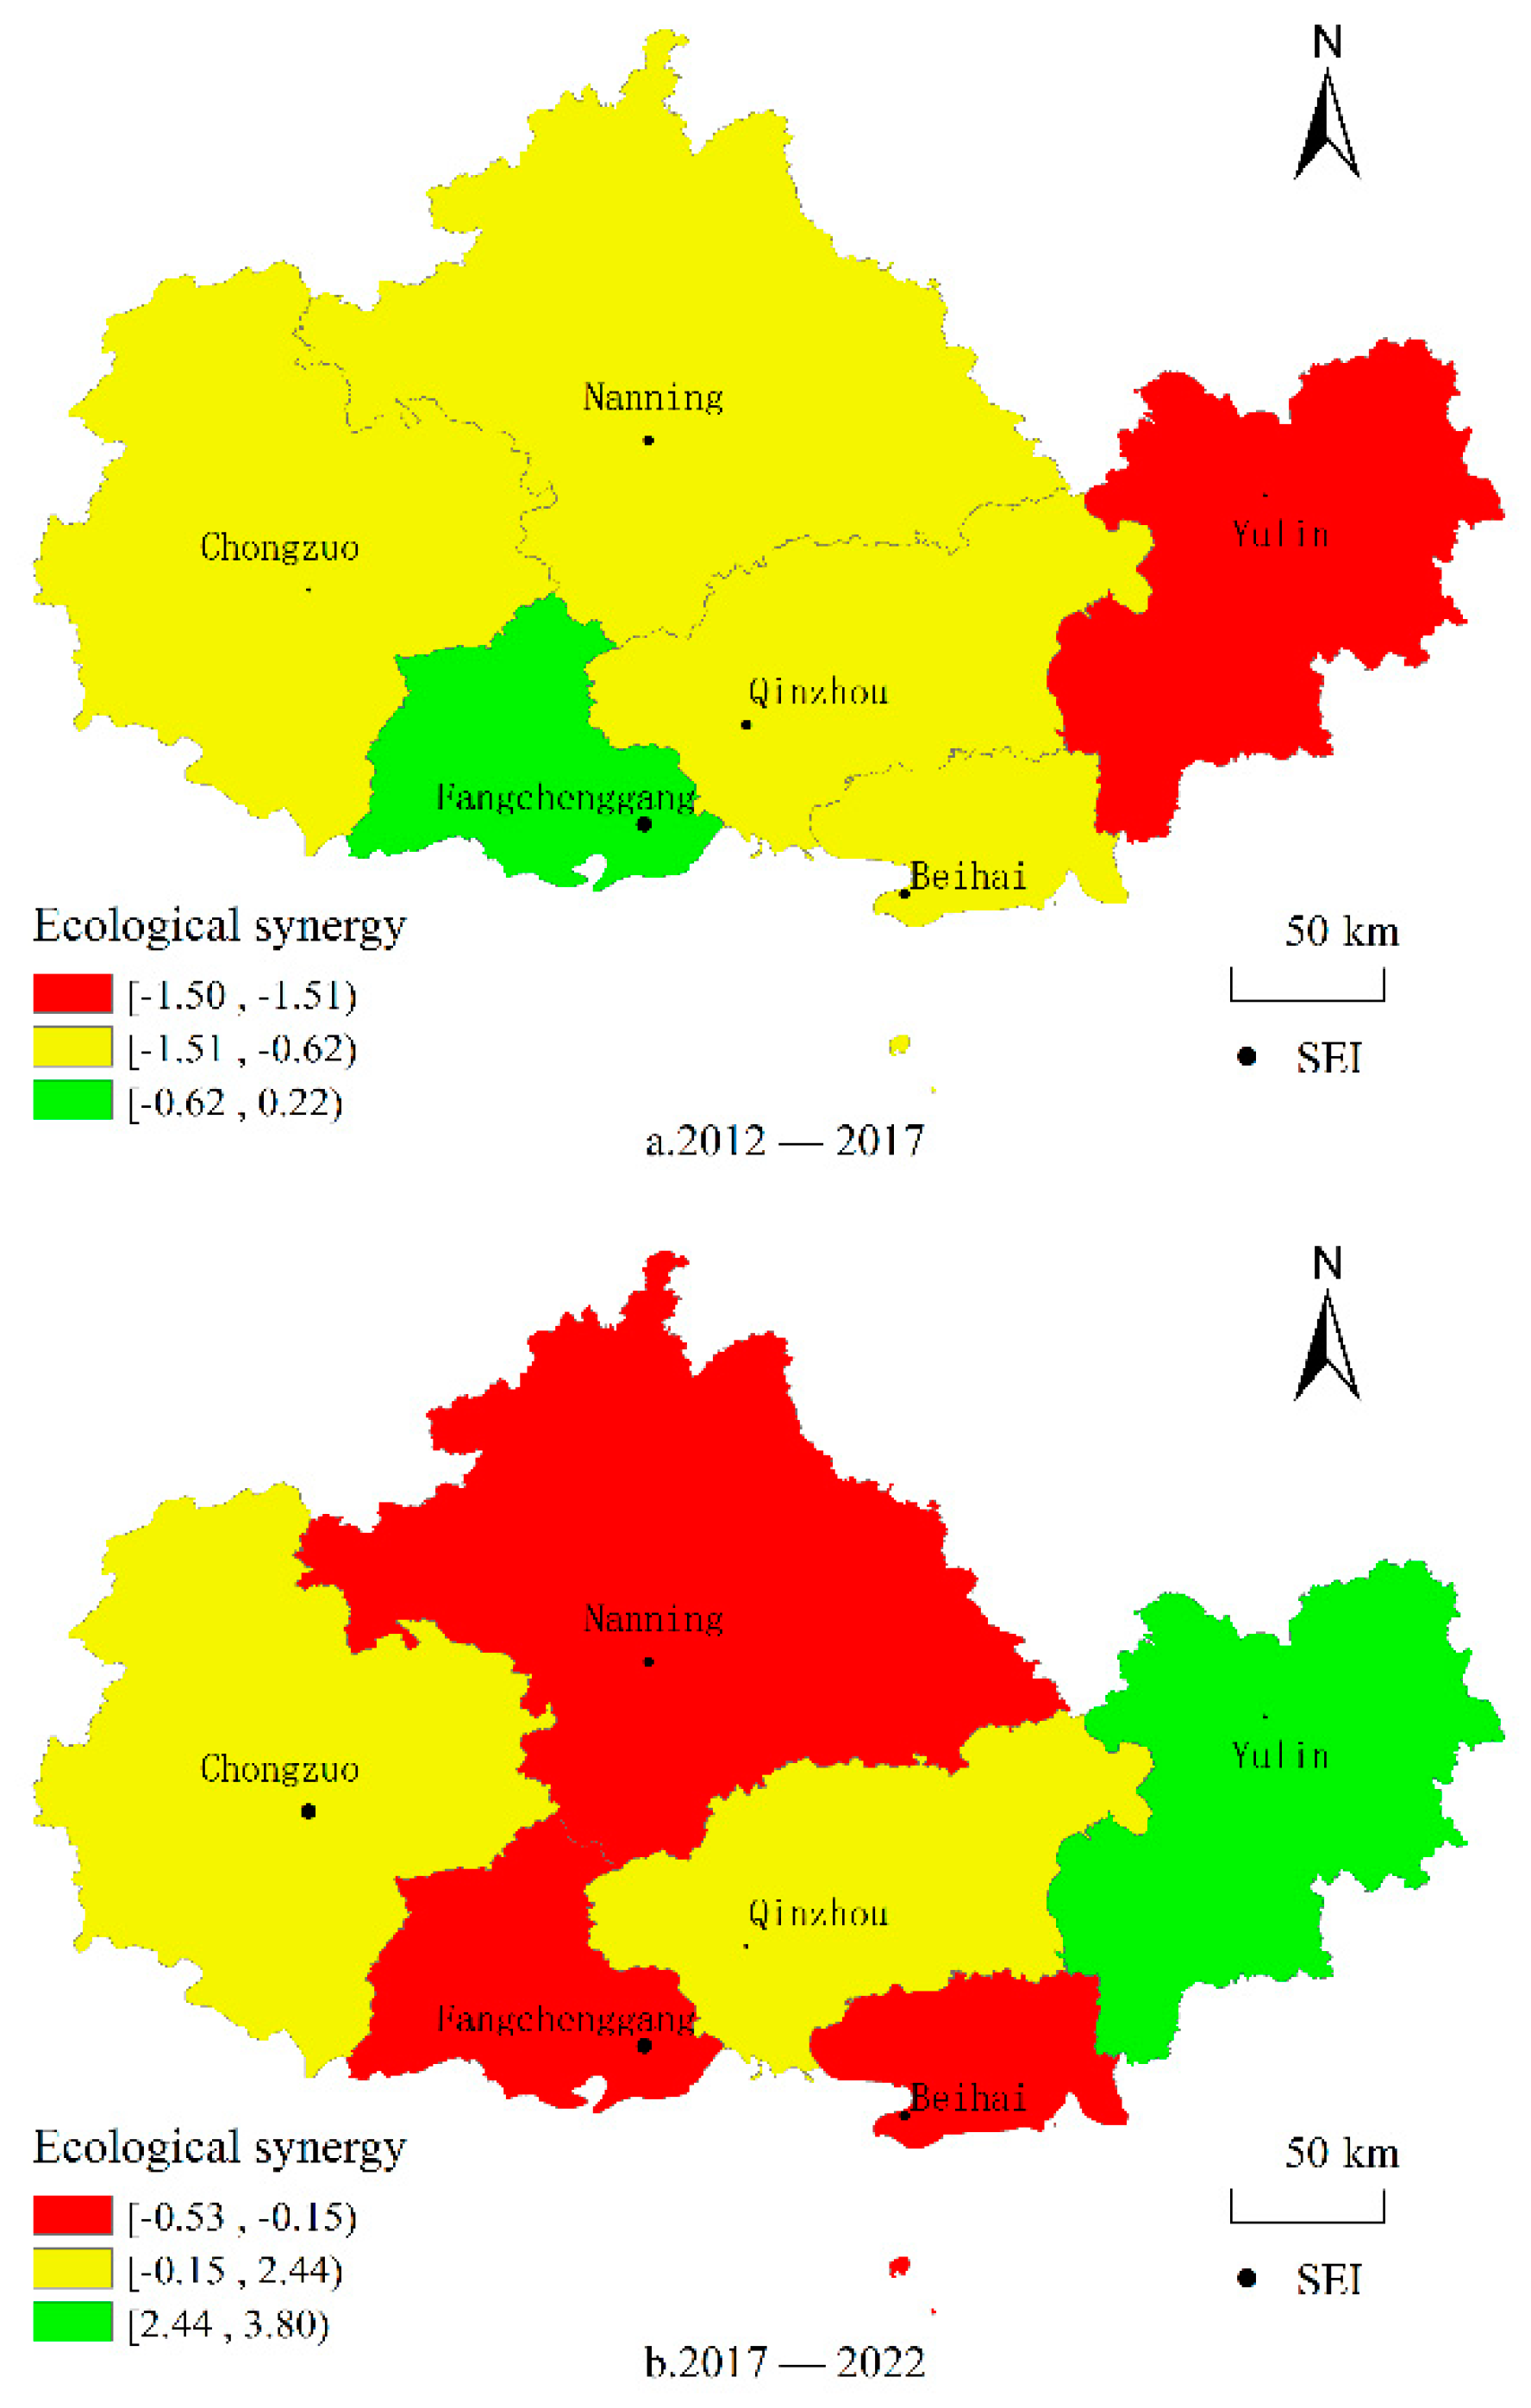
From 2012 to 2017, the average Ecological Synergy Index (SI) in Beibu Gulf Urban Agglomeration was less than 1, with Chongzuo, Qinzhou, and Yulin showing negative indices. From 2017 to 2022, the average SI was 0.41, with only Yulin having an SI greater than 1, while the other five cities had SI values less than 1. Research indicates that from 2012 to 2017, urban ecological construction in the Beibu Gulf Urban Agglomeration lagged behind land expansion, with tendencies towards utilitarian industrialization and industrial development during urbanization, neglecting carrying capacity of natural environment and resource protection, leading to blind expansion of natural habitats. However, from 2017 to 2022, as the concept of ecological civilization and harmony between human and nature became more prevalent, urban ecological benefits gradually recovered, and conflicts between central city ecological encroachment and spatial expansion eased, with little difference in ecological synergy among different cities. In urbanization construction, it is necessary to continuously strengthen the ecological foundation of the Beibu Gulf Urban Agglomeration, balance the relationship between urban development and ecological protection, follow the green coordinated development path, constantly optimize the urban construction mode and production and lifestyle, and build a livable blue bay urban agglomeration.
Figure 8.
Ecological-land synergy spatial and temporal differentiation
Figure 8.
Ecological-land synergy spatial and temporal differentiation
4.4. Driver Analysis
City expansion is influenced by various factors such as population, economy, society, and ecology. The spatial differentiation resulting from this reflects the interactive relationship between human-land geographic systems. Based on the theory of human-land geographic systems, a set of indicators for urbanization driving factors (
Table 2) was constructed. Using the Natural Breaks Method in ArcGIS, the numerical variables were transformed into categorical variables, and the classification results were imported into the Geodetector model to calculate the degree of influence of each factor on the urban expansion of the Beibu Gulf Urban Agglomeration.
Based on
Table 3, it is evident that the p-values of X1, X6, X7, and X8 have all passed the 95% confidence test. This indicates that population density, urban residents’ disposable income, per capita arable land area, and urban green space area play a significant role in the spatial differentiation of urbanization intensity. Particularly noteworthy are the exceedingly high Q-values for X6 and X7, both reaching 99.9%. This suggests that urban residents’ disposable income and per capita arable land area make substantial contributions to the expansion of the Beibu Gulf Urban Agglomeration from 2017 to 2022. On the other hand, urbanization rate, per capita GDP, output value of the secondary industry, and per capita road mileage did not pass the confidence test. This implies that their explanatory power in the spatial differentiation changes during the expansion of the Beibu Gulf Urban Agglomeration from 2017 to 2022 is minimal and their contributions are insignificant. Therefore, urban residents’ disposable income and per capita arable land area emerge as the core driving factors for urban expansion, while population density and urban green space area serve as important driving forces. The study demonstrates that the benefits in the social and ecological dimensions are dominant factors in determining or optimizing the spatial differentiation of the Beibu Gulf Urban Agglomeration, with noticeable effects also observed in the demographic and economic.
Urban development expansion relies on specific economic foundations. Economic synergy analysis indicates that the economic development and industrial agglomeration benefits of the Beibu Gulf Urban Agglomeration are relatively significant. However, factor analysis demonstrates that economic growth does not significantly contribute to the spatial expansion of the Beibu Gulf Urban Agglomeration, indicating insufficient impetus from economic growth for urban construction. Consequently, economic growth fails to ensure an overall improvement in the development level and comprehensive benefits of the Beibu Gulf Urban Agglomeration. Transportation development plays a crucial role in the extension of urban boundaries within the urban agglomeration. Nevertheless, per capita road mileage has a relatively low explanatory power for urban expansion intensity, reflecting the need for improvement in the convenience of transportation and the social infrastructure construction within the urban agglomeration, the regional urbanization process is relatively slow. Population density makes a significant and high contribution; however, the urbanization rate (Q value) is relatively low, indicating limited population agglomeration benefits restricting urban expansion. As a result, it is necessary to expedite the increase in the urban population scale of the Beibu Gulf Urban Agglomeration. Therefore, it is necessary to accelerate the increase of urban population size in the Beibu Gulf Urban Agglomeration, enhance the benefits of population agglomeration, optimize the allocation of population and industrial resources, alleviate conflicts between people and land, continually promote the coordination between urban and rural areas, optimize spatial layout, and improve the overall efficiency of urban production and living.
5. Conclusions
Based on the theory of urban system architecture, this study calculates the intensity index of urban expansion in the Beibu Gulf Urban Agglomeration and visually represents it in spatial terms. It analyzes the spatial-temporal differentiation characteristics of the spatial expansion of the Beibu Gulf Urban Agglomeration from the perspectives of urban expansion intensity, its relationship with population, economy, society, ecological gravity center shift, and coordination. Using the Geodetector, this study explores the impact of various factors on the extent of urban expansion in the Beibu Gulf Urban Agglomeration. The following conclusions are drawn:
(1) From the perspective of expansion intensity, the spatial expansion of the Beibu Gulf Urban Agglomeration has shown a stable growth trend in the past decade. The expansion intensity of the central city, Nanning, is relatively weaker compared to the peripheral nodal cities, indicating a pattern of outward development. High-value centers have shifted from the central city to the peripheral nodal cities, while low-value centers gradually cover the central city. The concentration of construction land expansion space has weakened, leading to a gradual reduction in the polarizing effect of Nanning as the central city. The disparities in urban spatial expansion among various cities are gradually narrowing.
(2) From the perspective of gravity center displacement, the overall social and economic gravity center of the Beibu Gulf Urban Agglomeration has shifted significantly, with relatively rapid development and construction, and notable changes. However, the ecological, urban, and population aspects have remained relatively stable. The population, social, and economic centers of gravity are all located in Qinzhou, while the urban center of gravity and ecological center of gravity are both situated in Nanning. There is a tendency for the economic and social centers of gravity to shift eastward and southward, which runs counter to the direction of urban center displacement, resulting in a mismatch between economic resources, social resources, and urban development. The direction of population center of gravity and ecological center of gravity displacement is generally consistent with the overall urban center. Consequently, it is essential to maintain convergence between urban construction and the population, economic, social, and ecological centers of gravity during the process of urbanization.
(3) From the perspective of Synergy Index. Over the past decade, the economic and social expansion intensity of the Beibu Gulf Urban Agglomeration has been faster than its urban expansion speed. However, the intensity of population and ecological expansion has been slower than that of urban expansion, and the distribution of urbanization expansion intensity is inconsistent with synergy. The differences in synergy between cities have gradually decreased. The ability of central cities to drive radiation is insufficient, leading to the underdevelopment of peripheral nodal cities and the continuous strengthening of the urbanization benefits of coastal cities.
(4) From the perspective of driving factors. The urban resident’s disposable income and per capita arable land area are core driving factors for urban expansion, while population density and urban green space area are important driving forces. The driving ability of economic density and industrial level, as well as the low population agglomeration benefits, make it difficult to ensure the overall development level and comprehensive benefits of the Beibu Gulf Urban Agglomeration. The slow process of regional urbanization affects the overall spatial distribution, expansion scale and speed of the urban agglomeration.
6. Discussion
The study of the spatial-temporal dynamic characteristics of the expansion of the Beibu Gulf Urban Agglomeration in Guangxi plays a pivotal role in promoting the balanced distribution of social resources, sharing the achievements of urbanization, and bridging regional development disparities in Guangxi. This research constructs a system for the coordinated expansion of urban agglomerations based on population, economy, society, and ecology. Through the use of expansion intensity index, inverse distance weighting interpolation, center-of-gravity model, synergy index and Geodetector, the spatial expansion characteristics of the Beibu Gulf Urban Agglomeration in Guangxi are analyzed, providing a foundation for the high-quality development of urbanization in Guangxi. In the era of rapid globalization and informatization, urban agglomerations have become increasingly dominant in regional factor flows, industrial division of labor, and resource allocation. As an important gateway to southwestern China, the Beibu Gulf Urban Agglomeration bears significant responsibilities for opening up to the outside world. However, from the perspective of the intensity of urban agglomeration expansion, the high-value center of the expansion of the Beibu Gulf Urban Agglomeration has shifted from the central city of Nanning to peripheral nodal cities, and the polarization effect of the central city’s space has gradually weakened, with no significant differentiation pattern between "core-periphery". While the differences in spatial expansion among cities within the region are gradually narrowing, there remains insufficient centripetal force in the overall development of urban agglomerations. In the future development, the Beibu Gulf Urban Agglomeration should strengthen the central city’s core role while nurturing secondary centers, thereby establishing a new development pattern of "one main, multiple subsidiaries," and enhancing the overall effectiveness of the Beibu Gulf Urban Agglomeration. Additionally, disparities exist in the urban expansion intensity and the distribution of synergy within the Beibu Gulf Urban Agglomeration. Emphasizing a modern urbanization system that stresses quality enhancement and balanced development, the urban agglomeration should further prioritize the coordinated coupling of various elements and enhance the capacity for coordinated development. With the proposal of the Chinese path to modernization and the advancement of the new urbanization strategy, the high-quality development of the Beibu Gulf Urban Agglomeration becomes increasingly critical. In the future, it will be imperative to employ efficient and precise computational models to address technical challenges such as spatial-temporal differentiation and factor-driven dynamics, providing in-depth insights and forward-looking interpretations of urban spatial expansion.
Author Contributions
Conceptualization, Zhantu Chen and Limei Xiao; Data curation, Zhantu Chen; Formal analysis, Limei Xiao; Methodology, Limei Xiao and Bing Feng; Project administration, Zhantu Chen; Validation, Limei Xiao and Li Ren; Visualization, Li Ren and Ling Xie; Writing, original draft, Limei Xiao and Zhantu Chen; Writing, review and editing, Zhantu Chen and Li Ren. All authors have read and agreed to the published version of the manuscript.
Funding
This research was funded by Social Science Foundation of Guangxi, grant no. 21FYJ057.
Data Availability Statement
Not applicable.
Acknowledgments
Thank you to everyone who contributed to this study.
Conflicts of Interest
The authors declare no conflict of interest.
References
- Ge, Y.; Han, L.; Zhao, Y.; et al. Spatiotemporal measurement analysis of urban expansion in Xi’an from 1984 to 2016. Chinese Journal of Ecology, 2019, 38(05): 1491-1499. (In Chinese).
- Zhang, J.; Xiao, L.; Li, Q.; et al. Spatial expansion and driving factors analysis of urban system in Guilin City. China Land Science, 2022, 36(06): 88-99. (In Chinese).
- Yu, B.; Liu, M.; Zhu, L.; et al. Boundary effects of urban agglomeration and development in border regions. Scientia Geographica Sinica, 2012, 32(06): 666-672. (In Chinese).
- Liu, Y.; Li, Y. Revitalize the world’s countryside. Nature, 2017, 548(7667): 275-277. [CrossRef]
- Wang, X.; Eddie; Hui, C.; et al. The new urbanization policy in China: Which way forward? Habitat International, 2015, 47: 279-284.
- Song, W.; Deng, X. Effects of urbanization-induced cultivated land loss on ecosystem services in the North China Plain. Energies, 2015, 8(6): 5678-5693. [CrossRef]
- Ouyang, X.; Zhu, X. Spatiotemporal dynamics of urban land expansion in Chinese urban agglomerations. Acta Geographica Sinica, 2020, 75(03): 571-588. (In Chinese).
- Zhang, M.; Yang, L.; Hu, Z.; et al. Spatiotemporal differentiation characteristics and influencing mechanism of urban expansion in the Yangtze River Economic Belt. Acta Geographica Sinica, 2024, 79(02): 439-461. (In Chinese).
- Wang, Y.; Su, M.; Wang, Y. Spatiotemporal characteristics and regional differences of urban expansion in the Yellow River Basin—A comparison between resource-based cities and non-resource-based cities [J/OL]. Chinese Journal of Agricultural Resources and Regional Planning, 1-13[2024-02-22]. http://kns.cnki.net/kcms/detail/11.3513.S.20230803.1729.020.html (In Chinese).
- Shi, T.; Hui, S. Analysis of the spatial and temporal characteristics and driving factors of construction land expansion in the Beijing-Tianjin-Hebei border area. Geography and Geo-information Science, 2023, 39(03): 48-57. (In Chinese).
- Zhan, Z.; Hui, S. The impact of administrative boundaries on land use changes in the urban agglomeration border areas: a case study of the Tongzhou-Wuqing-Langfang area. Progress in Geography, 2022, 41(12): 2271-2285. (In Chinese).
- Wang, M.; Peng, L.; Chen, X., et al. Research on urban construction land expansion in the three northeastern provinces based on GEE. Journal of Jilin University (Earth Science Edition), 2022, 52(01): 292-304. (In Chinese).
- Wang, X.; Li, P.; Liu, S., et al. Characteristics and driving mechanisms of urban construction land expansion in the southwestern mountainous areas of China. Chinese Journal of Ecology, 2021, 40(09): 2895-2903. (In Chinese).
- Shi, T.; Hui, S. Analysis of the spatial and temporal driving factors of Urumqi’s urban expansion based on geographic detector. Arid Land Geography, 2021, 44(03): 867-876. (In Chinese).
- Ouyang, X.; Li, Y.; Xu, F., et al. Study on the interaction between urban land expansion and ecological environment protection: a case study of the Chang-Zhu-Tan urban agglomeration. Economic Geography, 2021, 41(07): 193-201. (In Chinese).
- Zhao, D.; Tong, L.; Qiu, F., et al. Ecological environmental effects of urban land expansion in the Songhua River Basin. Geographical Research, 2017, 36(01): 74-84. (In Chinese).
- Zhao, K.; Xu, T.; Zhang, A. Urban land expansion, economies of scale, and the quality of economic growth. Journal of Natural Resources, 2016, 31(03): 390-401. (In Chinese).
- Wang, C.; Wang, H.; Li, C., et al. Spatial expansion characteristics of major urban agglomerations in China based on DMSP/OLS images. Acta Ecologica Sinica, 2012, 32(03): 942-954. (In Chinese).
- Wang, S.; Wang, Z. Spatiotemporal differences in urban land expansion and influencing factors in the context of economic transformation in the Yangtze River Delta. Journal of Natural Resources, 2021, 36(04): 993-1007. (In Chinese).
- Cai, E.; Kou, Z.; Meng, K.; et al. Analysis of spatiotemporal characteristics of urban expansion in Zhengzhou from 1990 to 2020. Journal of Henan Agricultural University, 2022, 56(04): 674-684. (In Chinese).
- Li, X. Identifying the spatial morphology of multiple centers in Zhengzhou based on gravity potential range. Acta Geographica Sinica, 2022, 77(06): 1475-1489. (In Chinese).
- Tang, J.; Zhu, Y.; Liu, Y.; et al. Evolution and influencing factors of spatial morphology in typical tourist cities: a case study of Zhangjiajie. Economic Geography, 2022, 42(01): 221-229. (In Chinese).
- Yin, X.; Tan, C.; Ke, Y.; et al. Evolution pattern and driving factors of landscape pattern in the coastal salt marsh wetlands of the Yellow River Delta from 1973 to 2020. Acta Ecologica Sinica, 2024, 44(01): 67-80. (In Chinese).
- Shu, B.; Li, Y.; Qu, Y.; et al. Characteristics and driving forces of urban land expansion in different economic development stages: a case study of Taicang City. Economic Geography, 2013, 33(07): 155-162. (In Chinese).
- Feng, Y.; Li, C.; Feng, J. Spatiotemporal response of urban ecosystem service value to urban expansion based on the GTWR model in the Jinan metropolitan area. Journal of Beijing Forestry University, 2024, 46(01): 104-118. (In Chinese).
- Luo, N.; Sun, P.; Cao, N.; et al. Study on the characteristics and mechanism of urbanization evolution of shrinking cities in Northeast China. World Regional Studies, 1-13[2024-03-20]. http://kns.cnki.net/kcms/detail/31.1626.P.20230515.1713.004.html (In Chinese).
- Wu, J.; Bai, Z. Explanation of differences in urbanization development in resource-based cities in China based on the Shapley value decomposition method. China Land Science, 2019, 33(12): 72-79. (In Chinese).
- Liu, S.; Chen, Y.; Xie, B.; et al. Study on the socio-economic driving forces of oasis farmland change based on PCA-STIRPAT model: a case study of Jiuquan City. Journal of China Agricultural Resources and Regional Planning, 2019, 40(12), 133-140. (In Chinese).
- Li, Z.; Kuang, W.; Zhao, D. Population urbanization and land use coupling mechanism in Beijing-Tianjin-Hebei urban agglomeration. Economic Geography, 2020, 40(08), 67-75. (In Chinese).
- Huang, P.; Li, D.; Xu, X.; et al. Analysis of urban exceedance flood risk based on inverse distance weighted interpolation. Water Resources Planning and Design, 2021, (11), 110-113. (In Chinese).
- Liu, G.; Wang, Y.; Zhang, H.; et al. Comparison of several interpolation methods in spatial analysis. Geomatics World, 2011, 9(03), 41-45. (In Chinese).
- Ling, Z.; Li, Y.; Jiang, W.; et al. Dynamic changes of national territorial three-dimensional space in mountain-river-sea interlaced area: a case study of Beibu Gulf Urban Agglomeration in Guangxi. Economic Geography, 2022, 42(02), 18-24. (In Chinese).
- Wen, Q.; Zhao, L. Trajectory and driving mechanism of the gravity center of grain production in Ningxia from 1978 to 2011. Areal Research and Development, 2014, 33(01), 99-102. (In Chinese).
- Wang, J.; Liao, Y.; Liu, X. Tutorial on spatial data analysis. Science Press, Beijing, 2019, pp. 107. (In Chinese).
- Wang, J.; Xu, C. Geodetector: Principle and prospective. Acta Geographica Sinica, 2017, 72(01): 116-134.
|
Disclaimer/Publisher’s Note: The statements, opinions and data contained in all publications are solely those of the individual author(s) and contributor(s) and not of MDPI and/or the editor(s). MDPI and/or the editor(s) disclaim responsibility for any injury to people or property resulting from any ideas, methods, instructions or products referred to in the content. |
© 2024 by the authors. Licensee MDPI, Basel, Switzerland. This article is an open access article distributed under the terms and conditions of the Creative Commons Attribution (CC BY) license (http://creativecommons.org/licenses/by/4.0/).
