1. Introduction
Societal concern in the field of environmental pollution has increased due to the direct impact of the deterioration in air quality on human health. Air pollution can indirectly impact human health by diminishing visibility and degrading building materials[
1]. In recent decades, the aviation industry has undergone significant advancement and robust expansion, establishing itself as a crucial component of the worldwide transportation network. The increasing frequency and magnitude of flights are amplifying the environmental issues associated with the aviation sector, especially the effects of aircraft emissions on air quality. Nitrogen oxides (NOx), black carbon (BC), and carbon monoxide (CO) released by airplanes at altitudes below 3,000 feet adversely affect local air quality[
2,
3,
4] and are contributing causes to cardiovascular and respiratory disorders[
5]. The LTO cycle significantly compromises air quality at the airport during different stages of flight operations due to the aircraft's closeness to the ground. Consequently, examining flight emissions and pollutant dispersion during the LTO cycle provides essential reference data for mitigating the environmental effects of air transportation, formulating suitable environmental protection policies, guiding aircraft operations, and facilitating airport planning. The QAR data record the real-time functioning of aircraft systems and parameters, encompassing fuel flow, flight path, wind velocity, and direction. As such, it is widely employed in the examination of emission data.
Investigations into contaminant dispersion commence with accurate computations of airplane emissions. Wayson[
6] initially presented a first-order estimate for determining the black carbon emission index, an approach recognized as a crucial instrument for measuring aviation emissions. Orhan, I[
7] computed the emissions of polluting gases, including hydrocarbons (HC), CO, and NOx, together with the fuel consumption throughout the LTO cycle at Ordu-Giresun International Airport, Turkey, in 2017. This analysis utilized flight data and aircraft engine emission data from the International Civil Aviation Organization (ICAO) emissions database to assess the influence of taxiing duration on emissions. Lobo, P.[
8] performed a measuring study on particle emissions from airplane engines across diverse operating situations. This investigation revealed the alterations in particle diameter and emission levels according to engine thrust settings. Yu JL[
9] analyzed the trend of air pollutant emissions from aircraft during the LTO cycle at several airports in China from 1990 to 2017. Xu H[
10] analyzed the emission-related characteristics of a certain aircraft type during the taxiing phase at Shanghai Hongqiao Airport, comparing them with ICAO reference levels, using data from the Aircraft Communication Addressing and Reporting System (ACARS). The findings revealed discrepancies between the ICAO reference values and actual measurements. Sheikhi and Aygun H[
11] analyzed the variations in emissions over the LTO cycle for different commercially available high-bypass-ratio turbofan engines. This research offers a reference for engine design concerning environmental impacts and aids in reducing engine emissions.
Building on emission calculations, researchers have directed their attention to the dispersion of pollutants. The dispersion of pollutants denotes the movement and distribution patterns of contaminants throughout the environment. Currently, research methods for understanding dispersion mechanisms primarily include field measurements, wind tunnel tests, and numerical models[
12] Field measurements yield the most precise data, but they are also the most costly. Therefore, they are appropriate solely for small-scale investigations or for the validation of sample methods[
13]. Wind tunnel experiments offer the benefit of producing relatively precise results and are straightforward to duplicate. Nevertheless, they are very limited and suited solely to particular conditions[
14]. Numerical simulations, conversely, are more efficient and cost-effective than the aforementioned methods. The advancement of numerous established commercial CFD software has diminished the entry barriers for study[
15,
16,
17]. However, CFD necessitates considerable computer resources. Wang, H.[
18] developed a fast urban canopy dispersion model that attains acceptable precision and operates approximately 50 times faster than large-eddy simulations, making it suitable for time-sensitive applications. Gan, L.[
19] investigated ship exhaust gases diffusion in the port area using a Gaussian puff model, revealing the impact of multiple ship emissions on the distribution of NO2 concentration and highlighting the need for targeted environmental monitoring and treatment. Micallef, A. and Micallef, C.[
20] developed a revised Gaussian plume model equation that incorporates numerous reflections in confined environments, such as street canyons, to enhance the precision of pollution concentration forecasts. Kuzu S. L.[
21] assessed emissions during the aircraft LTO cycle at Atatürk International Airport and compared the outcomes of the AERMOD model’s pollutant dispersion simulations with data from air quality monitoring stations, indicating that NOx concentrations in the majority of the airport and adjacent residential areas surpassed the annual limit values. Makridis M.[
22] calculated the dispersion of pollutants emitted during the LTO cycle at Chania Airport, Greece, employing the AERMOD model and assessed the ground-level concentrations. The results were consistent with those identified by Kuzu S. L. Kurtenbach R.[
23] developed the PolEmiCa model, which calculates aircraft emissions during the LTO phase and simulates pollutants dispersion in the airport area, and validated it at the Athens International Airport. Synylo, K.[
24] conducted a numerical simulation of an exhaust gas jet near the ground using CFD software to evaluate the impact of the ground on the exhaust gas jet. Pecorari E.[
25] assessed the dispersion and deposition of aircraft exhaust at the Marco Polo Airport in Venice using a Lagrangian particle dispersion model, focusing primarily on the influence of meteorological conditions on the pollution levels at the airport.
The ICAO Emissions Database provides only experimental average emission indices for various phases of the LTO cycle; hence, estimates based on this data may differ from actual conditions. Furthermore, CFD simulations of pollutant dispersion are resource-intensive and time-consuming when analyzing the dispersion patterns of pollutants from an airport's regional fleet. In contrast, the current use of Gaussian dispersion models for real-time dispersion simulations enables rapid assessment of the pollution produced by the fleet. This paper introduces an advanced Gaussian diffusion model that employs flight QAR data and Stokes' theorem to compute and examine the emission of pollutants and the diffusion process during the LTO phase. The impact of wind speed and particle settling was also examined. The proposed model serves as an example for calculating and assessing the environmental impacts of aviation emissions.
2. Calculation Method and Verification
2.1. Gaussian Diffusion Model
2.1.1. Stabilized Point Source Dispersion Model
The Gaussian diffusion model is a commonly used atmospheric diffusion model[
26] for estimating the transport and concentration distribution of air pollutants in the atmosphere. The model assumes that the movement of pollutants in the atmosphere follows a normal distribution pattern and is based on the Gaussian distribution principle. Diffusion models predicated on the Gaussian distribution can be derived from the analytical solution of the gradient transport equation [Eq. (1)], under the assumption of uniform airflow and stable turbulent circumstances[
27].
where,
denotes the pollutant concentration,
represents the average wind speed, while
,
, and
are the coefficients for turbulent diffusion along the
x,
y, and
z axes, respectively.
For uniform flow with homogenous turbulence and a continuous point source, the resolution of Eq. (1) gives
where
Q denotes the source intensity or the rate of emission.
Employing the standard deviations of the Gaussian concentration distribution,
and
, and applying the slender plume approximation[
28], Eq. (2) can be transformed into the familiar Gaussian plume equation format:
where
represent the concentration of the pollutant at points
;
H is the height of the point source;
Q indicates the instantaneous emission intensity of the pollutant;
u is the wind speed
and
are the atmospheric dispersion coefficients in the horizontal and vertical directions, respectively, which are associated with the atmospheric stability class[
29].
2.1.2. Moving Point Source Dispersion Model
In the assessment of emission dispersion from an airplane during a LTO cycle, the airplane acts as a moving point source. Consequently, a Gaussian dispersion model must be adapted to facilitate this calculation. Based on the assumption of a normal distribution, the concentration function of the smoke plume released by the engine can be determined under ideal conditions (unbounded and windless), as follows:
In addition , the influences of wind speed and wind direction are taken into account. When the wind speed is
u and the angle between the wind direction and the runway direction is
, a coordinate transformation can be performed at time
t. The
x-direction is transformed to
, the
y-direction to
, yet the z-direction remains unchanged without any coordinate transformations. With these transformations, we obtain
Taking into account the effect of ground reflections, it can be derived using the image source method:
The intensity of the pollutant source emitted by the engine is dynamic during aircraft operation. Assuming that the emission source intensity at a specific moment is
, the particulate matter emitted over a time interval
(onboard data are typically recorded at 1-second intervals) can be considered an instantaneous smoke cloud. The concentration of diffusion at the position
at time
t for this instantaneous smoke cloud can be determined using Eq. (7):
The diffuse concentration of particulate matter at a specific location from the engine can be seen as the sum of the diffuse concentrations from numerous instantaneous puffs of smoke at that location. Therefore, the concentration of particulate matter released during a specified duration
T can be calculated as follows:
where T represents the overall duration of smoke mass release, while t indicates the time of a specific smoke mass release event. Let
v denote the aircraft's variable movement speed, which fluctuates with the operational phase and time. The duration of each operational phase is
T (in seconds), and the descent approach angle or takeoff climb angle is
(0° during taxiing). Consequently, the diffusion model for the smoke mass emitted by the aircraft in three-dimensional space is represented by Eq. (9).
2.2. Calculation Verification
2.2.1. Calculation Domain and Conditions
Chen[
30] confirmed that the CFD method can be used to analyze the characteristics of pollution diffusion based on the experimental data from the wind tunnel. The pollutant concentration distribution calculated by the CFD method is essentially consistent with the results of the Gaussian diffusion model. Furthermore, the results of other researchers demonstrate that the CFD method is able to precisely describe the properties of pollutant distribution. Therefore, the reliability of the Gaussian model was confirmed in the current investigation adopting the same CFD methodology as Chen's study. The computational domain measured 250 m
100 m horizontally, and 50 m vertically, as shown in
Figure 1, which indicated the source’s position and the diffusion direction. We compared the results for varying beginning exhaust velocities of 10, 15, and 20 m/s while maintaining a wind speed of 5 m/s. Similarly, we analyzed the effects of wind speeds of 5, 7.5, and 10 m/s while maintaining a constant exhaust velocity of 20 m/s to compare the results across different wind speeds.
The CFD program's calculation parameters aligned with the Gaussian diffusion model, and the findings obtained from the CFD software were compared to those of the Gaussian diffusion model to validate the model's correctness in addressing point source diffusion. CFD simulations are generally performed using Fluent software. It is widely utilized in sectors including aerospace, automobile design, oil and gas, and turbine engineering. Additionally, it excels in simulating gas diffusion, allowing for the acquisition of generally accurate CFD results.
2.2.2. Results of the Verification
Starting from the point source, 600 data points were collected along the exhaust plume direction at intervals of 0.1 m. The pollutant volume fraction at these points was monitored, and the Gaussian Plume Model (GPM) was compared with the results from the Fluent.
Figure 2 illustrates the outcomes for varied beginning exhaust velocities, whereas
Figure 3 depicts the results for differing wind speeds.
The figure demonstrates that, close to the emission source, the curve derived from the Gaussian approach is more uniform, while the findings from the CFD method display greater variability. This disparity is attributed to the tendency of vortex and turbulence phenomena to occur near the exhaust exit. These flow instabilities enhance mixing among fluid microclusters, resulting in a heterogeneous and abrupt change in concentration distribution. The Gaussian model calculations aligned well with the results obtained from the CFD across various operational conditions.
2.3. Particle Sedimentation
This study incorporated the impact of particulate matter settling in the air into the general diffusion model to improve the realim of the calculation results and compared its concentration distribution with that obtained from a model that disregarded settling.
The determination of the settling velocity of particulate matter was performed by the use of Stokes' law:
Where v represents the settling velocity of the particulate matter, d is the diameter of the particulate matter, denotes the viscosity of air, which is approximately 1.8 10-5 (Pa·s) at room temperature and pressure, g is the acceleration due to gravity, which is taken as 9.8 m/s2, is the density of the particulate matter, and is the density of air. The velocity at which particulate matter settles can be determined using Stokes' Law and subsequently combined with the Gaussian diffusion model equation to provide the precise details of the vertical distribution of particulate matter.
An in-depth analysis of the concentration distribution of both particulate matter and general gases allows for a thorough comprehension of the dispersion pattern of pollutants emitted during the LTO phase of an airplane and its overall impact on the surrounding environment.
2.4. Calculation of Emissions
2.4.1. Black Carbon
BC is a major constituent of fine particulate matter, and its impact on the environment and contribution to the greenhouse effect are significant. The ICAO has implemented smoke number standards to regulate BC particle emissions. The present work employed a first-order approximation approach to measure the emissions of particulate matter during the LTO cycle of an aircraft engine, together with the BC emissions. This method relies on the engine Smoke Number (SN), Air-fuel Ratio (AFR), and Bypass Ratio (BPR) as Parameters[
6]. The calculation procedure is as outlined below:
- 1)
Mass of BC per unit volume of exhaust gas ()
When the SN of the engine is less than 30, the calculation formula for CI (mg/m³) is as follows:
Eq. (11) represents the general equation derived from best-fit estimation. In practical scenarios, the maximum uncertainty in this equation arises from the error in the SN, which is typically within ±3.
- 2)
Exhaust gas volume per unit mass of fuel consumed ()
For turbofan engines, V (m³/kg) can be determined using the AFR and BPR.
- 3)
Combining Eq. (11) with Eq. (12) yields the black carbon emission index EI (mg/kg) as
BC emissions can be calculated for any given period by further integrating the fuel flow data from the QAR.
2.4.2. NOx and CO
An emissions database maintained by the ICAO contains emissions data for various engine models at various operational phases[
31]. For the Rolls-Royce Trent 768 engine, which powers the Airbus A330-300 aircraft, the BPR is 5.2, and the AFR, SN, and emission data for various operational stages are detailed in
Table 1.
By using the emission data from the table and the fuel flow data recorded in the QAR, the pollutant emission indices at different times can be calculated using the Boeing Fuel Flow Method 2(BFFM2)[
32]. Subsequently, this information can be used to determine total emissions and their dispersion.
2.5. Calculation Process
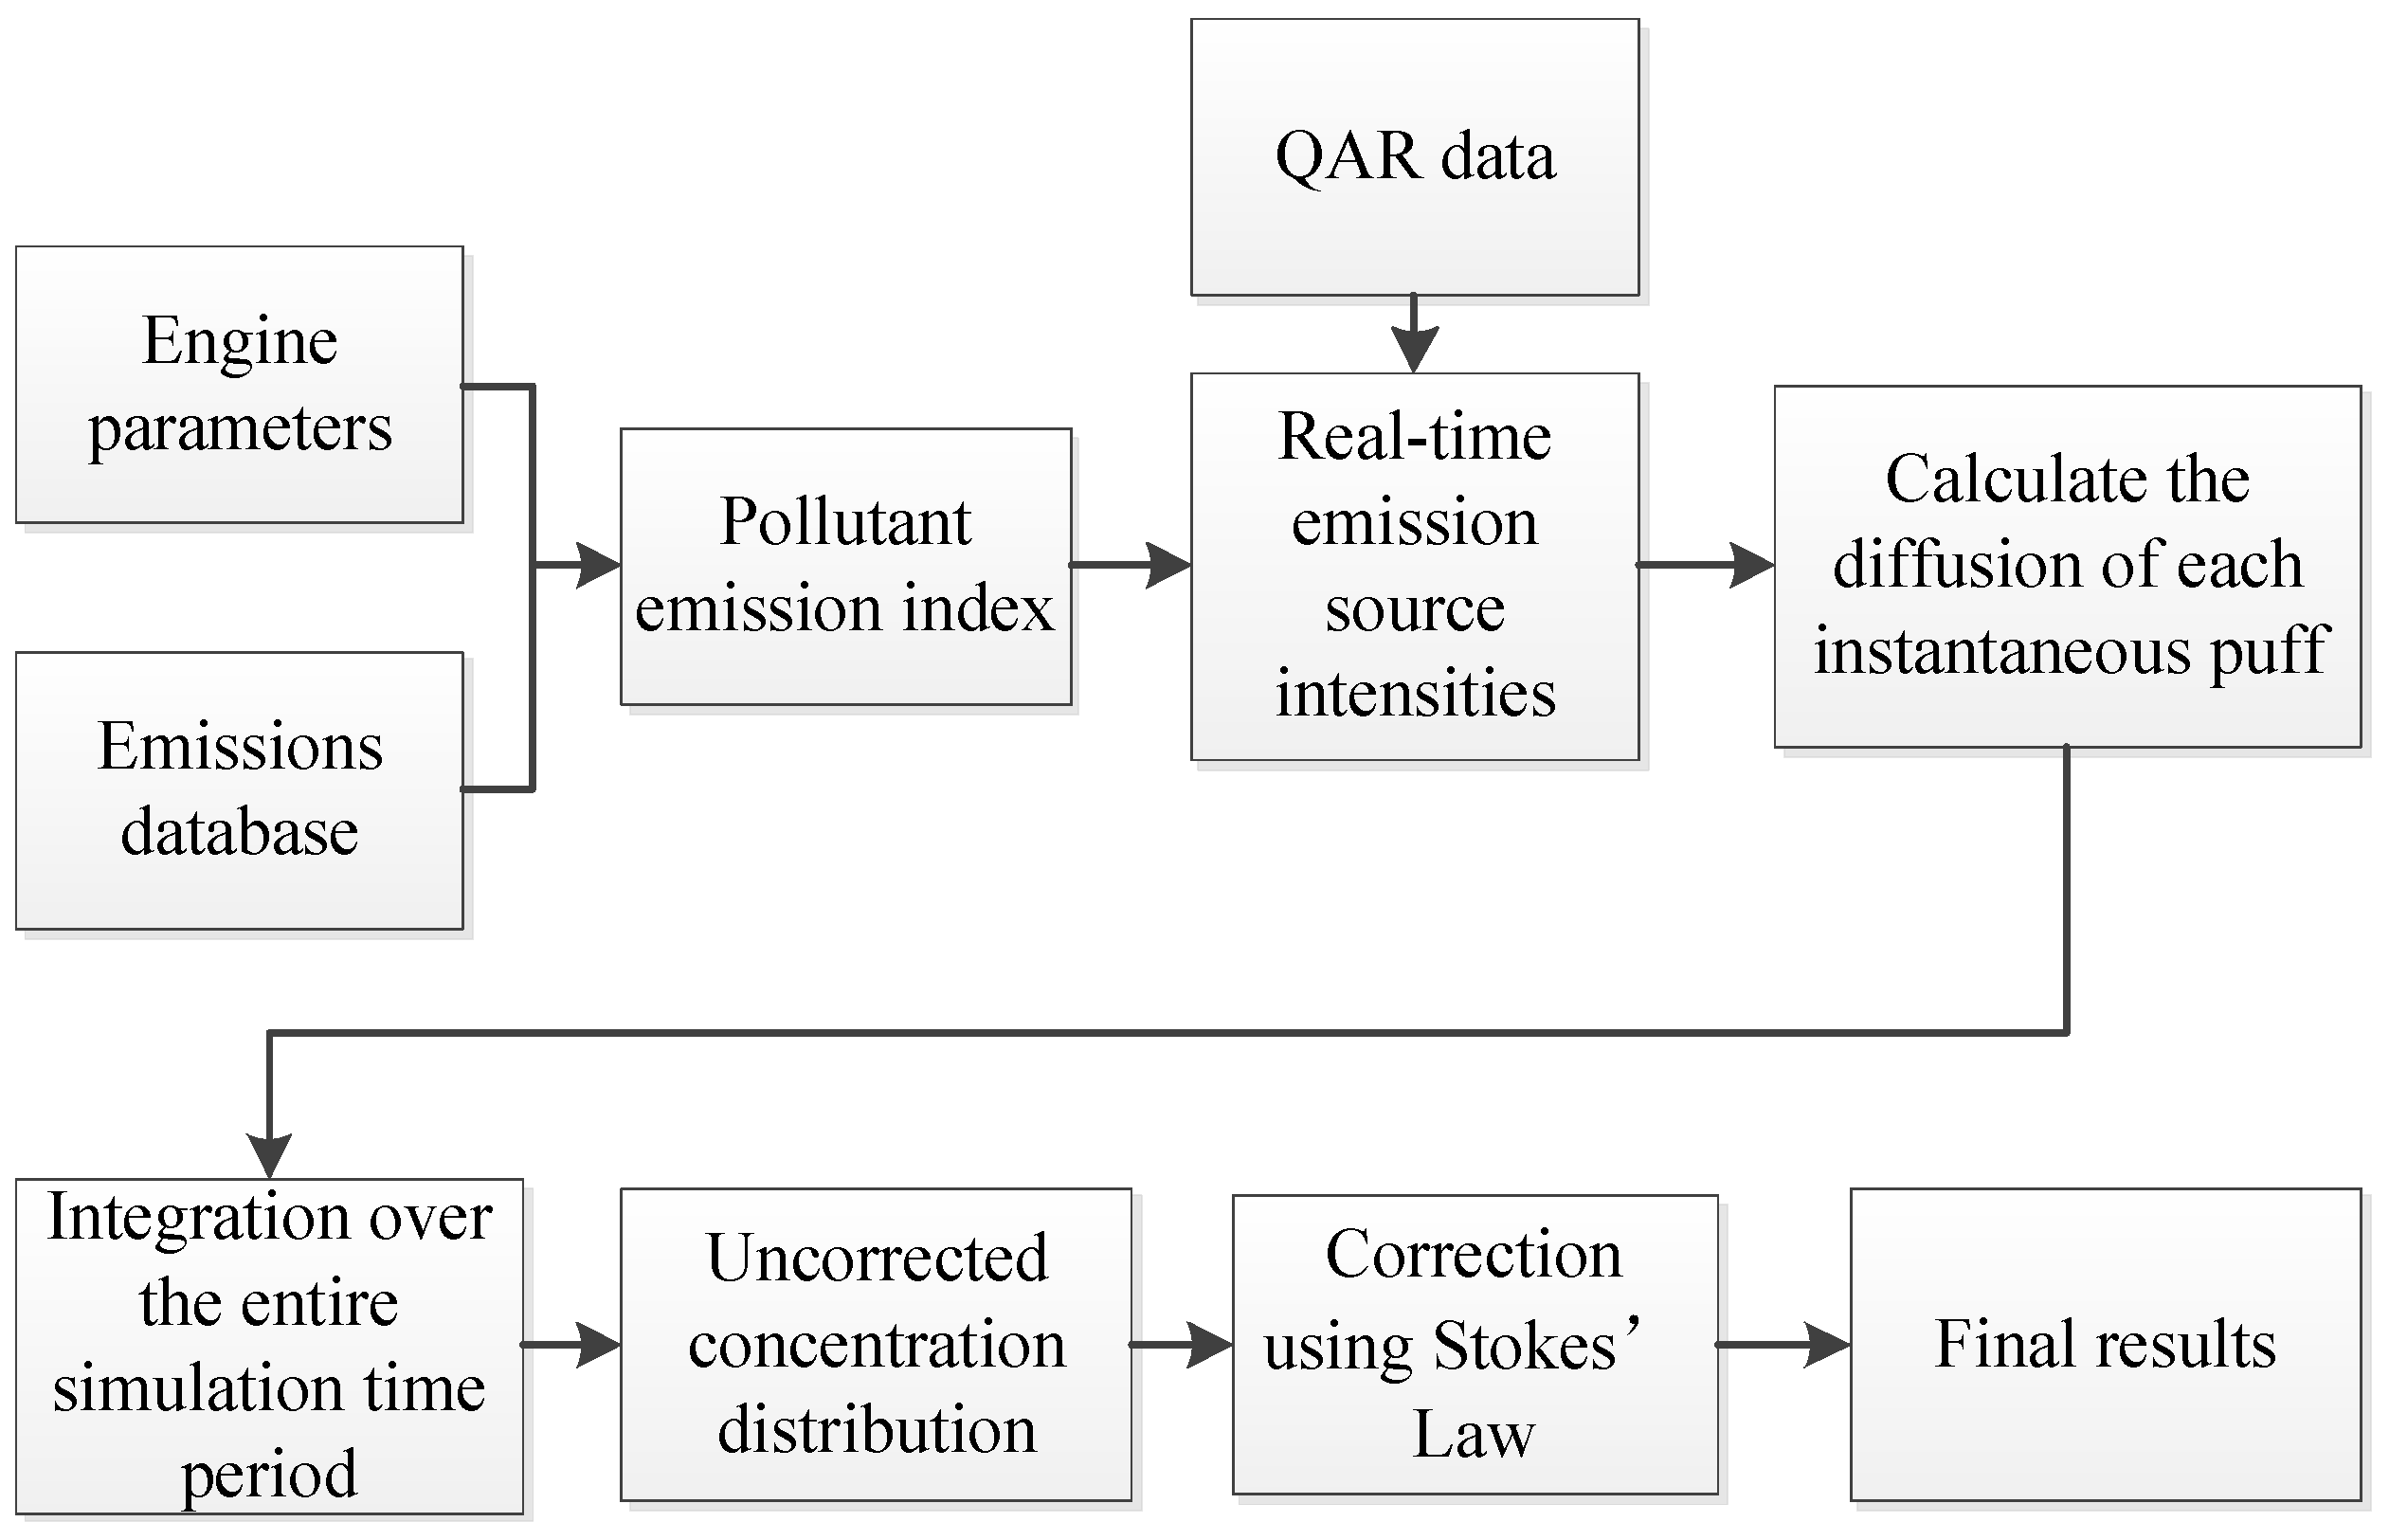
In this study, an improved Gaussian plume model is programmed and calculated using MATLAB. The calculation process is illustrated in
Figure 4.
1) Calculate the emission index for BC based on the engine's SN, AFR, and BPR, and determine the emission indices for HC, NOx, and CO using BFFM2.
2)Calculate the real-time emission source intensity during the LTO phase by integrating the fuel flow data from the QAR.
3) The Gaussian dispersion model was utilized to calculate the dispersion of each smoke plume and integrate it over the simulation time to obtain the concentration distribution in the simulated area.
4)The ultimate diffusion outcome is obtained by applying Stokes' Law to refine the computation findings.
3. Results and Discussion
3.1. Emissions during the LTO Phase
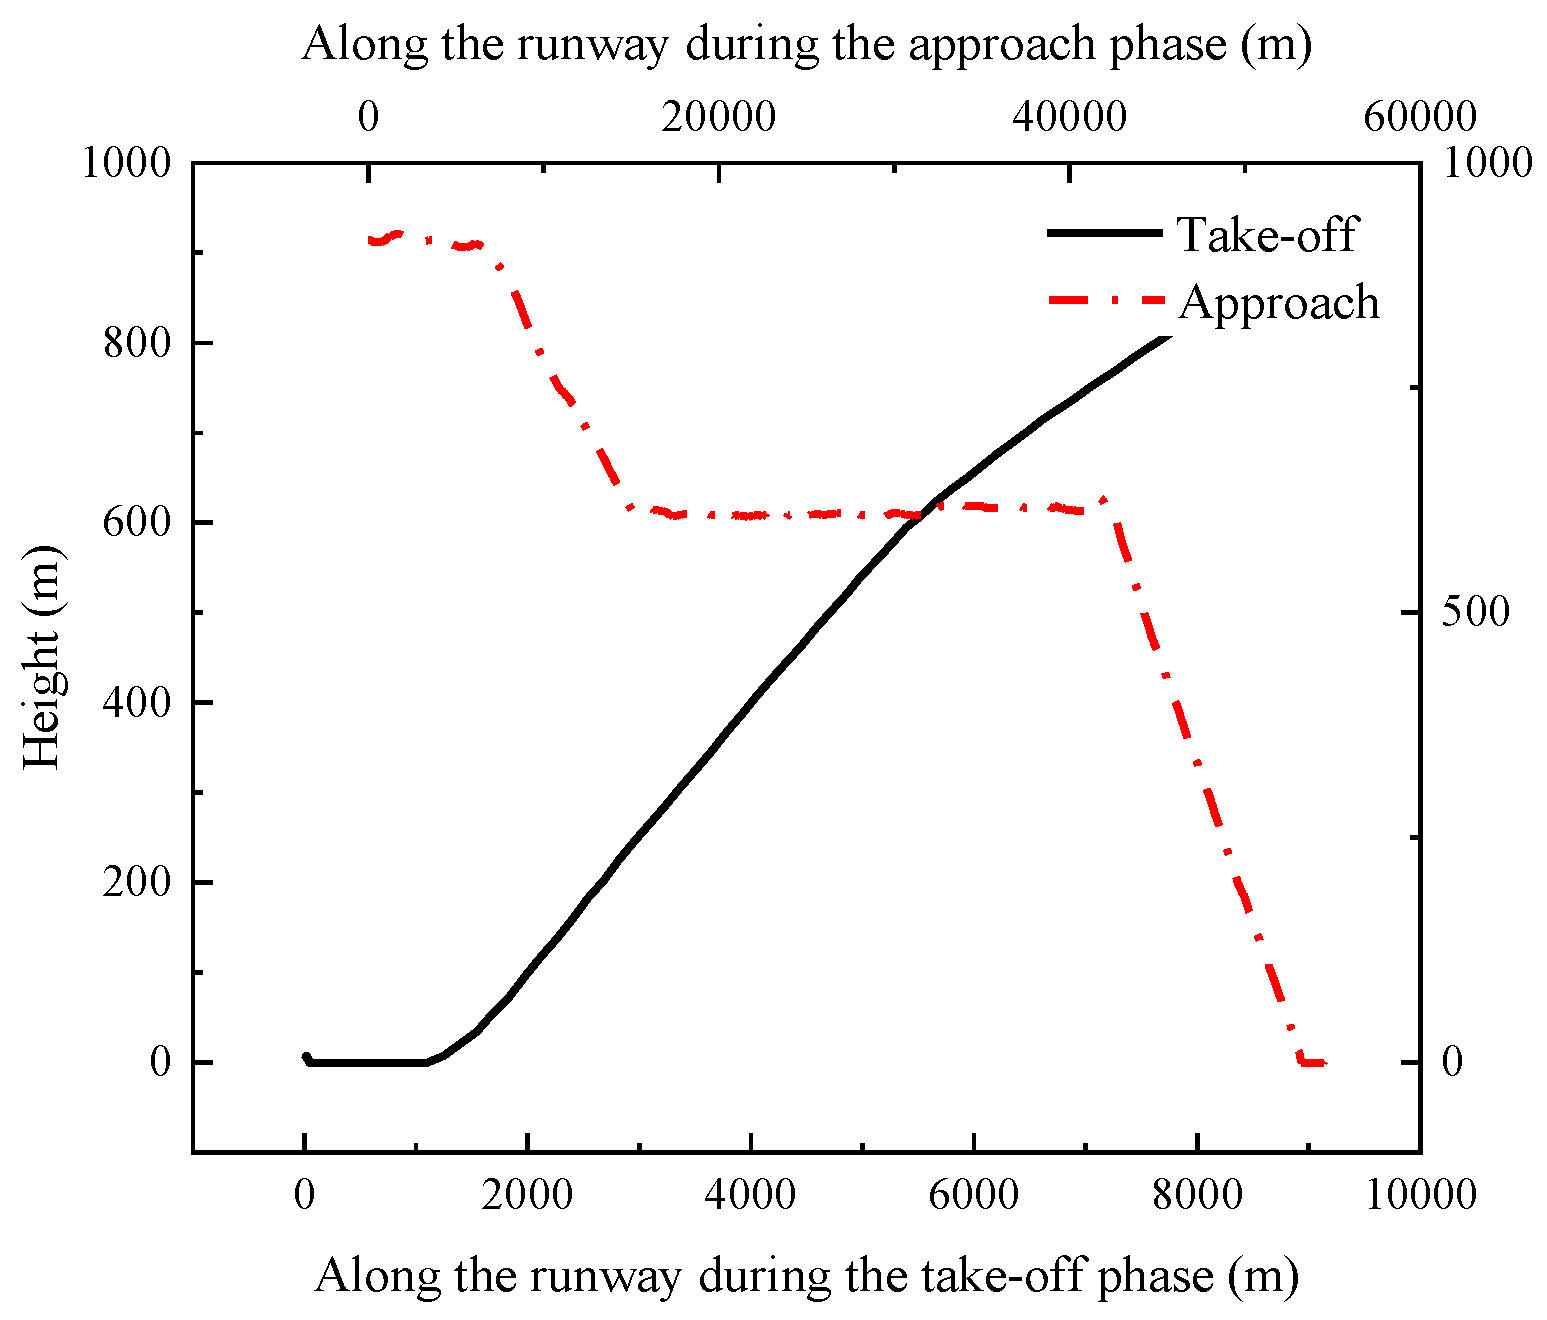
The emissions of various pollutants were determined by integrating the first-order approximation method with the emission database using the QAR data obtained from the flight of an Airbus A330-300 from Kansai Airport in Japan to Hongqiao Airport in Shanghai. The vertical trajectory during the LTO phase as recorded in the QAR data is shown in
Figure 5.
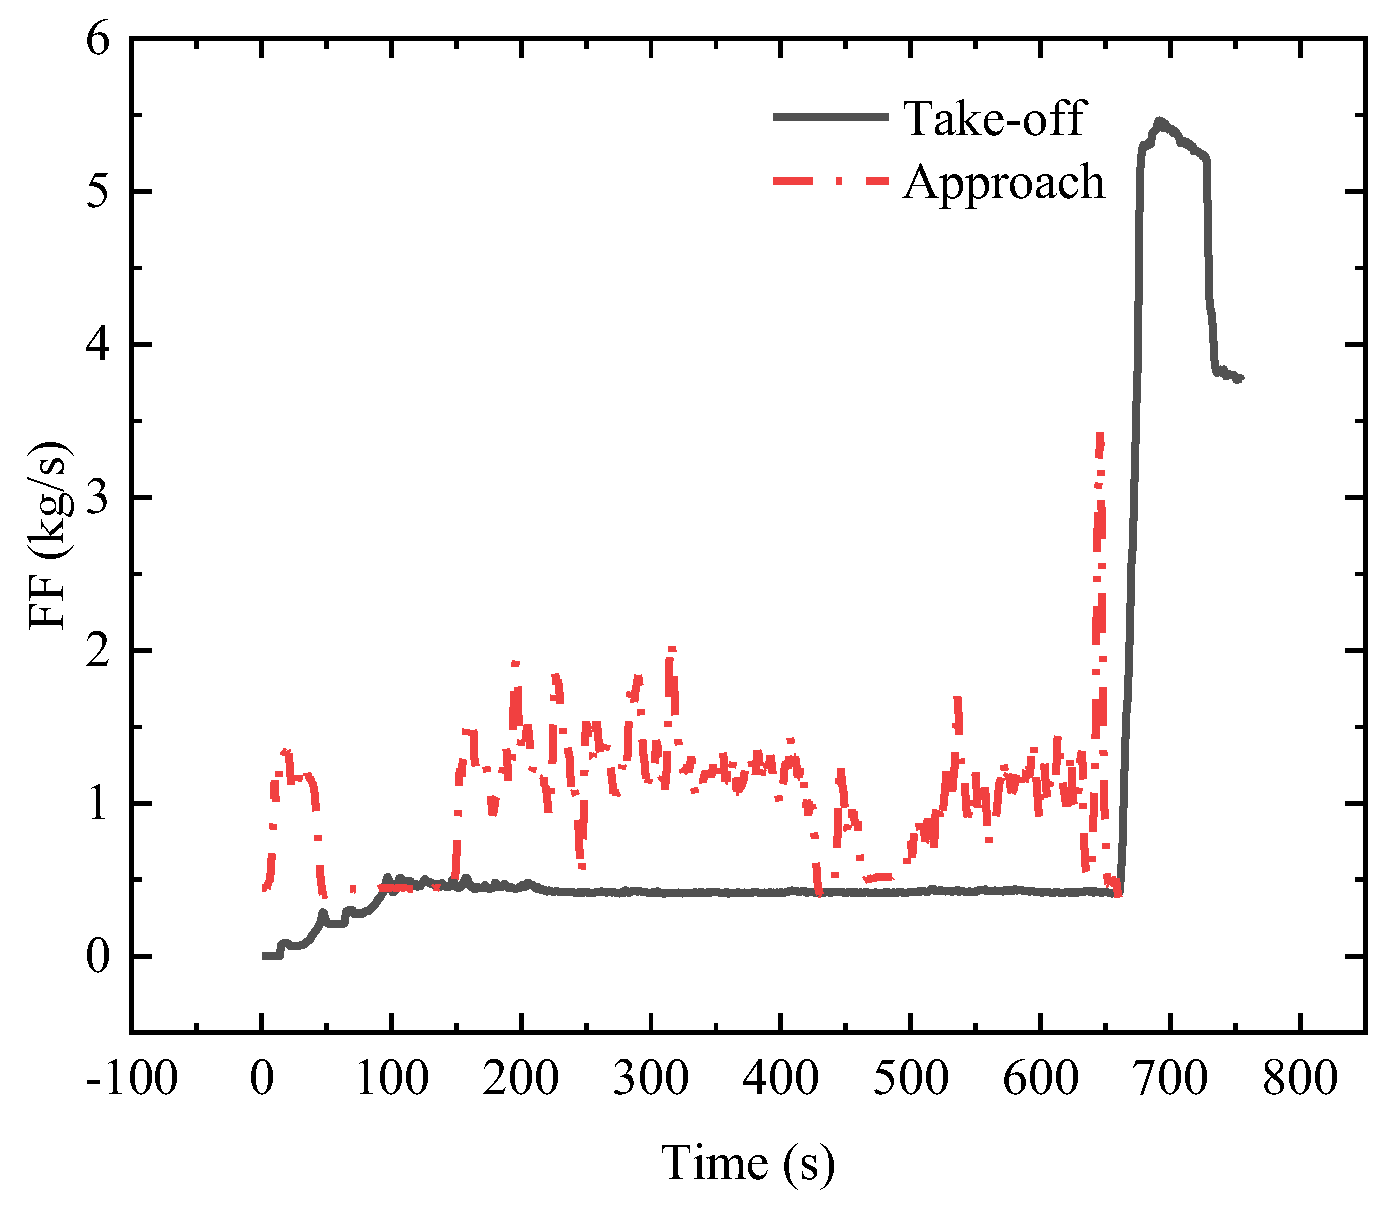
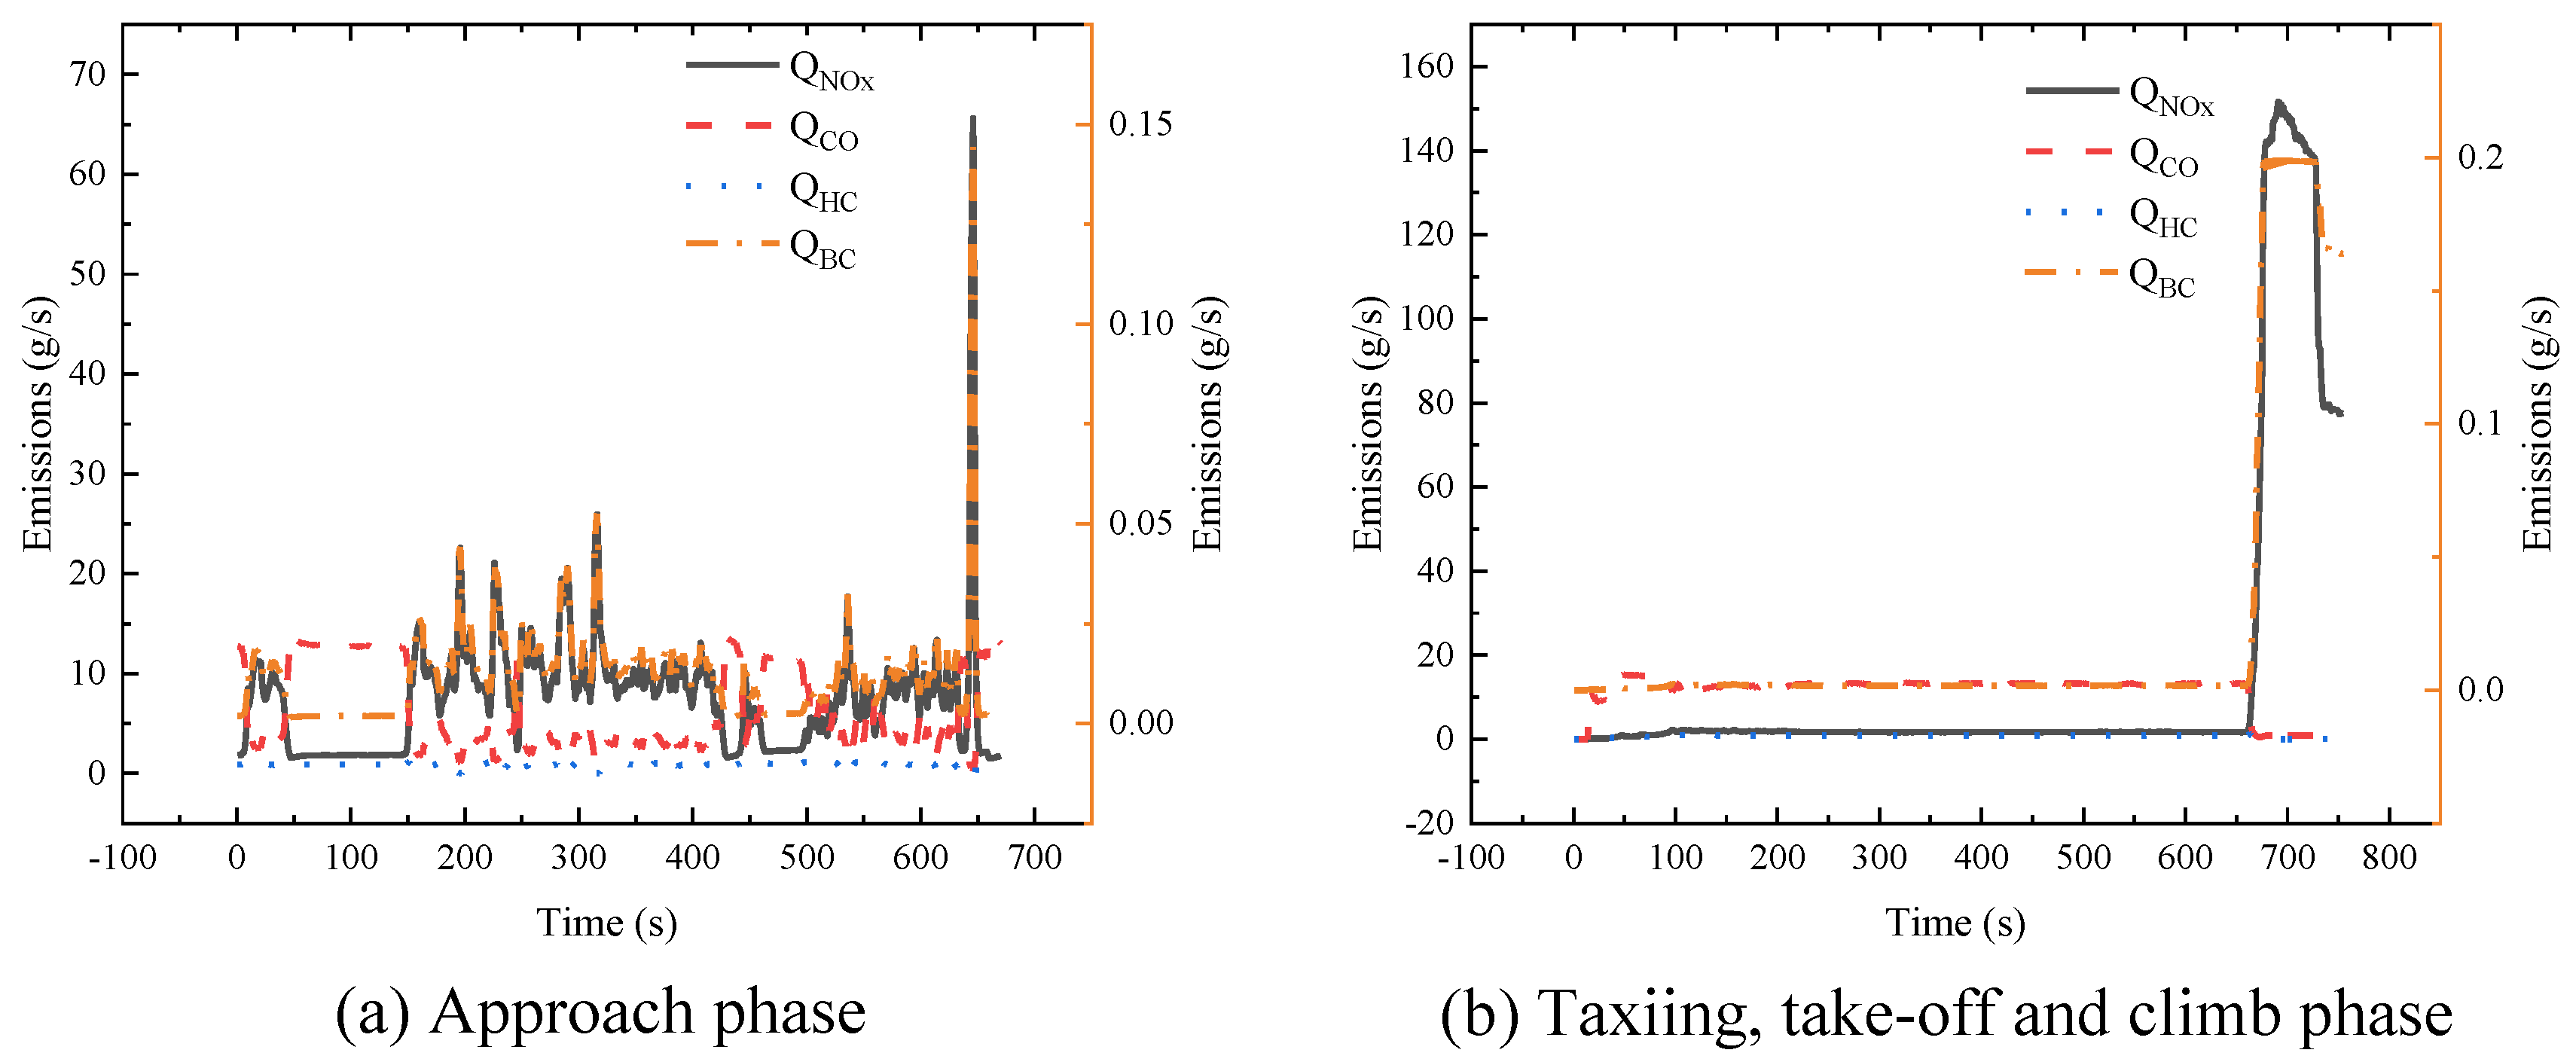
Figure 6 shows the fuel flow rate over time. It can be observed that the fuel flow rate during the approach phase exhibits greater fluctuations compared with the taxi, takeoff, and climb phases. The emission intensities of the LTO phase have been computed and are shown in
Figure 7.
Figure 7 reveals that HC and CO emissions were higher during the taxiing phase, whereas BC and NOx emissions were greater during the takeoff and climb phases. Because of the extended duration of the taxiing phase, the total emissions during this phase exceeded those during other phases.
Table 2 presents the aggregate emissions for each phase.
The data in the table indicate that the CO emissions for this flight during the taxiing phase amount to 8528.2 g, constituting 67.4% of the entire LTO cycle. Owing to the incomplete fuel combustion during the idle taxiing phase of the aircraft, the CO emissions in this phase are significantly higher than those in the other phases, consistent with the data shown in the table. The NOx emissions during the takeoff and climb phase totaled 6,265.4 g, which accounts for 38% of the entire LTO cycle. The high temperature prevailing in the engine combustion chamber during the takeoff and climb phases was identified as the cause of the substantial generation of NOx. However, because the taxi phase is significantly longer than the takeoff and climb phases, NOx emissions are more uniformly spread across the phases. The emission pattern for BC is similar to that of NOx, with a reasonably even distribution across each phase.
3.2. Pollutant Concentration Distribution
Particulate dispersion can be influenced by several parameters, including wind speed, wind direction, and temperature. Previous reseaech[
33,
34,
35] has shown that wind direction, wind speed, temperature gradient, and diffusion time are important determinants of dispersion. Therefore, this study focuses primarily on these factors.
3.2.1. Influence of Diffusion Time on Pollutant Distribution
Given the temporal variability of aircraft emissions and pollutant dispersion, this work specifically selected simulated moments at T=200s, 400s, and 600s to calculate the dispersion of gaseous pollutants in close proximity to the ground in these three instances. The specified parameters included a wind speed of 2 m/s, an atmospheric stability class of d, and a wind direction of -45°. The calculation results are shown in
Figure 8. Evidently, over time, the contaminants gradually dispersed in space and collectively moved slowly in the downwind direction. The central area shifted from 0 m to 1000 m in the y direction. Moreover, the concentration of pollutants in the central area also decreased progressively, from 0.18 mg/m
3 at 200 seconds to 0.08 mg/m
3 at 600 seconds.
3.2.2. Effect of Wind Direction and Wind Speed on Pollutant Distribution
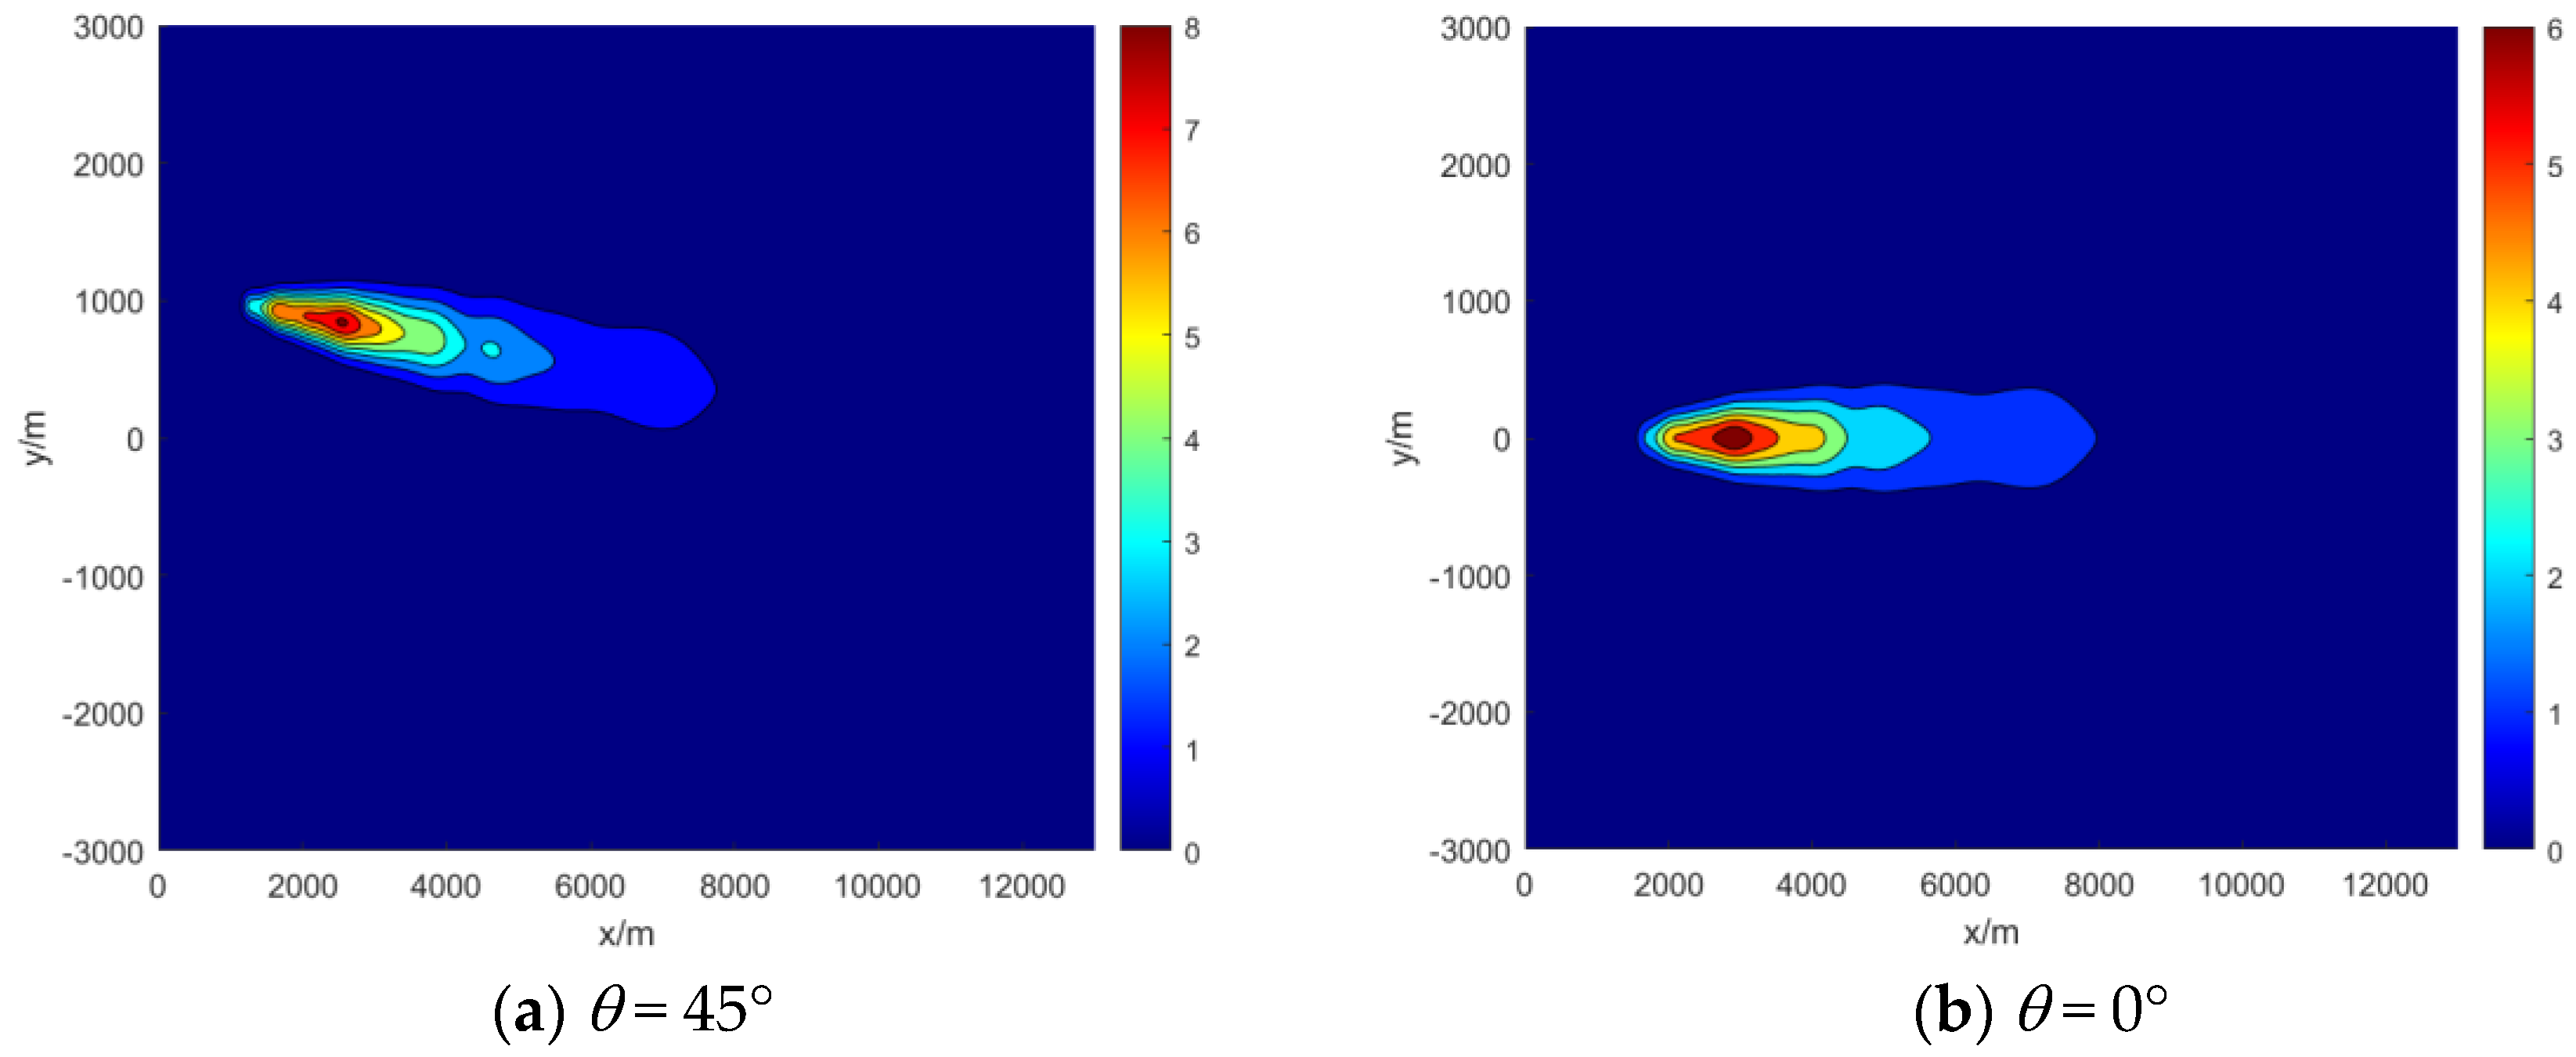
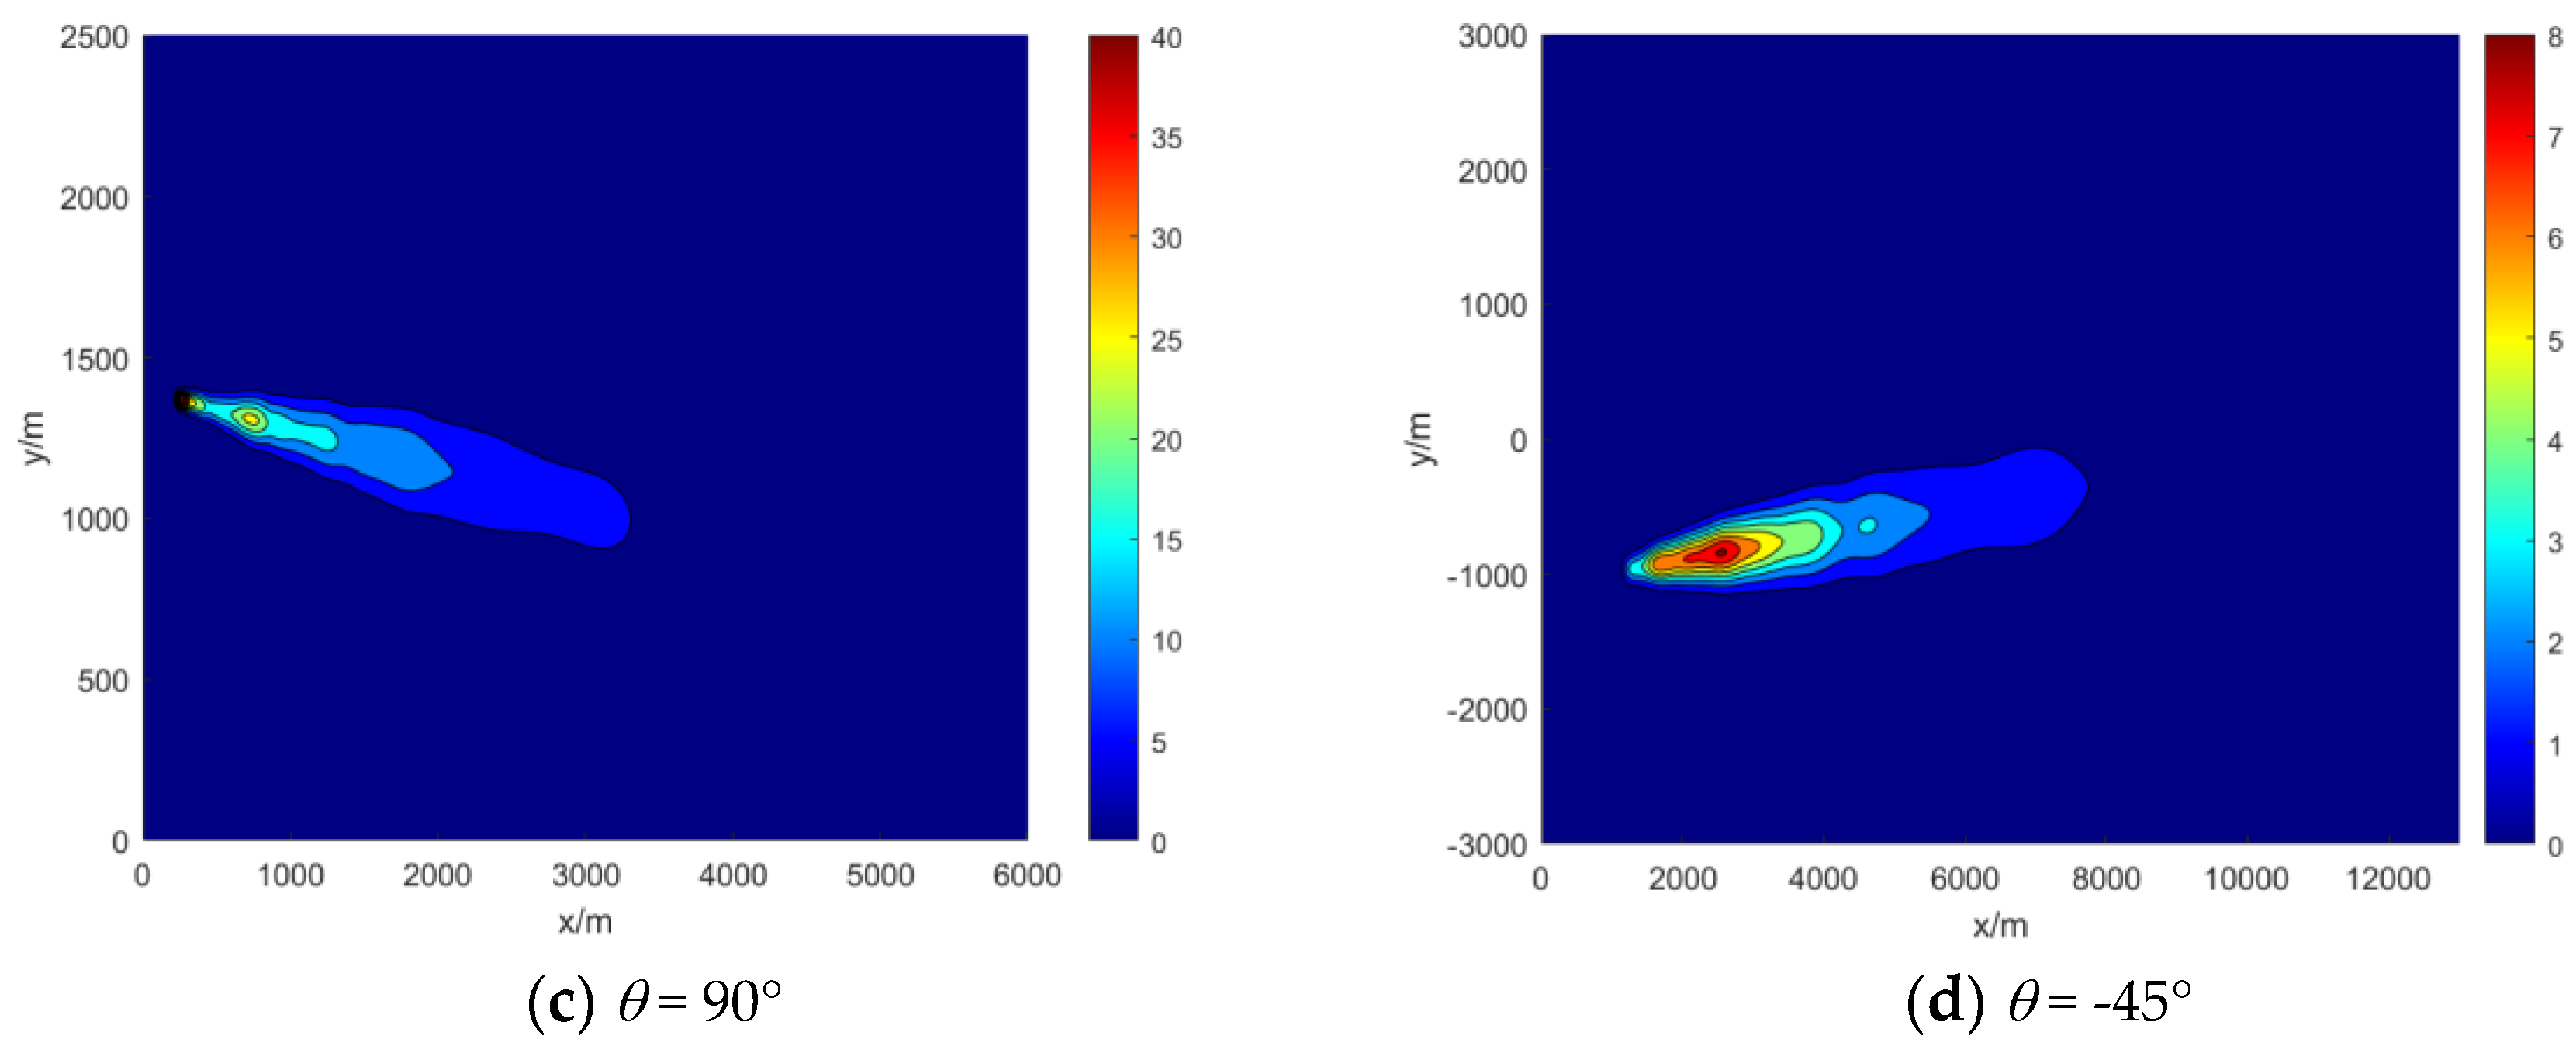
To investigate the diffusion distribution of pollutants under various wind directions, the study established four wind directions: -45°, 0°, 45°, and 90°. The primary calculation parameters included a wind speed of 2 m/s and a simulation time of 600 s. The dispersion for each wind direction was computed, and the results are shown in
Figure 9.
Figure 9 clearly demonstrates that the distribution of contaminants was extensively influenced by the direction of the wind. At a wind direction of 0°, the pollutants were mostly concentrated within the 3000–5000 m range along the x-axis. With wind directions of ±45°, the area of the highest pollutant concentration shifted away from the x-axis in the y-direction, and the densest central area was within the range of 2000 to 5000 m along the x-axis. In the case of a 90° wind direction, the area with the highest pollutant concentration was relatively concentrated because the pollutants were not influenced by the wind along the x-axis, and the overall concentration was also higher compared to other scenarios. Therefore, the wind direction plays a crucial role in the dispersion of pollutants. When implementing measures, such as pollutant monitoring and control, it is essential to first consider setting up monitoring points downwind to obtain more accurate monitoring data.
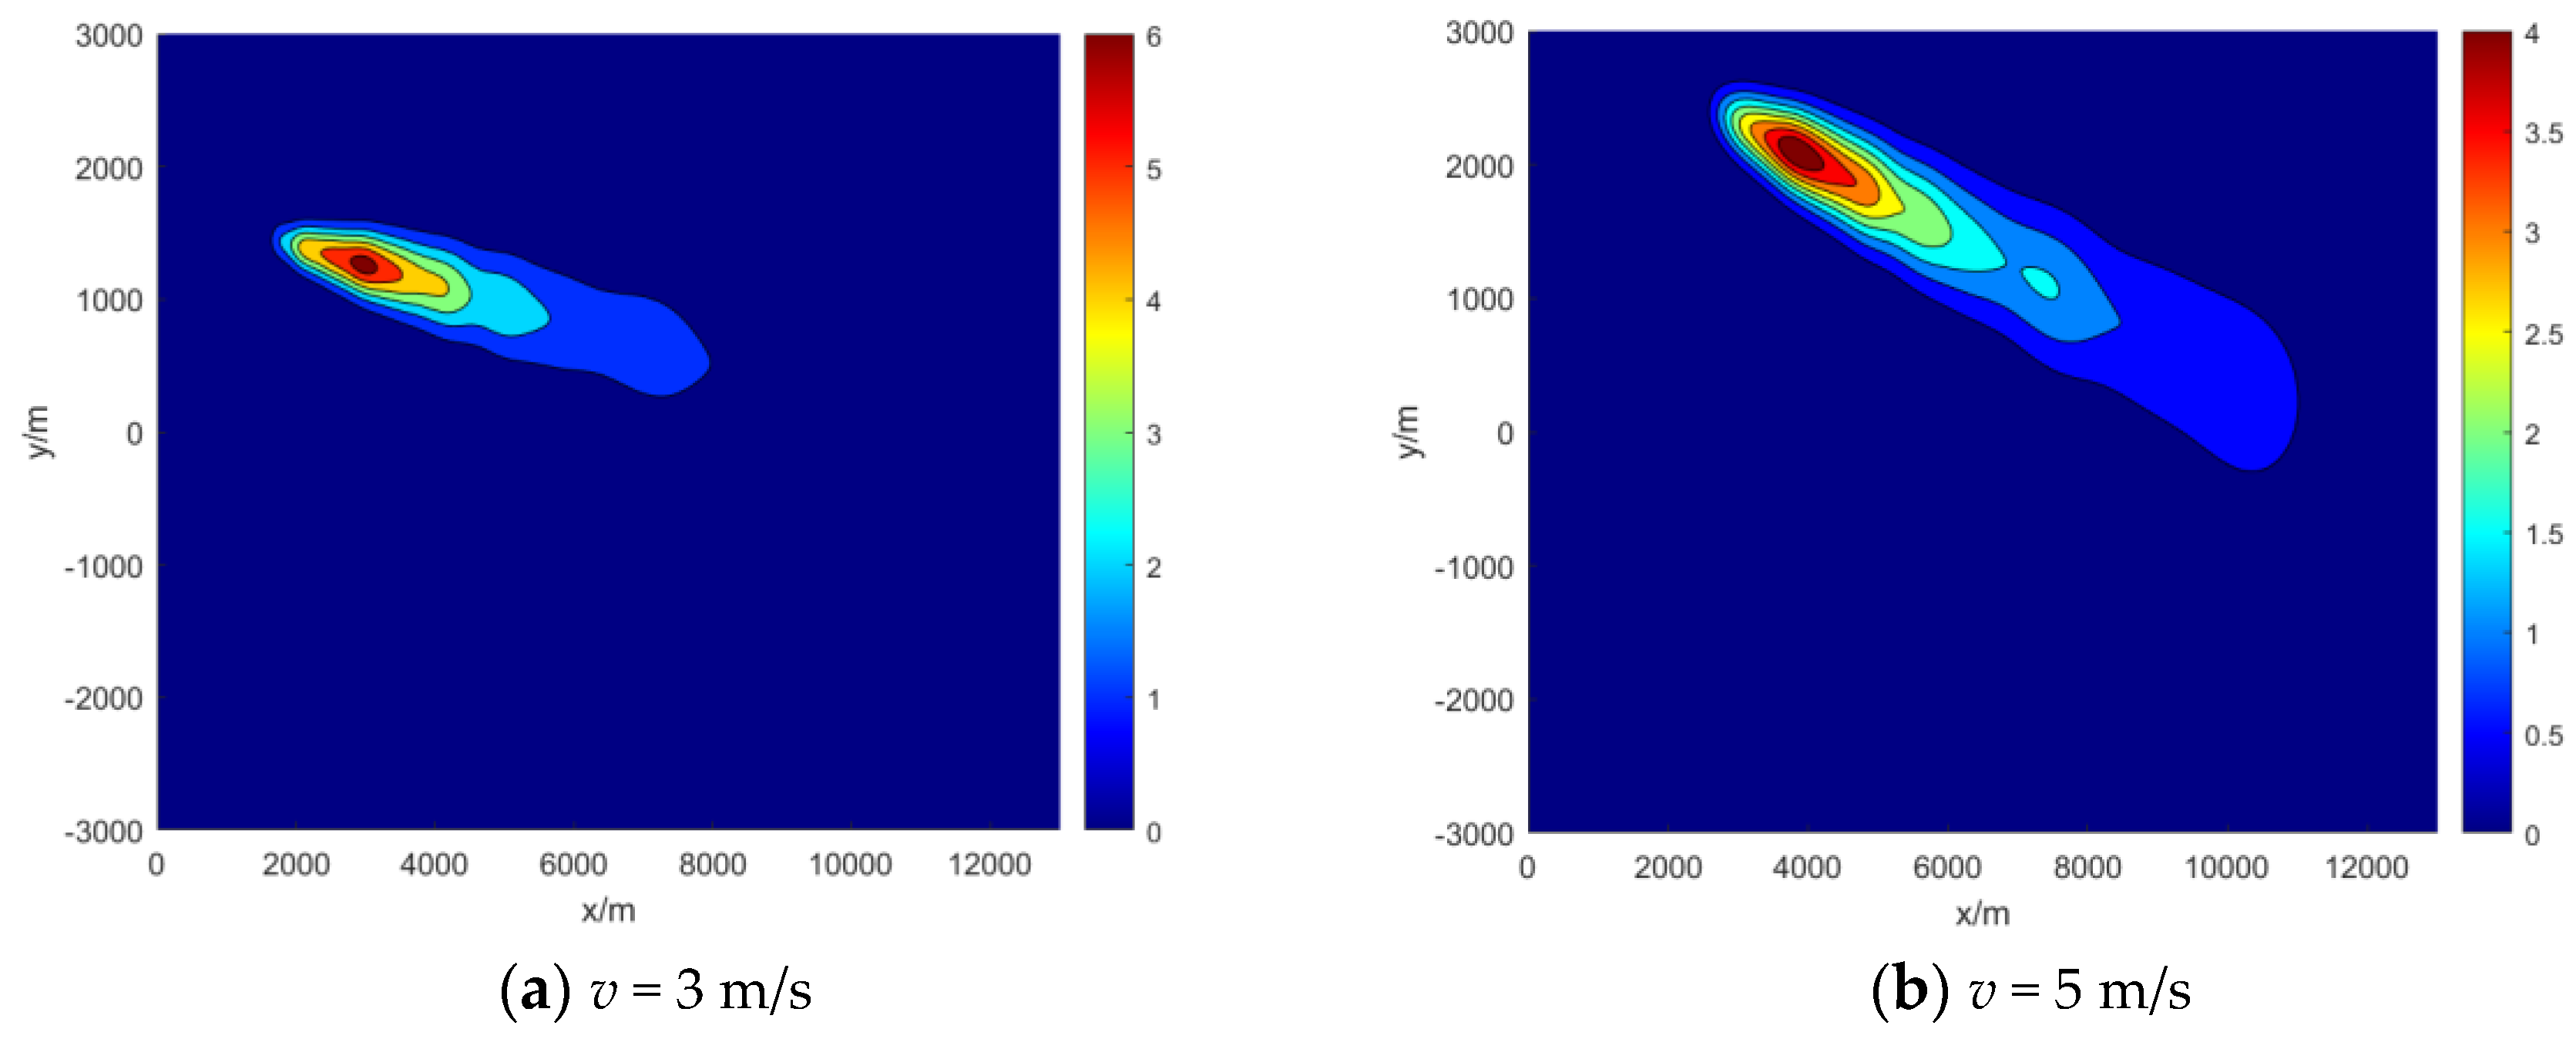
Similarly, to investigate the impact of wind speed on diffusion, simulations were conducted with wind speeds of 3 m/s and 5 m/s, while the wind direction was fixed at 45° for comparison with the scenario of 2 m/s wind speed. The calculation results are shown in
Figure 10.
Figure 10 clearly demonstrates that wind speed significantly affects the distribution of pollutants. Compared with the diffusion at a wind speed of 2 m/s, the distribution at a wind speed of 3 m/s showed a noticeable shift towards the downwind direction. At a wind speed of 5 m/s, the diffusion process saw notable downward movement and an increased distribution area in comparison to the previous two scenarios. Additionally, the concentration of pollutants reached its maximum level decreased by around 15%. This phenomenon can be attributed to the change in wind speed, which caused a more significant displacement of the pollutants emitted by the aircraft in the downwind direction. Consequently, there was a less overlap of the plumes from different locations, leading to a decrease in concentration.
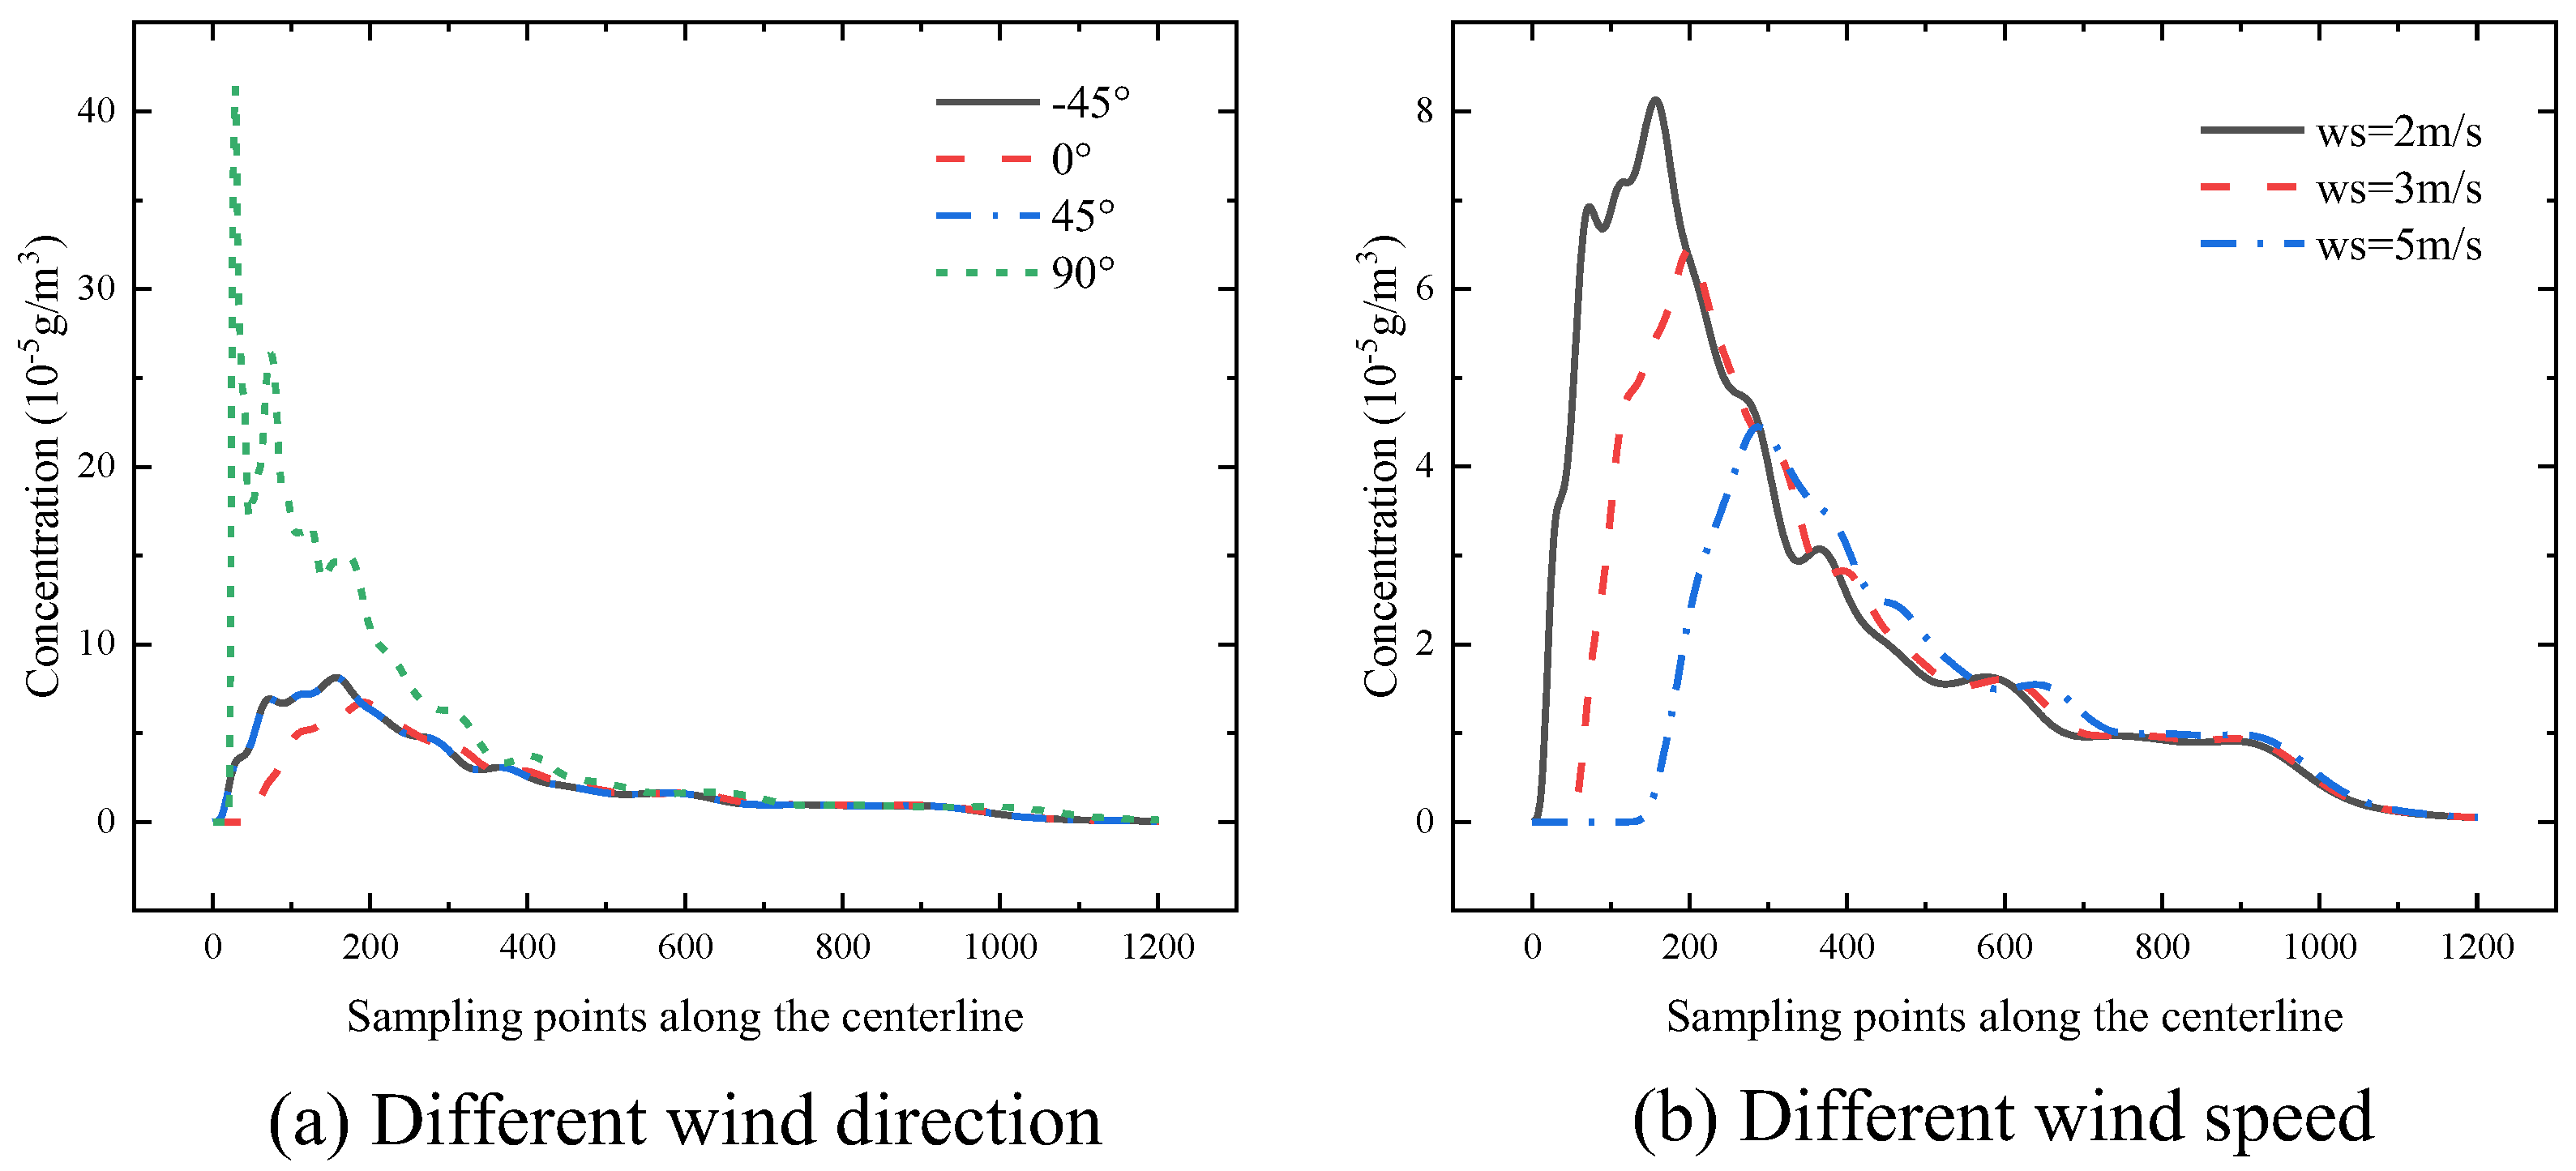
In order to further analyze and contrast the effects of different wind directions and speeds on pollutant concentrations, this study collected concentration data along the central axis of the pollutant accumulation area and depicted it as a curve graph, as shown in
Figure 11.
Figure 11(a) illustrates the variations in concentration along the centerline of the pollutant accumulation area for different wind directions. It is evident that the highest pollutant concentration is significantly greater in the case of a 90° wind direction than in the other cases. The concentration curves for wind directions 45°and -45°overlap, likely due to their symmetry in the computational domain. The lowest concentration curve is found in the case of a 0°wind direction. Considering the relationship between the wind direction and the direction of movement of the emission source, it can be concluded that when the wind direction is consistent with the direction of movement, it is more conducive to reducing the concentration of pollutants in the area where they converge, while the opposite leads to the aggregation of pollutants.
Figure 11(b), on the other hand, demonstrates the effect of different wind speeds on the concentration profiles. It is clear that larger wind speeds result in a significant decrease in pollutant concentration and cause a delay in the peak pollutant concentration.
3.2.3. Effect of Temperature Gradient on Pollutant Distribution
Temperature gradients significantly influence the atmospheric dispersion. The temperature gradient refers to the change in temperature per unit distance perpendicular to the direction of the runway surface and is frequently used to characterize the rate of temperature change with altitude in the atmosphere. The relationship between the temperature gradient and atmospheric stability is intimate, as the vertical distribution of temperature directly impacts vertical movement and turbulent mixing within the atmosphere, which in turn determines atmospheric stability.
The Richardson number is a critically important metric for evaluating atmospheric stability as it quantifies the impact of the temperature gradient on atmospheric stability. The Richardson number may be mathematically represented as
where
is the Richardson number;
g is the acceleration due to gravity;
is the potential temperature (in the atmosphere) or potential density (in the ocean);
z is the vertical altitude; u is the horizontal wind speed;
represents the vertical gradient of the potential temperature (or potential density); and
represents the vertical shear of the wind speed.
A higher Richardson number indicates a more stable atmosphere, meaning that the air layers are less likely to mix owing to their stable temperature profiles. Conversely, a lower Richardson number indicates a less stable atmosphere, which is more prone to turbulent mixing. Kiefer M. T.[
36] built upon the research of Mohan and Siddiqui[
37] to establish a correlation between the Richardson number and Pasquill stability classification, as follows:
Table 3.
Ri limits for Pasquill stability classification.
Table 3.
Ri limits for Pasquill stability classification.
| Pasquill stability class |
Richardson number |
| a |
|
| b |
|
| c |
|
| d |
|
| e |
|
| f |
|
The simulation results for dispersion under the Pasquill stability classes a, b, c, d, e, and f (ranging from extremely unstable to stable) are as follows:
As shown in
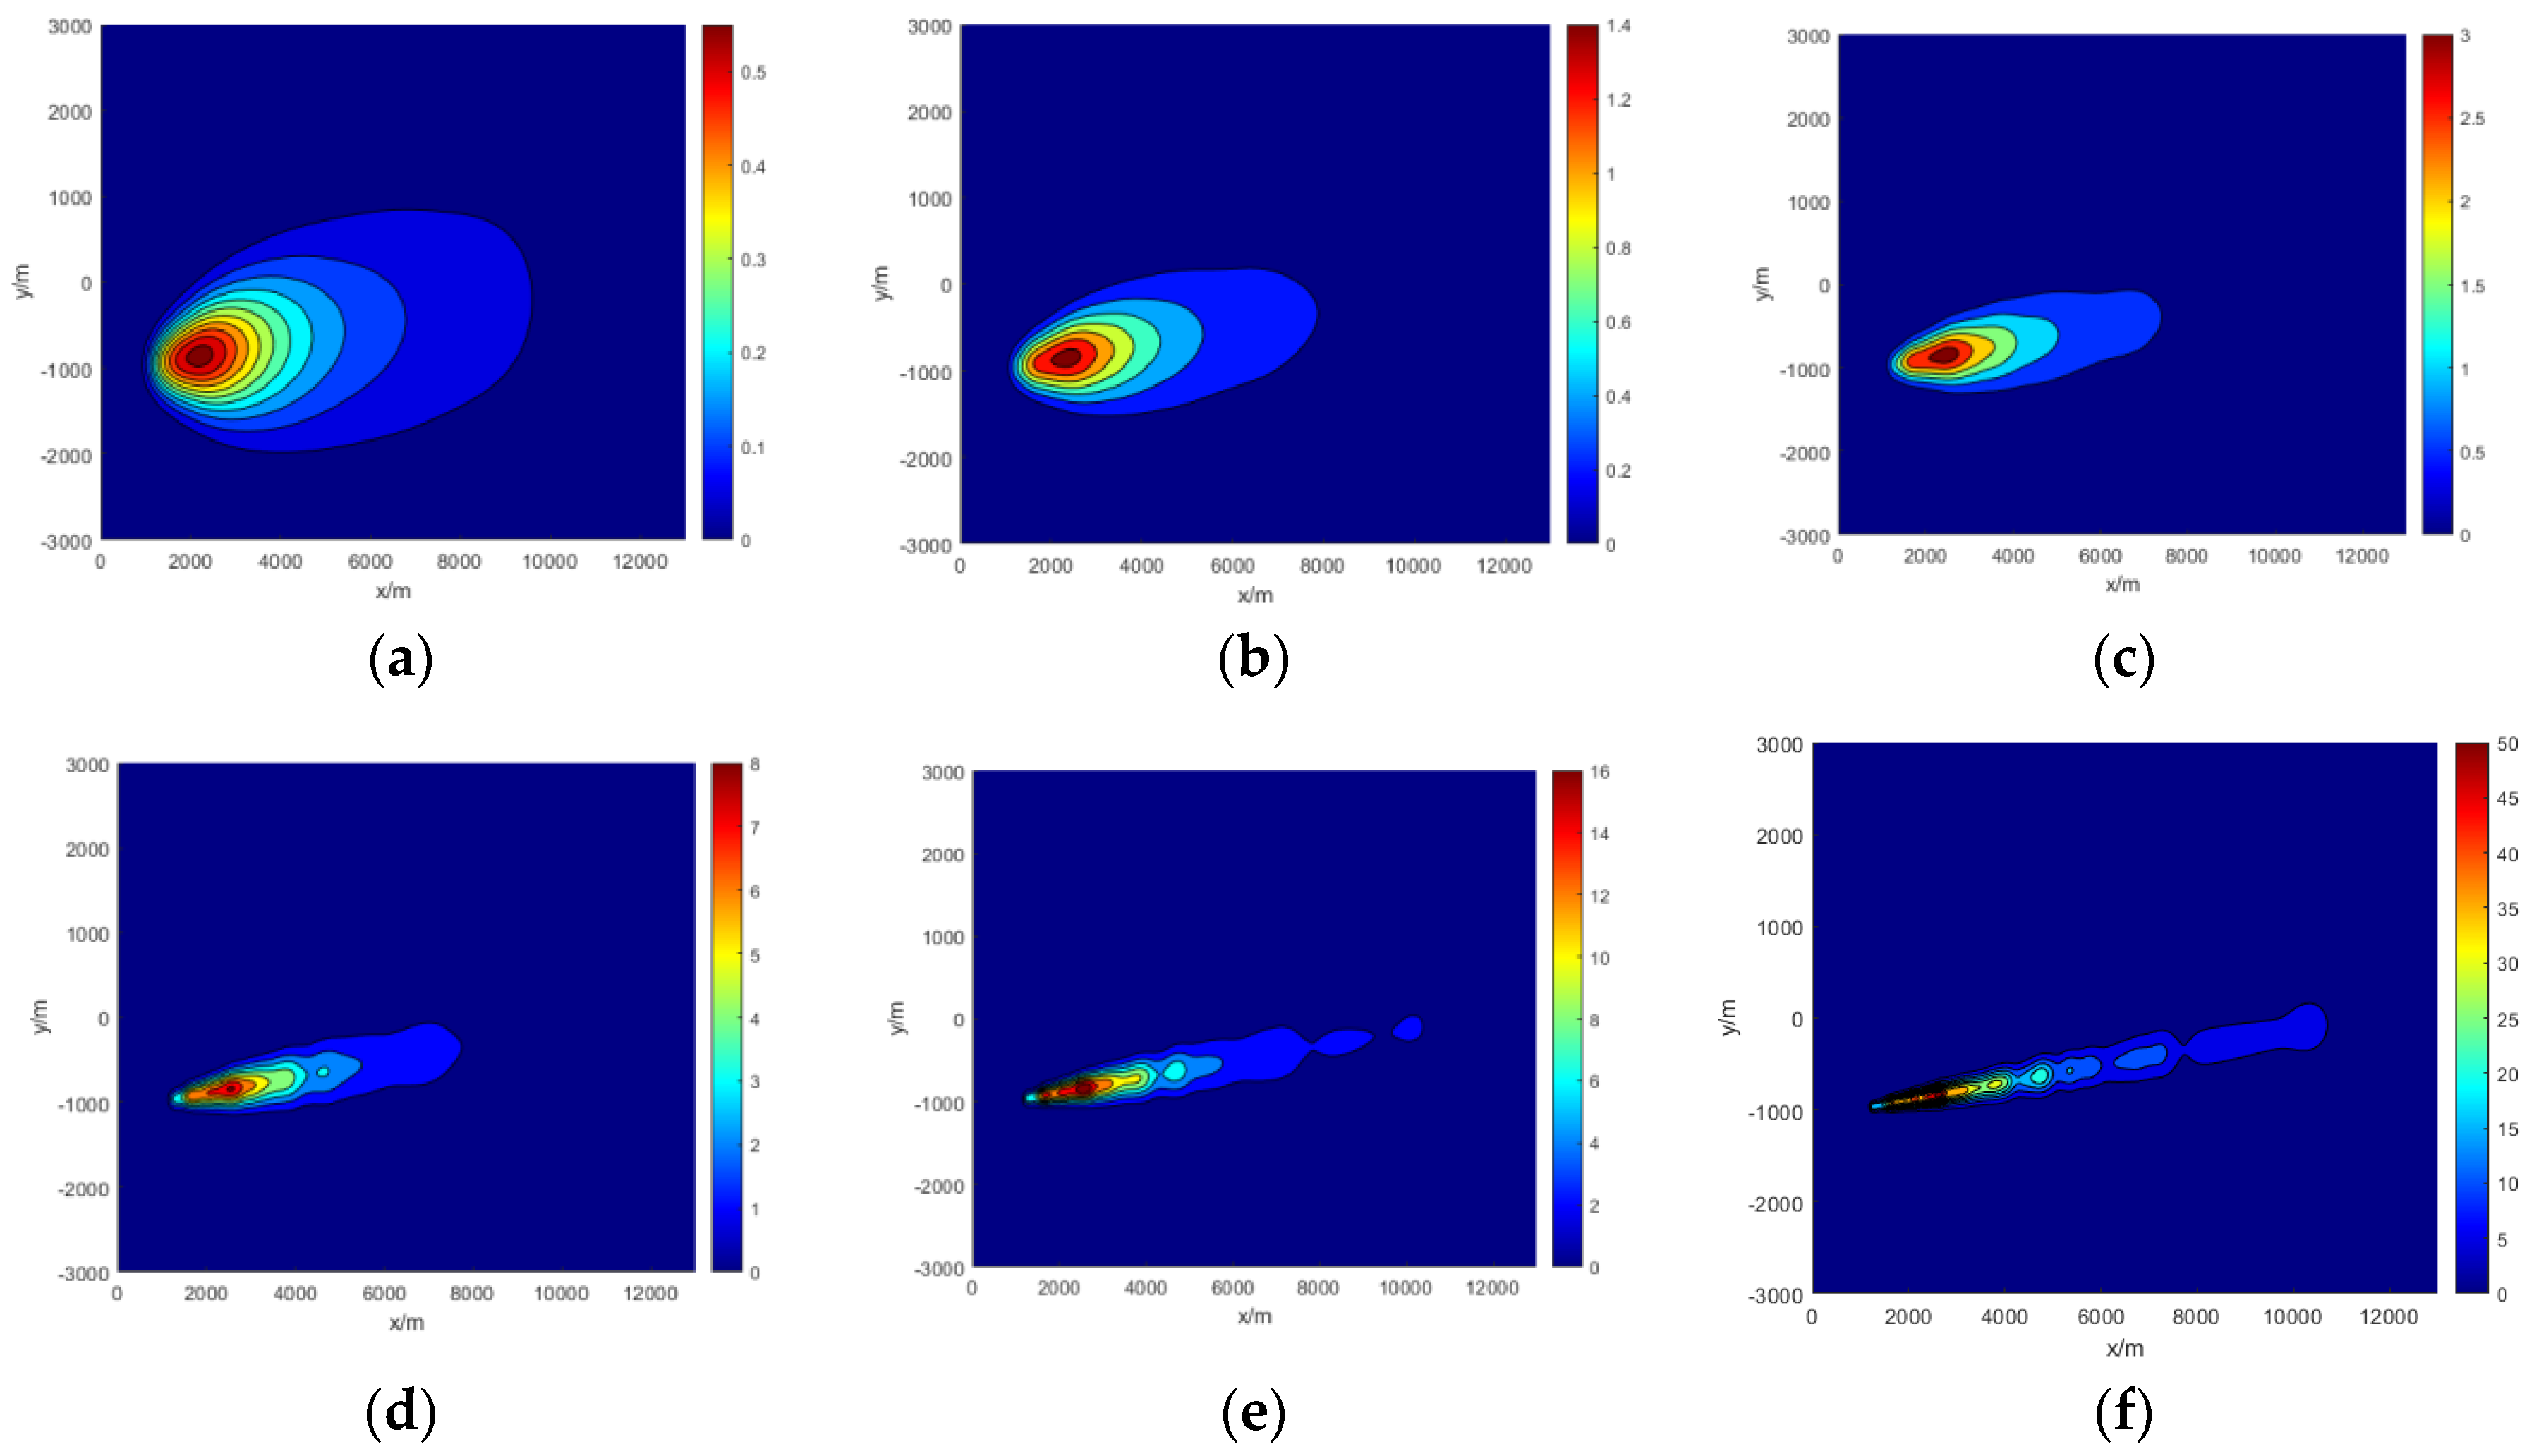
Figure 12, there were distinct variations in the dispersion of pollutants as the atmospheric stability shifted. Turbulence is intensified under unstable atmospheric circumstances, driving the horizontal dispersion of contaminants and facilitating the dilution of their concentration. Conversely, under neutral atmospheric stability, the dispersal of pollutants was more evenly distributed. In a stable atmosphere, the horizontal spread of pollutants is reduced, leading to a concentration accumulation at the source of emission. This accumulation has the potential to cause a significant rise in concentration, possibly by several orders of magnitude.
3.2.4. Effect of Sedimentation on Pollutant Distribution
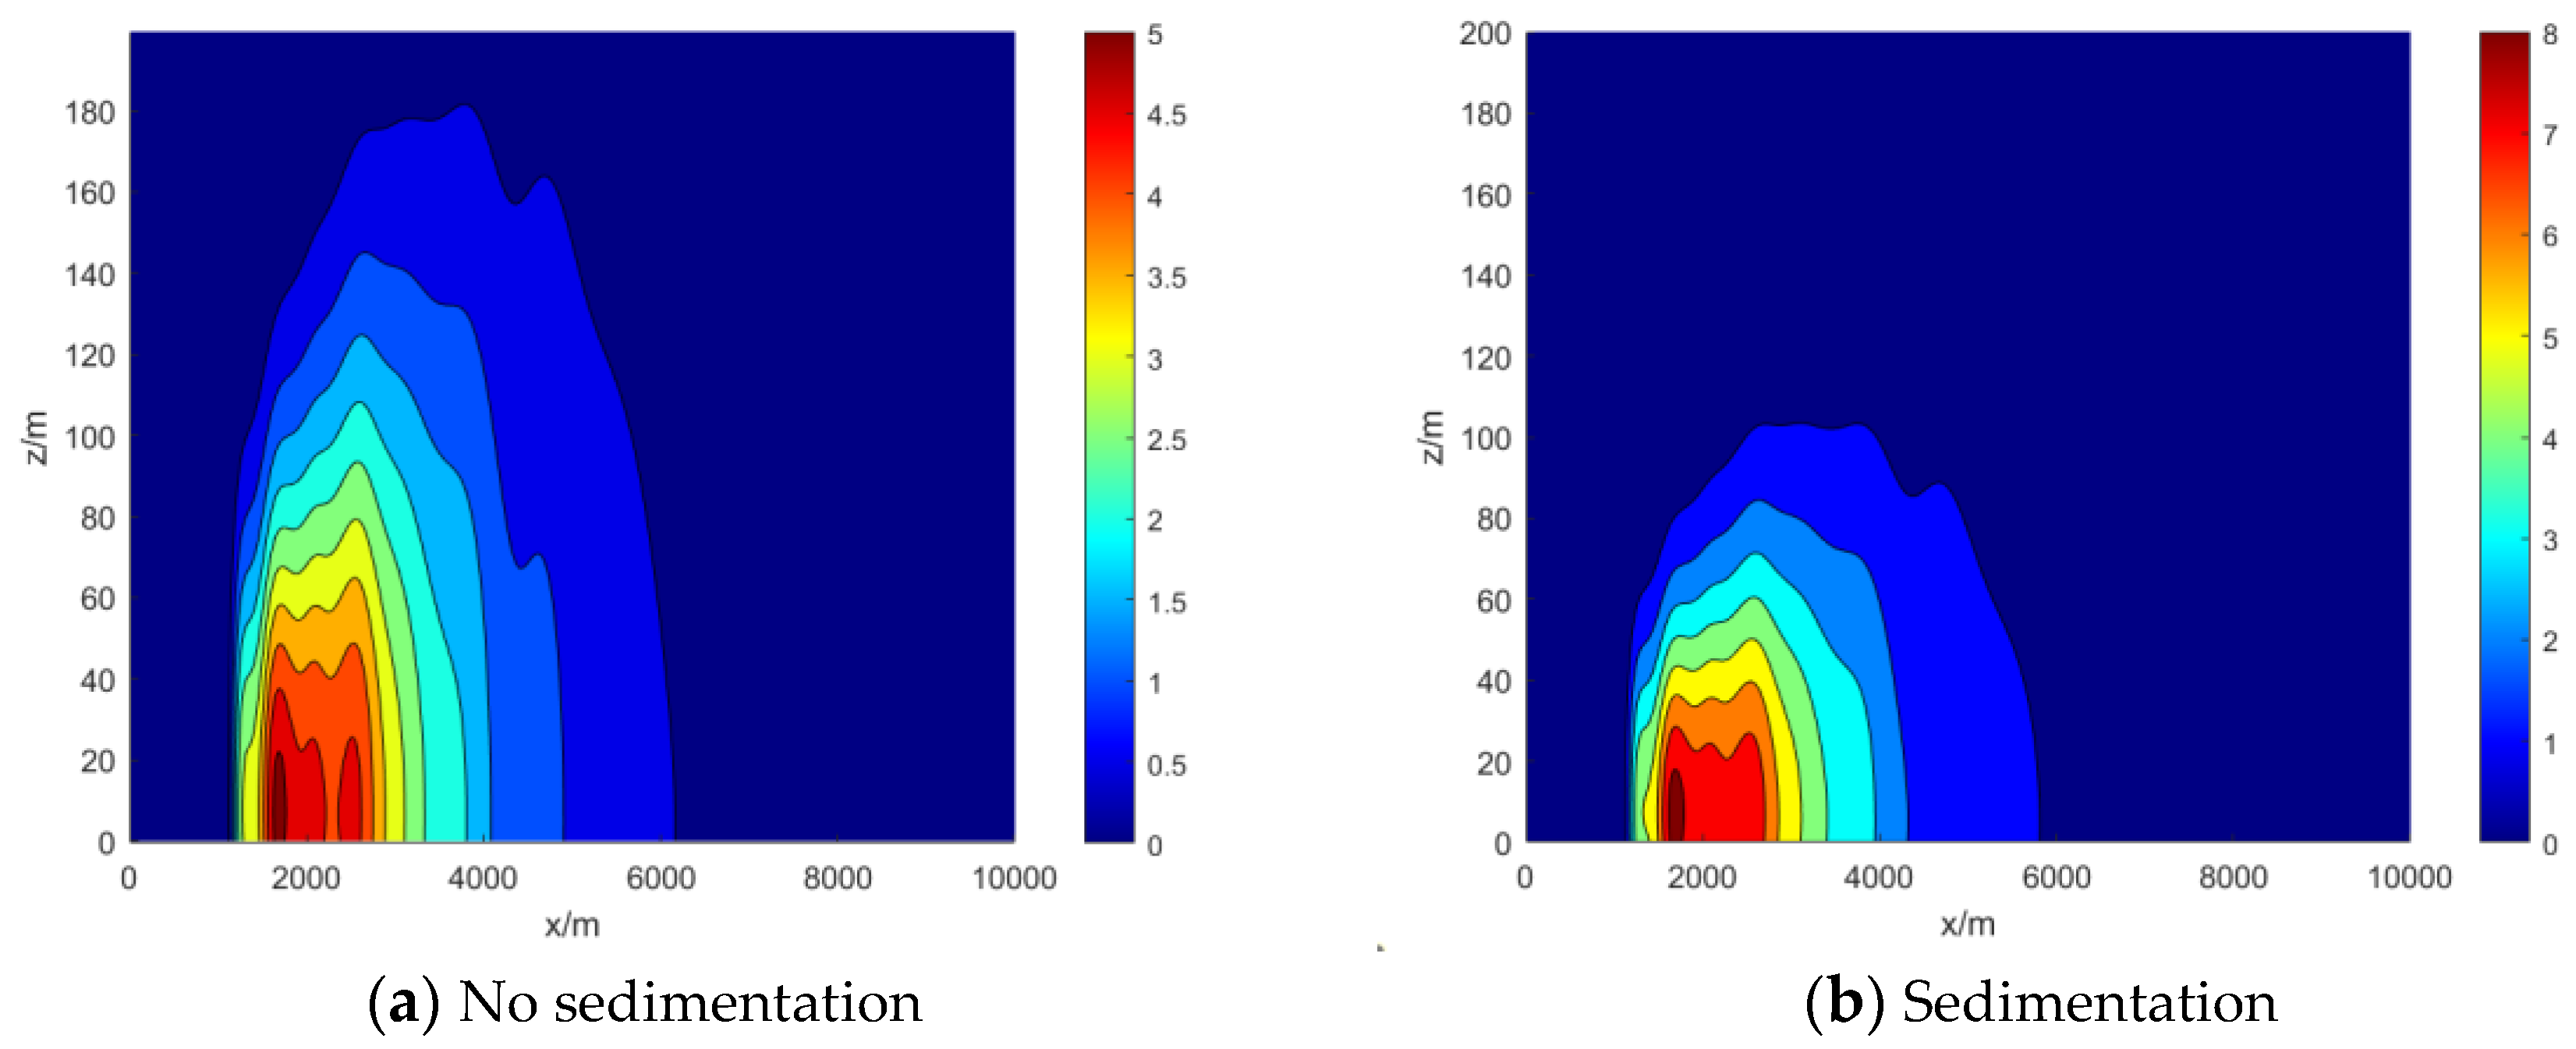
Upon taking into account the settling velocity of particulate matter, the concentration distribution in the longitudinal plane of the particle material showed a notable alteration in comparison to that of the polluted gas independent of the settling velocity. To facilitate the analysis, the study selected conditions with a wind speed of 2 m/s, wind direction of 45°, diffusion time of 600 s, and focus on the y = 500m axis in the longitudinal concentration distribution. The specific distributions are shown in
Figure 13.
As depicted in
Figure 13, the maximum ground-level concentration of particulate matter was approximately 0.05 mg/m
3 when sedimentation was not taken into account. However, after considering sedimentation, the highest ground-level concentration came to around 0.08 mg/m
3. This indicates that sedimentation significantly affects the distribution of particulate matter in the longitudinal plane. The overall distribution of pollutants exhibited a declining deposition pattern, with the area closest to the surface having notably greater concentration. Consequently, when calculating the diffusion concentration distribution of pollutants, it is important to take into account the deposition of pollutants as a relevant factor that greatly affects the health of inhabitants.
4. Conclusions
This study estimated the emission and dispersion of several pollutants on a single flight in the LTO cycle using flight QAR data to derive the actual fuel consumption statistics of an airplane and suggested a pollutant dispersion model for moving point sources. The following conclusions were drawn from the example calculations:
1) Differences in wind direction can lead to different distributions of pollutants, and wind speed plays a crucial role in the accelerated dispersion and long-distance movement of pollutants. Vigorous wind conditions accelerate the dispersal of pollutants; however, the concentration of contaminants in close proximity to the surface may be reduced. For instance, when the wind speed increased by 2m/s, the concentration in the central zone decreased by approximately 15% of the original value under a specific situation. This illustrates the dual role of wind conditions in environmental assessment.
2) Different temperature gradients lead to varying levels of atmospheric stability, which in turn affect the dispersion of pollutants. In an unstable atmosphere, pollutants are readily dispersed, but ground-level concentrations are diminished. Conversely, in a stable atmosphere, pollutants tend to accumulate, leading to an increase in the concentration and potential degradation of the air quality.
3) The overall vertical diffusion of particulate matter exhibited a declining pattern, leading to an increase in its concentration in the ground area from 0.05 mg/m3 to 0.08 mg/m3, taking into account the impact of particulate matter sedimentation. It suggests that the influence of deposition on the environment and public health should not be ignored.
Pollutant dispersion modeling using mobile point sources enables rapid and straightforward calculation of pollutant dispersion from flight emissions. This modeling can also be applied to estimate the dispersion of pollutants from all flights at a single airport over time, so providing a more comprehensive assessment of the impact on the airport environment.
Acknowledgment: The authors are grateful for the support of the Sichuan Science and Technology Program (No.2024NSFSC0875) and the Fundamental Research Funds for the Central Universities (No.J2023-008).
Author Contributions
Junli Yang: Conceptualization; Supervision (equal); writing – original draft (equal). Likun Li: Writing – original draft (equal); software. Xiaoyu Zheng: Investigation (equal); data curation (equal). Hang Liu: Investigation (equal); data curation (equal). Fengming Li: Data curation (equal). Yi Xiao: Supervision (equal); writing – review and editing (equal).
Data Availability
The data supporting the findings of this study are available from the corresponding author upon reasonable request.
Conflicts of Interest
The authors have no conflicts to disclose.
References
- Masiol, M.; Harrison, R. M.,Aircraft engine exhaust emissions and other airport-related contributions to ambient air pollution: A review. Atmospheric Environment 2014, 95, 409-455.
- D.S. Lee, D. W. F., P.M. Forster,Aviation and Global Climate Change in the 21st Century. Atmospheric Environment 2009, 43 (22-23), 3520-3537.
- FAA, Aviation Emissions, Impacts & Mitigation A Primer. FAA office of Environment and Energy: Washington, DC, USA, 2015.
- Sutkus, D. J.; Baughcum, S. L.; Dubois, D. P. Scheduled Civil Aircraft Emission Inventories for 1999: Database Development and Analysis; NASA/CRm2001-211216; 2001.
- Rituraj, N.; Kumar, T. A.,The Toxicological Mechanisms of Environmental Soot (Black Carbon) and Carbon Black: Focus on Oxidative Stress and Inflammatory Pathways. Frontiers in Immunology 2017, 8, 763.
- Wayson, R. L.; Fleming, G. G.; Lovinelli, R.,Methodology to estimate particulate matter emissions from certified commercial aircraft engines. Journal of the Air & Waste Management Association 2009, 59 (1), 91-100. [CrossRef]
- Orhan, I.,Passenger aircraft emissions analysis at Ordu-Giresun International Airport, Turkey in 2017. Aircraft Engineering and Aerospace Technology 2021, 93 (4), 682-689.
- Lobo, P.; Hagen, D. E.; Whitefield, P. D.; Raper, D.,PM emissions measurements of in-service commercial aircraft engines during the Delta-Atlanta Hartsfield Study. Atmospheric Environment 2015, 21 (5), 237-245. [CrossRef]
- Yu, J. L.; Jia, Q.; Gao, C.; Hu, H. Q.,Air pollutant emissions from aircraft landing and take-off cycles at Chinese airports. Aeronautical Journal 2021, 125 (3), 578-592. [CrossRef]
- Xu, H.; Xiao, K.; Cheng, J.; Yu, Y.; Liu, Q.; Pan, J.; Chen, J.; Chen, F.; Fu, Q.,Characterizing aircraft engine fuel and emission parameters of taxi phase for Shanghai Hongqiao International Airport with aircraft operational data. Science of The Total Environment 2020, 720, 137431. [CrossRef]
- Sheikhi, M. R.; Aygun, H.,Assessment of emission and environmental parameters of different commercial high by-pass turbofan engines throughout landing and take-off cycle. Environmental Progress & Sustainable Energy 2022, 42 (1). [CrossRef]
- Liang, M.; Chao, Y.; Tu, Y.; Xu, T.,Vehicle Pollutant Dispersion in the Urban Atmospheric Environment: A Review of Mechanism, Modeling, and Application. 2023, 14 (2), 279. [CrossRef]
- Leelőssy, Á.; Molnár, F.; Izsák, F.; Havasi, Á.; Lagzi, I.; Mészáros, R.,Dispersion modeling of air pollutants in the atmosphere: a review. 2014, 6 (3), 257-278.
- Wedding, J.; Lombardi, D. J.; Cermak, J.,A Wind Tunnel Study of Gaseous Pollutants in City Street Canyons. Journal of the Air Pollution Control Association: A Monthly Journal Devoted to Air Management 1977, 27 (6), 557-566.
- Ehm, C.; Frohmüller, M. O.; Flassak, T.; Stephan, D.,On-site reduction of nitrogen oxides at an emission hotspot using actively vented photocatalytic reactors in a highway tunnel. SN Applied Sciences 2022, 4. [CrossRef]
- Li, J.; Yu, Y.; Wang, Y.; Zhao, L.; He, C.,Prediction of Transient NOx Emission from Diesel Vehicles Based on Deep-Learning Differentiation Model with Double Noise Reduction. 2021, 12 (12), 1702. [CrossRef]
- Sun, D. J.; Wu, S.; Shen, S.; Xu, T.,Simulation and assessment of traffic pollutant dispersion at an urban signalized intersection using multiple platforms. Atmospheric Pollution Research 2021, 12 (7), 101087. [CrossRef]
- Wang, H.; Furtak-Cole, E.; Ngan, K.,Fast Models for Predicting Pollutant Dispersion inside Urban Canopies. 2023, 14 (9), 1337. [CrossRef]
- Gan, L.; Lu, T.; Shu, Y.,Diffusion and Superposition of Ship Exhaust Gas in Port Area Based on Gaussian Puff Model: A Case Study on Shenzhen Port. 2023, 11 (2), 330. [CrossRef]
- Micallef, A.; Micallef, C.,The Gaussian Plume Model Equation for Atmospheric Dispersion Corrected for Multiple Reflections at Parallel Boundaries: A Mathematical Rewriting of the Model and Some Numerical Testing. 2024, 6 (3), 48. [CrossRef]
- Kuzu, S. L.,Estimation and dispersion modeling of landing and take-off (LTO) cycle emissions from Atatürk International Airport. Air Qual Atmos Health 2018, 11, 153-161. [CrossRef]
- Makridis, M.; Lazaridis, M.,Dispersion modeling of gaseous and particulate matter emissions from aircraft activity at Chania Airport, Greece. Air Quality Atmosphere and Health 2019, 12 (8), 933-943. [CrossRef]
- Kurtenbach, R.; Zaporozhets, O.; Wiesen, P.; Synylo, K.,Comparison between modelled and measured NOX concentrations in aircraft plumes at Athens International Airport. International Journal of Sustainable Aviation 2017, 3 (4), 279.
- Synylo, K.; Krupko, A.; Zaporozhets, O.; Makarenko, R.,CFD simulation of exhaust gases jet from aircraft engine. Energy 2020, 213, 118610. [CrossRef]
- Pecorari, E.; Mantovani, A.; Franceschini, C.; Bassano, D.; Palmeri, L.; Rampazzo, G.,Analysis of the effects of meteorology on aircraft exhaust dispersion and deposition using a Lagrangian particle model. Science of The Total Environment 2016, 541, 839-856. [CrossRef]
- Abdel-Rahman, A. A. In On the Atmospheric Dispersion and Gaussian Plume Model, The Second Wseas/iasme International Conference on Waste Management, Water Pollution, Air Pollution, and Indoor Climate, Corfu, Greece, Corfu, Greece, 2008.
- Demael, E.; Carissimo, B.,Comparative Evaluation of an Eulerian CFD and Gaussian Plume Models Based on Prairie Grass Dispersion Experiment. J.appl.meteor.climatol 2005, 47 (3), 888-900. [CrossRef]
- Arya, S., Air pollution meteorology and dispersion. . Oxford University Press: 1999. [CrossRef]
- Davidson, G. A.,A modified power law representation of the Pasquill-Gifford dispersion coefficients. Journal of The Air&Waste Management Association 1990, 40, 1146-1147.
- Chen, D. Y.; Nie, B. J.; Ran, Y. L.; Wang, Y. X.; Li, H. Y.; Gu, W. G.; Wang, D. Z.,Improved Gaussian plume model for atmospheric dispersion considering buoyancy and gravitational deposition: The case of multi-form tritium. Applied Radiation and Isotopes 2023, 199. [CrossRef]
- ICAO, Aircraft Engine Emission Data Bank. 2018.
- Stettler, M. E. J.; Eastham, S.; Barrett, S. R. H.,Air quality and public health impacts of UK airports. Part I: Emissions. Atmospheric Environment 2011, 45 (31), 5415-5424. [CrossRef]
- Taha, K. E. a. H.,Study Gaussian plume model and the Gradient Transport (K) of the advection-diffusion equation and its applications. MAUSAM 2024, 74 (3), 663-672.
- Tokuslu, A.,Estimation of aircraft emissions at Georgian international airport. Energy 2020, 206 (9), 118219.
- Zaporozhets, O.; Synylo, K.,Improvements on aircraft engine emission and emission inventory asesessment inside the airport area. Energy 2017, 140 (2), 1350-1357. [CrossRef]
- Kiefer, M. T.; Andresen, J. A.; Rozeboom, D. W.; Bian, X.,Development of a Wind and Pasquill Stability Class Climate Dataset for the North American Great Lakes Region. International Journal of Climatology 2022, 42 (10), 5306-5320. [CrossRef]
- Mohan, M.; Siddiqui, T. A.,Analysis of various schemes for the estimation of atmospheric stability classification. Atmospheric Environment 1998, 32 (21), 3775-3781. [CrossRef]
|
Disclaimer/Publisher’s Note: The statements, opinions and data contained in all publications are solely those of the individual author(s) and contributor(s) and not of MDPI and/or the editor(s). MDPI and/or the editor(s) disclaim responsibility for any injury to people or property resulting from any ideas, methods, instructions or products referred to in the content. |
© 2024 by the authors. Licensee MDPI, Basel, Switzerland. This article is an open access article distributed under the terms and conditions of the Creative Commons Attribution (CC BY) license (http://creativecommons.org/licenses/by/4.0/).


