
Submitted:
23 September 2024
Posted:
24 September 2024
You are already at the latest version
Abstract
The transition to renewable and sustainable energy sources is critical to solving the environmental and socioeconomic problems associated with the use of fossil fuel. This study uses an interdisciplinary approach to analyze the evolution, challenges and prospects of a sustainable energy transition in the context of recent discovery and exploitation of fossil resources. We study the case of Senegal from 2000 to 2027 and the role of natural gas in its energy transition. In 2000, Senegal's energy mix consisted of about 97% for fossil energy and only 3% for renewable energy. Nowadays, although fossil fuels are still dominant, but they account for about 70% of total electricity production. The country has indeed undertaken tremendous efforts to develop renewable energy sources including, solar, hydro and wind power, which currently account for about 30% of the total energy mix. Socio-economic indicators show that over the past two decades, Senegal's population and electricity production have grown significantly, leading to an increased energy demand/need. This growth has resulted in a five-fold increase in per capita energy consumption over the same period. Combining the strategic use of natural gas as a transition energy source with the continued development of renewable energy sources could make Senegal as a model for West Africa’s energy transition. The projections for 2027 suggest a structural shift in the energy mix, with natural gas, oil, and renewables at 47%, 32%, and 21%, respectively.
Keywords:
Energy Transition
; Renewable Energy
; Fossil Fuel
; Natural Gas
; Senegal
1. Introduction
The transition to more sustainable energy sources has become a global priority in response to the environmental, economic, and social problems associated with the use of fossil fuels. However, this transition is complex and requires a gradual and balanced approach. The United Nations Sustainable Development Goals (SDGs), particularly SDG 7, aim to ensure an access to an affordable, reliable, sustainable and modern energy for all by 2030 [1]. SDG 7 also sets several goals for 2030. These include increasing the share of renewable energy sources, improving global energy efficiency indicators, strengthening international cooperation to promote access to clean energy research and technology, and developing infrastructure and technologies to deliver modern and sustainable energy services for all [2]. The energy sector accounts for nearly 75% of global greenhouse gas (GHG) emissions and is a major source of fugitive emissions [3,4]. Current trends show that energy consumption will continue to grow over the next 30 years. Currently, fossil fuels account for more than 80% of global energy consumption. According to climate change mitigation targets set by various organizations, including the United Nations (UN), the International Atomic Energy Agency (IAEA), and British Petroleum (BP), this share is expected to decrease to 22-40% by 2050 if committed actions are implemented [5,6]. Therefore, much effort is needed to reduce emissions of greenhouse gases such as carbon dioxide (CO2) and methane (CH4) and air pollutants such as nitrogen oxides (NOx), sulfur dioxide (SO2), and fine dust. These reductions are necessary to achieve the key goals of the Paris Agreement which was adopted at the 21st Conference of the Parties (COP21) [7]. If current trends in fossil fuel consumption continue, the world will not be able to mitigate the impacts of climate change on the population [8]. However, the global economy is becoming increasingly electrified, particularly through to the introduction of hybrid and electric vehicles and industrialization in developing countries, which will lead to increased demand for electricity [9,10].
A sustainable energy transition is therefore critical to revitalizing the global economy and solving climate problems. However, opinions differ on how to approach this transition. Some experts and organizations emphasize that to meet the UN’s goals, all electricity needs must be met using renewable and clean energy sources. Conversely, other experts argue that relying solely on renewable energy sources is unrealistic given the growing demand for electricity [11,12,13,14,15]. Despite these differing views, the global international community continues to advocate for a sustainable transition in response to the observed impacts and consequences of climate change.
From this perspective, natural gas can play an important role in the energy transition process due to its reputation as the least polluting fossil fuel [16,17]. Natural gas is increasingly recognized as a viable option for reducing carbon dioxide emissions in the energy sector, as its CO2 emissions are ~50% lower than other fossil fuels [18,19,20]. Recent studies also highlight the environmental benefits of natural gas, emitting almost 90% less pollutants into the atmosphere than other fossil fuels [21,22]. These factors enhance the potential of natural gas to play a key role in the transition to a low-carbon economy by providing a cleaner and more flexible alternative to traditional fossil fuels [23,24]. However, there are at least three different views on the role of natural gas: first, as a transition fuel for a future dominated by clean and renewable technologies; second, as a barrier to the development of new technologies due to its flexibility and accessibility; and third, the continued dependence of most economies on fossil fuels [25,26].
Africa’s energy mix is dominated by fossil fuels despite the continent’s significant potential for renewable energy, especially solar and hydropower. In 2019, only about 9.5% of Africa’s electricity production came from renewable energy sources [26]. In 2020, approximately 80% of Senegal’s electricity was produced from fossil fuels (oil, coal), while only 20% came from renewable energy sources (solar energy, wind power, and hydropower) [27]. Senegal’s energy mix is currently dominated by fossil fuels, which account for a significant share of electricity production. On the policy side, Senegal has already undertaken steps to encourage the integration of renewable energy sources through a supportive policy and regulatory framework [13,27]. However, coordination among various stakeholders and political stability remain important factors for a successful energy transition [28,29,30,31].
As a developing country, Senegal faces similar challenges related to energy demand and energy transition. Based on GHG emissions by sector, Senegal’s distribution is 49% from agriculture, 40% from energy, 7% from waste, and 4% from industrial processes [32]. Total emissions are 13,084 Gg ECO2, which is equivalent to 1.2 tons of CO2 per capita emitted by a population of 10,817,844 inhabitants in 2005 [33].
Meanwhile, recent large offshore oil and gas discoveries and upcoming developments promise to transform Senegal’s economy. However, these new developments pose serious challenges to sustainable development and energy transition. Increased fossil fuel production could delay investments in renewable energy and hinder the achievement of climate goals [30,34]. However, due to its abundant renewable resources, Senegal has significant solar potential with solar radiation levels ranging from 4.2 to 6 kWh/m2 /day [35,36,37,38]. Approximately 90% of the country benefits from direct general irradiation of 1,600 to 1,800 kWh/m² per year, which is almost 70% more per square meter than in northern Germany [36,39]. In 2018, IRENA estimated Senegal’s solar potential at 37,233 MW [40]. Senegal also has significant wind resources that can be harnessed to produce clean, reliable and affordable energy. Coastal areas, particularly along the northern and southern coasts, have the strongest and most reliable wind resources in West Africa, with wind speeds ranging from 4 to 7 m/s [41,42,43]. In addition, the World Bank estimates the offshore wind power potential at 45 GW, divided into 13 GW of fixed potential and 32 GW of floating potential [44]. The daily production of these two types of renewable energy care complementary. Solar energy peaks at noon and strong winds are recorded in the evening and night [40,45,46]. In addition, according to the Organization for the Development of the Senegal River (OMVS) [47], about 10 dam sites have been identified along the Senegal River and its tributaries, with a hydroelectric potential estimated at more than 4000 GW per year. These resources give Senegal the opportunity to diversify its energy mix and promote sustainable growth.
Taking into account the anticipated exploitation of fossil resources, Senegal decided to reorient its energy policy, which had previously focused on the gradual integration of renewable energy sources into its energy structure. As a result, the country decided to rely on natural gas as a transitional energy source while continuing to develop renewable energy sources to significantly reduce its dependence on oil and coal. The technical and economic challenges associated with this policy include the modernization of the existing energy infrastructure and the development of new energy storage capacities needed to cope with the intermittency of renewable energy sources [5,48] and transform thermal power plants into energy plants.
This study uses an interdisciplinary approach to provide a comprehensive analysis of the energy transition in Senegal. Our main goal is to identify and assess the economic and technological challenges Senegal is facing, while considering future prospects for the country’s sustainable energy transition. We start with a detailed study of the country’s socioeconomic and energy indicators, covering the period from 2000 to the present. Next, we conduct an in-depth study of Senegal’s energy structure from 2000 to 2022. Finally, we analyze current and expected strategies to achieve a sustainable energy transition in the context of the future exploitation of gas and oil resources. This paper is organized as follows: The data and methods used in this study are described in Section 2. Results and discussion are presented in Section 3. Finally, a summary of the main findings and a conclusion with recommendations for a sustainable energy transition in Senegal is presented in Section 4.
2. Data and Methods
2.1. Methodology
The methodology used in this study takes an interdisciplinary approach, aiming to provide a comprehensive analysis of the energy transition in Senegal. To assess the country’s energy structure from 2000 to 2022, we collect data from government sources such as the Senegalese National Electricity Company (SENELEC), international organizations such as the International Atomic Energy Agency (IAEA), the World Bank, and relevant scientific publications. These data include statistics on energy production and consumption, greenhouse gas emissions, access to electricity, and national energy policies.
Quantitative and statistical analysis methods are used to analyze access to electrification and estimate energy consumption by sector, while allowing for an efficient processing of available data. Various data processing tools are used to process, sort and pre-analyze the data. We use the Geographic Information Systems (GIS) for the geographic visualization and the analysis of spatial data related to electricity access and population distribution. Quantitative analysis includes descriptive statistics, and time series analysis. The analysis aims to understand past and present trends along with future prospects for energy sources, as well as the trends in access to electricity and energy consumption in sectors such as agriculture, industry and transport. We also examine greenhouse gas emissions by sector to identify the key factors contributing to climate change and assess the impact of energy policy on these emissions. Finally, we perform a detailed analysis of the evolution of electricity generation by energy source, focusing on production trends and the respective contributions of fossil and renewable energy sources. By combining these different analyses, our study aims to provide a comprehensive assessment of Senegal’s current energy environment and prospects for a sustainable energy transition against the backdrop of near-term fossil fuel development.
In this study, we use the Long Short-Term Memory (LSTM) model to predict the total number of electricity subscribers and energy balance in Senegal. This advanced variant of the recurrent neural network (RNN) is designed to learn autonomously from past data without explicit programming. The model has proven to be highly efficient in energy prediction [49,50,51,52]. In the first step, the data is normalized to the range of 0 to 1 to avoid learning problems, and then the relationship between input variables such as population, GDP, etc. and the total number of electricity customers is adjusted. The data set is divided into a training set (80% of the series) and a test set (20%) to test the model performance. The analysis includes daily consumption, number of customers, demographics, infrastructure and utilization of fossil resources, particularly natural gas. Economic factors and electrification rates have also been included to improve the forecast up to the year 2027.
2.2. Data Collection Strategy
To conduct this study, we use a methodological approach combining secondary data analysis and energy modeling. Data sources include national and international reports, energy agencies, government databases and scientific publications to ensure comprehensive and reliable coverage of the required information [53,54,55,56]. It is worth noting that secondary energy data for Senegal was obtained from databases such as the World Bank [57], the IAEA [58], and Climatewatch [59]. These data provide both global and regional information on energy consumption, energy balance and the future projections. The Global Renewable Energy Report (REN21) provides statistics and analysis on the integration of renewable energy into the energy structure of countries, including Senegal, while a report by the International Renewable Energy Agency (IRENA) provides insight into the potential and challenges of renewable energy in Africa and Senegal [60,61]. The annual reports of the Senegalese Ministry of Petroleum and Energy were used to obtain detailed data on energy production, consumption, and import/export in Senegal from 2000 to 2022 [62,63]. In addition, data from organizations such as the National Action Plan for Renewable Energy (PANER) report [64] and the SENELEC [65] are used. Demographic data are obtained from the National Agency of Statistics and Demography (ANSD) [66], and GDP growth data are based on projections from the Department of Planning and Economic Policy (DGPPE) [67]. Interviews with energy experts in Senegal provided qualitative insights into the challenges and opportunities of the energy transition. To ensure the validity and reliability of the findings, we triangulated information from multiple sources and cross-checked the data for accuracy and consistency by comparing it with various publications and reports.
3. Results and Discussion
3.1. Socio-Economic Profile and Electricity Generation: A Comprehensive Analysis
Figure 1 shows the annual variability of the total energy production (top panel) and total population (bottom panel) in Senegal from 2000 to 2023. Both indicators show an almost linear increasing trend over the years. On average, energy production increased by about 215.74 GWh per year, starting from a base production of 894.89 GWh. In particular, electricity production doubled in 10 years from 2918 GWh in 2012 to 5908.32 GWh in 2022, reflecting a compound annual growth rate (CAGR) of 7.62%. Production in 2023 is estimated at 6654.02 GWh, resulting to an increase of 11.40% compared to 2022. Likewise, the country’s population also doubled between 2000 and 2022, which explains the growing energy demand. This growth highlights the importance of implementing policies and measures to improve energy efficiency, diversify energy sources, and promote sustainable development. These measures are critical to meet the growing energy demand while minimizing environmental impacts.
Figure 2 shows the spatial distribution of the total population by region in 2023 (Figure 2a) and the distribution of the total number of residential subscribers by zone (region) in 2023 (Figure 2b). According to the latest general population census done in 2023, most of the population is concentrated in the western coastal regions, especially in Dakar, Thiès and Diourbel. In contrast, the southern region has the lowest population. Likewise, the major urban centers in the west, such as Dakar, Thiès and Diourbel, have the highest number of domestic subscribers. Conversely, the southern regions (Ziguinchor, Kolda and Sedhiou) and the northern regions have a lower number of domestic subscribers. This can be explained by the small population size in these regions and the limited access to the electricity grid. This information is important for regional development, infrastructure planning and public policy implementation. By taking into account population distribution and energy needs, authorities can better target infrastructure investment and development plans to meet the specific needs of each region, improve energy access, and promote balanced economic development across the country.
Future projections indicate that the the number of domestic subscribers is expected to increase from 2,198,624 in 2022 to 3,156,473 in 2027, representing an increase of 27% over this period.
3.2. Access to Electrification and Energy Consumption: Current Status since 2000 and Outlook
Figure 3 presents the electrification rate (%) for the total population (Figure 3a), rural population (Figure 3b) and urban population (Figure 3c) in Senegal from 2000 to 2021. All three indicators show a progressive increase. Overall, electricity access for the total population has increased from less than 40% in 2000 to more than 70% in 2021. During the same period, the urban population’s access to electricity increased from 73% in 2000 to nearly 95% in 2021, suggesting that majority of the urban population has access to electricity. However, in rural areas, the proportion remains low, increasing from less than 15% in 2000 to about 48% in 2021 (see Figure 3c). These results confirm the country’s official data showing that about 4.3 million rural people in approximately 14,000 localities do not have access to electricity [32]. Consequently, ensuring access to electricity for the most vulnerable rural populations remains a major challenge.
Figure 4 shows a comparison between GDP per capita and energy consumption per capita in Senegal from 2000 to 2022. It can be seen that the growth in GDP per capita is correlated with the increase in total and per capita energy consumption. This correlation is explained by the increasing energy demand of the population, which leads to a gradual increase in per capita energy consumption. These trends are likely to reflect rising living standards, population growth, and industrial development.
The energy pricing system in Senegal is structured into three power tiers: Low Voltage (LV), Medium Voltage (MV), and High Voltage (HV), as summarized in Table 1.
LV customers are those with a subscribed power demand of less than 34 kW and are served at a nominal voltage ranging between 220-380 volts (with a tolerance of 10%). The LV group includes residential, commercial, and public lighting. Within LV residential and commercial clients, there are three categories: small, medium, and large. Small clients are those with subscribed power below 6 kW, while medium clients are those with subscribed power between 7 kW and 17 kW. Large LV clients are those with subscribed power between 17 kW and 34 kW. Small and medium LV customers are priced on the basis of an ascending block price, where the marginal price of the kWh varies and increases as the level of kWh consumed increases. There are three tiers, and the tier cutoffs vary based on the customer group (small vs. medium vs. large) and the usage type (residential vs. commercial). Public lighting customers are charged a fixed price per kWh. Large LV customers/clients are charged on a time-of-use (ToU) pricing, with a higher marginal price during peak hours (between 7 pm and 11 pm) and a lower marginal price during off-peak hours. The average price per kWh for these LV clients is 115.35 FCFA/kWh (0.2 USD1/kWh) in 2022.
MV clients are those with a subscribed power between 34 kW and 1 MW (1000 kW) and are served at a nominal voltage between 1,000 volts and 50,000 volts. MV clients include small and medium industrial clients, large services and businesses, as well as rural electrification concessionaries, which are entities in charge of delivering electricity to very remote areas in private markets. The pricing for MV clients also follows a ToU pricing with three different categories: short usage, long usage, and general usage. Short usage is for clients with an average usage less than 1000 hours per year, general usage is for clients with an average usage between 1000 hours and 4000 hours per year, and long usage is for clients with average usage above 4000 hours per year. The average price per kWh for these medium voltage clients is 111.98 FCFA/kWh (~0.19 USD/kWh) in 2022.
HV clients are those with a subscribed power above 1 MW (1000 kW) and are served with a nominal voltage above 50,000 volts. The HV group applies to large industries and major projects exceeding 3000 kW. The average price per kWh for these medium voltage clients is 83.73 FCFA/kWh (~0.14 USD/kWh) in 2022. The number of HV clients is very small, for instance, it was only 9 in 2022.
Figure 5 shows the share of each category in the country’s total electricity production in 2000, 2010 and 2022. Electricity consumption in Senegal is mainly dominated by domestic and professional uses and public lighting, which account for between 50% and 64% of the total. However, this share has decreased slightly from 64% in 2010 to 61% in 2022, indicating a diversification towards other energy sources. Medium-sized enterprises and concessionaries which mainly consume medium voltage (MV), have seen their share decrease from 34% in 2000 to 30% in 2010, and further to 26% in 2022, possibly in response to energy optimization or new efficiency standards. Conversely, high voltage (HV) consumption by large industries declined from 16% in 2000 to 6% in 2010, before rising to 10% in 2022, suggesting a potential industrial recovery or improvements in energy efficiency.
In summary, electricity consumption in Senegal is mainly driven by domestic and commercial uses, with the industrial sector playing a minor role but subject to fluctuations. These trends reflect economic and technological developments as well as the country’s energy policy directions, and highlight the relatively limited contribution of the industrial sector to the national economy in terms of electricity consumption.
3.3. Sectoral Analysis of Energy Consumption
Figure 6 shows the distribution of electricity consumption by sector in 2000, 2010, and 2021. First, it should be noted that the most energy-intensive sector is the residential sector, followed by transport and industry, which account for over 95% of total consumption. A closer look reveals that, despite the overwhelming share of the residential sector, it has declined from 57% in 2000 to 45% in 2021. This decline can be explained by various factors including lifestyle changes resulting from improved energy efficiency in homes, and increased adoption of energy-saving technologies, along with increased dependence on other sectors for energy services. At the same time, the share of the transport sector has increased from 26% between 2000 and 2010 to 33% in 2021. This is likely due to increased energy demand due to economic growth, accelerating urbanization, and expanding transportation networks. During the same period, energy consumption in the industrial sector increased from 12% in 2000 to 19% in 2021. This growth could be driven by the expansion of existing manufacturing and industrial facilities, which require more energy to power machinery and industrial processes. This analysis highlights significant changes in Senegal’s energy distribution, characterized by a decrease in the share of the residential energy consumption and an increase in the share of consumption by the industrial and transport sectors (see Figure 6).
3.4. Greenhouse Gas Emissions Assessment
Figure 7 shows greenhouse gas emissions by sector for 2000, 2010 and 2021. Overall, agriculture stands out as the main source of emissions, accounting for almost half of the emissions, followed by the energy sector. Indeed, emissions from agriculture have remained high over the past three decades, consistently accounting for about 50% of total national emissions. The primary gases emitted by the agricultural sector are mainly methane (CH4) and nitrous oxide (N2O). Methane is largely derived from enteric fermentation, while nearly all nitrous oxide is emitted from agricultural soils [33].
Likewise, Greenhouse gas emissions from the energy sector have slightly increased, by about 5% (electricity and transport) between 2000 and 2021. Other sectors, such as waste management and industrial processes, have relatively low emissions, with a decreasing trend since 2000. However, it is important to continue efforts to reduce emissions by mitigating climate change and promoting sustainable development, in particular, by encouraging sustainable agricultural practices, investing in clean energy, introducing more efficient industrial technologies, and improving waste management.
Figure 8 compares per capita CO2 emissions between Senegal (red) and several other countries (France, China, United States of America, Vietnam, Niger and Côte d’Ivoire) from 2000 to 2021. The top right panel of the figure provides a detailed overview of Senegal’s emissions. In terms of emissions, two distinct groups are evident. Industrialized countries (France, China, United States of America) have higher emissions, typically in the range of 5 to 20 tCO2 per capita per year, due to their significant energy consumption and dependence on fossil fuels. Conversely, emissions in developing countries (Senegal, Vietnam, Niger and Côte d’Ivoire) are lower, at less than 1 tCO2 per capita per year. However, a closer look at Senegal (inset above) shows a notable increase in emissions. Overall, although emissions per capita are still very low compared to developed countries, they have doubled between 2000 and 2021, which indeed, are in line with increased economic activity.
The analysis of per capita CO2 emissions reveals diverse trends among countries, reflecting differences in their economic development, environmental policies, and patterns of energy production and consumption. It is crucial for all countries to implement measures to reduce their CO2 emissions in order to combat climate change and promote sustainable development.
3.5. Electricity Production by Energy Source from 2000 to 2022
Figure 9 shows the change in energy production by energy source in Senegal from 2000 to 2021. In 2000, almost all production came from fossil fuels. However, other types of fossil fuels have progressively been added, including coal and gas. In addition, the use of renewable energy sources, such as hydropower, solar and wind energy has increased significantly, leading to an important increase in the country’s installed capacity. By 2020-2021, Senegal’s installed capacity is estimated at 1.2-1.5 GW, producing 5.61 TWh of electricity. This capacity increased from 1.79 GW in 2022 to 1.95 GW in 2023 [68,69,70]. The transition to renewable energy sources has meant a significant increase in installed capacity, which has reduced the initial dominance of fossil fuels observed in the early 2000s.
The total installed capacity of renewable energy sources is observed to be increasing. For instance, between 2021 and 2023, solar capacity was projected to increase from 226 MW to 249.68 MW, representing a growth of 9 %. Likewise, according to the SENELEC, hydropower capacity will increase from 75 MW in 2021 to 121 MW in 2023, representing a growth rate of 38%. Despite progress in diversification with a significant increase in the renewable energy production, fossil fuels and mainly heating oil still remain the main source of power. This fossil fuel energy dependence exposes the country to instability in global markets for coal, oil, and gas. The need to import these fuels at high prices has a significant negative impact on Senegal’s economy, which is already struggling with high electricity prices.
Figure 10 shows the share of fossil fuels in Senegal’s energy mix from 2000 to 2021. Overall, it is clear that a significant portion of Senegal’s energy comes from fossil fuels, particularly oil and its derivatives. From 2000 to 2002, fossil fuels accounted for approximately 97% of the country’s energy production. But in 2003, this percentage dropped to about 80% with the connection of the Manantali hydroelectric dam. However, between 2007 and 2009, the share of fossil fuels increased to about 90%. During this period, the country experienced regular power outages. To overcome this blackouts, the Senegalese government had launched an initiative called the “Takkal Plan” (literally means “Lighting Plan”). During the Takkal plan, large diesel generators were used to provide electricity to the public, which could explain the rising use of fossil fuels during this period. Finally, from 2012 to the present, with the increasing integration of renewable energy sources such as solar and wind power, the share of fossil fuels has further decreased to approximately 85%. Overall, this result clearly demonstrates Senegal’s efforts to achieve a more sustainable energy transition and reduce dependence on fossil fuels.
Figure 11 shows the integration of renewable energy sources into Senegal’s energy mix from 2010 to 2022. In 2010, the only renewable energy source was hydroelectricity, introduced in 2002 through the connection of the Manantali Dam, which added 25 to 30 GWh per year. Senegal began to gradually integrate solar energy with the operation of the Bohol Solar Power Plant in the northern region in 2013. Since 2016, additional solar power plants, such as Kahone, Malicounda, Tenmerina, Mekhe, Sakal and Diass, have also come online, further increasing the share of solar energy in the energy mix. At the same time, a new wind farm was installed in Taïba Ndiaye in 2017, promoting the development of renewable energy sources. The wind farm became operational in 2017 and reached its maximum capacity of 158.7 MW by 2021-2022. In addition, hydroelectric power production increased significantly in 2022 with the construction of the 128 MW Sambangalou hydropower dam. With other projects in various stages of planning or construction, Senegal is well on its way to meeting its hydropower capacity targets.
3.6. Evolution of the Energy Mix from 2000 to 2022
Figure 12 illustrates Senegal’s energy mix in 2000, 2010, and 2022. In 2000, Senegal primarily relied on fossil fuels (97%, predominantly oil and its derivatives) and a minor share of biomass (3%), mainly used in rural areas. In 2010, although fossil fuels still dominate with 89% of the total share, the hydroelectricity produced by the Manantali dam contributed to 9% to the total share and the share of biomass decreased to 2%. In 2022, a significant strides were made in the integration of renewable energy. Overall, in 2022 fossil fuels decreased to 70%, while solar energy, wind energy, and hydroelectricity increased to 12%, 9%, and 7%, respectively. The biomass remained steady at 2%.
3.7. Short and Medium Term Energy Transition Strategies in the Context of Fossil Fuel Exploitation
In its energy transition strategy, Senegal has made a strategic decision to use natural gas as a medium-term transition energy source while continuing to promote the development of renewable energy sources. The Grand Tortue/Ahmeyim gas field is considered the largest deposit in West Africa, with estimated reserves of 450 billion cubic meters, and is expected to produce approximately 2.5 million tons of liquefied natural gas (LNG) per year by 2025. The exploitation of this Senegalese gas will create wealth and stimulate the country’s economic growth [71]. Figure 13 presents the projections for 2027, taking into account the oil and gas production plans starting from 2025. According to this model, the energy mix in 2027 will consist of 47% of natural gas, 32% of petroleum products, 12% of hydropower, 5% of solar energy, and 4% of wind energy. Senegal should phase out heavy oil from its power generation mix and continue to expand its renewable energy capacity, according to a parallel analysis conducted as part of a 2019 loan operation based on policies supported by the World Bank. However, the share of gas is expected to increase to the same proportion of production as our results by 2026 [46].
Figure 14 summarizes the evolution of the energy structure over the last 30 years, categorized into fossil, renewable, and transition energy sources, and the projections for the next 10 years (until 2030). In 2000, fossil fuels accounted for 97% of the total, while renewables accounted for only 3%. By 2010, the share of fossil fuels had decreased to 87%, while that of renewables had increased to 13%. Throughout the 2020s (here 2022), the share of fossil fuels has continued to decrease, reaching 70%, while that of renewables has continued to rise reaching 30% of the total energy mix. The forecast for the next few years until 2027 shows a significant shift in the energy mix, along with the expected depletion of the country’s oil and gas reserves. Therefore, by 2027, the energy mix will consist of 47% of natural gas, 32% of oil and 21% of renewable energy, which the country considers as transitional energy.
3.8. Economic Impact of the Energy Mix
Beyond the environmental importance of the energy mix, the energy sources also merit a particular attention because they affect the marginal cost of electricity production, which is used to calculate the retail price paid by households and firms. Indeed, the way in which the regulatory body CRSE (Regulatory Commission for the Electricity Sector) sets the rate schedule for consumers is subject to the variable costs of energy production. The CRSE starts with the projected electricity consumption for different customer groups. This projected demand is then used to estimate the required production based on an assumed ratio of sales to production. The cost of this required level of production is then estimated based on projected costs of production. These estimated production costs are combined with transportation and distribution costs to get an estimated total cost. Taxes, import duties, amortization payments and projected capital investments are added to the calculated costs to get a required level of revenue per kWh, which are then used as rate schedules for customers. Thus, the energy mix in Senegal has a socio-economic impact on the well-being of consumers, since electricity is a non-trivial portion of household and firm expenditures. Table 2 provides an overview of Senegal’s electricity system in 2022, detailing the primary power plants, their classifications, energy sources, annual production per plant, and the corresponding production costs.
Table 2 shows the variable price per kWh of electricity produced by each of the different power plants in the country.
Table 3 shows the distribution of the cost of production by energy source across the different power plants shown in Table 2. The table highlights that solar, wind and hydroelectric power are quite cheap, with averages of 0.102, 0.035 and 0.116 USD/kWh, respectively. Globally, the cost of these renewable energy sources has been decreasing over the last few decades and is expected to decrease further in the coming decades [72]. On the other hand, electricity from fossil fuels is much more expensive to produce, with the marginal cost of production greater than 100 FCFA/kWh (~ $ 0.1667 /kWh) for both heavy fuel oil and coal. Natural gas seems to be a good middle ground in terms of production costs, as its costs ranges between that of renewables and fossil fuels (see Table 3). Furthermore, the cost of natural gas production is expected to decrease further as the country will begin exploiting its own reserves in 2025.
4. Summary and Conclusions
The aim of this study was to analyze the challenges and opportunities of energy transition in Senegal, taking into account the exploitation of fossil fuels, especially natural gas, and the gradual integration of renewable energy sources.
Based on the findings of the study, several quantitative conclusions can be drawn and used to provide a clear outlook for a sustainable energy future. Senegal’s electricity production has increased significantly over the past two decades, from 1,100 GWh in 2000 to approximately 4,000 GWh in 2020, corresponding to a nearly quadrupling in capacity. This growth is primarily driven by population growth of 2.8% per year and an increased energy demand due to rapid urbanization. Our results show that while the energy mix is still dominated by fossil fuels, which still account for 70% of electricity production in 2020, renewable energies have made a remarkable progress. For instance the renewable energy increases from less than 3% of installed capacity in 2000 to approximately 30% of installed capacity in 2022. Among the renewable energy sources, solar power generation has shown a more rapid growth, with the installed capacity reaching 245 MW in 2022, and representing a growth of more than 40% in five years. In addition, the construction of the Taïba Ndiaye wind farm and its connection to the Manantali and Sambagalou hydroelectric dams have contributed significantly to increase the share of renewable energy sources to 30%. This important development marks a major turning point in Senegal’s energy landscape. Moreover, the recent discovery of natural gas, estimated at 1.2 trillion cubic meters, represents a unique opportunity for the country’s economic development. As an energy source with low greenhouse gas and pollutant emissions, natural gas offers an opportunity for both economic development and energy transition. As a transitional energy source, natural gas can reduce CO2 emissions by up to 30% compared to coal while supporting the development of renewable energy infrastructure. By consolidating the 500 MW of natural gas production capacity, Senegal can enhance the reliability of its electricity grid and save approximately 700 billion FCFA (nearly US $ 1.147 billion) annually by reducing its dependence on oil imports [73]. However, to ensure a sustainable energy transition while building climate resilience, Senegal will need to strike the right balance between the short-term economic benefits of natural gas and the long-term environmental sustainability and social well-being. In particular, there is a need to investigate and understand the potential social, economic and environmental impacts of natural gas development, especially on vulnerable communities, in the aim to engage the country in a just energy transition pathways that create green jobs and avoid exacerbating inequalities. Moreover, significant challenges remain, as energy infrastructure requires a substantial investment. To achieve universal access to energy, modernize the power grid, and develop reliable storage facilities, the total investment is estimated at around 660 billion FCFA (US $ 1.6 billion) [74]. The access to electricity is geographically unequal, with more than 95% of urban areas having access to electricity, while only 50% of rural areas have access to electricity. Promoting decentralized energy systems and mini-grids in rural areas will contribute to improve access to energy and reduce rural poverty. Finally, to achieve a sustainable energy transition, Senegal needs to strengthen its energy policy with a focus on energy efficiency, integration of renewable energy sources and development of the necessary climate resilient infrastructure, but also, to raise public awareness and to provide better access to electricity at affordable rate in rural areas.
Author Contributions
Conceptualization, S.A.A.N., A.C. and M.S.D; methodology, S.A.A.N., A.C., M.S.D., A.D., K.T., S.O.N, and I.D; software, S.A.A.N. and A.C.; data curation, S.A.A.N. and I.D.; writing—original draft preparation, S.A.A.N., A.C., M.S.D., I.D.; writing—review and editing, S.A.A.N, A.C., M.S.D., I.D., and A.D. All authors have read and agreed to the published version of the manuscript.
Funding
This research received no funding.
Data Availability Statement
Data will be made available on request.
Acknowledgments
AC work was supported by the Department of Agriculture and Resource Economics, University of California, Berkeley, Berkeley, CA, United States of America. ID work was supported by the San Jose State University (SJSU), San Jose, CA, United States of America. AD work was supported by Institut de Recherche pour le Développement (IRD) and LMI NEXUS (Joint International Laboratory on climate water agriculture and energy nexus). We warmely acknowledge all the universities, research centers, the Senegalese National Electricity Company (SENELEC) and the agencies that made this study possible.
Conflicts of Interest
The authors declare no conflicts of interest.
| 1 | Here we used: 1.0 USD ($) = 600.00 CFA |
| 2 | Liquefied Natural Gas |
| 3 | Independent Power Producer |
References
- United Nations. (2015). Transforming our world: the 2030 Agenda for Sustainable Development, [online]. Available at: https://sustainabledevelopment.un.org/content/documents/21252030%20Agenda%20for%20Sustainable%20Development%20web.pdf.
- United Nations, About the sustainable development goals, [online]. [Accessed: October 2021]. 2015. Available at: https://www.un.org/sustainabledevelopment/sustainable-development-goals/ .
- International Energy Agency. (2019). World energy outlook 2019. Available at: https://www.iea.org/reports/world-energy-outlook-2019.
- World Resource Institute. (2020). Global Historical Emissions. https://www.wri.org/resources/data-visualizations/world-greenhouse-gas-emissions-2016.
- International Energy Agency, World-Energy-Outlook-2021. 2021. Available at: https://www.iea.org/reports/world-energy-outlook-2021 .
- BP, Energy Outlook 2023 explores the key trends and uncertainties surrounding the energy transition. Available at: https://www.bp.com/content/dam/bp/business-sites/en/global/corporate/pdfs/energy-economics/energy-outlook/bp-energy-outlook-2023.pdf.
- Rogelj, J., den Elzen, M., Höhne, N. et al. Paris Agreement climate proposals need a boost to keep warming well below 2 °C. Nature 2016, 534, 631–639. [CrossRef]
- International Energy Agency, World Energy Model, [online]. 2019. Available at: https://iea.blob.core.windows.net/assets/ff3a195d-762d-4284-8bb5-bd062d260cc5/GlobalEnergyandClimateModelDocumentation2023.pdf.
- Jakemanm M., Global economy watch. The global economy has become much more energy efficient. But are there further gains to come? [online]. 2019. Available at: https://www.pwc.com/gx/en/issues/economy/global-economy-watch/assets/pdfs/efficient-global-economy-july-2019.pdf .
- Laclau, B., How net-zero emissions present the power sector with an opportunity. [online]. 2020. Available at: https://www.ey.com/enuk/power-utilities/how-net-zero-emissions-present-the-power-sector-with-an-opportunity .
- Daniel Steinberg, Dave Bielen, Josh Eichman, Kelly Eurek, Jeff Logan, Trieu Mai, Colin McMillan, Andrew Parker, Laura Vimmerstedt, and Eric Wilson. Electrification & Decarbonization: Exploring U.S. Energy Use and Greenhouse Gas Emissions in Scenarios with Widespread Electrification and Power Sector Decarbonization. National Renewable Energy Laboratory. 2017. Available at: https://www.nrel.gov/docs/fy17osti/68214.pdf.
- Davis, Stacy Cagle, Williams, Susan E., and Boundy, Robert Gary. Transportation Energy Data Book: Edition 35. United States: N. p. 2016. [CrossRef]
- Narayan, A. Narayan, A. The Electrification of Transport Could Transform our Future—If We are Prepared for It. In World Economic Forum. 2018. Available at: https://www.weforum.org/agenda/2018/08/we-must-get-it-right-with-electric-vehicles-for-the-sake-of-our-planet.
- IRENA (2019a), Climate Change and Renewable Energy: National policies and the role of communities, cities and regions (Report to the G20 Climate Sustainability Working Group (CSWG)), International Renewable Energy Agency, Abu Dhabi. ISBN: 978-92-9260-136-2 .
- Energy Transitions Commission. The future of fossil fuels: how to steer fossil fuel use in a transition to a low-carbon energy system. 2017. Available at: https://www.energy-transitions.org/.
- Michael Burger and Jessica Wentz, Evaluating the Effects of Fossil Fuel Supply Projects on Greenhouse Gas Emissions and Climate Change Under NEPA, 44 Wm. & Mary Envtl L. & Pol’y Rev. 423 (2020). https://scholarship.law.wm.edu/wmelpr/vol44/iss2/4.
- Delborne, J. A., Hasala, D., Wigner, A., & Kinchy, A. Dueling metaphors, fueling futures:“Bridge fuel” visions of coal and natural gas in the United States. Energy Research & Social Science 2020, 61, 101350. [CrossRef]
- Yusuf, N., & Al-Ansari, T. Current and Future Role of Natural Gas Supply Chains in the Transition to a Low-Carbon Hydrogen Economy: A Comprehensive Review on Integrated Natural Gas Supply Chain Optimisation Models. Energies 2023, 16(22), 7672. [CrossRef]
- Huang, M. T., & Zhai, P. M. Achieving Paris Agreement temperature goals requires carbon neutrality by middle century with far-reaching transitions in the whole society. Advances in Climate Change Research 2021, 12(2), 281-286. [CrossRef]
- Pischke, E. C., Solomon, B., Wellstead, A., Acevedo, A., Eastmond, A., De Oliveira, F., ... & Lucon, O. From Kyoto to Paris: measuring renewable energy policy regimes in Argentina, Brazil, Canada, Mexico and the United States. Energy Research & Social Science 2019, 50, 82-91. [CrossRef]
- Gillingham, K., & Stock, J. H. The cost of reducing greenhouse gas emissions. Journal of Economic Perspectives 2018, 32(4), 53-72. [CrossRef]
- McCaffery, C., Zhu, H., Tang, T., Li, C., Karavalakis, G., Cao, S., ... & Durbin, T. D. Real-world NOx emissions from heavy-duty diesel, natural gas, and diesel hybrid electric vehicles of different vocations on California roadways. Science of the Total Environment 2021, 784, 147224. [CrossRef]
- Bistline, J. E., & Young, D. T. The role of natural gas in reaching net-zero emissions in the electric sector. Nature Communications 2022, 13(1), 4743. [CrossRef]
- Bugaje, A. A. B., Dioha, M. O., Abraham-Dukuma, M. C., & Wakil, M. Rethinking the position of natural gas in a low-carbon energy transition. Energy Research & Social Science 2022, 90, 102604. [CrossRef]
- León, G. D., & Scipio-Cimetta, S. D. The role of natural gas in today’s energy transition. Dyna 2022, 89(221), 92-100. [CrossRef]
- Nunez, C. Can natural gas be a bridge to clean energy? National Geographic. 2020. Available at: https://www.nationalgeographic.com/environment/energy/great-energy-challenge/big-energy-question/can-natural-gas-be-a-bridge-to-clean-energy/.
- Ministère du Pétrole et des Énergies du Sénégal. Rapport Annuel 2020. 2020. Available at: https://www.energie.gouv.sn/wp-content/uploads/2023/02/Rapport-dactivite%CC%81s_MPE_2020_002.pdf.
- UNDP. UNDP Annual Report 2019. 2019. Available at: https://www.undp.org/pacific/publications/undp-annual-report-2019-0.
- Hamdiyah Alhassan, Paul Adjei Kwakwa, Mensah Tawiah Cobbinah. Energy financing in Africa: The prospects and challenges, Reference Module in Social Sciences, Elsevier, 2024, ISBN 9780443157851. [CrossRef]
- Adams, S., & Asante, W. Politics of renewable energy in Africa: Nature, prospects, and challenges. Innovation in Global Green Technologies. 2019. [CrossRef]
- REN21. Renewables 2021 Global Status Report (Paris: REN21 Secretariat). 2021; ISBN 978-3-948393-03-8. Available at: https://www.ren21.net/wp-content/uploads/2019/05/GSR2021_Full_Report.pdf.
- International Energy Agency. Senegal 2023, IEA. (accessed on January 2024). 2023. Available at: https://www.iea.org/reports/senegal-2023.
- UNFCCC. Third National Communication on Climate Change of Senegal. 2015. Retrieved from Available at: https://unfccc.int/sites/default/files/resource/Sennc3.pdf.
- Sambo, A. Renewable Energy Development in Africa: Issues, Challenges and Prospects. In: Sayigh, A. (eds) Renewable Energy in the Service of Mankind Vol II. Springer, Cham, 2016. [CrossRef]
- Niang, S.A.A., Gueye, A., Sarr, A., Diop, D., Goni, S. and Nebon, B. Comparative Study of Available Solar Potential for Six Stations of Sahel. Smart Grid and Renewable Energy 2023, 14, 153-167. [CrossRef]
- Solargis, World Bank Group and ESMAP. Global Solar Atlas. 2023. Available at: https://globalsolaratlas.info/map?c=14.510848,-14.4375,7&r=SEN.
- Drame M S, Bilal BO, Camara M, Sambou V, Gaye A. Impacts of aerosols on available solar energy at Mbour, Senegal. J Renew Sustain Energy 2012. [CrossRef]
- Drame Mamadou Simina, Pape Mbagnick N’Diaye, Serigne Abdoul Aziz Niang, Ismaila Diallo, Astou Sarr, Ahmed Gueye, Demba Ndao Niang. On the characterization of Cloud occurrence and its impact on solar radiation in Mbour, Senegal, Journal of Atmospheric and Solar-Terrestrial Physics 2024, 261, 106284, ISSN 1364-6826. [CrossRef]
- IRENA. Senegal Renewables Readiness Assessment. 2012. IRENA. Available at: https://www.irena.org/-/media/Files/IRENA/Agency/Publication/2013/IRENA-Senegal-RRA.pdf?rev=7b-9208bf1bba443c805e154fe6804cbd.
- IRENA. Planning and prospects for renewable power: WEST AFRICA. International Renewable Energy Agency (IRENA). 2018. Available at: https://www.irena.org/-/media/Files/IRENA/ Agency/Publication/2018/Nov/IRENA_Planning_West_Africa_2018.pdf.
- Niang, S.A.A., Drame, M.S., Gueye, A. et al. Temporal dynamics of energy production at the Taïba Ndiaye wind farm in Senegal. Discover Energy 2023, 3, 6. [CrossRef]
- Bilal, B. O., Ndongo, M., Kebe, C. M. F., Sambou, V., & Ndiaye, P. A. Feasibility study of wind energy potential for electricity generation in the northwestern coast of Senegal. Energy Procedia 2013, 36, 1119-1129. [CrossRef]
- DTU, World Bank Group, ESMAP and Vortex (2023) Global Wind Atlas. Available at: Available at: https://globalwindatlas.info/en.
- Sterl, S., Vanderkelen, I., Chawanda, C.J., et al. (2020). Smart renewable electricity portfolios in West Africa, Nature Sustainability 2020, 3. [CrossRef]
- Niang, S.A.A., Drame, M.S., Gueye, A. et al. Analysis and simulation of six solar power plants seasonal production in Senegal, West Africa. Model. Earth Syst. Environ. 2024, 10, 1543–1554. [CrossRef]
- Ba, Amadou., Alphousseyni, N., Mamadou, T., & Senghane, M. Energy situation of Senegal: sub-sector of electricity. J. P. Soaphys 2020, Vol 2, N°1. [CrossRef]
- NewClimate Institute. Integration of Renewable Energy in Senegal: Potential and Opportunities. 2023. Available at:https://newclimate.org/sites/default/files/2023-08/NewClimate_RenewableSenegal_FR_23.pdf.
- Kang, T., Lim, D. Y., Tayara, H., & Chong, K. T. (2020). Forecasting of power demands using deep learning. Applied Sciences 2020, 10(20), 7241. [CrossRef]
- Kim, T. Y., & Cho, S. B. Predicting residential energy consumption using CNN-LSTM neural networks. Energy 2019, 182, 72-81. [CrossRef]
- Somu, N., MR, G. R., & Ramamritham, K. A deep learning framework for building energy consumption forecast. Renewable and Sustainable Energy Reviews 2021, 137, 110591. [CrossRef]
- Song, X., Liu, Y., Xue, L., Wang, J., Zhang, J., Wang, J., ... & Cheng, Z. Time-series well performance prediction based on Long Short-Term Memory (LSTM) neural network model. Journal of Petroleum Science and Engineering 2020, 186, 106682. [CrossRef]
- World Bank. The World Bank Annual Report 2020, 2020. [CrossRef]
- ENDA Energie. Étude sur la situation de base des énergies renouvelables et de l’efficacité énergétique au Sénégal. 2018. Available at: http://test.endaenergie.org/wp1/wpcontent/uploads/Situation_Base_Senegal-Final.pdf.
- Tchanche, B. Analyse du système énergétique du Sénégal. Journal of Renewable Energies 2018, 21(1), 73-88. https://www.cder.dz/download/Art21-1_9.pdf.
- Plan d’Actions National des Energies Renouvelables (PANER) SENEGAL, Période [2015-2020/2030]. (2015). Available at: https://faolex.fao.org/docs/pdf/sen221046.pdf.
- Ahmadou Saïd Ba. Analyse de la politique d’efficacité énergétique du Sénégal : Barrières et perspectives. [Rapport de recherche] Université Paris Dauphine PSL. 2018. https://hal.science/hal-01956216v2.
- U.S. Energy Information Administration. Energy Institute Statistical Review of World Energy (2023). Population based onvarious sources (2023). 2023. Available at: https://ourworldindata.org/.
- IEA. World Energy Statistics and Balances, IEA, Paris. 2023. Available at: https://www.iea.org/data-and-statistics/data-product/world-energy-statistics-and-balances.
- Climatewatch. 2021. Available at: https://www.climatewatchdata.org/countries/SEN?end_year=2021&start_year=1990.
- IRENA. Scaling up renewable energy deployment in Africa. 2020. Available at: https://www.irena.org/media/Files/IRENA/Agency/Publication/2020/Feb/IRENA_Africa_Impact_Report_2020.pdf.
- IRENA. Hydrogen: A renewable energy perspective, International Renewable Energy Agency, 2019. https://www.irena.org/-/media/Files/IRENA/Agency/Publication/2019/Sep/IRENA_Hydrogen_2019.pdf.
- Ministère du Pétrole et des Energies. http://www.energie.gouv.sn/les-agences/.
- Comité de régulation du secteur de l’électricité. Producteurs indépendants. 2020. http://www.crse.sn/index.php/ producteurs-indépendants.
- CRSE. Rapport annuel 2014. 2014. Available at: http://www.CRSE.sn/sites/default/files/2017 04/RapportCRSE-2014.pdf.
- Agence Nationale de la statistique et de la démographie. 2023. Available at: http://www.ansd.sn.
- AIE. CO2 Emissions from Fuel Combustion 2016, Editions OCDE, Paris, 2016. [CrossRef]
- Wane, A., & Kaïré, M. Climate finance technical and policy notes: Bridging the WAEMU climate policy gaps to access climate finance. 2023. https://www.sparc-knowledge.org.
- Ember. Energy Institute—Statistical Review of World Energy 2024. Available at: https://ourworldindata.org/energy.
- SENELEC. 2023. Available at: https://www.senelec.sn/chiffres-cls.
- Matteo Maillard. Le Sénégal achève le plus grand parc éolien d’Afrique de l’Ouest, Le Monde Planète. 2020. Available at: https://www.lemonde.fr/planete/article/2020/01/08/le-senegal-acheve-le-plus-grand-parc-eolien-d-afrique-de-l-ouest_6025114_3244.html.
- Banque mondiale, Sénégal-Vue d’ensemble. 2024. Available at: https://www.banquemondiale.org/fr/country/senegal/overview.
- Costas Arkolakis & Conor Walsh. “Clean Growth, NBER Working Papers 31615, National Bureau of Economic Research, Inc. 2023. https://static1.squarespace.com/static/5b4b997eda02bc592b5131cd/t/64e38ceeb5dae75b3b9cb7e3/1692634362860/CleanGrowth.pdf.
- Tchanche, B. Senegal devient producteur de pétrole : ce qui pourrait changer dans le pays. 2024. Available at: https://theconversation.com/le-senegal-devient-producteur-de-petrole-ce-qui-pourrait-changer-dans-le-pays-232860.
- Accès universel à l’électricité en 2025. 2020. https://acces-universel electricite.gouv.sn/IMG/pdf/prospectus_d_investissement_-_acces_universel_2025.pdf.
Figure 1.
Evolution of total annual energy production (GWh, top) and total population (millions, bottom) in Senegal from 2000 to 2023.
Figure 1.
Evolution of total annual energy production (GWh, top) and total population (millions, bottom) in Senegal from 2000 to 2023.
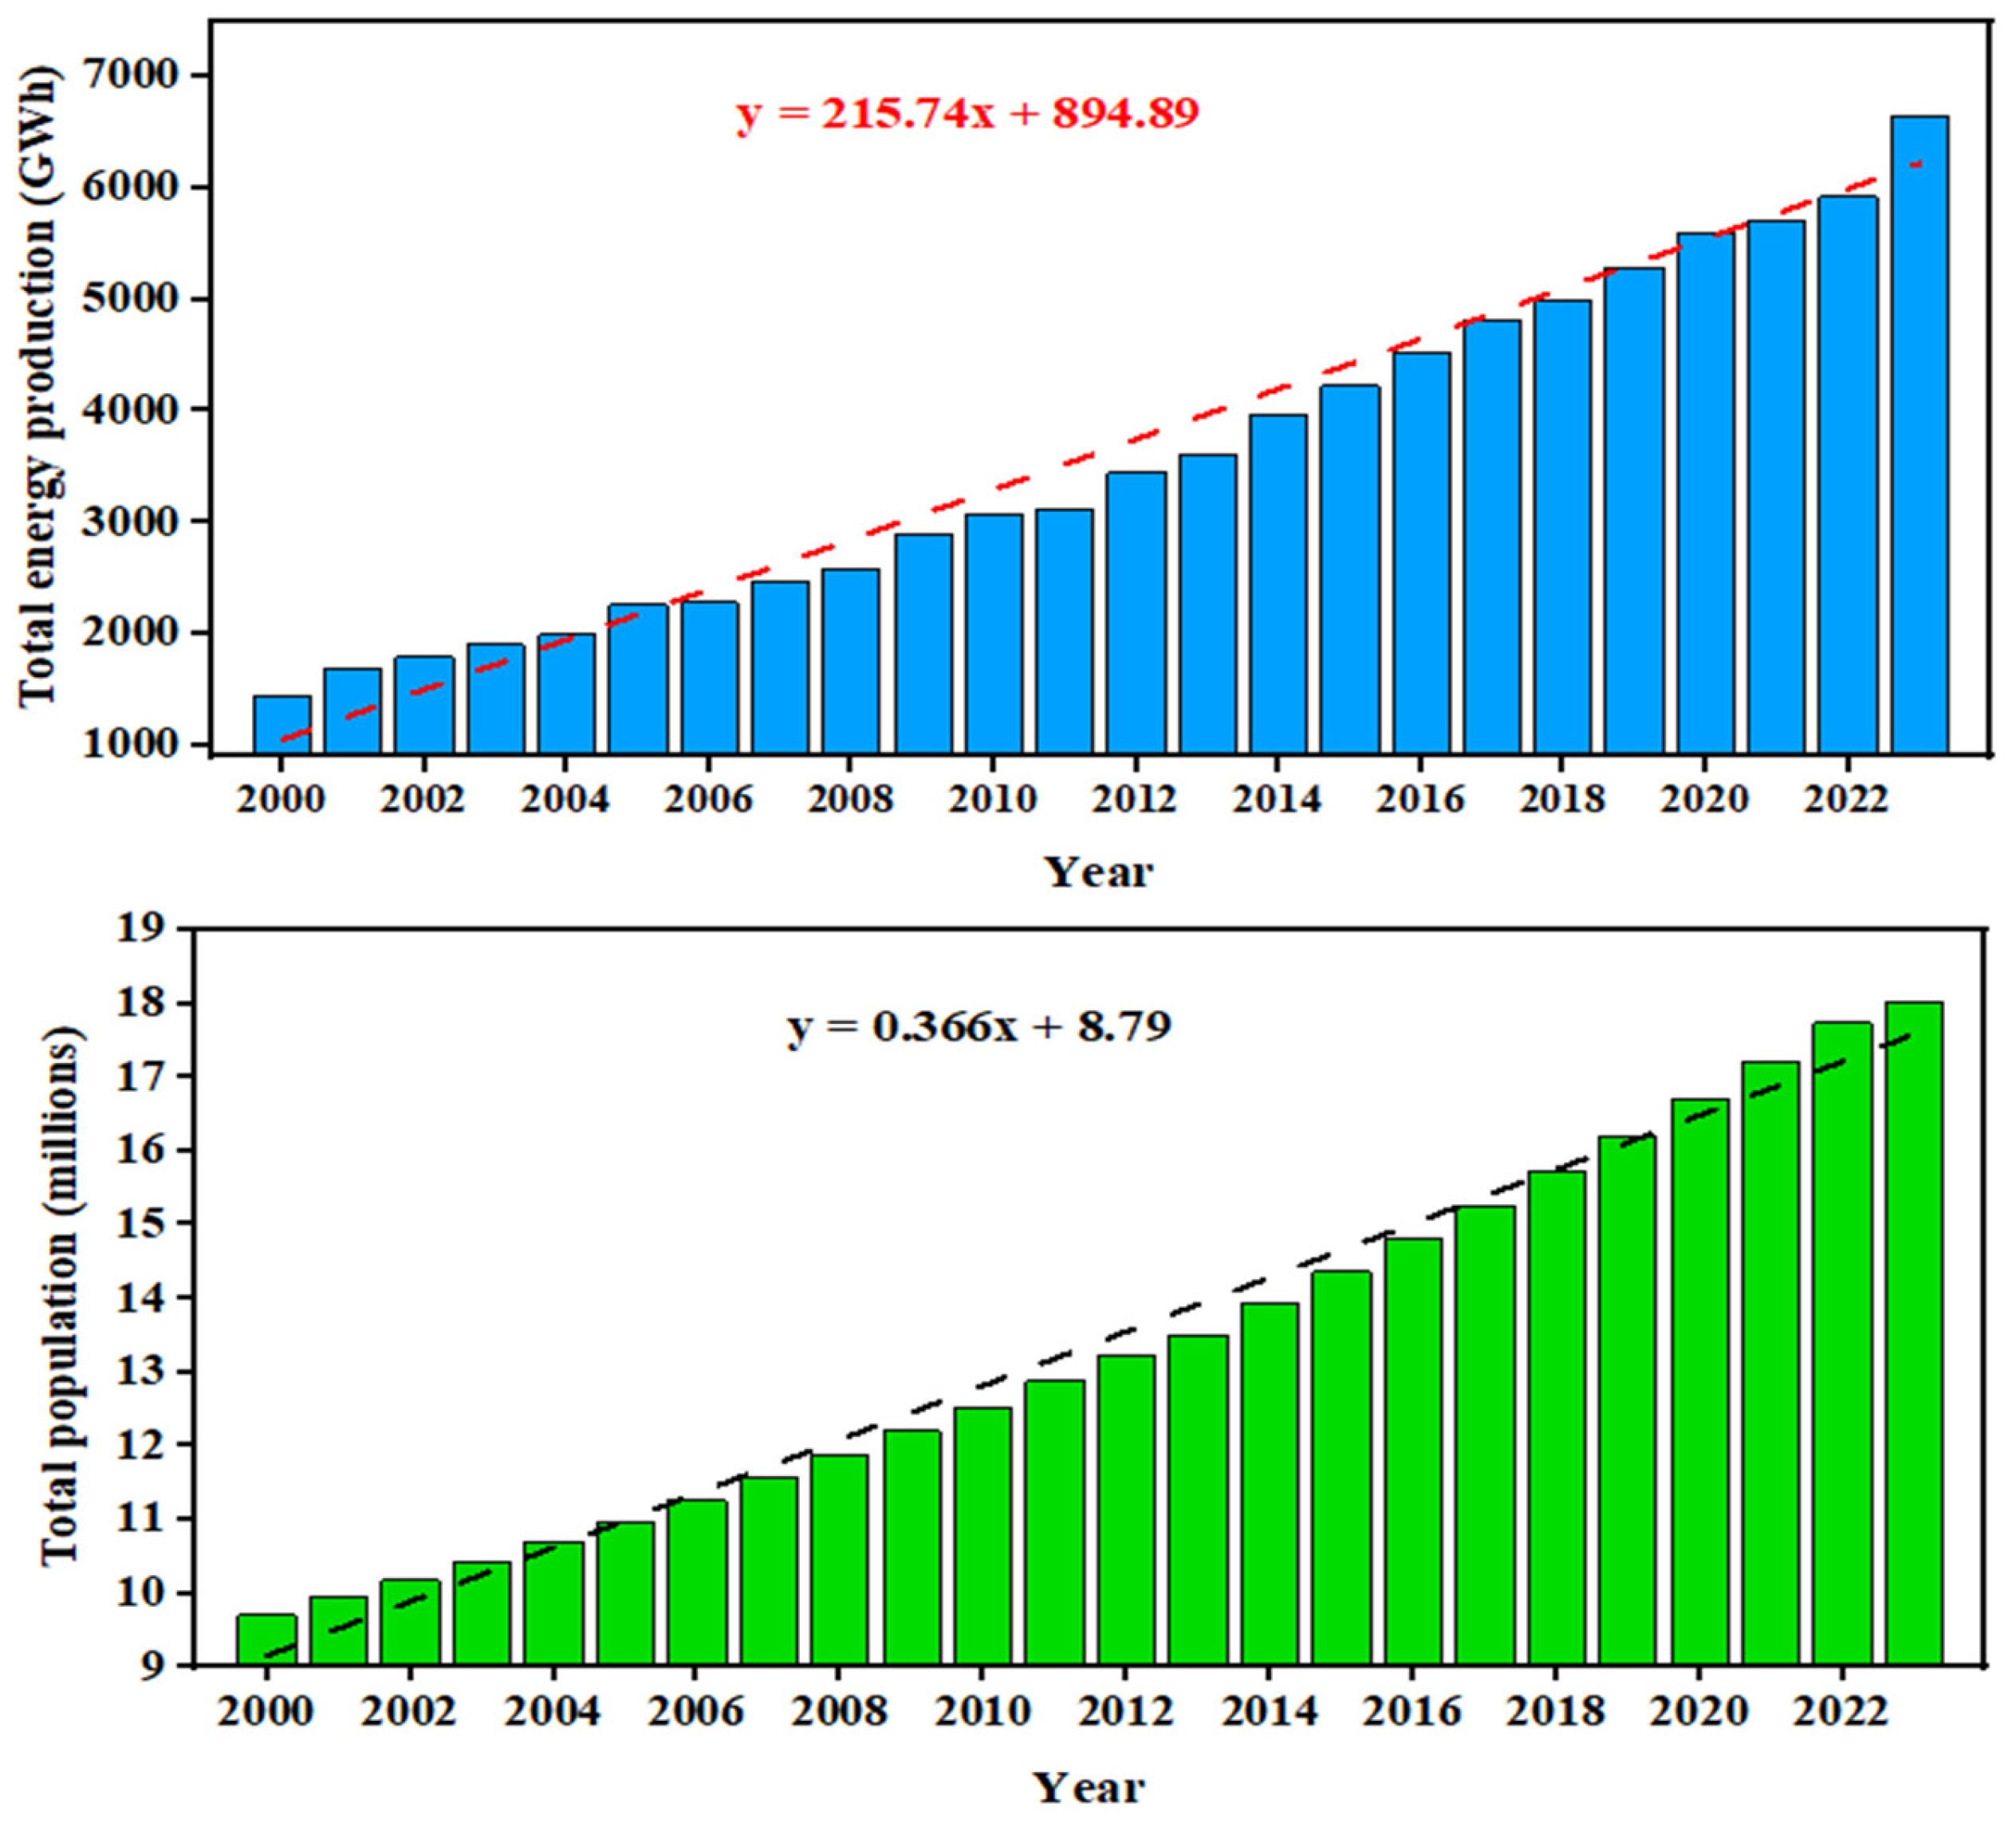
Figure 2.
Geographical (regional) distribution accross the 14 regions of (a) the population in 2023 and (b) the number of domestic subscribers by zone in 2023.
Figure 2.
Geographical (regional) distribution accross the 14 regions of (a) the population in 2023 and (b) the number of domestic subscribers by zone in 2023.
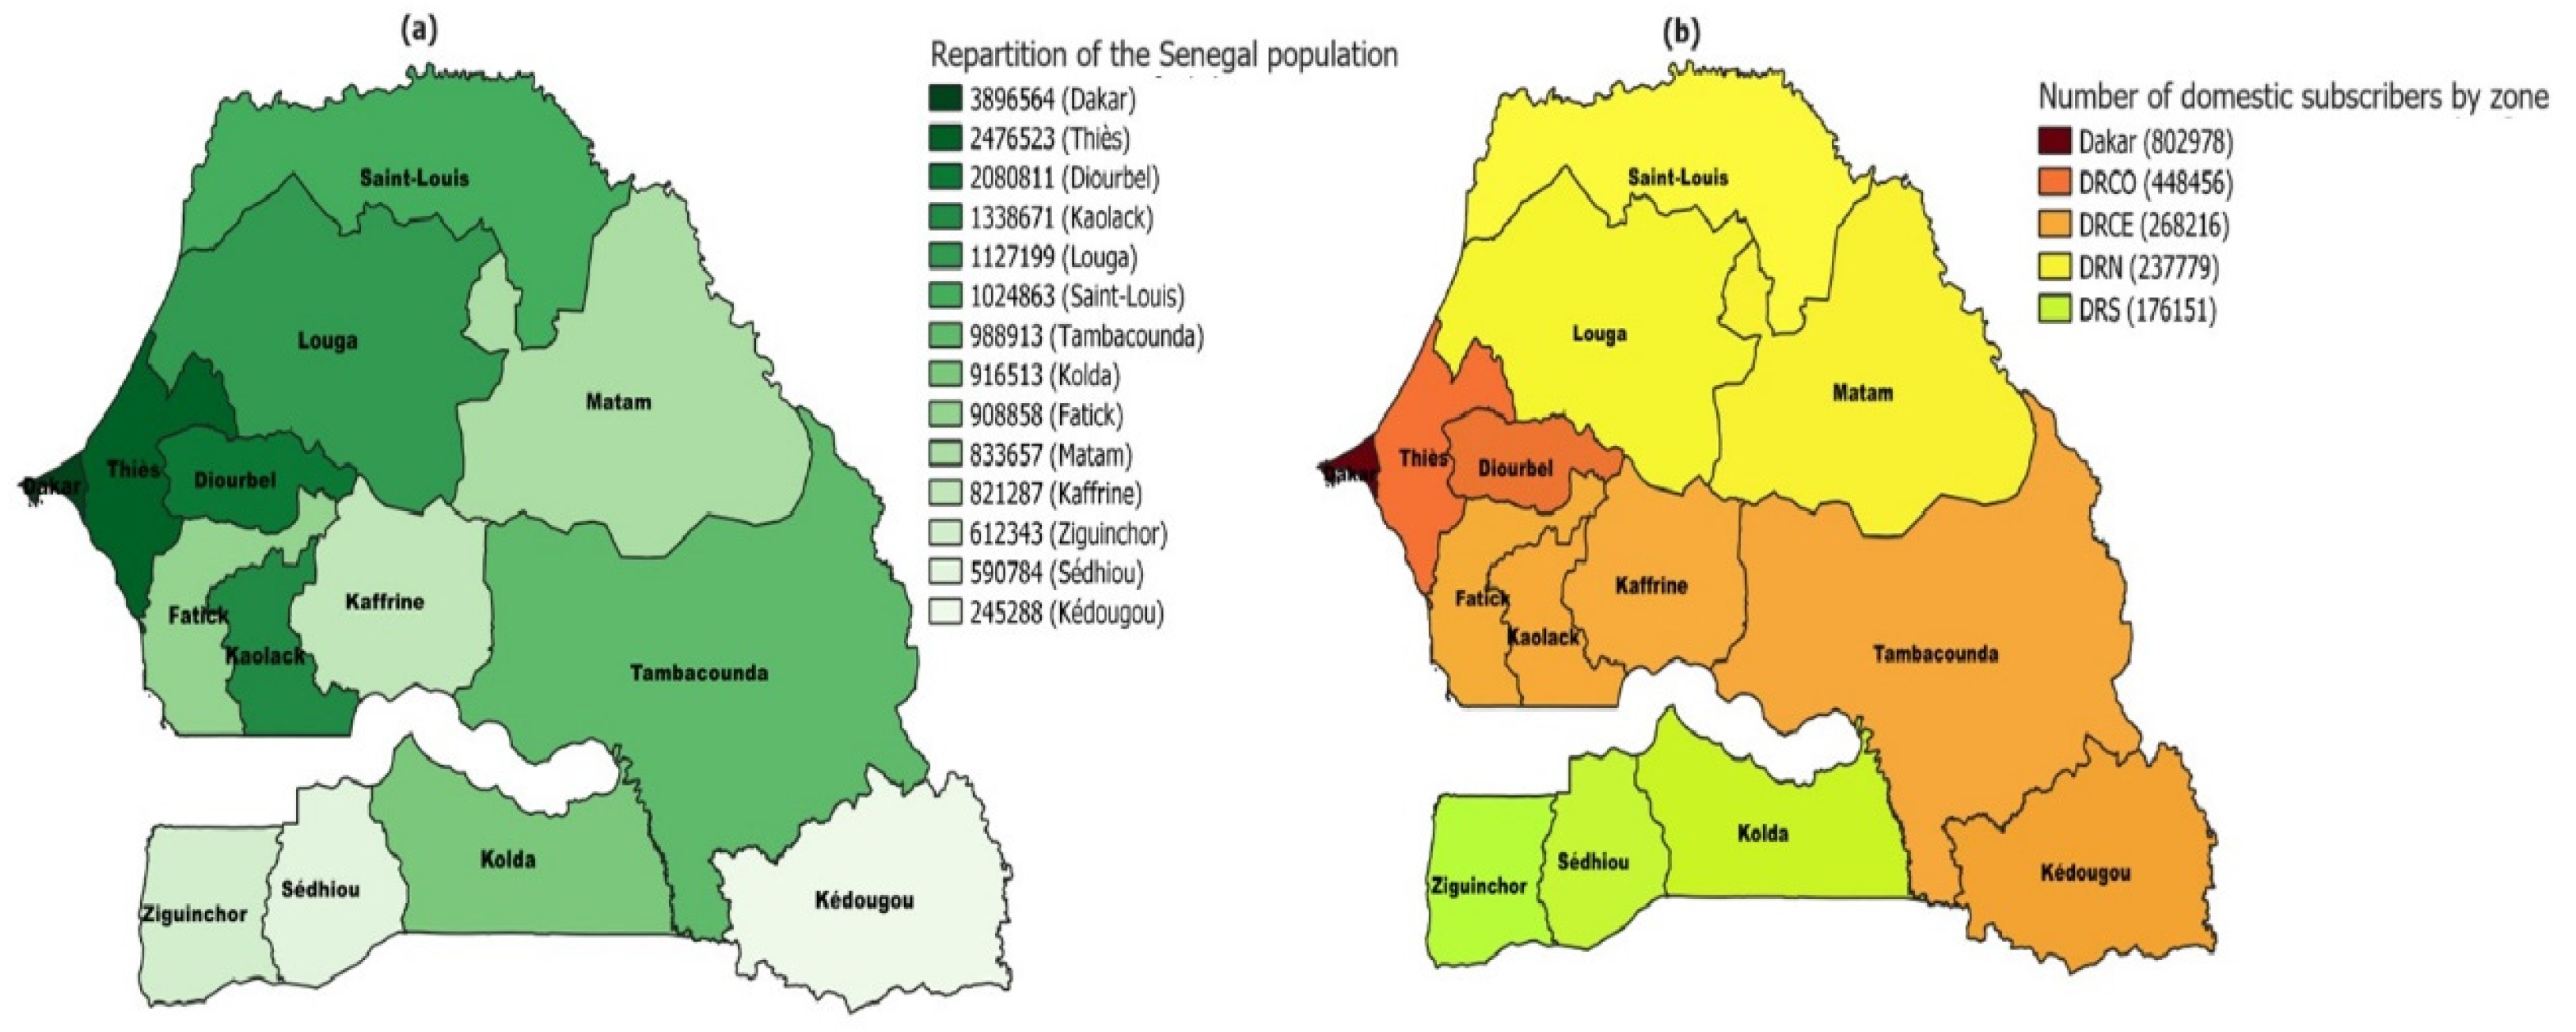
Figure 3.
Rate of electricity access (in %) for the entire population (a), rural population (b), and urban population (c) from 2000 to 2021.
Figure 3.
Rate of electricity access (in %) for the entire population (a), rural population (b), and urban population (c) from 2000 to 2021.
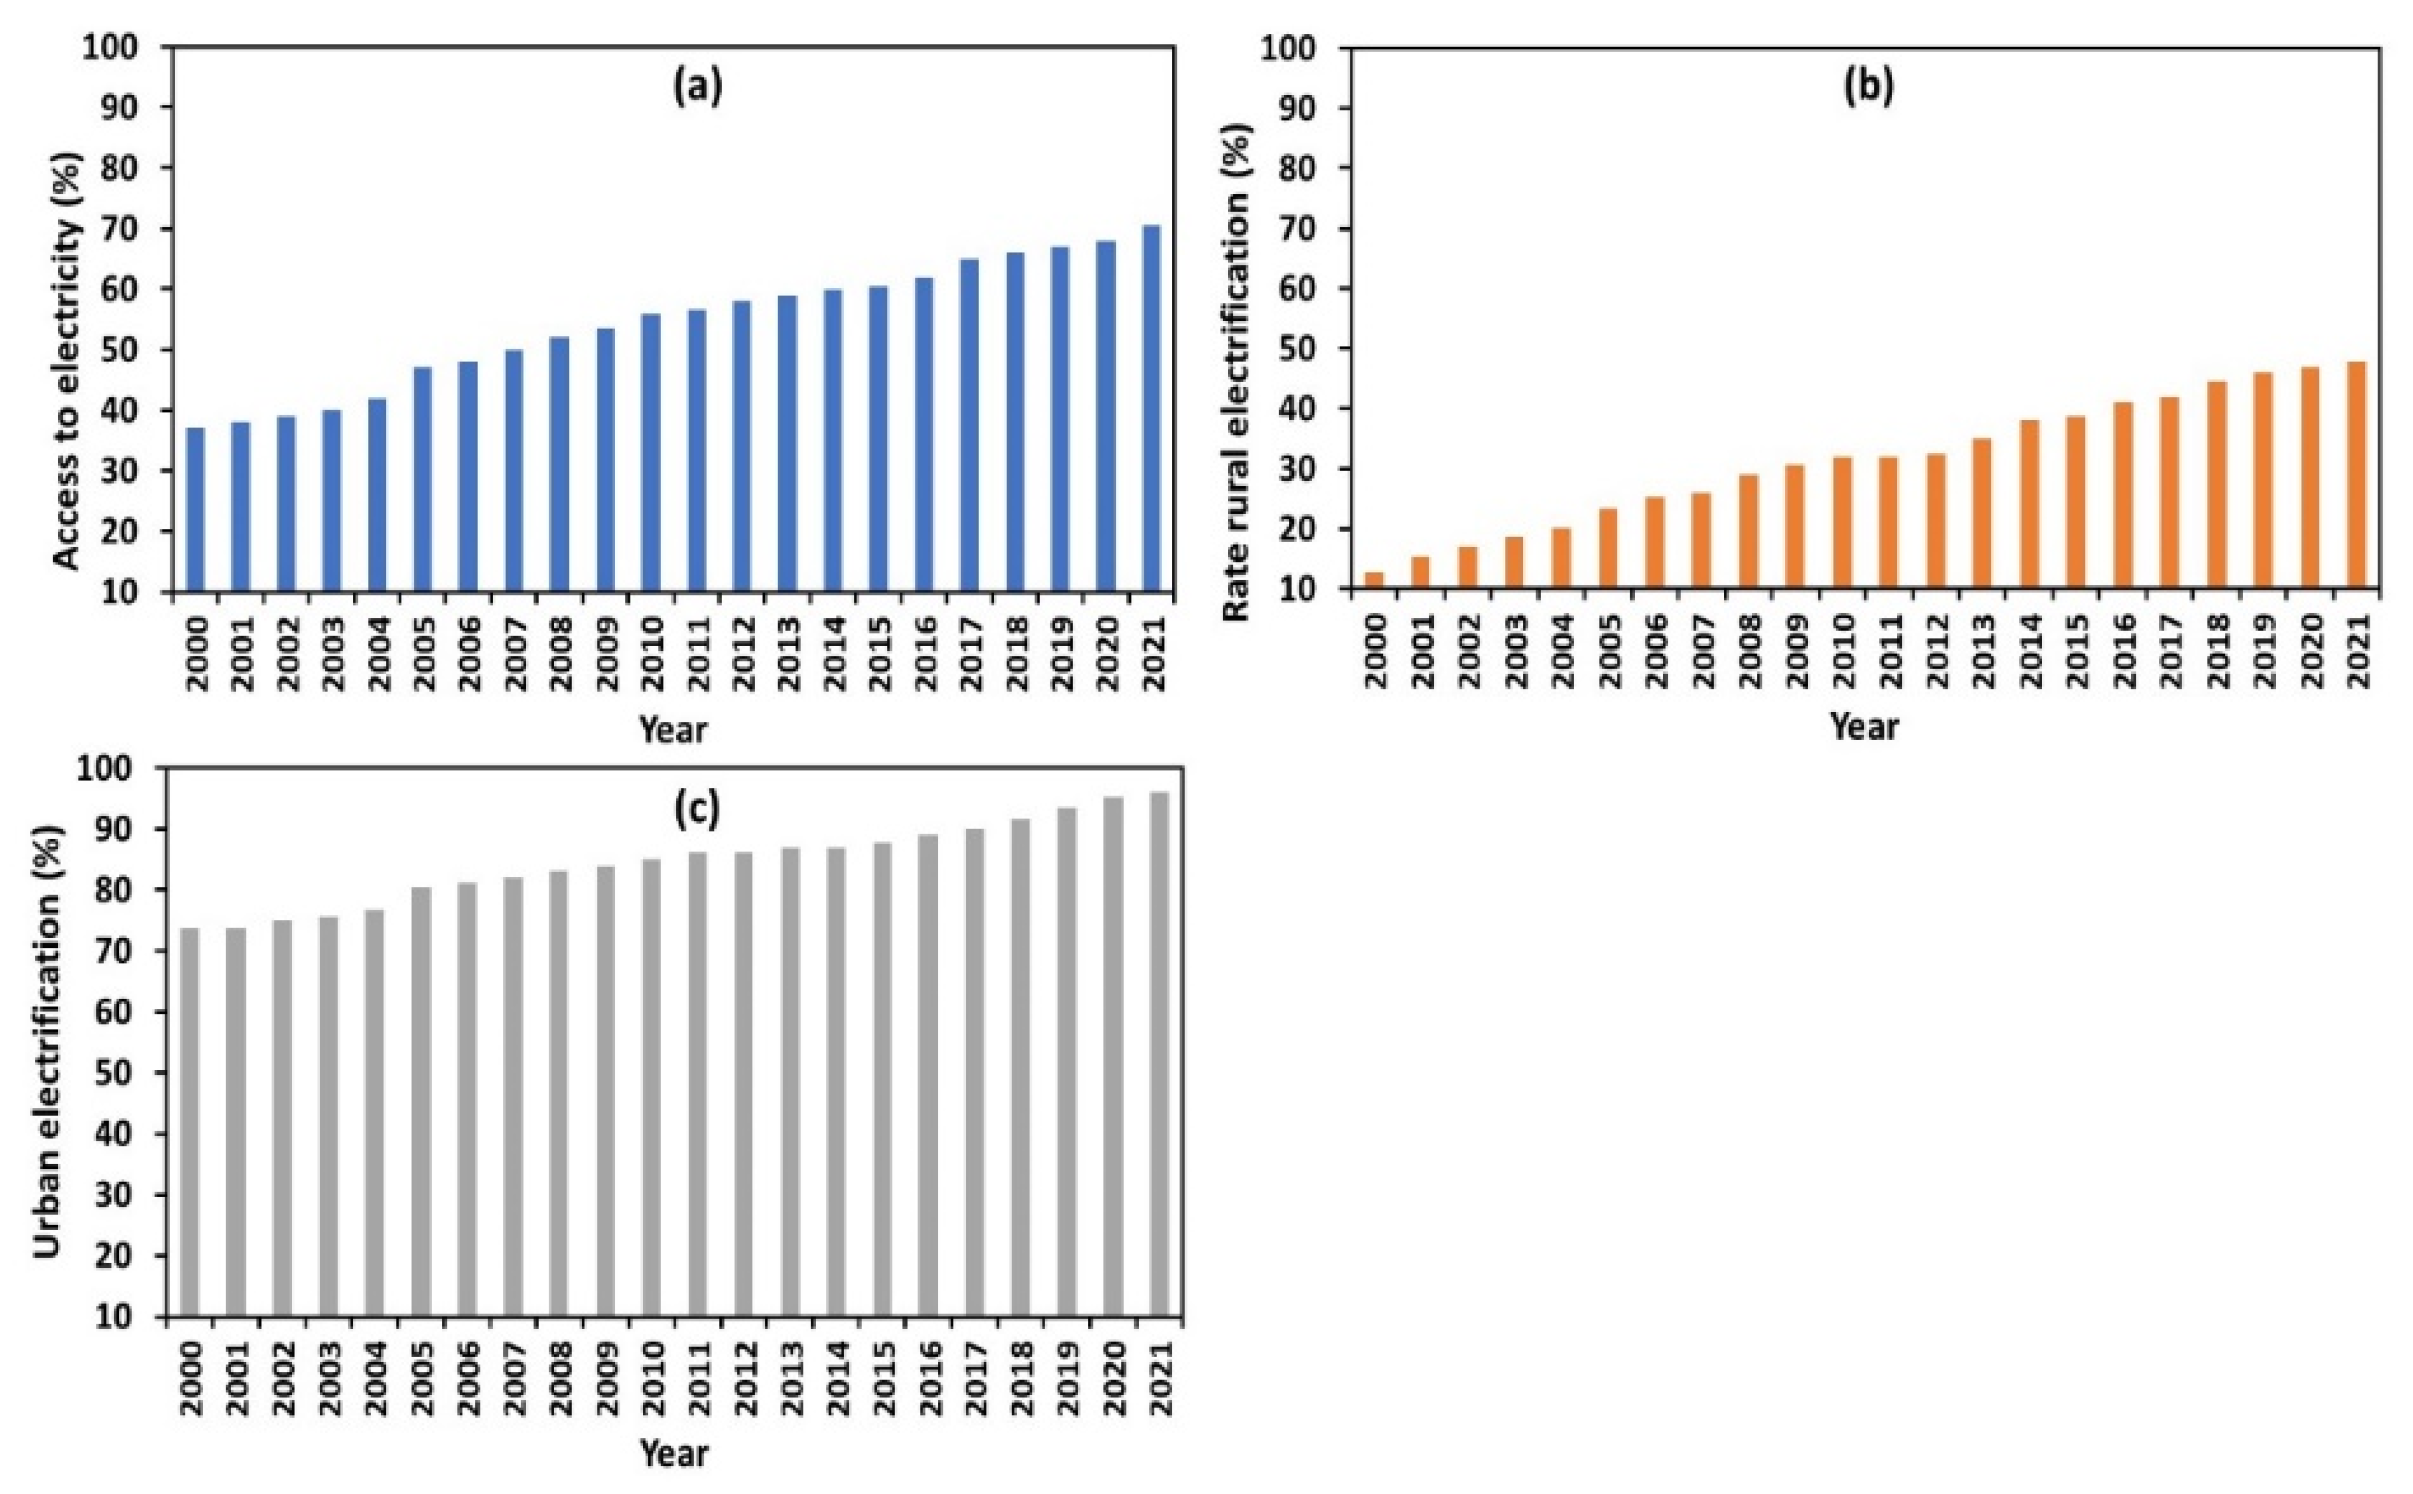
Figure 4.
Trends in nominal GDP per capita (red, in US $) and electricity consumption per capita (blue, in kWh) from 2000 to 2022 in Senegal.
Figure 4.
Trends in nominal GDP per capita (red, in US $) and electricity consumption per capita (blue, in kWh) from 2000 to 2022 in Senegal.
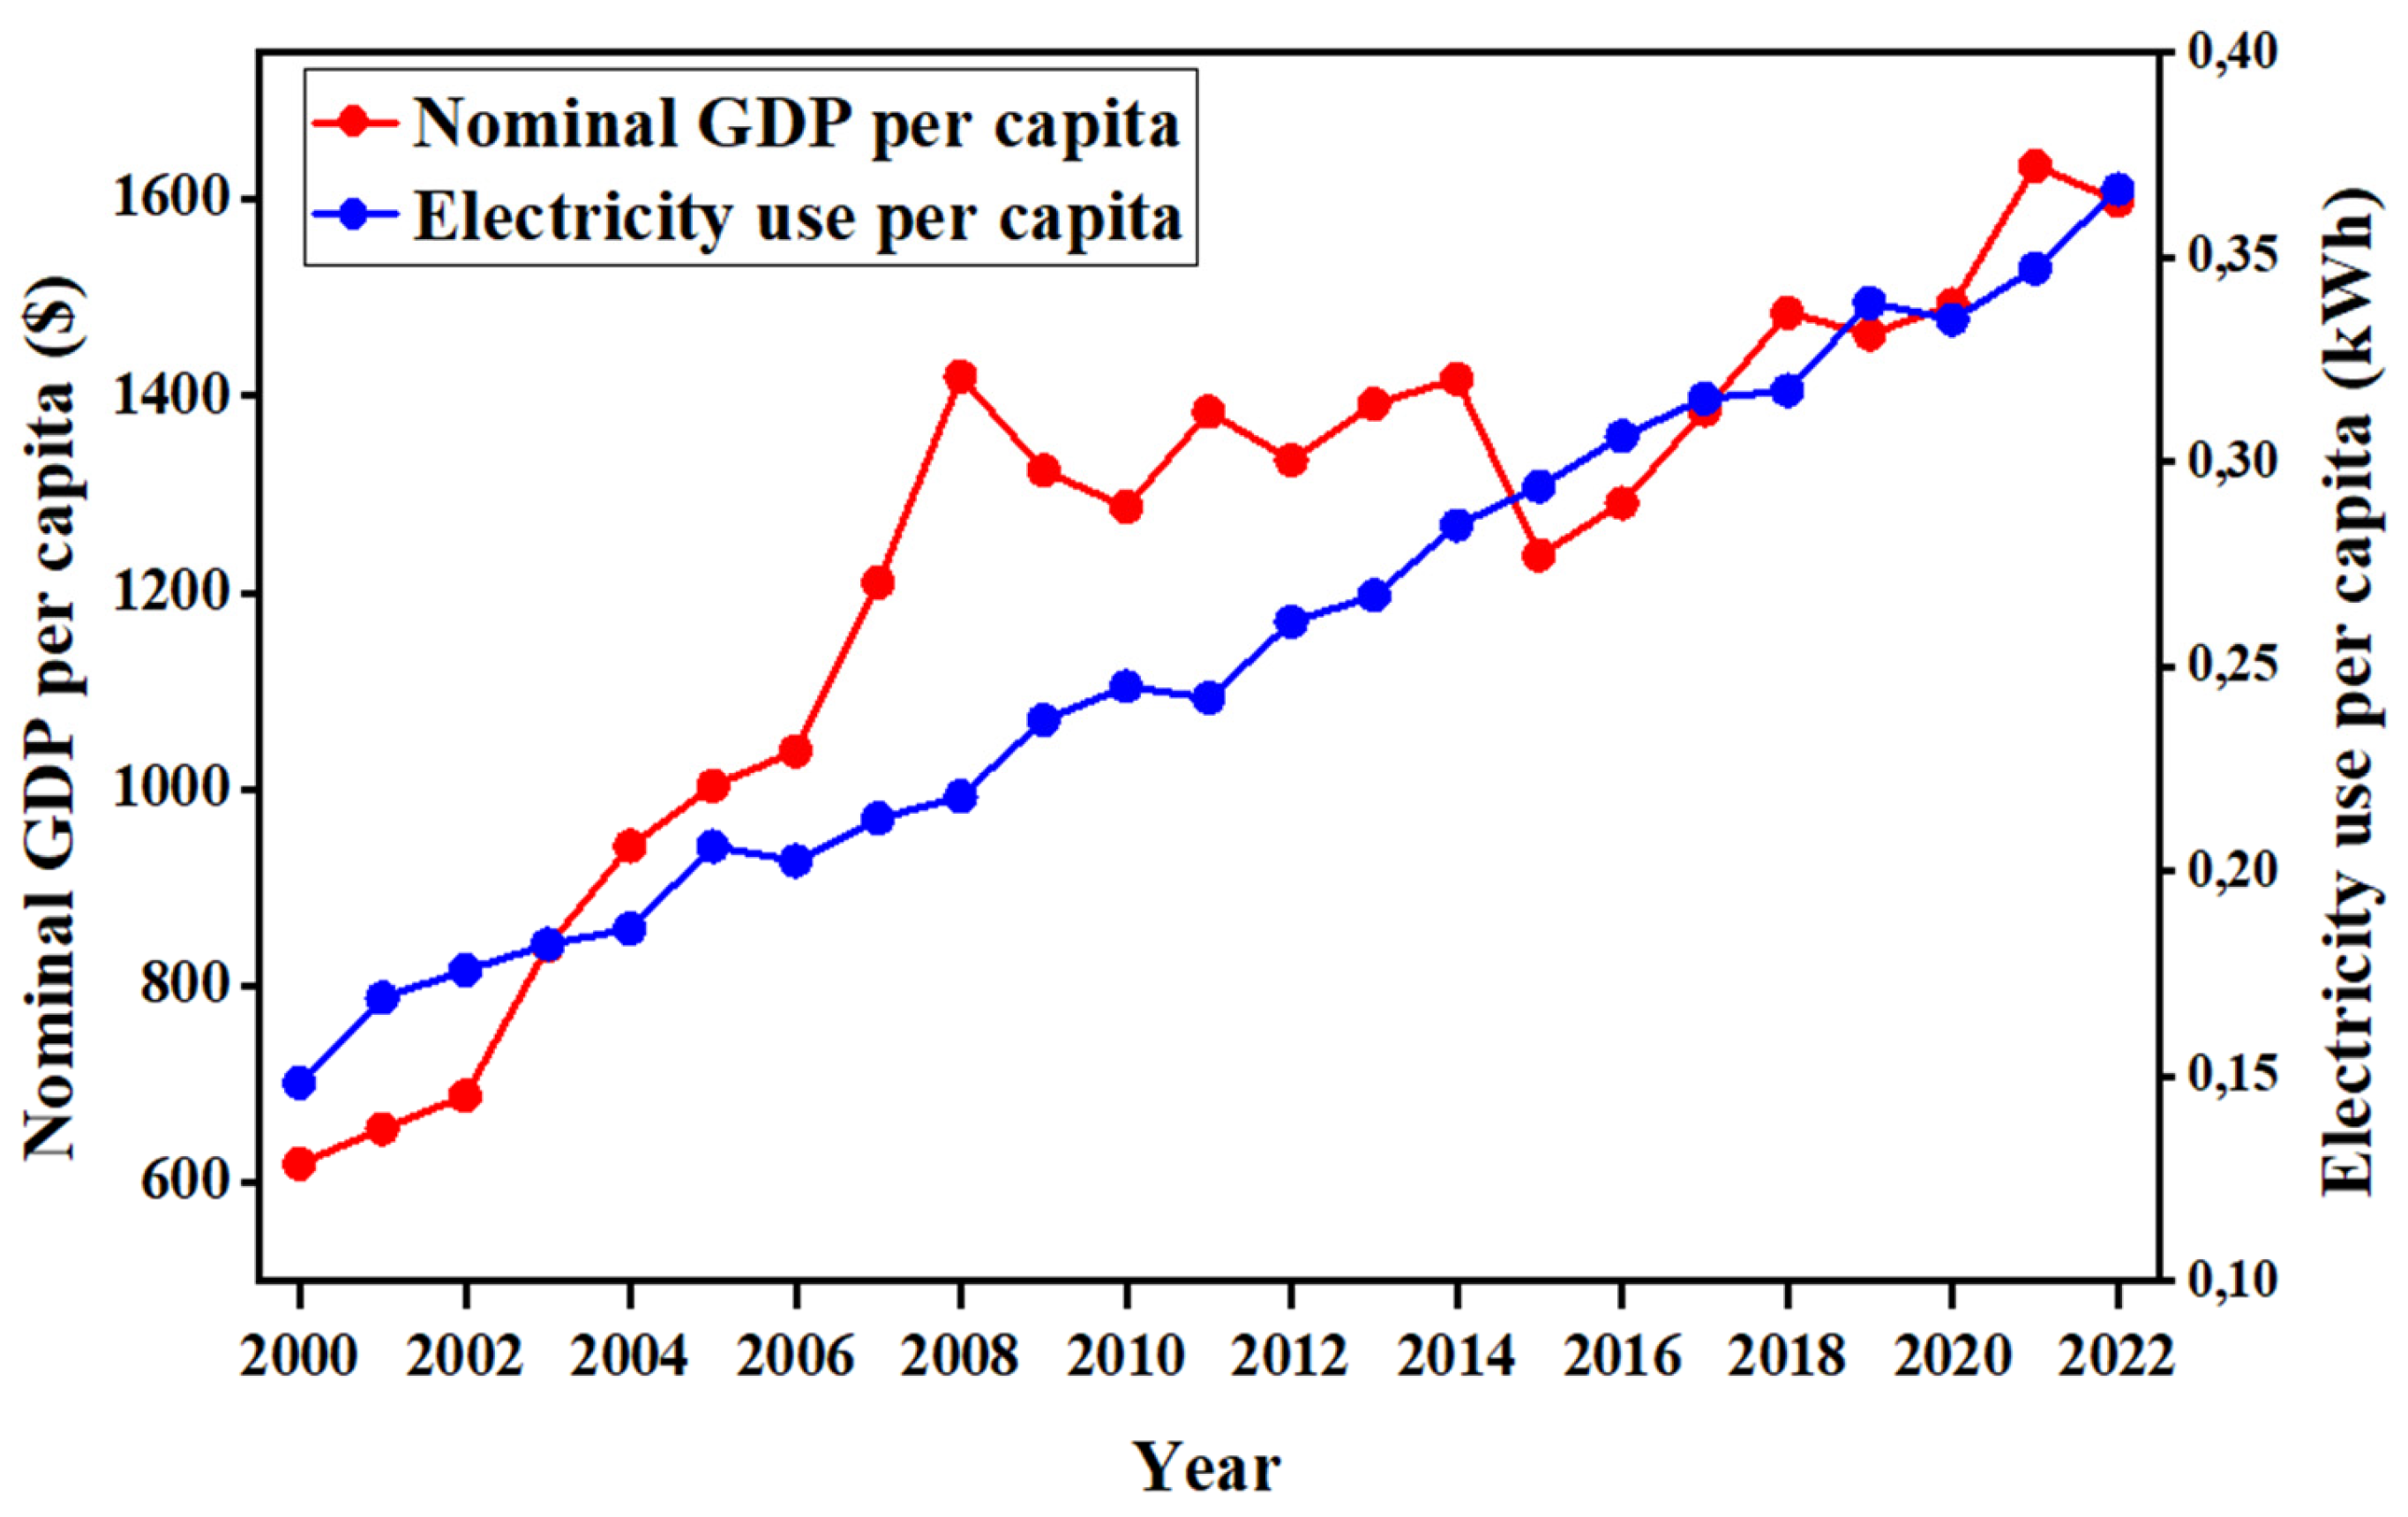
Figure 5.
Consumption share (%) for each subscription type LV (households), MV (Small-scale industry) and HV (large-scale industry) in 2000 (left), 2010 (middle) and 2022 (right).
Figure 5.
Consumption share (%) for each subscription type LV (households), MV (Small-scale industry) and HV (large-scale industry) in 2000 (left), 2010 (middle) and 2022 (right).
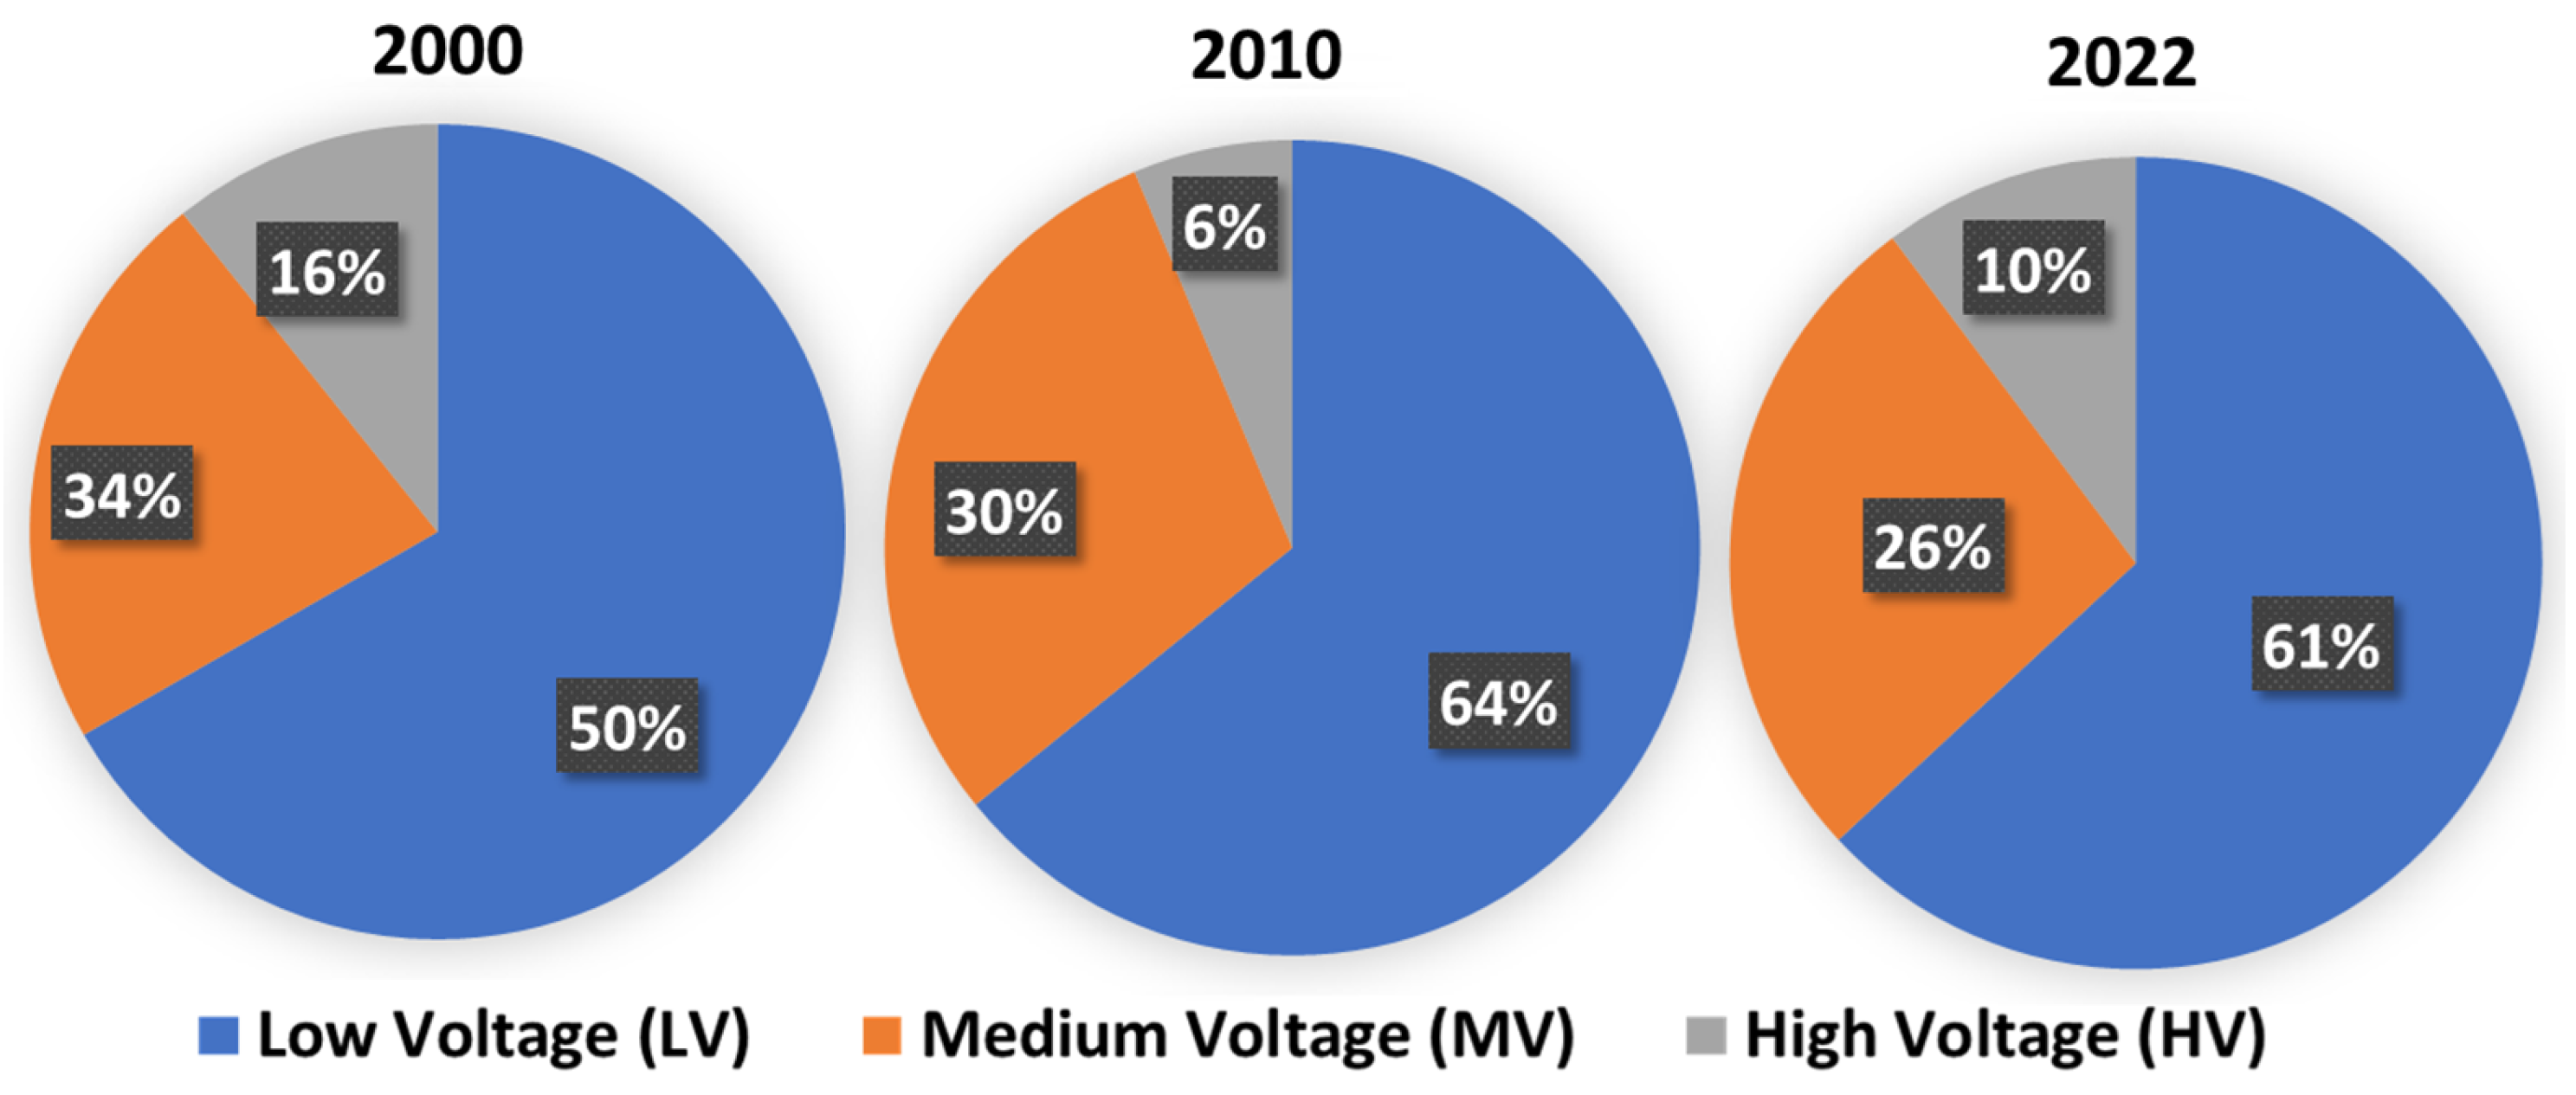
Figure 6.
Distribution of electricity consumption by sector in 2000 (left), 2010 (center), and 2021 (right).
Figure 6.
Distribution of electricity consumption by sector in 2000 (left), 2010 (center), and 2021 (right).
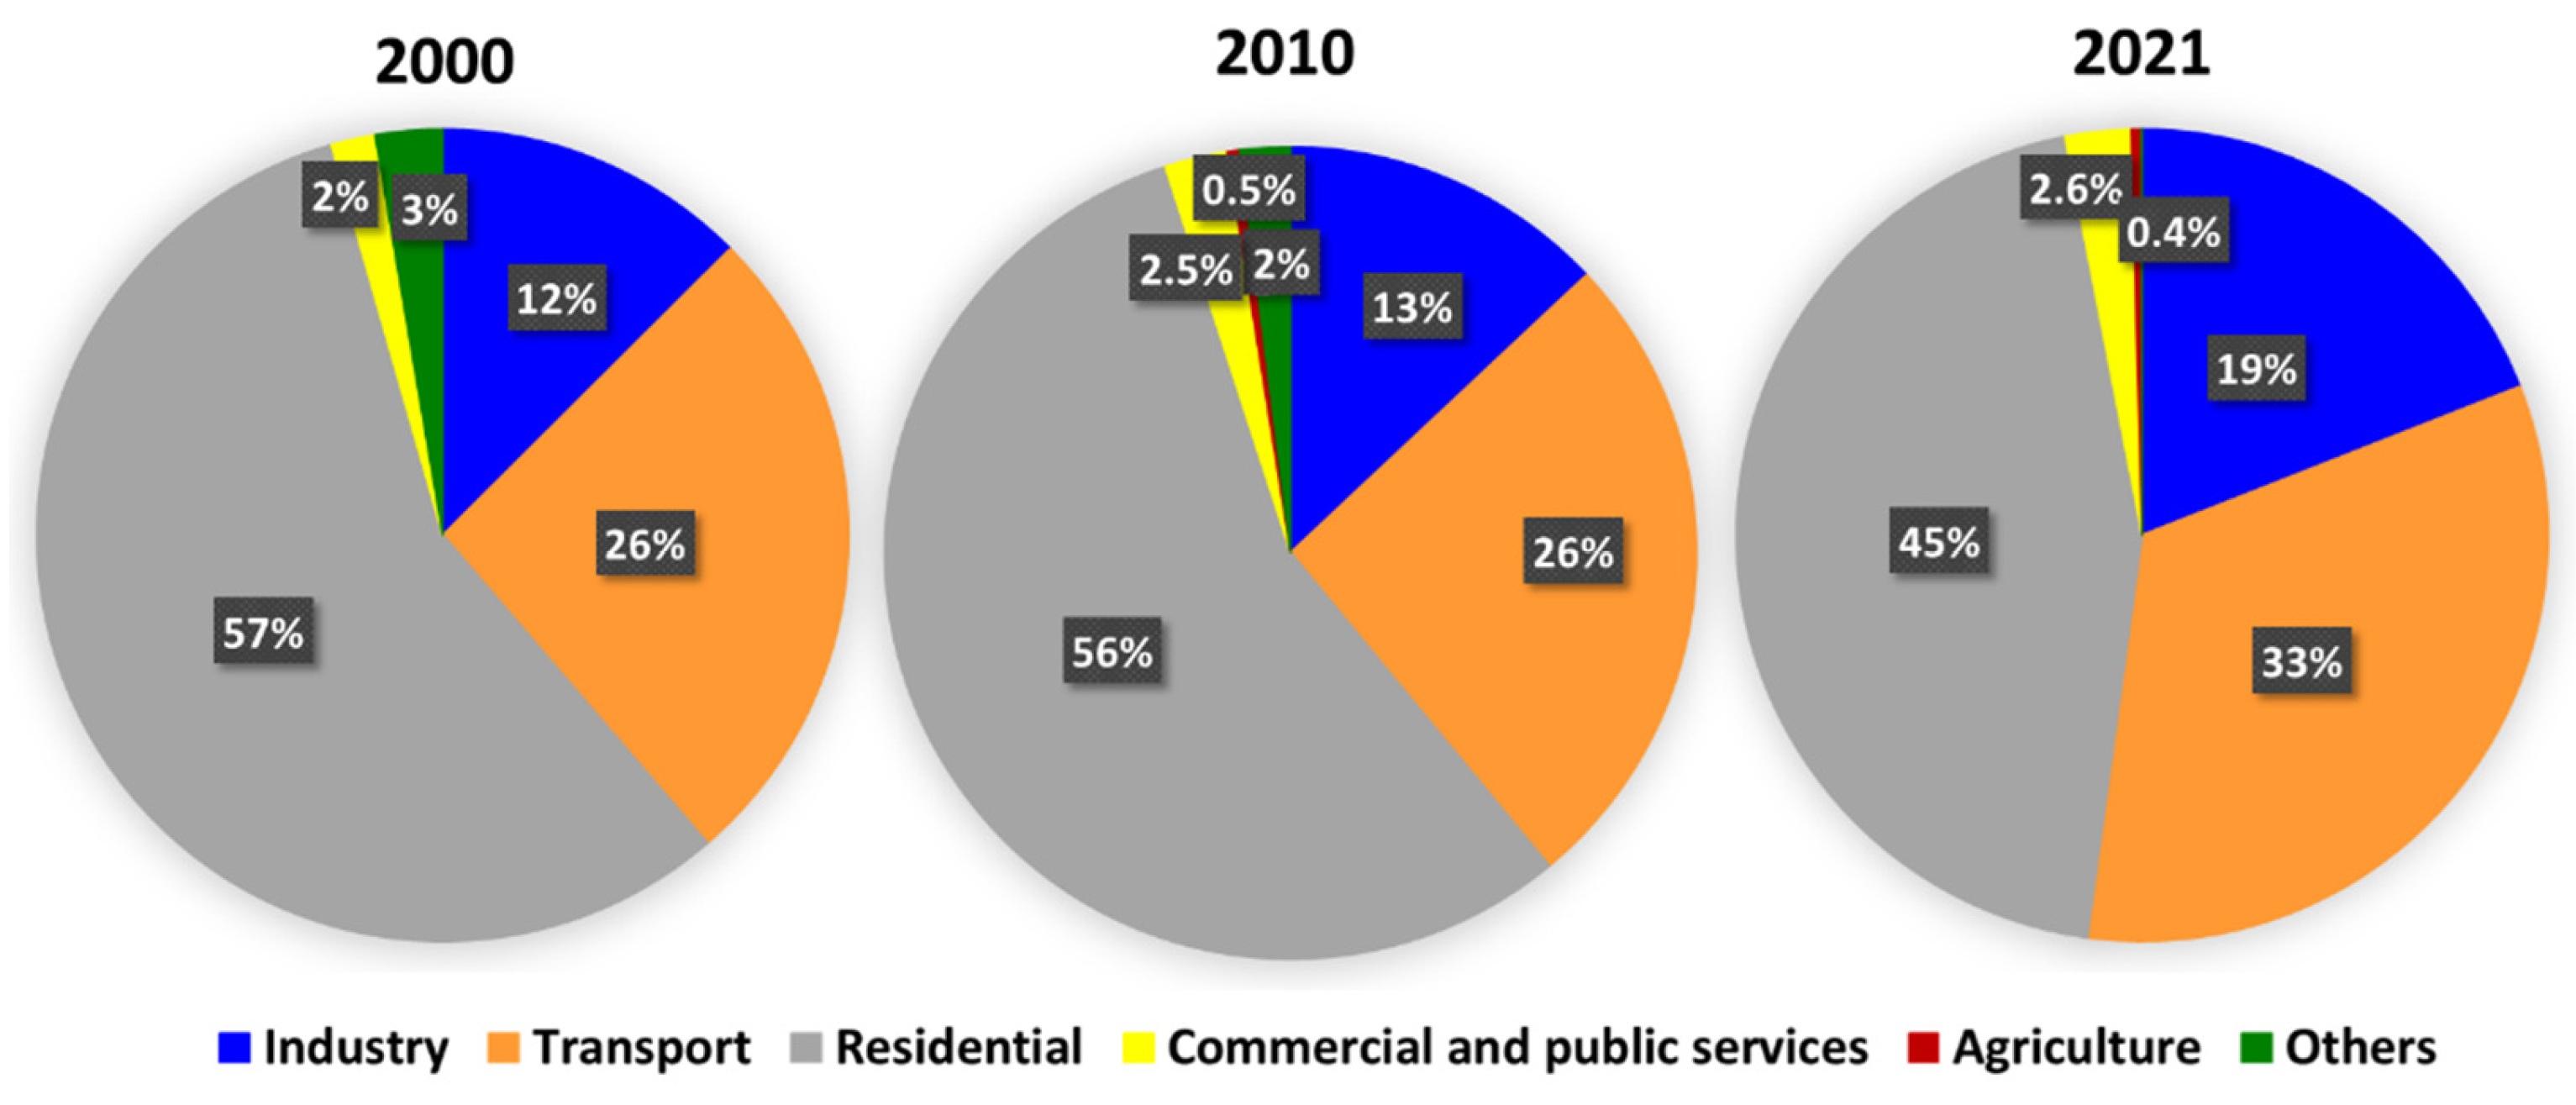
Figure 7.
Estimated greenhouse gas emissions (in %) by sector in Senegal in 2000 (left), 2010 (center), and 2021 (right).
Figure 7.
Estimated greenhouse gas emissions (in %) by sector in Senegal in 2000 (left), 2010 (center), and 2021 (right).
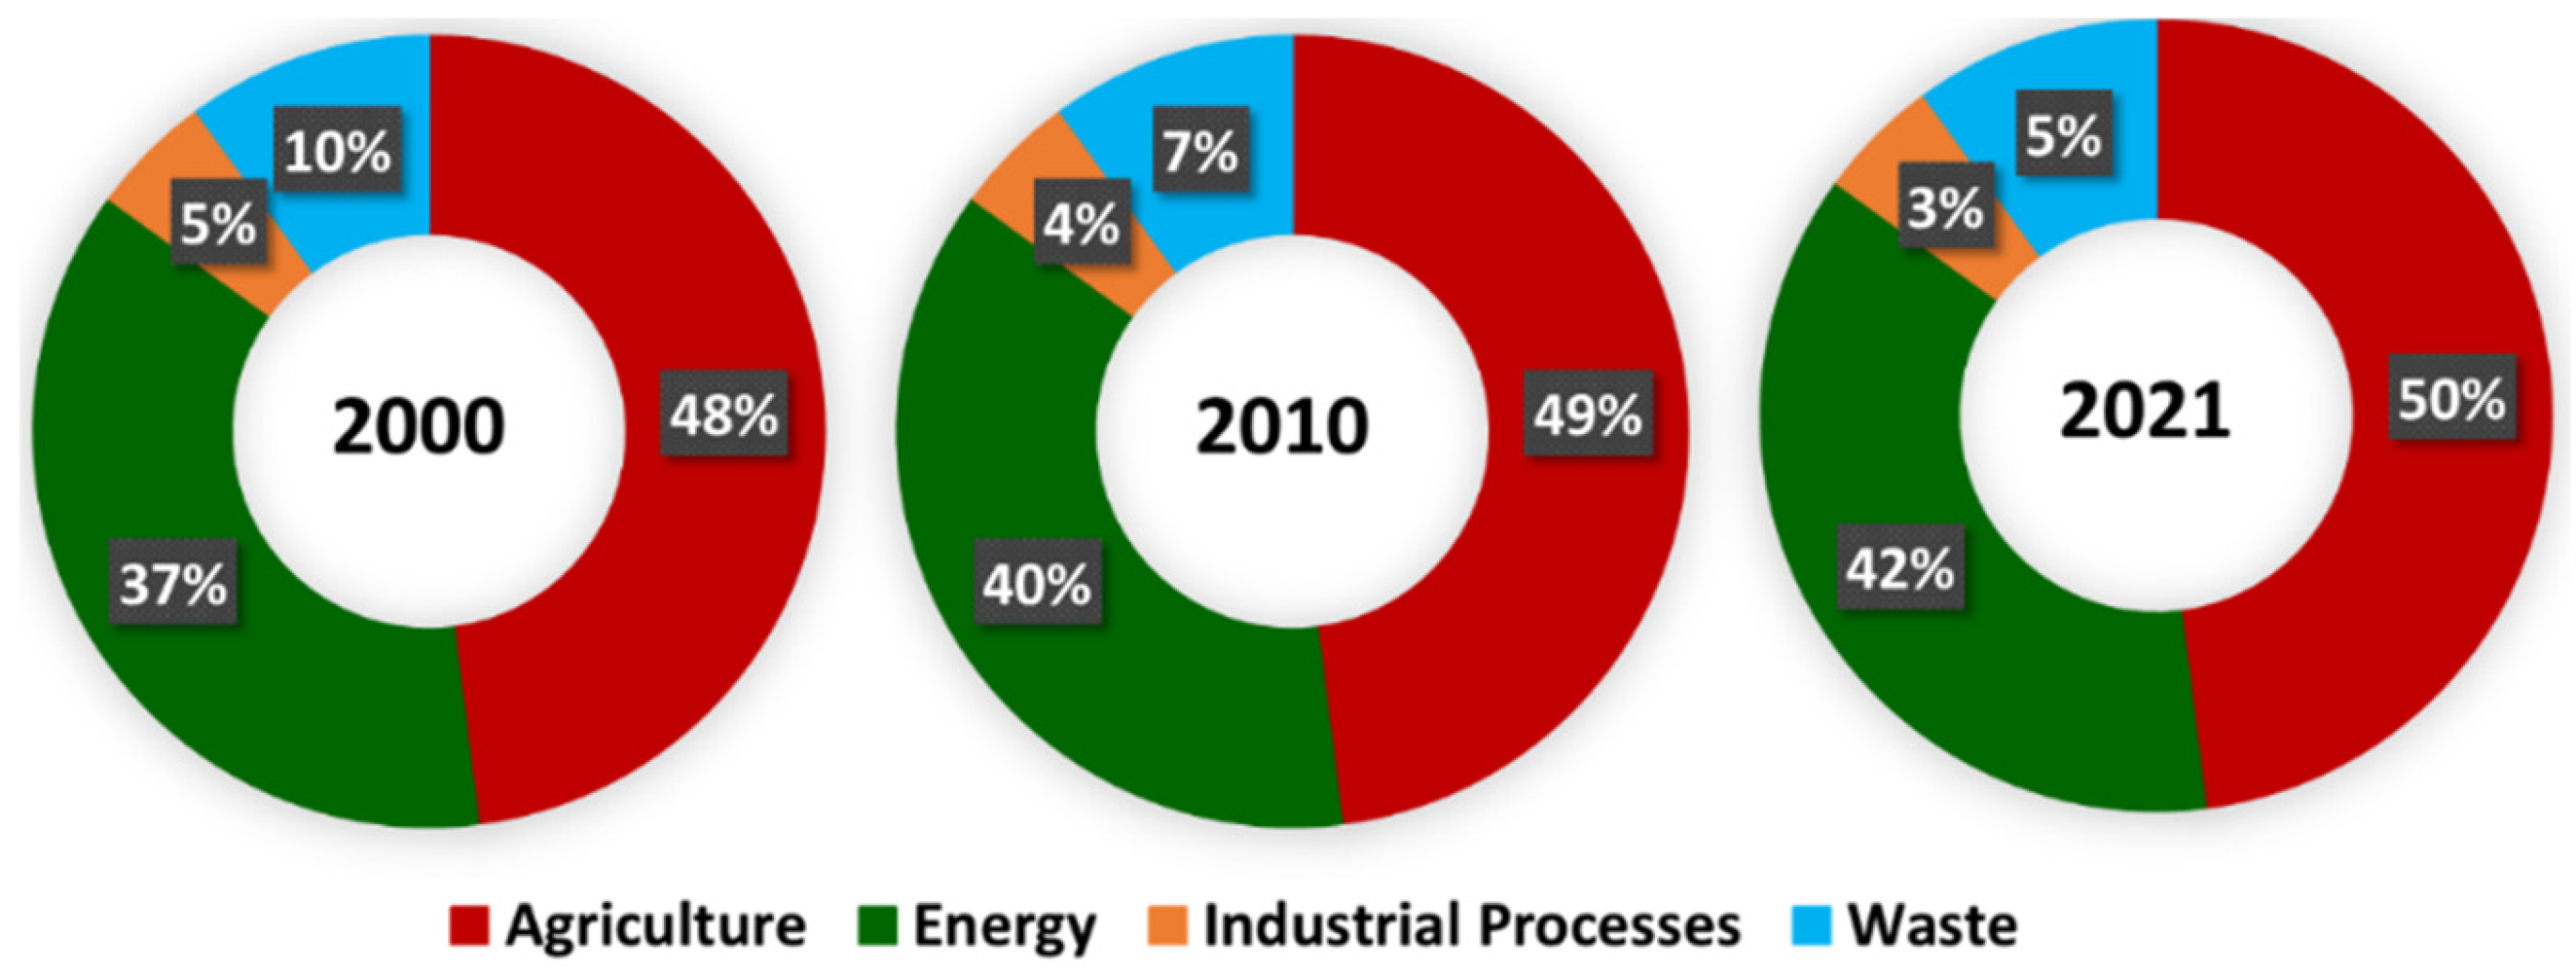
Figure 8.
Comparison of greenhouse gas emissions trends (in tCO2) per capita between Senegal and several other countries from 2000 to 2021. The top right inset is a close-up of Senegal’s emissions.
Figure 8.
Comparison of greenhouse gas emissions trends (in tCO2) per capita between Senegal and several other countries from 2000 to 2021. The top right inset is a close-up of Senegal’s emissions.
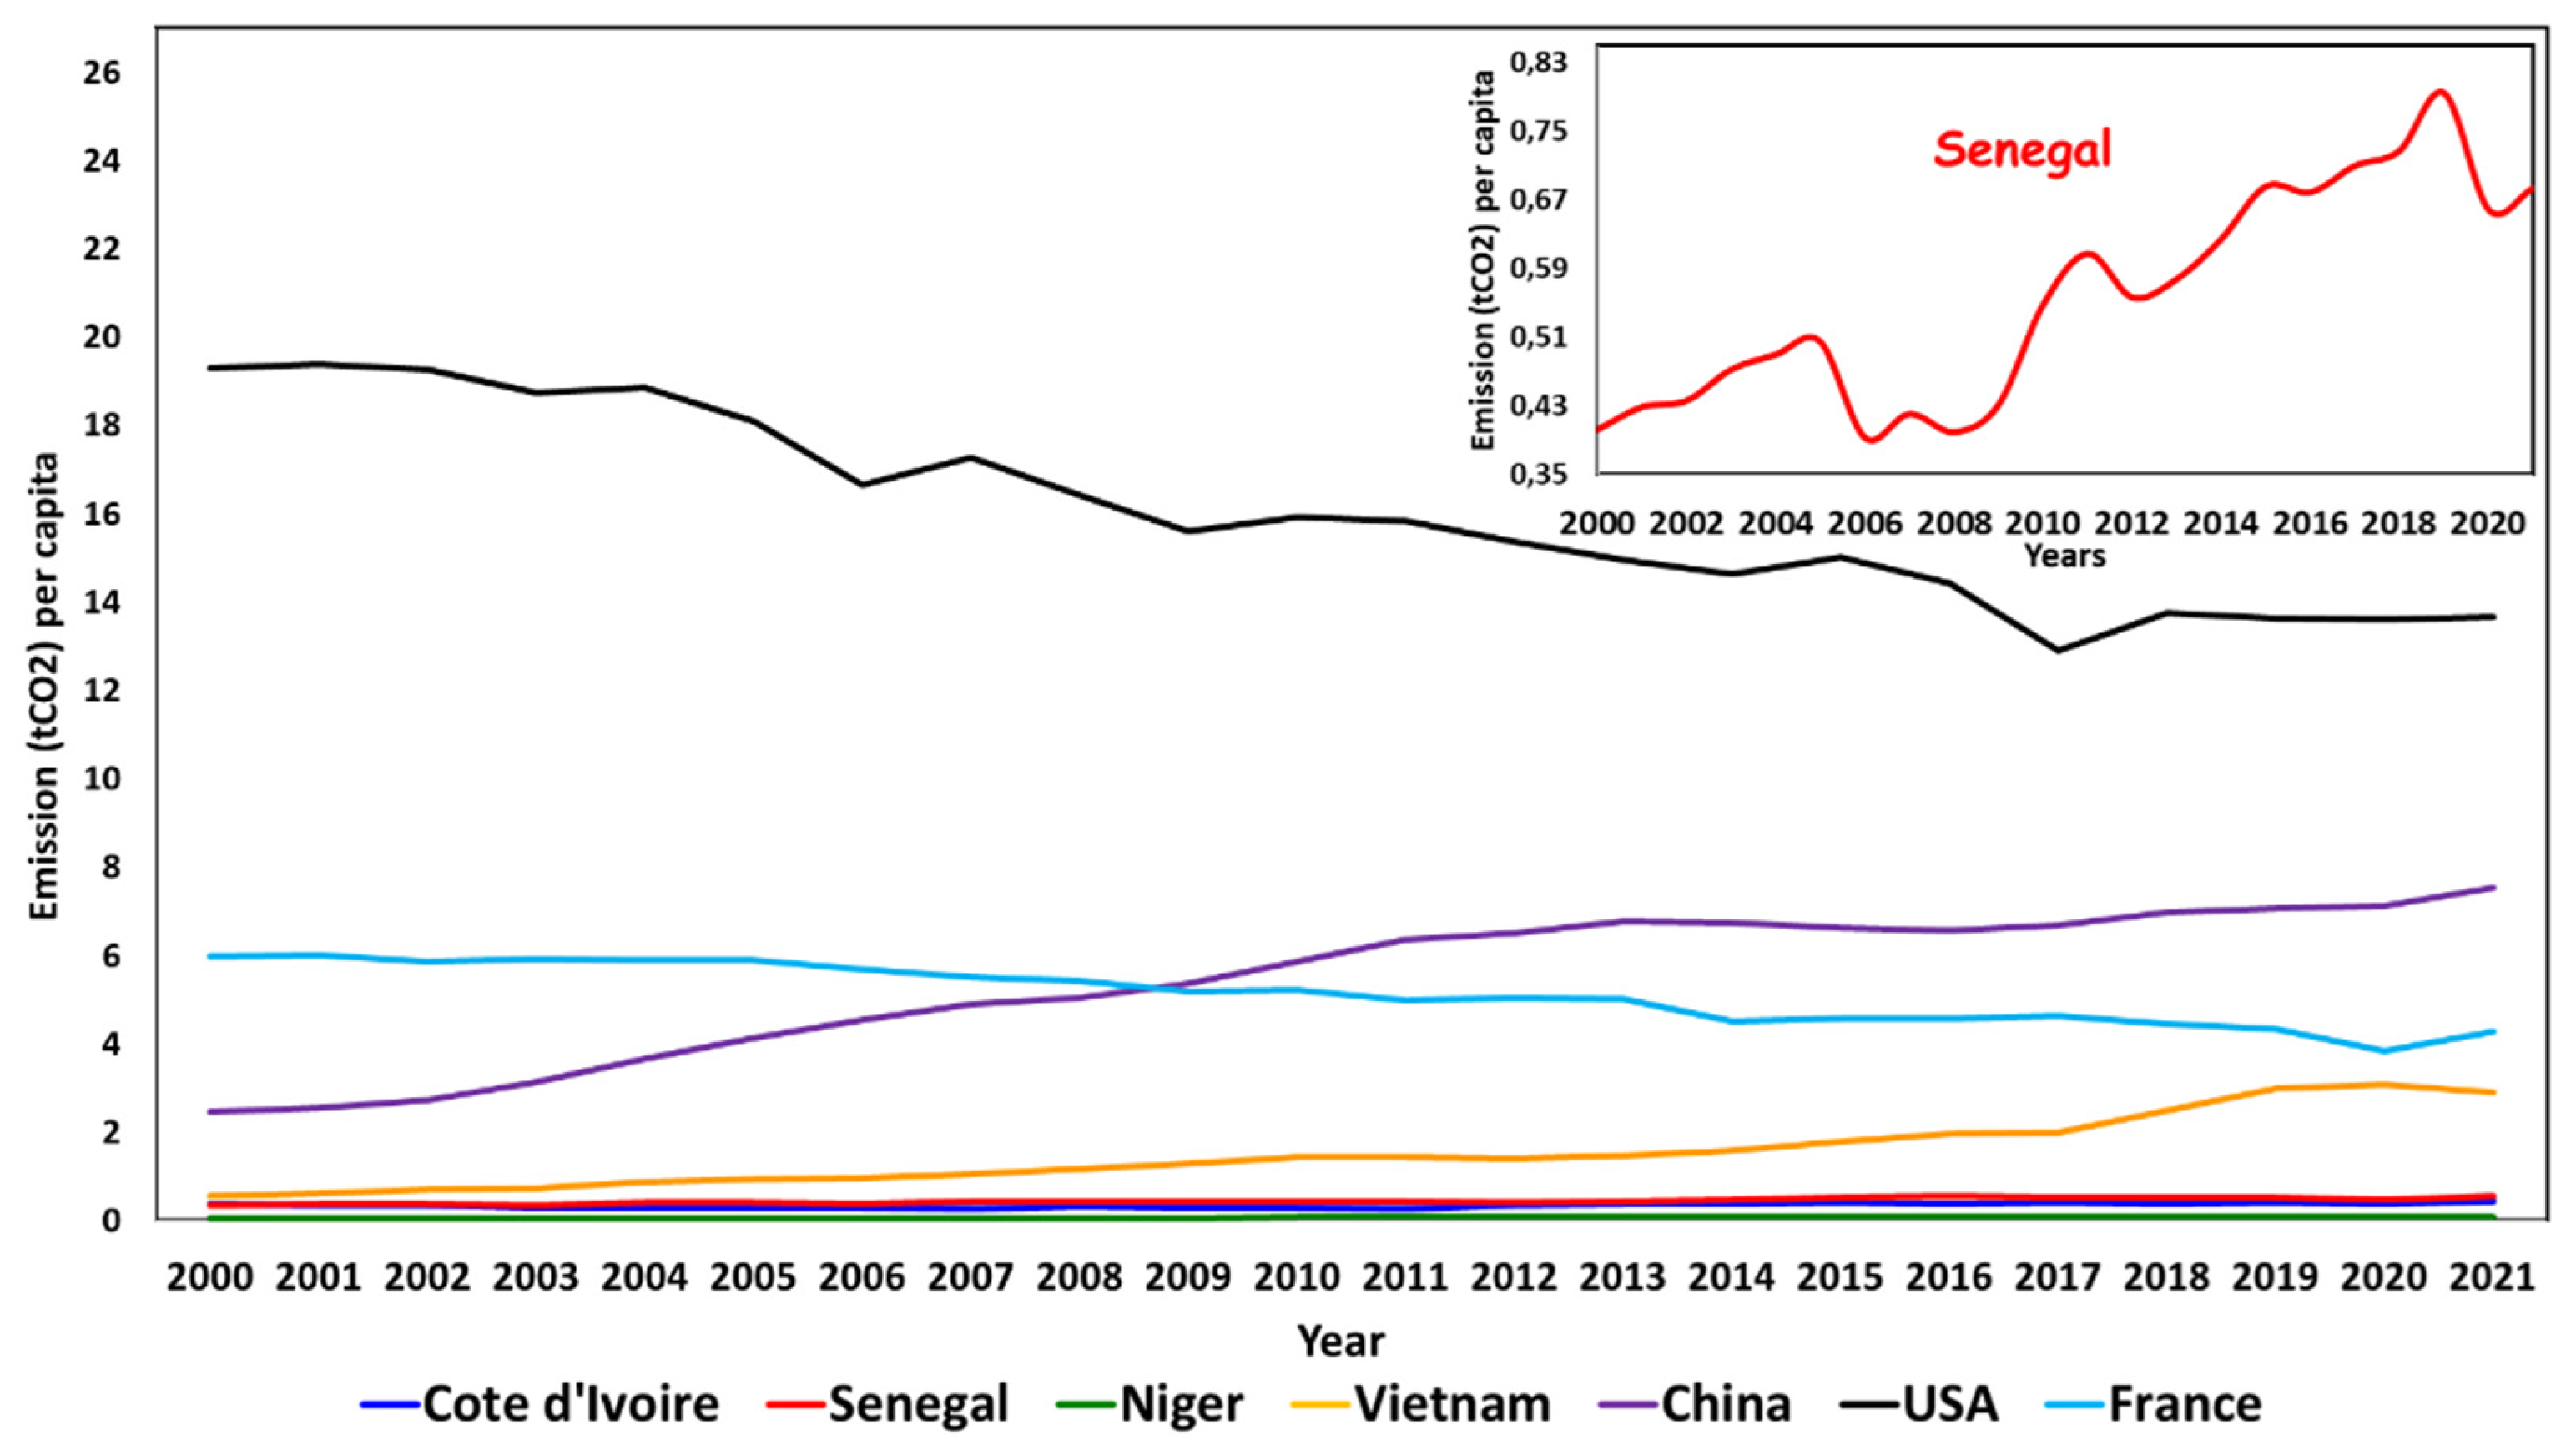
Figure 9.
Distribution of energy production (in TWh) by energy source in Senegal from 2000 to 2021.
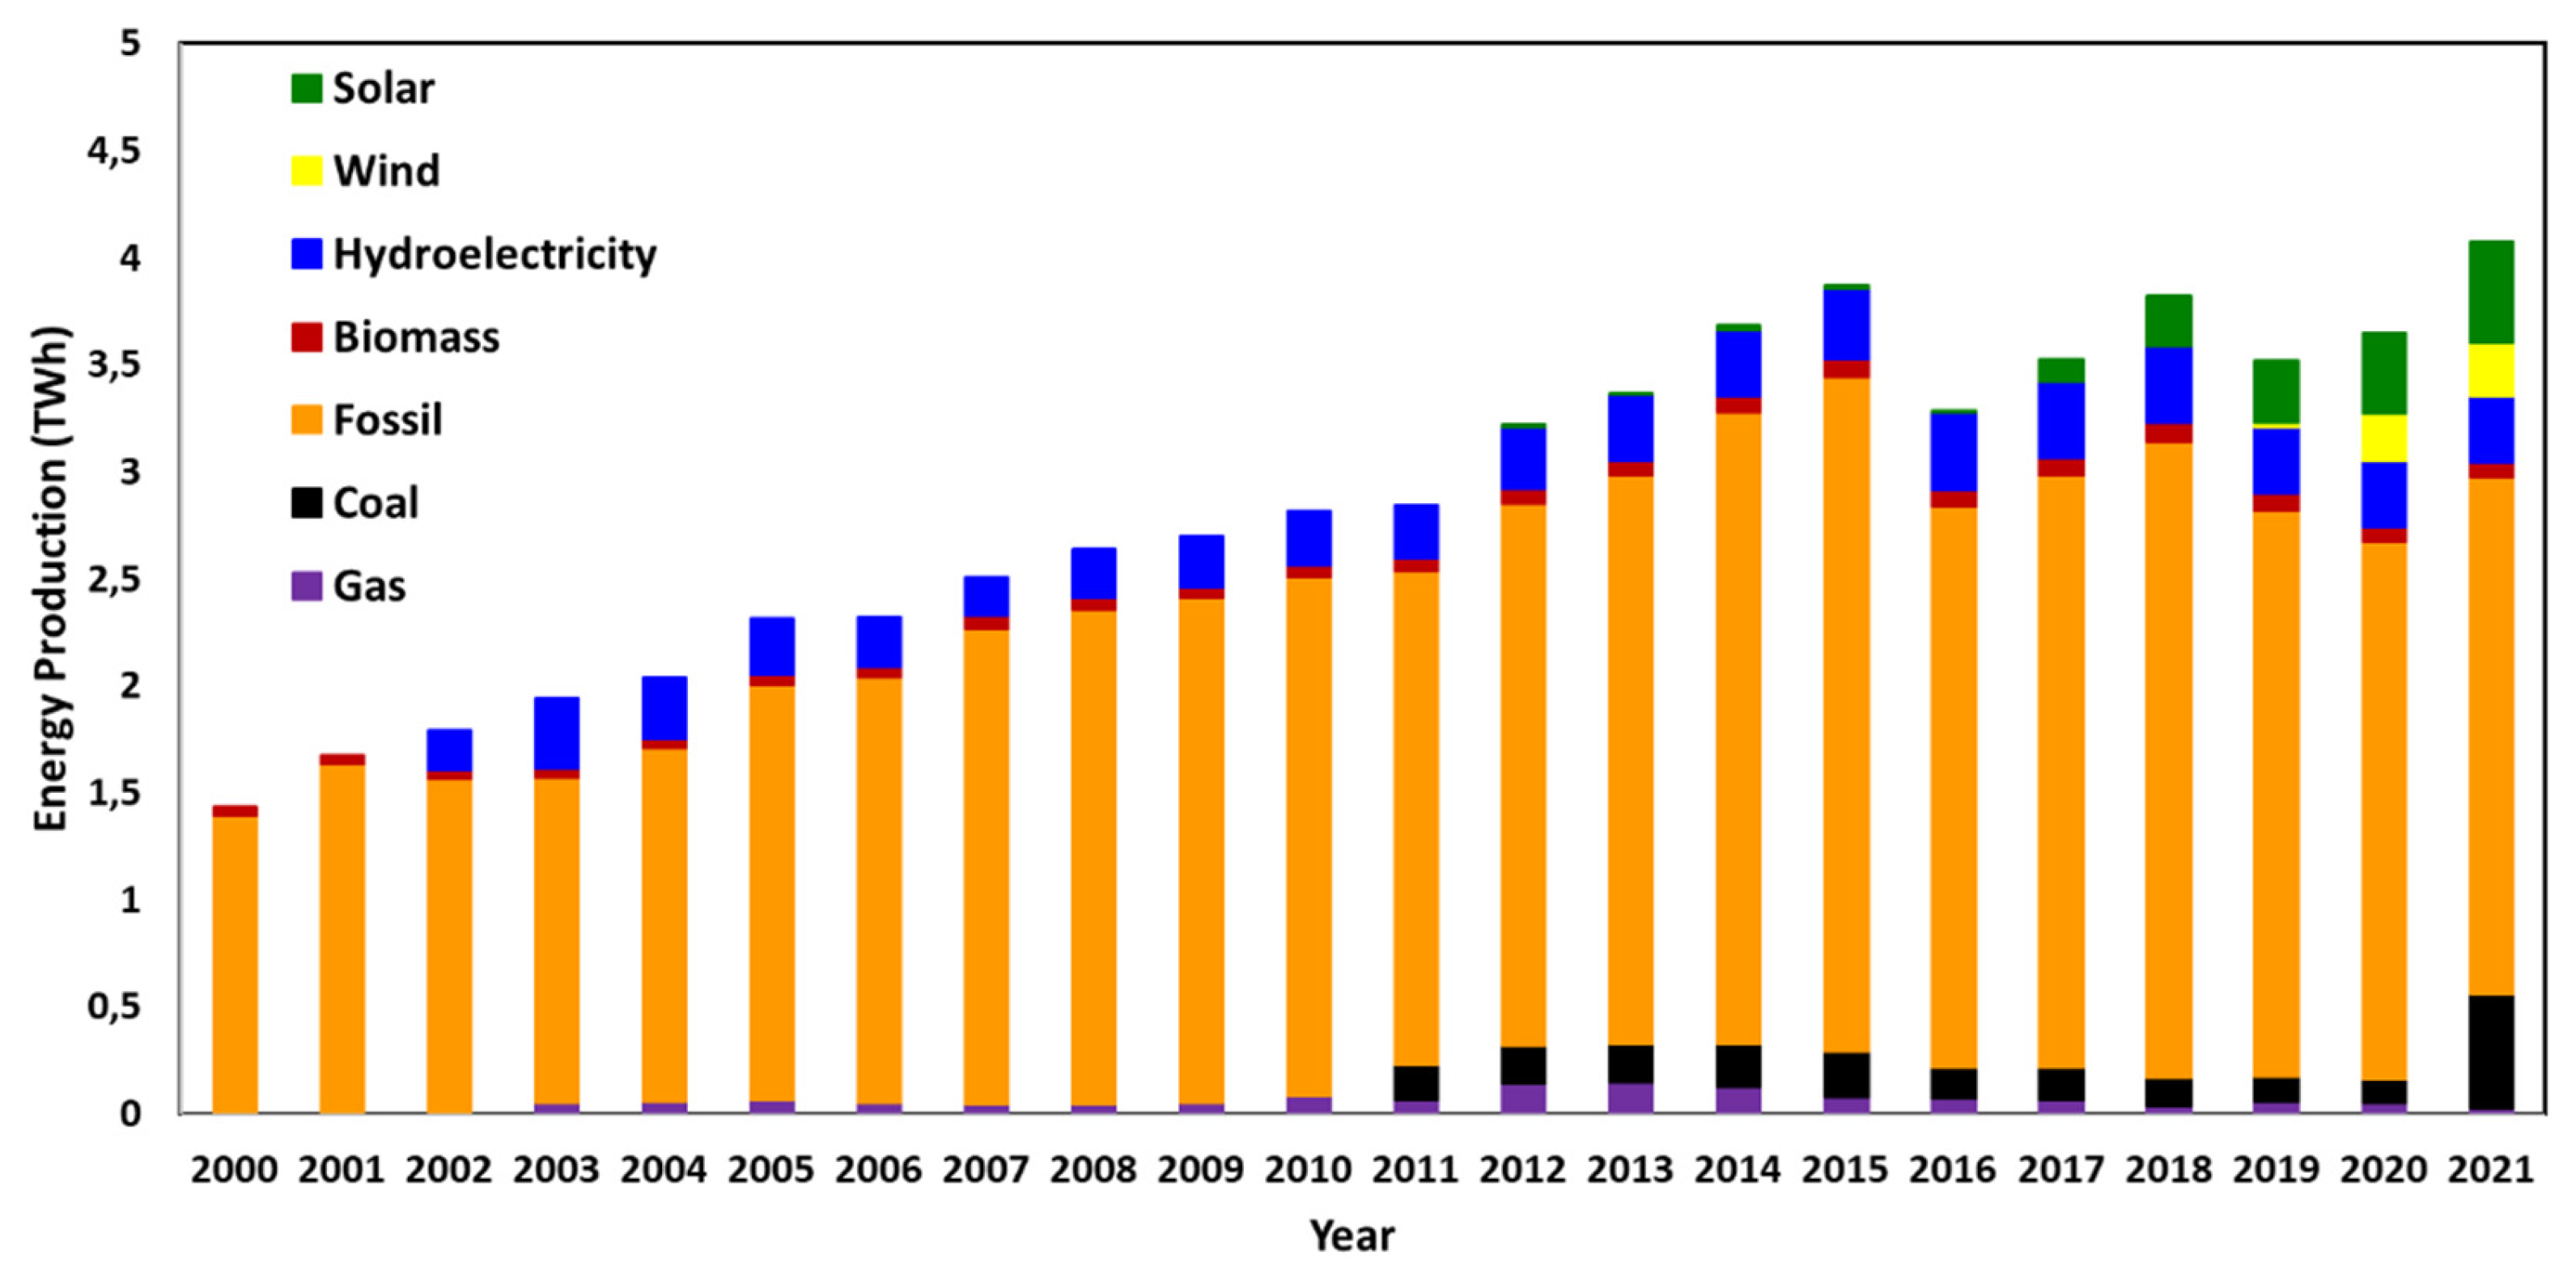
Figure 10.
Evolution in the share of fossil fuels in Senegal’s total energy mix from 2000 to 2021.
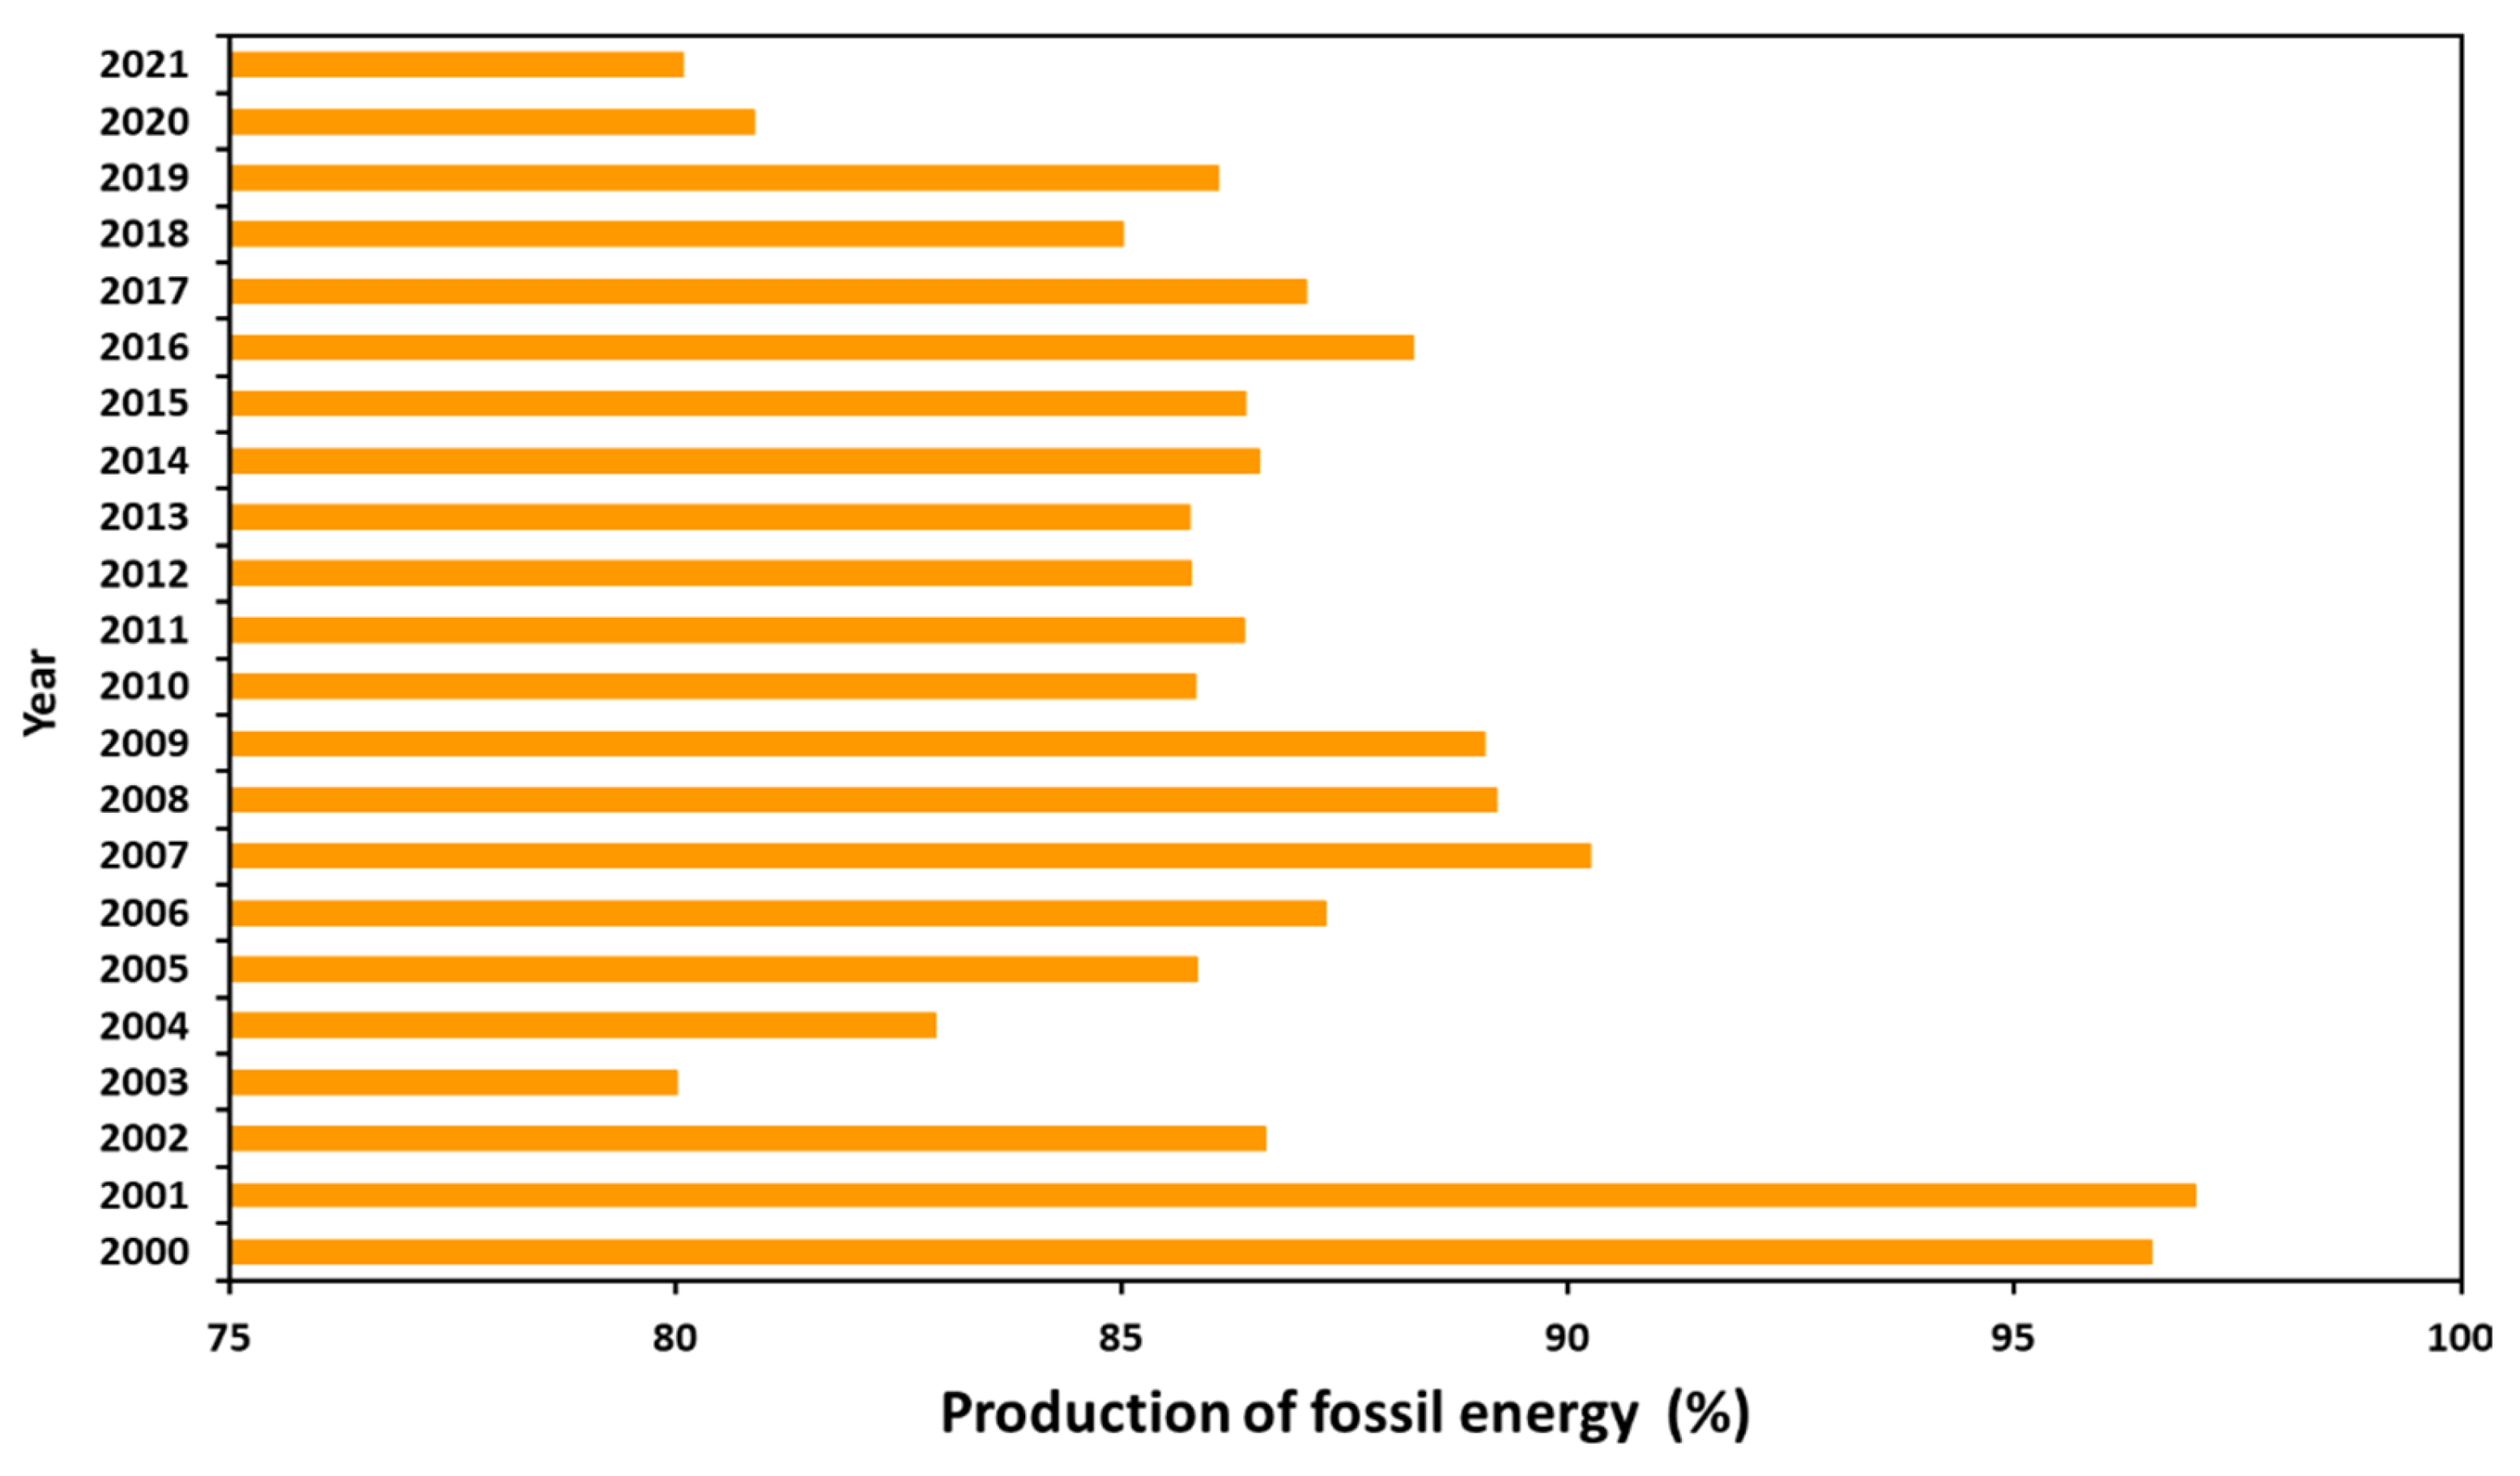
Figure 11.
Change in production (GWh) of different types of renewable energy in Senegal from 2010 to 2022.
Figure 11.
Change in production (GWh) of different types of renewable energy in Senegal from 2010 to 2022.
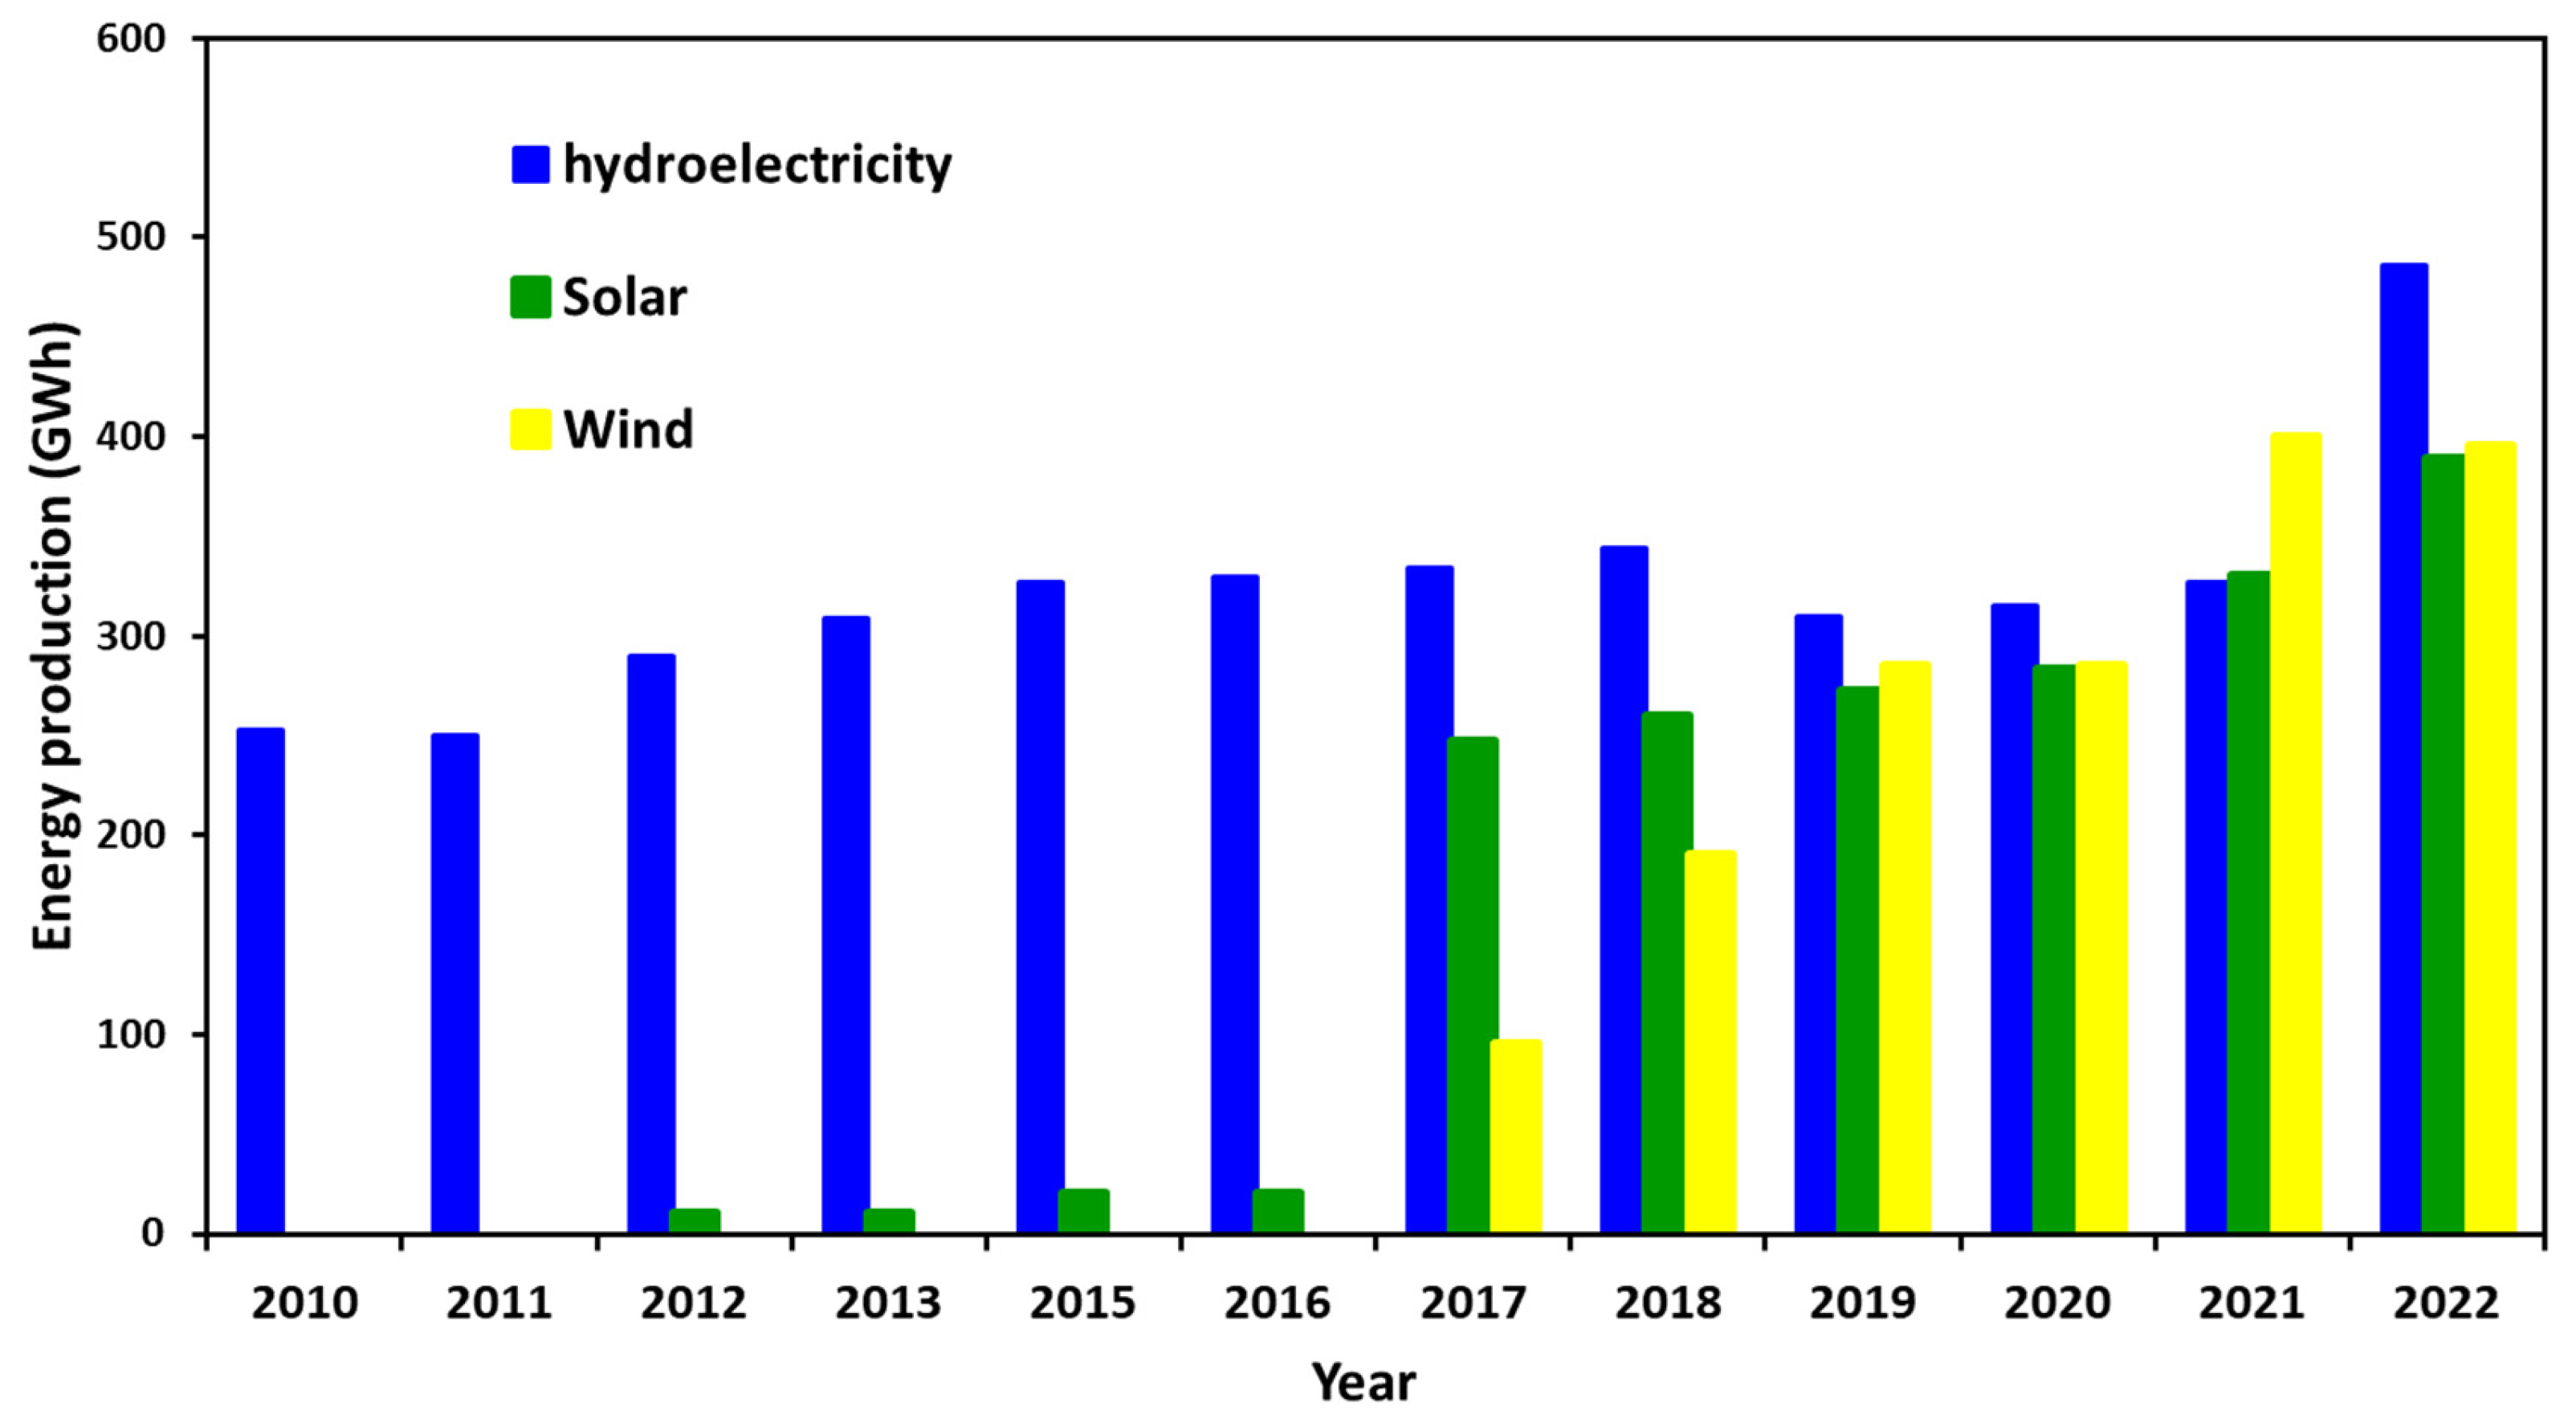
Figure 12.
Share of Senegal’s energy mix in 2000, 2010 and 2022.
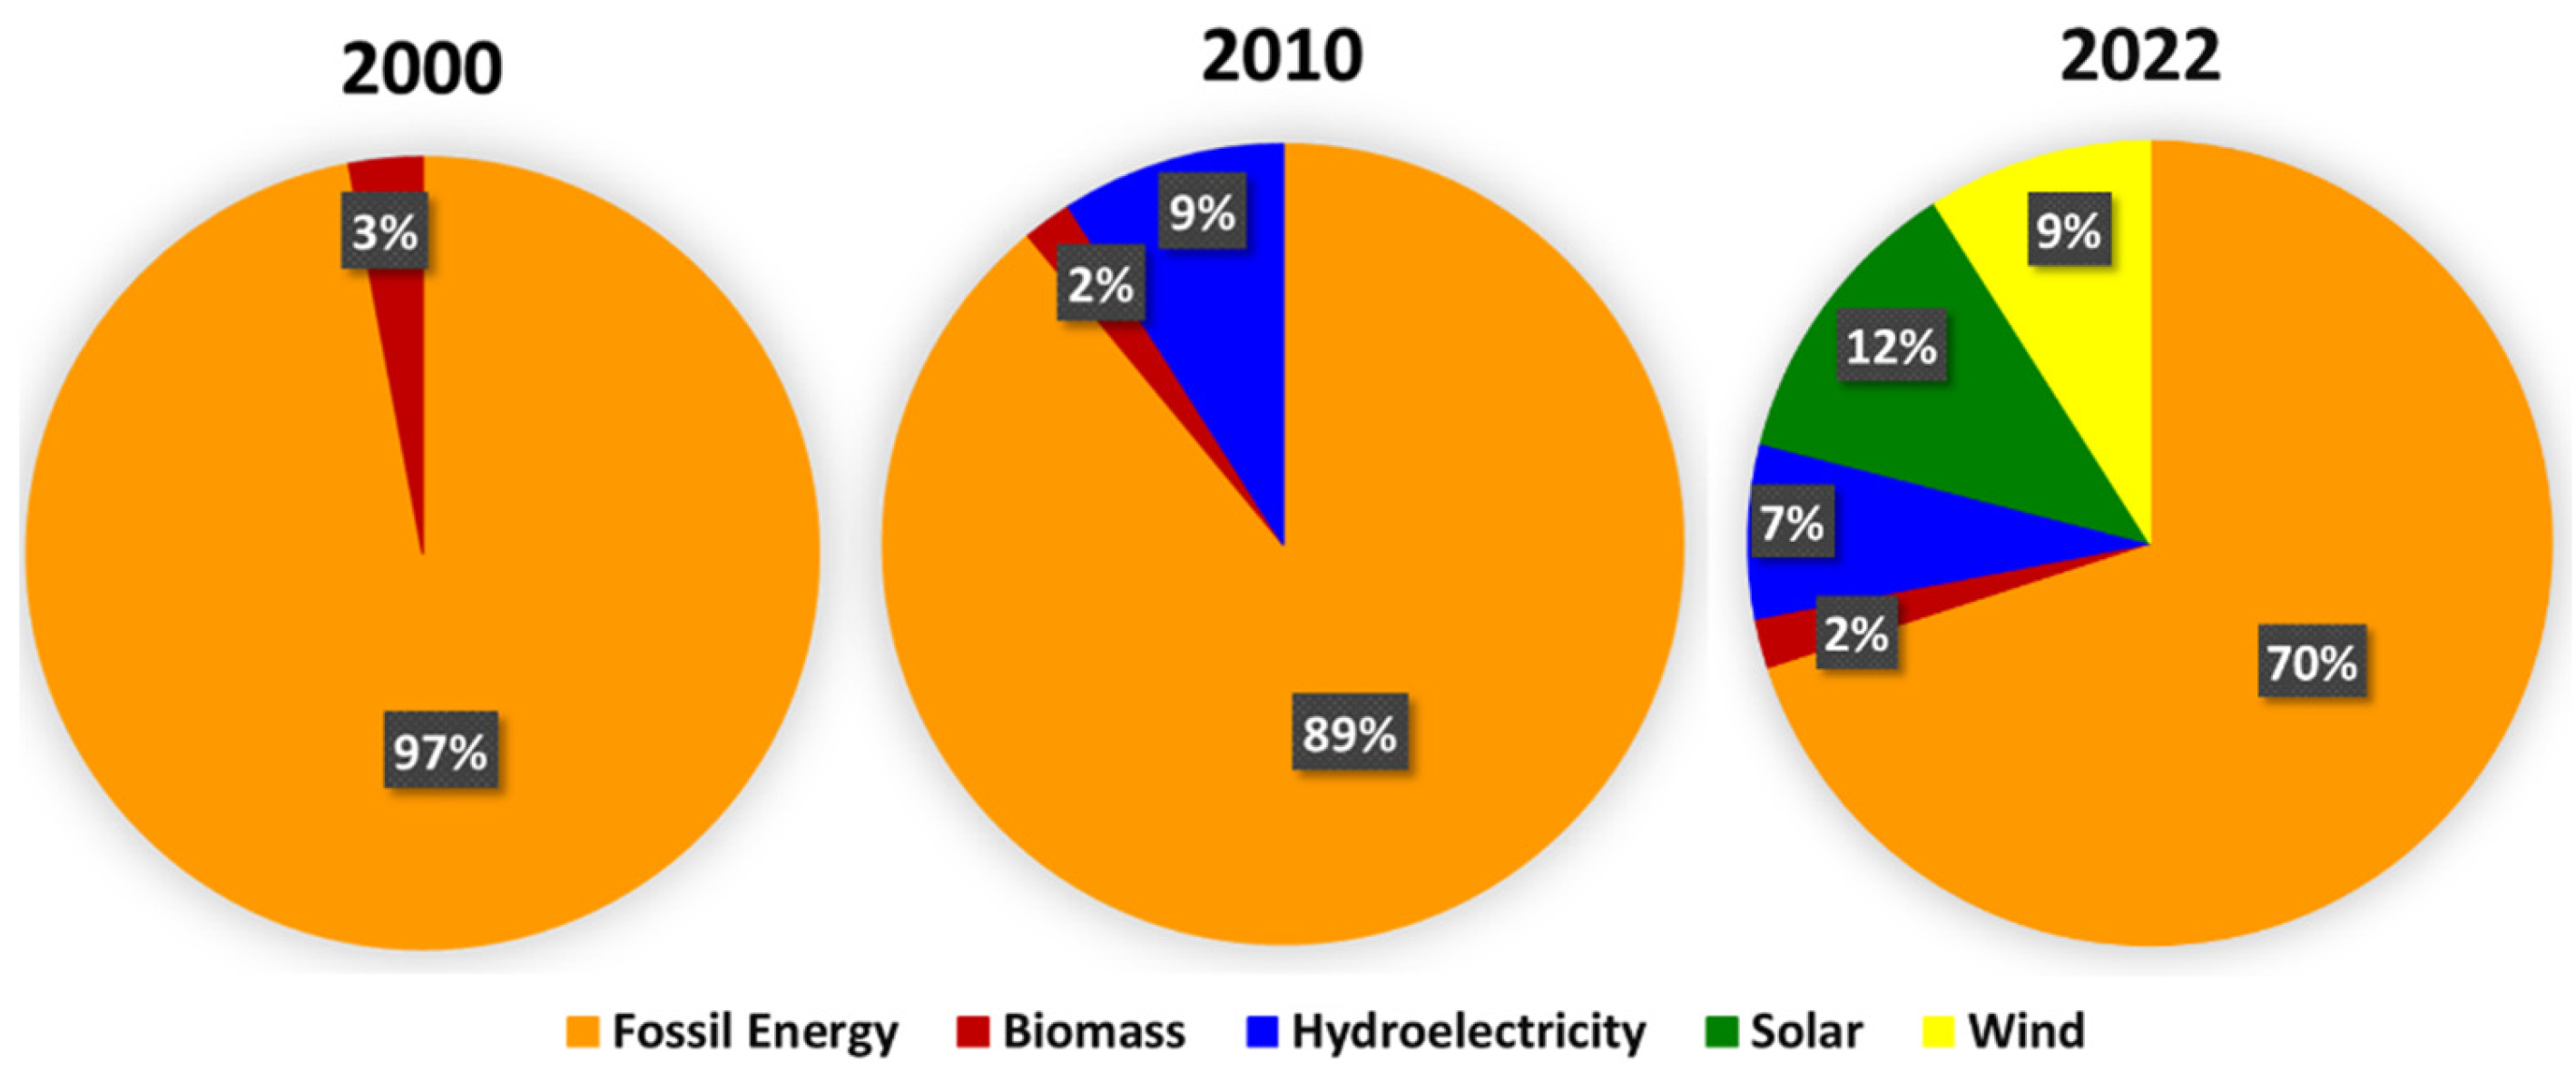
Figure 13.
Projected energy transition by energy source in Senegal in 2027 (%).
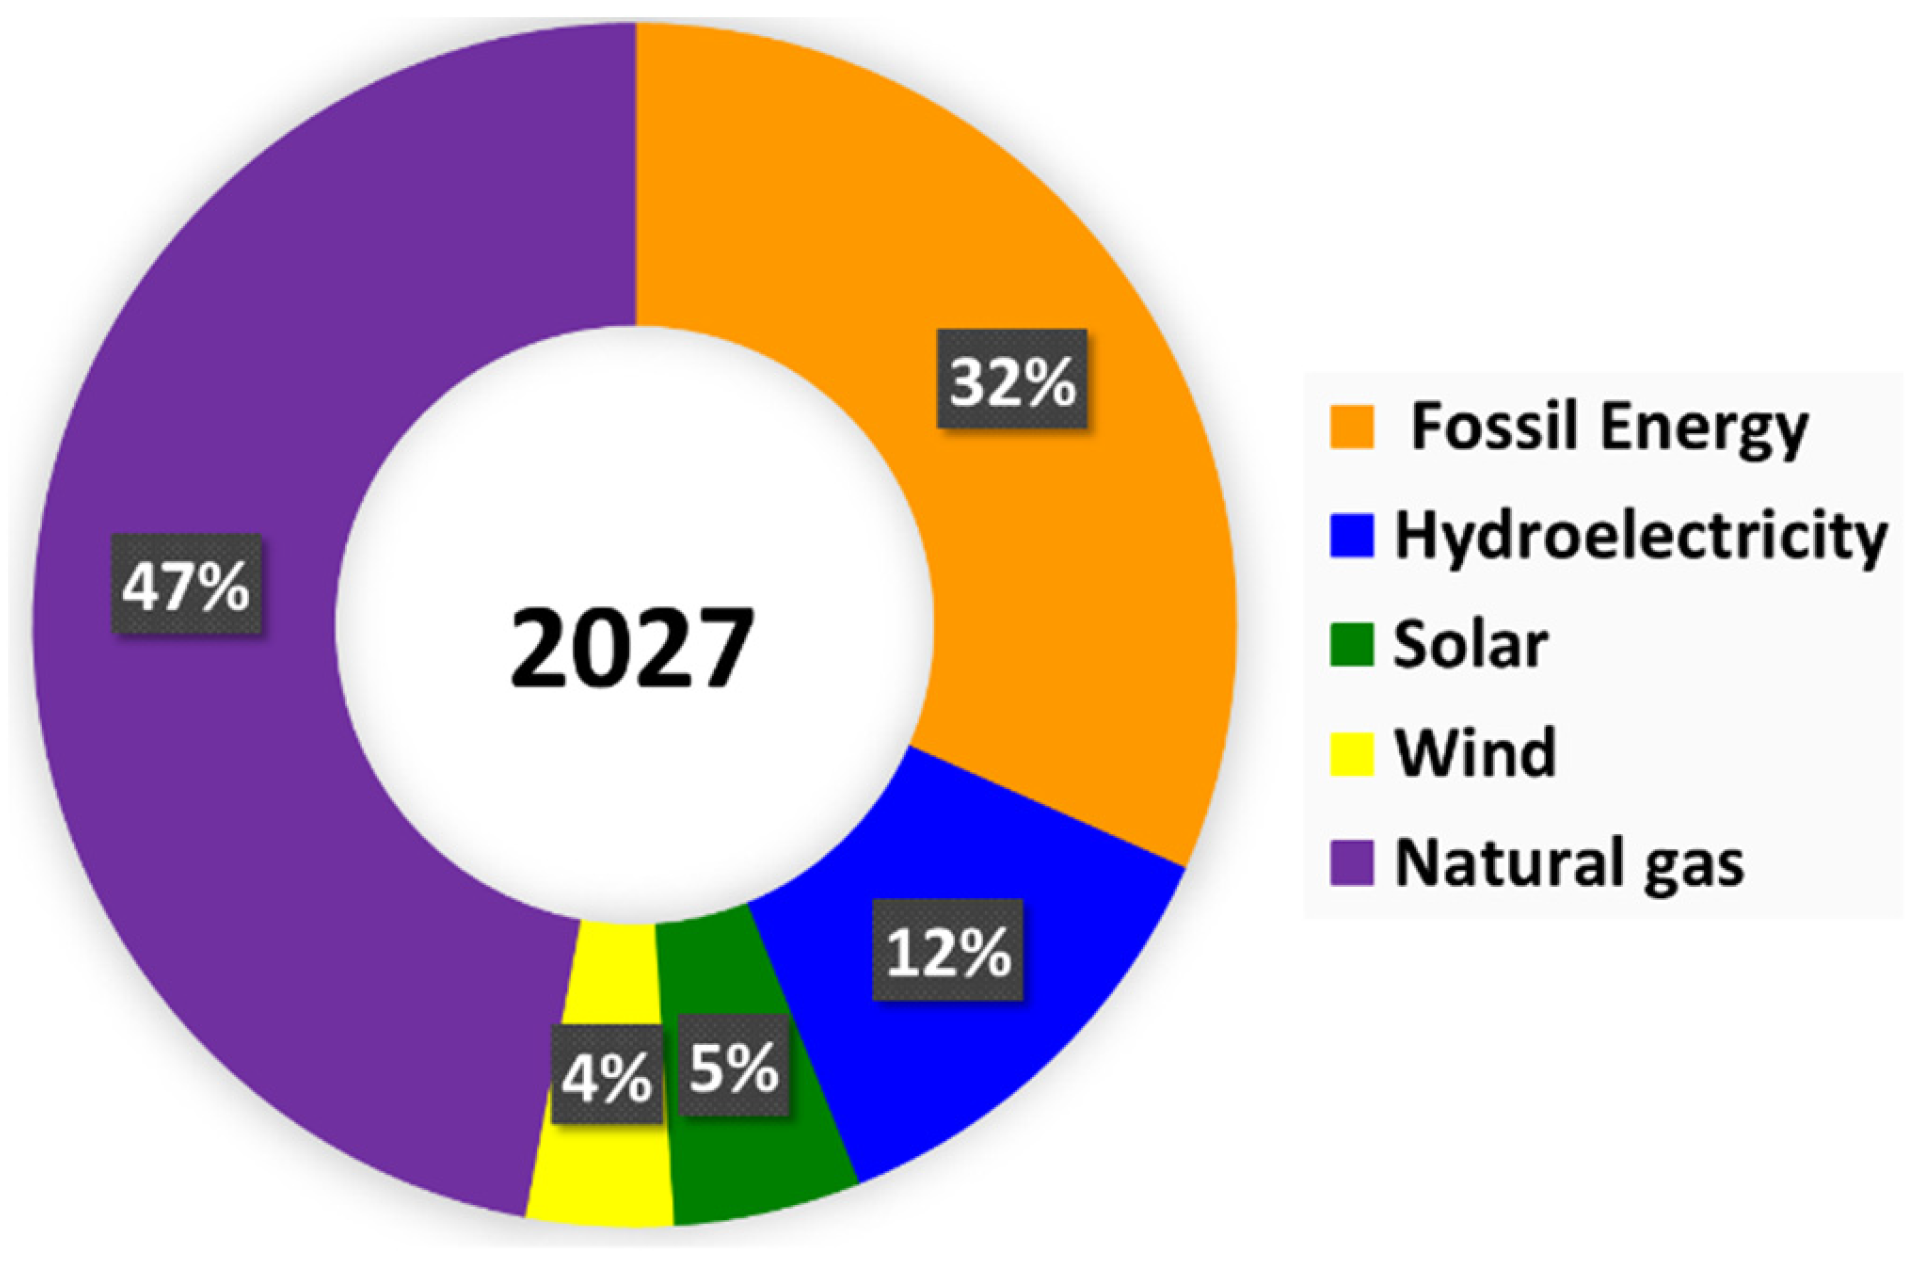
Figure 14.
Evolution of Senegal’s energy mix in 2000, 2010, 2022, with projections for 2027.
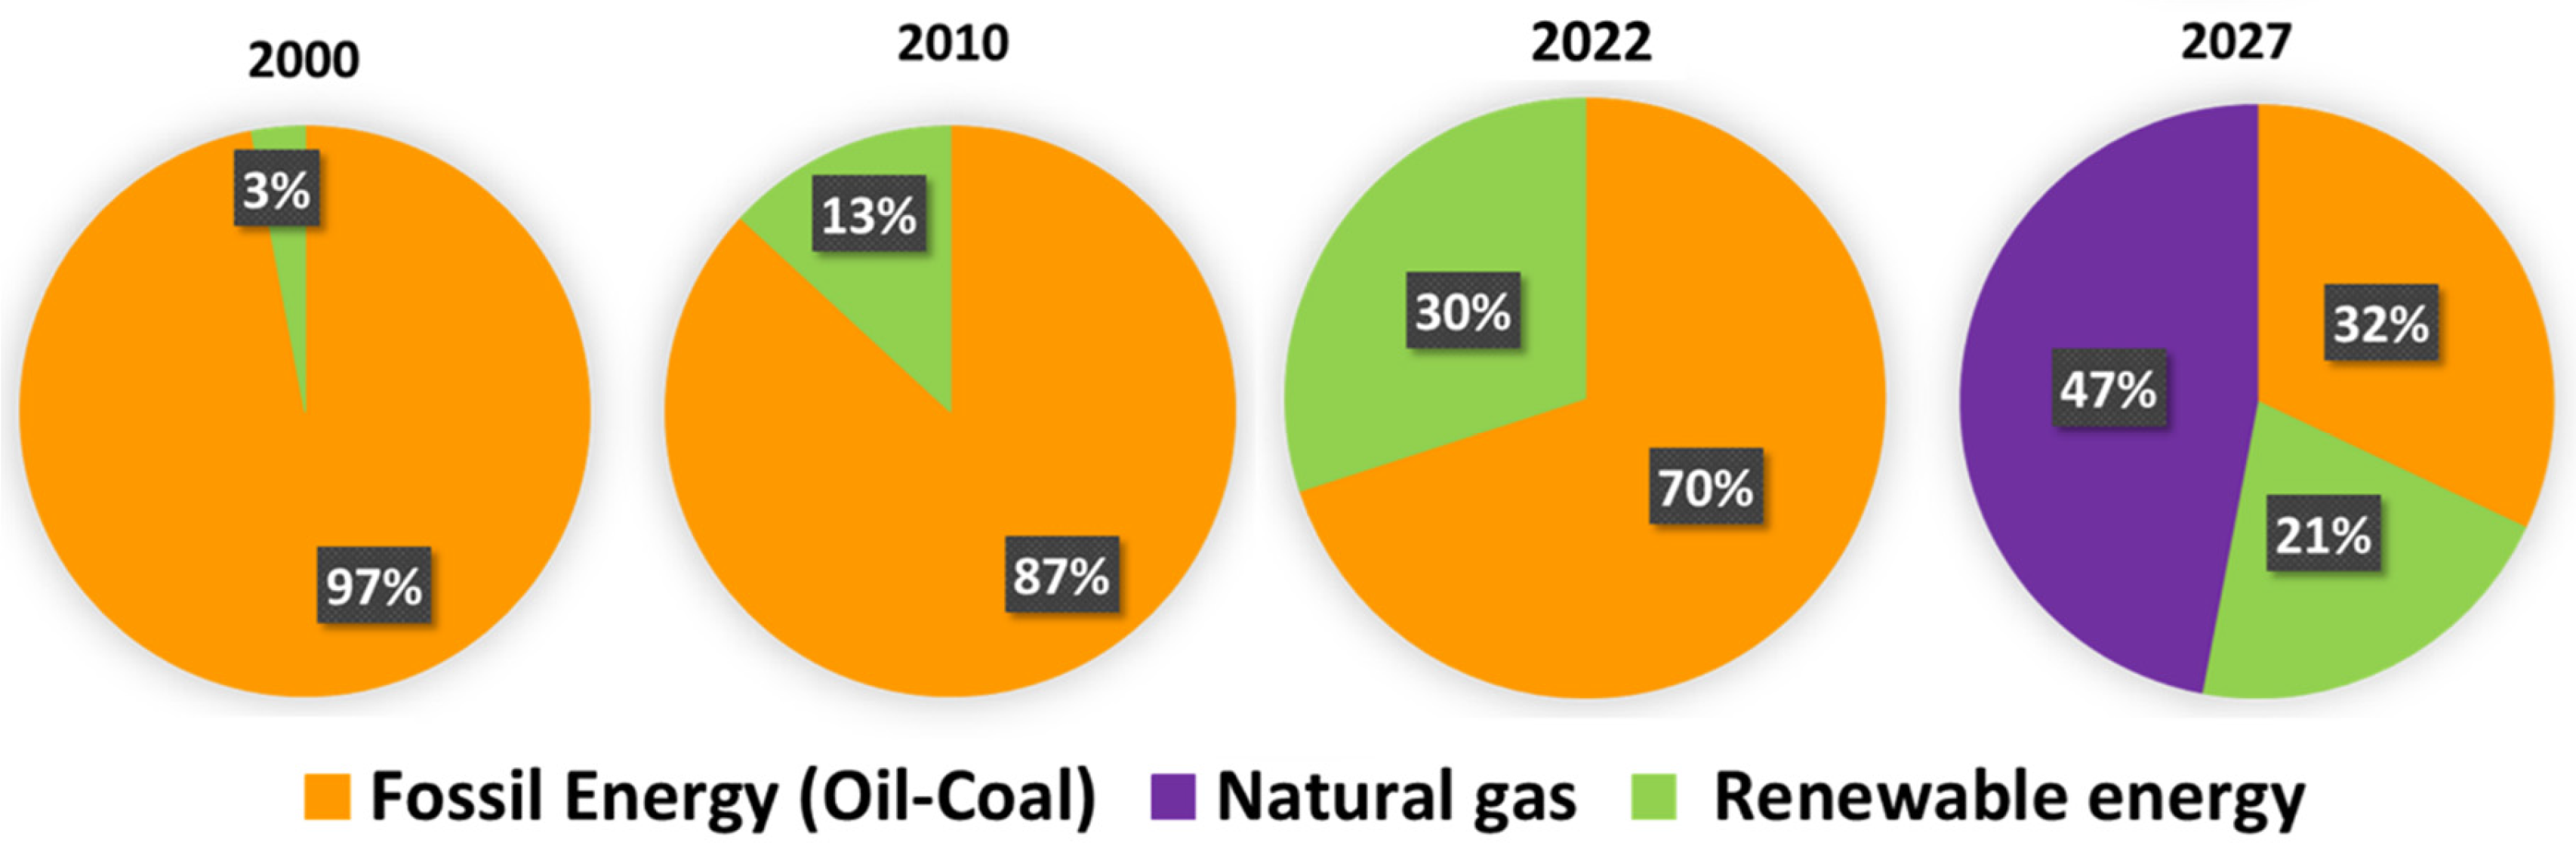

Table 1.
Characteristics of different client types in the Senegalese electricity market.
| Voltage Levels | Subscribed Power | Client Type |
|---|---|---|
| Low | 0-34 kW | Domestic + Commercial |
| Medium | 34kW–1000 kW | Small and medium industrial |
| High | > 1000 kW | Large industrial |
Table 2.
Variable cost in FCFA of electricity production by power plant in 2022.
| Plant | Type | Energy Source | Production in 2022 (GWh) | Variable Cost of Production (FCFA / kWh) |
|---|---|---|---|---|
| C3 Cap des Biches Power Plant + C3 | Interconnected grid network | Heavy Fuel Oil + LNG2 | 9.37 | 123.43 |
| Diesel | Interconnected grid network | Heavy Fuel Oil | 1539.02 | 155.07 |
| Gas Turbines | Interconnected grid network | -- | 10.07 | 321.39 |
| Solar-CICAD | Interconnected grid network | Solar | 2.16 | NA |
| Solar-DIASS | Interconnected grid network | Solar | 28.90 | NA |
| Boutoute | Non-interconnected grid network | Heavy Fuel Oil | 26.71 | 96.81 |
| Secondary plants | Non-interconnected grid network | -- | 39.27 | 184.62 |
| Contour Global | IPP3 | Thermal | 512.88 | 89.40 |
| Kounoune Power | IPP | Heavy Fuel Oil | 132.09 | 108.05 |
| Tobene Power | IPP | Heavy Fuel Oil | 239.62 | 94.76 |
| Karpowership plant | IPP | Heavy Fuel Oil | 1398.06 | 94.76 |
| CES Sendou | IPP | Coal | 340.55 | 109.37 |
| Malicounda Power | IPP | Natural Gas | -- | 90.52 |
| ICS | Autoproduction | Coal | 15.59 | 43.00 |
| PV-Bokhol | IPP | Solar | 41.00 | 79.88 |
| PV-Malicounda | IPP | Solar | 33.10 | 70.36 |
| PV-Senergy | IPP | Solar | 48.10 | 78.91 |
| PV-Ten Merina | IPP | Solar | 48.50 | 75.50 |
| PV Kahone | IPP | Solar | 33.00 | 83.22 |
| PV Sakal | IPP | Solar | 41.20 | 69.78 |
| PV Kahone | IPP | Solar | 53.00 | 24.78 |
| Kael Solar plant | IPP | Solar | 51.00 | 26.26 |
| Taïba Ndiaye | IPP | Wind | 395.56 | 69.42 |
| Manantali Dam | Purchase | Hydro | 232.00 | 20.68 |
| Felou Dam | Purchase | Hydro | 69.29 | 20.77 |
| Gouina Dam | Purchase | Hydro | 184.72 | 20.81 |
Table 3.
Distribution of variable cost (US $) of electricity production by energy source in 2022.
| Energy Source |
Minimum | Maximum | Weighted Average Mean |
|---|---|---|---|
| Solar | 0.041 | 0.139 | 0.102 |
| Hydro | 0.034 | 0.035 | 0.035 |
| Wind | 0.116 | 0.116 | 0.116 |
| Gas | 0.151 | 0.151 | 0.151 |
| Coal | 0.072 | 0.182 | 0.177 |
| Heavy Fuel Oil | 0.149 | 0.308 | 0.200 |
Disclaimer/Publisher’s Note: The statements, opinions and data contained in all publications are solely those of the individual author(s) and contributor(s) and not of MDPI and/or the editor(s). MDPI and/or the editor(s) disclaim responsibility for any injury to people or property resulting from any ideas, methods, instructions or products referred to in the content. |
© 2024 by the authors. Licensee MDPI, Basel, Switzerland. This article is an open access article distributed under the terms and conditions of the Creative Commons Attribution (CC BY) license (http://creativecommons.org/licenses/by/4.0/).
Copyright: This open access article is published under a Creative Commons CC BY 4.0 license, which permit the free download, distribution, and reuse, provided that the author and preprint are cited in any reuse.


