Submitted:
24 September 2024
Posted:
24 September 2024
You are already at the latest version
Abstract
Keywords:
1. Introduction
2. Materials and Methods
3. Results and Discussion
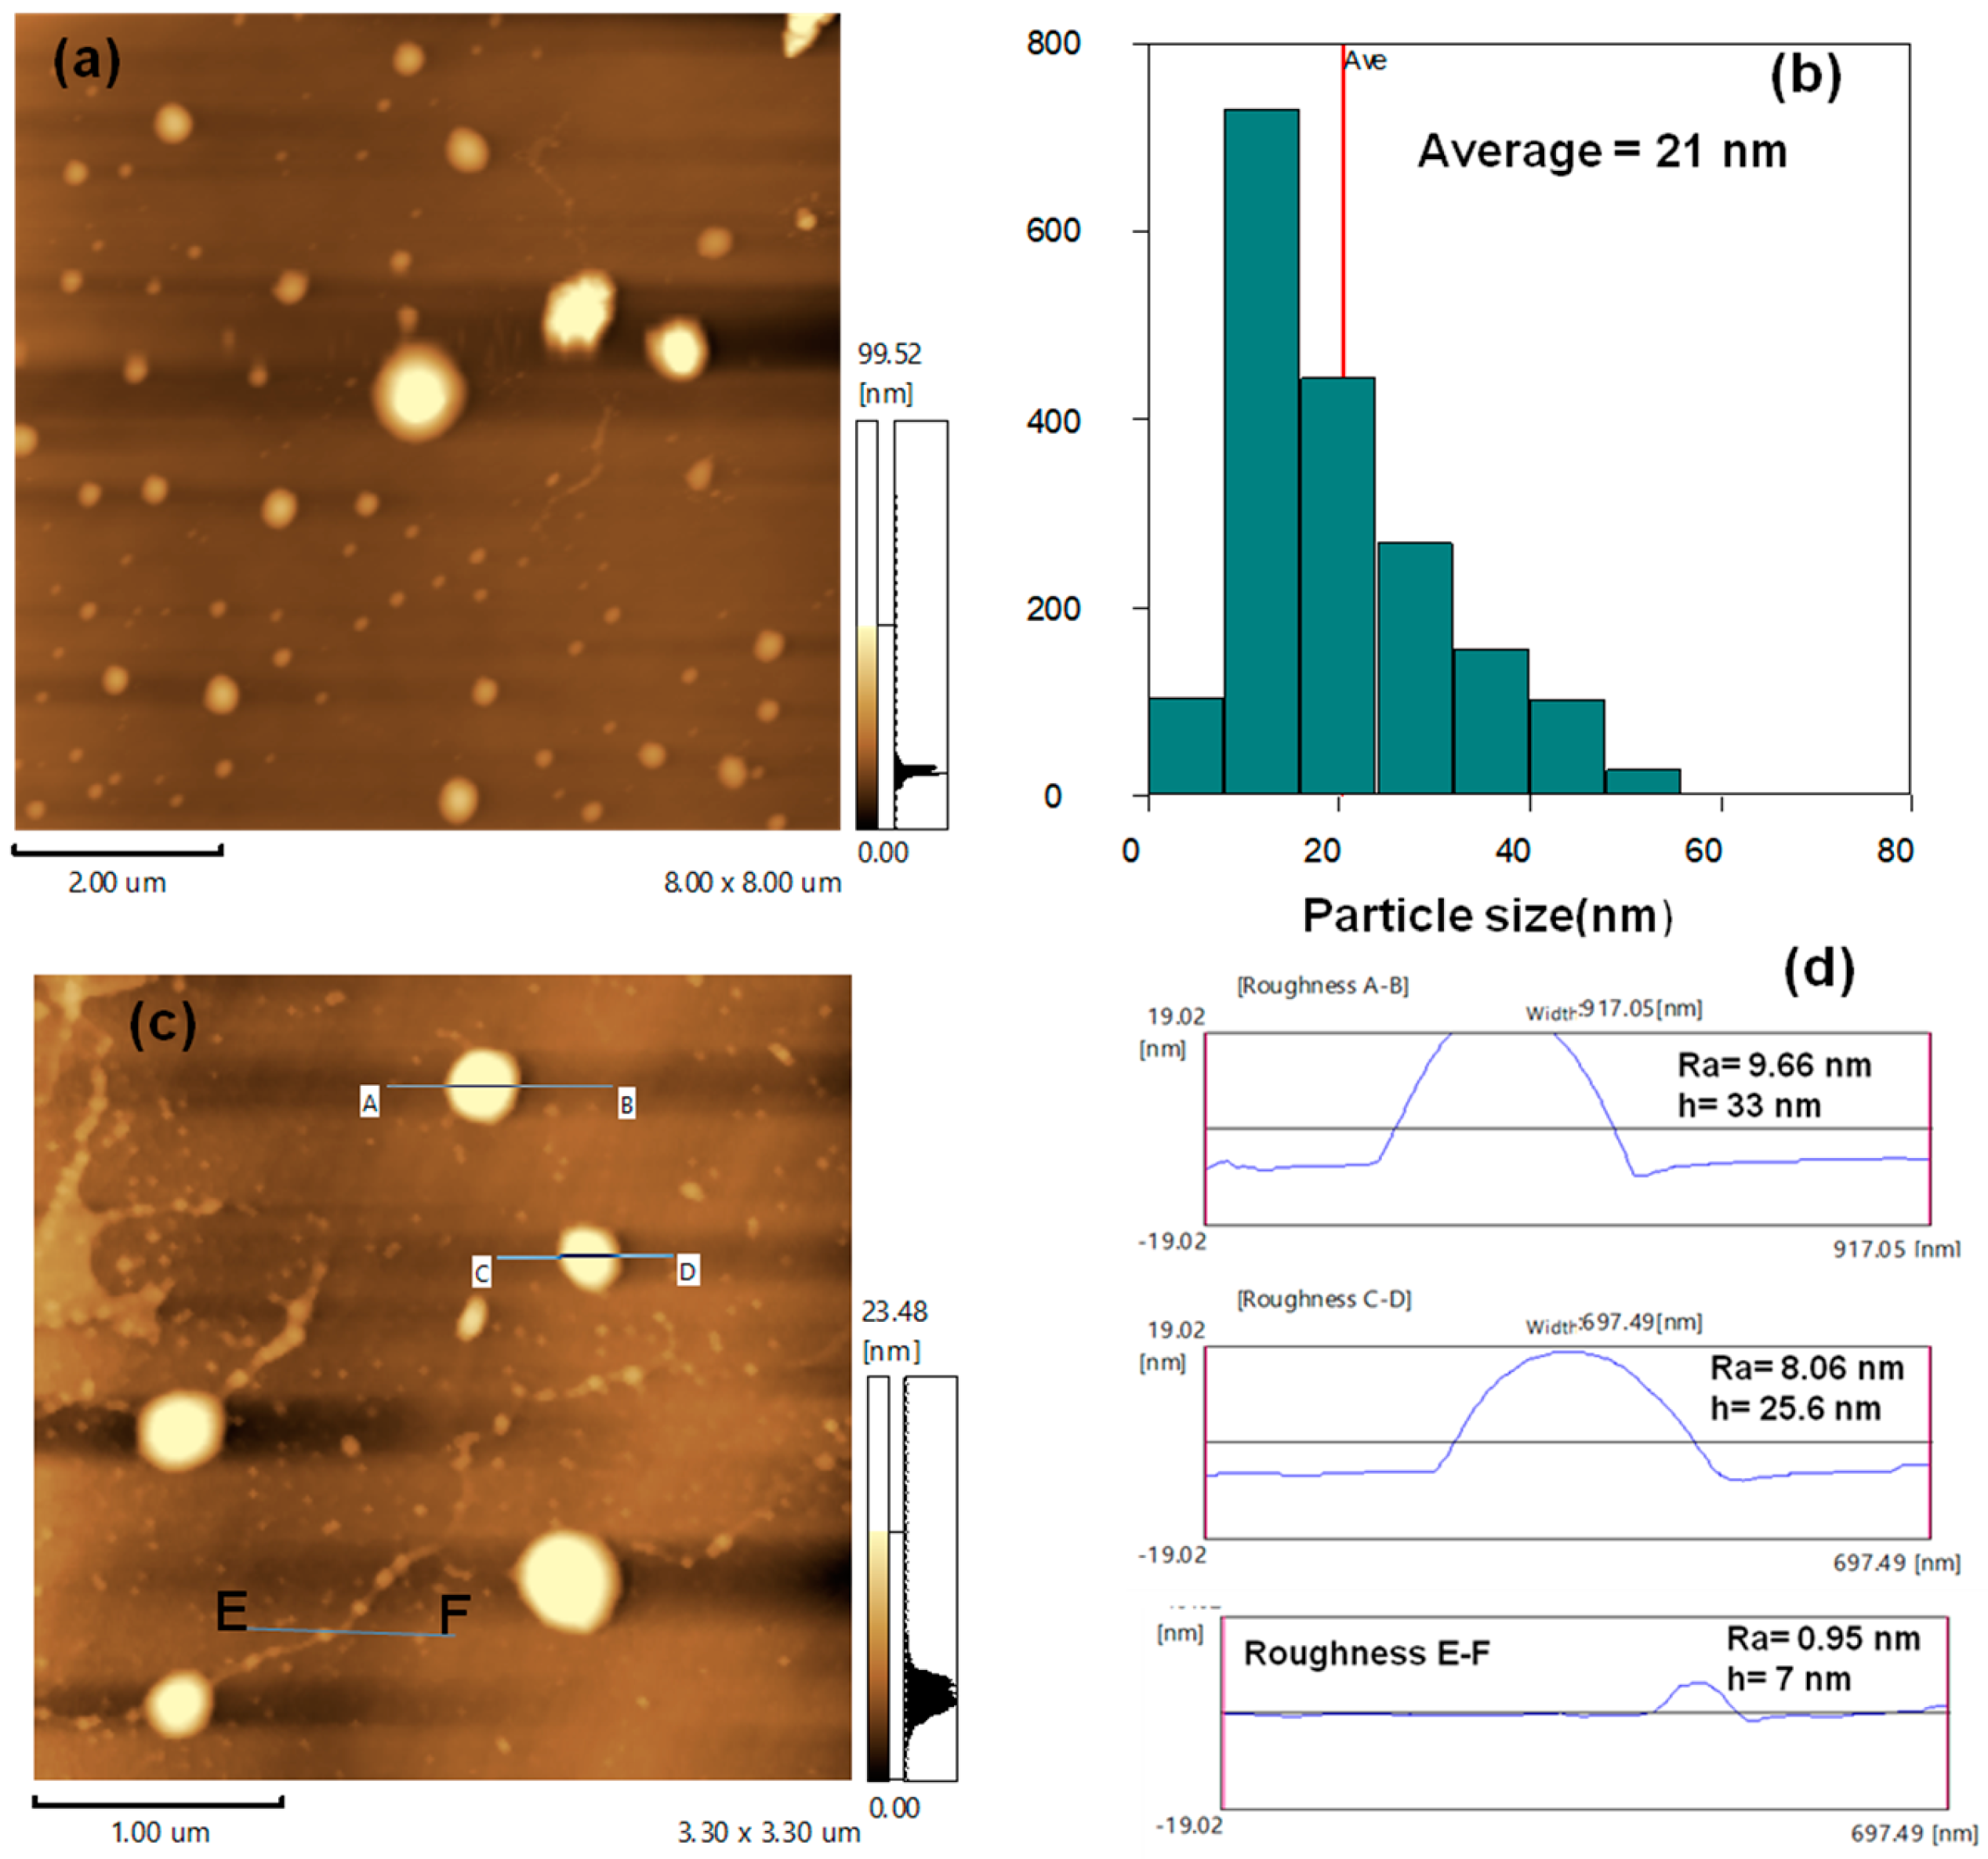
3.1. AFM and Surface Roughness of TiO2 Nanoparticles
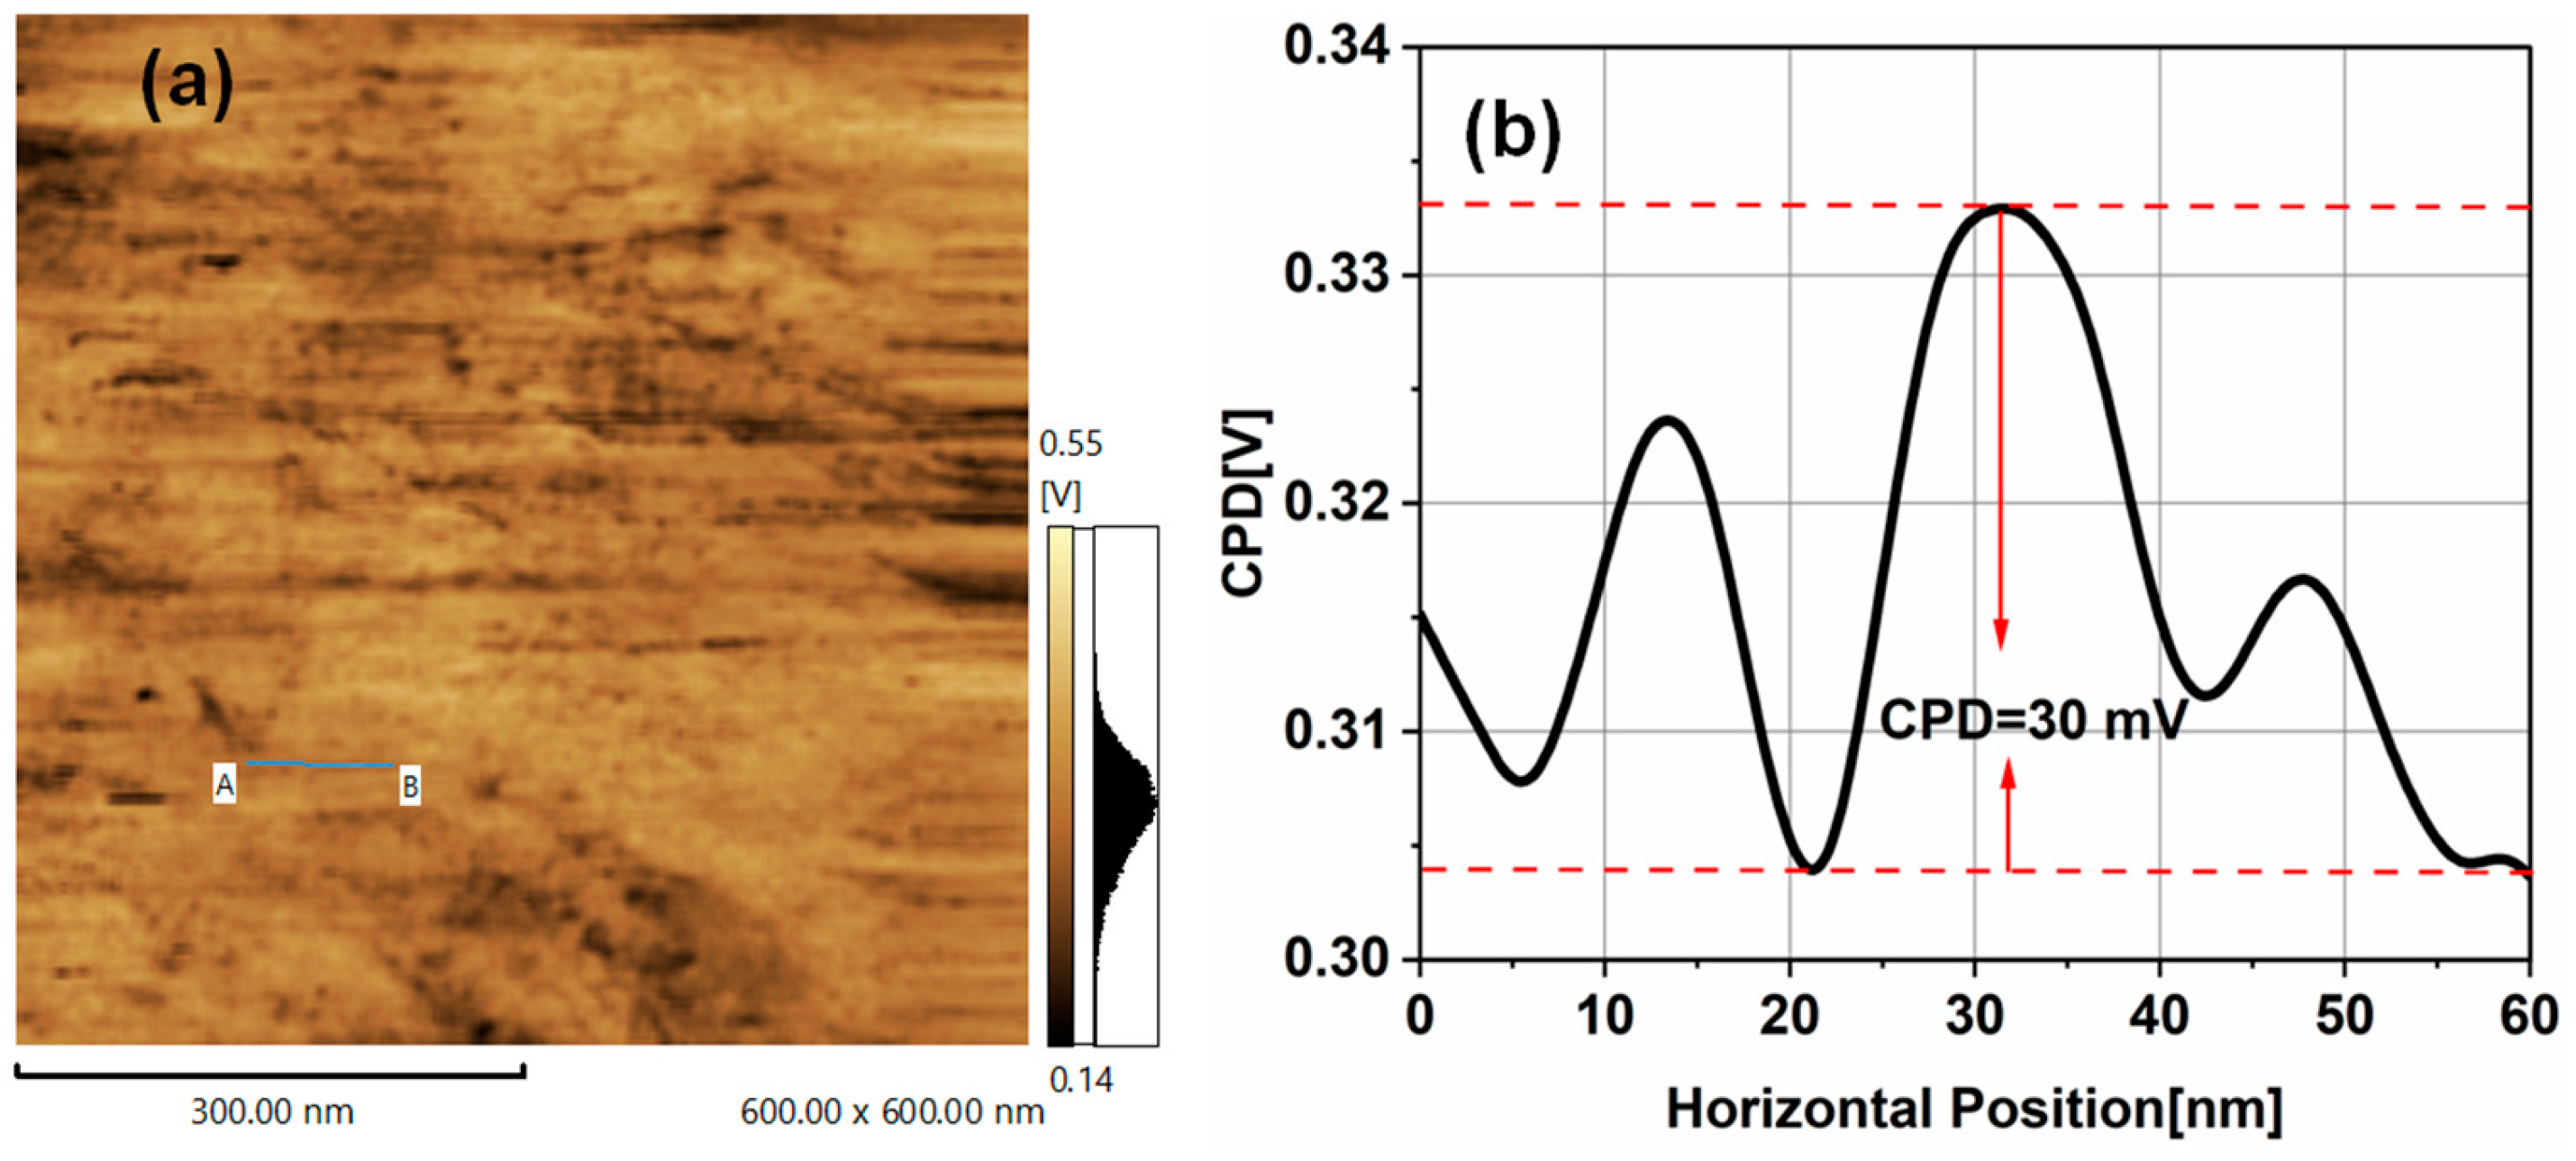
3.2. Kelvin Probe Force Microscopy of TiO2NPs
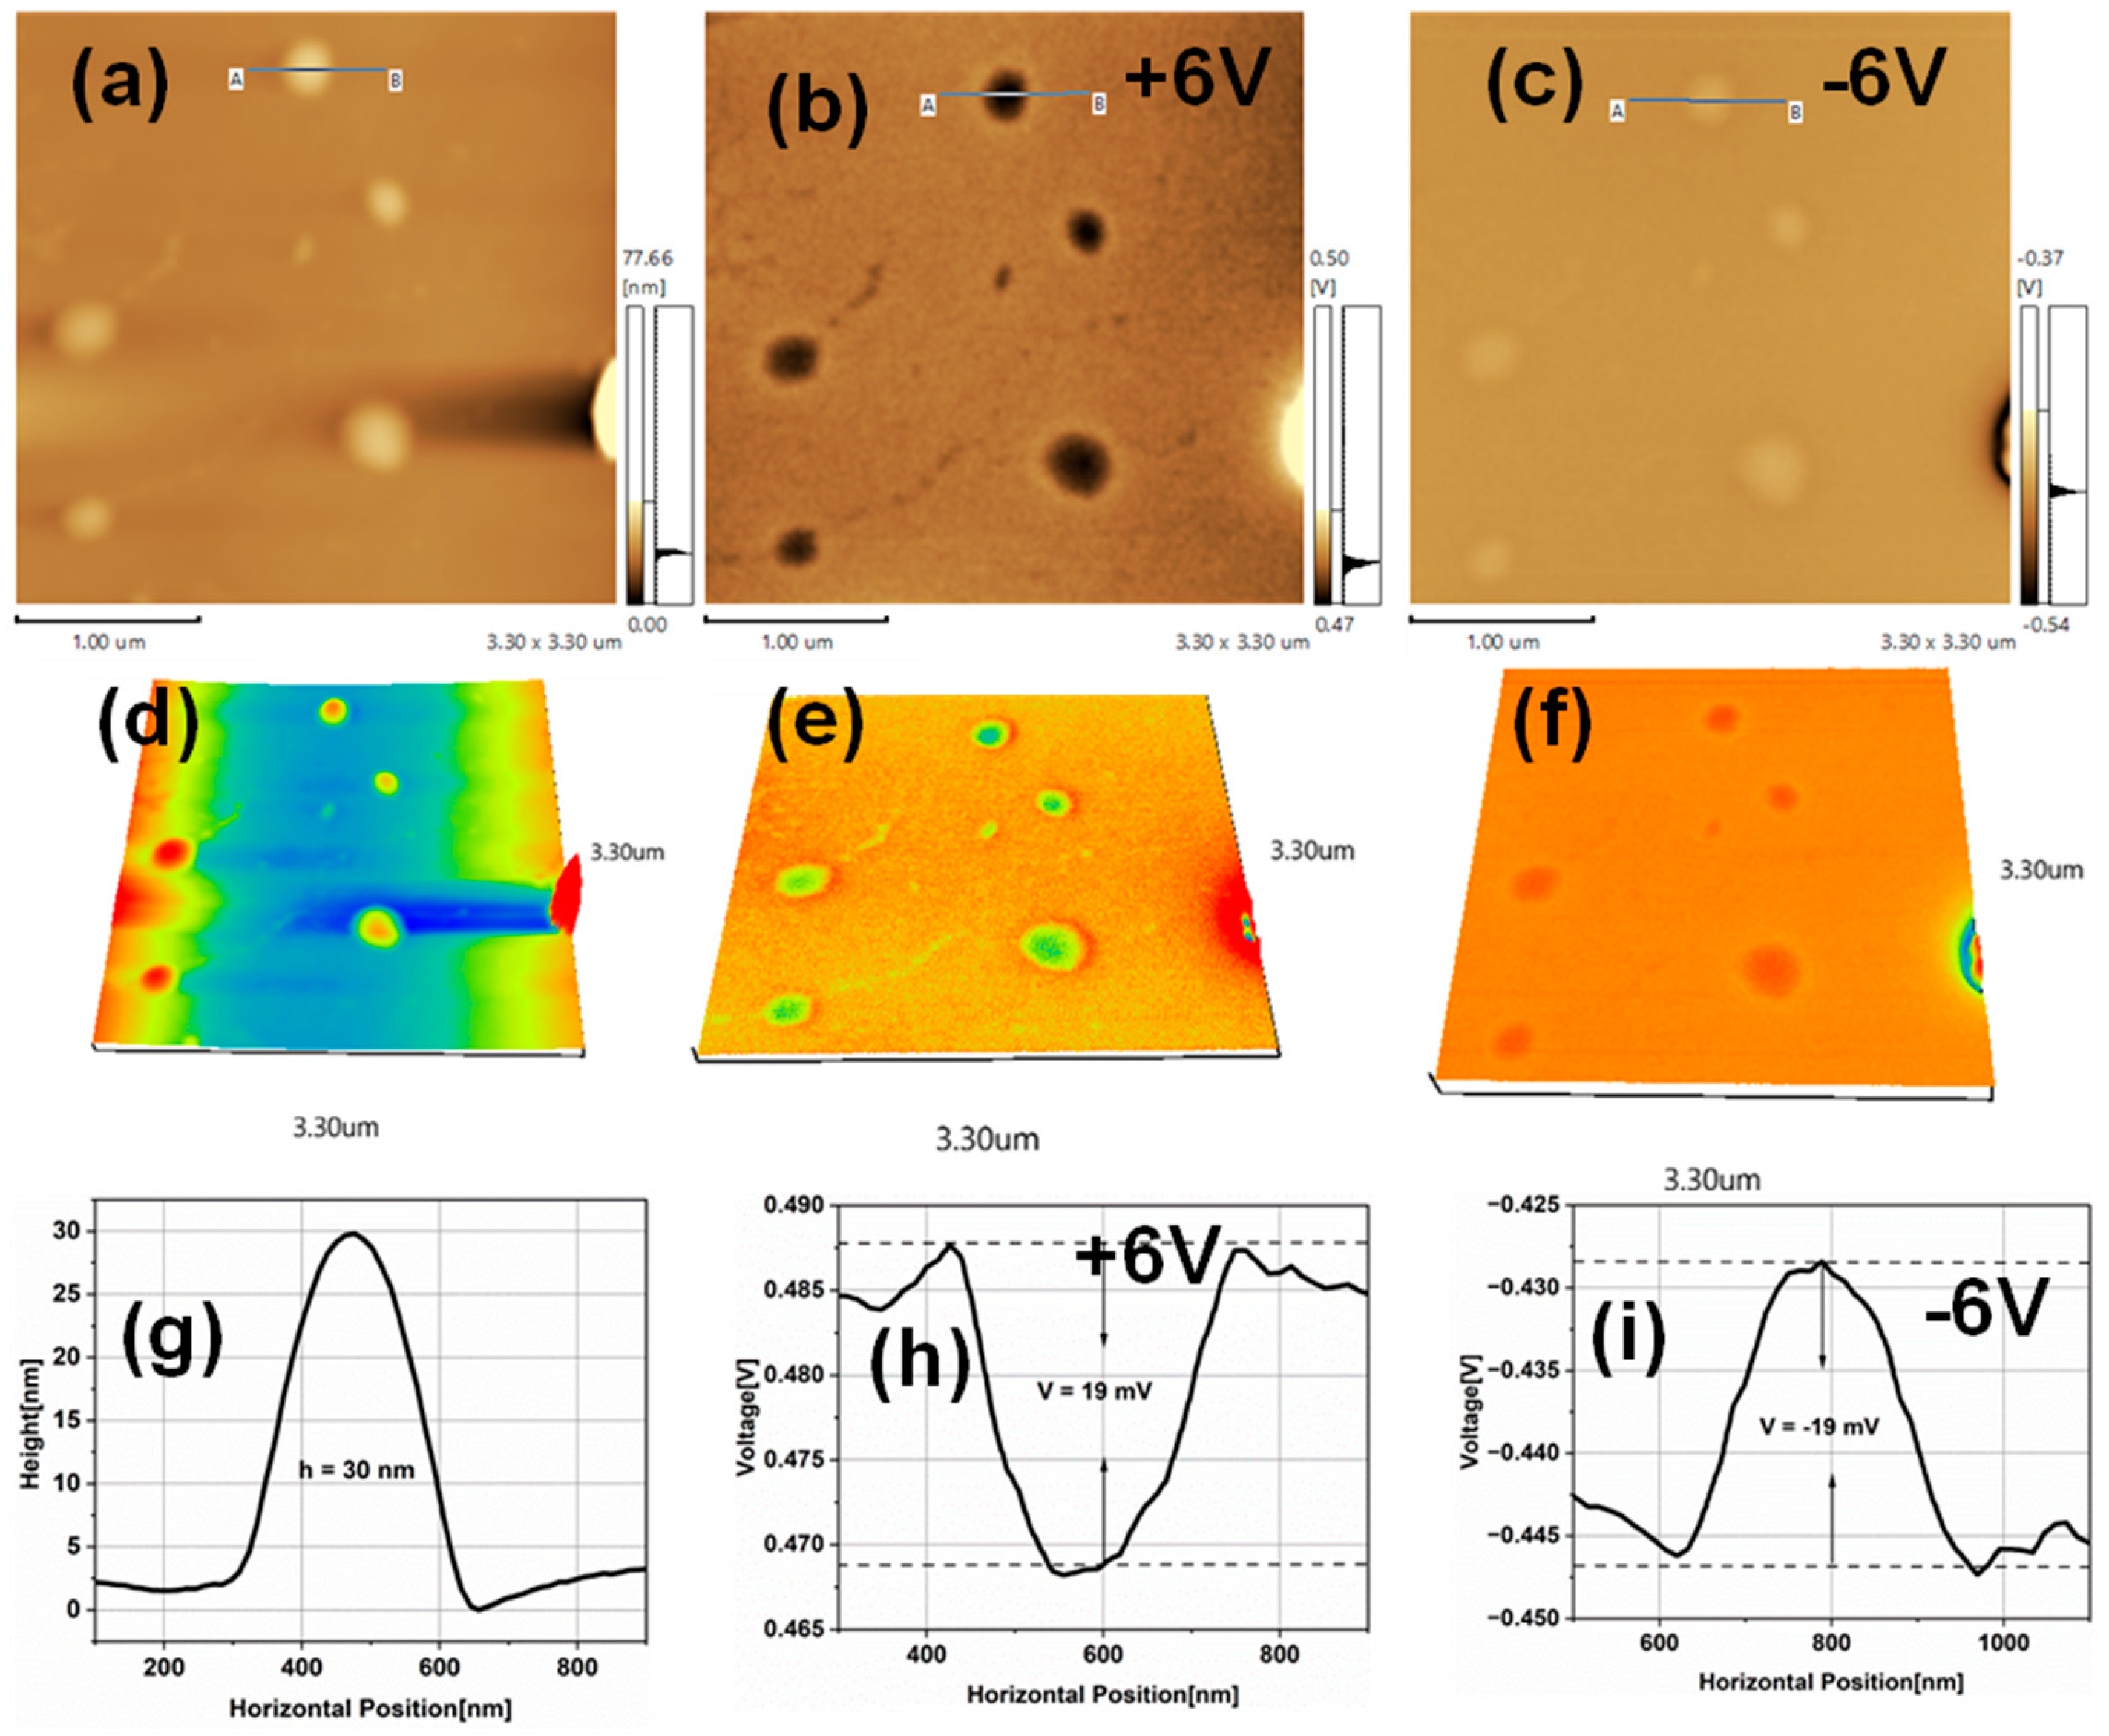
3.3. Electrostatic Force Microscopy of TiO2NPs
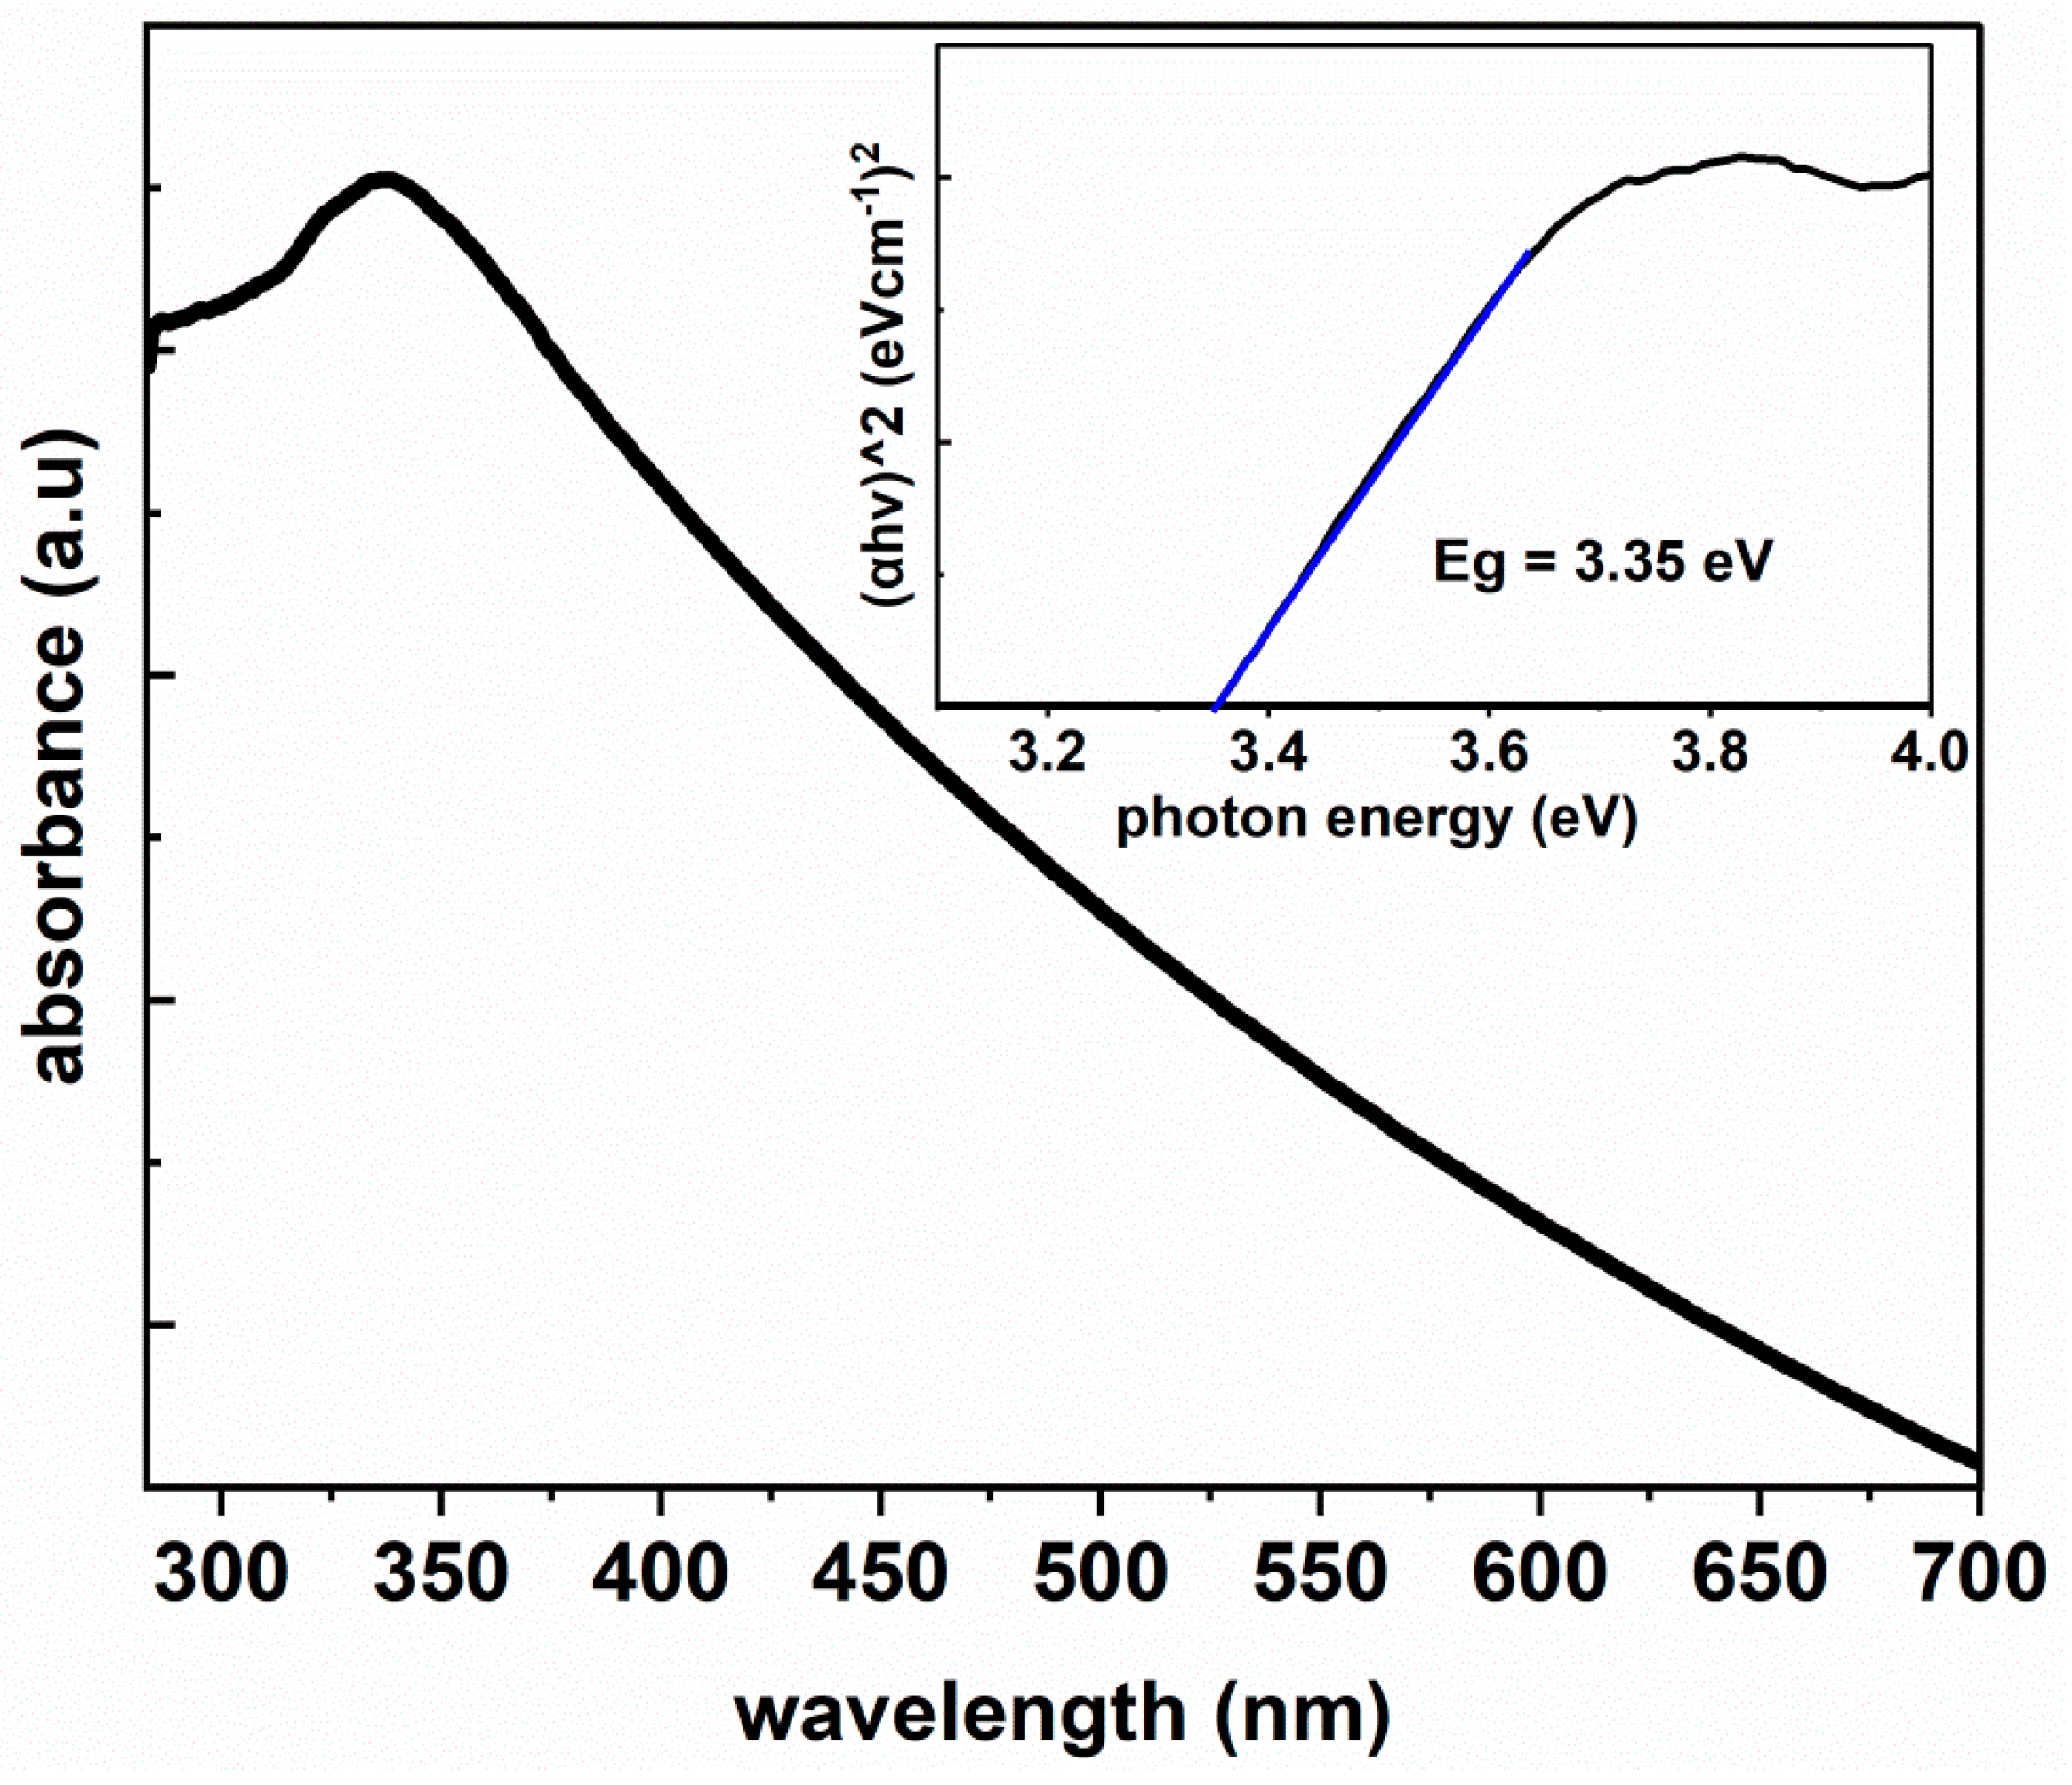
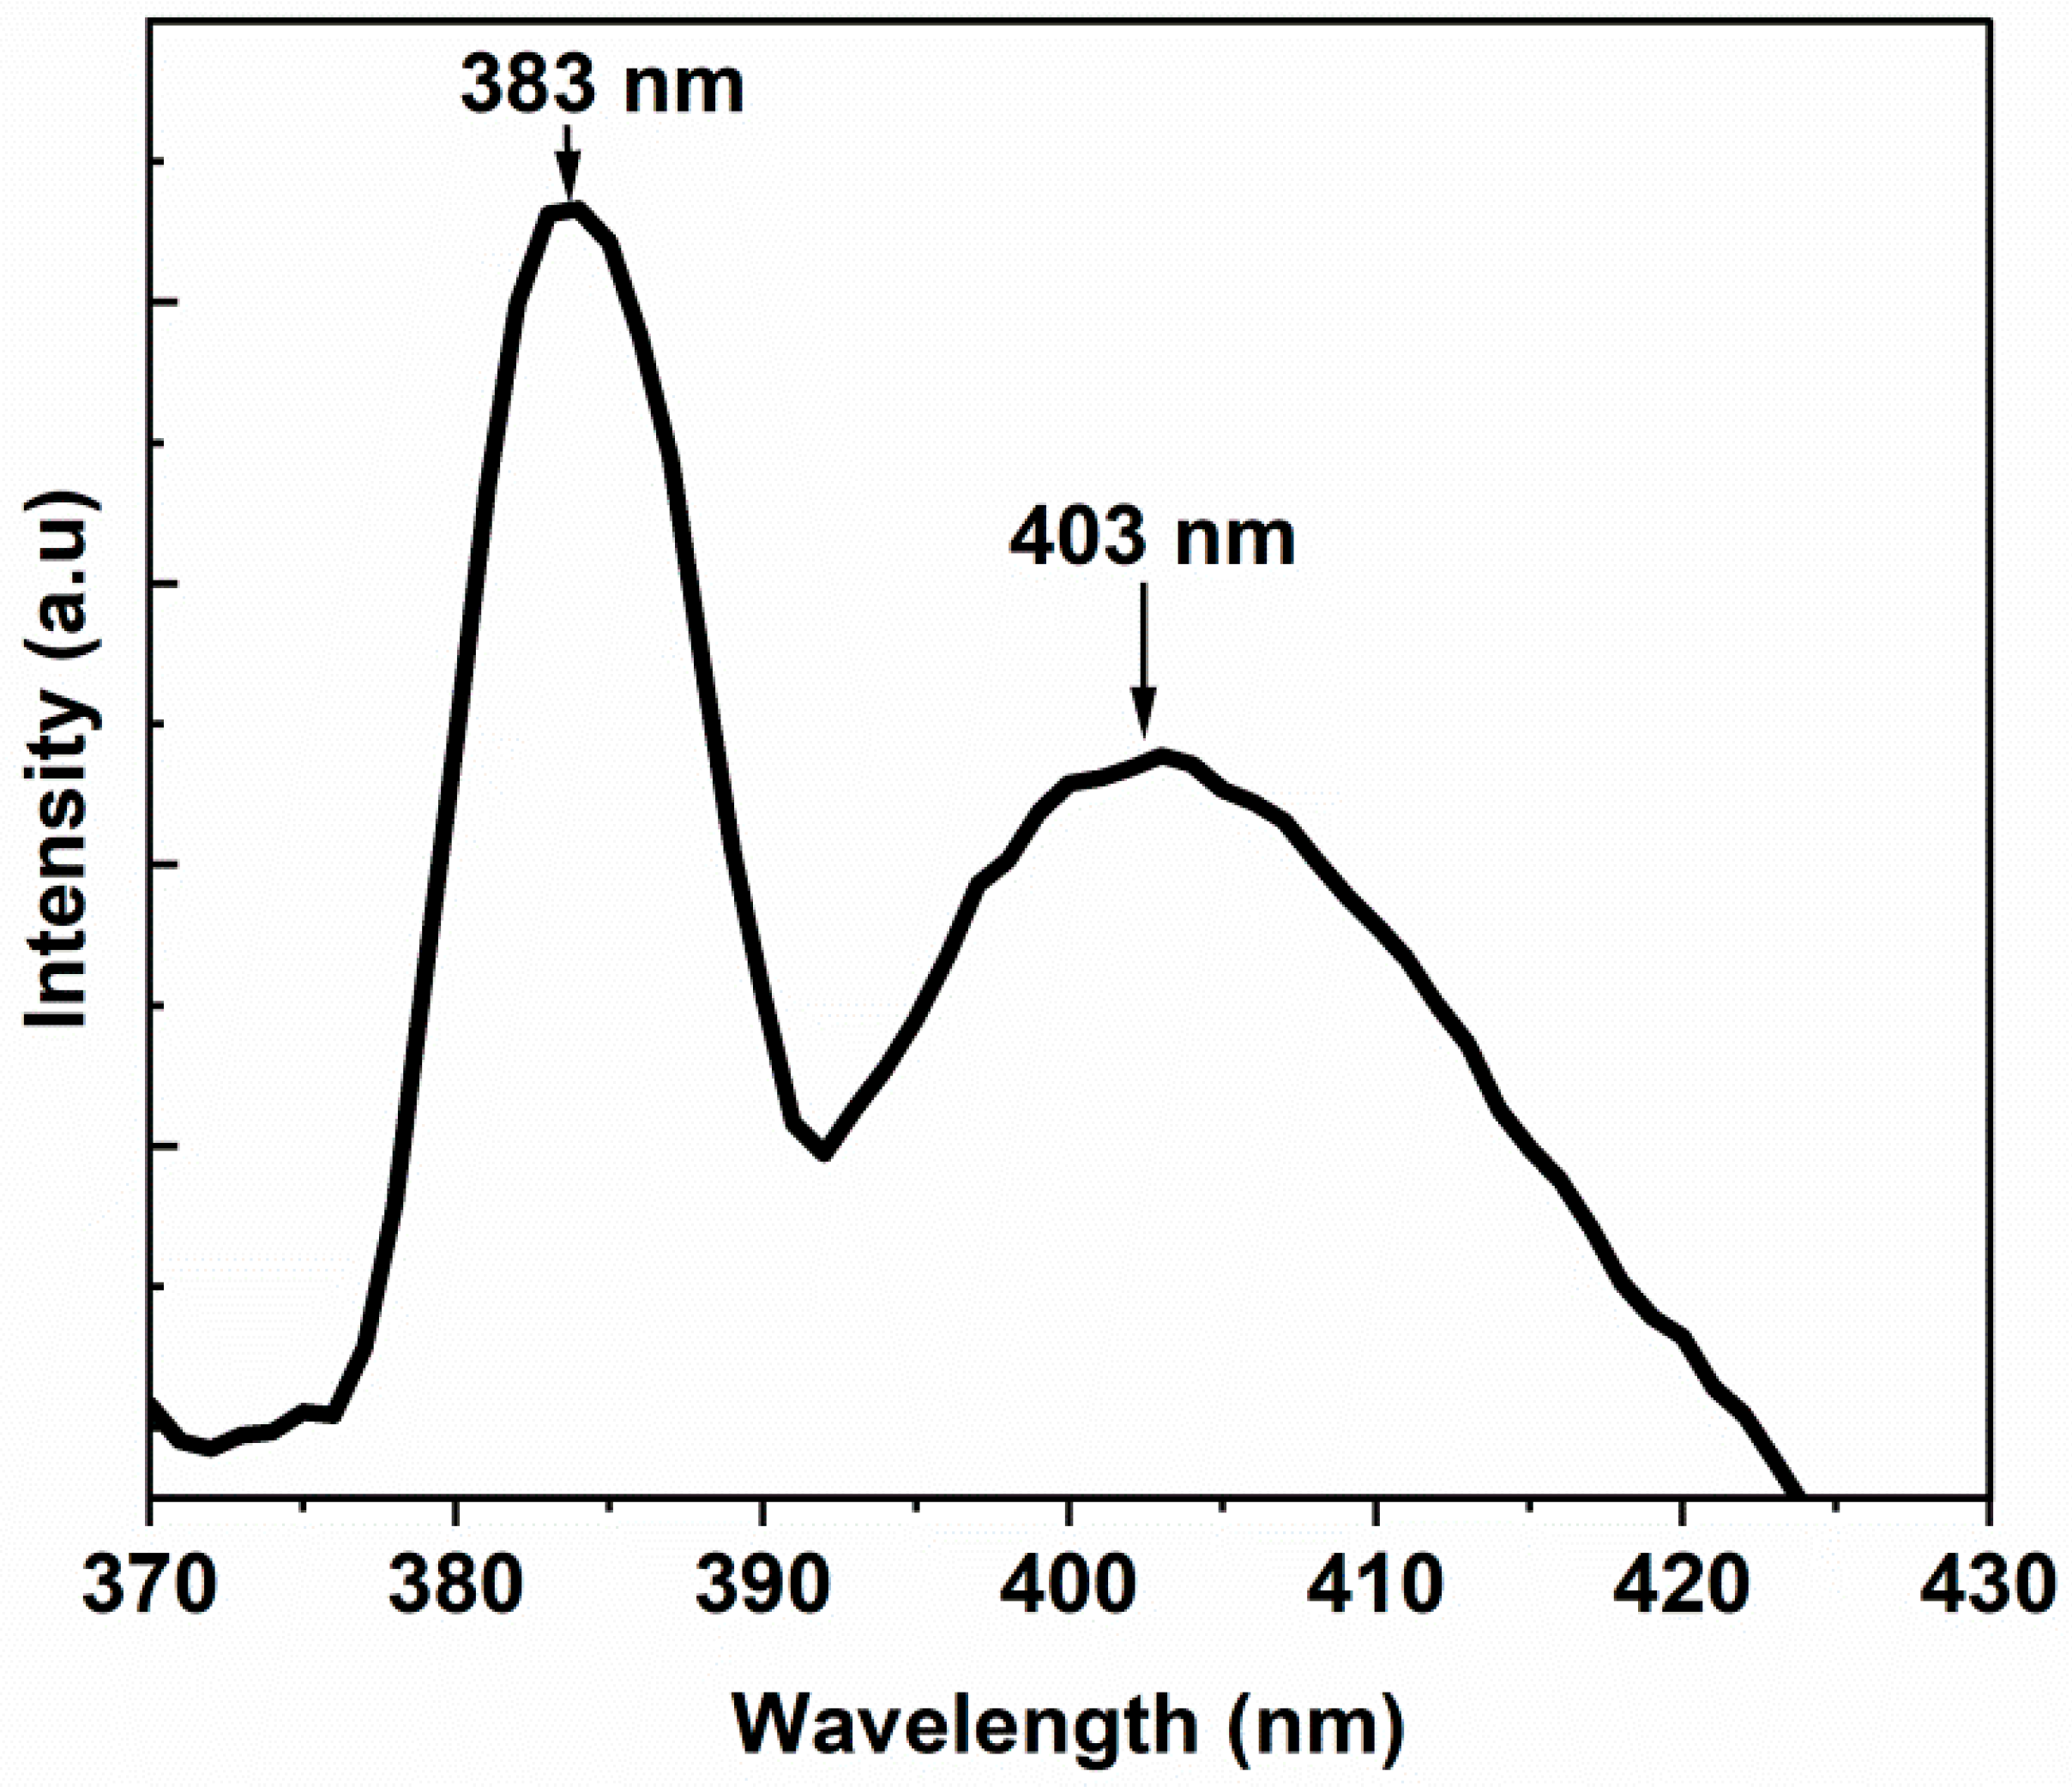
3.4. Optical Properties
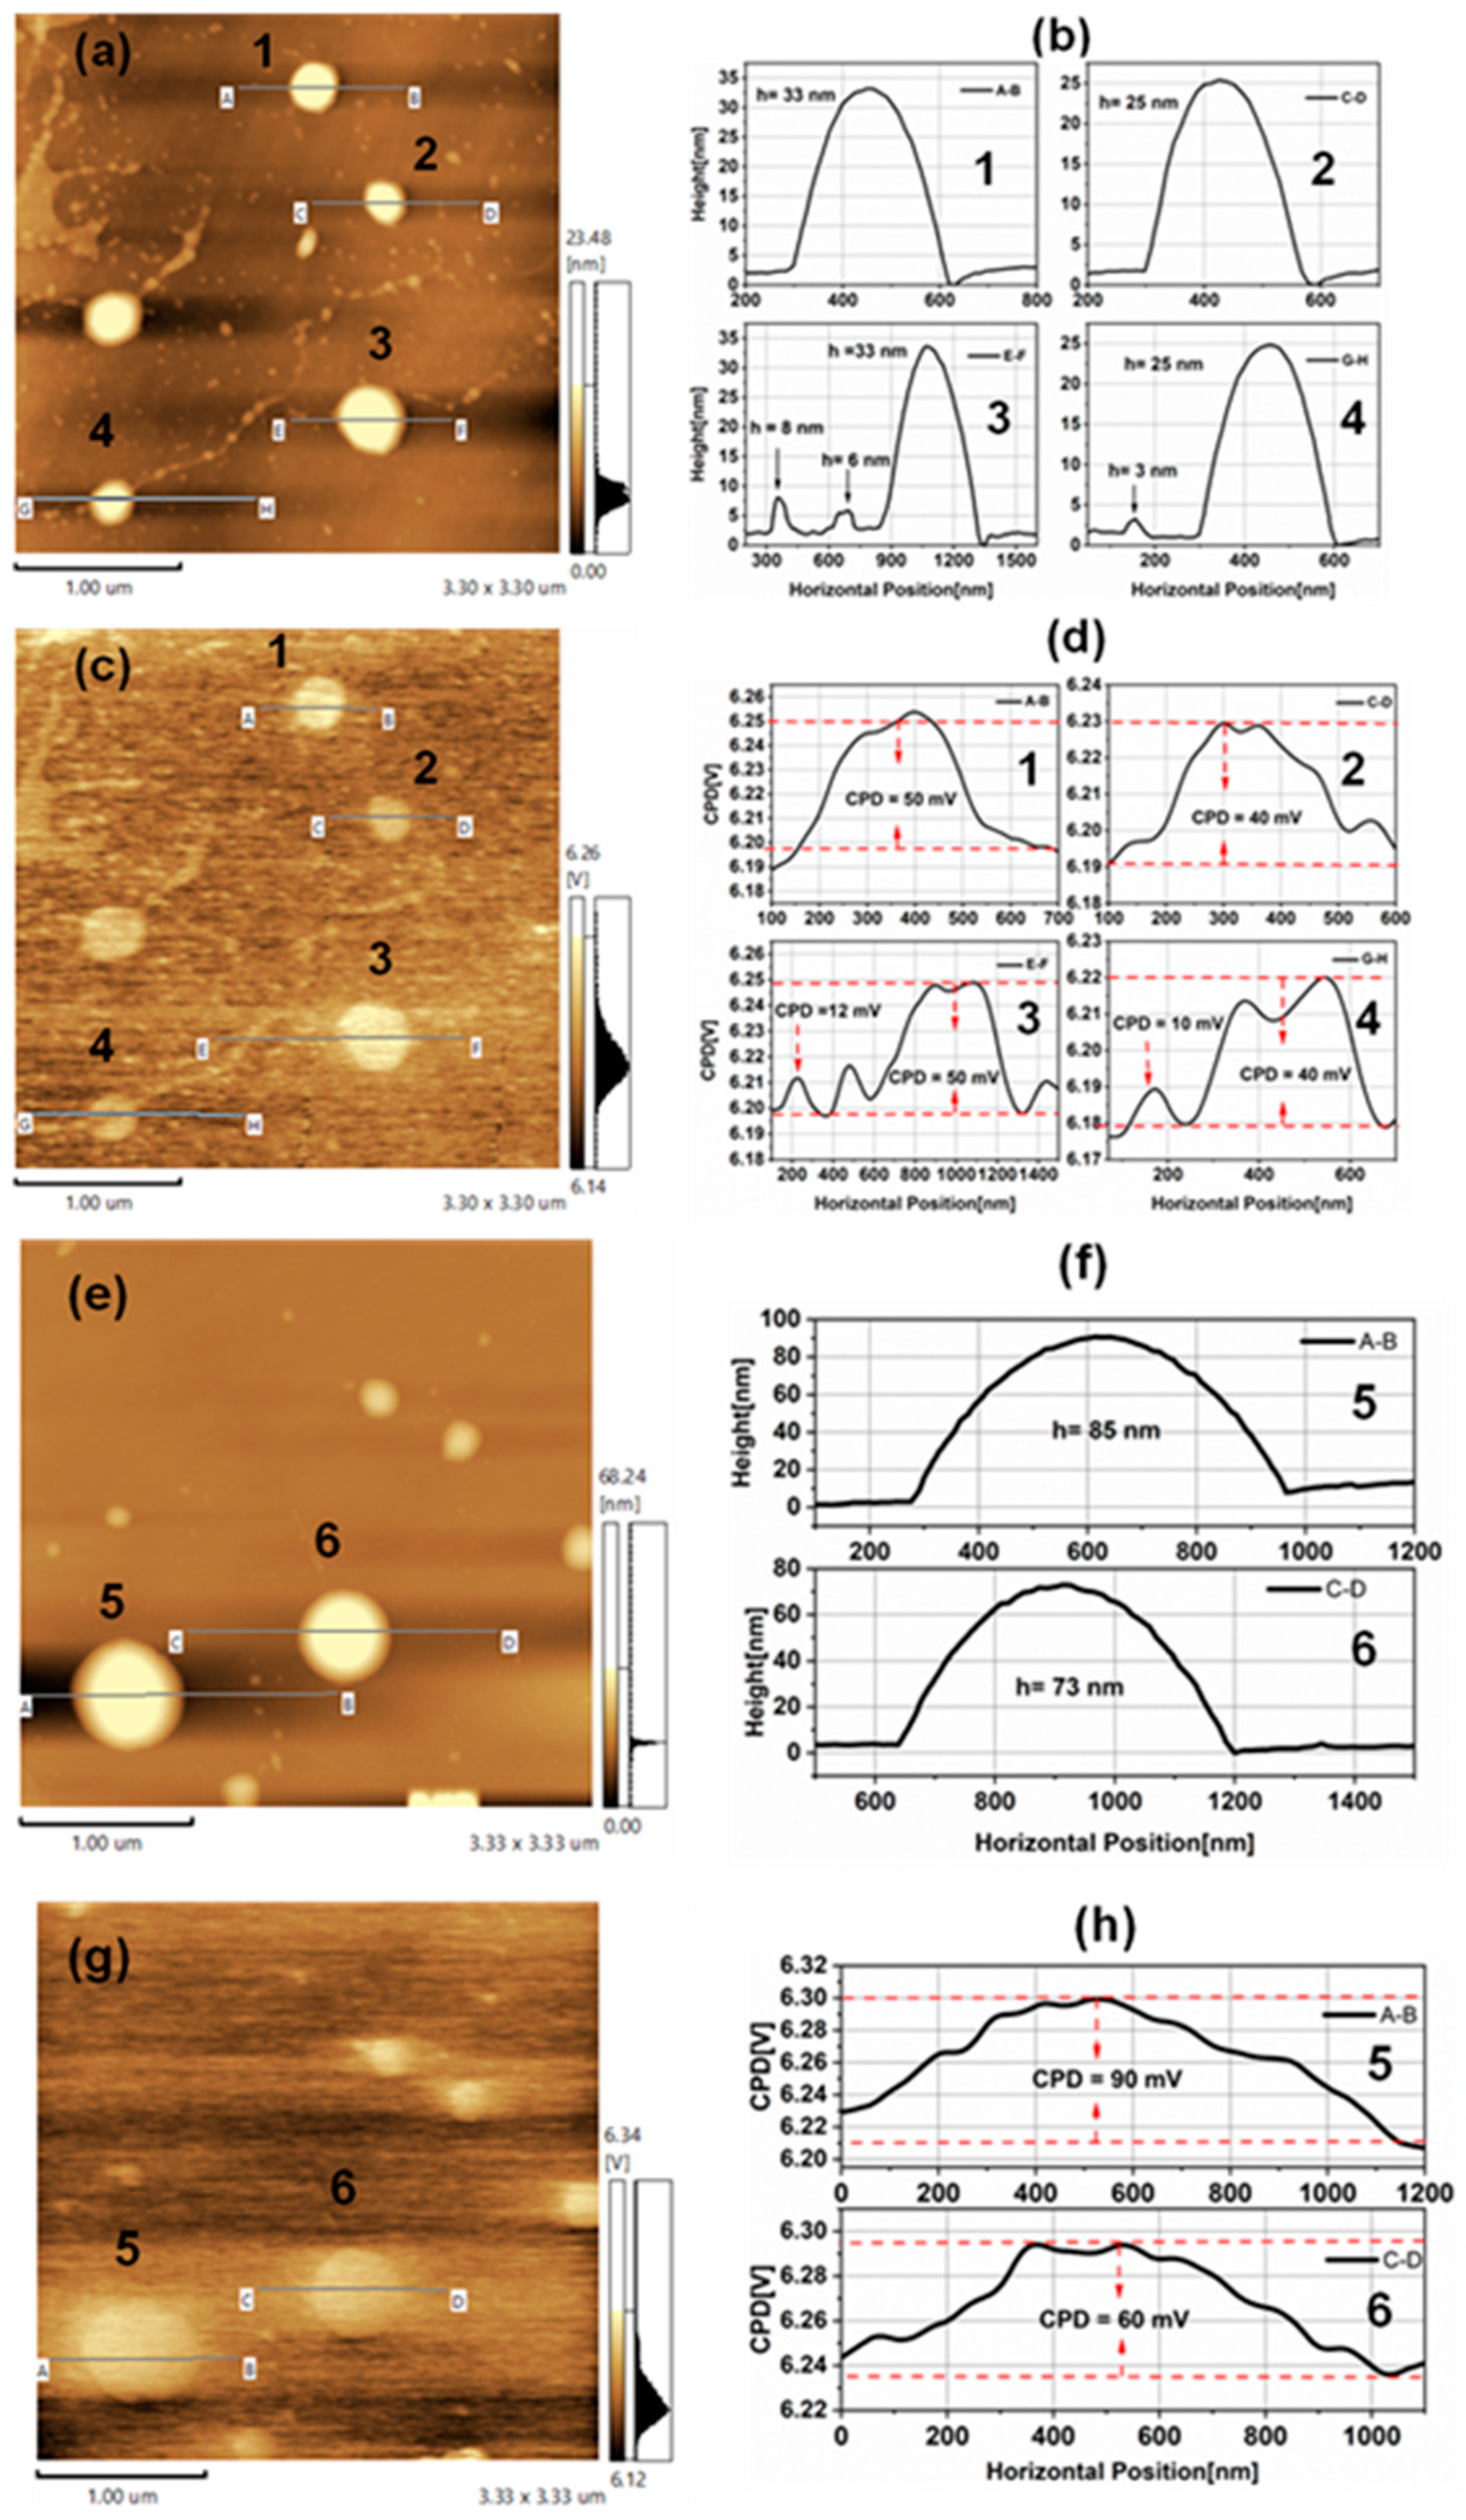
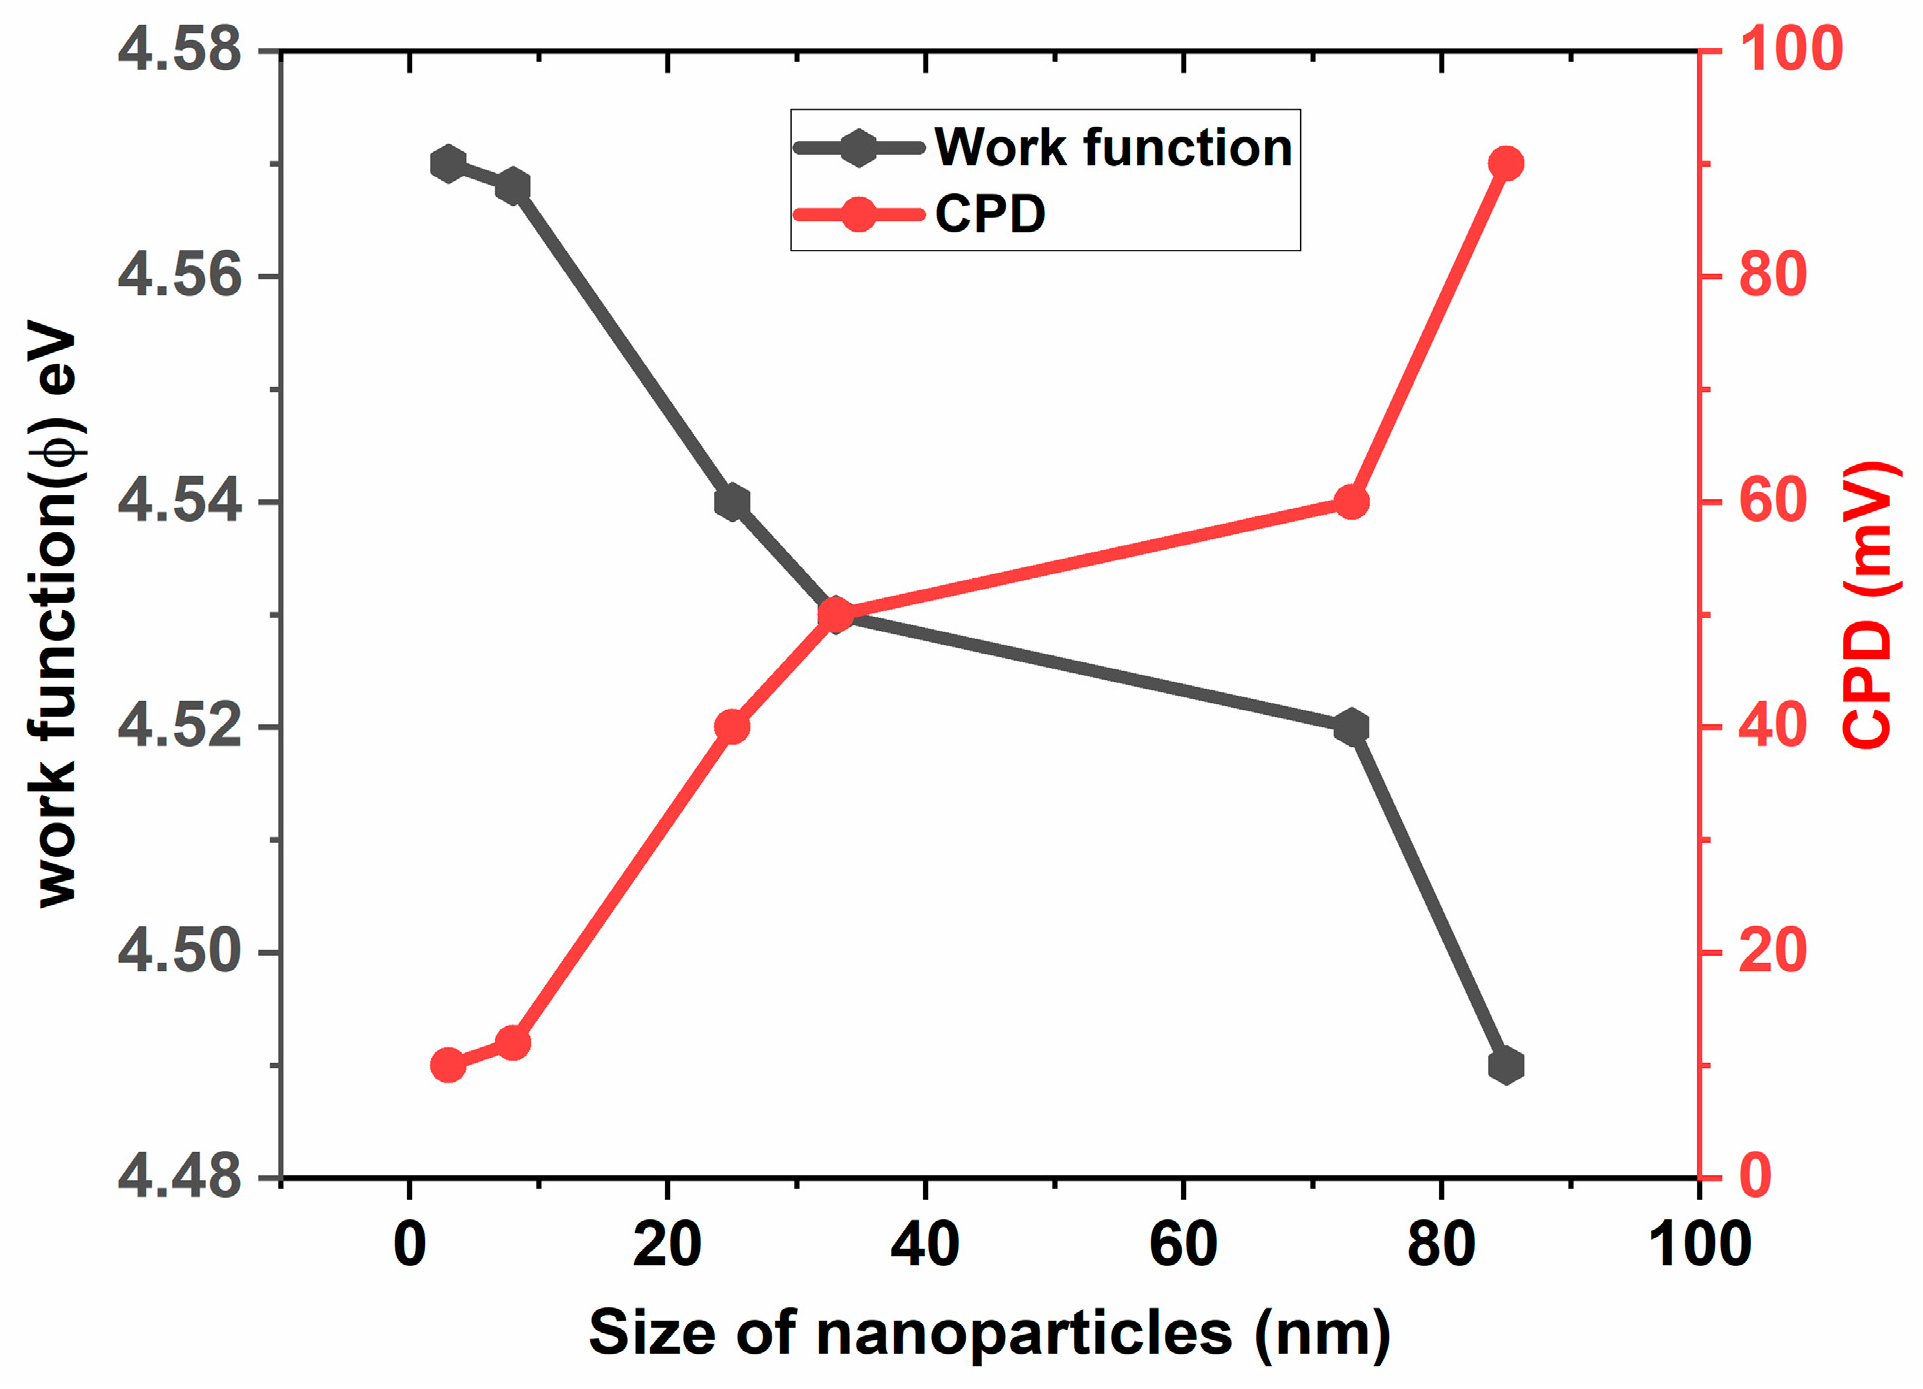
3.5. Determination of and Using KPFM
5. Conclusions
Author Contributions
Funding
Data Availability Statement
Acknowledgments
Conflicts of Interest
References
- Parrino, F.; Palmisano, L. Titanium Dioxide (TiO2) and Its Applications; Elsevier Science, 2020; ISBN 978-0-12-820434-4.
- Akakuru, O.U.; Iqbal, Z.M.; Wu, A. TiO Nanoparticles. In TiO2 Nanoparticles; John Wiley & Sons, Ltd., 2020; pp. 1–66 ISBN 978-3-527-82543-1.
- Abdullah, E.A. Band Edge Positions as a Key Parameter to a Systematic Design of Heterogeneous Photocatalyst. Eur. J. Chem. 2019, 10, 82–94. [Google Scholar] [CrossRef]
- Li, D.; Song, H.; Meng, X.; Shen, T.; Sun, J.; Han, W.; Wang, X. Effects of Particle Size on the Structure and Photocatalytic Performance by Alkali-Treated TiO2. Nanomaterials 2020, 10, 546. [Google Scholar] [CrossRef] [PubMed]
- Tesfaye Jule, L.; Ramaswamy, K.; Bekele, B.; Saka, A.; Nagaprasad, N. Experimental Investigation on the Impacts of Annealing Temperatures on Titanium Dioxide Nanoparticles Structure, Size and Optical Properties Synthesized through Sol-Gel Methods. Materials Today: Proceedings 2021, 45, 5752–5758. [Google Scholar] [CrossRef]
- Glatzel, T.; Gysin, U.; Meyer, E. Kelvin Probe Force Microscopy for Material Characterization. Microscopy 2022, 71, i165–i173. [Google Scholar] [CrossRef]
- Kim, Y.-M.; Lee, J.; Jeon, D.-J.; Oh, S.-E.; Yeo, J.-S. Advanced Atomic Force Microscopy-Based Techniques for Nanoscale Characterization of Switching Devices for Emerging Neuromorphic Applications. Applied Microscopy 2021, 51, 7. [Google Scholar] [CrossRef] [PubMed]
- Wang, J.; Zhang, H.; Cao, G.; Xie, L.; Huang, W. Injection and Retention Characterization of Trapped Charges in Electret Films by Electrostatic Force Microscopy and Kelvin Probe Force Microscopy. physica status solidi (a) 2020, 217, 2000190. [Google Scholar] [CrossRef]
- Checa, M.; Neumayer, S.M.; Tsai, W.-Y.; Collins, L. Advanced Modes of Electrostatic and Kelvin Probe Force Microscopy for Energy Applications. In Atomic Force Microscopy for Energy Research; CRC Press, 2022 ISBN 978-1-00-317404-2.
- Zhang, H.; Gao, H.; Geng, J.; Meng, X.; Xie, H. Torsional Harmonic Kelvin Probe Force Microscopy for High-Sensitivity Mapping of Surface Potential. IEEE Transactions on Industrial Electronics 2022, 69, 1654–1662. [Google Scholar] [CrossRef]
- Chen, S.; Dong, H.; Yang, J. Surface Potential/Charge Sensing Techniques and Applications. Sensors 2020, 20, 1690. [Google Scholar] [CrossRef]
- Zhang, W.; Chen, Y. Experimental Determination of Conduction and Valence Bands of Semiconductor Nanoparticles Using Kelvin Probe Force Microscopy. J Nanopart Res 2013, 15, 1334. [Google Scholar] [CrossRef]
- Henning, A.; Günzburger, G.; Jöhr, R.; Rosenwaks, Y.; Bozic-Weber, B.; Housecroft, C.E.; Constable, E.C.; Meyer, E.; Glatzel, T. Kelvin Probe Force Microscopy of Nanocrystalline TiO2 Photoelectrodes. Beilstein J Nanotechnol 2013, 4, 418–428. [Google Scholar] [CrossRef]
- Melitz, W.; Shen, J.; Lee, S.; Lee, J.S.; Kummel, A.C.; Droopad, R.; Yu, E.T. Scanning Tunneling Spectroscopy and Kelvin Probe Force Microscopy Investigation of Fermi Energy Level Pinning Mechanism on InAs and InGaAs Clean Surfaces. Journal of Applied Physics 2010, 108, 023711. [Google Scholar] [CrossRef]
- Lanzoni, E.M.; Gallet, T.; Spindler, C.; Ramírez, O.; Boumenou, C.K.; Siebentritt, S.; Redinger, A. The Impact of Kelvin Probe Force Microscopy Operation Modes and Environment on Grain Boundary Band Bending in Perovskite and Cu(In,Ga)Se2<math><msub Is=“true”><mrow Is=“true”></Mrow><mrow Is=“true”><mn Is=“true”>2</Mn></Mrow></Msub></Math> Solar Cells. Nano Energy 2021, 88, 106270. [Google Scholar] [CrossRef]
- Miyazaki, M.; Wen, H.F.; Zhang, Q.; Adachi, Y.; Brndiar, J.; Štich, I.; Li, Y.J.; Sugawara, Y. Imaging the Surface Potential at the Steps on the Rutile TiO 2 (110) Surface by Kelvin Probe Force Microscopy. Beilstein J. Nanotechnol. 2019, 10, 1228–1236. [Google Scholar] [CrossRef] [PubMed]
- Musa, I.; Faqi, R. Structural, Electrostatic Force Microscopy, Work Function, and Optical Characterization of Pure and Al-Doped ZnO Nanoparticles. Results in Materials 2024, 22, 100570. [Google Scholar] [CrossRef]
- Fakhouri, H.; Arefi-Khonsari, F.; Jaiswal, A.K.; Pulpytel, J. Enhanced Visible Light Photoactivity and Charge Separation in TiO2/TiN Bilayer Thin Films. Applied Catalysis A: General 2015, 492, 83–92. [Google Scholar] [CrossRef]
- Mansfeldova, V.; Zlamalova, M.; Tarabkova, H.; Janda, P.; Vorokhta, M.; Piliai, L.; Kavan, L. Work Function of TiO 2 (Anatase, Rutile, and Brookite) Single Crystals: Effects of the Environment. J. Phys. Chem. C 2021, 125, 1902–1912. [Google Scholar] [CrossRef]
- Kaur, J.; Kant, R. Curvature-Induced Anomalous Enhancement in the Work Function of Nanostructures. J. Phys. Chem. Lett. 2015, 6, 2870–2874. [Google Scholar] [CrossRef]
- Taylor, K.J.; Pettiette-Hall, C.L.; Cheshnovsky, O.; Smalley, R.E. Ultraviolet Photoelectron Spectra of Coinage Metal Clusters. The Journal of Chemical Physics 1992, 96, 3319–3329. [Google Scholar] [CrossRef]
- Musa, I.; Ghabboun, J. Work Function, Electrostatic Force Microscopy, Tunable Photoluminescence of Gold Nanoparticles, and Plasmonic Interaction of Gold Nanoparticles/Rhodamine 6G Nanocomposite. Plasmonics 2024. [Google Scholar] [CrossRef]
- Vollath, D.; Fischer, F.D.; Holec, D. Surface Energy of Nanoparticles – Influence of Particle Size and Structure. Beilstein J. Nanotechnol. 2018, 9, 2265–2276. [Google Scholar] [CrossRef]
- Khoury, D.E. Towards the Use of Electrostatic Force Microscopy to Study Interphases in Nanodielectric Materials. phdthesis, Université Montpellier, 2017.
- Marchi, F.; Dianoux, R.; Smilde, H.J.H.; Mur, P.; Comin, F.; Chevrier, J. Characterisation of Trapped Electric Charge Carriers Behaviour at Nanometer Scale by Electrostatic Force Microscopy. Journal of Electrostatics 2008, 66, 538–547. [Google Scholar] [CrossRef]
- Kaja, K.; Mariolle, D.; Chevalier, N.; Naja, A.; Jouiad, M. Sub-10 Nm Spatial Resolution for Electrical Properties Measurements Using Bimodal Excitation in Electric Force Microscopy. Review of Scientific Instruments 2021, 92, 023703. [Google Scholar] [CrossRef] [PubMed]
- Chen, G.; Xu, Z. Charge Trapping and Detrapping in Polymeric Materials. Journal of Applied Physics 2009, 106, 123707. [Google Scholar] [CrossRef]
- Silva-Pinto, E.; Neves, B.R.A. Charge Injection on Insulators via Scanning Probe Microscopy Techniques: Towards Data Storage Devices. Journal of Nanoscience and Nanotechnology 2010, 10, 4204–4212. [Google Scholar] [CrossRef]
- Fidalgo, A.; Letichevsky, S.; Santos, B.F. Assessment of TiO2 Band Gap from Structural Parameters Using Artificial Neural Networks. Journal of Photochemistry and Photobiology A: Chemistry 2021, 405, 112870. [Google Scholar] [CrossRef]
- Safiay, N.M.; Rani, R.A.; Azhar, N.E.A.; Khusaimi, Z.; Hamzah, F.; Rusop, M. Influence of Different Annealing Temperatures on the Structural and Optical Properties of TiO 2 Nanoparticles Synthesized via Sol-Gel Method: Potential Application as UV Sensor. Indonesian Journal of Chemistry 2021, 21, 279–285. [Google Scholar] [CrossRef]
- Mithun, M.H.; Sayed, A.; Rahaman, I. The Effect of Band-Gap on TiO2 Thin Film Considering Various Parameters. Proceedings of Engineering and Technology Innovation 2021, 19, 45–52. [Google Scholar] [CrossRef]
- Sharma, S.; Venkata Dhanunjaya Reddy, A.; Jayarambabu, N.; Vikram Manoj Kumar, N.; Saineetha, A.; Venkateswara Rao, K.; Kailasa, S. Synthesis and Characterization of Titanium Dioxide Nanopowder for Various Energy and Environmental Applications. Materials Today: Proceedings 2020, 26, 158–161. [Google Scholar] [CrossRef]
- D’Elia, D.; Beauger, C.; Hochepied, J.-F.; Rigacci, A.; Berger, M.-H.; Keller, N.; Keller-Spitzer, V.; Suzuki, Y.; Valmalette, J.-C.; Benabdesselam, M.; et al. Impact of Three Different TiO2 Morphologies on Hydrogen Evolution by Methanol Assisted Water Splitting: Nanoparticles, Nanotubes and Aerogels. International Journal of Hydrogen Energy 2011, 36, 14360–14373. [Google Scholar] [CrossRef]
- Sampaio, M.J.; Yu, Z.; Lopes, J.C.; Tavares, P.B.; Silva, C.G.; Liu, L.; Faria, J.L. Light-Driven Oxygen Evolution from Water Oxidation with Immobilised TiO2 Engineered for High Performance. Sci Rep 2021, 11, 21306. [Google Scholar] [CrossRef]
- Abdullah, S.A.; Sahdan, M.Z.; Nafarizal, N.; Saim, H.; Bakri, A.S.; Cik Rohaida, C.H.; Adriyanto, F.; Sari, Y. Photoluminescence Study of Trap-State Defect on TiO 2 Thin Films at Different Substrate Temperature via RF Magnetron Sputtering. J. Phys.: Conf. Ser. 2018, 995, 012067. [Google Scholar] [CrossRef]
- Mahesh, A.; Jawahar, I.N.; V, B. Photoluminescence, Photocurrent Response and Photocatalytic Activity of Hydrothermally Derived Nanocrystalline Zno with Native Point Defects 2023.
| Particle Size (nm) | surface roughness (nm) | CPD (mV) | Work function(Φ) (eV) | Conduction band (eV) | Valance band (eV) |
|---|---|---|---|---|---|
| 3 | 0.58 | 10 | 4.57 | -4.57 | -7.92 |
| 8 | 0.95 | 12 | 4.568 | -4.568 | -7.918 |
| 25 | 8.06 | 40 | 4.54 | -4.54 | -7.89 |
| 33 | 9.66 | 50 | 4.53 | -4.53 | -7.88 |
| 73 | 23.92 | 60 | 4.52 | -4.52 | -7.87 |
| 85 | 30.57 | 90 | 4.49 | -4.49 | -7.84 |
Disclaimer/Publisher’s Note: The statements, opinions and data contained in all publications are solely those of the individual author(s) and contributor(s) and not of MDPI and/or the editor(s). MDPI and/or the editor(s) disclaim responsibility for any injury to people or property resulting from any ideas, methods, instructions or products referred to in the content. |
© 2024 by the authors. Licensee MDPI, Basel, Switzerland. This article is an open access article distributed under the terms and conditions of the Creative Commons Attribution (CC BY) license (http://creativecommons.org/licenses/by/4.0/).


