Submitted:
24 September 2024
Posted:
24 September 2024
You are already at the latest version
Abstract
Keywords:
1. Introduction
2. Materials and Methods
2.1. Apple Samples and Fruit Measurement
2.2. Algorithm for Assessing the Quality of Apple Fruits via a Digital Method
3. Results
3.1. Determination of the Geometric Parameters of Fruits
3.2. Determination of the Weight and Volume of Apples via Digital Methods
3.2.1. Apple Weight Prediction Results
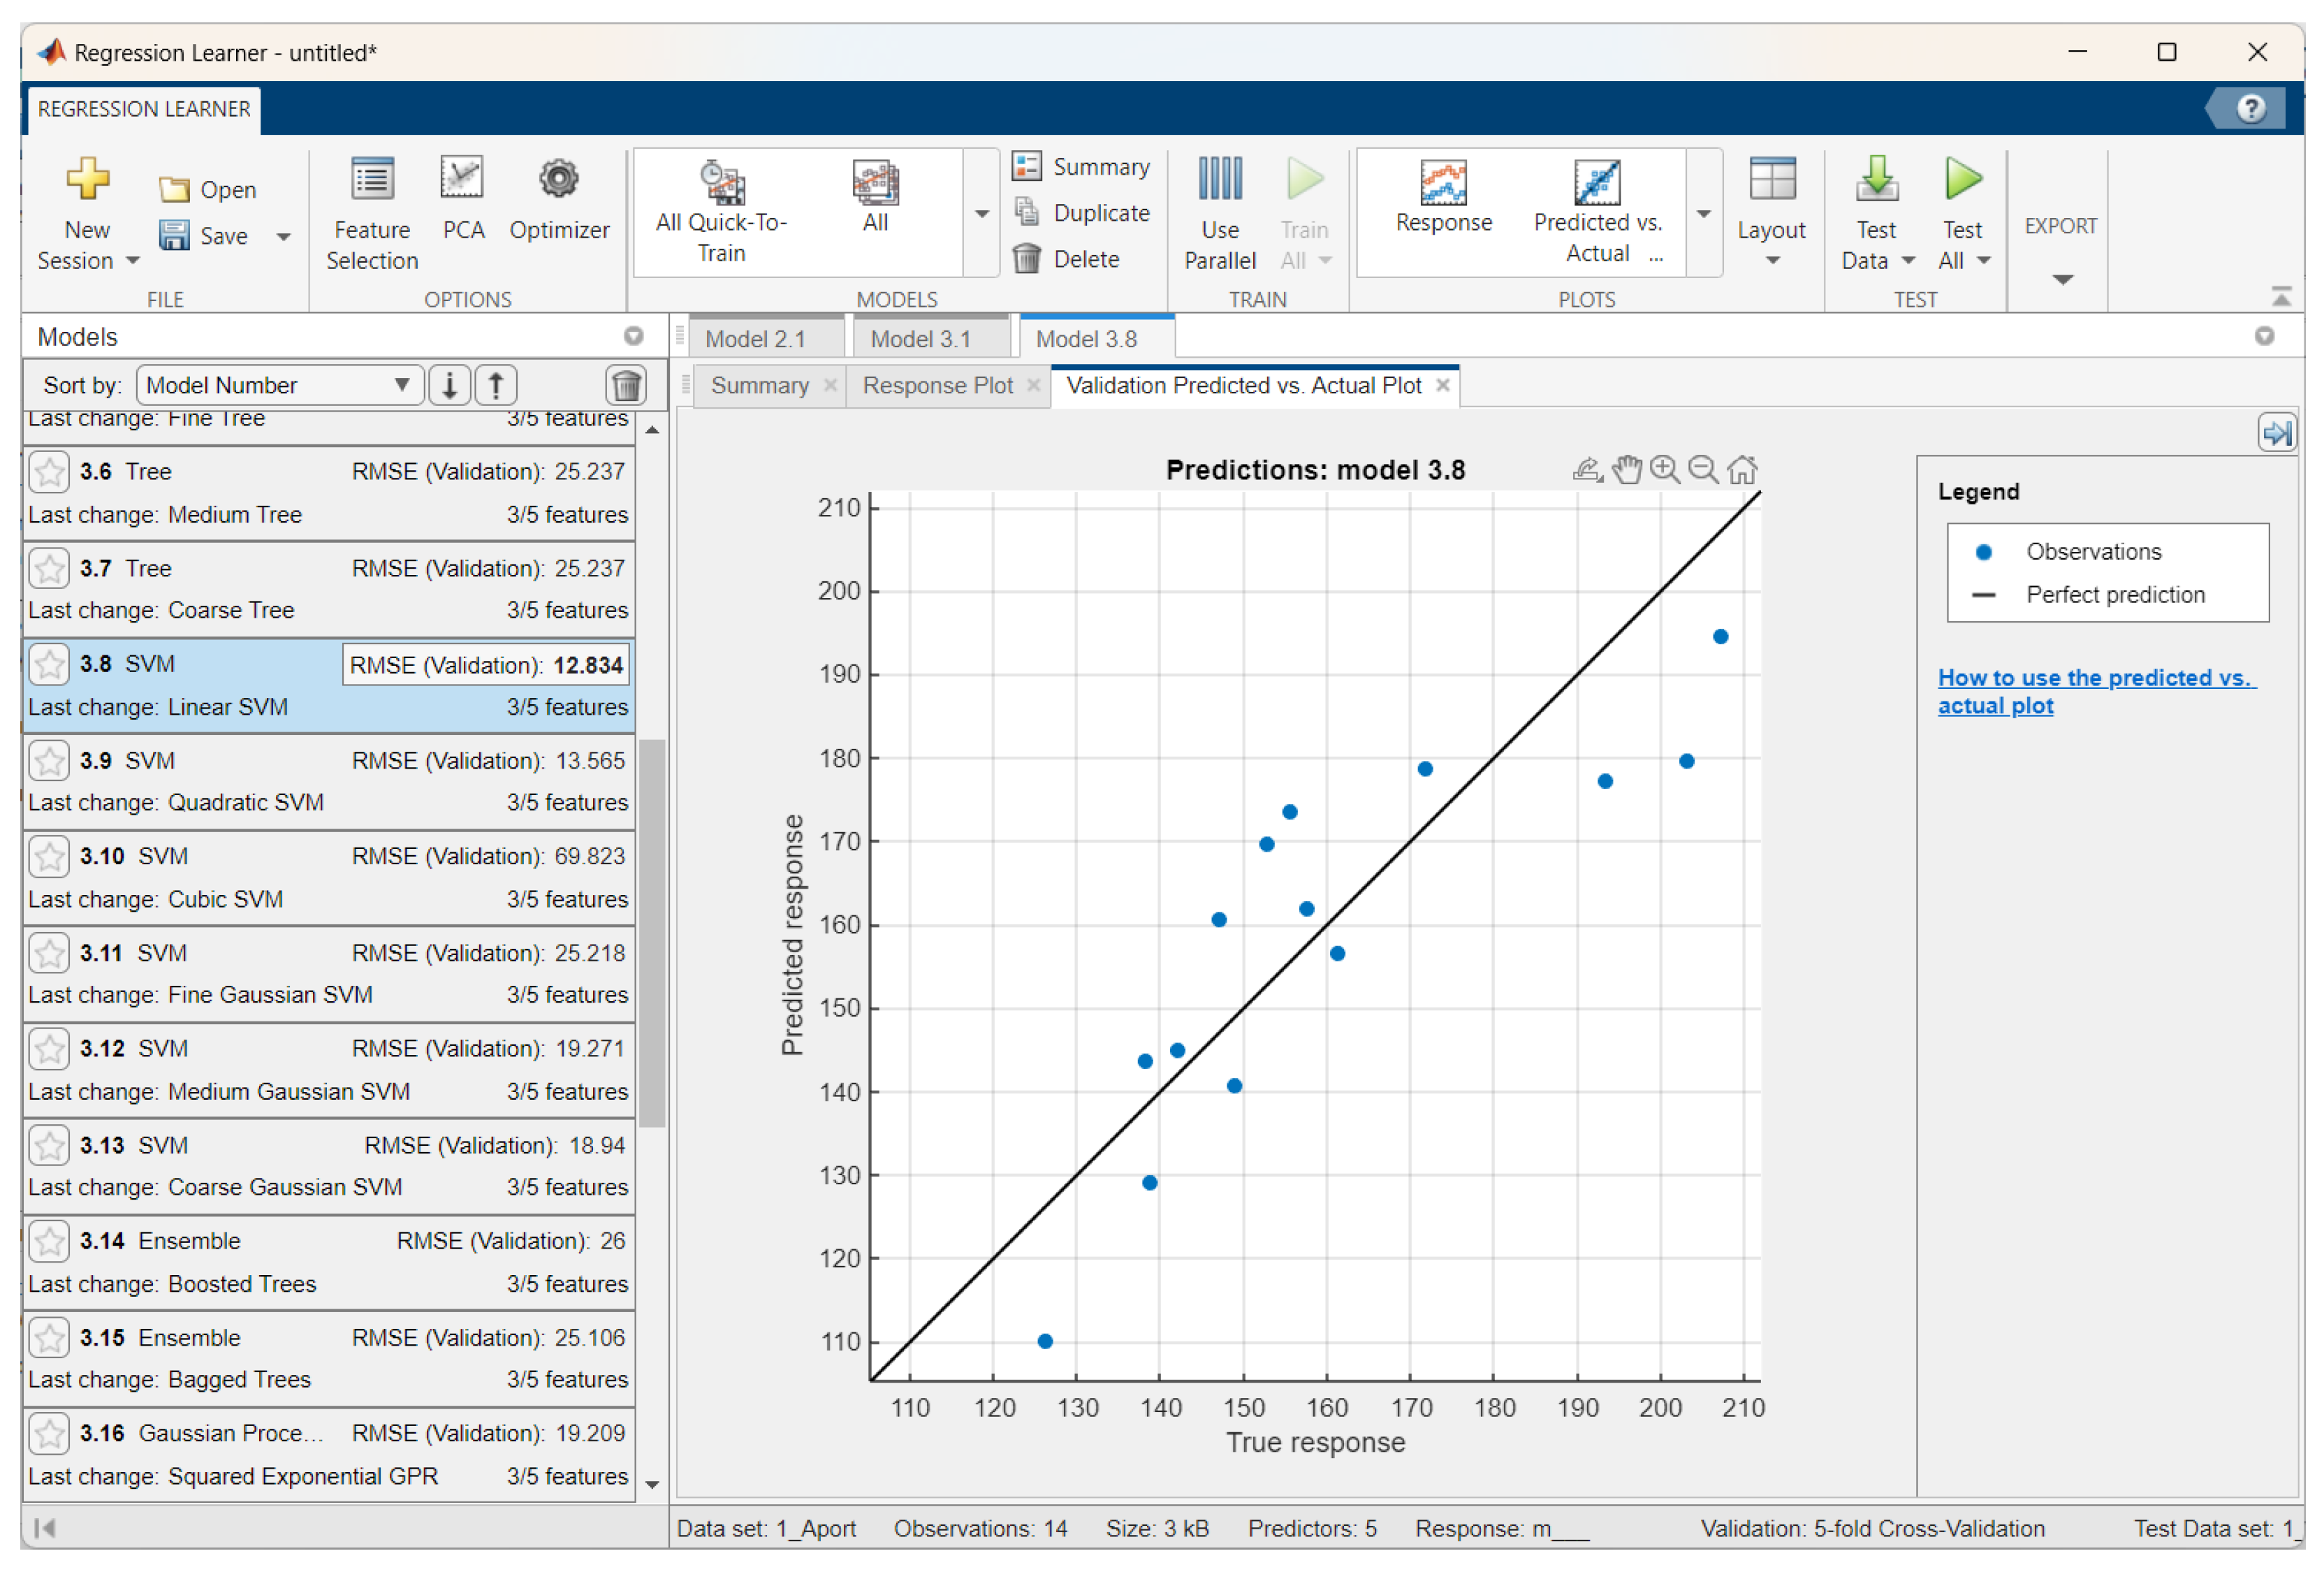
3.2.2. Apple Volume Prediction Results
5. Conclusions
- With the growth of apple production and the shortage of skilled workers in Kazakhstan, the development and implementation of digital technologies to improve the productivity of apple fruit quality assessment is an urgent issue.
- The literature analysis confirms that technical vision systems, which use color video cameras and flexible algorithms for digital image processing, contribute to the use of information about the object of study and the surrounding background and are widely used for determining the quantitative indicators of various objects to solve the problem of determining fruit quality.
- The developed digital method achieved high accuracy in determining the size d of the fruit, with maximum relative errors of 2.99%, 3.03%, and 4.12% for the e, h, and D parameters, respectively. This methods enables the quantification of the area and the percentage of color, which cannot always be detected with the naked eye, allowing for the automation and optimization of apple quality assessment.
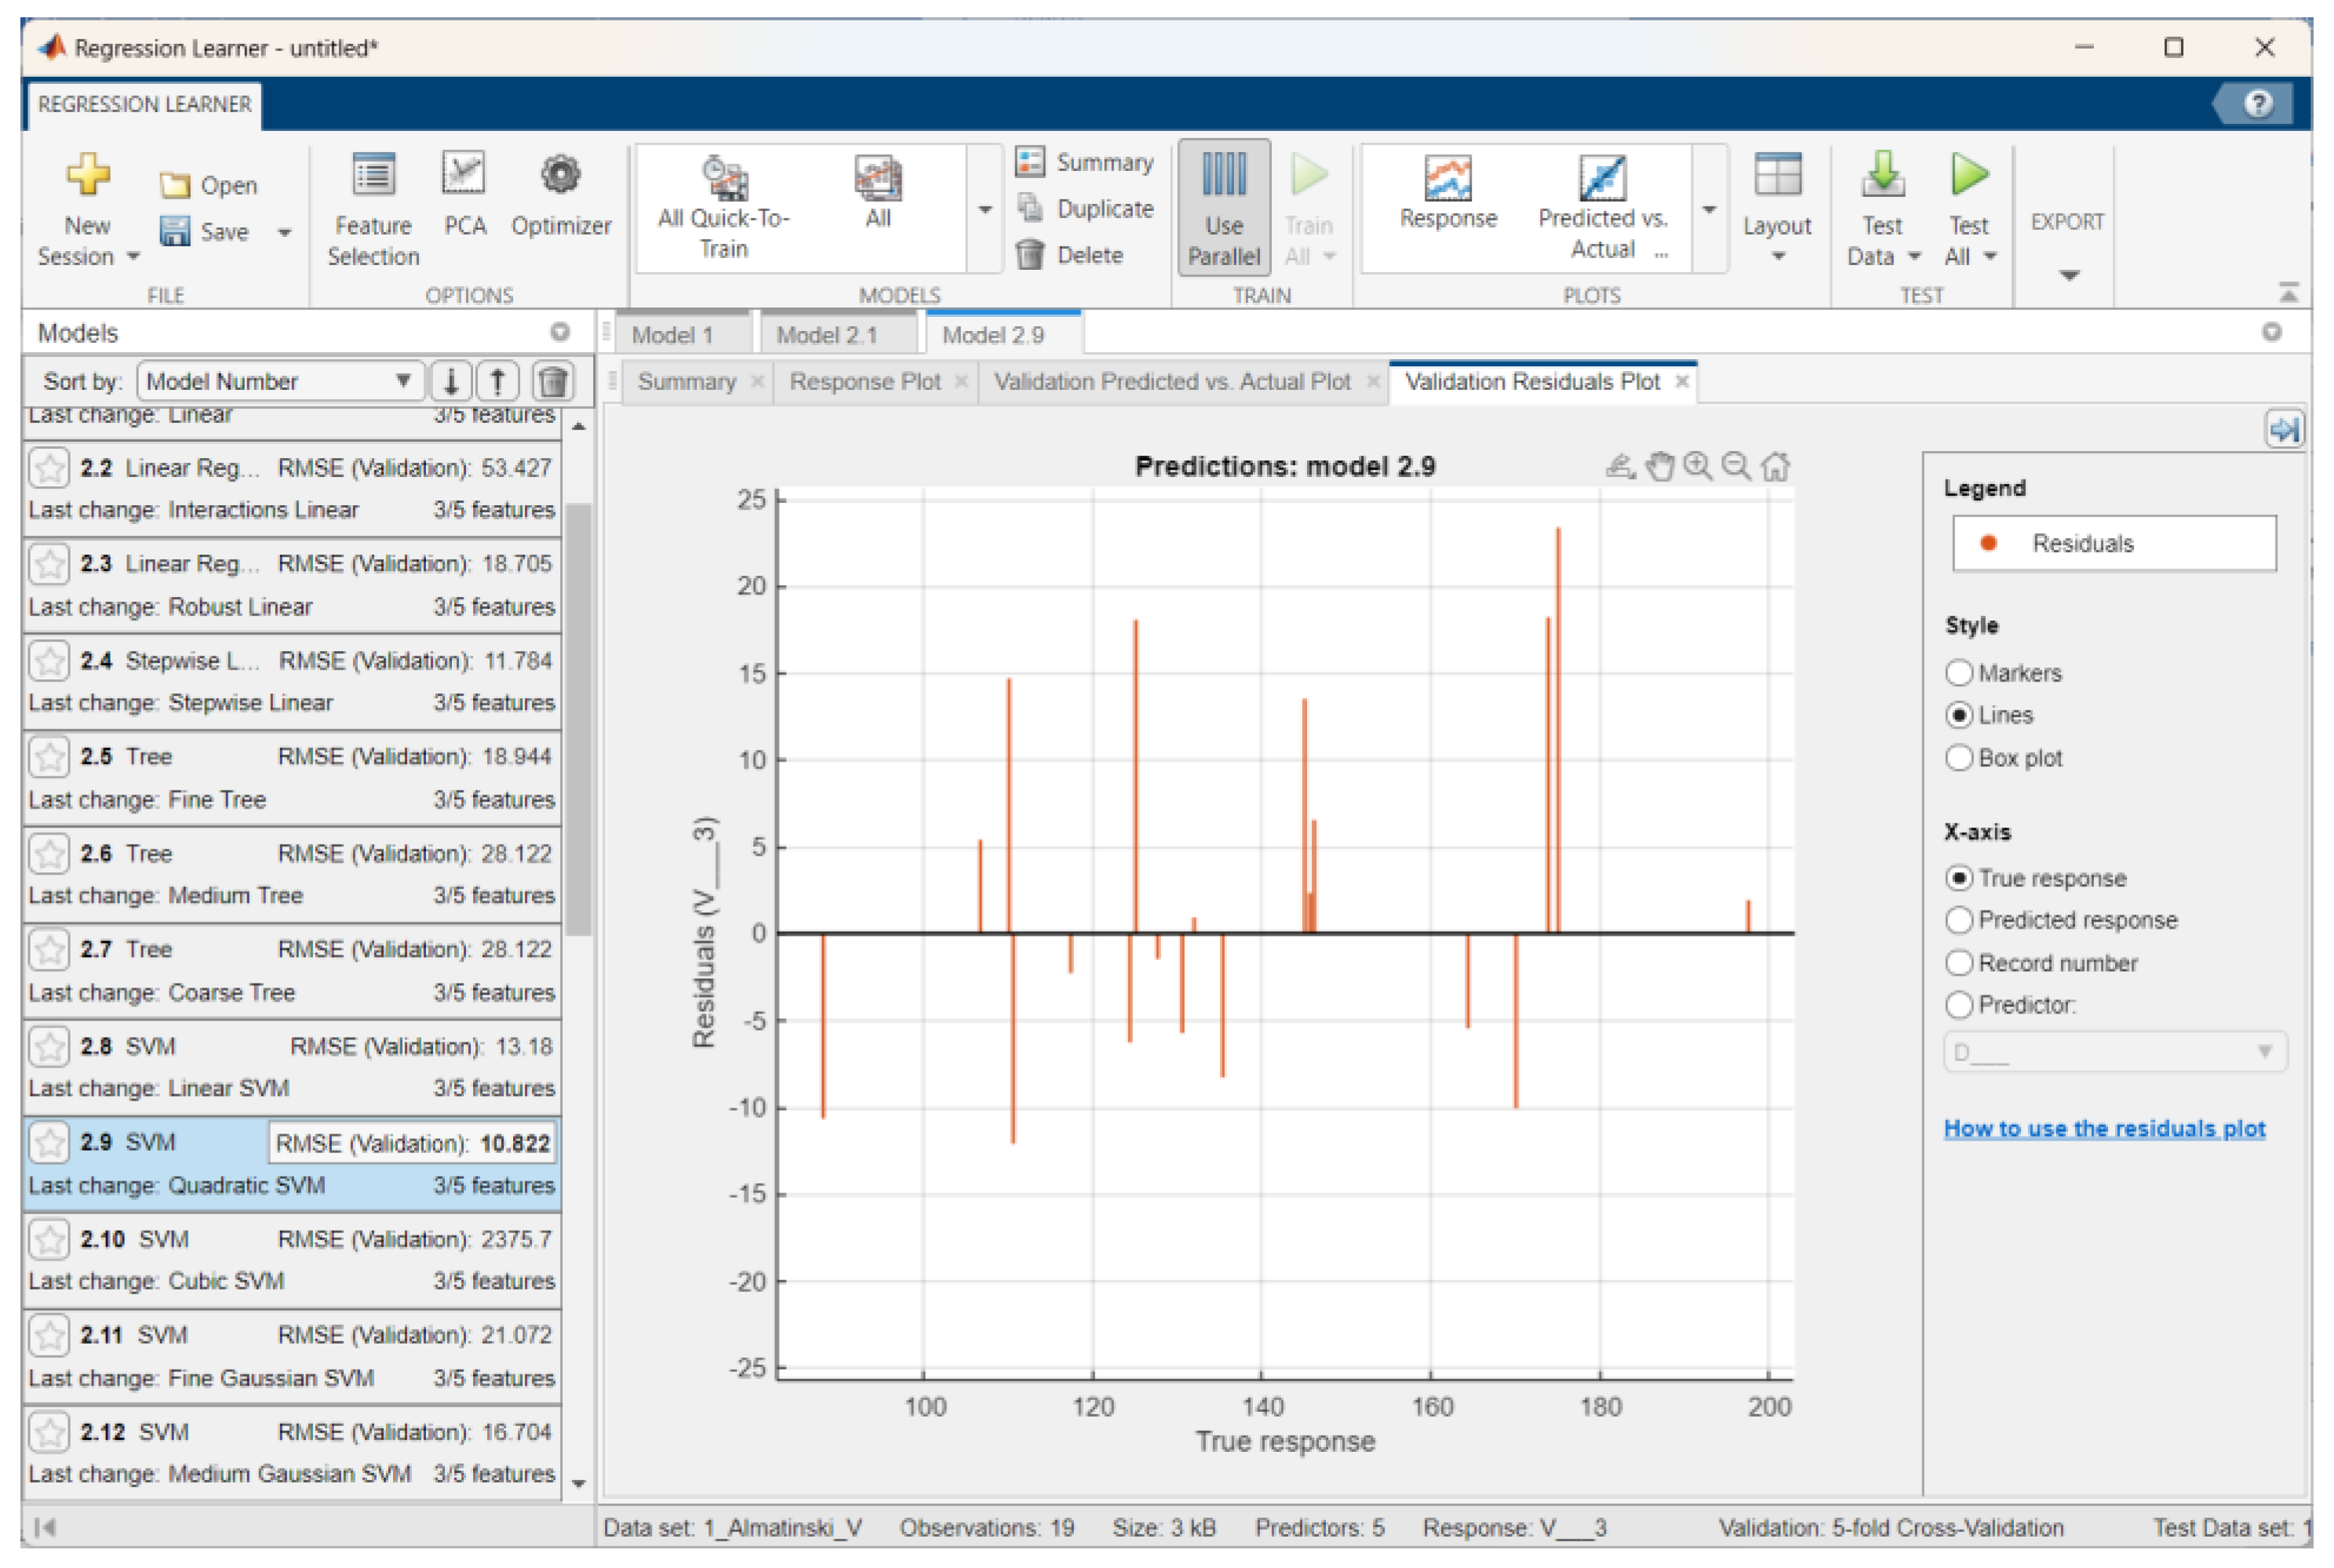
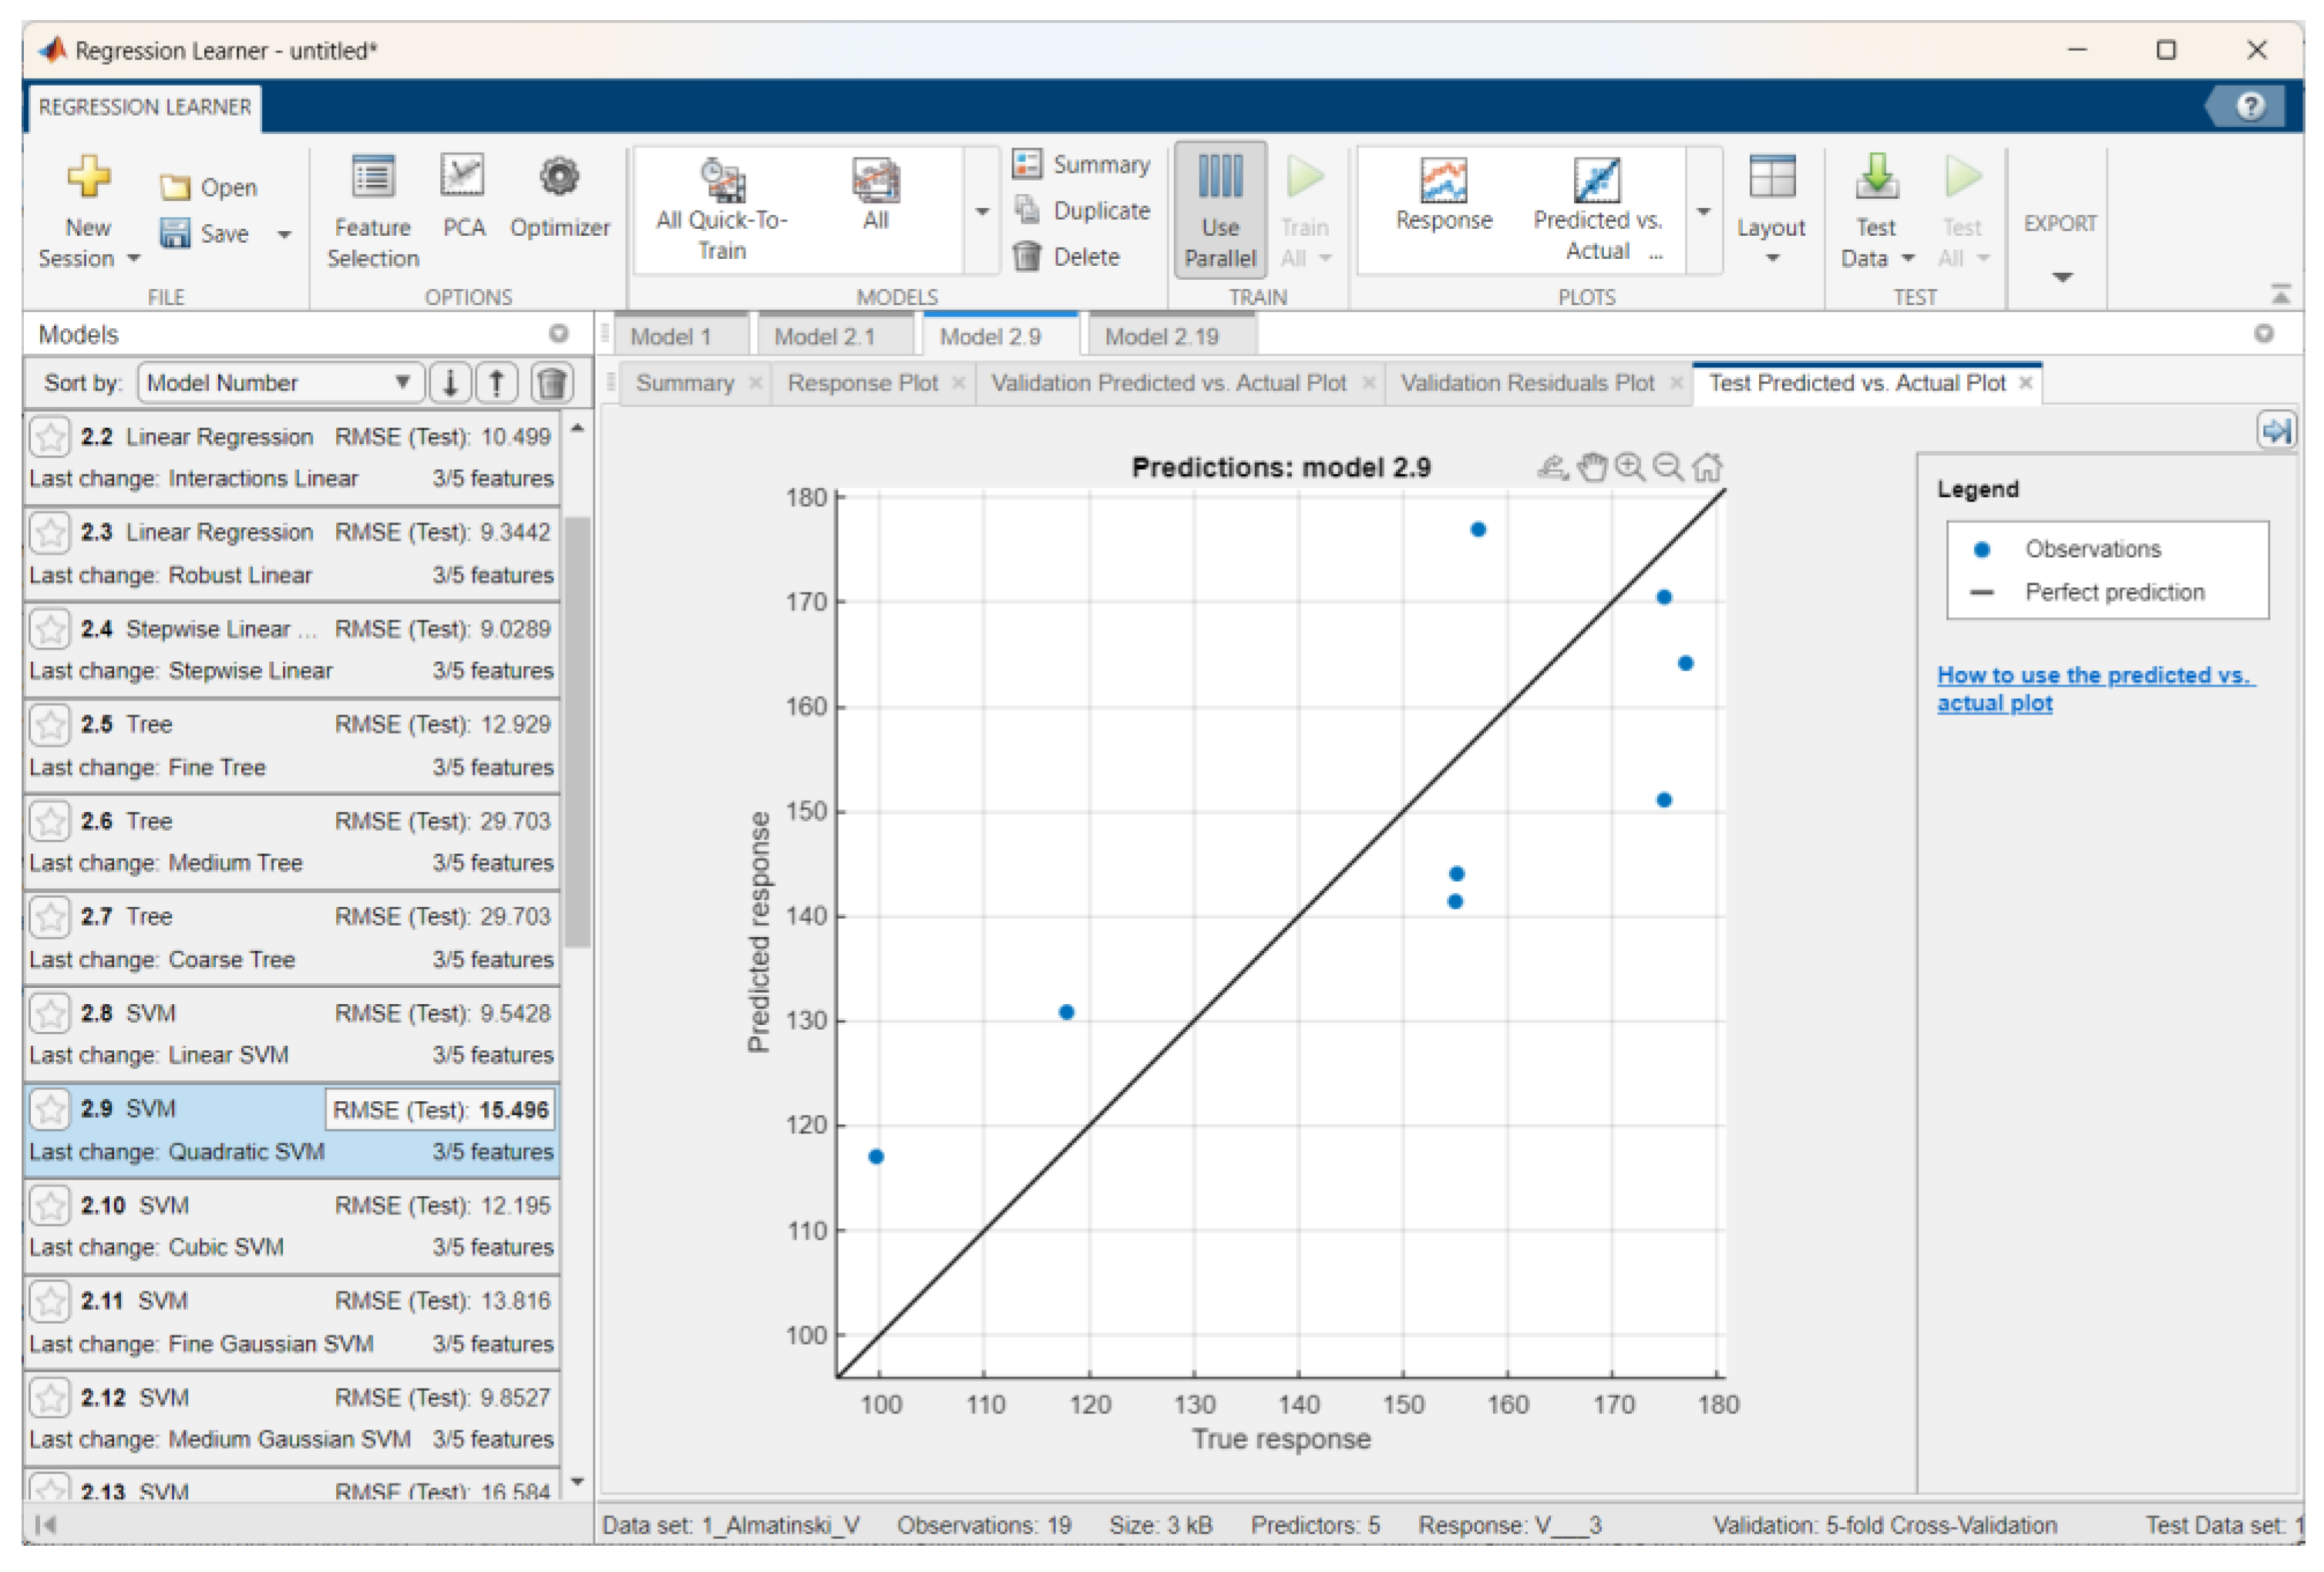
- Experimental studies were conducted, and regression models were developed to determine and predict the mass and volume of apples via a digital method. The best results for the weight prediction of the Sinap Almatynski apples via stepwise linear regression were as follows: RMSEs of 7.17 for training and 4.83 for testing, R2 values of 0.9–0.92 for training and 0.96 for testing, and MAEs of 6.12 for training and 4.14 for testing. The best results for volume prediction of the Nursat variety via linear regression were as follows: relatively small RMSEs of 9.84 for training and 9.65 for testing, R2 values of 0.9–0.91 for training and 0.92 for testing, and relatively small MAEs of 8.12 for training and 7.96 for testing. The accuracy of the procedures could be improved by optimizing the models and increasing the number of datasets.
- The regression equations obtained from the relationship between mass, volume and geometric parameters, together with the numerical method for determining the color area, serve as the basis for the development of a compact instrument for the evaluation of quality indicators and the automatic sorting of apples by commercial variety.
Author Contributions
Funding
Data Availability Statement
Conflicts of Interest
References
- Tekhnicheskie Usloviya Data Vvedeniya, GOST 34314-2017 Yabloki Svezhie, Realizuemye v Roznichnoj Torgovle, (2018).
- Y. Ozaki, W.F. McClure, A.A. Christy, Near-Infrared Spectroscopy in Food Science and Technology, (John Wiley & Sons, New Jersey, 2007).
- C.A. Roberts, J. Workman, J.B. Reeves, Near-Infrared Spectroscopy in Agriculture, (IM Publications, Boston, 2004).
- A.K. Bhatt, D. Pant, AI Soc. 2015, 30, 45. [CrossRef]
- M.M. Sofu, O. Er, M.C. Kayacan, B. Cetişli, Comput. Electron. Agric. 2016, 127, 395. [CrossRef]
- A.K. Pothula, Z. Zhang, R. Lu, Comput. Electron. Agric. 2023, 208, 107789. [CrossRef]
- P. Moallem, A. Serajoddin, H. Pourghassem, Inf. Process. Agric. 2017, 4, 33. [CrossRef]
- J. Alikhanov, S.M. Penchev, T.D. Georgieva, A. Moldazhanov, Z. Shynybay, P.I. Daskalov, J. Food Meas. Charact. 2018, 12, 87. [CrossRef]
- Nurtuleuov, A. Moldazhanov, A. Kulmahambetova, D. Zinchenko, Izdenister Natigeler 2021, 3, 125.
- L. Anjaneya, U. Mahanthesha, Int. J. Recent Sci. Res. 2023, 14, 4372. [CrossRef]
- V. Verdhan, Computer Vision Using Deep Learning: Neural Network Architectures with Python and Keras, (Apress, Berkeley, 2021).
- G. Roffo, arXiv 2016, arXiv:1607.01327.
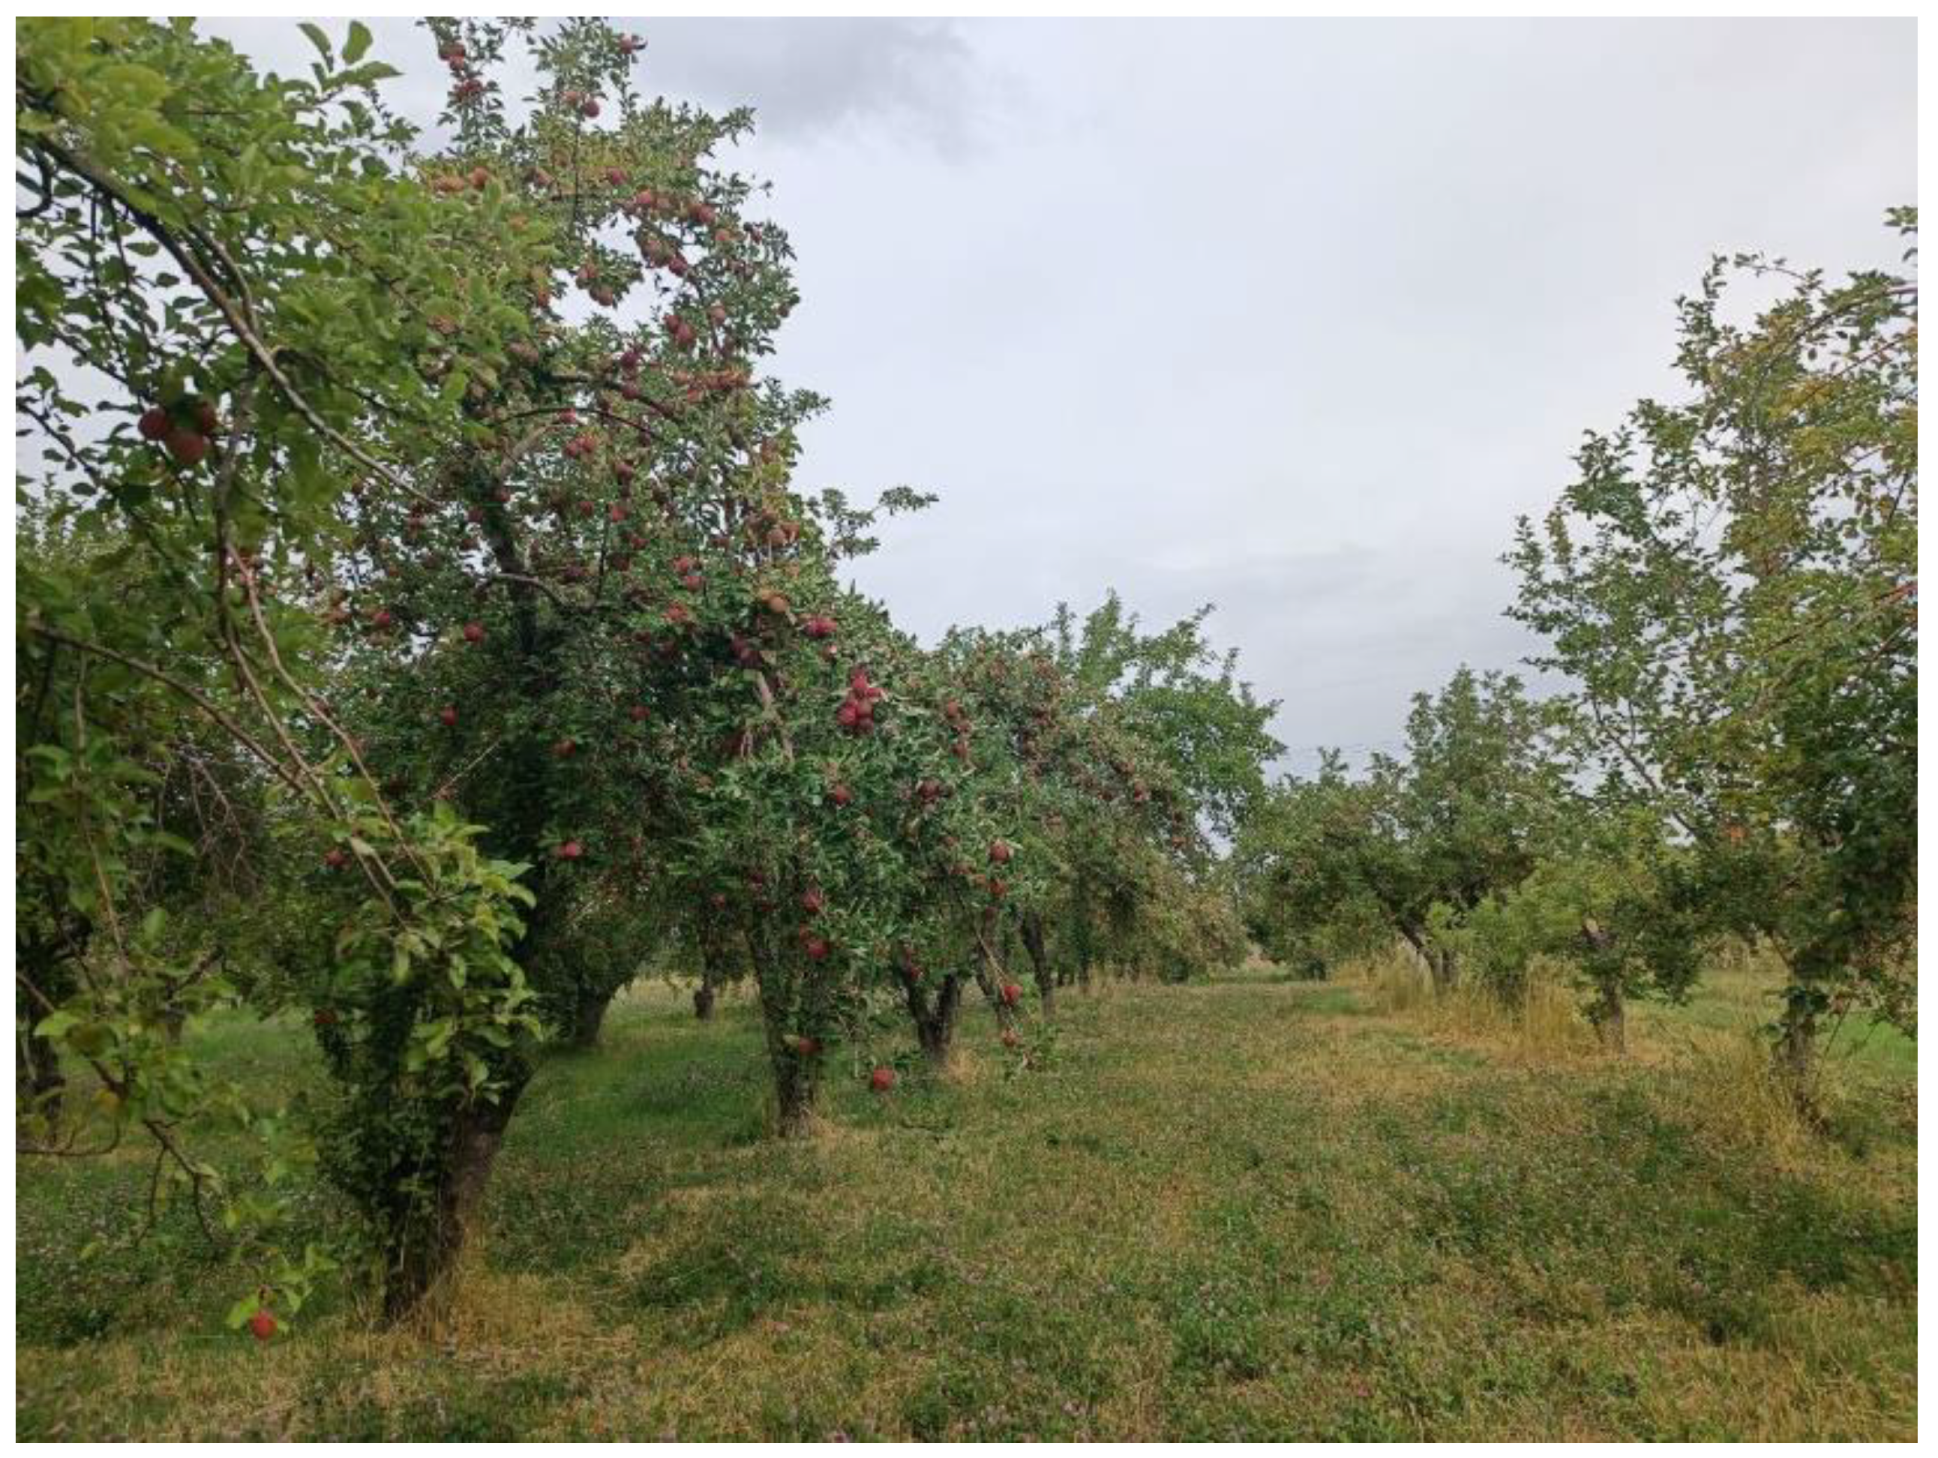
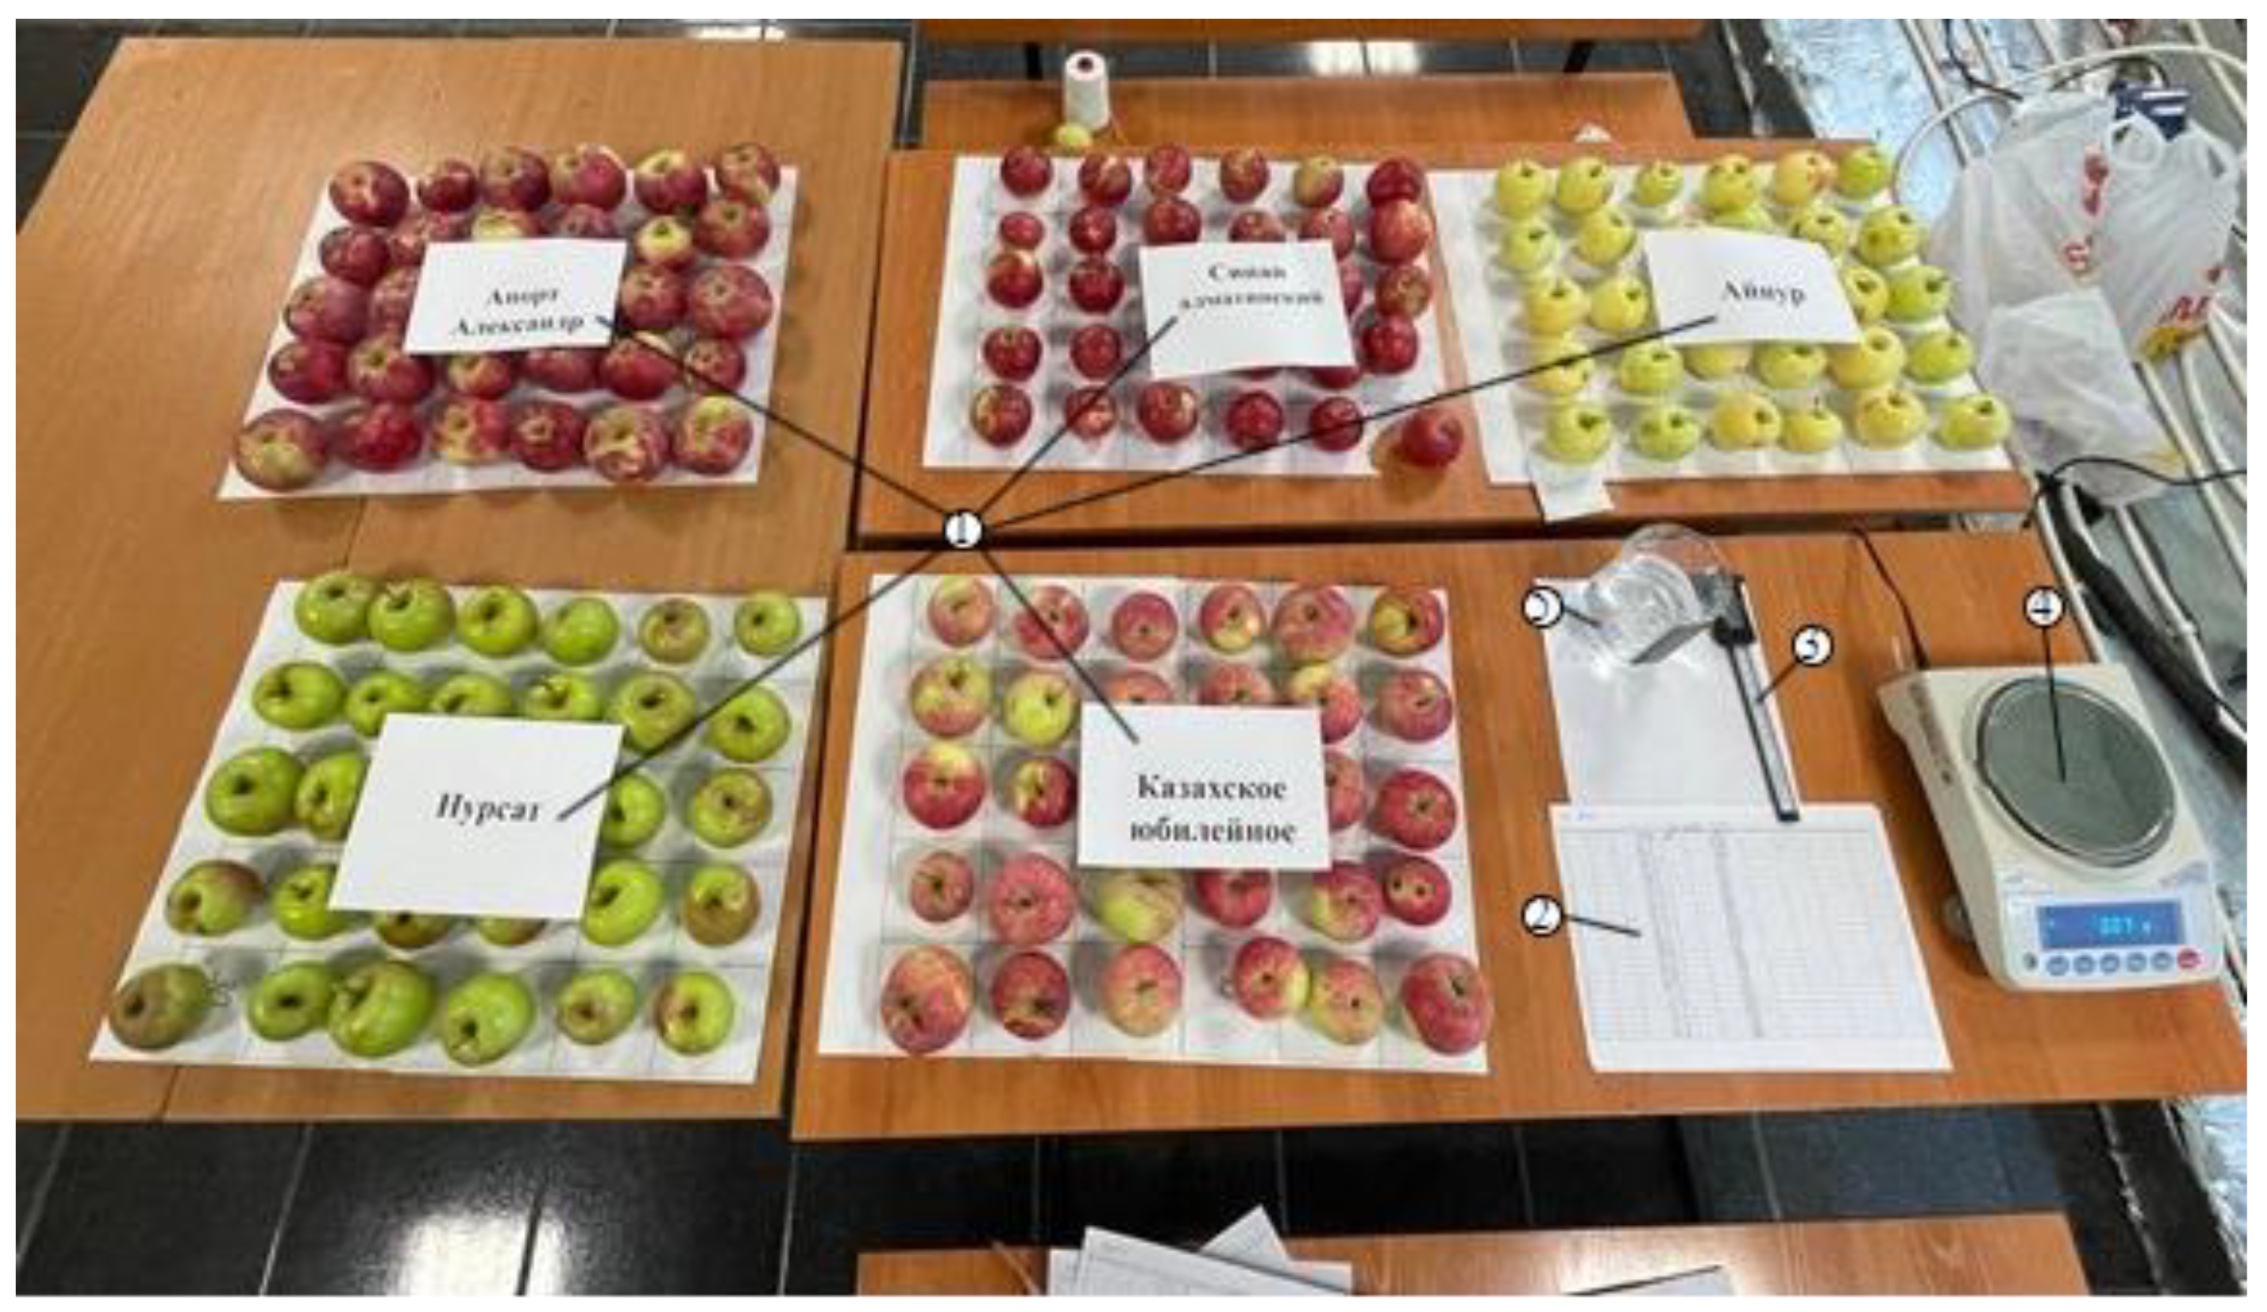
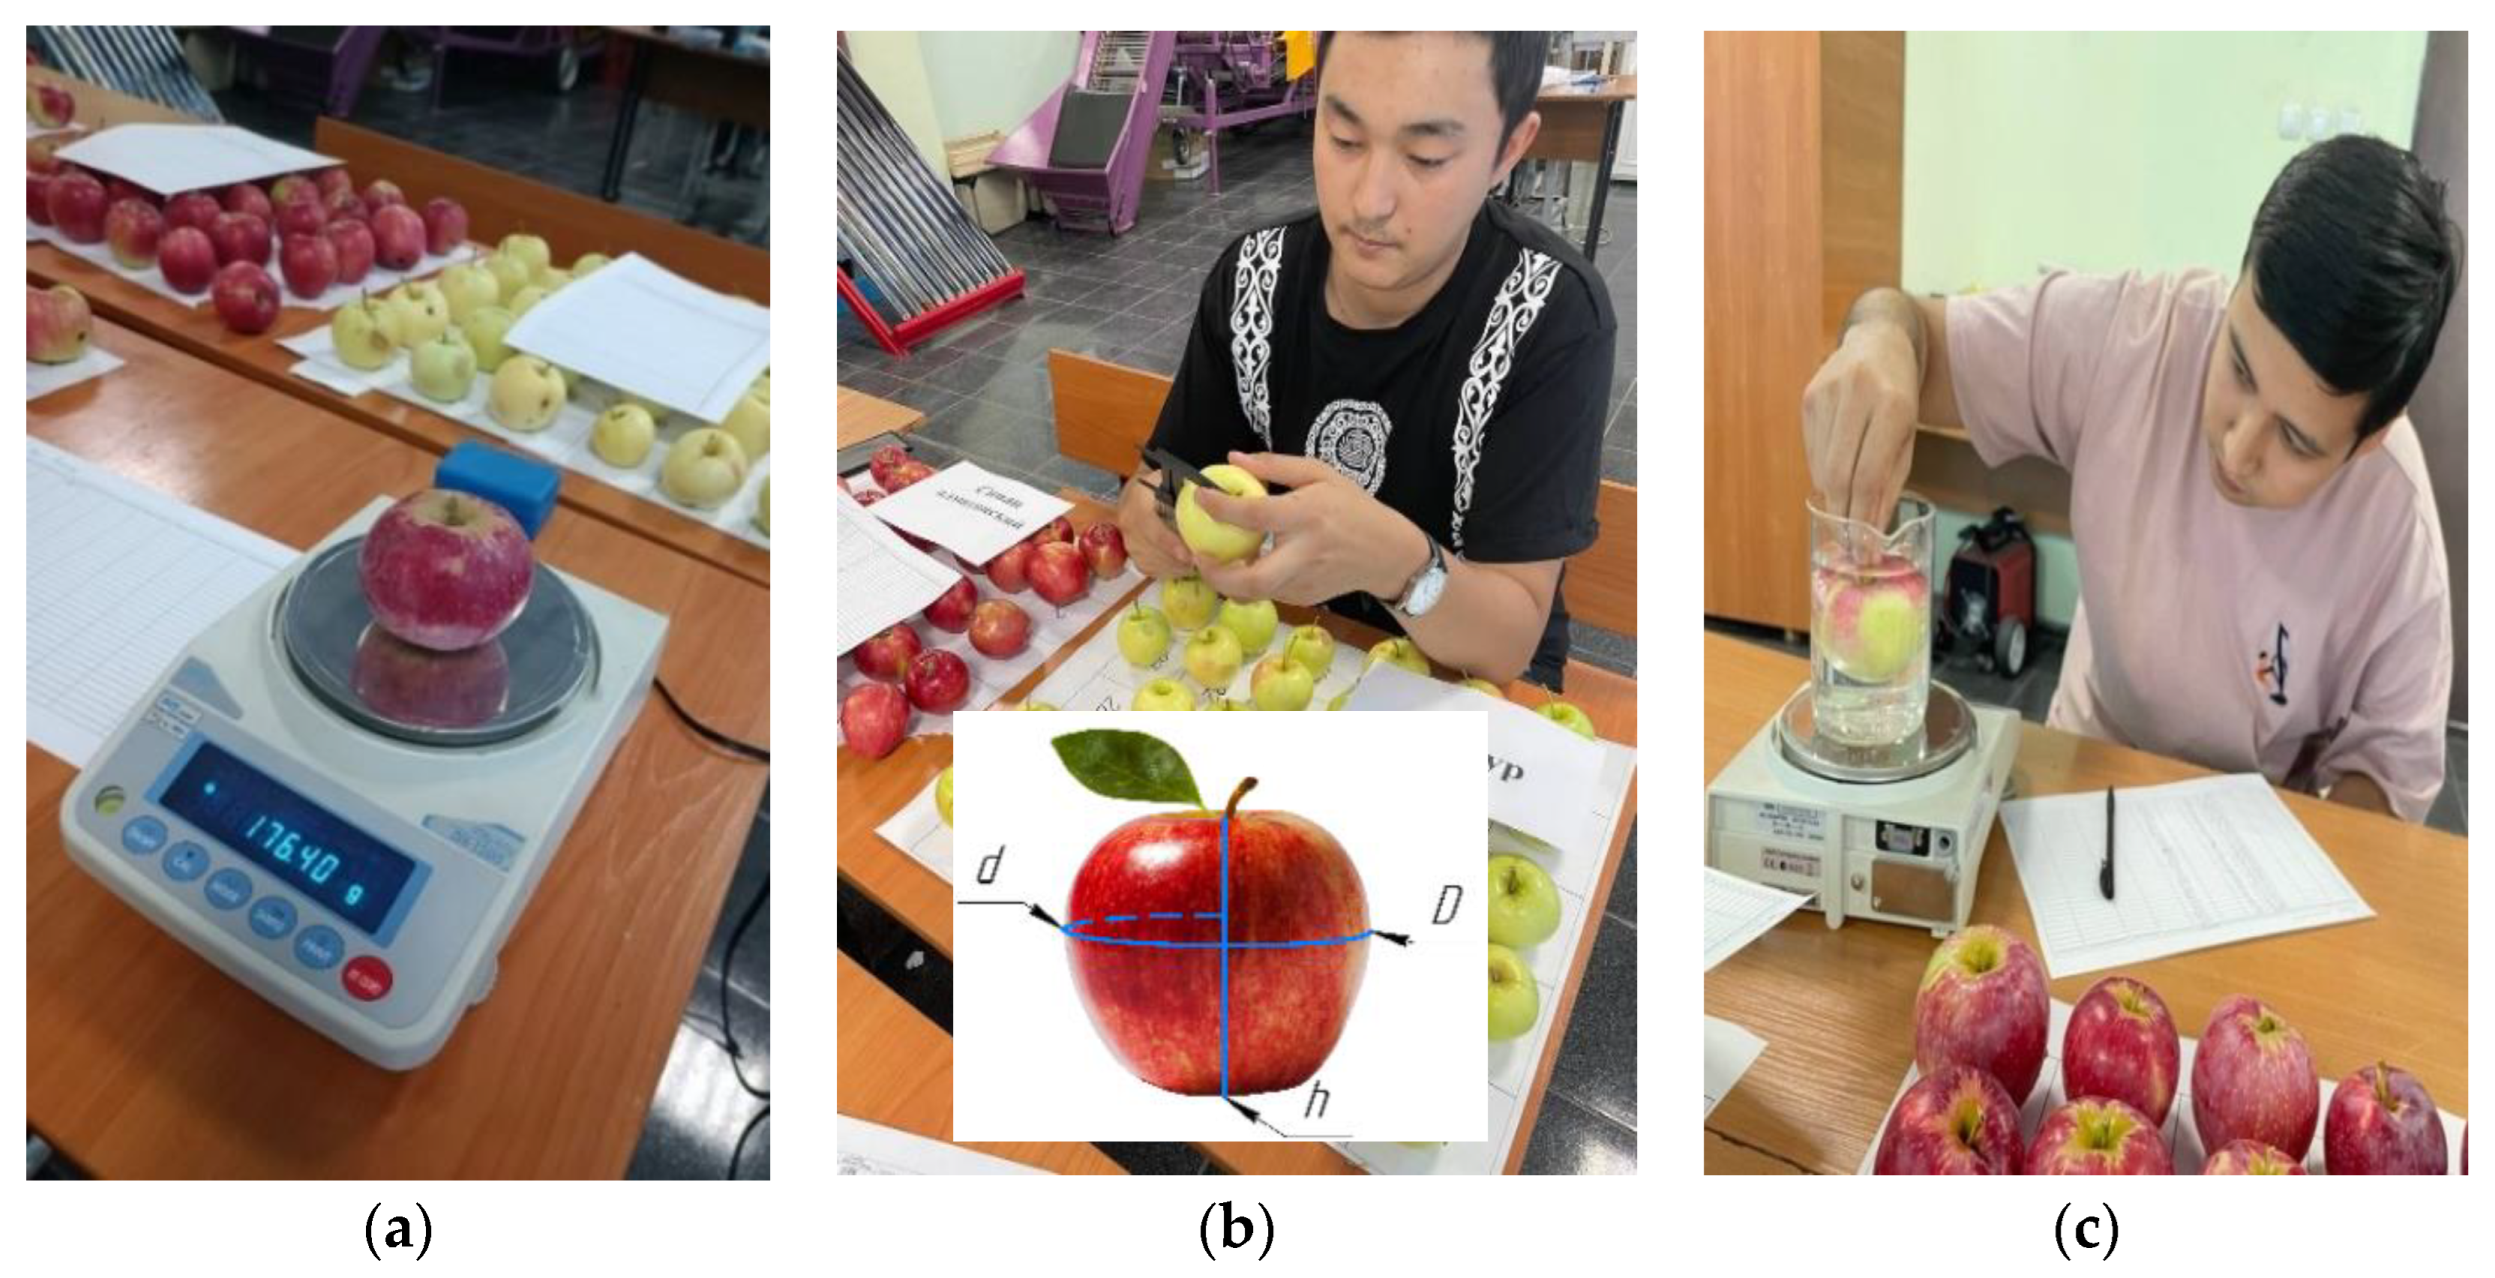
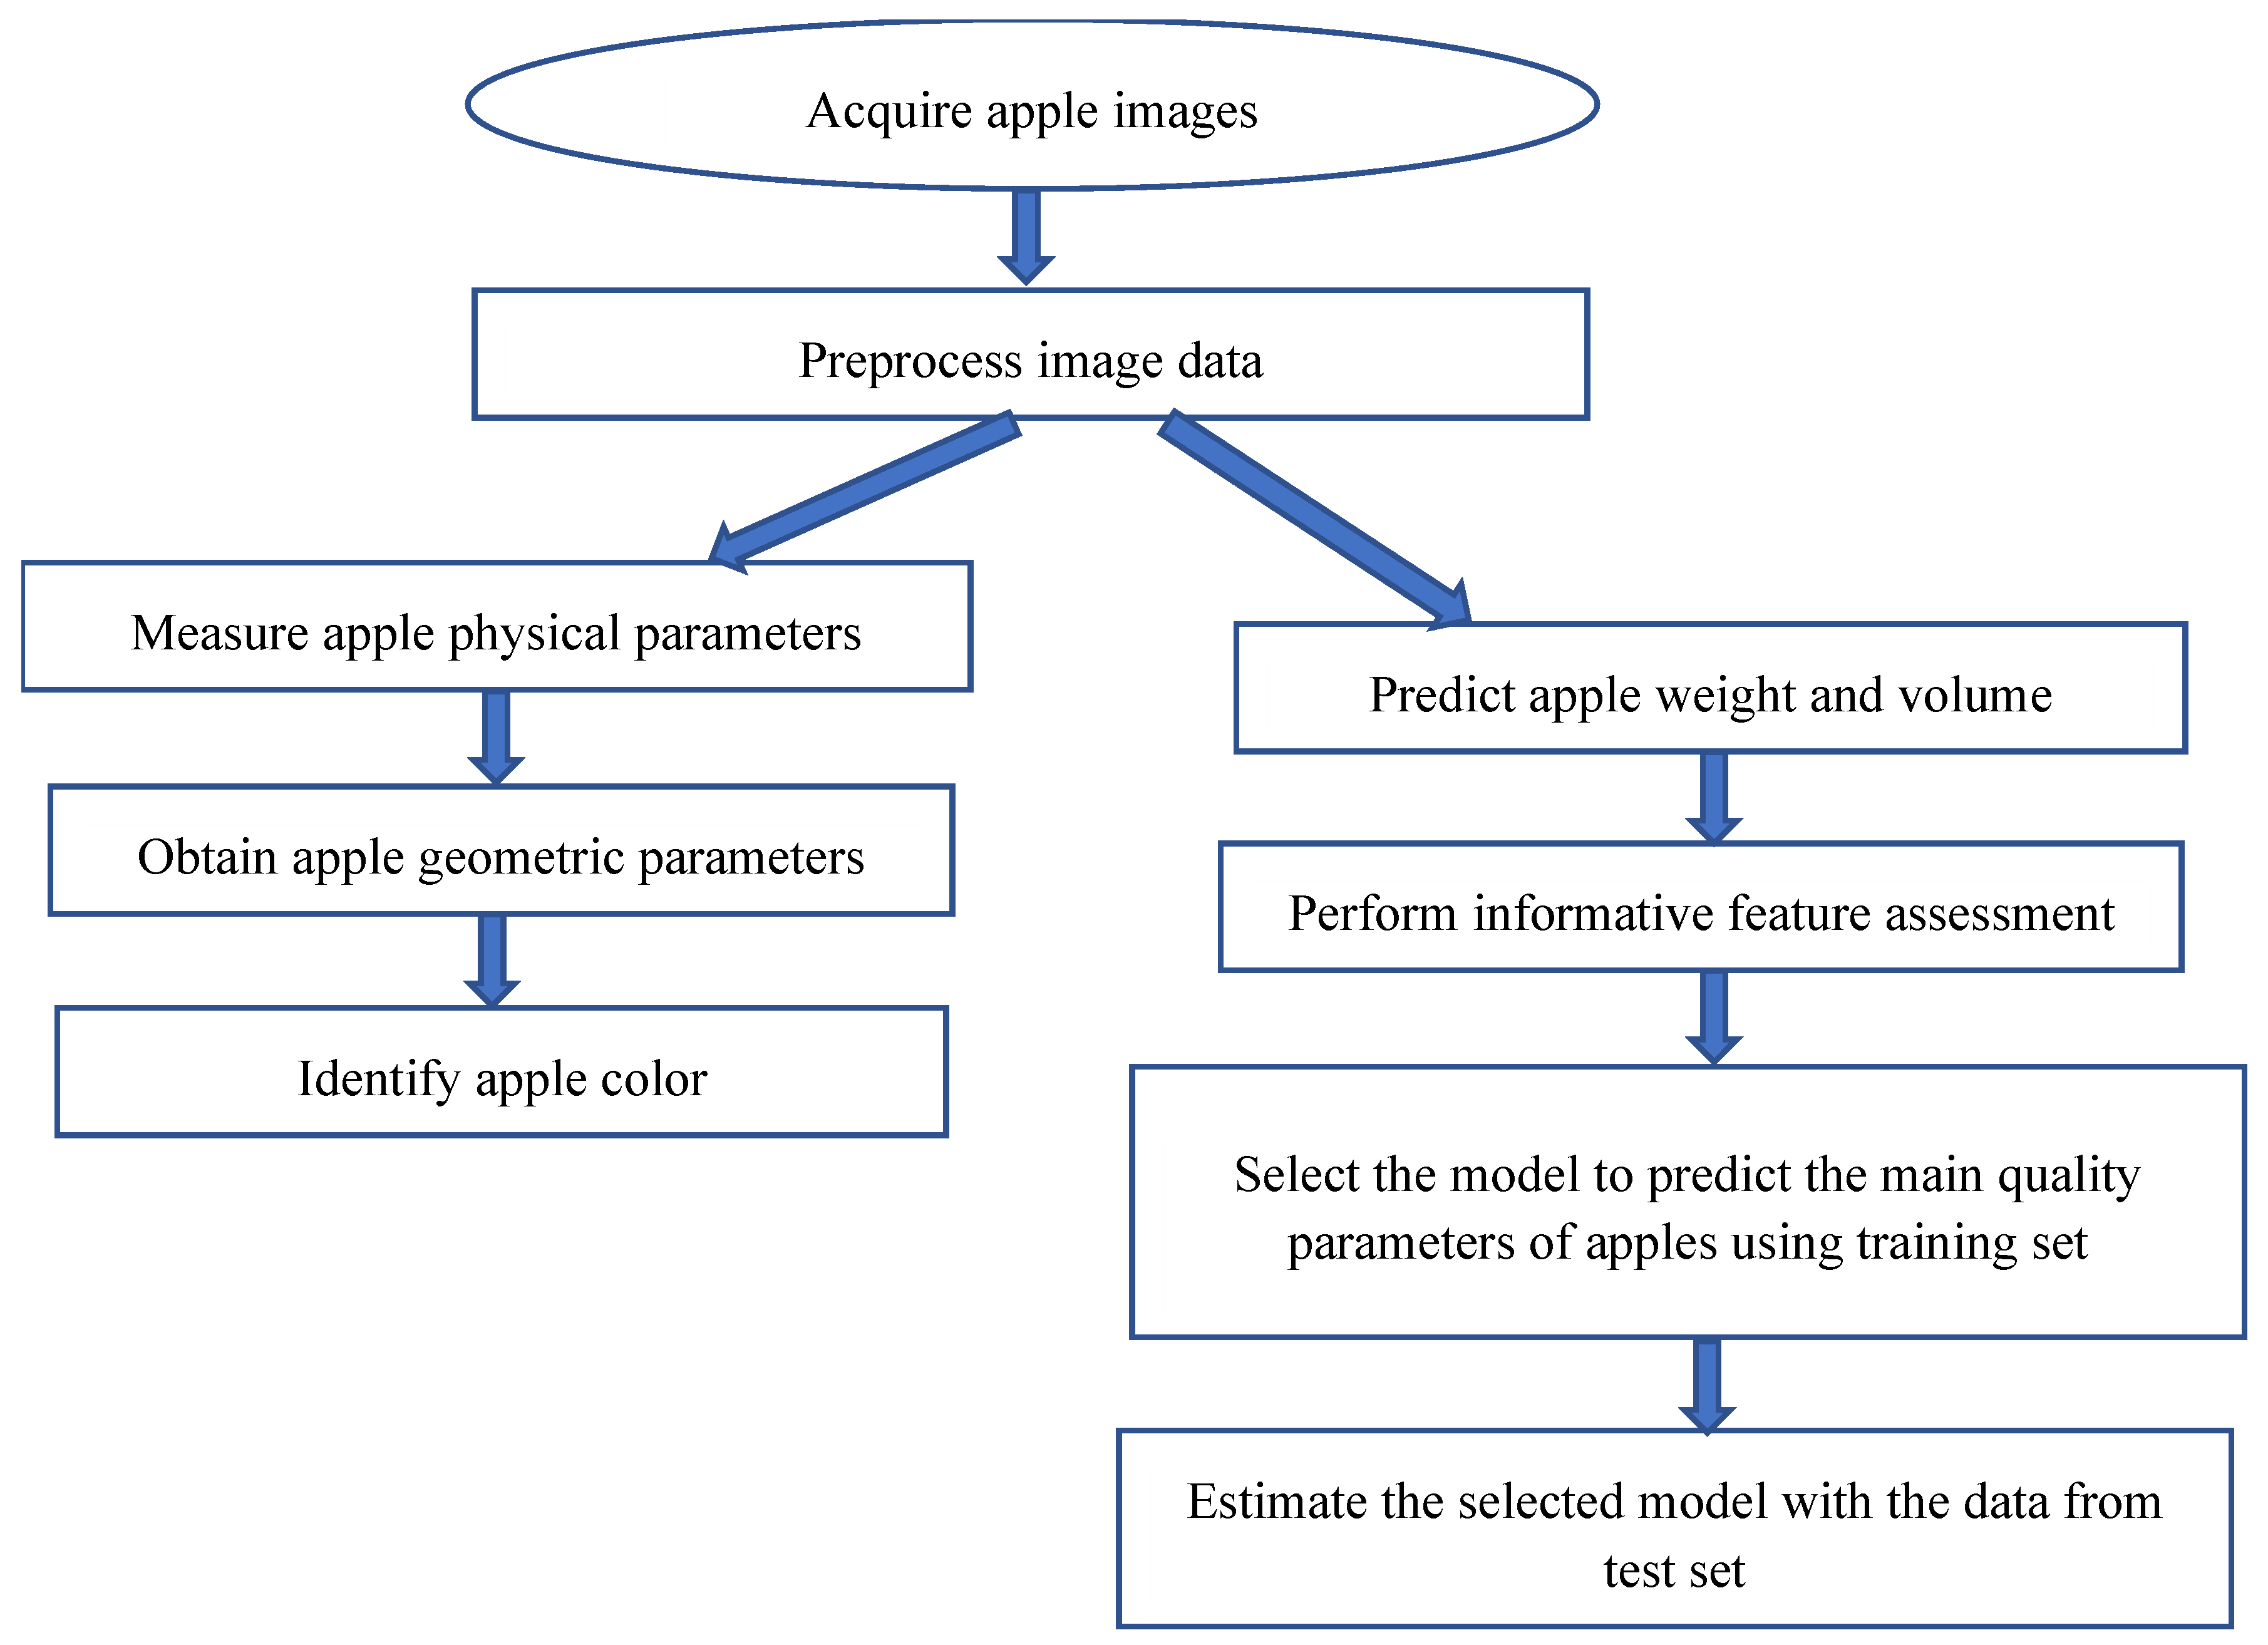
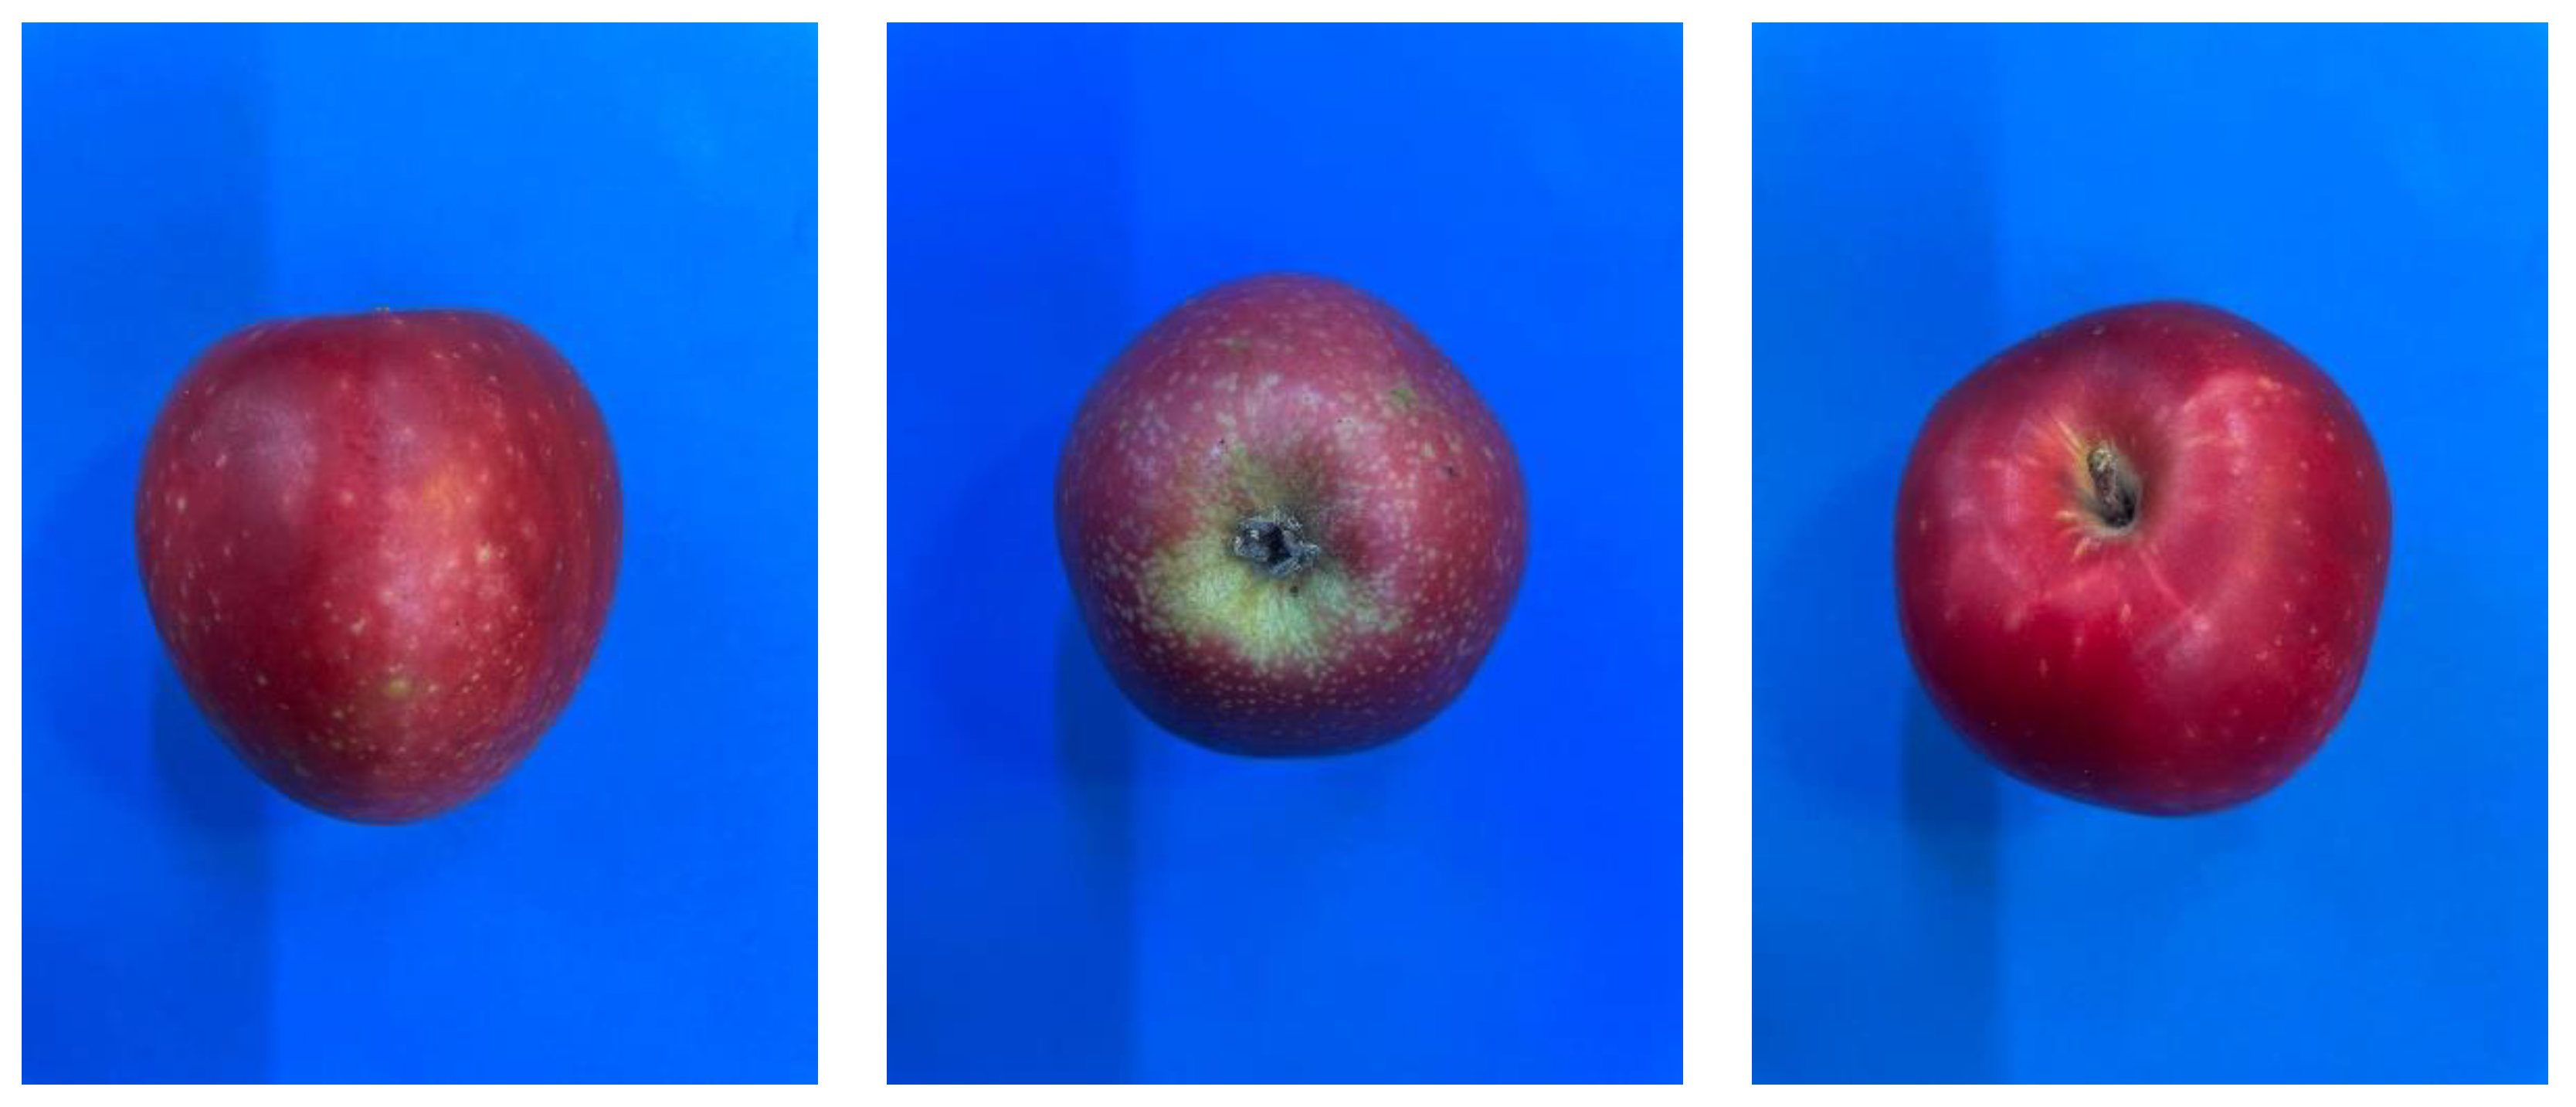
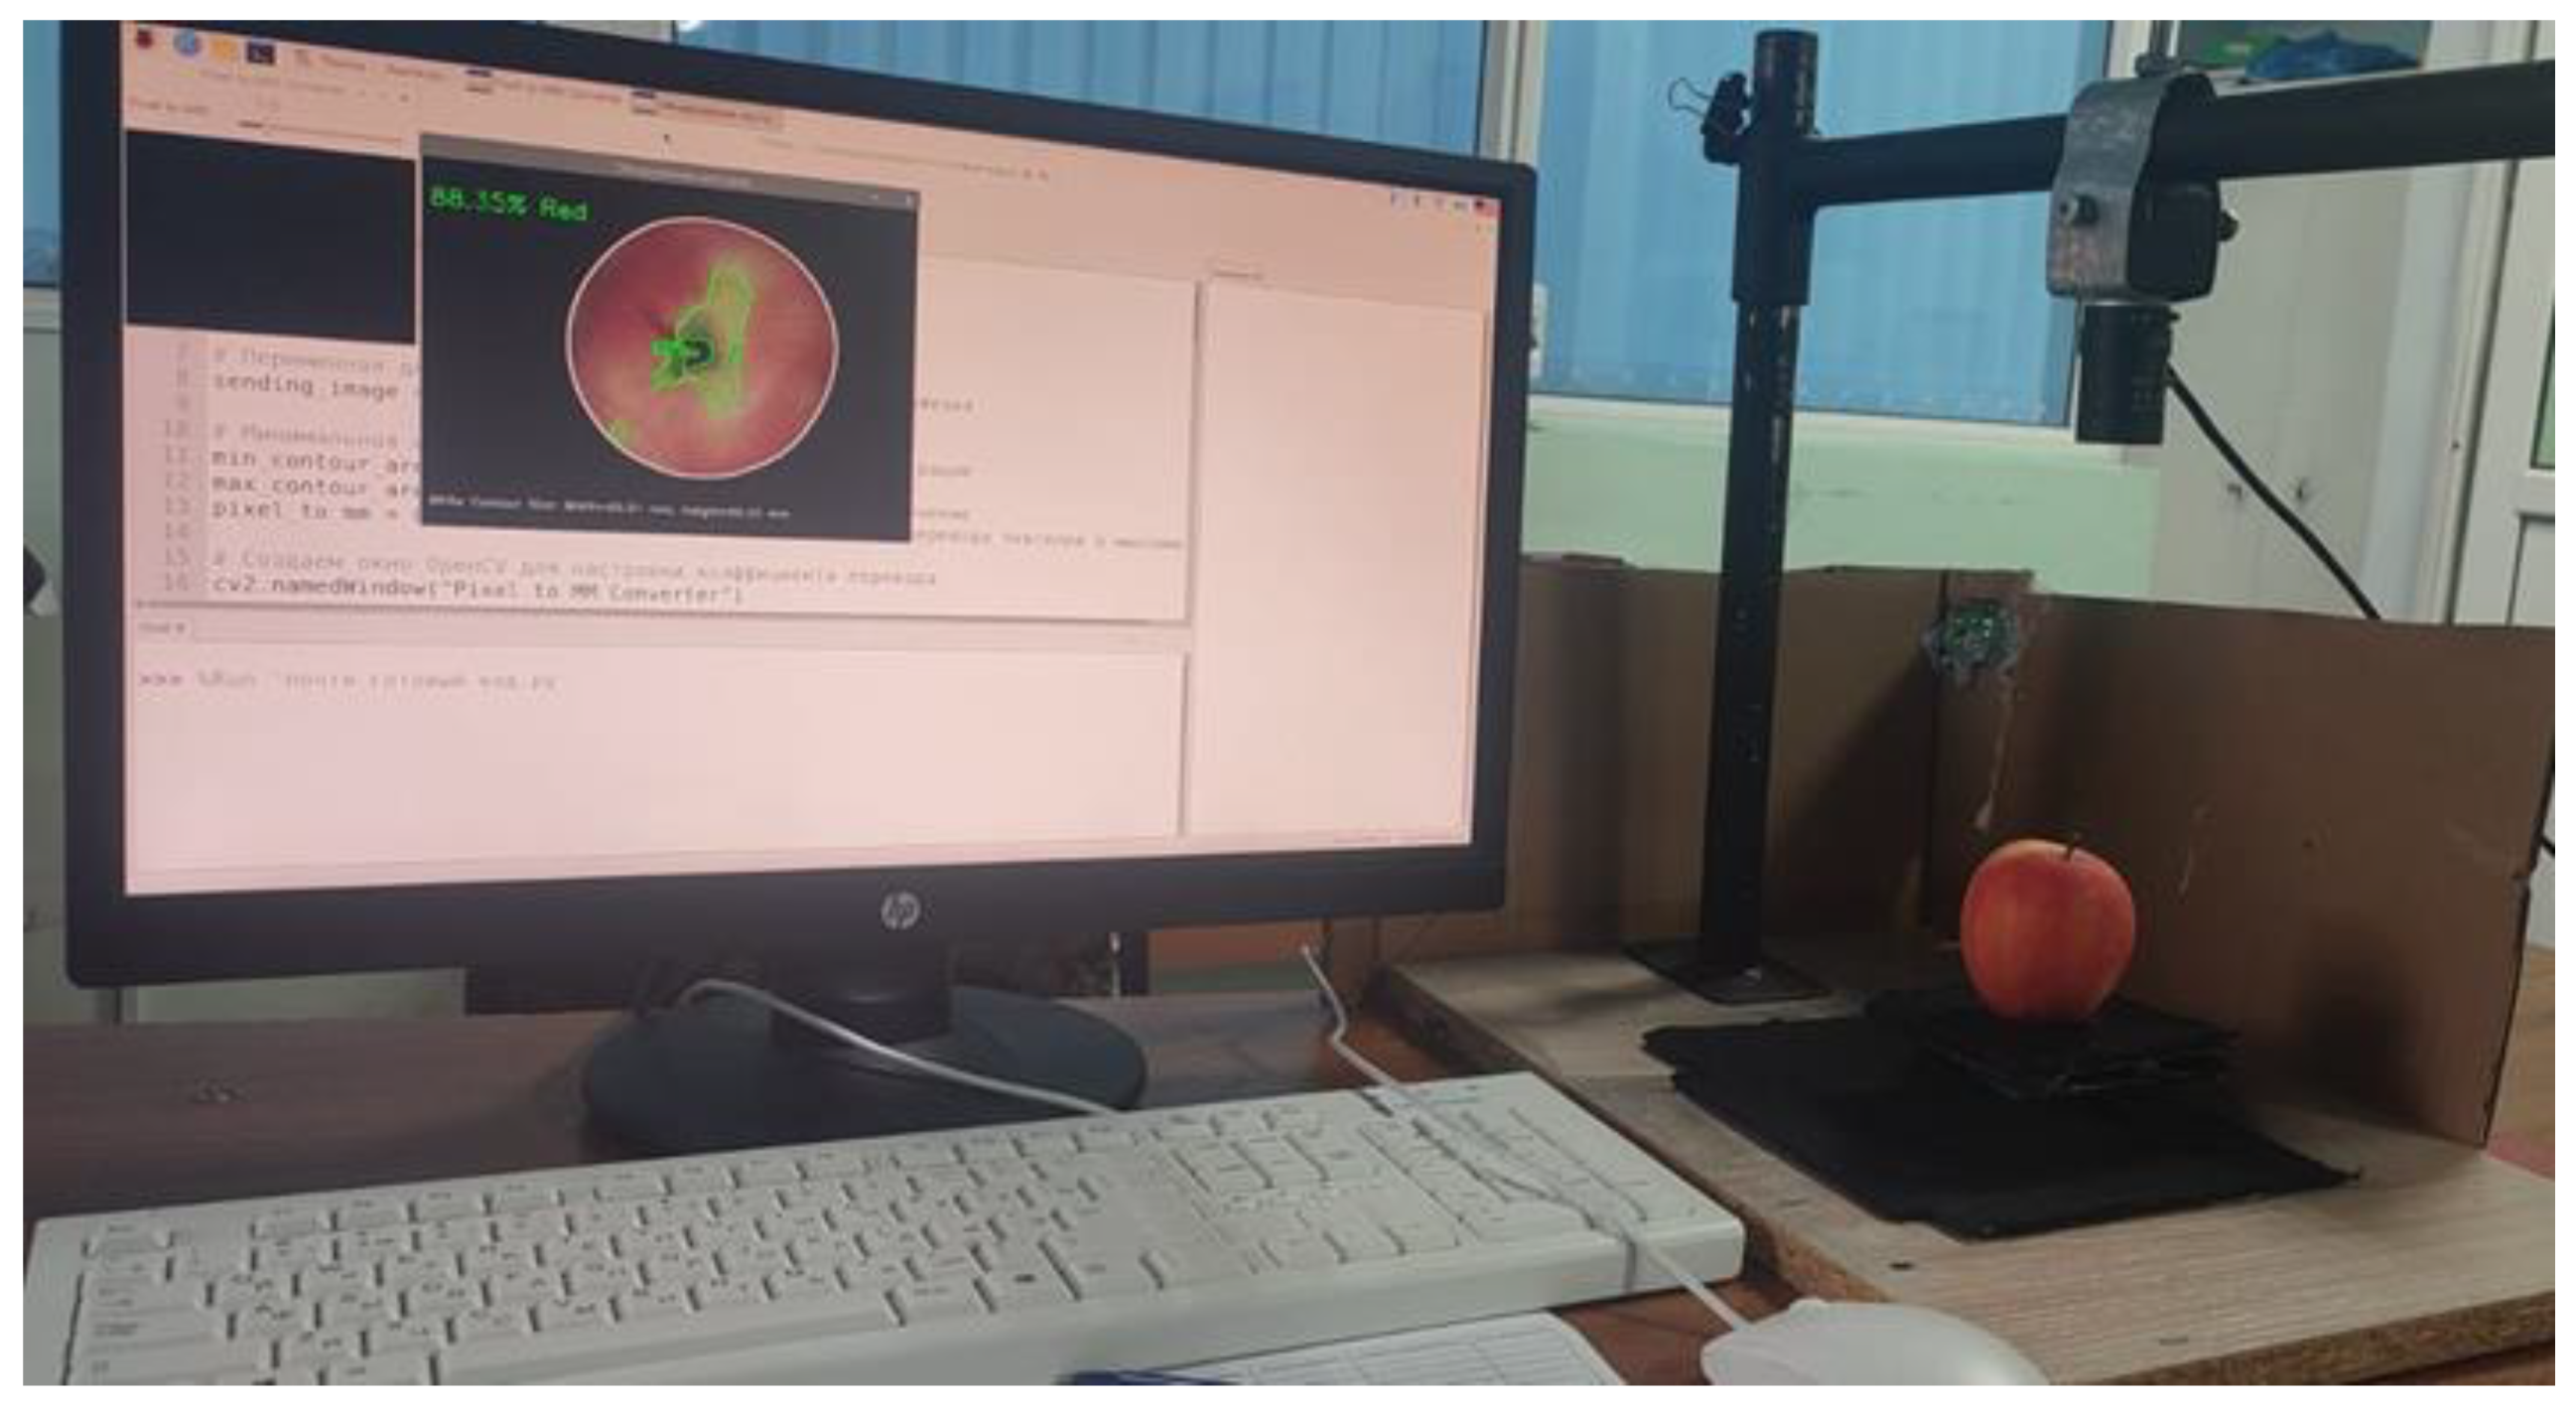

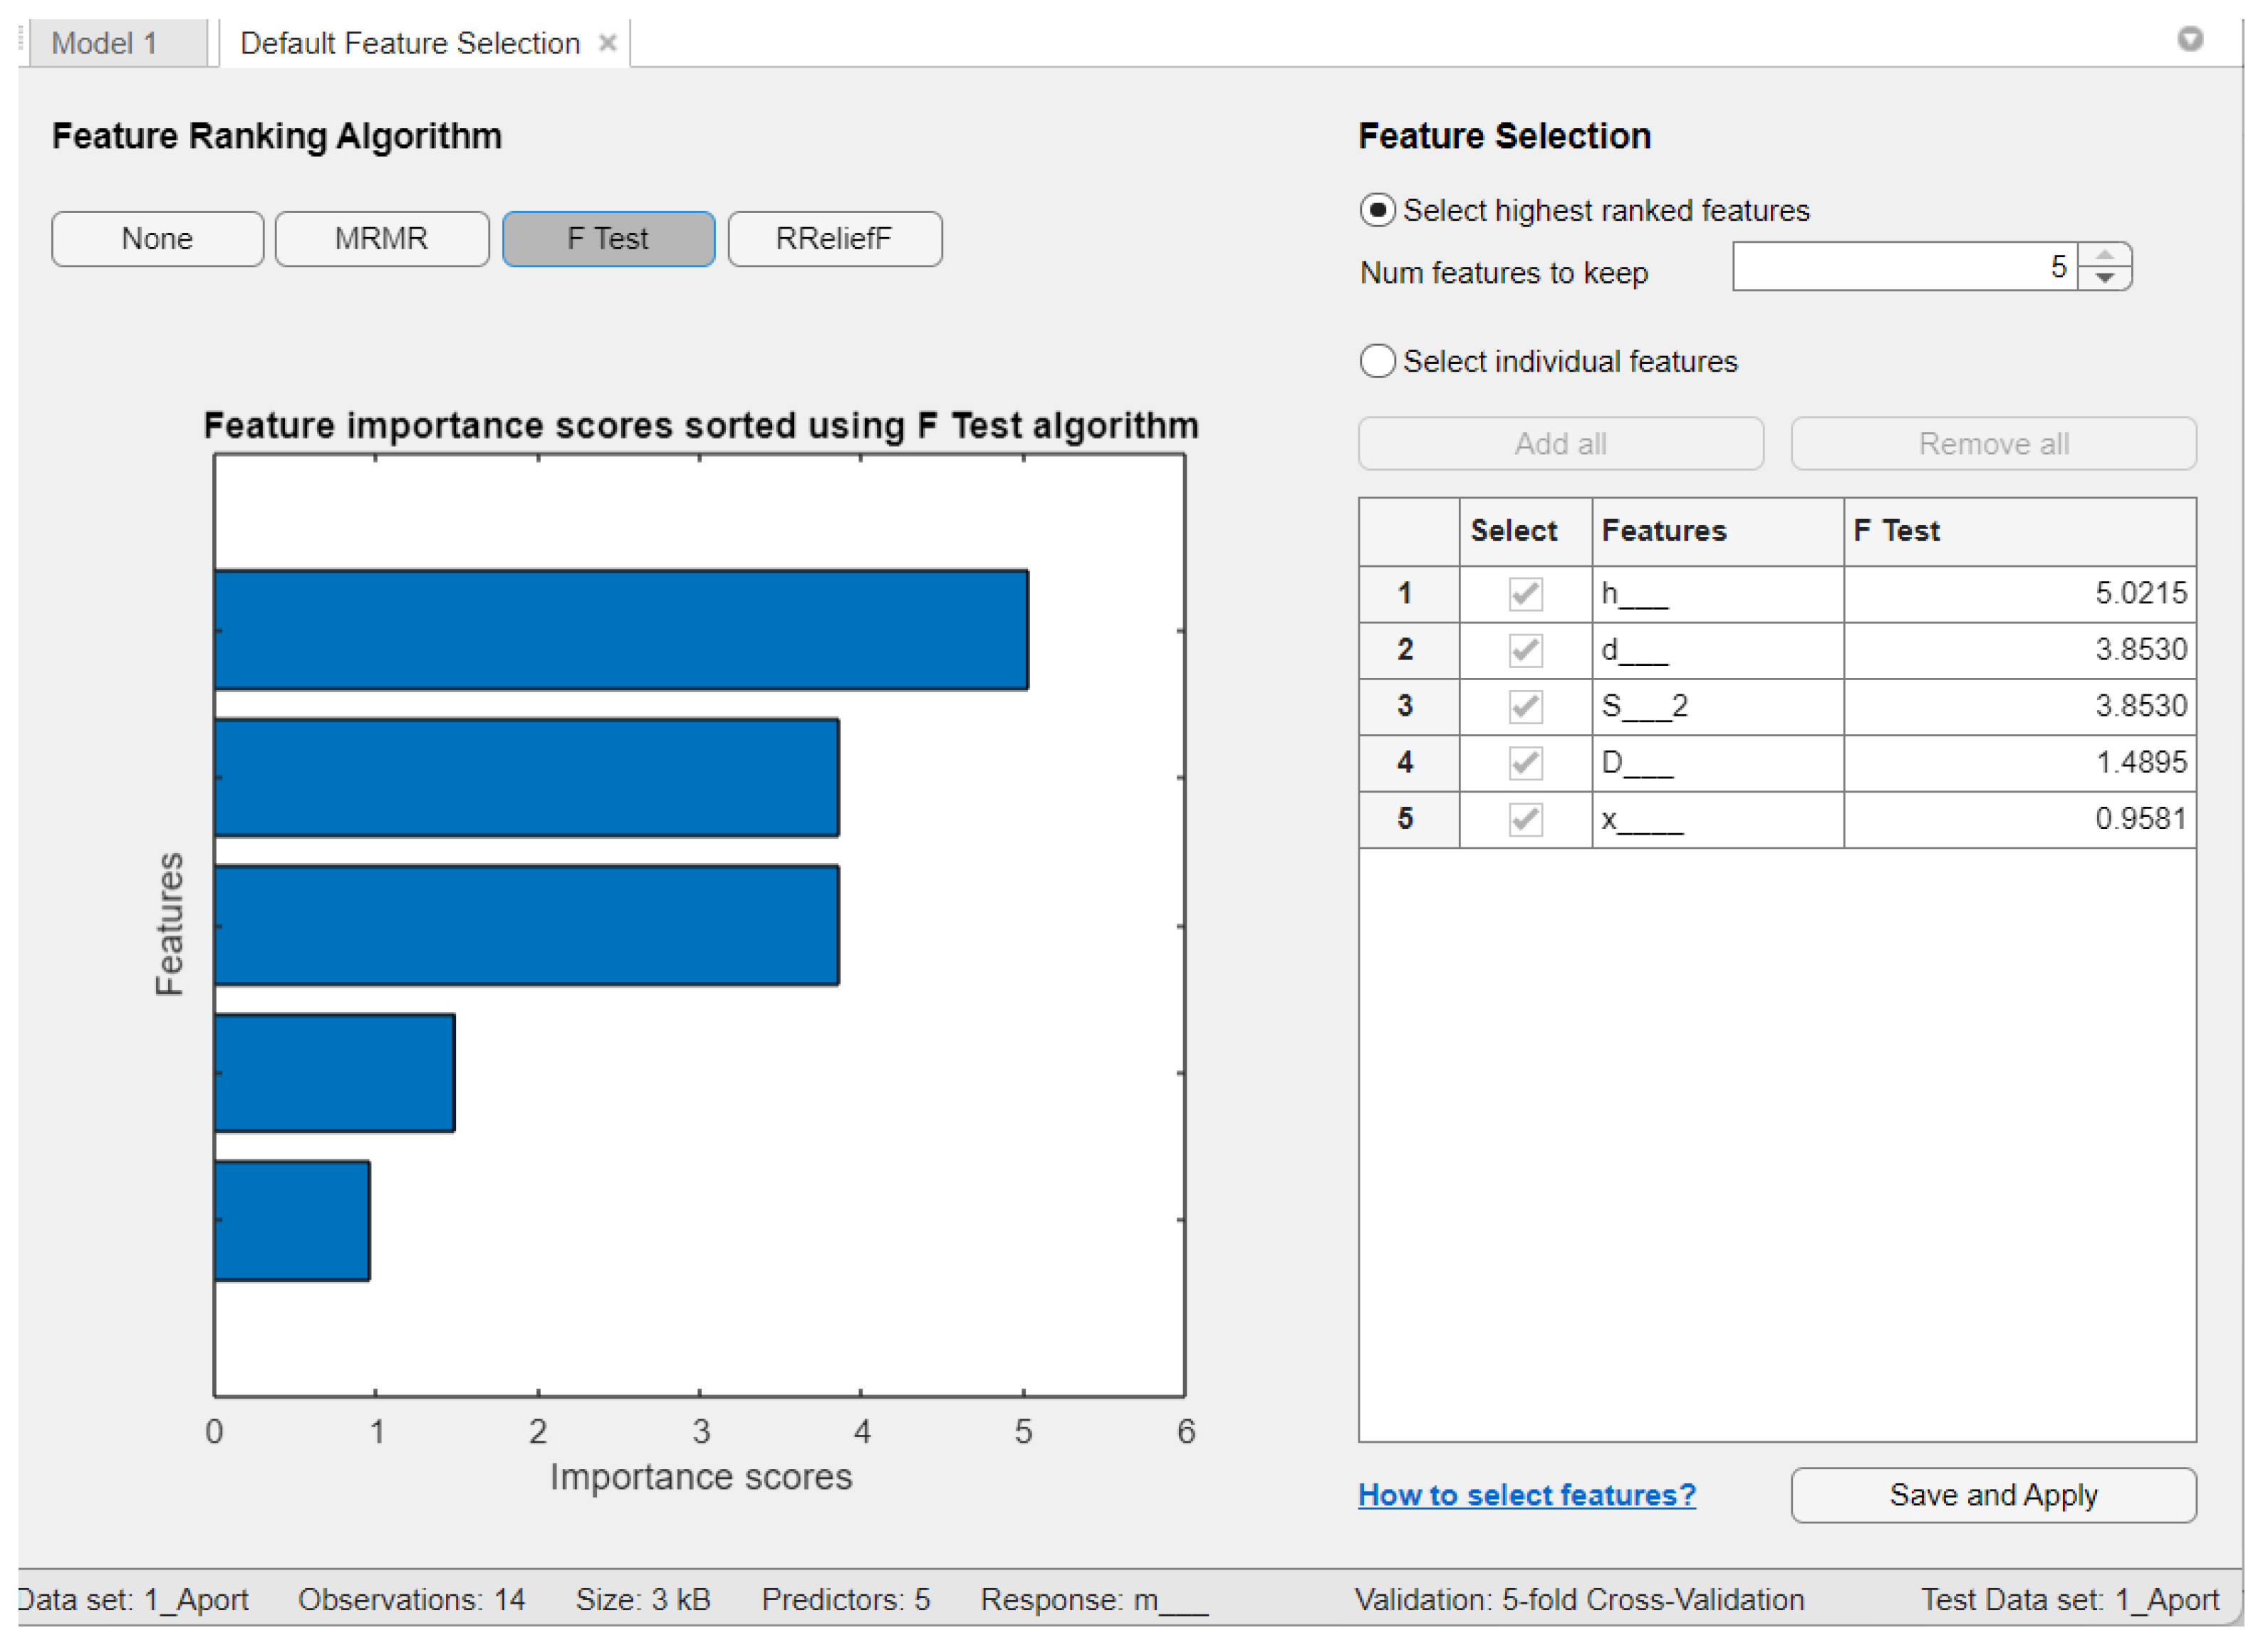
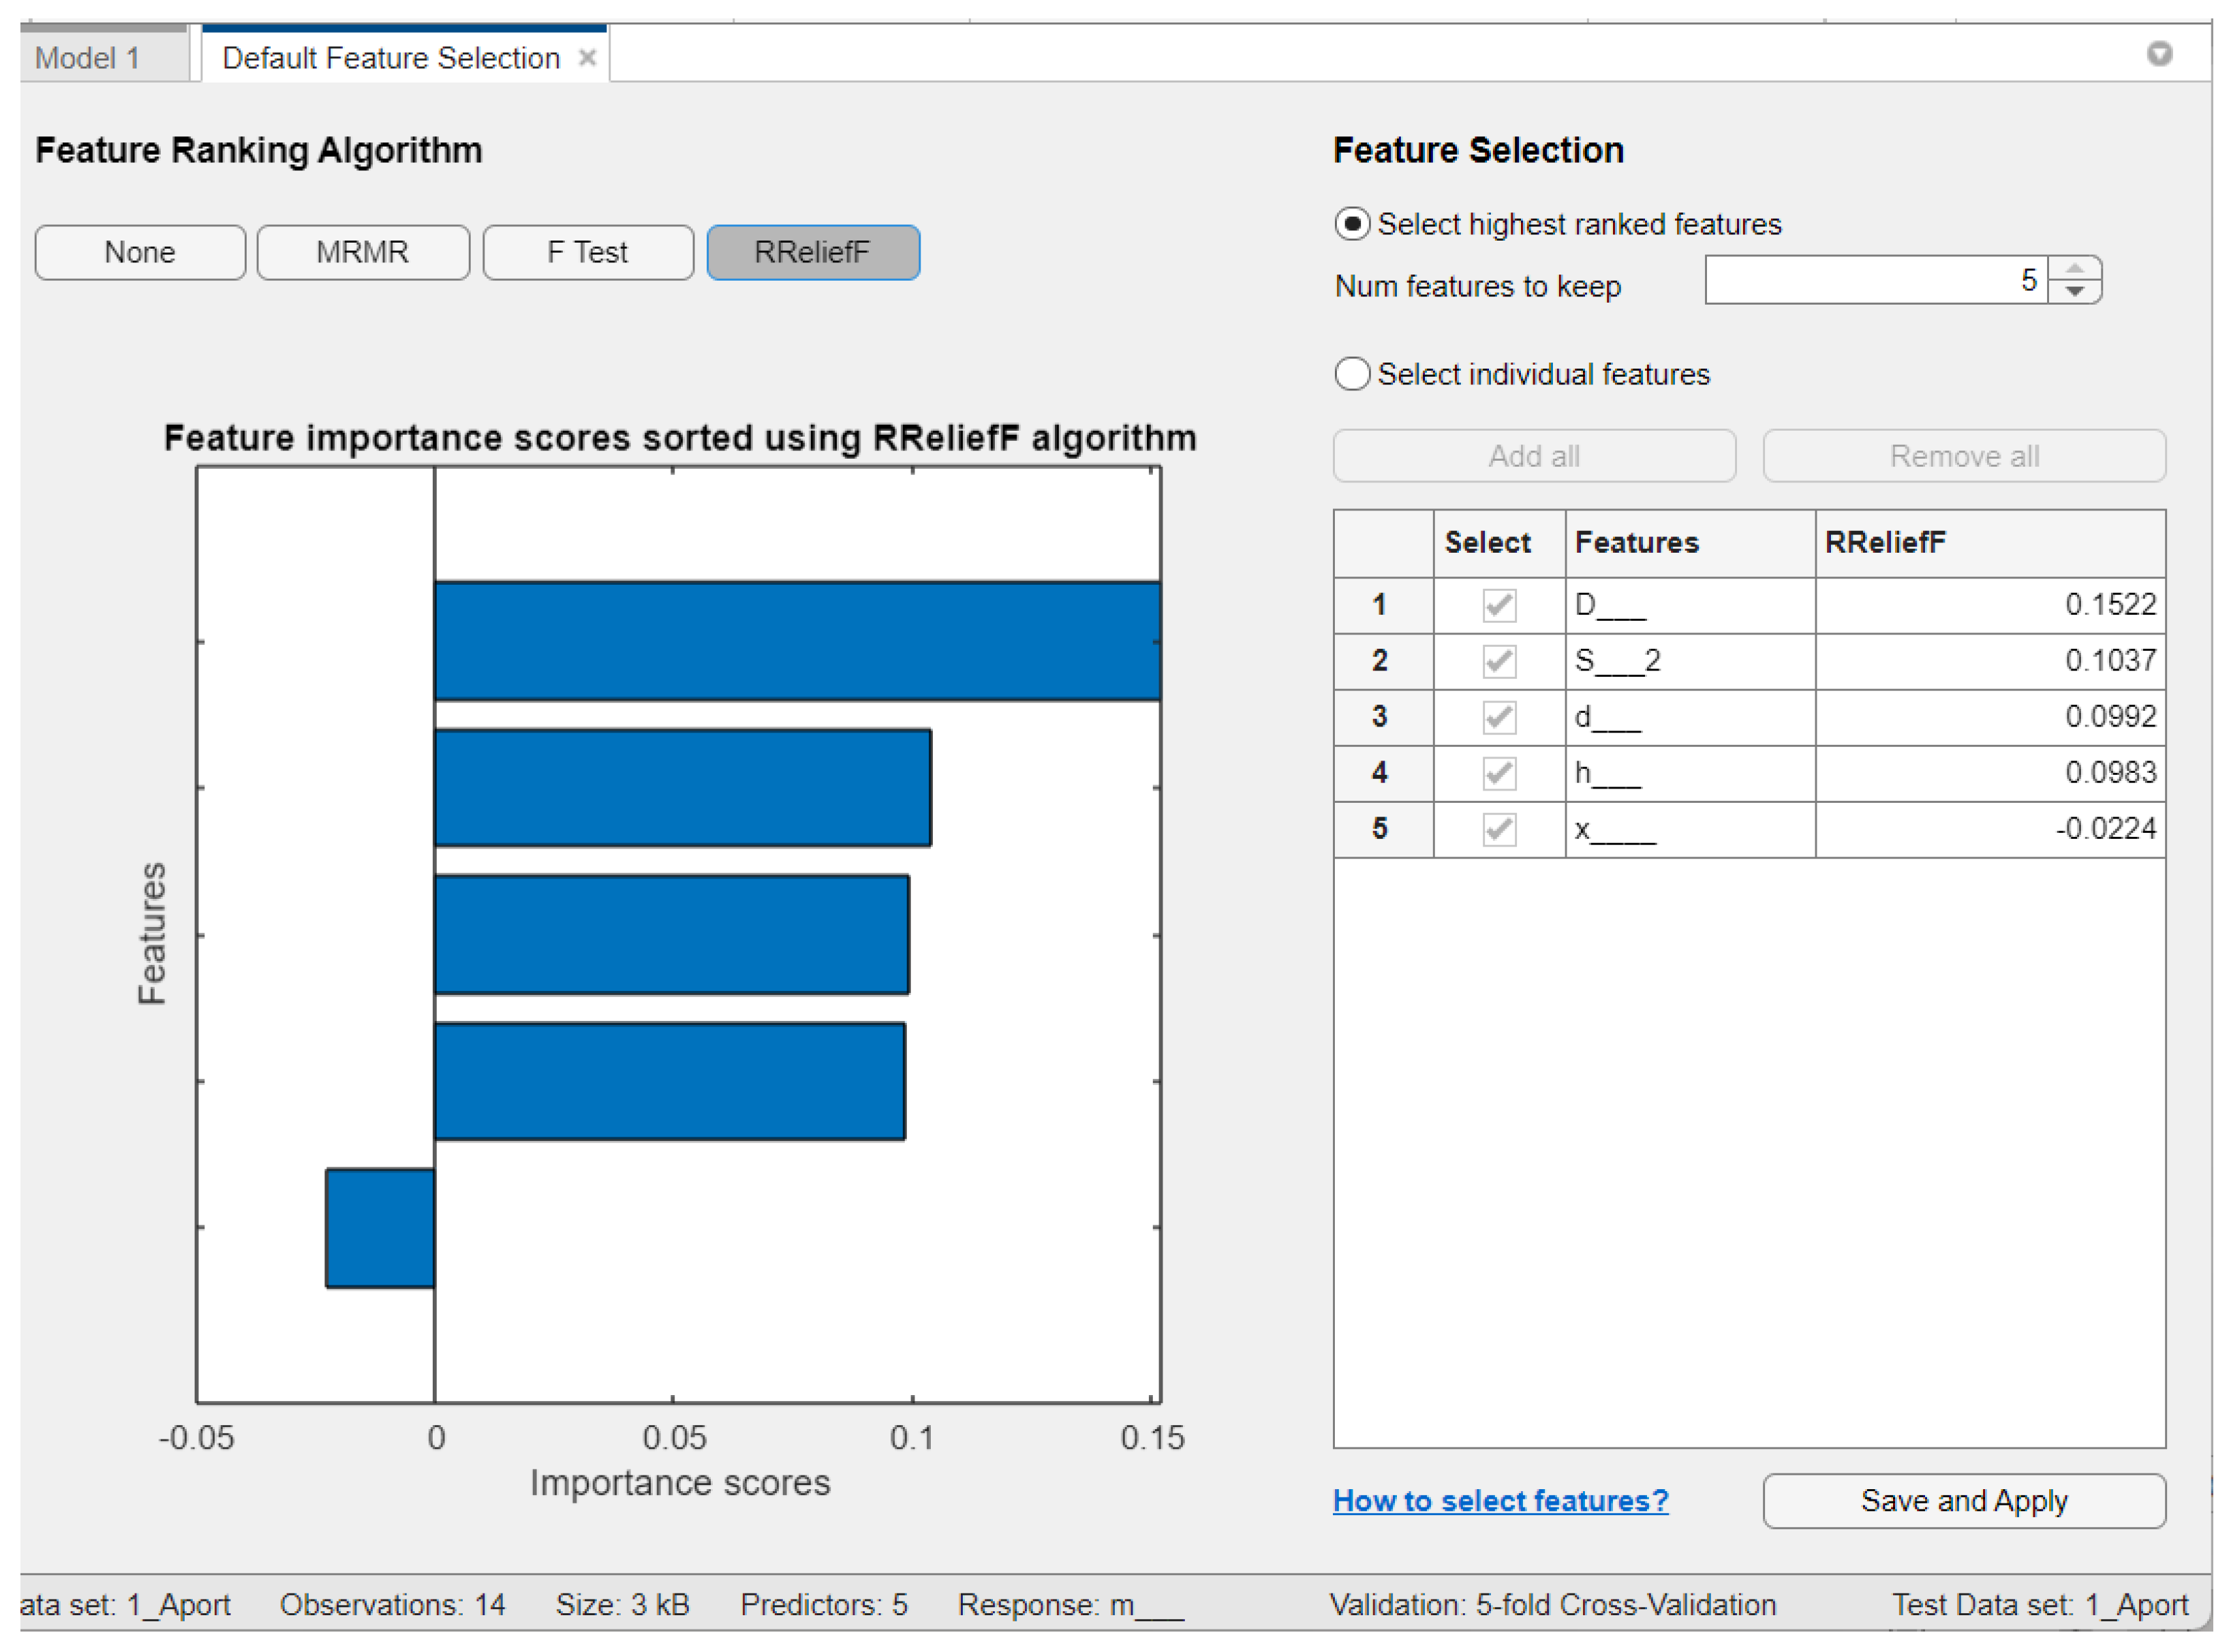
| Statistical Value | D, mm | d, mm | h, mm | m, gr | V, cm3 | ρ, gr/cm3 | Dк, mm | dк, mm | hк, mm | δr, % | S, cm2 |
|---|---|---|---|---|---|---|---|---|---|---|---|
| Aport Alexander | |||||||||||
| Average value | 63.60 | 78.70 | 76.10 | 163.45 | 208.50 | 0.79 | 63.50 | 78.70 | 76.00 | 54.10 | 48.79 |
| Standard deviation | 5.30 | 4.89 | 3.85 | 23.09 | 34.72 | 0.03 | 5.30 | 4.89 | 3.85 | 8.63 | 6.01 |
| Min | 56.40 | 68.40 | 69.40 | 126.30 | 150.00 | 0.73 | 56.30 | 68.50 | 69.50 | 42.00 | 36.72 |
| Max | 72.40 | 86.40 | 82.40 | 207.19 | 270.00 | 0.84 | 72.30 | 86.40 | 82.30 | 70.00 | 58.59 |
| Sinap Almatynski | |||||||||||
| Average value | 65.60 | 65.00 | 62.00 | 122.17 | 142.10 | 0.86 | 65.50 | 64.90 | 62.40 | 54.70 | 33.62 |
| Standard deviation | 11.44 | 7.96 | 4.25 | 24.40 | 28.24 | 0.03 | 11.44 | 7.96 | 4.25 | 8.84 | 9.32 |
| Min | 35.90 | 54.40 | 55.00 | 77.18 | 88.00 | 0.74 | 35.80 | 54.50 | 55.20 | 40.00 | 23.23 |
| Max | 98.80 | 97.0 | 71.40 | 173.25 | 197.50 | 0.88 | 98.70 | 97.20 | 71.50 | 71.00 | 73.86 |
| Kazakhski Yubileinyi | |||||||||||
| Average value | 53.10 | 67.90 | 65.50 | 138.60 | 167.40 | 0.83 | 53.60 | 67.60 | 65.70 | 57.90 | 36.62 |
| Standard deviation | 6.91 | 6.80 | 5.60 | 28.59 | 34.33 | 0.02 | 6.91 | 6.80 | 5.60 | 10.20 | 7.50 |
| Min | 43.00 | 58.60 | 57.80 | 99.00 | 115.00 | 0.76 | 43.00 | 58.00 | 57.60 | 38.00 | 26.97 |
| Max | 66.50 | 82.70 | 77.70 | 187.00 | 230.00 | 0.86 | 66.50 | 82.50 | 77.80 | 68.00 | 53.72 |
| Ainur | |||||||||||
| Average value | 58.20 | 64.90 | 62.40 | 110.72 | 137.11 | 0.81 | 58.10 | 64.80 | 62.20 | 5.50 | 33.15 |
| Standard deviation | 3.40 | 3.36 | 4.25 | 16.72 | 22.49 | 0.06 | 3.40 | 3.36 | 4.25 | 0.92 | 3.50 |
| Min | 53.40 | 61.30 | 57.10 | 89.86 | 100.00 | 0.72 | 53.30 | 61.50 | 57.20 | 4.00 | 29.51 |
| Max | 66.30 | 72.70 | 73.40 | 152.5 | 190.00 | 0.90 | 66.40 | 72.90 | 73.40 | 7.00 | 41.51 |
| Nursat | |||||||||||
| Average value | 67.70 | 66.00 | 60.50 | 134.16 | 155.83 | 0.86 | 67.80 | 66.20 | 60.20 | 4.17 | 34.44 |
| Standard deviation | 4.72 | 5.54 | 5.20 | 27.48 | 33.61 | 0.02 | 4.72 | 5.54 | 5.20 | 1.09 | 5.80 |
| Min | 60.60 | 56.20 | 48.80 | 86.21 | 100.00 | 0.82 | 60.40 | 56.10 | 48.70 | 2.00 | 24.81 |
| Max | 76.50 | 75.90 | 69.60 | 189.33 | 230.00 | 0.90 | 76.00 | 76.00 | 69.40 | 5.00 | 45.25 |
| Geometrical parameter and error | ||||||
|---|---|---|---|---|---|---|
| Alexander | 0.15 | 0.27 | 0.15 | 0.22 | 0.15 | 0.22 |
| Sinap Almatynski | 0.24 | 0.67 | 0.24 | 0.44 | 0.24 | 0.44 |
| Kazakhski Yubileinyi | 1.70 | 4.12 | 1.70 | 2.99 | 1.70 | 3.03 |
| Ainur | 0.11 | 0.21 | 0.11 | 0.18 | 0.11 | 0.19 |
| Nursat | 0.07 | 0.12 | 0.07 | 0.12 | 0.07 | 0.14 |
| Statistical values of the errors | ||||||
| Average Value | 0.45 | 1.08 | 0.45 | 0.79 | 0.45 | 0.80 |
| Min | 0.07 | 0.12 | 0.07 | 0.12 | 0.07 | 0.14 |
| Max | 1.7 | 4.12 | 1.7 | 2.99 | 1.7 | 3.03 |
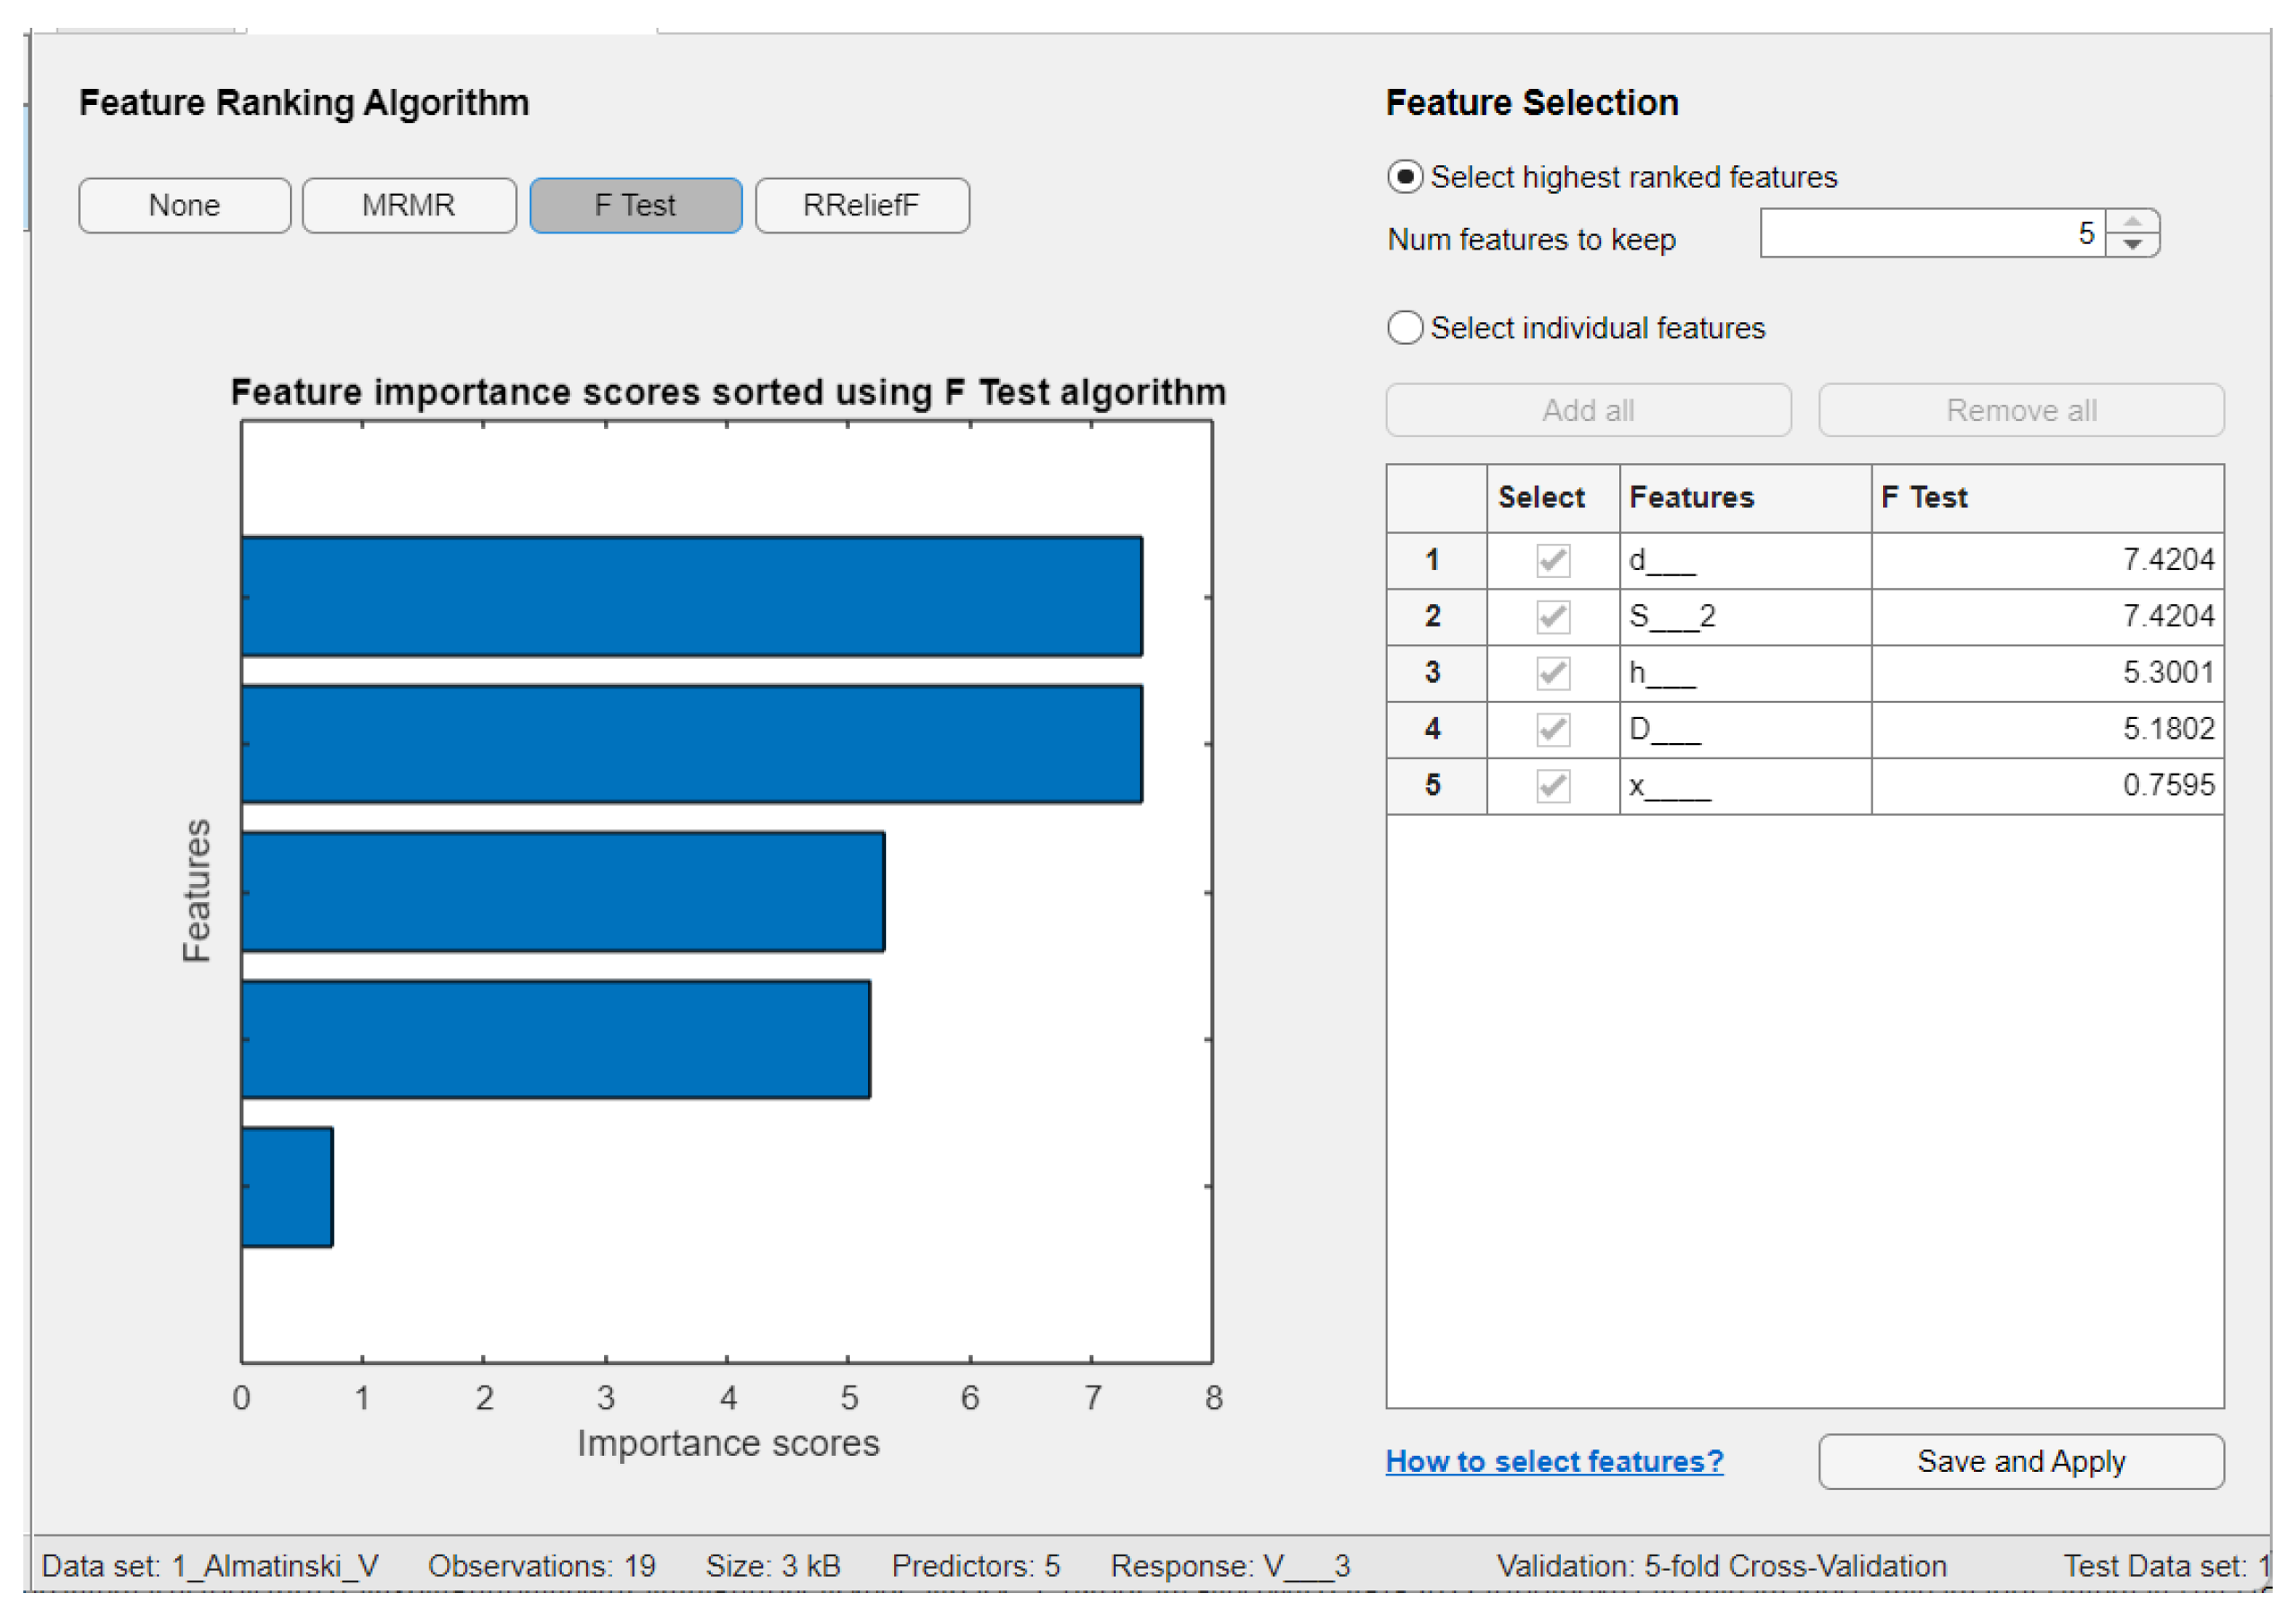
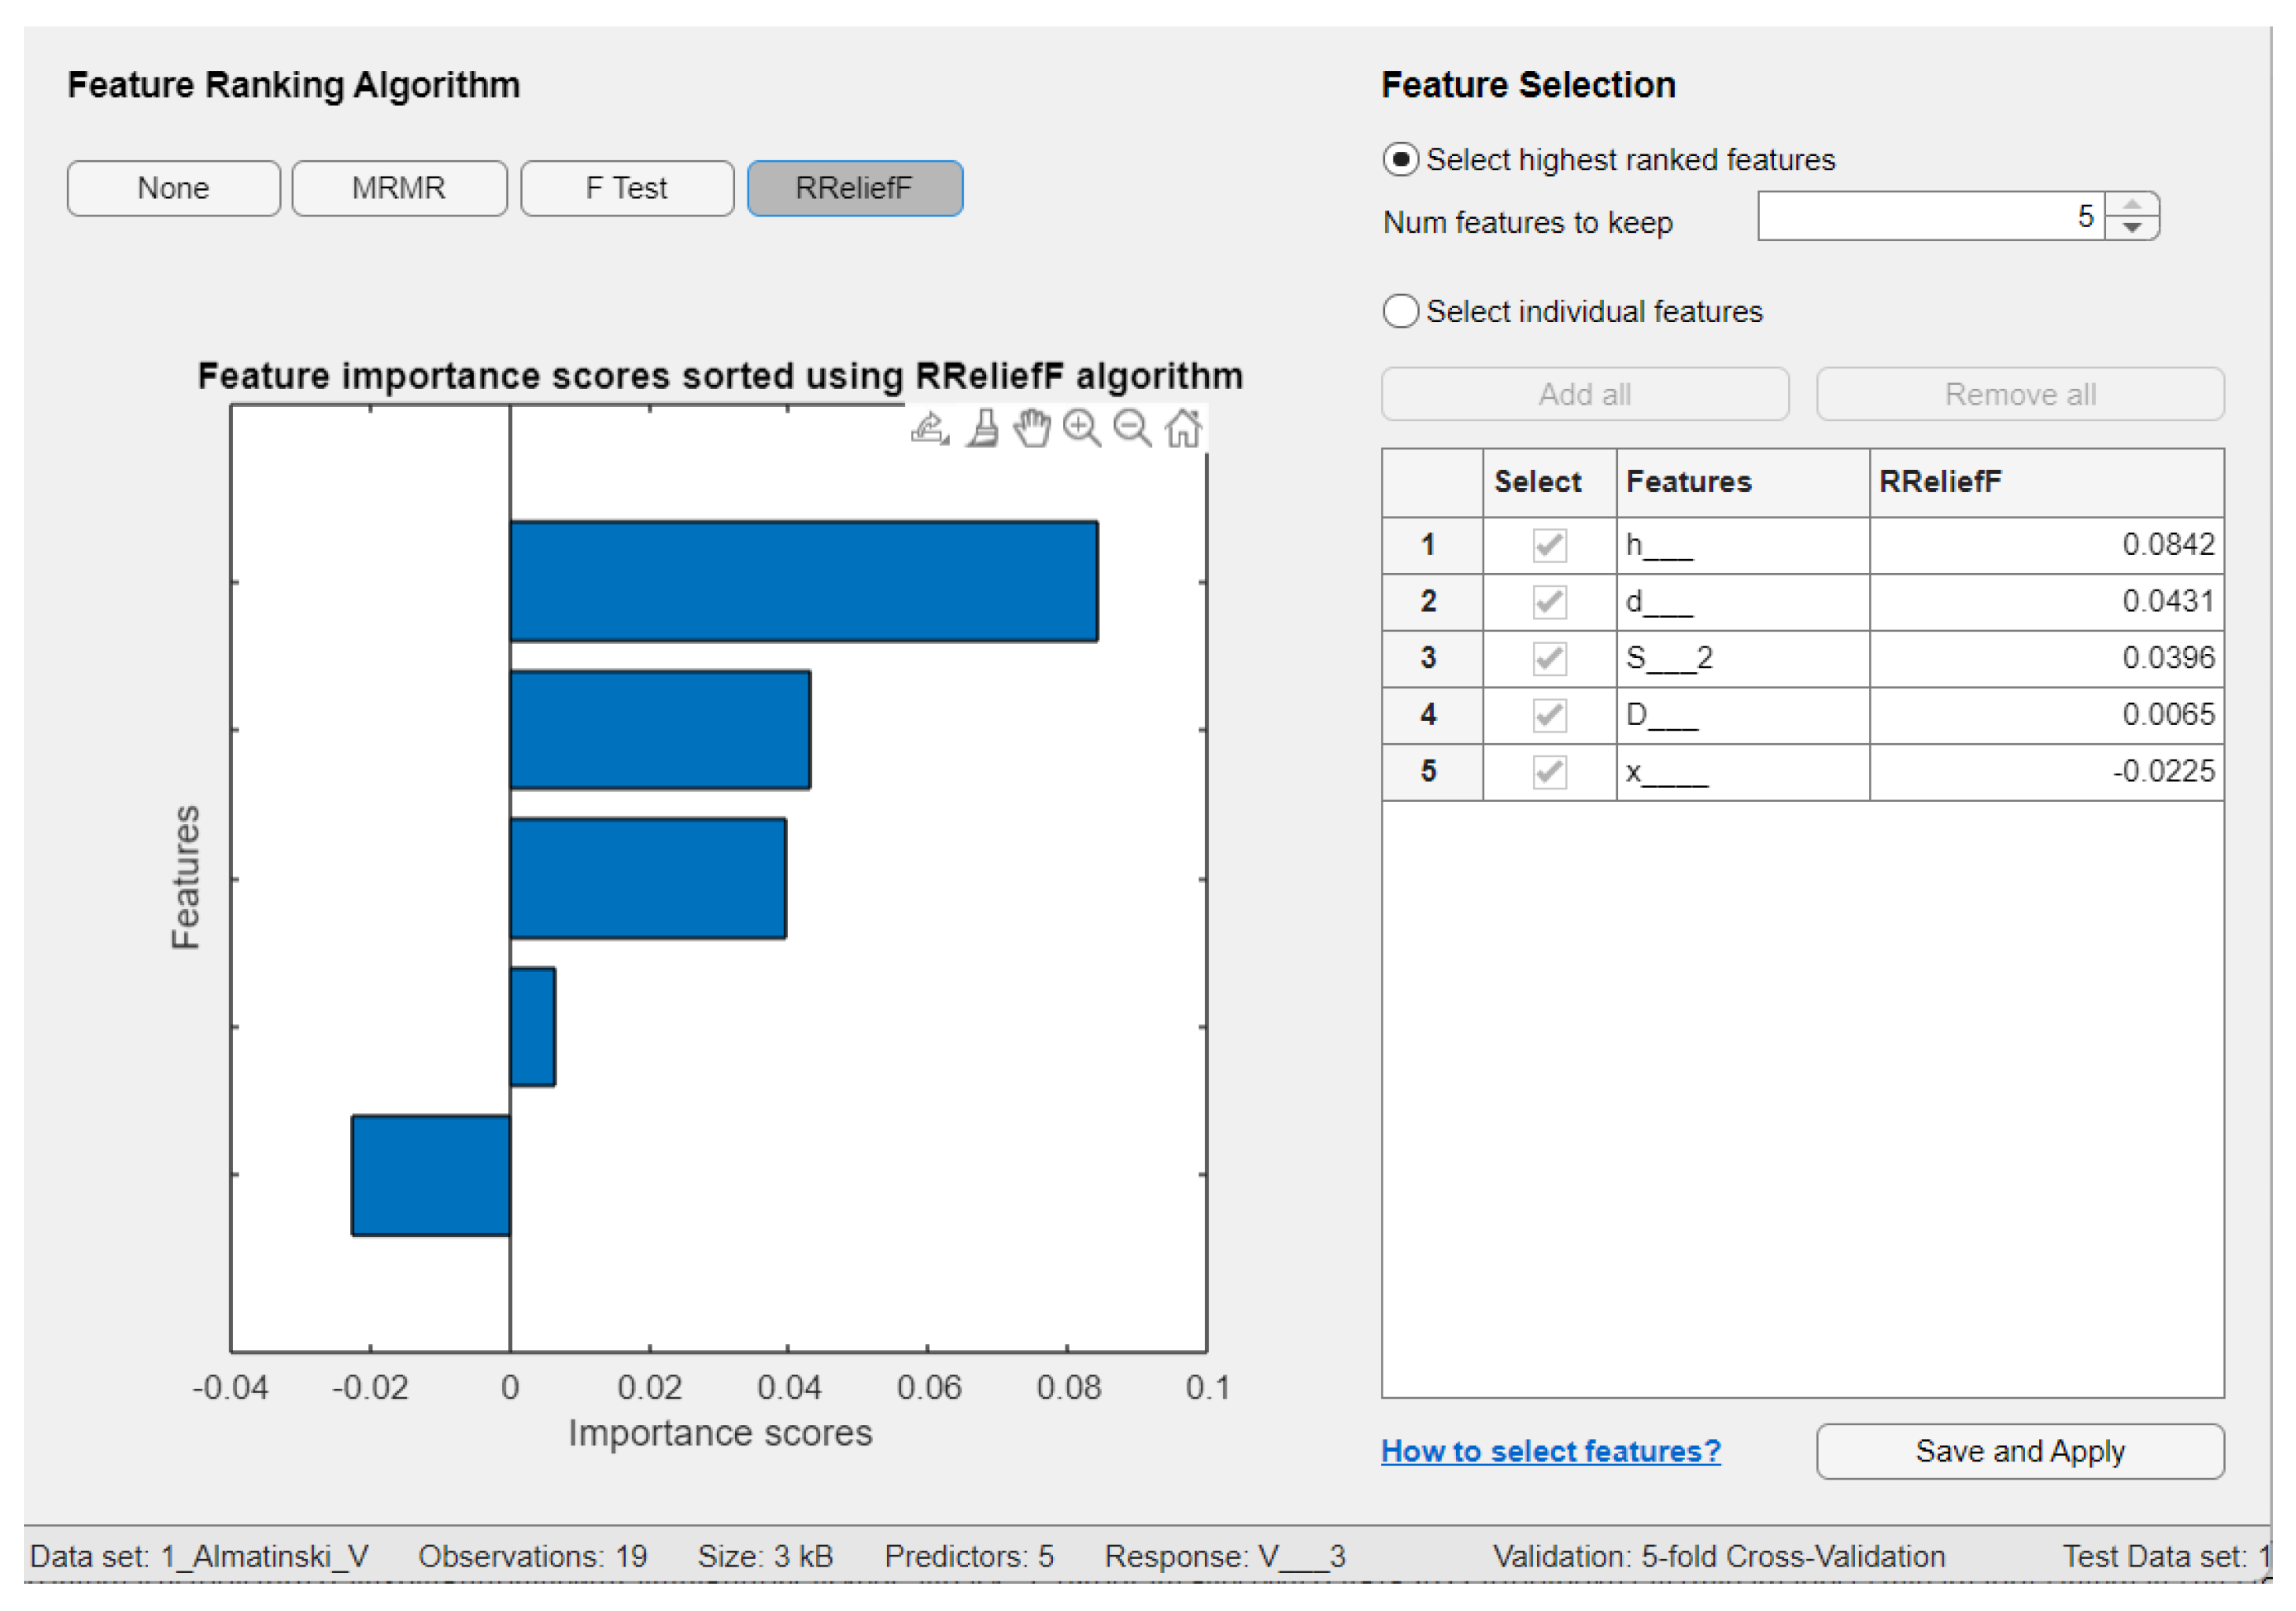
| Feature selection algorithm | mRMR | F−test | RReliefF |
|---|---|---|---|
| Aport Alexander | - | h, d, and S | D, S, and d |
| Sinap Almatynski | D and h | d, S, and h | h, d, and S |
| Kazakhski Yubileinyi | - | h, d, and S | h, d, and S |
| Ainur | - | d, S, and D | h, S, and d |
| Nursat | D, d, and h | h, d, and S | D, h, and S |
| Training set | Testing set | |||||||
|---|---|---|---|---|---|---|---|---|
| Regression model | RMSE | R2 | MAE | Training time, s | RMSE | R2 | MAE | |
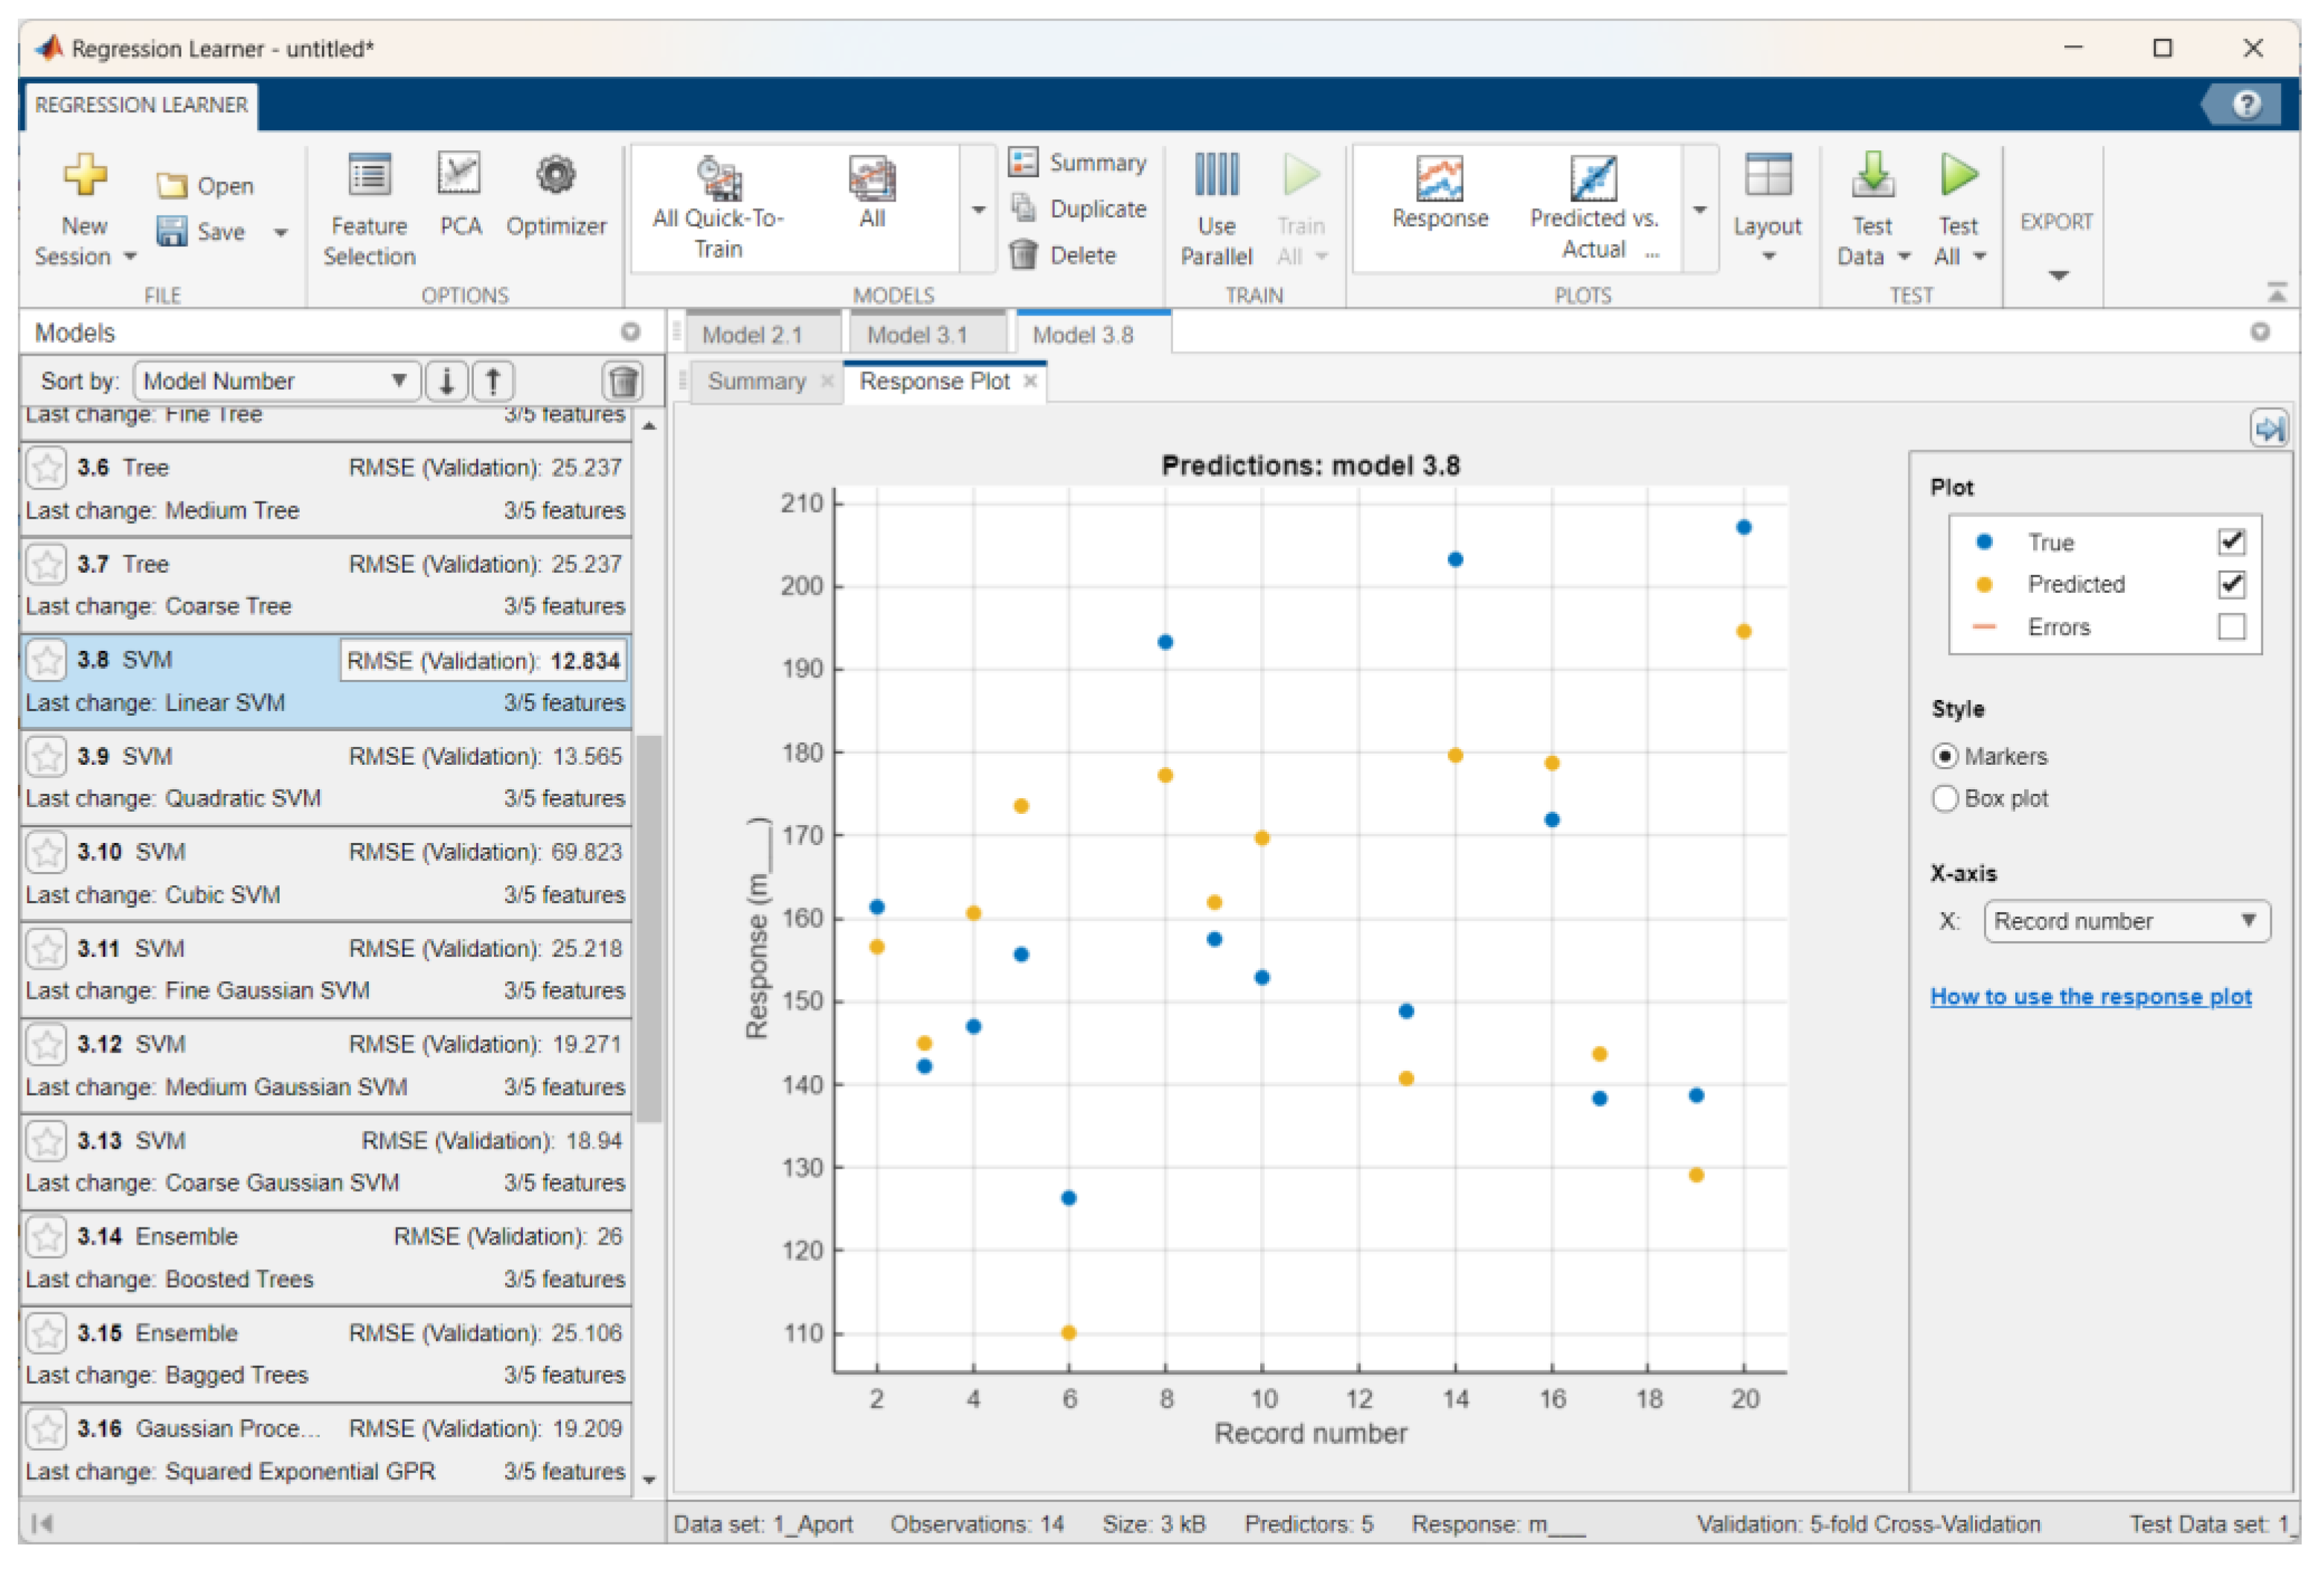
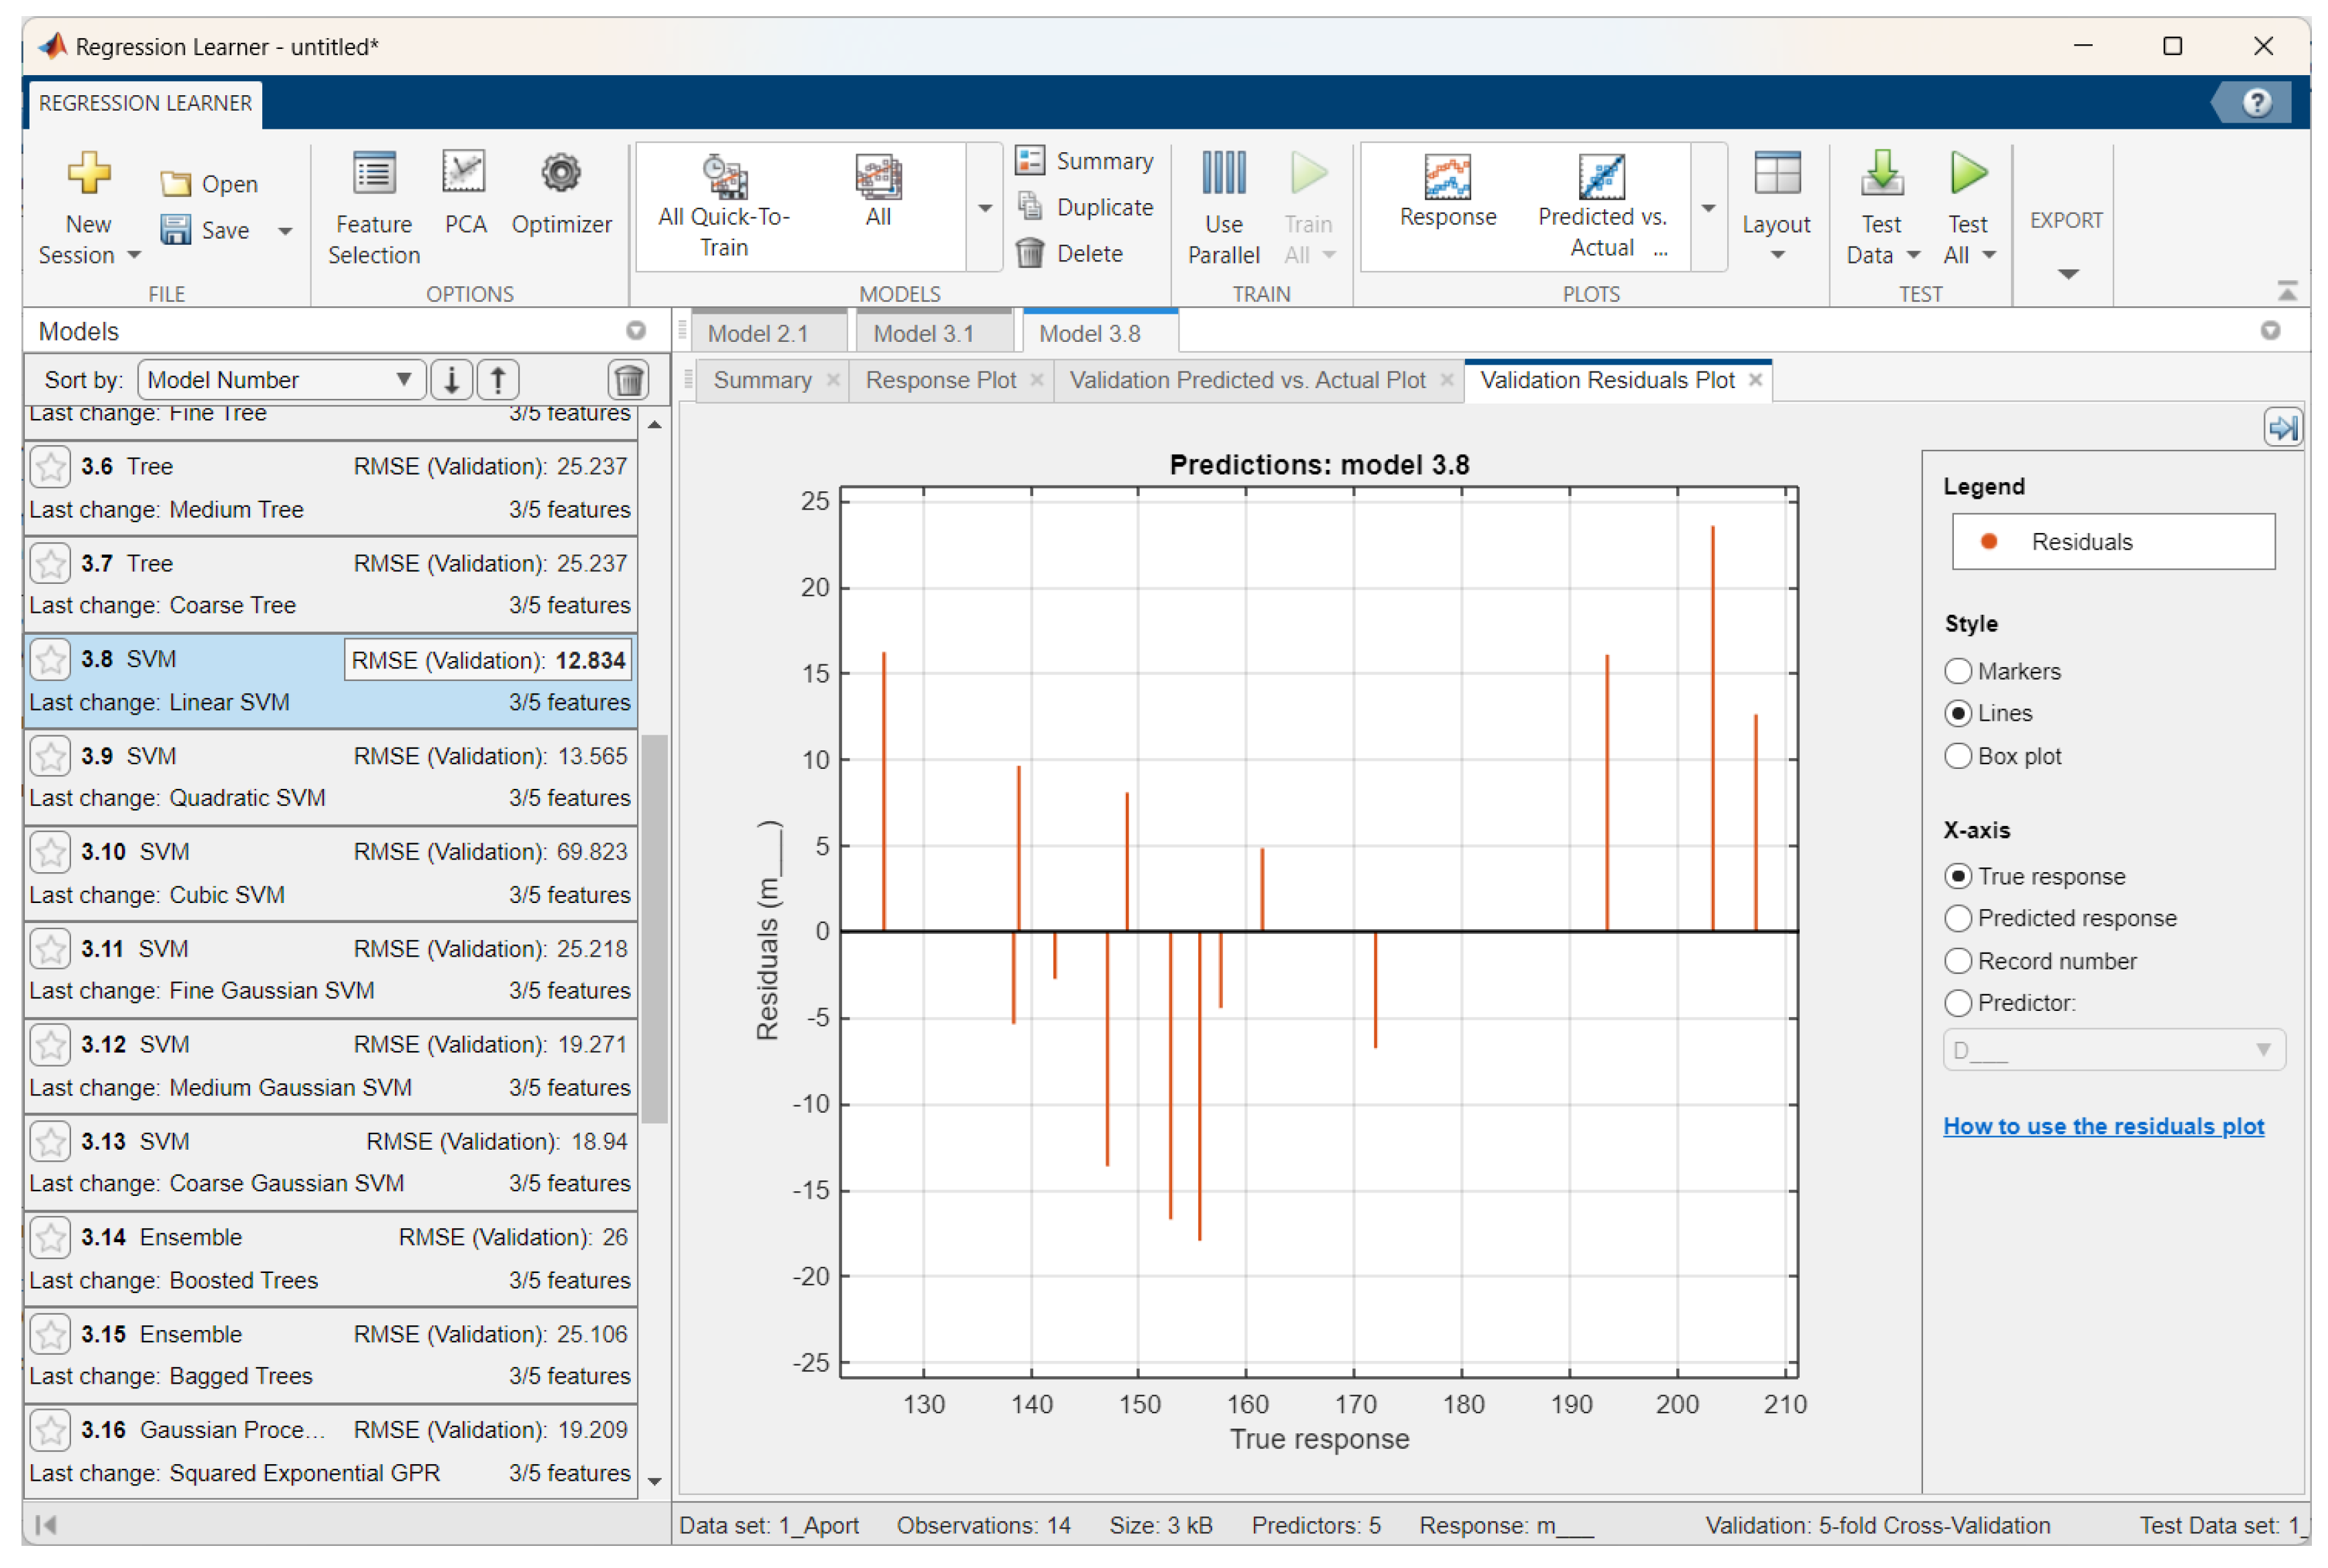
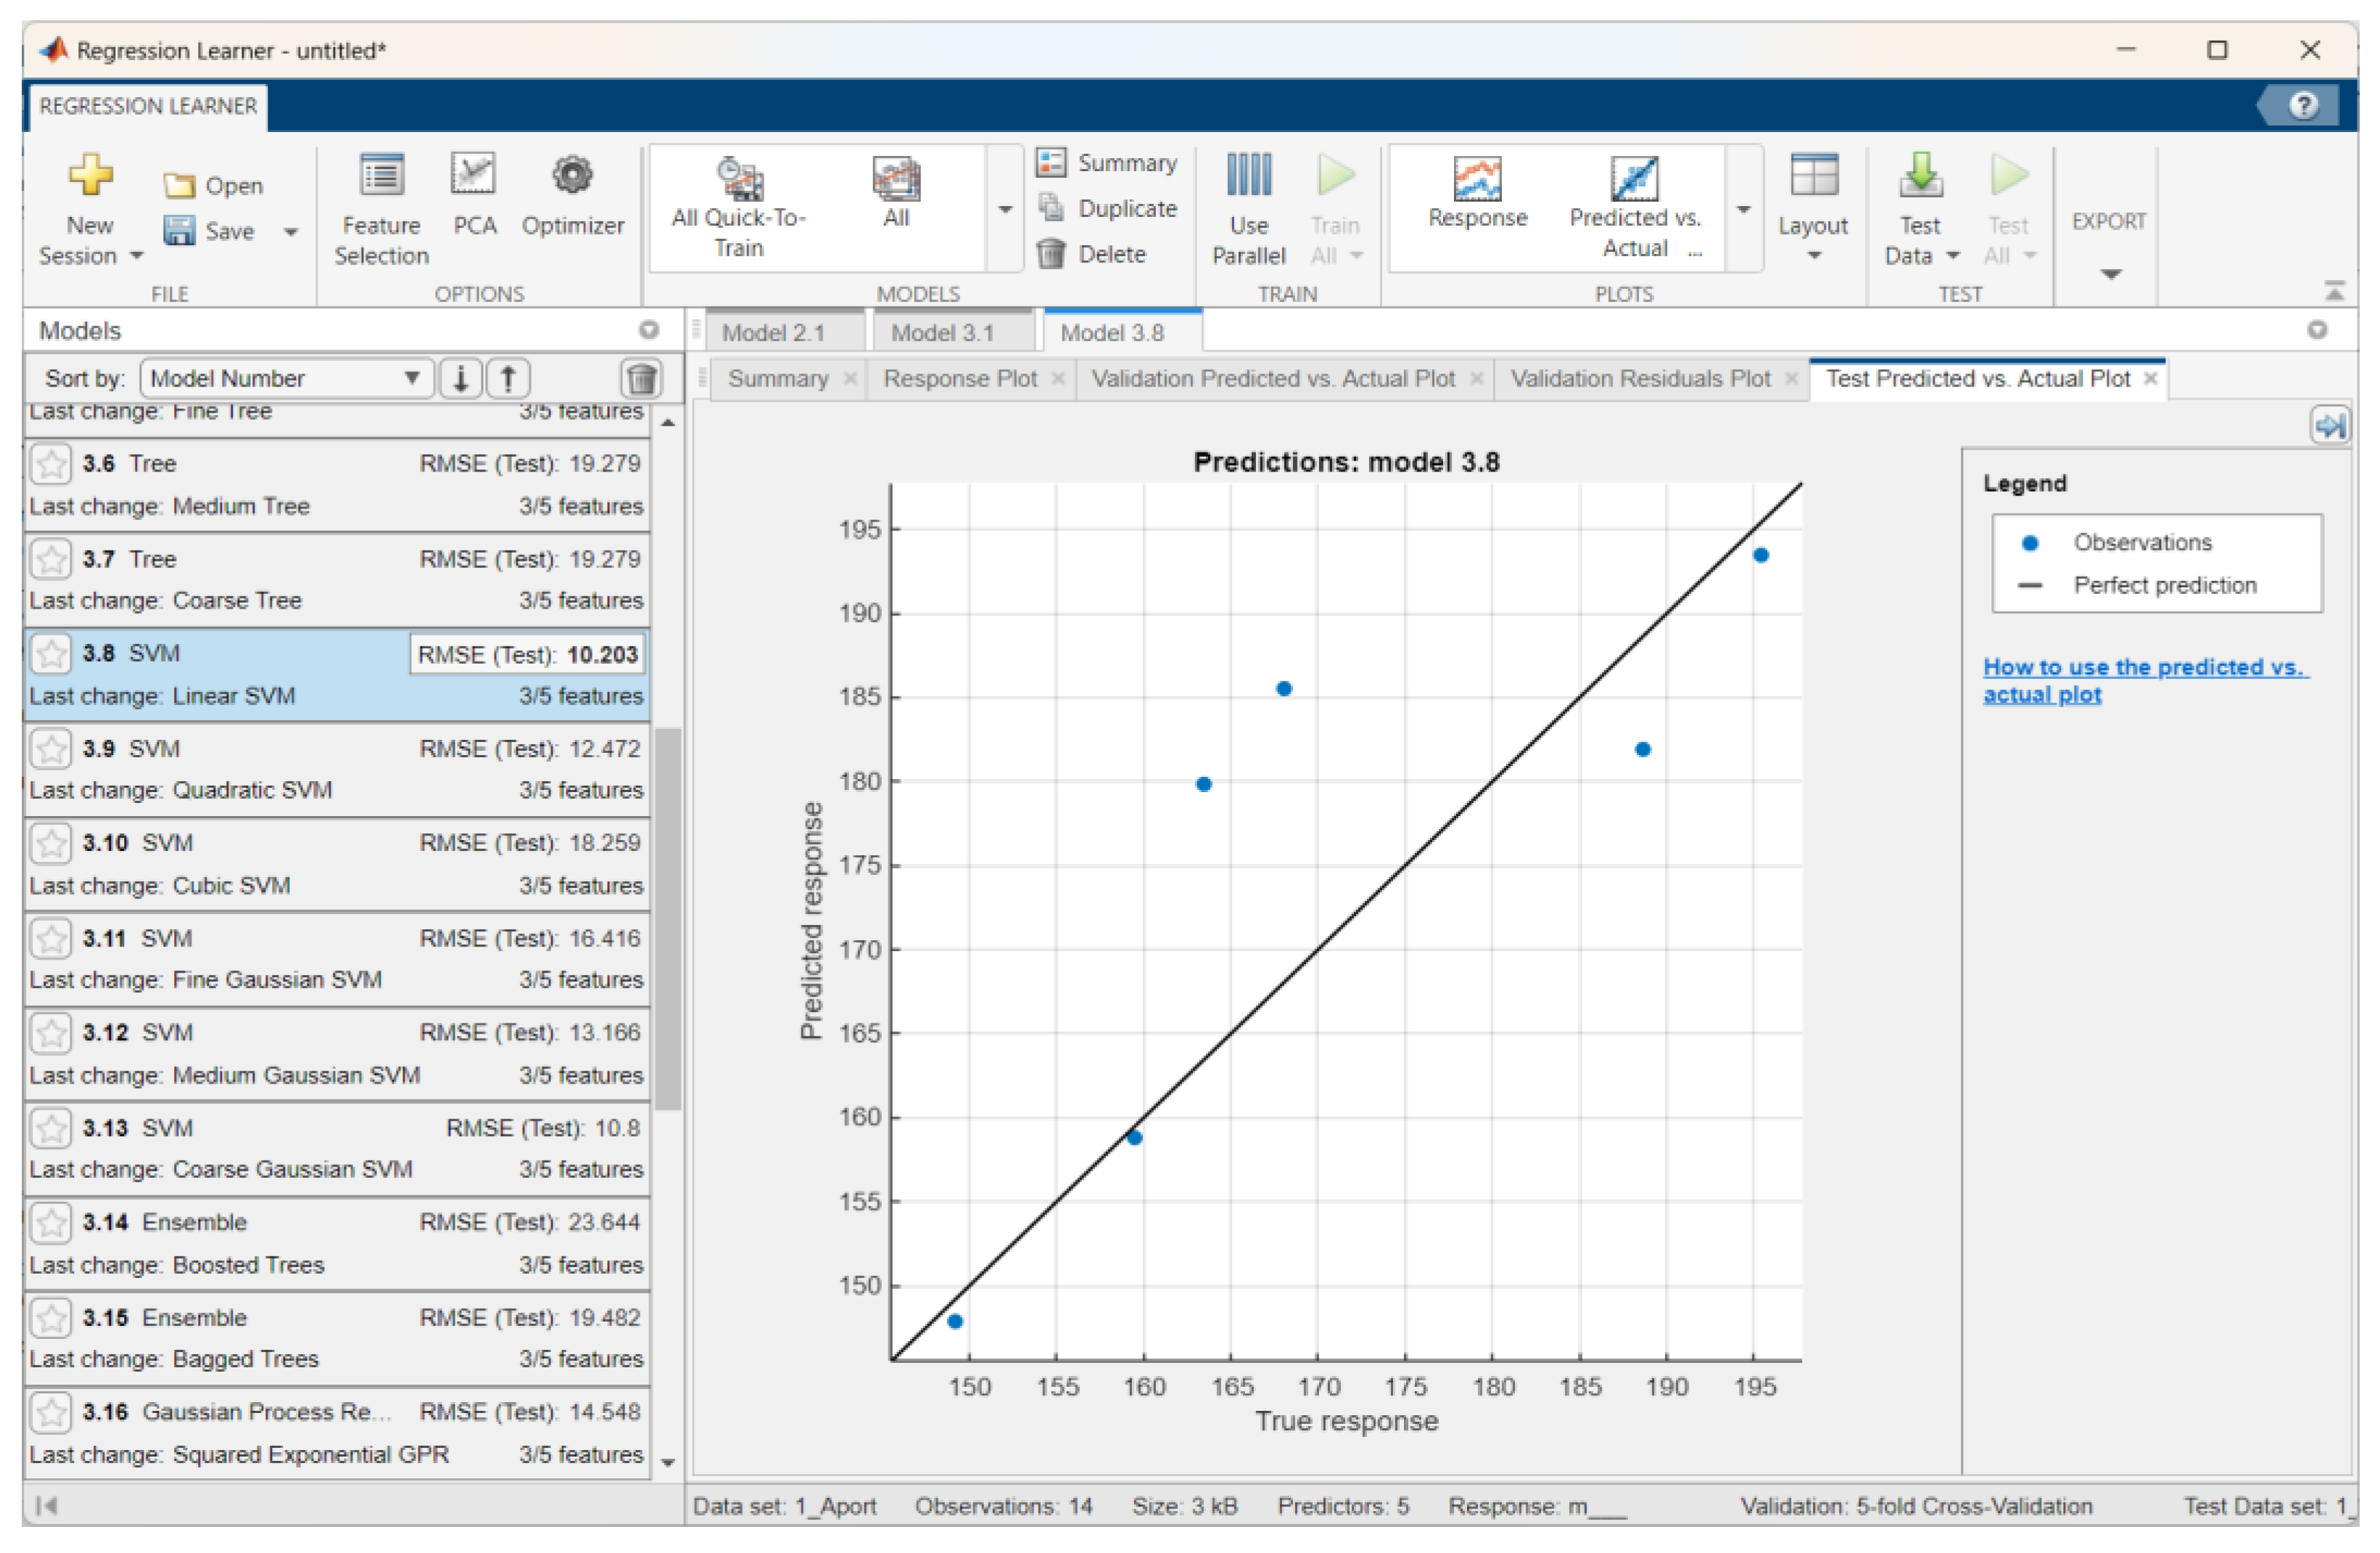
| Aport Alexander | Linear SVM | 12.83 | 0.74 | 11.33 | 2.77 | 10.20 | 0.61 | 7.42 |
| Sinap Almatynski | Stepwise Linear Regression | 7.17 | 0.92 | 6.12 | 1.88 | 4.83 | 0.96 | 4.14 |
| Kazakhski Yubileinyi | Rational Quadratic Gaussian Process Regression | 9.64 | 0.88 | 7.97 | 0.60 | 16.97 | 0.68 | 12.29 |
| Ainur | Linear SVM | 9.09 | 0.70 | 6.64 | 1.71 | 4.96 | 0.92 | 3.84 |
| Nursat | Linear Regression | 10.10 | 0.89 | 8.38 | 4.27 | 8.95 | 0.66 | 6.36 |
| Feature selection algorithm | mRMR | F−test | RReliefF |
|---|---|---|---|
| Aport Alexander | - | D, S, and h | h, S, and d |
| Sinap Almatynski | d, D, and S | h, d, and S | d, S, and h |
| Kazakhski Yubileinyi | D | h, d, and S | d, h, and S |
| Ainur | D | d, S, and D | h, S, and d |
| Nursat | D | D, h, and δ | D, h, and δ |
| Apple Variety | Training set | Testing set | ||||||
|---|---|---|---|---|---|---|---|---|
| Regression Model | RMSE | R2 | MAE | Training time, s | RMSE | R2 | MAE | |
| Aport Alexander | Squared Exponential Gaussian Process Regression | 22.75 | 0.65 | 19.66 | 2.26 | 9.38 | 0.92 | 7.65 |
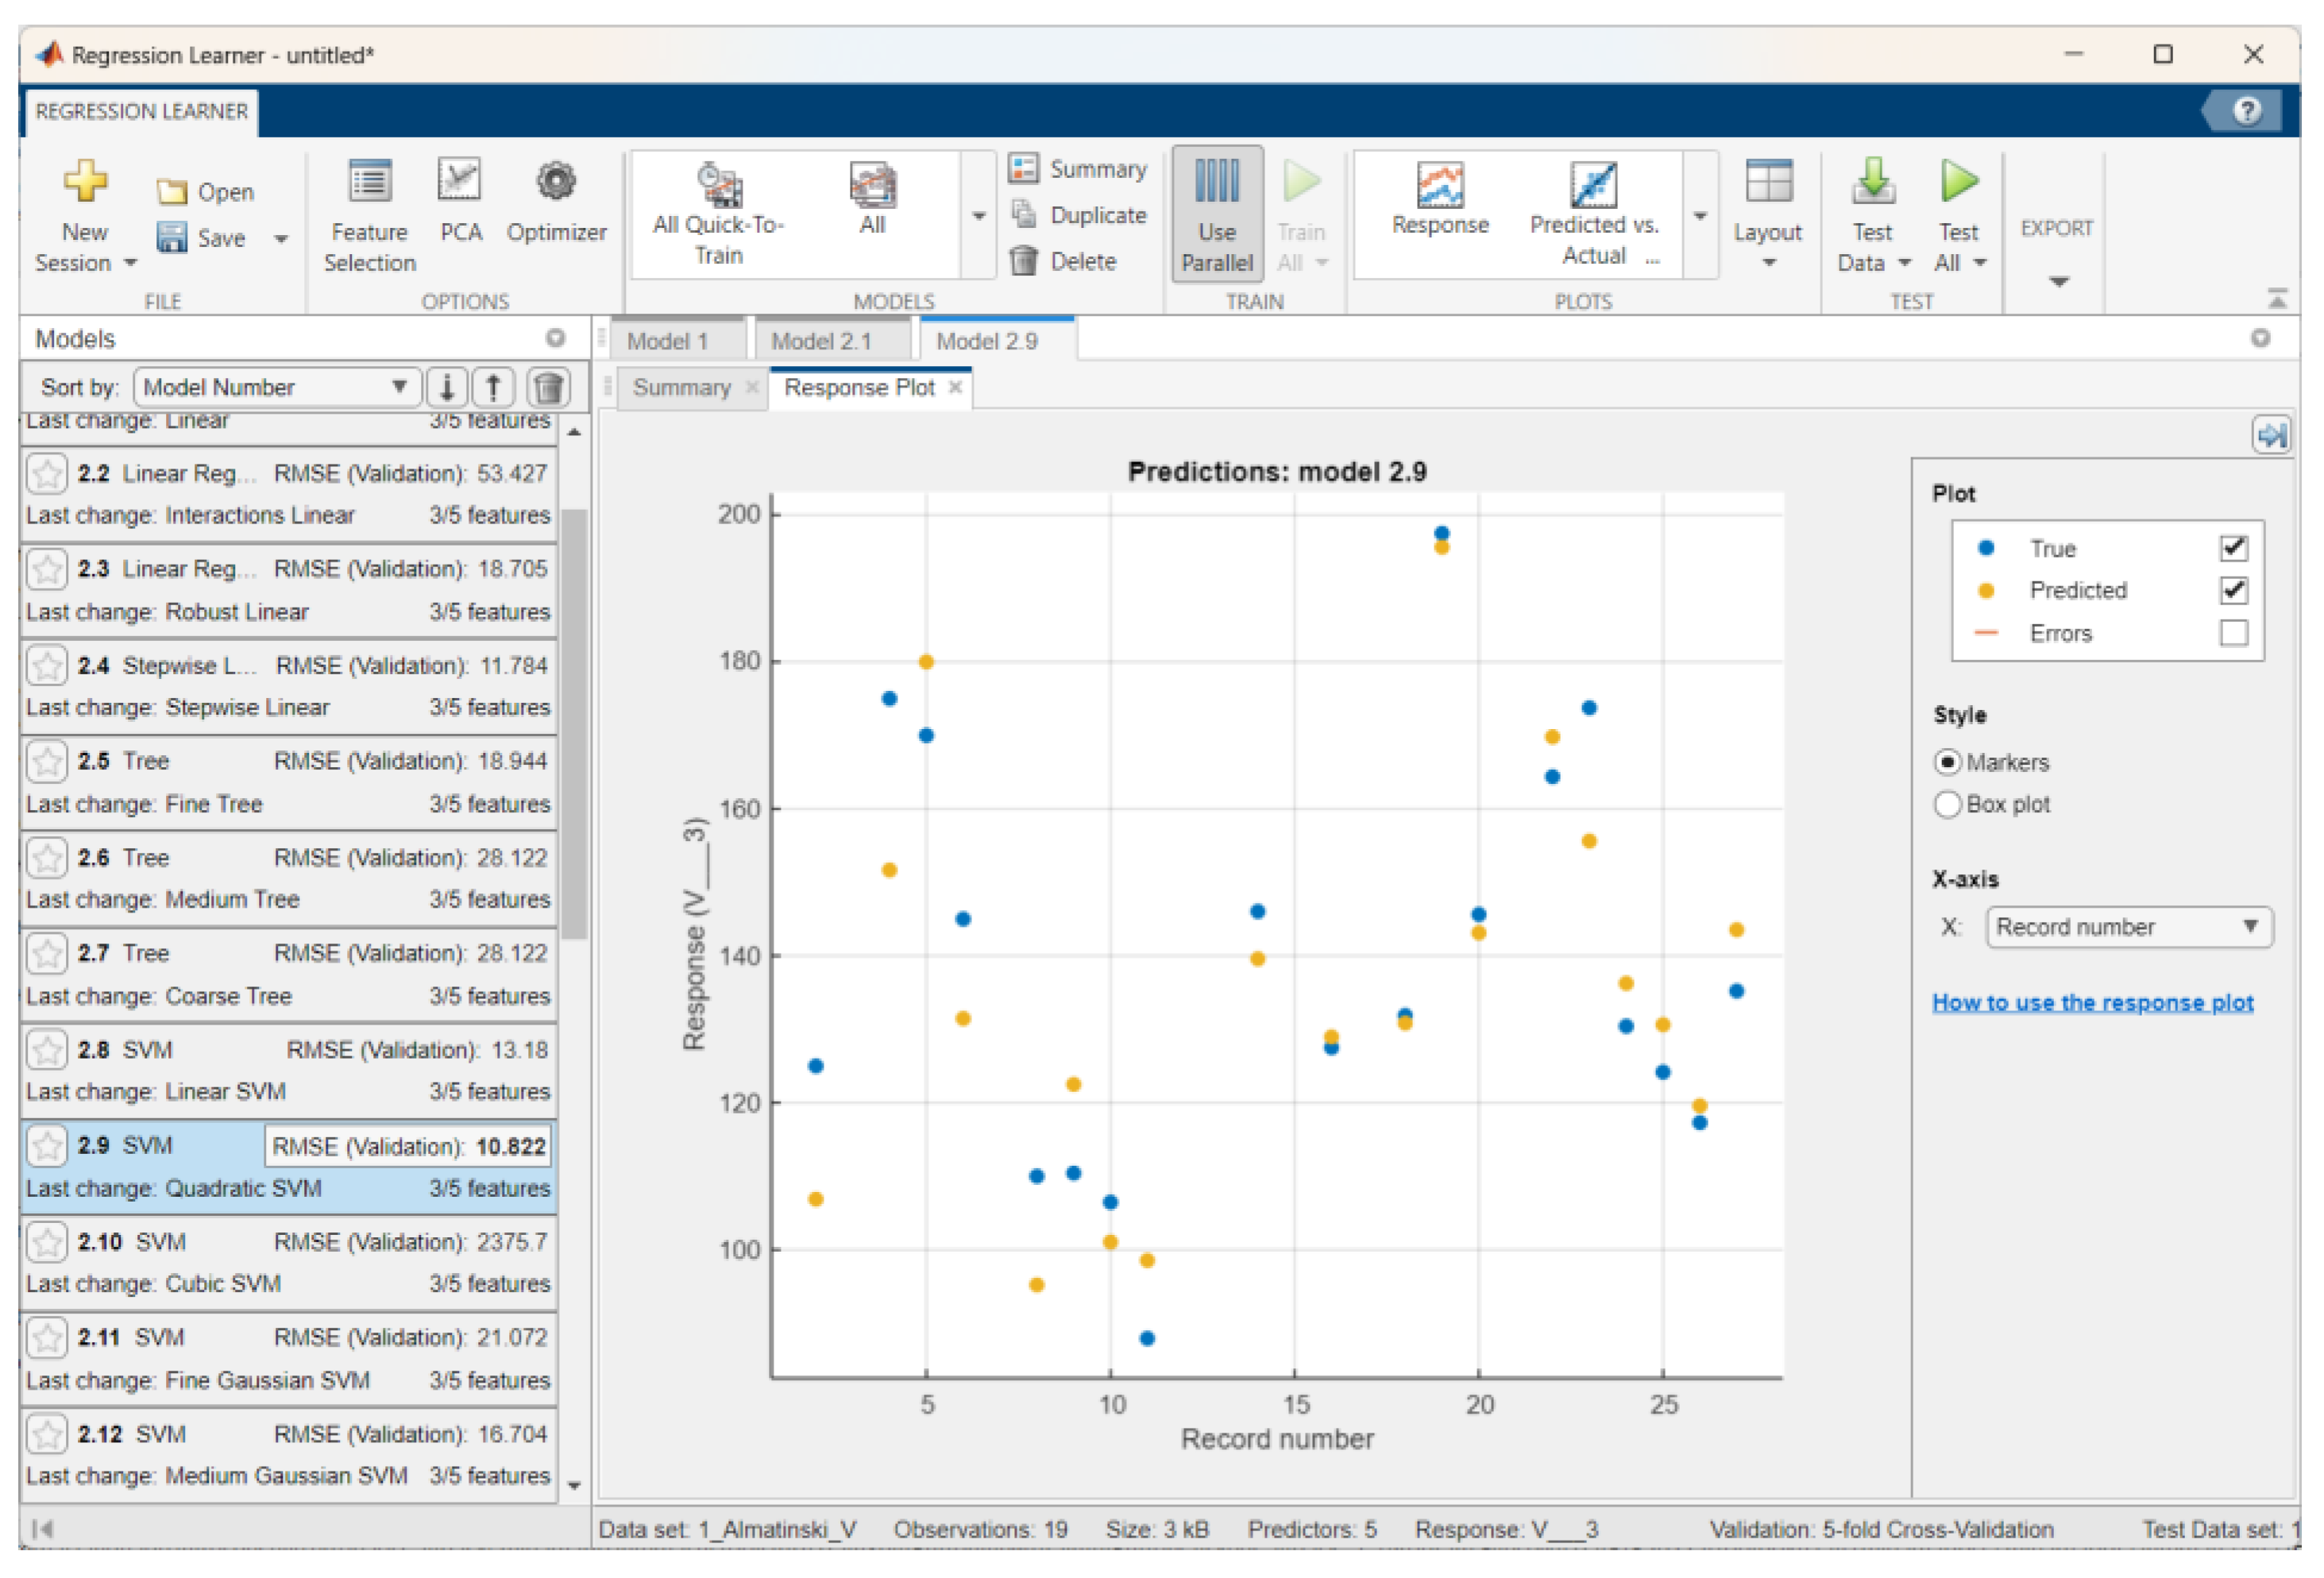
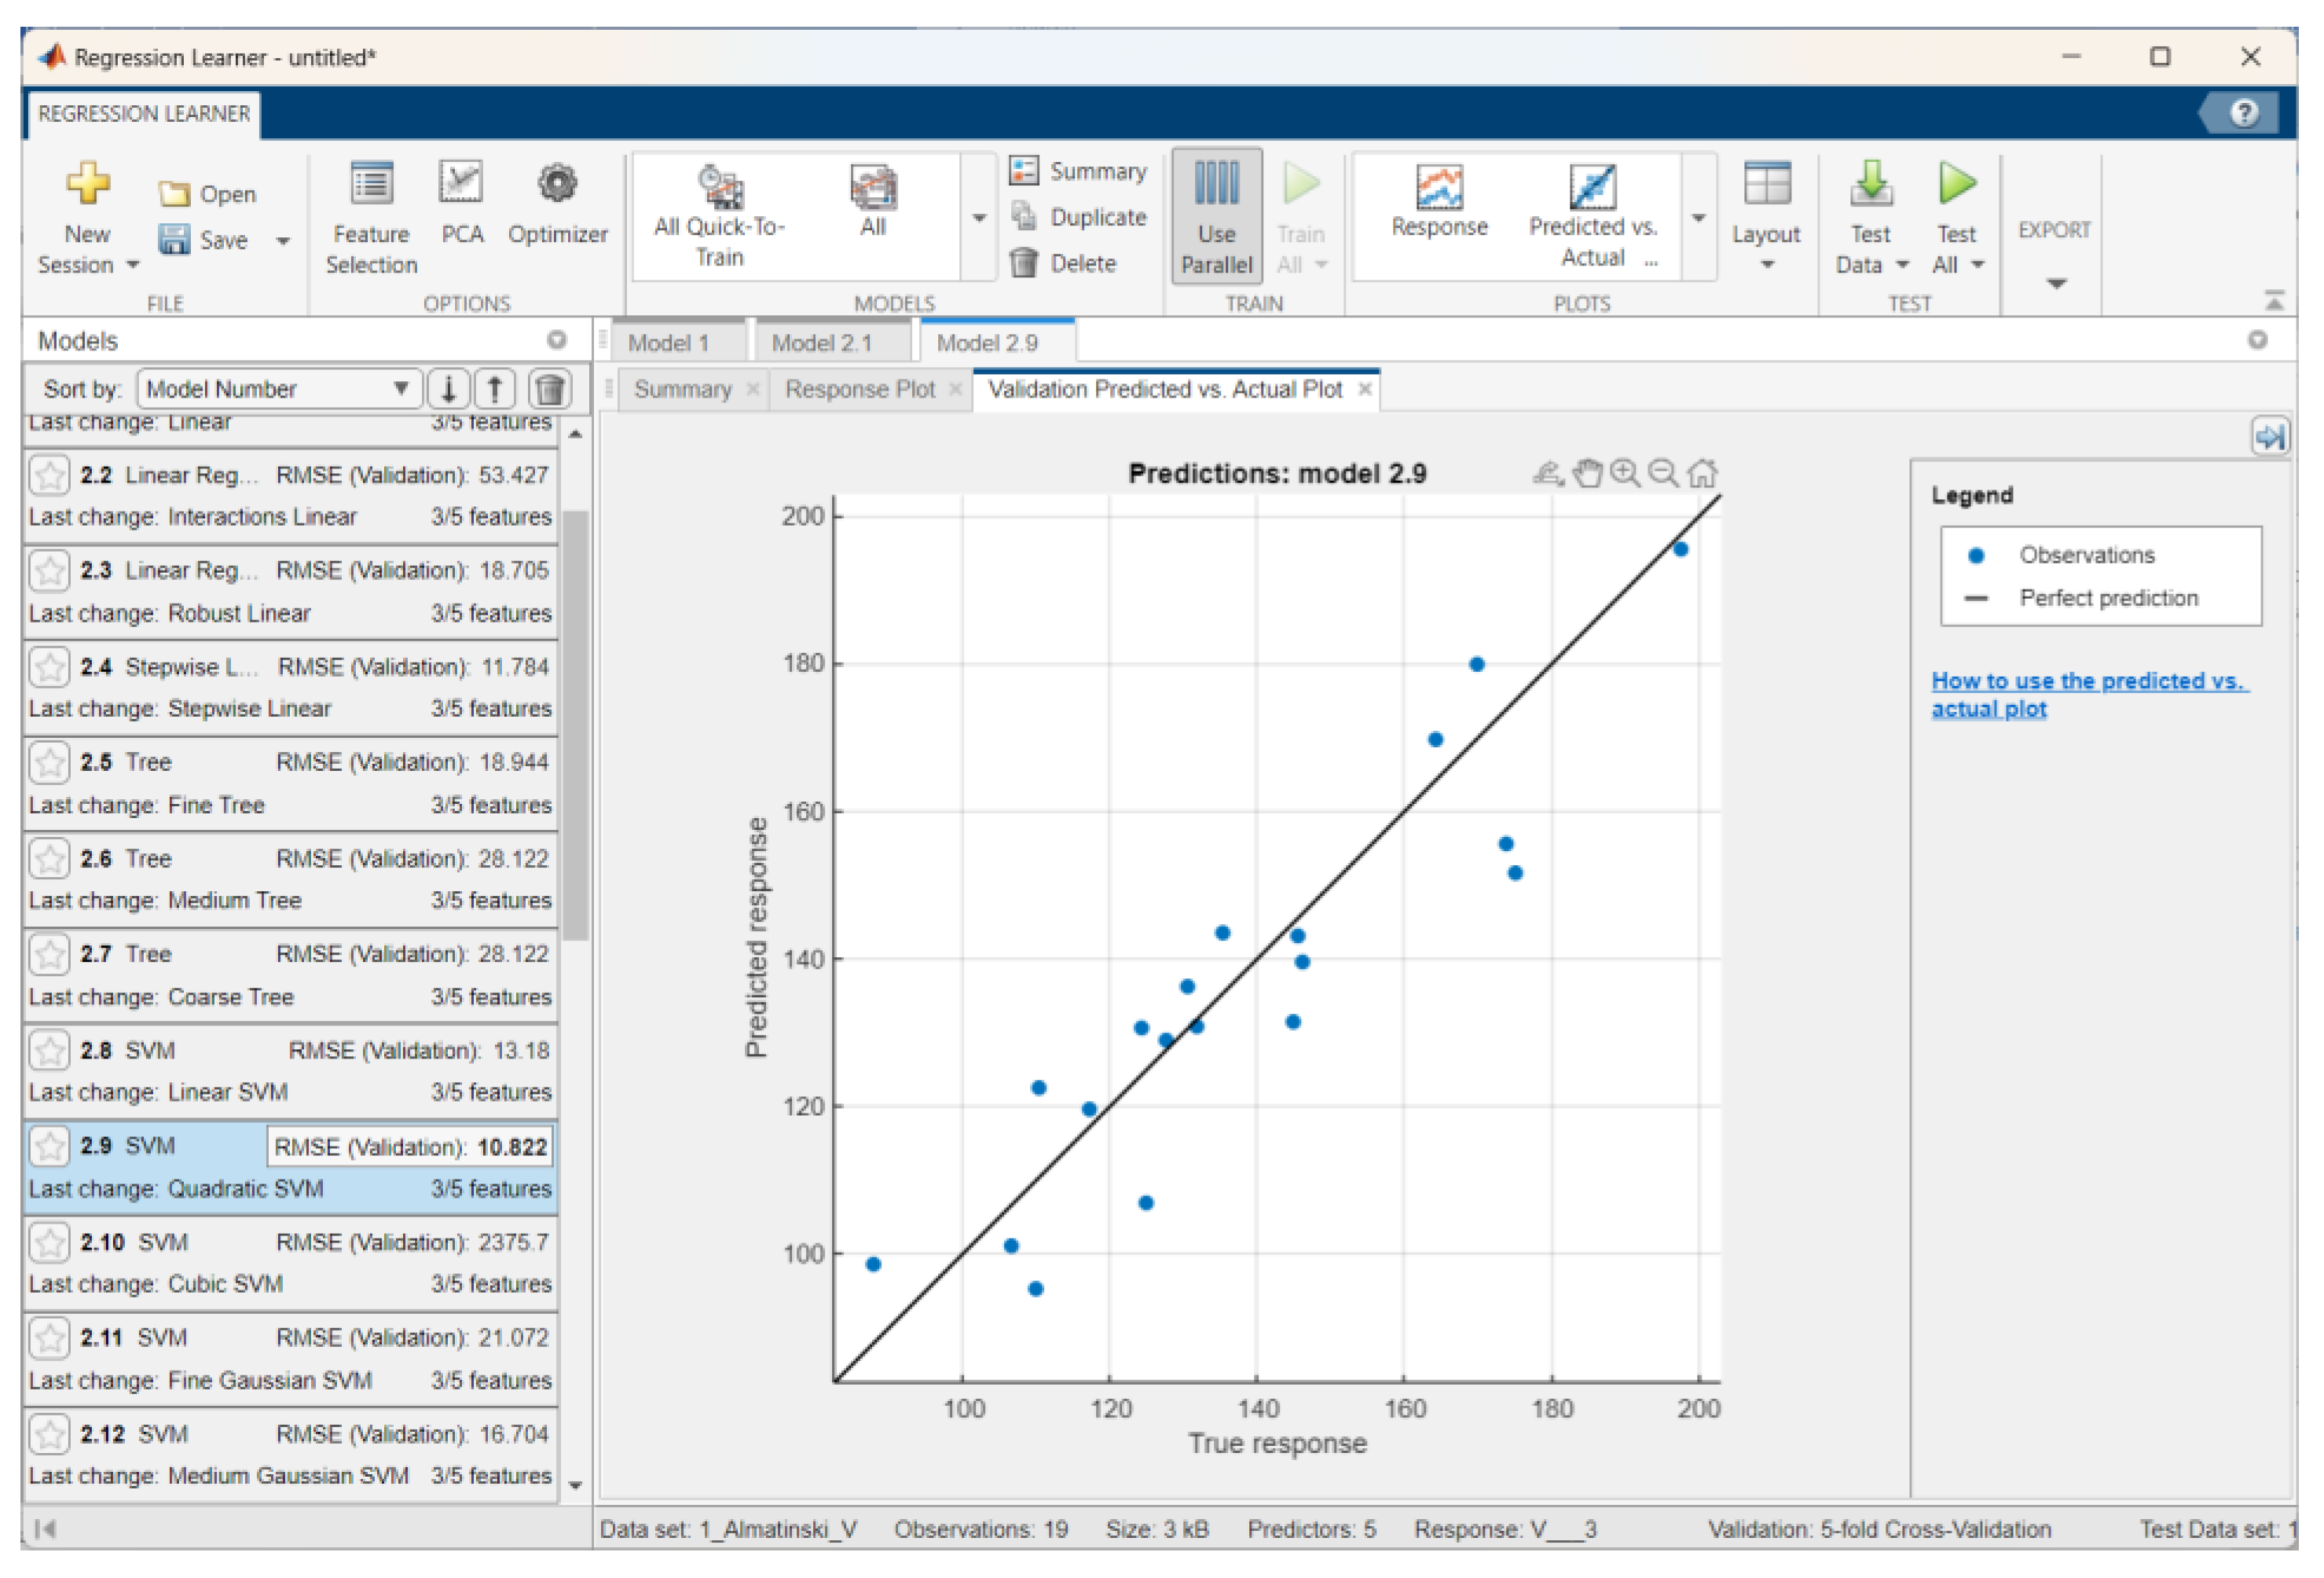
| Sinap Almatynski | Quadratic SVM | 10.82 | 0.85 | 8.81 | 1.44 | 15.49 | 0.66 | 14.49 |
| Kazakhski Yubileinyi | Linear SVM | 11.77 | 0.91 | 9.11 | 1.02 | 13.95 | 0.68 | 11.16 |
| Ainur | Robust Linear Regression | 9.49 | 0.75 | 7.58 | 0.41 | 14.28 | 0.80 | 11.93 |
| Nursat | Linear Regression | 9.84 | 0.91 | 8.12 | 5.28 | 9.65 | 0.92 | 7.96 |
Disclaimer/Publisher’s Note: The statements, opinions and data contained in all publications are solely those of the individual author(s) and contributor(s) and not of MDPI and/or the editor(s). MDPI and/or the editor(s) disclaim responsibility for any injury to people or property resulting from any ideas, methods, instructions or products referred to in the content. |
© 2024 by the authors. Licensee MDPI, Basel, Switzerland. This article is an open access article distributed under the terms and conditions of the Creative Commons Attribution (CC BY) license (http://creativecommons.org/licenses/by/4.0/).


