1. Introduction
International policy on fossil fuels leads societies to recognize the inevitable phase-out of hard coal production for energy purposes [
1]. This brings a series of consequences, particularly significant economic burdens on the facilities, but also problems with maintaining highly skilled staff and hiring new employees who want to tie their future to work in the extraction plant [
2,
3]. Training employees and gaining experience is an important process from the perspective of work safety, which is also expressed in the ability to recognize hazards, for example through accurate and reliable measurements. Numerous changes in mine ventilation networks and the extraction of hard-to-reach coal resources bring additional risks [
4]. These risks can be partially minimized through the intensification of safety controls and preventive measures concerning natural hazards. One of the natural hazards is the methane hazard, the prevention of which involves the proper regulation of the mine's ventilation network and frequent monitoring of methane concentration in the ventilation air, as well as an efficient methane drainage system [
5,
6]. Maintaining a high level of safety, with decreasing employment in the mining industry, leads to proposing new solutions that do not require highly qualified personnel and operate largely autonomously.
A proposed new solution is the Sectional Methane Hazard Detection System (System Odcinkowej Detekcji Zagrożenia Metanowego – SDZM) [
7]. This system is designed for the prevention and identification of methane hazards in the context of measuring methane concentration along underground workings. It allows for the measurement of concentrations in workings by dividing them into measurement sections. The system continuously compares the methane concentration recordings collected from individual sections and assesses the hazard.
2. SDZM Method and Algorithms
The method of sectional methane concentration measurement is based on a set of methane concentration recordings. Each recording is a time series of methane concentrations obtained while the measurer moves along the working. The set of recordings is obtained through repeated passes by individuals along the same section. The sectional methane concentration measurement method is implemented in an individual methane detector through a series of algorithms:
Sectional Pattern Selection Algorithm
Determination of Permissible Sectional Concentrations Area Algorithm
Data Classification Algorithm
Data Exchange Algorithm
These algorithms are discussed in detail in the work [
7]. In general terms, they involve supplementing and processing measurement data related to methane concentration and the location of measurement points. The hazard detection algorithms operate based on methane concentration measurements in sectional segments that are parts of the paths traversed by personnel. During personnel movement along these segments, the device measures the methane concentration and records it as data sequences in its memory. Using this data, the algorithms normalize and compare it, allowing for the assessment of the recorded methane concentration profile. This assessment pertains to the methane concentration relative to the position within the segment. The new measurement data is evaluated against the tolerance field of methane concentration changes derived from the reference profile. If the new profile falls within the tolerance field, it is considered that there are no significant methane concentration changes indicating a hazard. The choice of the reference profile is crucial in classifying the new sectional profile, hence a rule for selecting the reference profile has been established and described in the work [
7]. The algorithms enable the detection of methane accumulation or increased methane emissions along the paths or in other areas where the crew is present [
8,
9].
3. Hazard Level Analysis at the Longwall Outlet Based on Crew Movement Simulation
The analysis focused on the 841A longwall area at KWK B, which was ventilated using a "U" system with additional ventilation provided to the wall outlet. This longwall area was part of a research experiment detailed in work [
10], allowing for the identification of methane sources in the longwall area and the determination of air flow parameters and methane distribution along the longwall during cutting with a shearer through “in situ” measurements. The issue of developing a model for methane emission from the longwall face before and behind the shearer was presented in work [
11]. The developed mathematical model was modified in subsequent works [
12,
13], enabling validation studies of the model using numerical simulations of the longwall shearer operation, the longwall conveyor, and the transport of the extracted material. [
14].
The comparison of methane concentration and air velocity profiles recorded by the mine monitoring system with the corresponding methane concentration and air velocity profiles obtained from computer simulations allowed for the conclusion that it is possible to reproduce the temporal profiles of air velocity and methane concentrations for the longwall area. This indicates that many of the adopted models and algorithms are correct [
14,
15,
16].
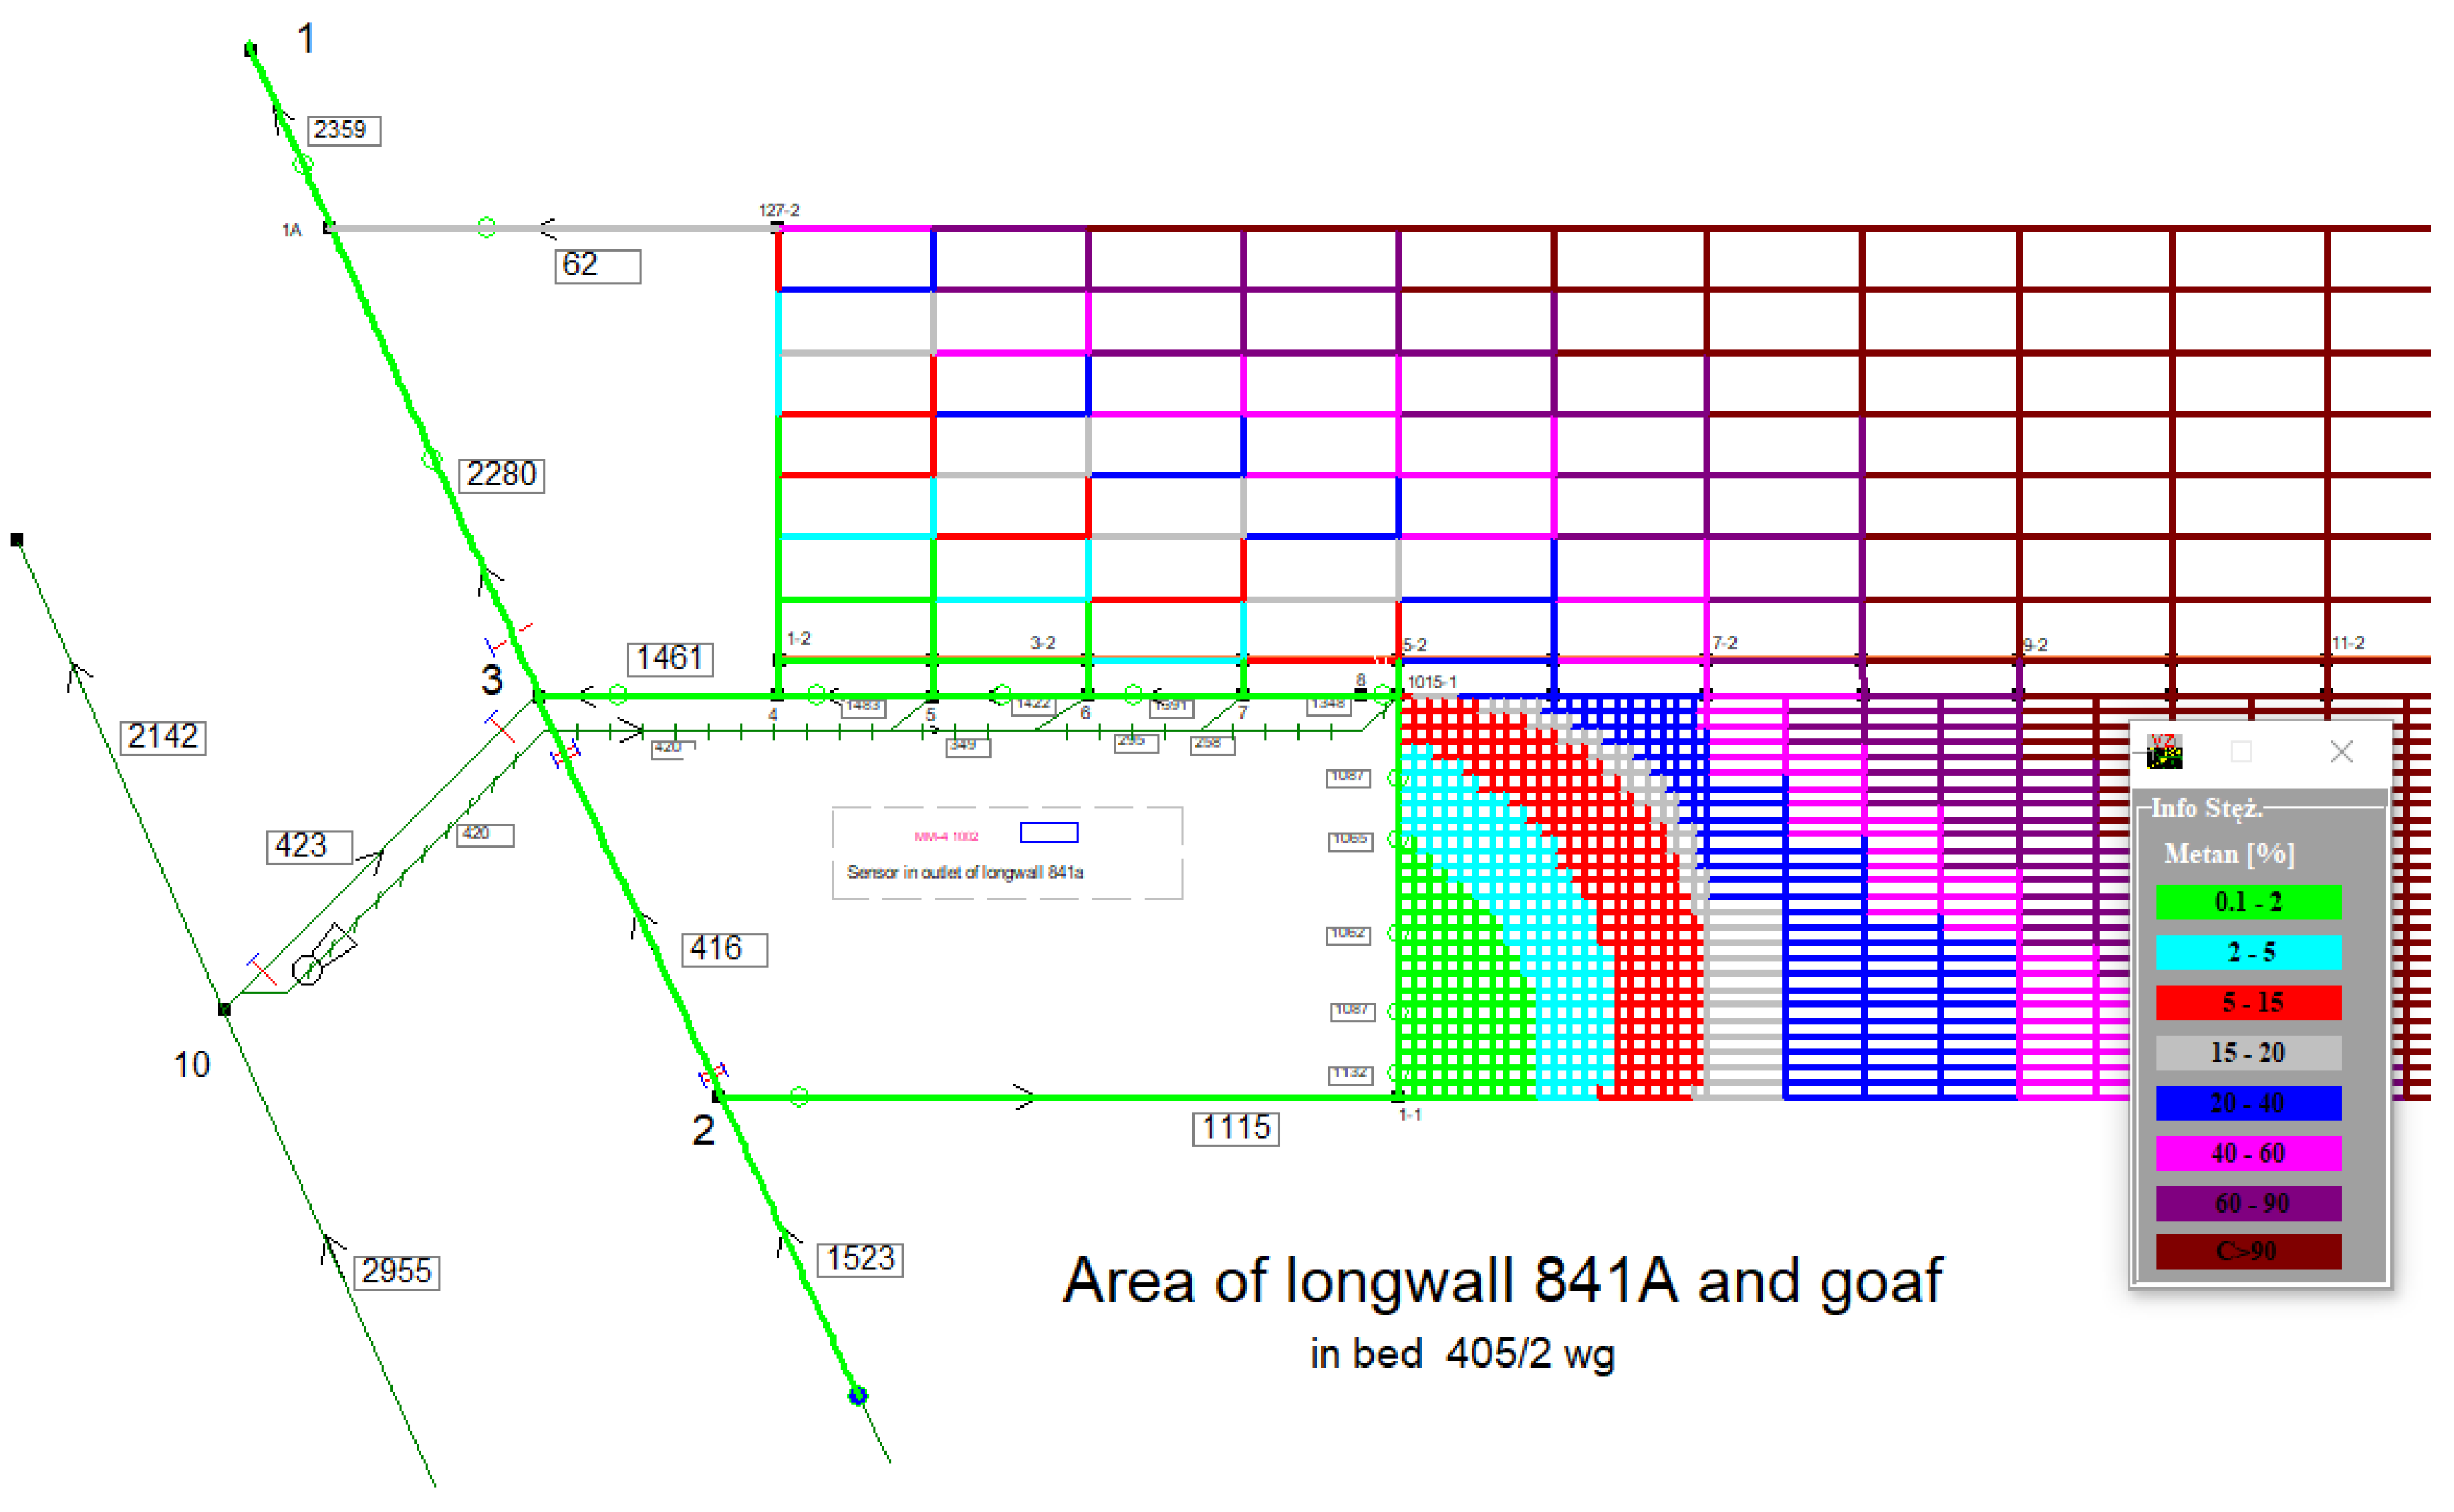
As an example of airflow and methane flow simulations in the 841A longwall area and the area of the decommissioned 841B wall, as well as their abandoned working areas under the conditions of longwall cutting with a shearer, a database containing the parameters of the applied mathematical model was used. This database was supplemented with parameters of the shearer speed control algorithm [
14]. The developed numerical model of the longwall area is shown in
Figure 1. Longwall 841A, exploited using the longwall system, was ventilated in a “U” pattern along the coal face. The wall had a length of 130 meters, an average height of 2.9 meters, and a face advance of 550 meters. The methane hazard category was IV. The transport of the extracted material was carried out by a conveyor belt with a speed of up to 2.0 m/s. The 841A longwall area in seam 405/2 was characterized by an absolute methane emission of 18.1 m³ CH₄/min. The average methane drainage efficiency assumed in the technical project for wall exploitation was 35%. The amount of air at the inlet to the wall was 1115 m³/min. The outlet from the longwall was refreshed (263.5 m³/min) using a duct that delivered fresh air to the decommissioned section behind the longwall. The total airflow at the outlet of the ventilation roadway was 1461 m³/min. Along the upper wall roadway, connections with the abandoned working areas of the decommissioned adjacent longwall 841B were included, in the form of segments placed every 5 meters. Therefore, methane emissions from the longwall, the extracted material, and the abandoned working areas of both longwalls were considered. In the lower longwall roadway, methane emissions from the transported material on the conveyor belt were also taken into account.
The developed numerical model allowed for the determination of the methane concentration distribution in the ventilation pathways of the area, which formed the basis for further research aimed at obtaining a data source for inferring methane hazards based on the operation of individual methane detectors working according to the algorithms of the Methane Hazard Detection System.
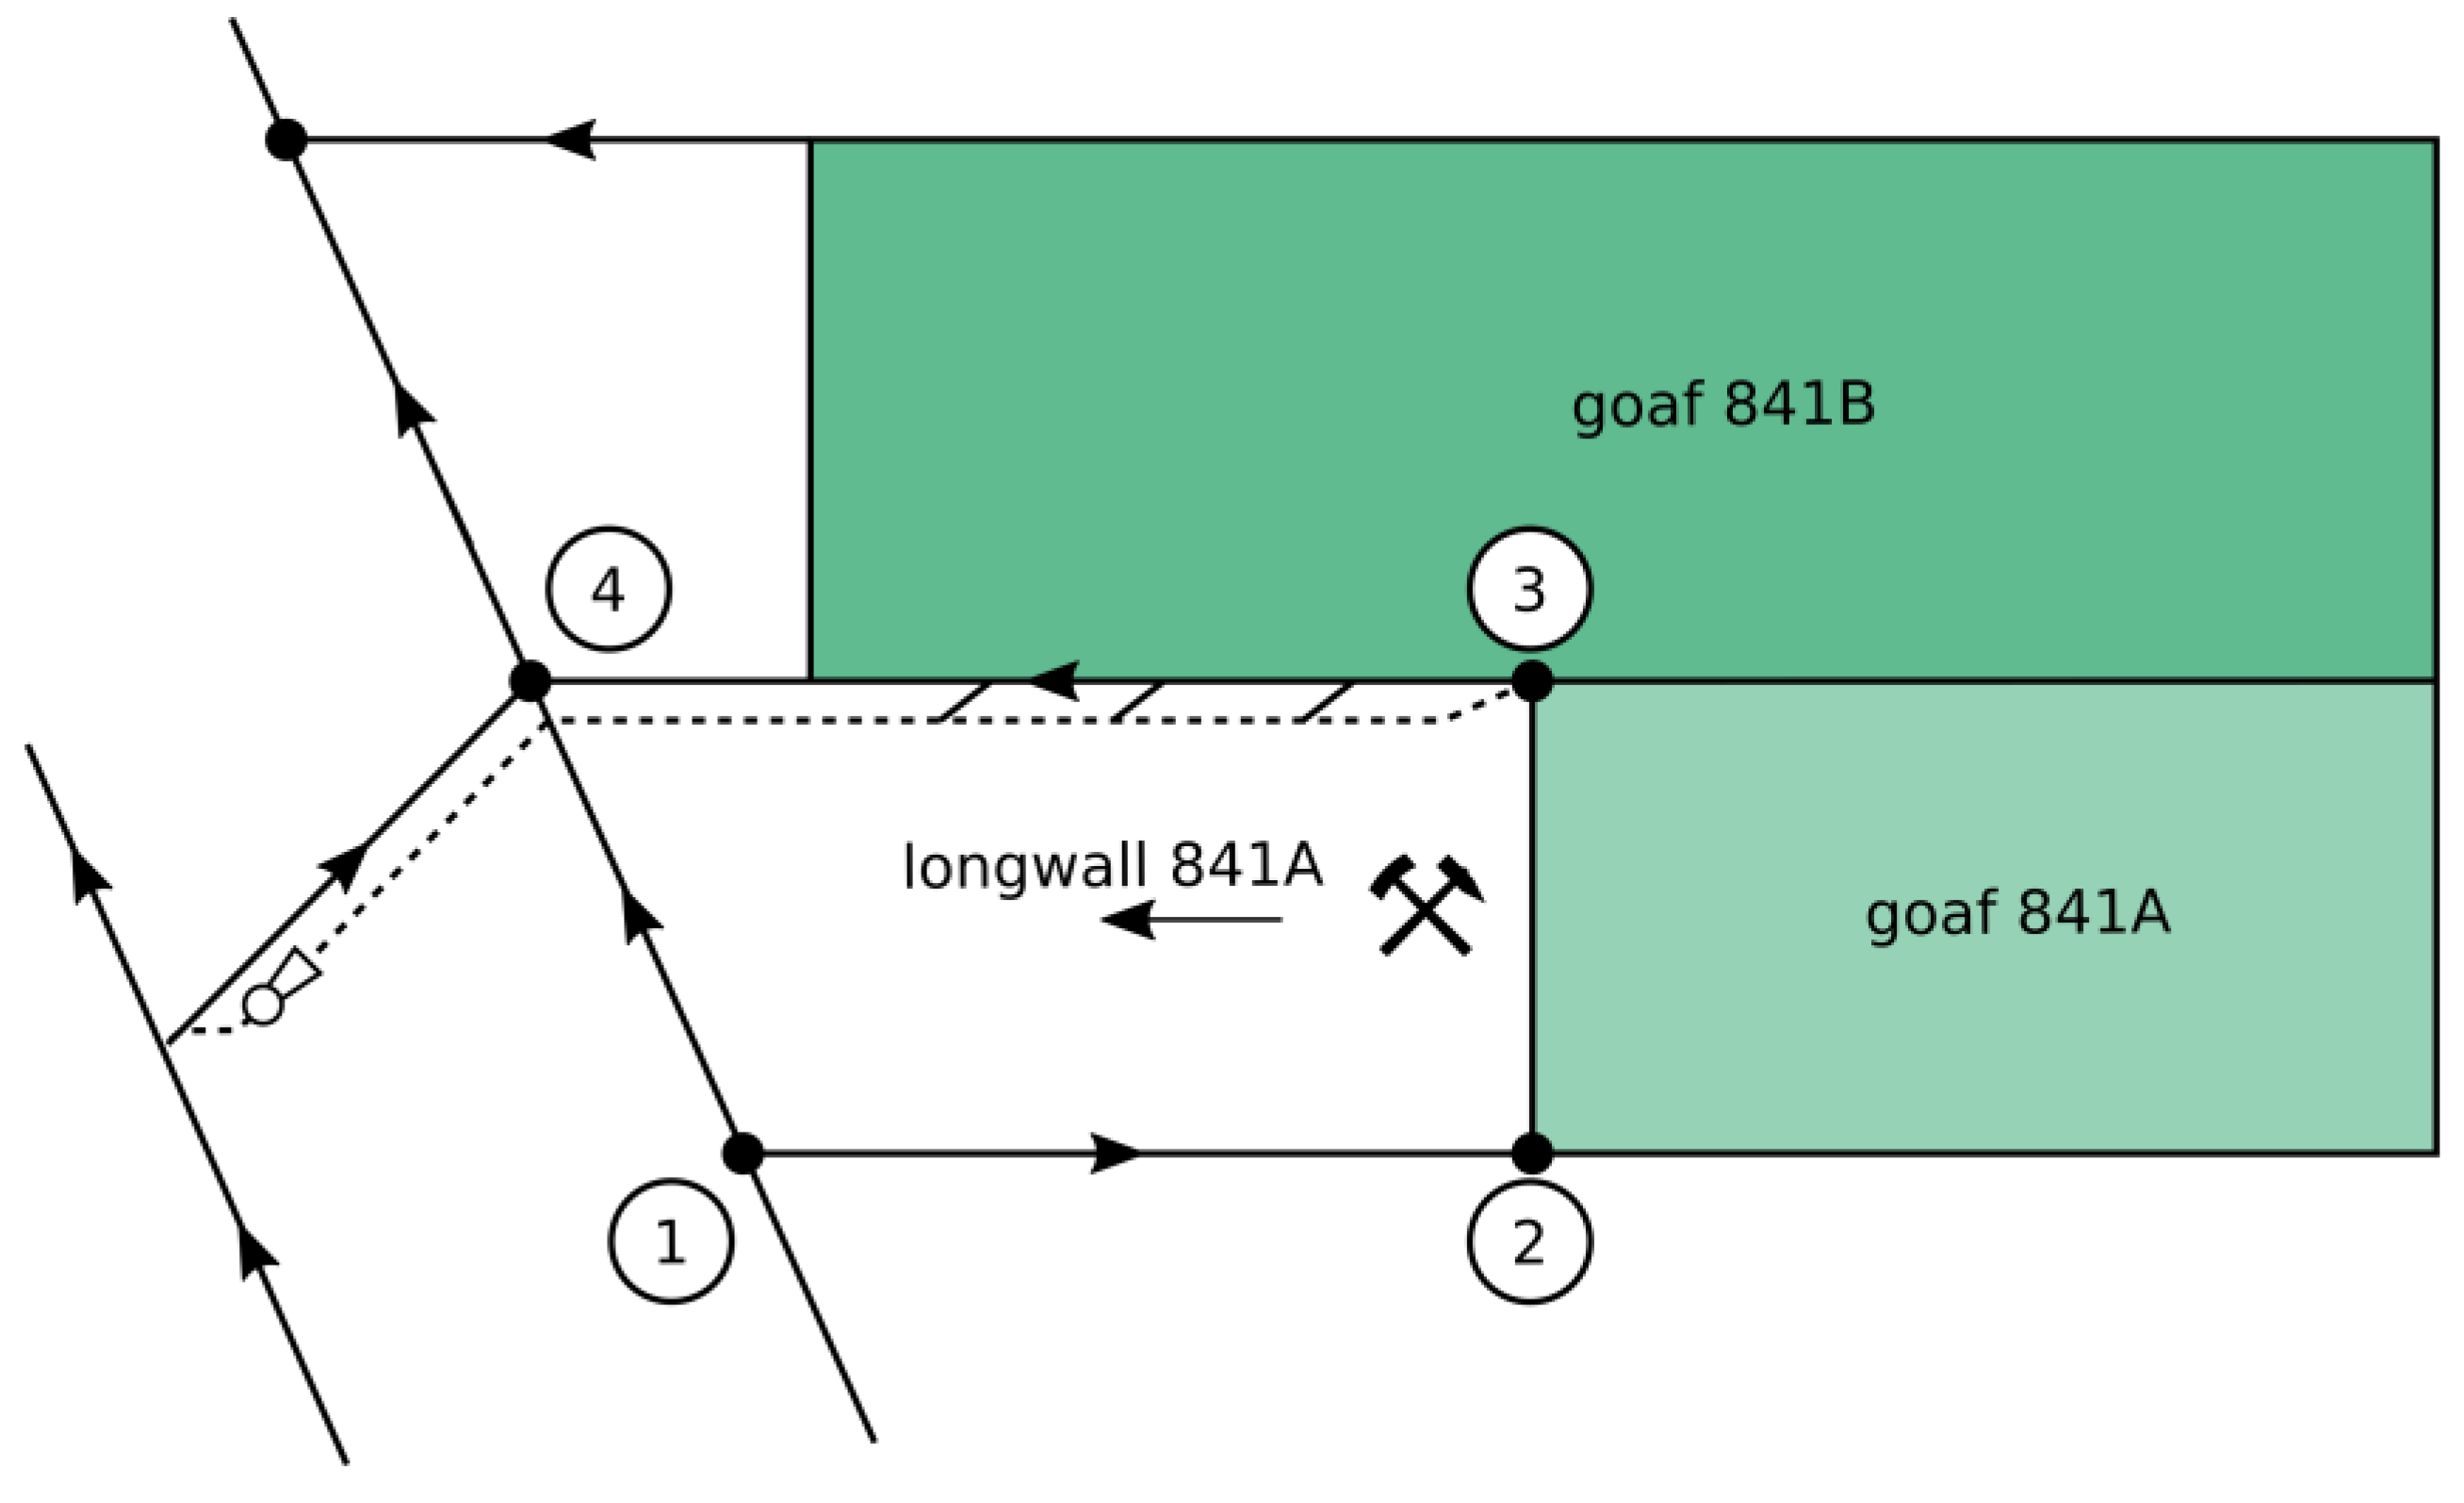
Figure 2 shows the working ventilation schematic useful for further research.
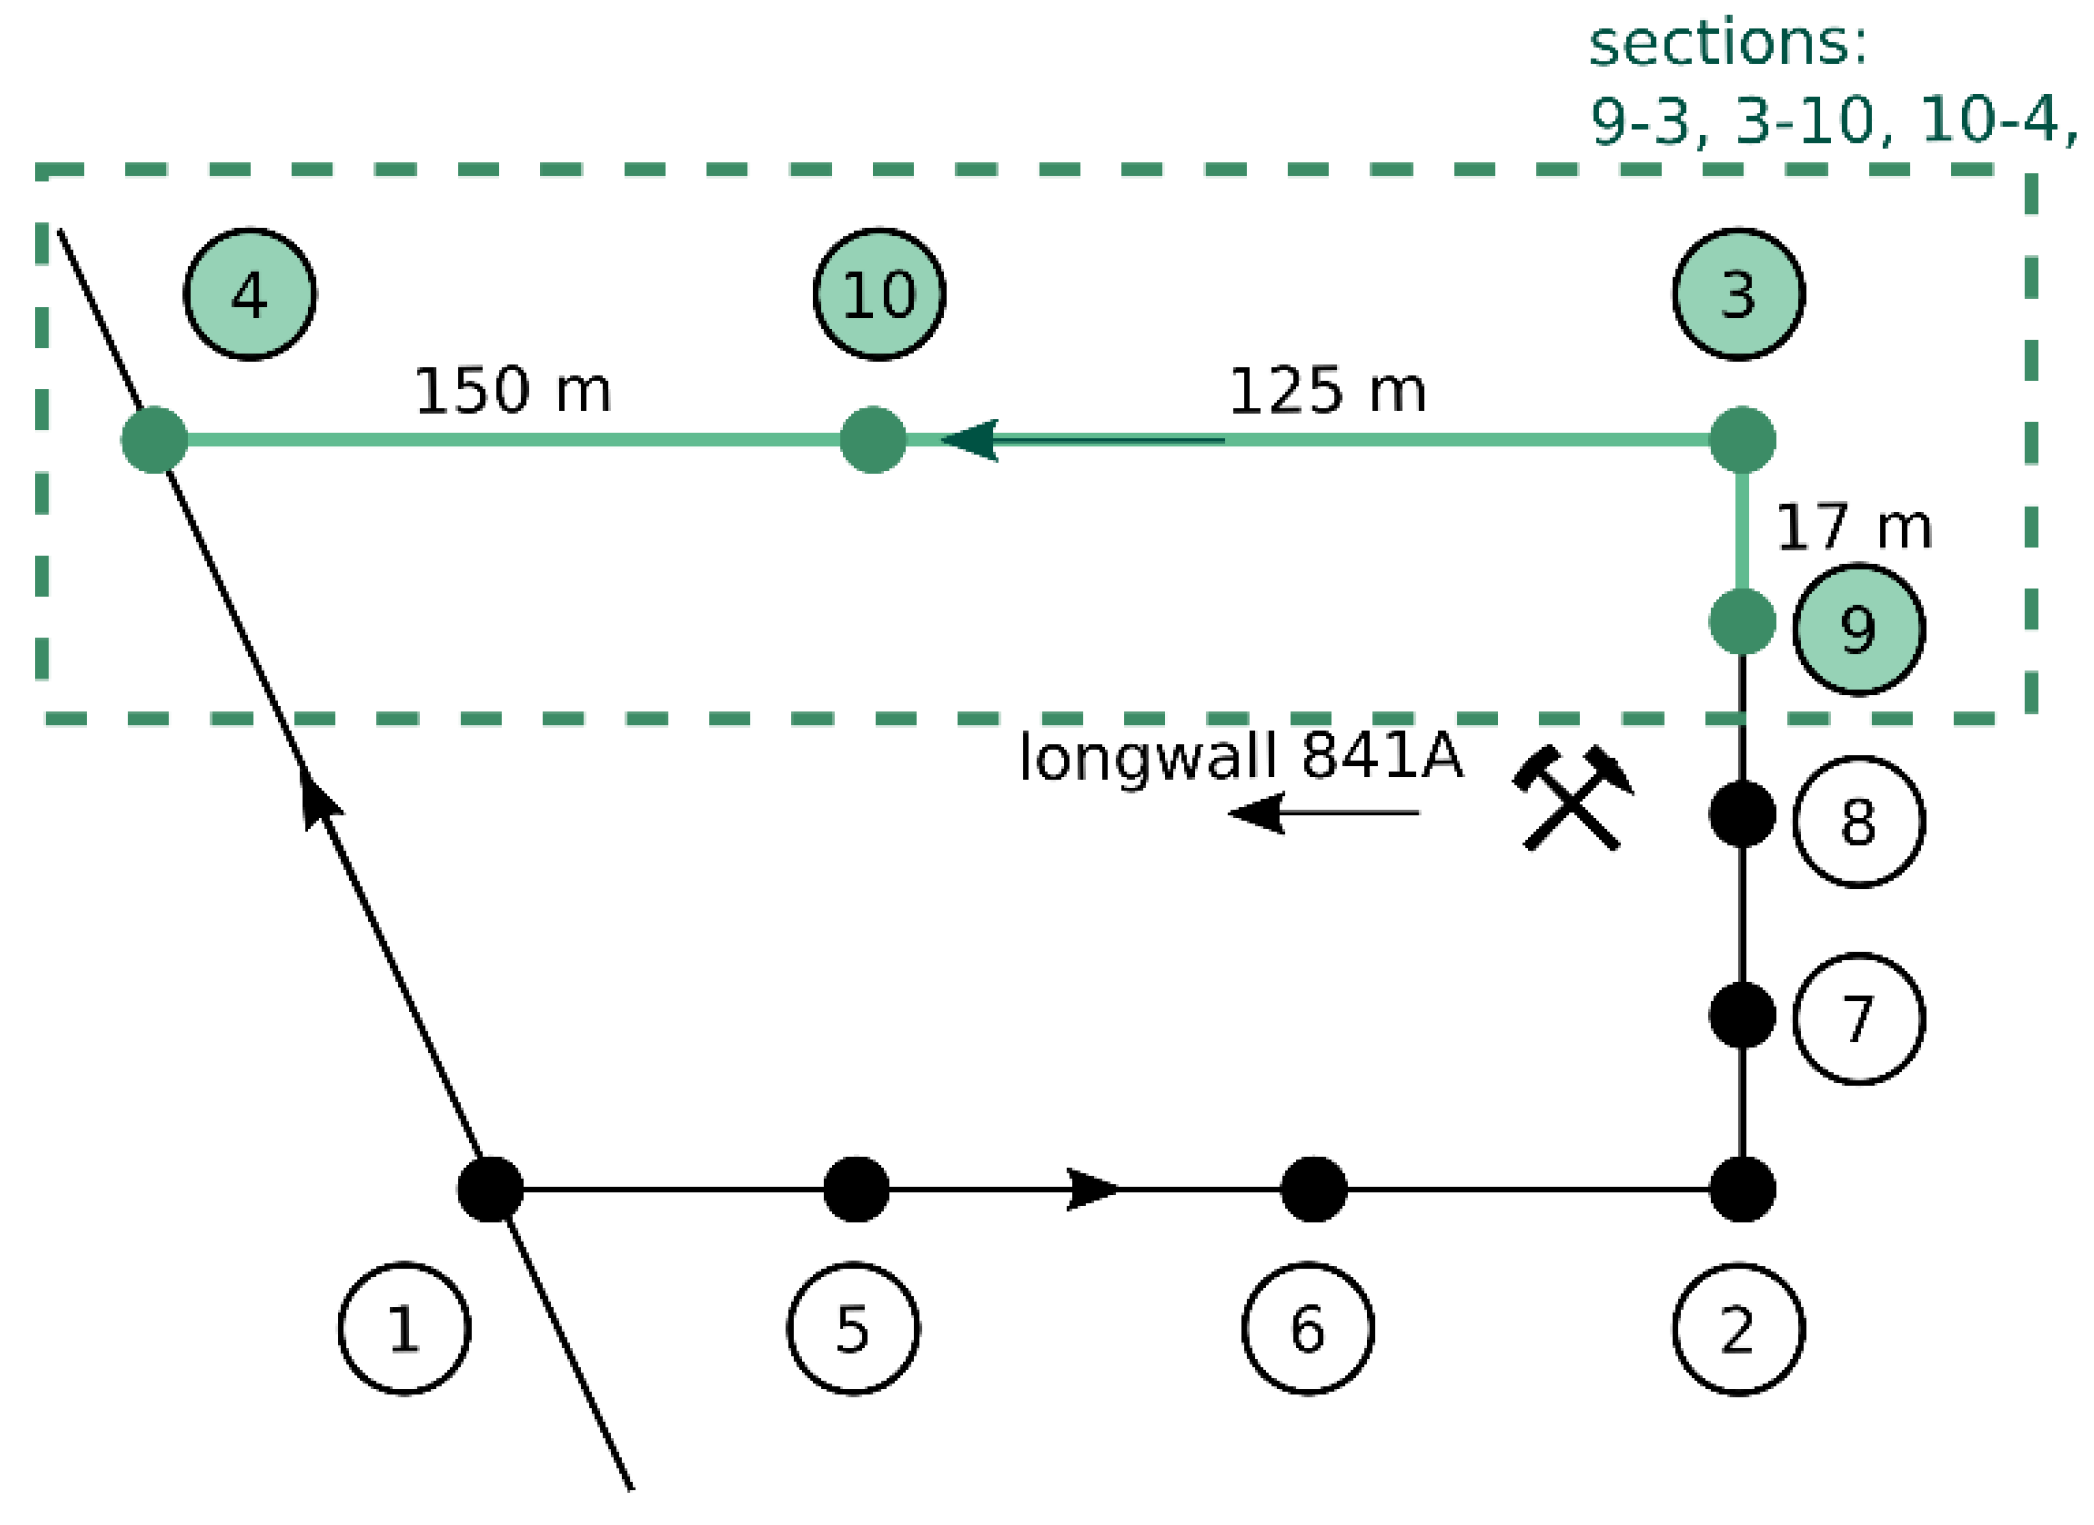
The route taken by the miners included the upper longwall roadway and the last section at the longwall outlet, which is marked in green in
Figure 3.
The route included nodes 9 to 4 according to the diagram (
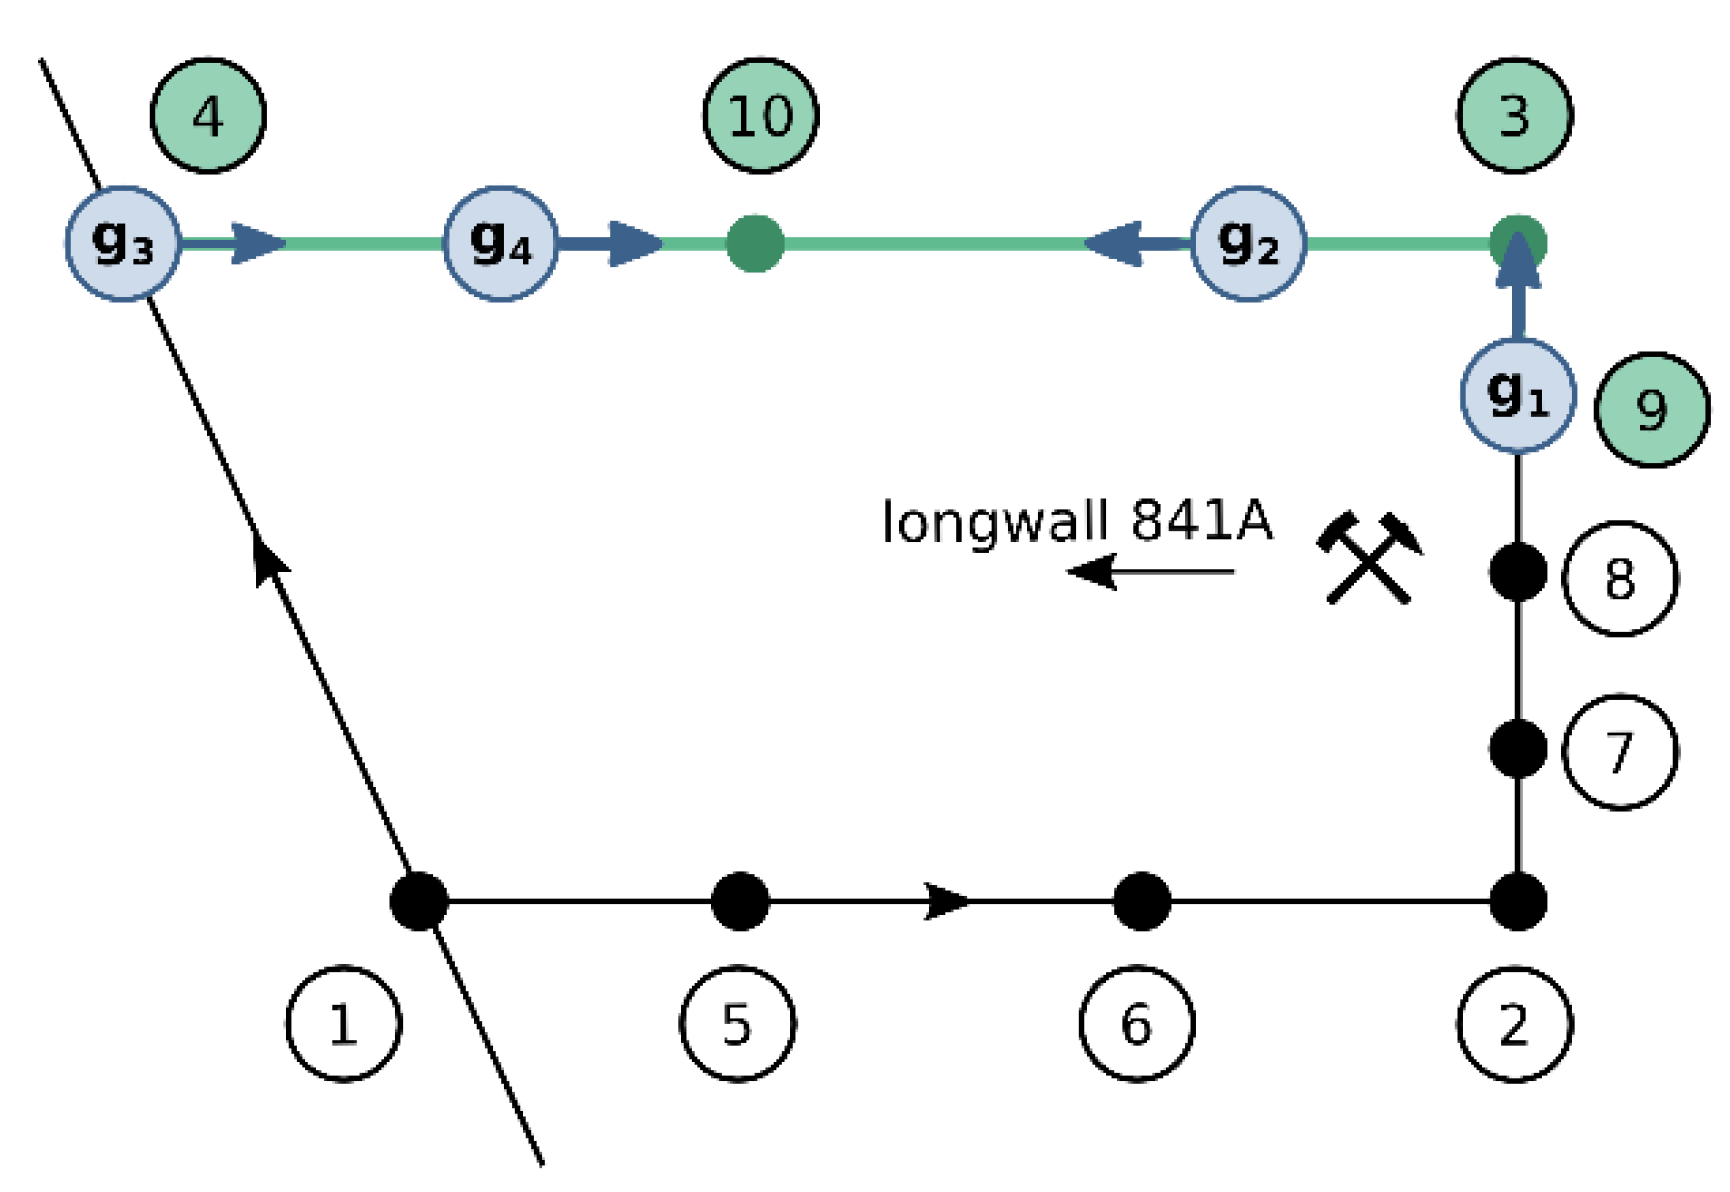
Figure 3). The total length of the route was 584 meters, including both directions. The route was assigned to four miners, each given equal traveling speeds but different starting positions (
Table 1.).
The route recorded as a node list is as follows: 9, 3, 10, 4, 10, 3, 9. Node number 9 serves as both the start and end of the route.
The initial positions of the miners and the directions of movement are plotted on the diagram below:
The miners moved cyclically along a preset route. The flow conditions and methane concentrations at each point of the route varied according to the Ventgraph program simulation.
The miners' travel time was 6 hours and 26 minutes.
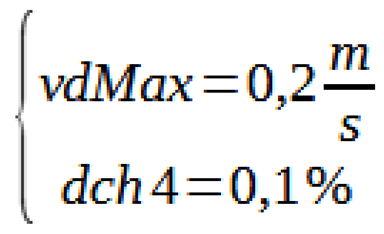
The analysis adopted parameters for the methane concentration tolerance field:
The search for the reference profile for methane hazard assessment was based on the last 30 sectional data. The simulation parameters adopted allowed for good detectability of high-level hazards.
4. Results
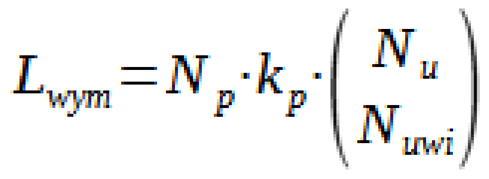
The sectional data stored in the miners' devices mostly overlap; differences only concern the last recorded data, which the devices did not manage to transmit before the end of the simulation. Within one route traversal, there were 8 data exchanges. In general, the number of data exchanges can be expressed by the formula:
where:
Lwym – number of data exchanges, Np - number of route traversals, kp equals 1 when the route traversal occurs only in one direction, kp equals 2 when the route traversal occurs in both directions, Nuwi - number of devices with which direct information exchange can occur.
For a single route traversal, in the analyzed case, we obtain:
Below are the results of hazard assessment by one of the devices (miner device No. G1), noting that the results of the other devices do not significantly differ. Depending on the section assessed for hazard, the results varied – the closer to the longwall, the more often the devices indicated a high level of hazard.
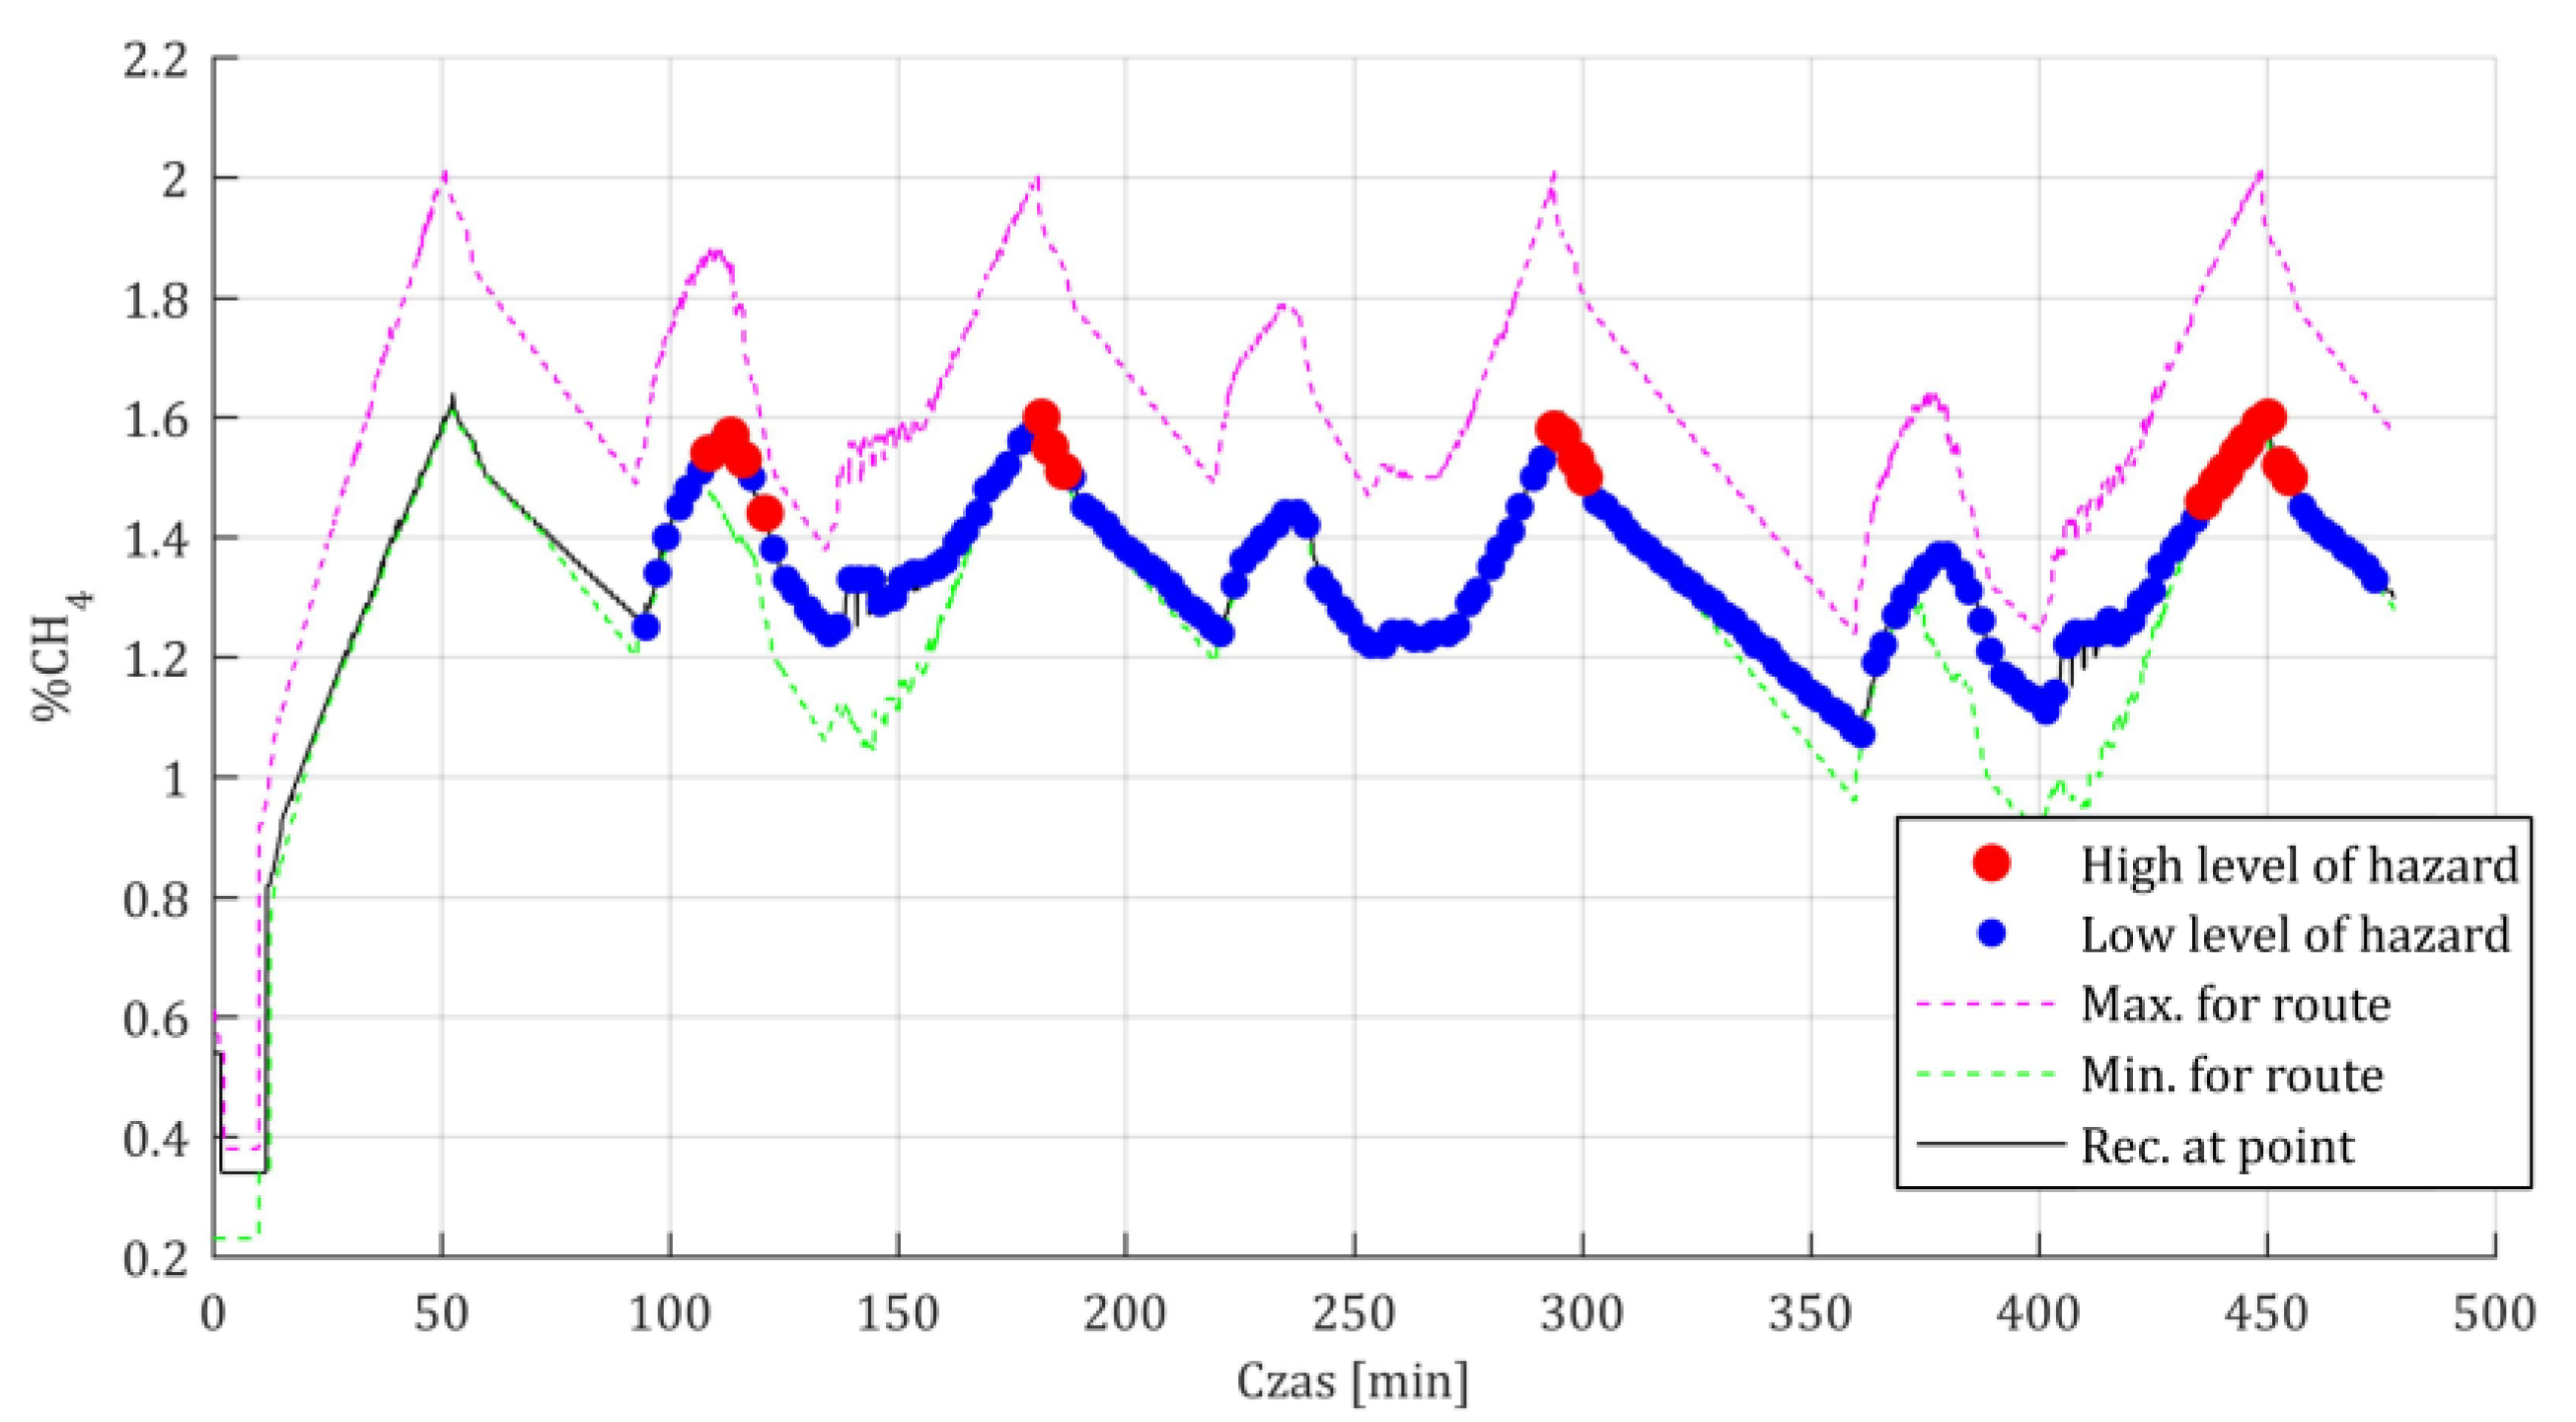
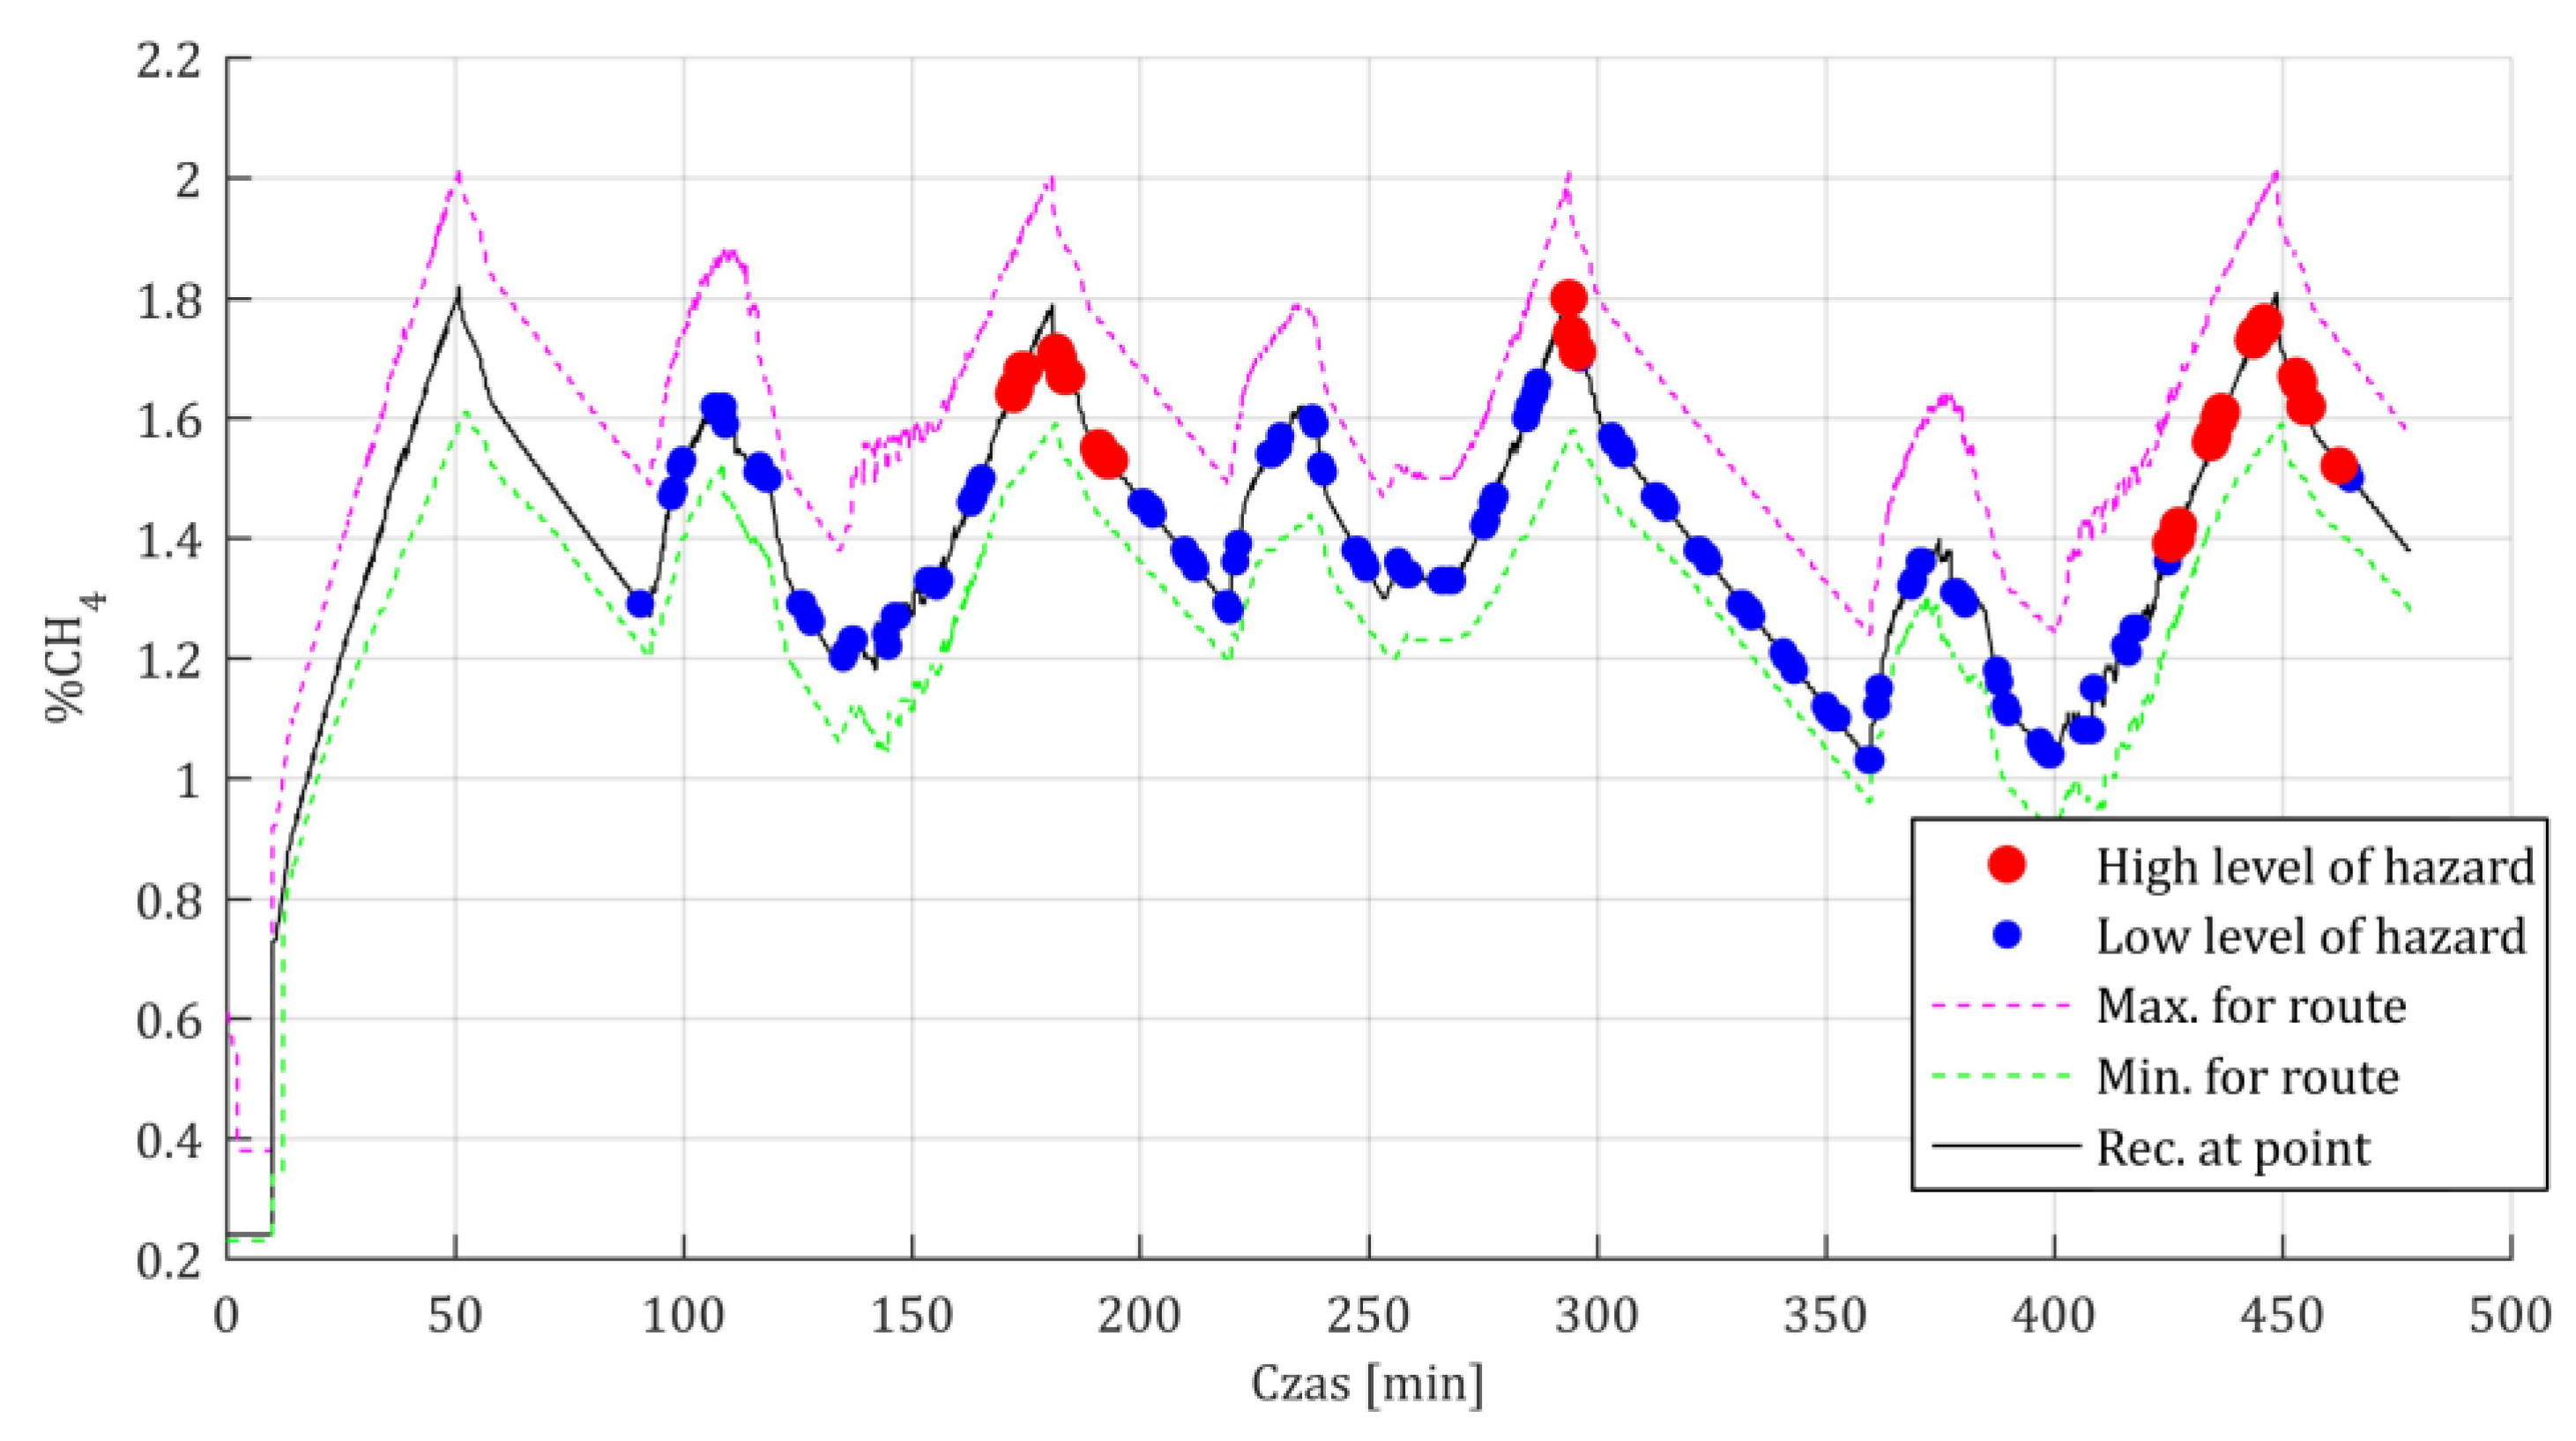
In the figure (
Figure 5), the black line represents data from a virtual sensor placed at the 75th meter of section 4-10, which is halfway along the length of the section. Onto this line, points corresponding to the hazard level were plotted, with the hazard assessment ending at the time corresponding to the position of this point on the time axis. A high hazard level is indicated by red color in 4 groups of sectional records, each occurring near a local maximum. In total, a high hazard level was observed in 20 cases.
In the figure (
Figure 6), similar to the previous one, the hazard level assessment is overlaid on the methane concentration profile for a selected point on the section. In this case, it was a point on section 3-10, located 62 meters from node number 3. A high hazard level was observed in 16 cases.
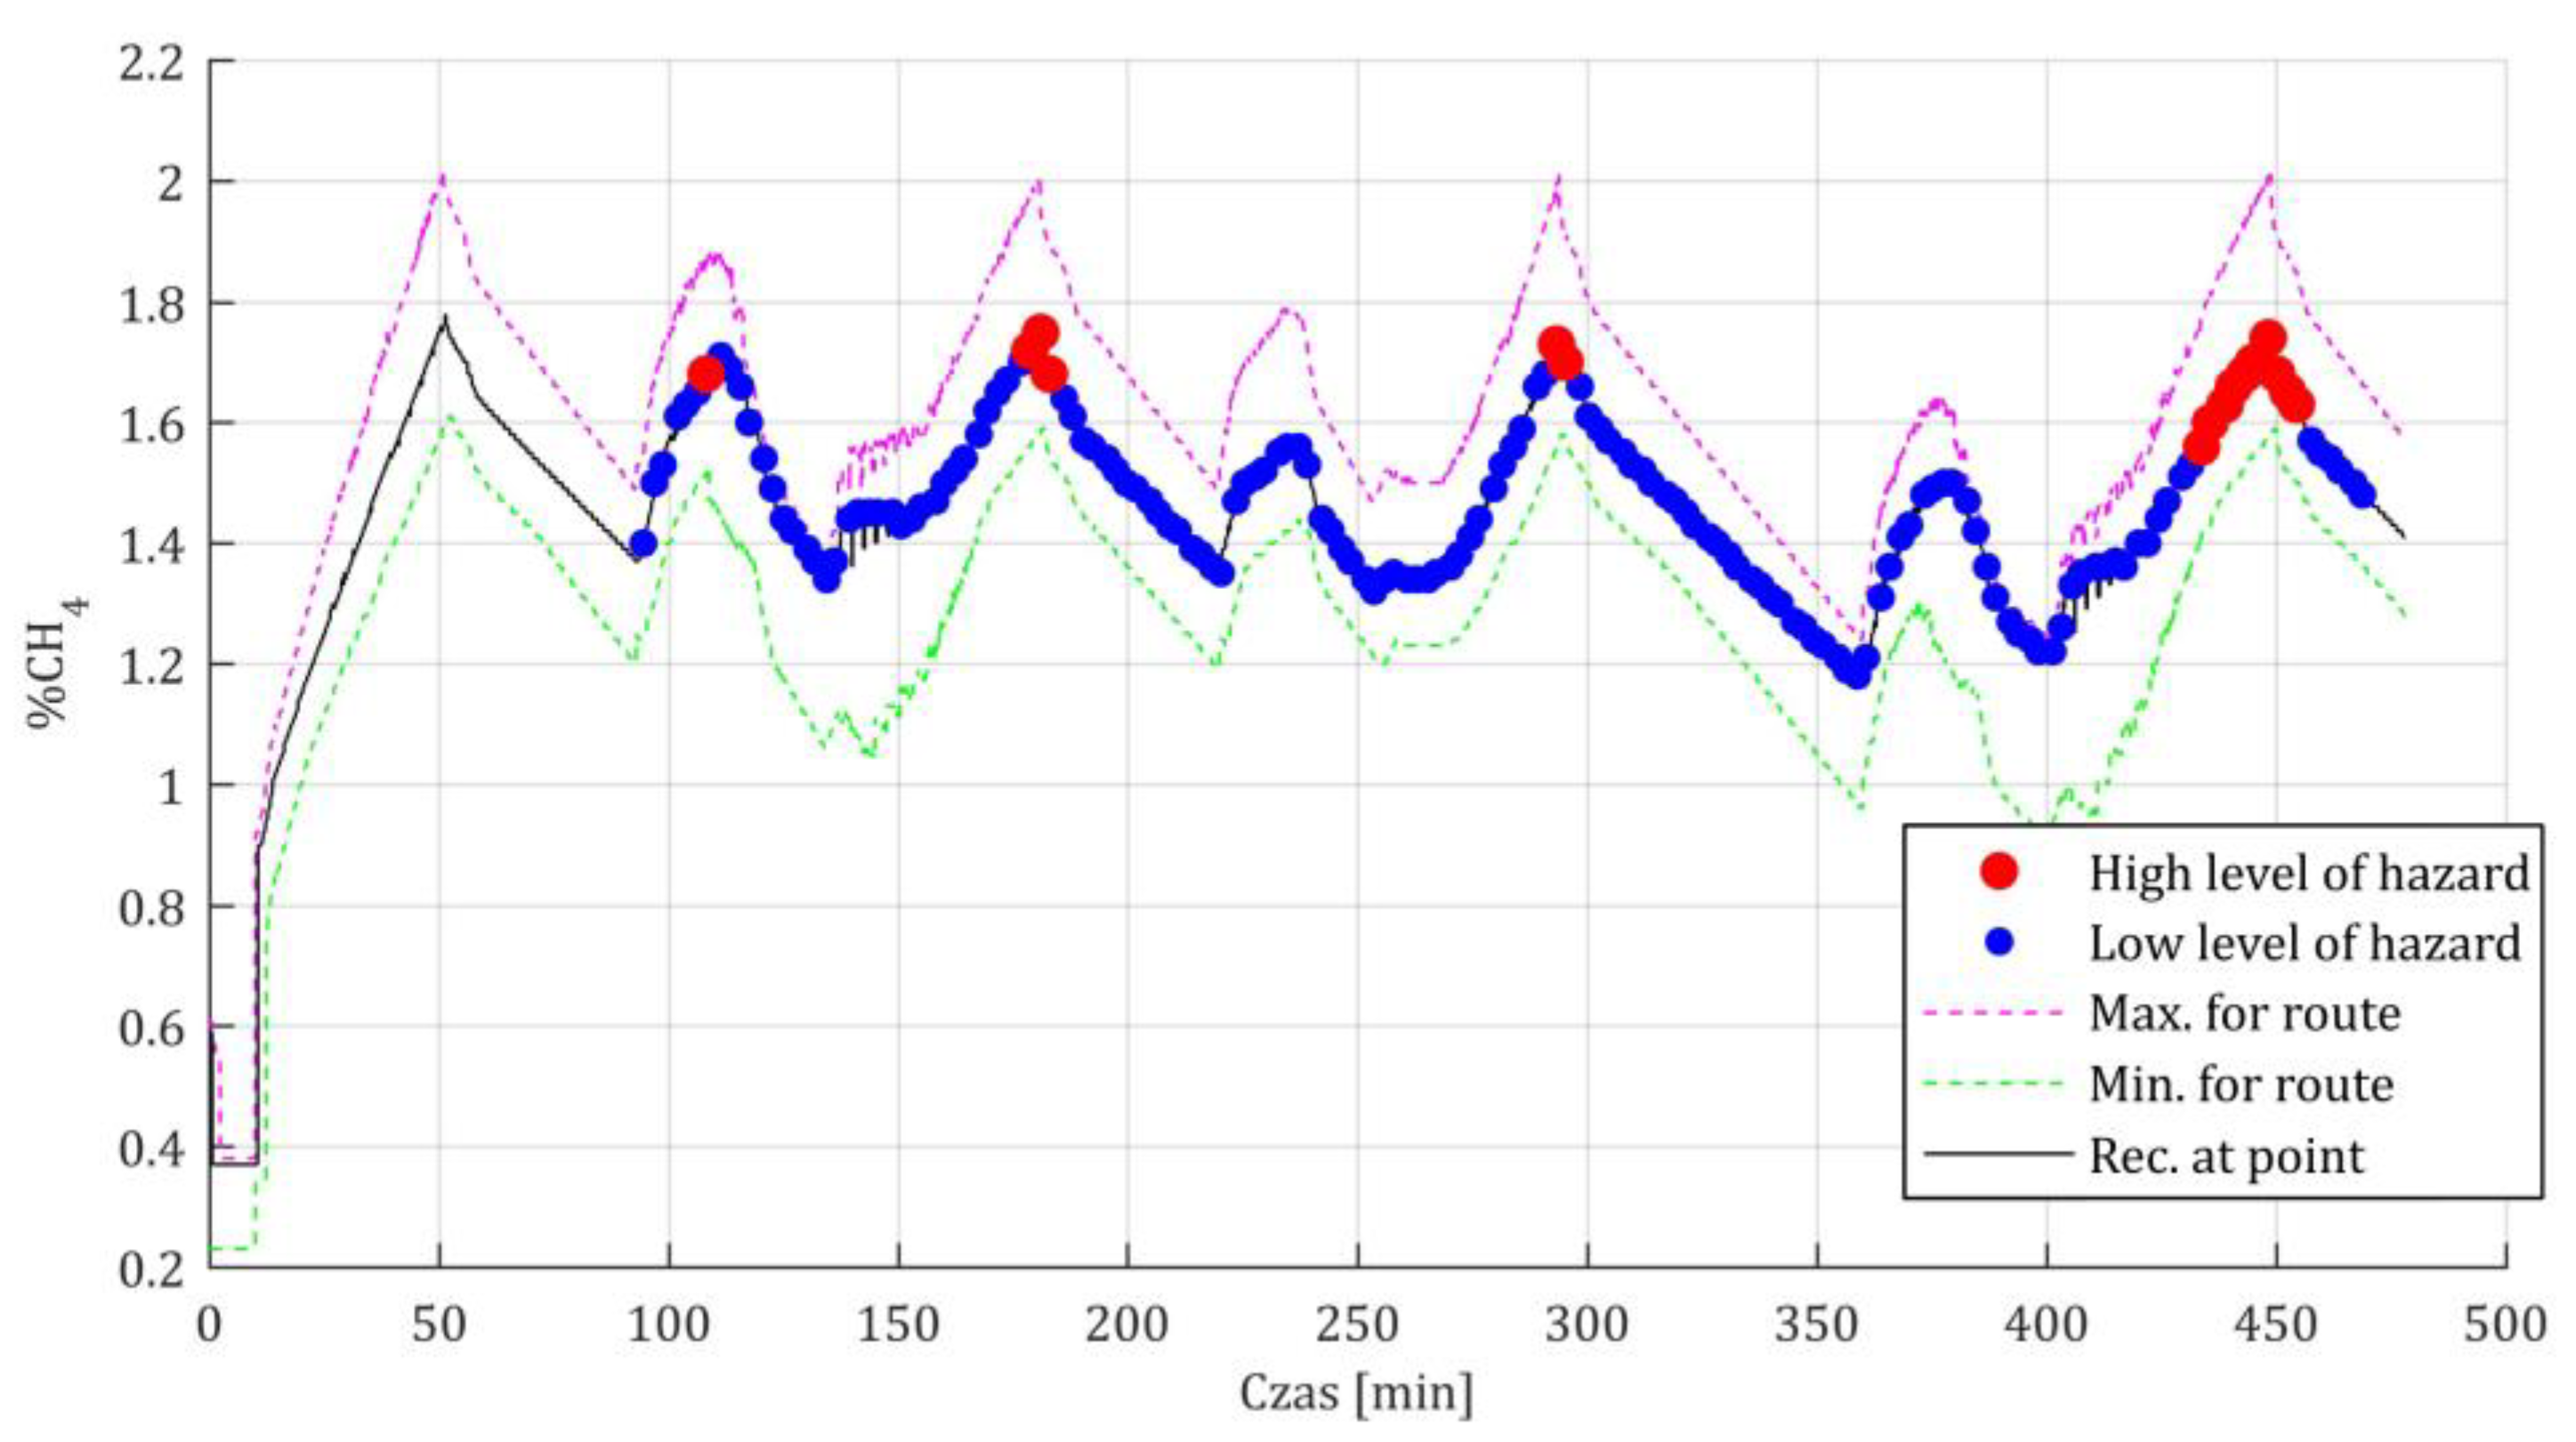
In the figure (
Figure 7), similar to the previous ones, the hazard level assessment is overlaid on the methane concentration profile for a selected point on the section. In this case, it was a point on section 9-3, located 8 meters from node number 9. A high hazard level was observed in 31 cases. Next, a sensitivity analysis of hazard detectability was conducted based on two factors: the value of the dch4 parameter and the number of historical data points considered by the algorithms. The dch4 coefficient, related to the tolerance field width and the accuracy of the methane detectors, was set at 0.2% in the first case and 0.1% in the second case. The number of sectional data points considered in determining the sectional pattern was also varied – in each case, 10, 30, and 50 sectional data points for each section were considered. The results are presented in
Table 2.
Table 2 contains the results of further calculations for different parameters of the hazard detection algorithm operation. The hazard assessment was conducted for methane concentration tolerance fields (dch4) of 0.2% and 0.1%. A higher concentration tolerance resulted in decreased hazard detectability, which was an expected outcome. It was noted that for the narrower methane concentration tolerance field, the hazard detectability remained at a similar level for the three cases examined: 10, 30, and 50 sections back. This indicates that the sectional pattern was similar to many others remaining in memory, meaning the change in the sectional pattern did not significantly affect the hazard assessment, which is a positive result. For the wider tolerance field (dch4=0.2%), the results for the detectability of high hazard levels for the smallest number of sections (10 sections back) stood out clearly, indicating significantly fewer sections with high hazard levels than in the other cases.
5. Conclusions
The methane hazard detection algorithms were tested on the simulation output data of methane concentration distribution along the ventilation paths in a selected coal mine. The simulation results of methane concentration distribution were previously validated based on actual measurement data from the gas monitoring system. The simulation studies allowed for understanding the working conditions of the algorithms, such as the minimum number of data points required for an accurate hazard assessment, which should be at least 30 records for each analyzed section. Narrowing the tolerance field by adjusting the dch4 parameter results in greater sensitivity of the algorithms, thus leading to more detected instances of high methane hazard levels. Further narrowing of the tolerance field could result in false positives, indicating high hazard levels where the actual level is low. The SDZM system does not require new skills from the mine personnel, and its implementation and use can facilitate the detection of methane hazards and identify potential danger zones.
The authors declare that they have no conflict of interest.
References
- Communication from the Commission to the European Parliament, the European Council, the Council, the European Economic and Social Committee and the Committee of the Regions — The European Green Deal (COM(2019) 640 final, 11.12.2019).
- Blankenship, B.; Aklin, M.; Urpelainen, J.; Nandan, V. Jobs for a just transition: Evidence on coal job preferences from India. Energy Policy 2022, 165. [Google Scholar] [CrossRef]
- Frankowski, J.; Mazurkiewicz, J.; Sokołowski, J. Mapping the indirect employment of hard coal mining: A case study of Upper Silesia, Poland. Resources Policy 2023, 83. [Google Scholar] [CrossRef]
- Musioł, D. Changes into structures of ventilation nets in coal mines under restructure process. Zeszyty Naukowe Politechniki Śląskiej, Górnictwo 2008, 286, 1798. [Google Scholar]
- Szlązak, N.; Obracaj, D.; Borowski, M.; Swolkień, J.; Korzec, M. Monitoring and controlling methane hazard in excavations in hard coal mines. AGH Journal of Mining and Geoengineering 2013, 37. [Google Scholar] [CrossRef]
- Krause, E.; Skiba, J. Formation of methane hazard in longwall coal mines with increasingly higher production capacity. International Journal of Mining Science and Technology 2014. [Google Scholar] [CrossRef]
- Ostrogórski, P. Ocena i detekcja zagrożenia metanowego w oparciu o rozproszony system bezprzewodowy, Phd Thesis, Instytut Mechaniki Górotworu Polskiej Akademii Nauk, (2022).
- Ostrogórski, P.; Skotniczny, P.; Pucka, M. Measurements of the Methane Concentration along the longwall excavations and longwall. Arch. Min. Sci. 2022, 67. [Google Scholar] [CrossRef]
- Ostrogórski, P.; Skotniczny, P. Methane Emission Measurements Along Underground Galleries of Coal Mine. Arch. Min. Sci. 2024, 69. [Google Scholar] [CrossRef]
- Dziurzyński W, W.; at, al. 2009: Content-related preparation and execution of an research experiment in the exploitation longwall of high natural and technological hazard level aimed to acquire data for the verification of the mathematical model of methane concentration distribution while mining with combined cutter loader. Stage 1. Elaboration of assumption data and guidelines for the research experiment in the 841a longwall area, 405/1 seam, in Bielszowice mine – in Polish]. Report of IMG PAN, Kraków - April 2009.
- Blecharz, B.; Dziurzyński, W.; Krach, A.; Pałka, T. Symulacja przepływu mieszaniny powietrza i metanu w rejonie ściany, z uwzględnieniem procesu urabiania i odstawy węgla. Mechanizacja i Automatyzacja Górnictwa, 3-4, (2003).
- Dziurzyński, W.; Krach, A.; Pałka, T.; Wasilewski, S. Walidacja komputerowego programu symulacji wentylacji VentMet dla rejonu ściany, z uwzględnieniem zmiennych w czasie źródeł metanu, związanych z cykliczna pracą kombajnu
. Prace IMG PAN 2007, 9, 1–2. [Google Scholar]
- Dziurzyński, W.; Krach, A.; Pałka, T.; Wasilewski, S. Walidacja programu VentZroby z wykorzystaniem wyników eksperymentu „in situ” i z zastosowaniem nowych algorytmów przygotowania danych wejściowych. Prace Instytutu Mechaniki Górotworu PAN 2008, 10, 1–4. [Google Scholar]
- Dziurzyński, W.; Krach, A.; Pałka, T. Shearer control algorithm and identification of control parameters. Arch. Min. Sci. 2018, 63. [Google Scholar] [CrossRef] [PubMed]
- Wasilewski, S. Modern systems of gas hazard monitoring in Polish hard coal mines. Arch. Min. Sci. 2008, 53, 511–524. [Google Scholar]
- Dziurzyński, W.; Krach, A.; Pałka, T.; Wasilewski, S. Digital Simulation of the Gas-dynamic Phenomena Caused by Bounce Experiment and Validation. Arch. Min. Sci. 2010, 55. [Google Scholar]
|
Disclaimer/Publisher’s Note: The statements, opinions and data contained in all publications are solely those of the individual author(s) and contributor(s) and not of MDPI and/or the editor(s). MDPI and/or the editor(s) disclaim responsibility for any injury to people or property resulting from any ideas, methods, instructions or products referred to in the content. |
© 2024 by the authors. Licensee MDPI, Basel, Switzerland. This article is an open access article distributed under the terms and conditions of the Creative Commons Attribution (CC BY) license (http://creativecommons.org/licenses/by/4.0/).

