Submitted:
24 September 2024
Posted:
25 September 2024
You are already at the latest version
Abstract
Keywords:
1. Introduction
2. Results
2.1. Establishing a Model of Obesity
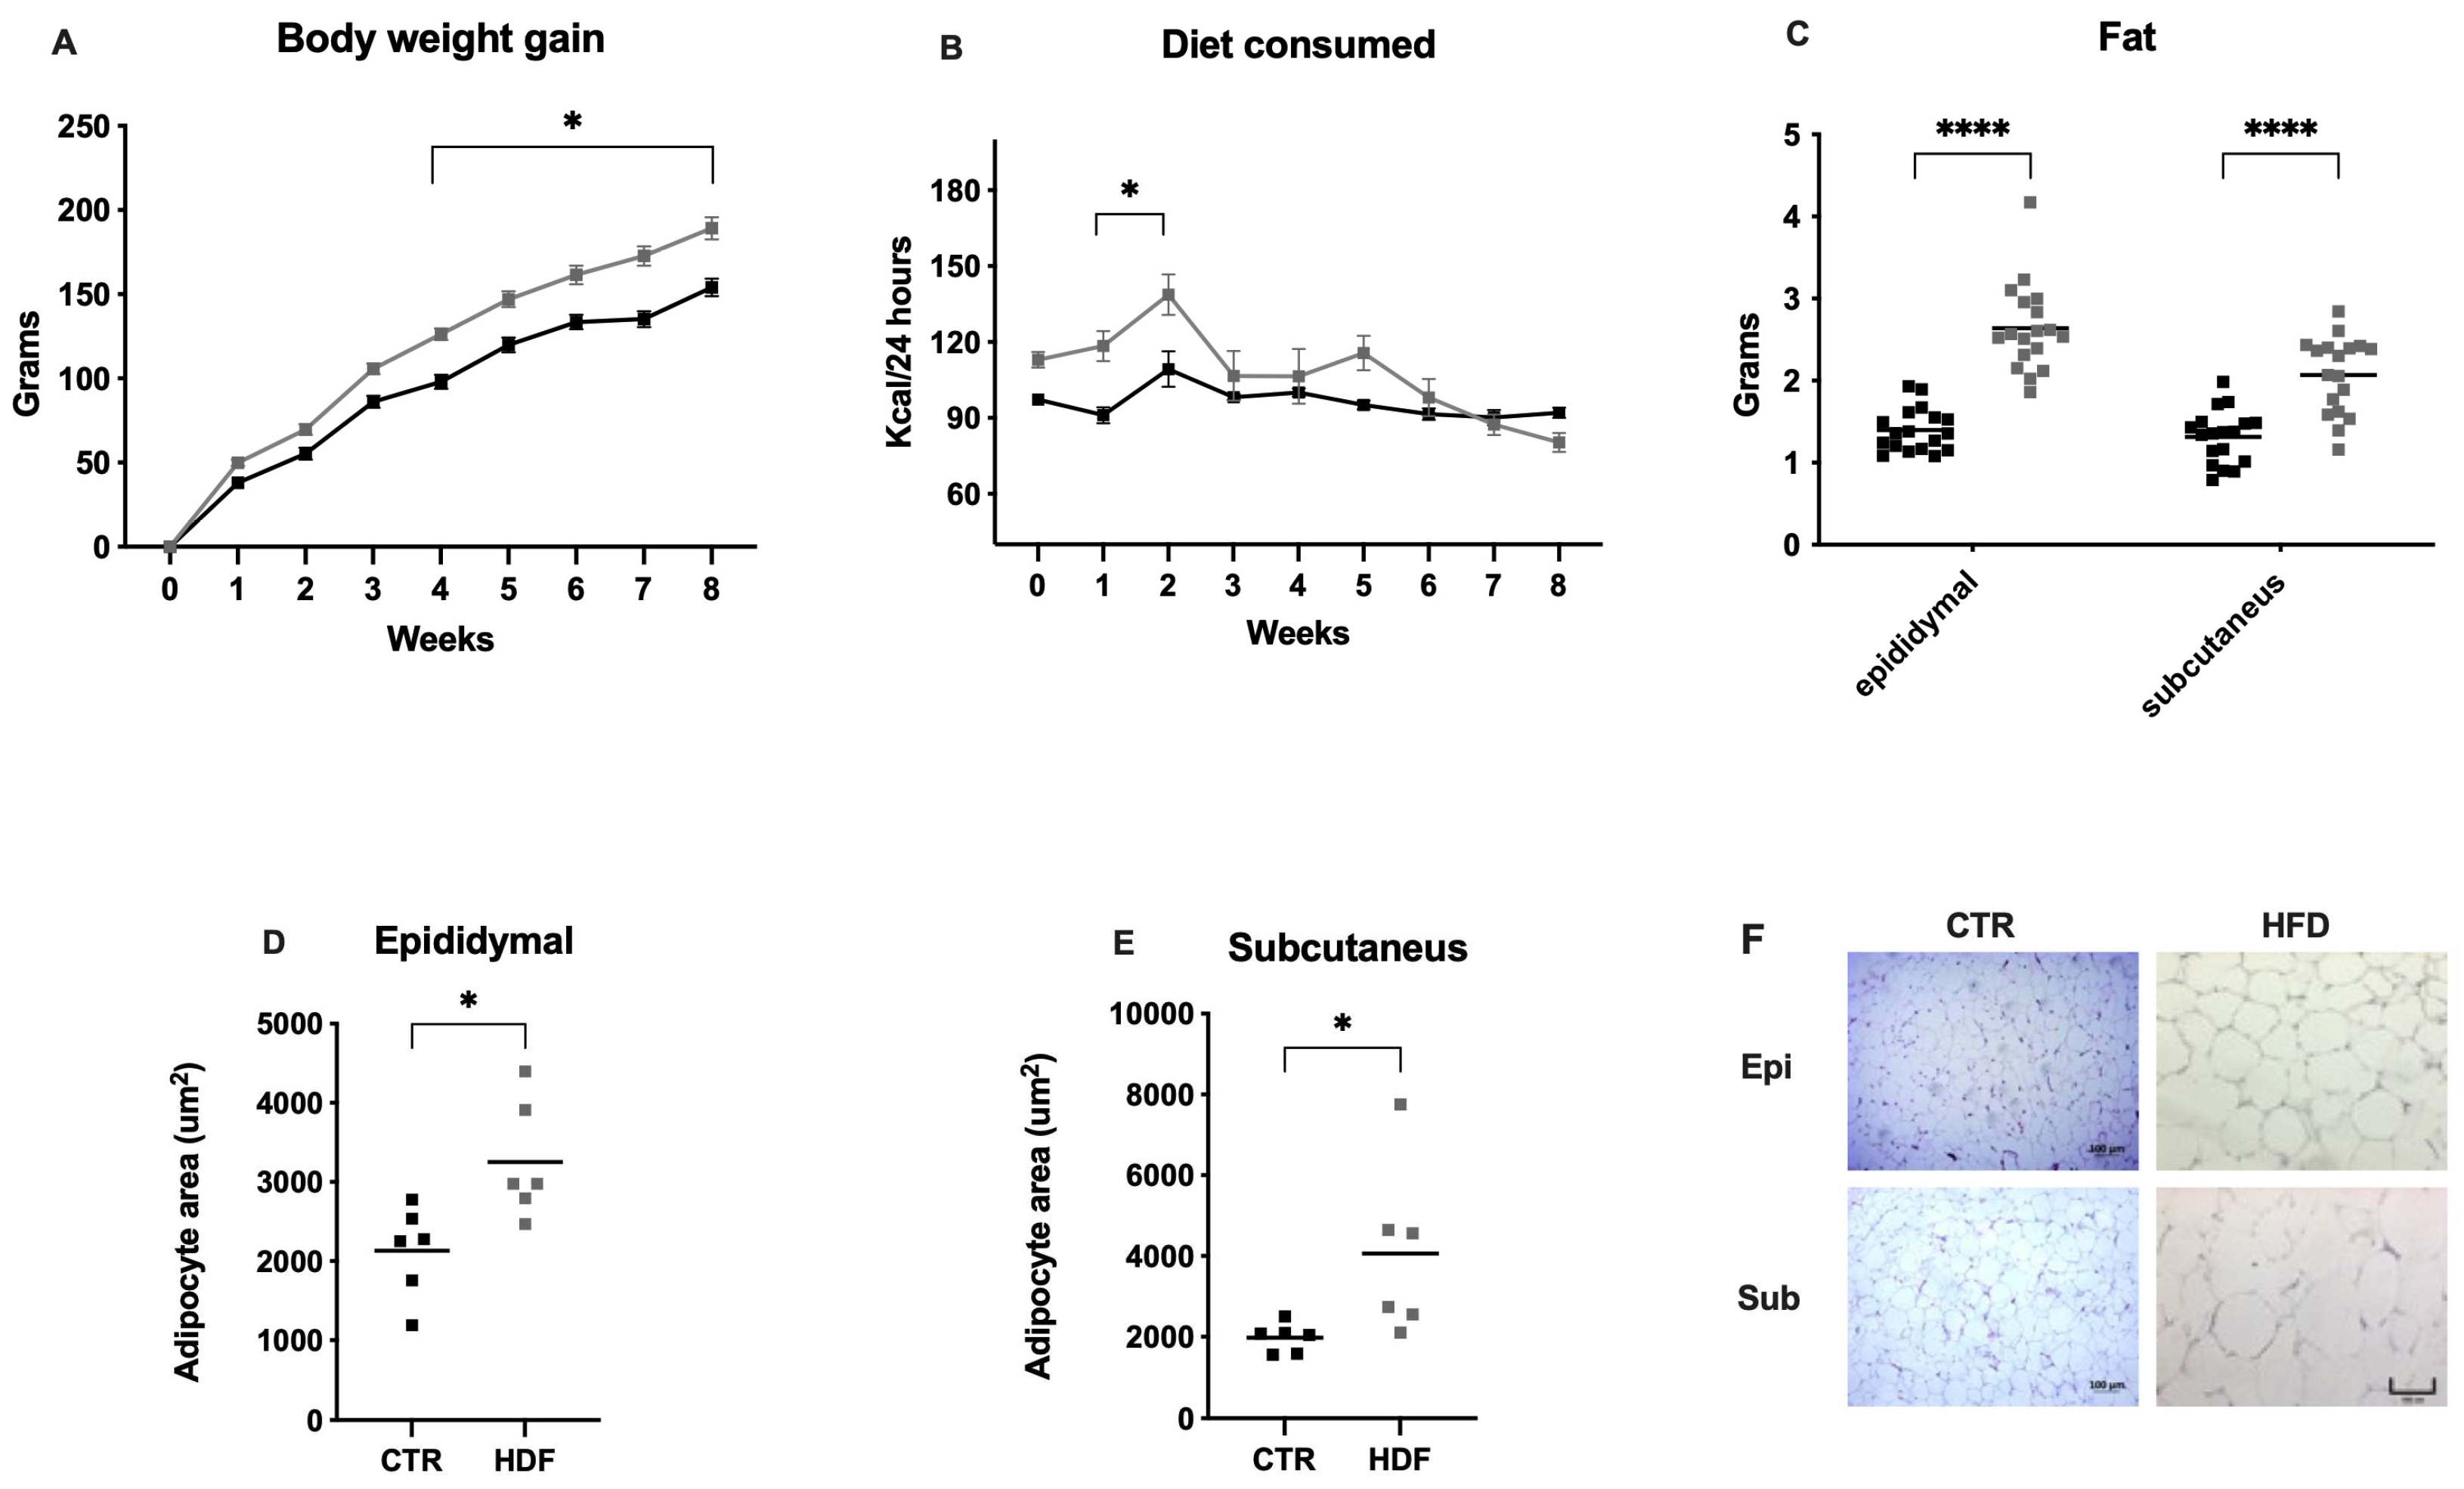
2.1.1. Body Weight, Food Consumption, and Adiposity
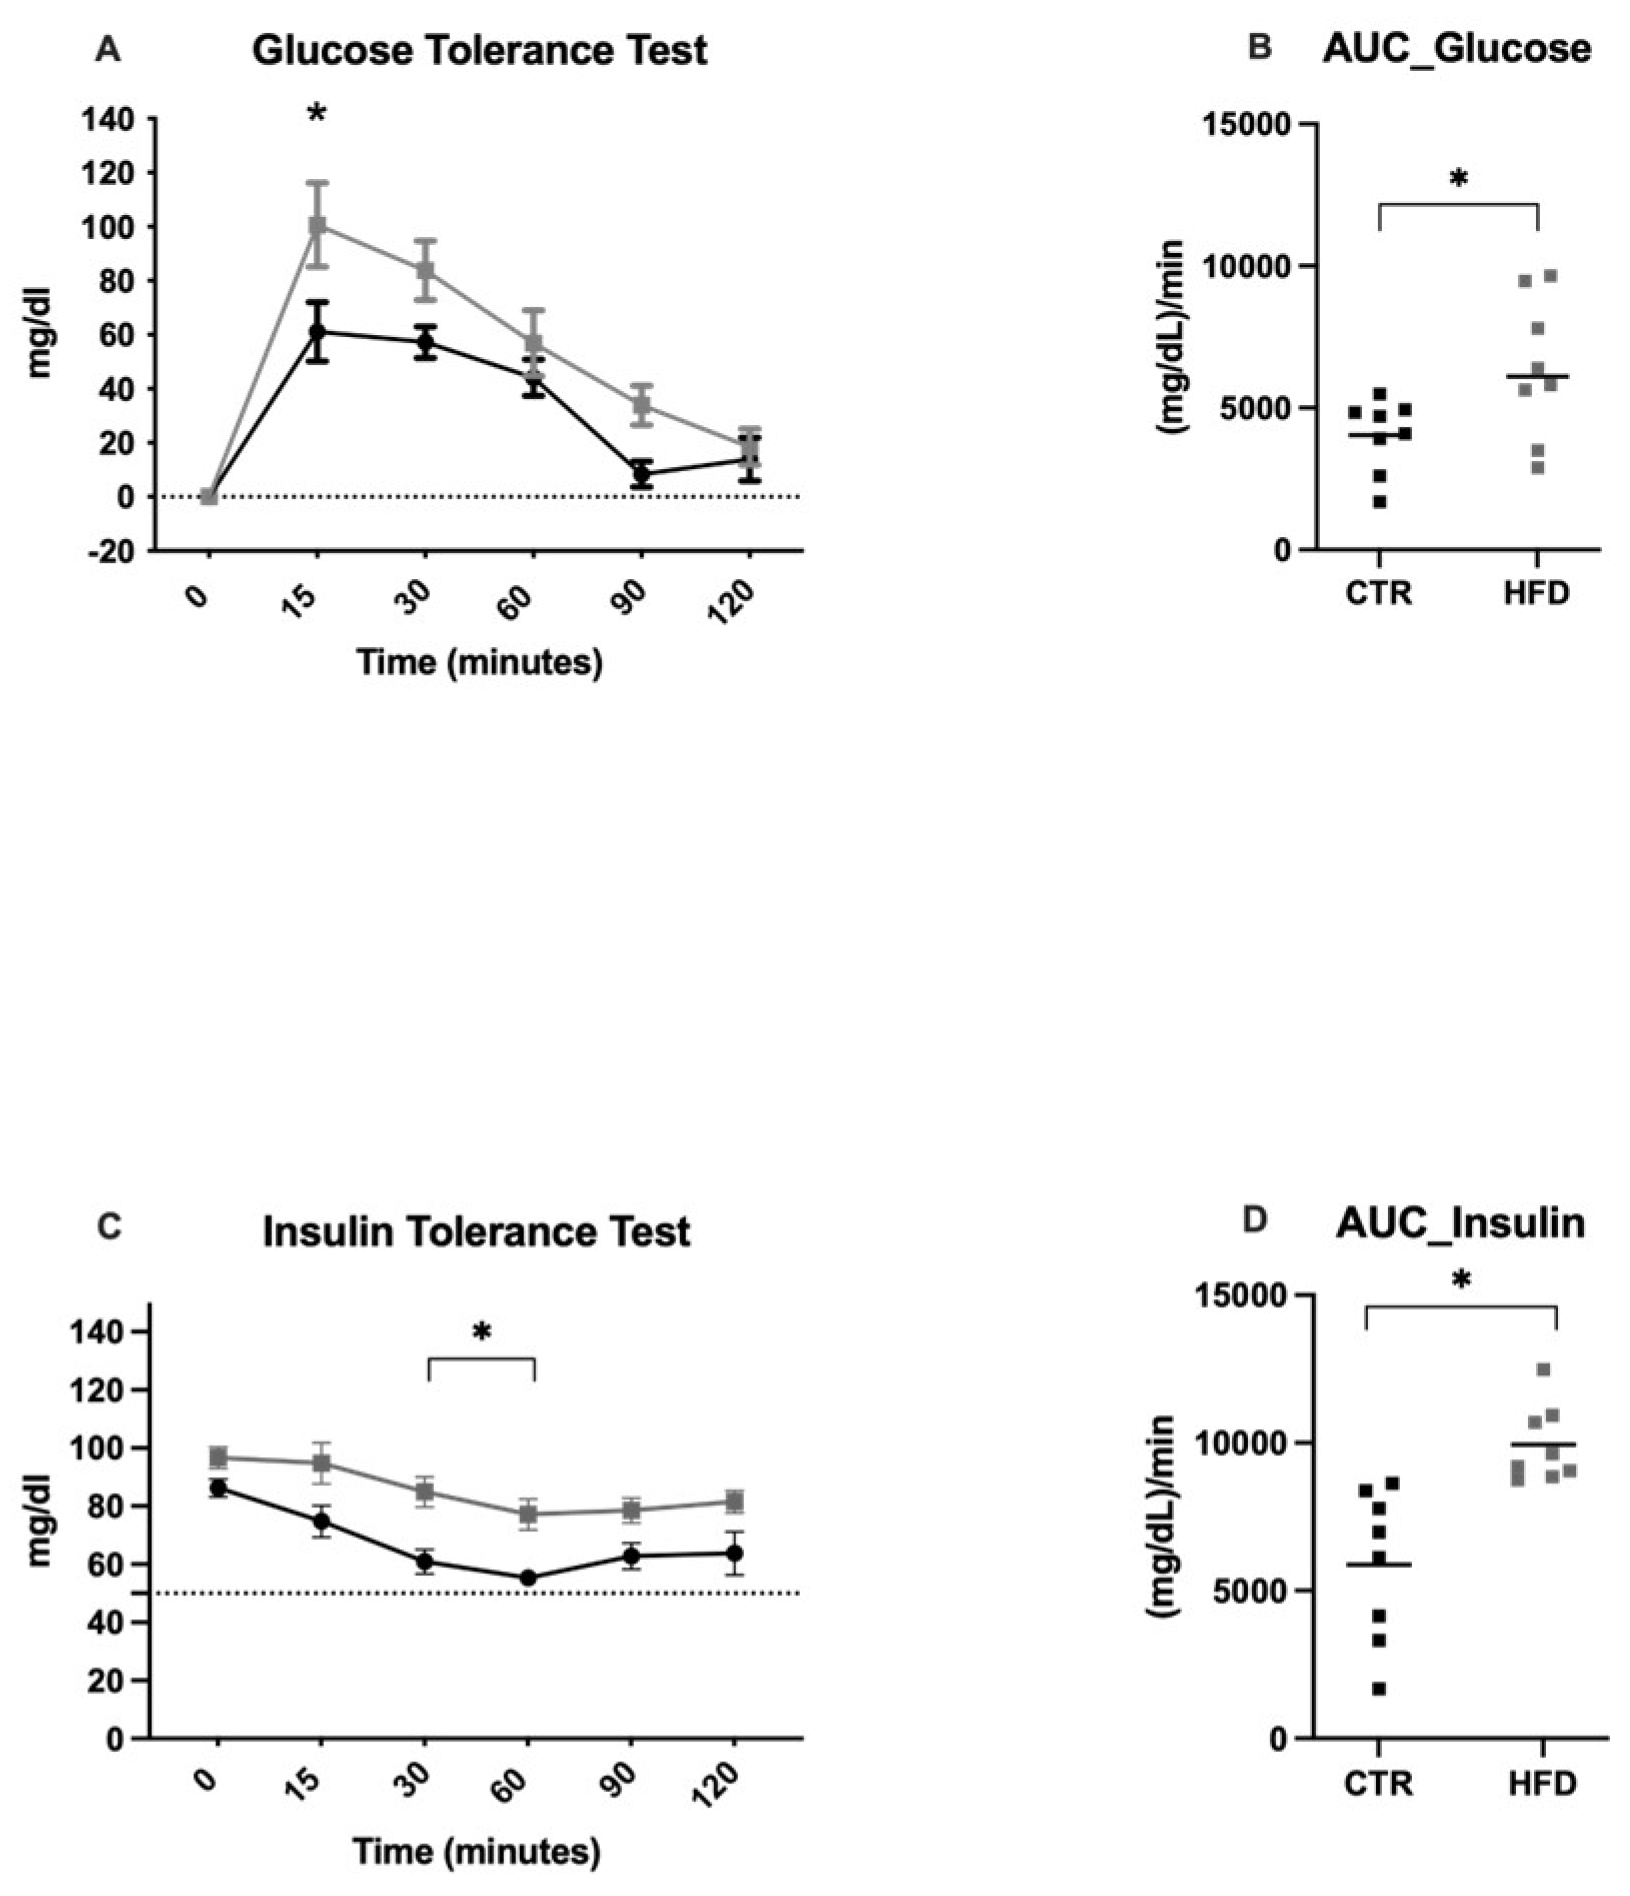
2.1.2. Effects of an 8-Week HFD on Somatometric and Metabolic Modifications
2.2. Behavioral Tests and Damage Induced by an HFD
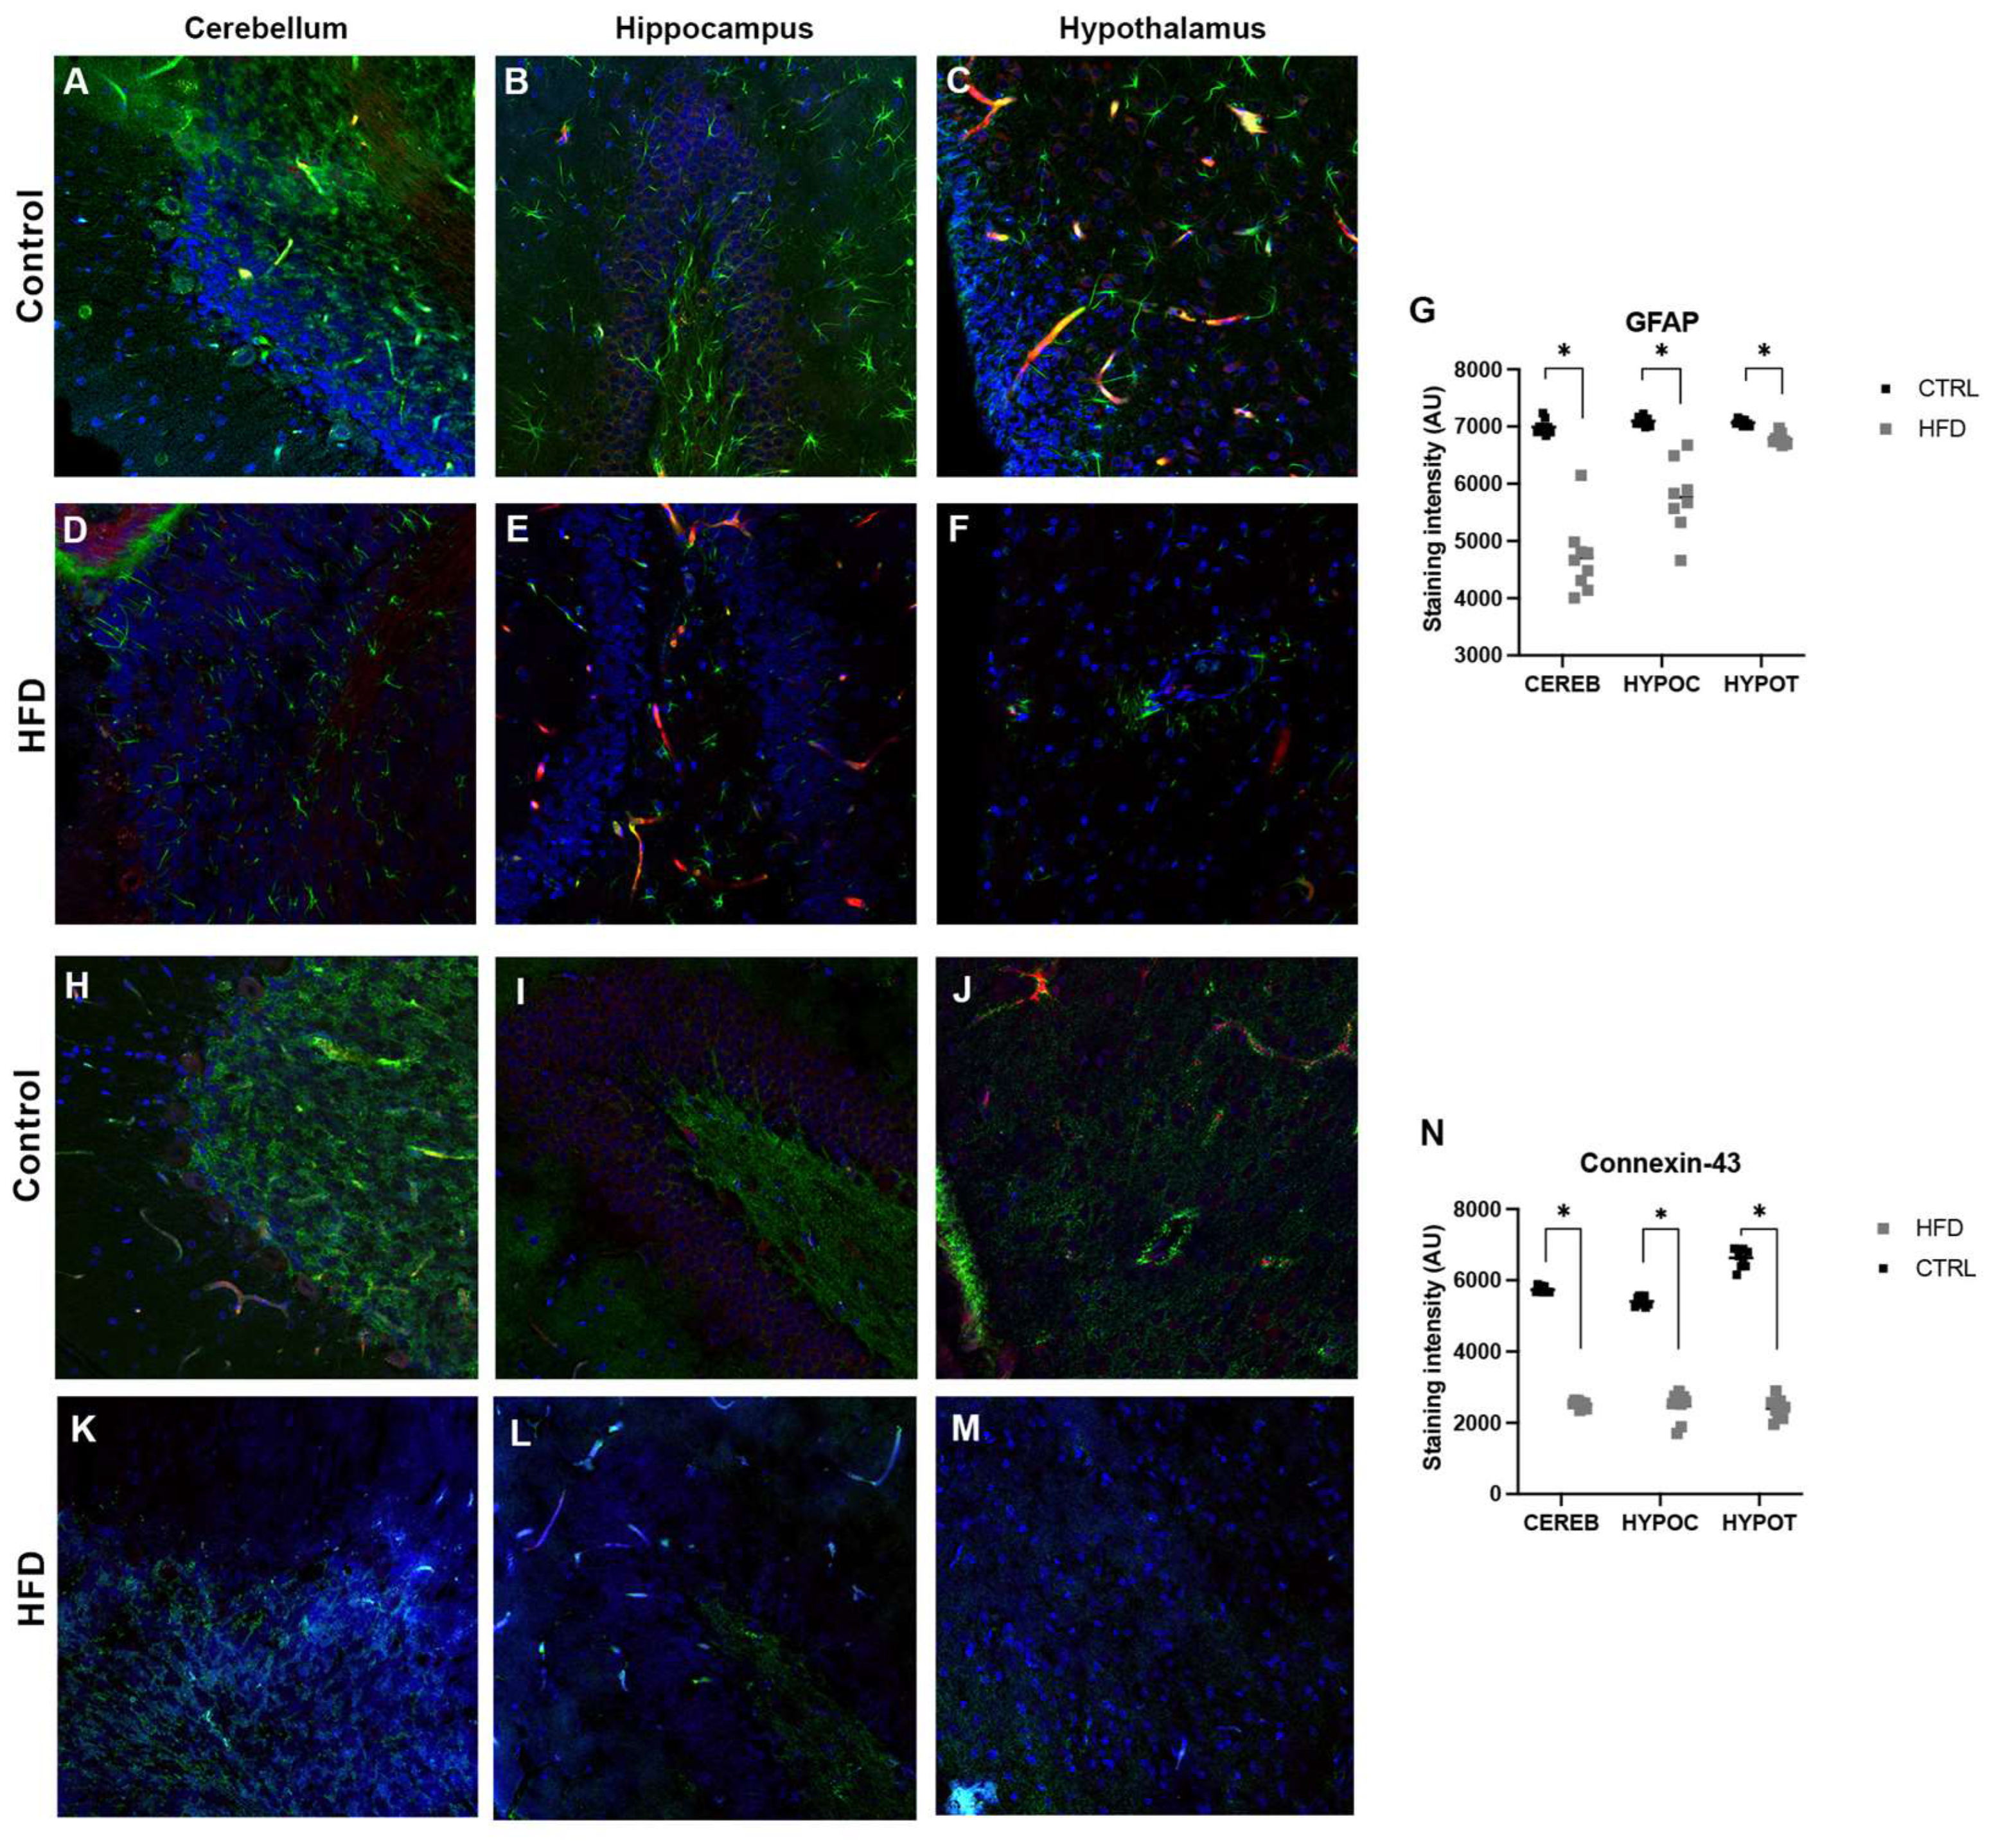
2.3. Evaluating BBB Integrity
3. Discussion
4. Materials and Methods
4.1. Establishing a Model of Obesity
4.1.1. High Fat Diet
4.1.2. Experimental Design
4.1.3. Glucose Tolerance Test (IPGTT) and Insulin Tolerance Test (ITT)
4.1.4. Insulin Resistance Surrogate Measures
4.1.5. Plasma, Adipose Tissue, and Brain Samples
4.1.6. Histological Preparation
4.2. Behavioral Tests and Damage Induced by an HFD
4.2.1. Mechanical Allodynia
4.2.2. Motor Coordination
4.3. Evaluating BBB Integrity
4.3.1. Evans Blue Administration
4.3.2. Immunofluorescence
4.3.3. Image Digitalization
4.3.4. Transmission Electron Microscopy
4.3.5. Data Analysis
Supplementary Materials
Author Contributions
Funding
Institutional Review Board Statement
Informed Consent Statement
Data Availability Statement
Acknowledgments
Conflicts of Interest
References
- Levesque:, R.J.R. Obesity and Overweight. In Encyclopedia of Adolescence; Springer International Publishing, 2018; pp. 2561–2565.
- Cornier, M.A.; Dabelea, D.; Hernandez, T.L.; Lindstrom, R.C.; Steig, A.J.; Stob, N.R.; Van Pelt, R.E.; Wang, H.; Eckel, R.H. The Metabolic Syndrome. Endocr. Rev. 2008, 29, 777–822. [Google Scholar] [CrossRef] [PubMed]
- Kleinert, M.; Clemmensen, C.; Hofmann, S.M.; Moore, M.C.; Renner, S.; Woods, S.C.; Huypens, P.; Beckers, J.; De Angelis, M.H.; Schürmann, A.; et al. Animal Models of Obesity and Diabetes Mellitus. Nat. Rev. Endocrinol. 2018, 14, 140–162. [Google Scholar] [CrossRef]
- Small, L.; Brandon, A.E.; Turner, N.; Cooney, G.J. Modeling Insulin Resistance in Rodents by Alterations in Diet: What Have High-Fat and High-Calorie Diets Revealed? Am. J. Physiol. - Endocrinol. Metab. 2018, 314, E251–E265. [Google Scholar] [CrossRef] [PubMed]
- Keita, H.; Ramírez-San Juan, E.; Paniagua-Castro, N.; Garduño-Siciliano, L.; Quevedo, L. The Long-Term Ingestion of a Diet High in Extra Virgin Olive Oil Produces Obesity and Insulin Resistance but Protects Endothelial Function in Rats: A Preliminary Study. Diabetol. Metab. Syndr. 2013, 5, 1–10. [Google Scholar] [CrossRef] [PubMed]
- Larqué, C.; Lugo-Martínez, H.; Mendoza, X.; Nochebuena, M.; Novo, L.; Vilchis, R.; Sánchez-Bringas, G.; Ubaldo, L.; Velasco, M.; Escalona, R. Paternal Obesity Induced by High-Fat Diet Impairs the Metabolic and Reproductive Health of Progeny in Rats. Reprod. Heal. Progeny Rats. Metab. 2023, 13, 1098. [Google Scholar] [CrossRef] [PubMed]
- Tan, B.L.; Norhaizan, M.E. Effect of High-Fat Diets on Oxidative Stress, Cellular Inflammatory Response and Cognitive Function. Nutrients 2019, 11. [Google Scholar] [CrossRef]
- Lama, A.; Pirozzi, C.; Severi, I.; Morgese, M.G.; Senzacqua, M.; Annunziata, C.; Comella, F.; Del Piano, F.; Schiavone, S.; Petrosino, S.; et al. Palmitoylethanolamide Dampens Neuroinflammation and Anxiety-like Behavior in Obese Mice. Brain. Behav. Immun. 2022, 102, 110–123. [Google Scholar] [CrossRef]
- Hargrave, S.L.; Davidson, T.L.; Zheng, W.; Kinzig, K.P. Western Diets Induce Blood-Brain Barrier Leakage and Alter Spatial Strategies in Rats. Behav. Neurosci. 2016, 130, 123–135. [Google Scholar] [CrossRef]
- Machida, T.; Takata, F.; Matsumoto, J.; Miyamura, T.; Hirata, R.; Kimura, I.; Kataoka, Y.; Dohgu, S.; Yamauchi, A. Contribution of Thrombin-Reactive Brain Pericytes to Blood-Brain Barrier Dysfunction in an in Vivo Mouse Model of Obesity-Associated Diabetes and an in Vitro Rat Model. PLoS One 2017, 12. [Google Scholar] [CrossRef]
- Ogata, S.; Ito, S.; Masuda, T.; Ohtsuki, S. Changes of Blood-Brain Barrier and Brain Parenchymal Protein Expression Levels of Mice under Different Insulin-Resistance Conditions Induced by High-Fat Diet. Pharm. Res. 2019, 36, 141. [Google Scholar] [CrossRef]
- Shiadeh, S.M.J.; Goretta, F.; Svedin, P.; Jansson, T.; Mallard, C.; Ardalan, M. Long-Term Impact of Maternal Obesity on the Gliovascular Unit and Ephrin Signaling in the Hippocampus of Adult Offspring. J. Neuroinflammation 2024, 21. [Google Scholar] [CrossRef] [PubMed]
- Tucsek, Z.; Toth, P.; Tarantini, S.; Sosnowska, D.; Gautam, T.; Warrington, J.P.; Giles, C.B.; Wren, J.D.; Koller, A.; Ballabh, P.; et al. Aging Exacerbates Obesity-Induced Cerebromicrovascular Rarefaction, Neurovascular Uncoupling, and Cognitive Decline in Mice. J. Gerontol. A. Biol. Sci. Med. Sci. 2014, 69, 1339–1352. [Google Scholar] [CrossRef]
- Salameh, T.S.; Mortell, W.G.; Logsdon, A.F.; Butterfield, D.A.; Banks, W.A. Disruption of the Hippocampal and Hypothalamic Blood-Brain Barrier in a Diet-Induced Obese Model of Type II Diabetes: Prevention and Treatment by the Mitochondrial Carbonic Anhydrase Inhibitor, Topiramate. Fluids Barriers CNS 2019, 16, 1. [Google Scholar] [CrossRef]
- Kim, D.W.; Glendining, K.A.; Grattan, D.R.; Jasoni, C.L. Maternal Obesity in the Mouse Compromises the Blood-Brain Barrier in the Arcuate Nucleus of Offspring. Endocrinology 2016, 157, 2229–2242. [Google Scholar] [CrossRef]
- Higuchi, S.; Irie, K.; Mishima, S.; Araki, M.; Ohji, M.; Shirakawa, A.; Akitake, Y.; Matsuyama, K.; Mishima, K.; Mishima, K.; et al. The Cannabinoid 1-Receptor Silent Antagonist O-2050 Attenuates Preference for High-Fat Diet and Activated Astrocytes in Mice. J. Pharmacol. Sci. 2010, 112, 369–372. [Google Scholar] [CrossRef] [PubMed]
- Molina, J.; Joaquim, A.; Bonamin, L.V.; Martins, M. de F.M.; Kirsten, T.B.; Cardoso, C.V.; Bernardi, M.M.; Bondan, E.F. Reduced Astrocytic Expression of GFAP in the Offspring of Female Rats That Received Hypercaloric Diet. Nutr. Neurosci. 2020, 23, 411–421. [Google Scholar] [CrossRef]
- Severi, I.; Fosca, M.; Colleluori, G.; Marini, F.; Imperatori, L.; Senzacqua, M.; Di Vincenzo, A.; Barbatelli, G.; Fiori, F.; Rau, J. V.; et al. High-Fat Diet Impairs Mouse Median Eminence: A Study by Transmission and Scanning Electron Microscopy Coupled with Raman Spectroscopy. Int. J. Mol. Sci. 2021, 22, 8049. [Google Scholar] [CrossRef] [PubMed]
- El-Sayyad, H.I.H.; El-Gallil, H.A.; El-Ghaweet, H.A. Synergistic Effects of Pomegranate Juice and Atorvastatin for Improving Cerebellar Structure and Function of Breast-Feeding Rats Maternally Fed on a High Cholesterol Diet. J. Chem. Neuroanat. 2020, 107. [Google Scholar] [CrossRef]
- Woo, C.W.; Schmidt, L.; Krishnan, A.; Jepma, M.; Roy, M.; Lindquist, M.A.; Atlas, L.Y.; Wager, T.D. Quantifying Cerebral Contributions to Pain beyond Nociception. Nat. Commun. 2017, 8. [Google Scholar] [CrossRef]
- Gavini, C.K.; Bookout, A.L.; Bonomo, R.; Gautron, L.; Lee, S.; Mansuy-Aubert, V. Liver X Receptors Protect Dorsal Root Ganglia from Obesity-Induced Endoplasmic Reticulum Stress and Mechanical Allodynia. Cell Rep. 2018, 25, 271–277.e4. [Google Scholar] [CrossRef]
- Guo, X.; Tao, X.; Tong, Q.; Li, T.; Dong, D.; Zhang, B.; Zhao, M.; Song, T. Impaired AMPK-CGRP Signaling in the Central Nervous System Contributes to Enhanced Neuropathic Pain in High-fat Diet-induced Obese Rats, with or without Nerve Injury. Mol. Med. Rep. 2019, 20, 1279–1287. [Google Scholar] [CrossRef] [PubMed]
- Uppin, V.; Acharya, P.; Kempaiah, B.B.; Talahalli, R.R. Zerumbone Augments Cognitive Enhancement Potentials of EPA+DHA: Insight from a Hyperlipidaemic Rat Model. Br. J. Nutr. 2020, 124, 1353–1360. [Google Scholar] [CrossRef]
- Hatori, M.; Vollmers, C.; Zarrinpar, A.; DiTacchio, L.; Bushong, E.A.; Gill, S.; Leblanc, M.; Chaix, A.; Joens, M.; Fitzpatrick, J.A.J.; et al. Time-Restricted Feeding without Reducing Caloric Intake Prevents Metabolic Diseases in Mice Fed a High-Fat Diet. Cell Metab. 2012, 15, 848–860. [Google Scholar] [CrossRef]
- Fajardo, L.; Sanchez, P.; Salles, J.; Rigaudière, J.P.; Patrac, V.; Caspar-Bauguil, S.; Bergoglgio, C.; Moro, C.; Walrand, S.; Le Bacquer, O. Inhibition of the Endocannabinoid System Reverses Obese Phenotype in Aged Mice and Partly Restores Skeletal Muscle Function. Am. J. Physiol. Endocrinol. Metab. 2023, 324, E176–E184. [Google Scholar] [CrossRef] [PubMed]
- Speakman, J.R. Use of High-Fat Diets to Study Rodent Obesity as a Model of Human Obesity. Int. J. Obes. 2019, 43, 1491–1492. [Google Scholar] [CrossRef] [PubMed]
- Boustany, C.M.; Bharadwaj, K.; Daugherty, A.; Brown, D.R.; Randall, D.C.; Cassis, L.A. Activation of the Systemic and Adipose Renin-Angiotensin System in Rats with Diet-Induced Obesity and Hypertension. Am. J. Physiol. - Regul. Integr. Comp. Physiol. 2004, 287. [Google Scholar] [CrossRef]
- Buettner, R.; Schölmerich, J.; Bollheimer, L.C. High-Fat Diets: Modeling the Metabolic Disorders of Human Obesity in Rodents. Obesity (Silver Spring). 2007, 15, 798–808. [Google Scholar] [CrossRef]
- Suman, R.K.; Ray Mohanty, I.; Borde, M.K.; Maheshwari, U.; Deshmukh, Y.A. Development of an Experimental Model of Diabetes Co-Existing with Metabolic Syndrome in Rats. Adv. Pharmacol. Sci. 2016, 2016. [Google Scholar] [CrossRef]
- Wong, S.K.; Chin, K.-Y.; Suhaimi, F.H.; Fairus, A.; Ima-Nirwana, S. Animal Models of Metabolic Syndrome: A Review. Nutr. Metab. (Lond). 2016, 13, 65. [Google Scholar] [CrossRef]
- Hu, S.; Wang, L.; Yang, D.; Li, L.; Togo, J.; Wu, Y.; Liu, Q.; Li, B.; Li, M.; Wang, G.; et al. Dietary Fat, but Not Protein or Carbohydrate, Regulates Energy Intake and Causes Adiposity in Mice. Cell Metab. 2018, 28, 415–431.e4. [Google Scholar] [CrossRef]
- Buettner, R.; Parhofer, K.G.; Woenckhaus, M.; Wrede, C.E.; Kunz-Schughart, L.A.; Schölmerich, J.; Bollheimer, L.C. Defining High-Fat-Diet Rat Models: Metabolic and Molecular Effects of Different Fat Types. J. Mol. Endocrinol. 2006, 36, 485–501. [Google Scholar] [CrossRef] [PubMed]
- Kettner, N.M.; Mayo, S.A.; Hua, J.; Lee, C.; Moore, D.D.; Fu, L. Circadian Dysfunction Induces Leptin Resistance in Mice. Cell Metab. 2015, 22, 448–459. [Google Scholar] [CrossRef]
- Mwangi, S.M.; Nezami, B.G.; Obukwelu, B.; Anitha, M.; Marri, S.; Fu, P.; Epperson, M.F.; Le, N.A.; Shanmugam, M.; Sitaraman, S. V.; et al. Glial Cell Line-Derived Neurotrophic Factor Protects against High-Fat Diet-Induced Obesity. Am. J. Physiol. - Gastrointest. Liver Physiol. 2014, 306. [Google Scholar] [CrossRef]
- Marques Miranda, C.; de Lima Campos, M.; Leite-Almeida, H. Diet, Body Weight and Pain Susceptibility – A Systematic Review of Preclinical Studies. Neurobiol. Pain 2021, 10. [Google Scholar] [CrossRef] [PubMed]
- Baron, R.; Binder, A.; Wasner, G. Neuropathic Pain: Diagnosis, Pathophysiological Mechanisms, and Treatment. Lancet Neurol. 2010, 9, 807–819. [Google Scholar] [CrossRef] [PubMed]
- Cooper, M.A.; O’Meara, B.; Jack, M.M.; Elliot, D.; Lamb, B.; Khan, Z.W.; Menta, B.W.; Ryals, J.M.; Winter, M.K.; Wright, D.E. Intrinsic Activity of C57BL/6 Substrains Associates with High-Fat Diet-Induced Mechanical Sensitivity in Mice. J. Pain 2018, 19, 1285–1295. [Google Scholar] [CrossRef]
- Liang, Y.J.; Feng, S.Y.; Qi, Y.P.; Li, K.; Jin, Z.R.; Jing, H.B.; Liu, L.Y.; Cai, J.; Xing, G.G.; Fu, K.Y. Contribution of Microglial Reaction to Increased Nociceptive Responses in High-Fat-Diet (HFD)-Induced Obesity in Male Mice. Brain. Behav. Immun. 2019, 80, 777–792. [Google Scholar] [CrossRef] [PubMed]
- Lupachyk, S.; Watcho, P.; Obrosov, A.A.; Stavniichuk, R.; Obrosova, I.G. Endoplasmic Reticulum Stress Contributes to Prediabetic Peripheral Neuropathy. Exp. Neurol. 2013, 247, 342–348. [Google Scholar] [CrossRef]
- Guilford, B.L.; Ryals, J.M.; Wright, D.E. Phenotypic Changes in Diabetic Neuropathy Induced by a High-Fat Diet in Diabetic C57Bl/6 Mice. Exp. Diabetes Res. 2011, 2011, 18–21. [Google Scholar] [CrossRef]
- Brooks, S.P.; Dunnett, S.B. Tests to Assess Motor Phenotype in Mice: A User’s Guide. Nat. Rev. Neurosci. 2009, 10, 519–529. [Google Scholar] [CrossRef]
- Grover, L.; Sklioutovskaya-Lopez, K.; Parkman, J.K.; Wang, K.; Hendricks, E.; Adams-Duffield, J.; Kim, J.H. Diet, Sex, and Genetic Predisposition to Obesity and Type 2 Diabetes Modulate Motor and Anxiety-Related Behaviors in Mice, and Alter Cerebellar Gene Expression. Behav. Brain Res. 2023, 445. [Google Scholar] [CrossRef]
- Bhandari, A.; Kalotra, S.; Bajaj, P.; Sunkaria, A.; Kaur, G. Dietary Intervention with Tinospora Cordifolia Improved Aging-Related Decline in Locomotor Coordination and Cerebellar Cell Survival and Plasticity in Female Rats. Biogerontology 2022, 23, 809–824. [Google Scholar] [CrossRef] [PubMed]
- Hatori, M.; Vollmers, C.; Zarrinpar, A.; DiTacchio, L.; Bushong, E. a.; Gill, S.; Leblanc, M.; Chaix, A.; Joens, M.; Fitzpatrick, J. a J.; et al. Time-Restricted Feeding without Reducing Caloric Intake Prevents Metabolic Diseases in Mice Fed a High-Fat Diet. Cell Metab. 2012, 15, 848–860. [Google Scholar] [CrossRef] [PubMed]
- Valdez, M.C.; Freeborn, D.; Valdez, J.M.; Johnstone, A.F.M.; Snow, S.J.; Tennant, A.H.; Kodavanti, U.P.; Kodavanti, P.R.S. Mitochondrial Bioenergetics in Brain Following Ozone Exposure in Rats Maintained on Coconut, Fish and Olive Oil-Rich Diets. Int. J. Mol. Sci. 2019, Vol. 20, Page 6303 2019, 20, 6303. [Google Scholar] [CrossRef] [PubMed]
- Severi, I.; Fosca, M.; Colleluori, G.; Marini, F.; Imperatori, L.; Senzacqua, M.; Di Vincenzo, A.; Barbatelli, G.; Fiori, F.; Rau, J. V.; et al. High-Fat Diet Impairs Mouse Median Eminence: A Study by Transmission and Scanning Electron Microscopy Coupled with Raman Spectroscopy. Int. J. Mol. Sci. 2021, 22. [Google Scholar] [CrossRef]
- Boitard, C.; Cavaroc, A.; Sauvant, J.; Aubert, A.; Castanon, N.; Layé, S.; Ferreira, G. Impairment of Hippocampal-Dependent Memory Induced by Juvenile High-Fat Diet Intake Is Associated with Enhanced Hippocampal Inflammation in Rats. Brain. Behav. Immun. 2014, 40, 9–17. [Google Scholar] [CrossRef]
- Guillemot-Legris, O.; Muccioli, G.G. Obesity-Induced Neuroinflammation: Beyond the Hypothalamus. Trends Neurosci. 2017, 40, 237–253. [Google Scholar] [CrossRef]
- Severi, I.; Fosca, M.; Colleluori, G.; Marini, F.; Imperatori, L.; Senzacqua, M.; Di Vincenzo, A.; Barbatelli, G.; Fiori, F.; Rau, J. V.; et al. High-Fat Diet Impairs Mouse Median Eminence: A Study by Transmission and Scanning Electron Microscopy Coupled with Raman Spectroscopy. Int. J. Mol. Sci. 2021, 22. [Google Scholar] [CrossRef]
- Ding, H.; Liu, C.; Zhang, S.; Li, B.; Xu, Q.; Shi, B.; Li, S.; Dong, S.; Ma, X.; Zhang, Y.; et al. Sleeve Gastrectomy Attenuated Diabetes-Related Cognitive Decline in Diabetic Rats. Front. Endocrinol. (Lausanne). 2022, 13. [Google Scholar] [CrossRef]
- Escalona, R.; Larqué, C.; Cortes, D.; Vilchis, R.; Granados-Delgado, E.; Sánchez, A.; Sánchez-Bringas, G.; Lugo-Martínez, H. High-Fat Diet Impairs Glucose Homeostasis by Increased P16 Beta-Cell Expression and Alters Glucose Homeostasis of the Progeny in a Parental-Sex Dependent Manner. Front. Endocrinol. (Lausanne). 2023, 14, 1246194. [Google Scholar] [CrossRef]
- Cacho, J.; Sevillano, J.; de Castro, J.; Herrera, E.; Ramos, M.P. Validation of Simple Indexes to Assess Insulin Sensitivity during Pregnancy in Wistar and Sprague-Dawley Rats. Am. J. Physiol. Metab. 2008, 295, E1269–E1276. [Google Scholar] [CrossRef] [PubMed]
- Knopp, J.L.; Holder-Pearson, L.; Chase, J.G. Insulin Units and Conversion Factors: A Story of Truth, Boots, and Faster Half-Truths. J. Diabetes Sci. Technol. 2019, 13, 597–600. [Google Scholar] [CrossRef] [PubMed]
- Chaplan, S.R.; Bach, F.W.; Pogrel, J.W.; Chung, J.M.; Yaksh, T.L. Quantitative Assessment of Tactile Allodynia in the Rat Paw. J. Neurosci. Methods 1994, 53, 55–63. [Google Scholar] [CrossRef] [PubMed]
- Dixon, W.J. Efficient Analysis of Experimental Observations. Annu. Rev. Pharmacol. Toxicol. 1980, 20, 441–462. [Google Scholar] [CrossRef]
- Harauma, A.; Tomita, M.; Muto, D.; Moriguchi, T. Effect of Long-Term Administration of Arachidonic Acid on n-3 Fatty Acid Deficient Mice. Prostaglandins Leukot. Essent. Fat. Acids 2015, 95, 41–45. [Google Scholar] [CrossRef]
- del Valle, J.; Camins, A.; Pallàs, M.; Vilaplana, J.; Pelegrí, C. A New Method for Determining Blood-Brain Barrier Integrity Based on Intracardiac Perfusion of an Evans Blue-Hoechst Cocktail. J. Neurosci. Methods 2008, 174, 42–49. [Google Scholar] [CrossRef]
- Bozzola, J.J.; Russell, L.D. Specimen Preparation for Transmission Electron Microscopy. In Principles and Techniques for Biologists; McKean, B.L., Ed.; Jones and Bartlett Publishers Inc.: Massachusetts, 1998; pp. 20–22. ISBN 0763701920. [Google Scholar]

| Parameters | Groups | P | |
|---|---|---|---|
| CTR | HFD-fed | ||
| BMI (kg/m2) | 0.67 ± 0.02 | 0.79 ± 0.03 | 0.002* |
| Abdominal circumference (cm) | 19.09 ± 0.13 | 21.23 ± 0.28 | 0.001* |
| Body length (cm) | 25.86 ± 0.35 | 24.50 ± 0.44 | 0.026* |
| Lee index (g/cm) | 295.34 ± 4.42 | 318.70 ± 5.68 | 0.004* |
| Fasting plasma glucose (mg/dL) | 81 ± 1.58 | 91 ± 4.54 | 0.022* |
| Leptin (pg/ml) | 26547.19 ± 7785 | 58447.19 ± 9227 | 0.007* |
| Insulin (pg/ml) | 3180.77 ± 366.2 | 4621.67 ± 691.1 | 0.042* |
| Triacylglycerols (mg/dL) | 99.11 ± 4.47 | 118.16 ± 18.39 | 0.177 |
| HOMA-IR (%) | 18.38 ± 1.86 | 31.76 ± 4.59 | 0.012* |
Disclaimer/Publisher’s Note: The statements, opinions and data contained in all publications are solely those of the individual author(s) and contributor(s) and not of MDPI and/or the editor(s). MDPI and/or the editor(s) disclaim responsibility for any injury to people or property resulting from any ideas, methods, instructions or products referred to in the content. |
© 2024 by the authors. Licensee MDPI, Basel, Switzerland. This article is an open access article distributed under the terms and conditions of the Creative Commons Attribution (CC BY) license (http://creativecommons.org/licenses/by/4.0/).


