
Submitted:
24 September 2024
Posted:
25 September 2024
You are already at the latest version
Abstract
Animals form functional units with their microbial communities, termed metaorganisms. While extensive research has been conducted on a few model animals, much remains unknown about the microbial diversity in most species. Here, we describe the taxonomic profile of the microbes from the outer gut mucus layer from the Northeast Arctic cod or also called the migrating Atlantic cod using a shotgun DNA sequencing approach. We provide metagenomes from six individuals. The results reveal three different taxonomic profile “types": Type I is dominated in numbers by Pseudomonaceae (44%) and Xanthomonadaceae (13%), Type II contains 65% Vibrionaceae and Type III contains 76% Enterobacteriaceae. This stands in sharp contrast to the bacterial diversity of the transient gut content (i.e., feces). Additionally, binning of assembled reads followed by phylogenomic analyses place a high-completeness bin of Type I within the Pseudomonas fluorescens group, one bin of Type II within the Photobacterium phosphoreum clade, and finally a bin of Type III within the Escherichia/Shigella group. In conclusion, we describe the adherent bacterial diversity in the Northeast Arctic cod's intestine using shotgun sequencing, revealing different taxonomic profiles compared to the more homogenous transient (fecal) microbiota. This suggests that the intestine contains two separate and distinct microbial populations.
Keywords:
Northeast Arctic cod microbiome
; Adherent bacteria
; Autochthonous
; Mucus microbiota
; Intestinal tract
; NGS
; Metagenome assembled genomes
; MAGs
1. Introduction
Animals live in close dynamic relationships with communities of microorganisms to form what has been named metaorganisms (or holobionts) [1,2]. In humans, the microbiota with the highest density of microorganisms is found in the intestinal tract [1,3,4], where it plays essential roles, e.g., in food digestion, host immunity, host metabolism and stress responses [1,5]. The structure of the gut microbial community can depend on various factors such as diet, habitats, host lineages and external stimuli. In vertebrates, phyla such as Firmicutes, Bacteroidetes, Actinobacteria, Proteobacteria (newly proposed renamed to “Bacillota”, “Bacterioidota”, “Actinoycetota” and “Pseudomonadota” respectively by International Committee on Systematics of Prokaryotes [6]) and Fusobacteria generally dominates, but with variations of their relative proportions [7,8]. For example, the gut of most mammals is typically rich in representatives from Bacteroidetes and Firmicutes [7,9,10] whereas other types of bacteria densely populate the gut of reptiles, fish and birds [11]. In fish, the gut hosts predominantly Proteobacteria [3,8,12,13].
An interesting dimension of the gastrointestinal tract, of at least some model mammals, is that the intestinal lumen and mucus layer host separate microbiota that are considered as autochthonous (i.e., adherent bacteria) and allochthonous (i.e, non-adherent bacteria) [14]. Whereas the allochthonous bacteria are in direct contact with the digesta within the intestinal lumen, the autochthons bacteria populate the outer mucus layer that covers the inner mucus layer and the intestinal epithelium. The reason why these two microbiota are separate is due to the complex structure and function of the intestine [15]. The focus herein will remain mainly on the adherent microbial community that populates the mucin-rich mucus. Mucin is the main component of the intestinal mucus in animals and is mainly made of O-glycosylated proteins [14]. Such proteins can serve as source of energy for microorganisms with genes encoding for catabolic glycosylic enzymes. Mucin-consuming bacteria are expected to outcompete bacteria that are unable to utilize mucin [14].
Microorganisms that inhabit the mucus are critical to the health of the intestine. They are in close proximity to the host epithelium, and here they work in symbiosis with the host, ideally without triggering the immune system. Firstly, they form a protective barrier against pathogens [16,17]. Secondly, they also serve critical roles in the interplay with the host e.g., in digestion, immunity, and nutrient exchange [5]. Today, it is clear that not only the physiology of the intestine is affected by the gut microbiota. Microbial composition also affects the whole-body metabolism by communicating with distant organs like the brain, liver and heart [14,15]. This is made possible due to bidirectional exchanges of small molecules, including those produced by microbes, between the outer mucus layer and the host epithelium via goblet cells [14]. Once molecules penetrate the epithelium barrier, they can enter the bloodstream and make their way to all organs.
In comparison with humans, less is known about the gut microbiota of fish, both with respect to the microbial structure and their roles in e.g., the health of the intestine. One of the best-studied fish models in this respect is Zebrafish (Danio rerio). Zebrafish offers several benefits to study the effect of the gut microbiota on the health of the host, and this has led to an increased attention to how such in vivo models can contribute to a wider understanding in this field [18]. This inexpensive model can e.g., be used to study germ-free larvae, large cohorts and gut activity directly by using transparent transgenic lines.
In contrast to studies that involve advanced fish models such as Zebrafish, studies on the gut microbiota of economically important reared or wild-caught fish must typically rely on classical microbiological methods or DNA sequencing methods. The latter can be done by purifying DNA from the gut and then amplifying parts of the 16S rDNA (amplicon sequencing), or by sequencing the total DNA directly (shotgun sequencing; metagenomics). To succeed with the latter, sufficient high-quality total DNA is extracted from feces or mucus material, which is a challenging task and therefore not typically done. We and others have during recent years used DNA sequencing methods to study the microbial composition of the gut of different populations of Atlantic cod (e.g., [19,20,21]). However, these studies are mainly focusing on the non-adherent microorganisms (allochthonous) of the gastrointestinal tract with the conclusion that Photobacterium is the most abundant bacterium. It is however still unclear how the adherent bacteria vary in composition compared with the non-adherent bacteria.
Here, we have established the first bacterial profiles of autochthonous bacteria (adherent bacteria) from six individuals of Northeast Arctic cod (NEAC) using high throughput shotgun DNA sequencing. Taxonomical profiles at family levels, as well as resulting metagenomic assembled genomes (MAGs), and phylogenomic analyses that include the most abundant bacteria, are presented.
2. Materials and Methods
2.1. Sampling of Fish and Intestinal Mucus
In January 2021, freshly collected intestinal tracts of Northeast Arctic cod were obtained from a fish factory outside of Tromsø, Norway (latitude 69.851620, longitude 18.821799). Intact gastrointestinal tracts (stomach-pyloric caeca-intestine-rectum-anus) were collected from the end of a processing line in the fish slaughterhouse, during processing of freshly landed catches of adult NEAC cod. The sex of the animals from which the organs originated is therefore not known. Figure 1A shows the intestinal tract of one specimen. The intestinal tracts were emptied of their lumen content (feces and transient bacteria) by gently squeezing the intestines, before washing with sterile saline solution three times. The intestines were then cut with a clean scissor and placed on a sterile dish. Using disposable plastic pipettes and spoons, any remaining feces was removed from the inside of ca. 10 cm section of the intestine segments (Figure 1B), and the mucus was collected in 2 mL Eppendorf tubes by scraping the inside surface of the intestines. The mucus samples were stored at – 80 °C before DNA extraction.
2.2. Isolation of DNA and Shotgun Sequencing
Total DNA was then isolated from the collected mucus sample of six Northeast Arctic cod. DNA isolation proved to be very challenging, typically producing very small amounts of DNA of poor quality. Thus, three DNA isolation protocols (Figure 2) were tested and modified before DNA of sufficient quantity and quality was obtained.
In the first attempt, the DNazol method [22] was used, followed by extraction with phenol:chloroform:isoamyl alcohol (25:24:1 saturated with 10 mM Tris, pH 8.0, 1 mM EDTA; Sigma-Aldrich) followed by precipitation with 2.5 vol 96% ethanol (stored at –20 °C) and 0.1 vol 3M Sodium Acetate, pH 5.2. The DNazol method protocol was optimized by incorporating additional steps. A lysozyme treatment was introduced by adding 200 μL of 100 mg/mL lysozyme to the samples, followed by incubation for 10 minutes at 37 °C. After the elution step, the samples were treated with 5 µL of RNase A (5 µg/µL) and incubated for 30 minutes at 37 °C to ensure the degradation of RNA. Typically, this resulted in DNA concentrations ranging from 7–17.6 ng/μL with acceptable OD260/280 (~1.8) and OD 260/230 (2.0–2.2) ratios. However, the samples did not yield clear DNA bands on agarose gels and were not successful when subjected to Illumina sequencing using Swift Turbo library preparation. It is possible that the presence of RNA in the samples led to an overestimation of the DNA concentration despite RNase A digestion. We then tried to extract mucosal DNA using the High Pure PCR Template Preparation Kit (Roche, Basel, Switzerland), but this method also did not yield high-quality DNA. Finally, we used the FastDNATM Spin Kit (MP Biomedicals) for extracting DNA from the mucus, in a similar manner as described earlier [21]. Firstly, 200-250 mg of mucus were added per E-lysing matrix tube. Four tubes were used per fish for increasing the DNA yield. The samples underwent homogenization using the FastPrep®-24 system (MP Biomedicals) for a duration of 10-15 seconds at a setting of speed 4. Instead of employing a vortex, we opted for a manual rotation of the samples to always mix them gently. For the re-suspension of the DNA pellet, we carefully employed a micropipette equipped with the largest available tips to reduce the risk of DNA shearing. We extended the duration of the final centrifugation step, which involved a wash with SEWS-M, from one minute to two minutes. The samples were eluted in 200 µl of clean distilled water. RNA was removed by incubating the eluted samples with 1 µL of RNase cocktail (500 U/ml RNase A and 20,000 U/ml RNase T1 g/mL) for 10 minutes at 37 °C. Secondly, DNA purification commenced with phenol-chloroform extraction where 200 µL of phenol-chloroform was added to an equal volume of DNA solution. Tubes were mixed by inversion, not vortexing, Centrifugation at room temperature for 5 minutes at 14,000 rpm allowed phase separation. A portion of the lower phase was discarded to minimize phenol contamination and maximize DNA yield. An additional centrifugation at the same conditions ensured clear phase distinction. The aqueous phase (upper layer), approximately 180 µL, was transferred to a new tube, avoiding phenol-chloroform uptake. DNA was then precipitated overnight with 1/10 volume of 3M sodium acetate (pH 5.2) and 2 volumes of cold 100% ethanol at -20°C, concentrating the DNA and eliminating contaminants. Samples were gently mixed by tube inversion. Next a centrifugation was performed at 14,000 rpm and 4 °C for 30 minutes, after which the supernatant was discarded. DNA pellets were washed with 500 μL of pre-chilled 70% ethanol and re-centrifuged for 5 minutes at 14,000 rpm and 4 °C. The supernatant was removed, and the tubes were quick spin to collect residual ethanol, which was then pipetted out. DNA pellets were dried using a Speed Vac for 3 to 7 minutes at room temperature. Finally, pellets were resuspended in 20 μL of 10 mM Tris buffer (pH 7.5) without EDTA. Yields from 0.29 to 10 ng/μL (averaging 1.77 ng/μL among the six samples) were obtained in a total volume of ≤ 20 μL, and with acceptable DNA quality. Table 1 shows DNA isolation outputs for six mucus samples that were subjected to Illumina MiSeq sequencing.
These samples were DNA sequenced at the Norwegian Sequencing Centre (NSC) using the Illumina MiSeq platform. Due to the low yield of the isolated total DNAs, sequencing was done with 250 bp (Smart ThruPlex for low-input samples) paired-end reads. At first by subjecting samples to Smart ThruPlex library preparation for low-input samples, and then by running the 250 bp paired-end sequencing using MiSeq Reagent v.2 (500 cycles). The purity of the samples was monitored by Nanodrop 2000c (Thermofisher Scientific, USA) and the final DNA concentration was determined with a Qubit 2.0 Fluorometer (ThermoFisher Scientific).
2.3. Quality Control of DNA Sequence Reads
Following DNA sequencing, we removed any reads that matched host (i.e., Atlantic cod) DNA or Illumina adapters using FastQ_Screen v.0.13.0 [23] and Trimmomatic v.0.39 [24], respectively. Furthermore, the quality of the sequence reads was accessed with FastQC [25], and low-quality reads were removed with Trimmomatic v.0.39. NGS statistics are provided in Table 2. Overall, the number of reads between the different samples varies by up to two folds with an average of 13 million reads. The read lengths also varied from 54 to 118 bp (average of 92 bp). After quality control, 65 to 96.5% of the reads were identified as host DNA and removed. Furthermore, after trimming of the remaining low quality raw reads, an average of 1.9 million reads were kept per sample before further analysis.
2.4. Rarefaction Curves
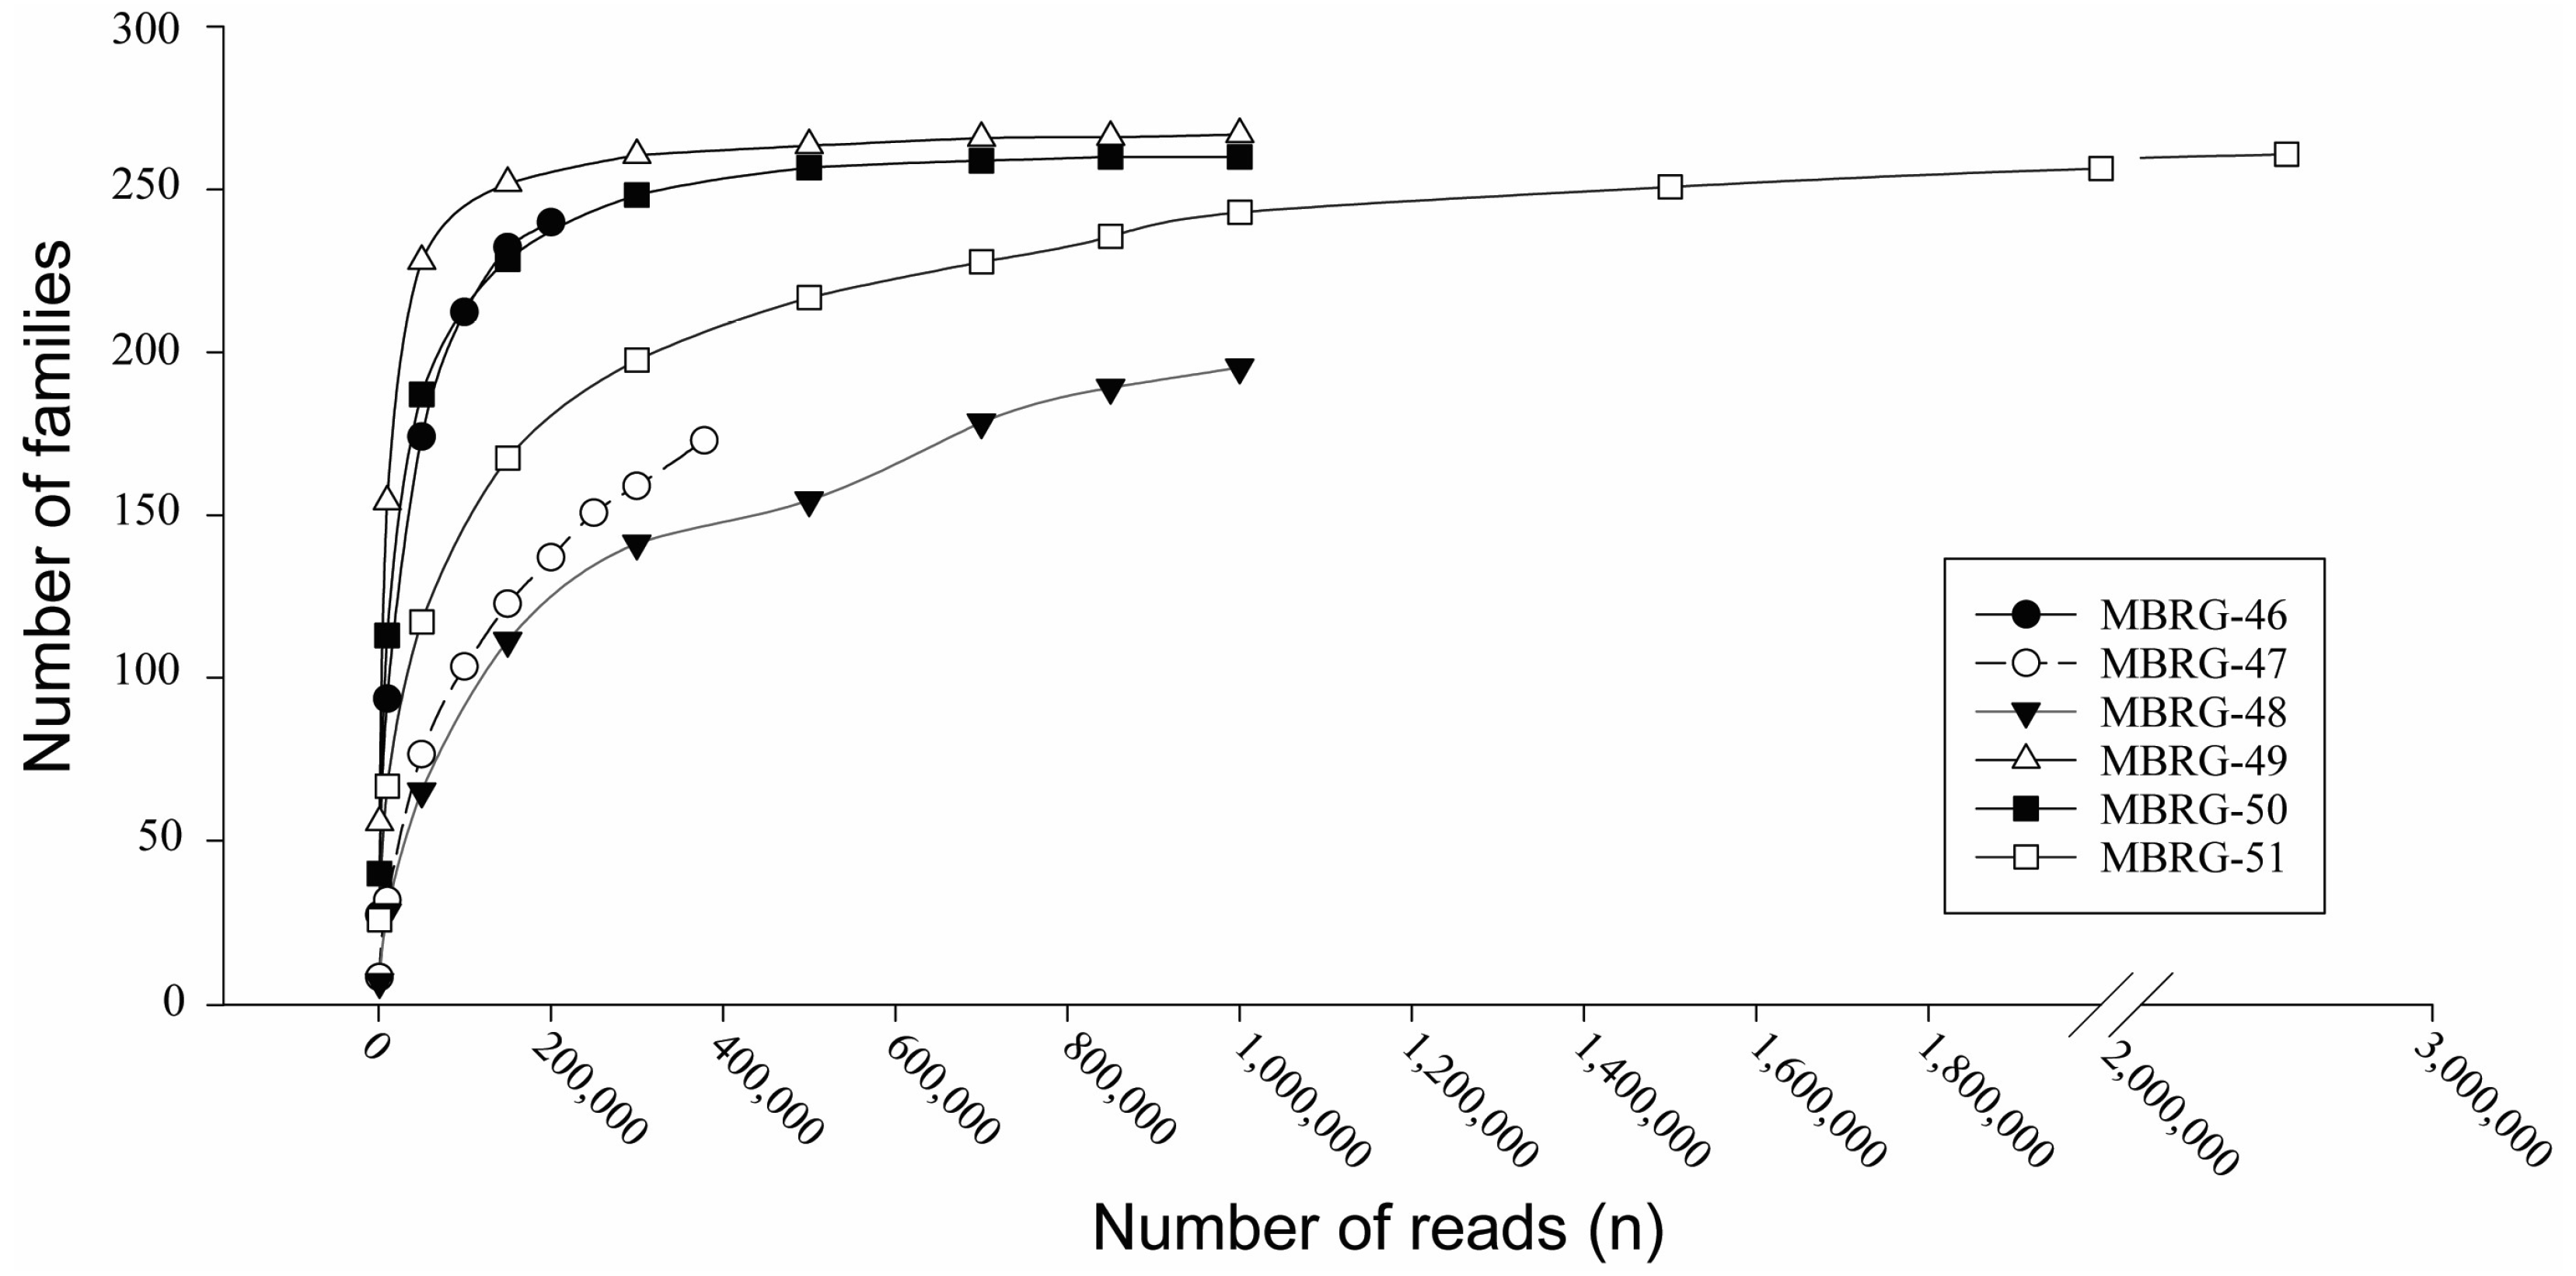
Using the same technique as previously described rarefaction curves were created for all six mucosal samples from the Northeast Arctic cod (see Figure A1) [21]. Using the Kaiju output files, which contained the identified bacterial families from the six fecal samples, rarefaction curves were created. Each output file was first transformed into "rarefaction reports," which have a large number of lines called reads (i.e., up to 3 million), where each line/read corresponds to a single bacterial family. As a result, one specific bacterial family can be represented by numerous lines or reads. Finally, yet importantly, rarefaction curves were created utilizing the "rarefaction report" from each distinct sample, where bacterial families were chosen randomly at various read counts ranging from 1000 to ca. 3 million reads depending on the number of reads available for each distinct sample. A family, however, was only represented once and as a singular family in the rarefaction curves when it was found in a sample more than once.
2.5. Taxonomic Profiling and Metagenome-Assembled Genomes (MAGs)
After removing host DNA and quality-trimming, we obtained an average of 1.98 million reads per sample with an average length of 92 bp. The processed sequencing reads were used for taxonomic classification using Kaiju version 1.6.2 [26] with default settings. We instructed Kaiju to analyze the reads using protein sequences from the MarDb and MarRef version 2 databases (specific databases for marine organisms) [27], as previously escribed [21]. Kaiju created a taxonomic report for the six samples that contained family names and the number of assigned reads. Percentage identified bacterial families were calculated using only classified reads.
Next, we assembled the six metagenomes into longer contigs using MetaSpades v3.15.3 [28] and attempted to produce MAGs using Maxbin v.2.2.7 [29]. All six samples were assembled successfully. However, after running Maxbin and adjusting the available options of the tool (e.g., contigs-length) we were able to obtain sufficient quality MAGs for only three samples (i.e., MBRG 49, MBRG 50 and MBRG 51). After trying to bin the assemblies with several various “length_contigs” options, we were able to optimize the bins for the three samples as following: 1) 800 bp for MBRG-49, 2) 2000 bp for MBRG-50 and 3) 500 bp for MBRG-51. The obtained MAGs were further checked for completeness and contamination using CheckM v1.0.12 [30] with default parameters. The criteria for validating and keeping bins were set to a completeness of at least 50% and contamination lower than 10%. Then, we used Sendsketch from the BBMap package [31] to identify the bacteria represented in the individual bins for each of the three samples. In order to check the identity results by sendsketch, we used BRIG v 0.95 (BLAST Ring Image Generator) with blast+ v.2.13.0 [32] that compared the bins against reference genomes using nucleotide fasta files.
2.6. Phylogenomic Analyses of the MAGs
The EzTree pipeline [33] was used as previously described [21] for producing concatenated multiple sequence alignments from identified single-copy markers genes in reference genomes and MAGs. Finally, we used MEGA 11 [34] for creating the Maximum likehood (ML) phylogenetic trees from the sequence alignments as described earlier [21] and using the JTT+G+I evolutionary model, and the stability of nodes was tested with a bootstrap analysis (ML/JTT+G+I/200 pseudoreplicates).
3. Results
3.1. DNA Sequencing Revealed Three Different Taxonomic Profile Types among Six Mucosal Samples from Migrating Northeast Arctic Cod
The taxonomic profile of the adherent bacteria in the intestinal tract of Atlantic cod was calculated using Kaiju v.1.6.2 [26] and the MarDB/MarRef v.2 marine databases [27], essentially as previously described [21]. Rarefaction curve calculations showed that for three of the six samples, the number of discovered bacterial families were saturated. For the remaining three samples, more sequence depth would likely result in a higher number of discovered families (Figure A1). We can conclude that even though we obtained limited sequence reads of bacterial origin, our data is sufficient for evaluating the most abundant families and the overall taxonomic profile of samples.
A graphical representation of the microbial diversity in the intestinal mucus of six Atlantic cod is shown in Figure 3.
Our main finding is that we found three very different taxonomic profiles among the samples. These are donated as Type I, Type II and Type III in the figure. Averaged over three samples (MBRG 46, MBRG 47 and MBRG 50) Type I is dominated in numbers by Pseudomonaceae (44%), followed by Xanthomonadaceae (13%). Averaged over two samples, Type II is highly dominated in numbers by one family, i.e., Vibrionaceae (65%). Finally, Type III comprises one sample only, which contains 76% representatives from Enterobacteriaceae. This was to us surprising since previous studies of > 40 Atlantic cod, consistently identified Vibrionaceae as the dominating bacterial family in the intestinal tract, either in the transient gut content (i.e., feces) [21,35], or in the mixed fecal/mucosal material [20,36,37]. Another notable observation is that on average, 229 families were identified per sample. This is somewhat lower than what we reported for fecal samples (268 families)[21].
In conclusion, we found three main types of taxonomic profiles among the six sequenced mucosal samples from the gut of Atlantic cod. On average, 229 families were found per sample.
3.2. Binning of Assembled Contigs Produce High-Completeness bins/MAGs
To further study the most abundant bacteria in each mucosal sample, we next produced metagenome-assembled genomes (MAGs). This was done by first assembling the metagenomics sequence data into contigs using MetaSPades v.3.15.3 [28], followed by separating them into bins using Maxbin v.2.2.7 [29]. We obtained five high-completeness bins/MAGs for three mucosal samples, where each sample represented one taxonomic profiling (MBRG 49 (Type II), MBRG 50 (Type I) and MBRG 51 (Type III), as seen in Figure 3). Table 3 describes the five obtained high-completeness MAGs/bins.
The remaining three mucosal samples only produced low-quality bins (due to limited read lengths and low number of classified reads) and were discarded (see Materials and Methods for more details). Additionally, we analyzed the five high-completeness MAGs/bins from samples MBRG 49 (Bins 1–3), MBRG 50 (Bin 1) and MBRG 51 (Bin 1) using Sendsketch from BBMap package [31]. Sendsketch performs approximate taxonomic classification by using a hash function to create sketches (a sketch is a collection of k-mers, each typically 31-nt in size) that are compared to sketches made from reference genomes (Refseq). Three high-completeness bins from sample MBRG-49 were all identified as Photobacterium iliopiscarium, a bin from sample MBRG-50 was identified as Pseudomonas fluorescens, and a bin from sample MBRG-51 was identified as Shigella sp./Escherichia coli, respectively. This result agrees with the most abundant families identified by Kaiju (see Figure 3), but further narrows the bacteria to genus or species level. The size of one bin per sample correspond well with the expected sizes of reference genomes, i.e., 4.17 Mb (Bin 3 from sample MBRG-49) versus 4.26 Mb (P. iliopiscarium ATCC 51760), 7.7 Mb (Bin 2 from sample MBRG-50) versus 6.5 Mb (P. fluorescens), and 4.53 Mb (Bin 1 from sample MBRG 51) versus 4.55 Mb (Shigella PAMC 28760). Figure 4 shows a BRIG analysis [32] of the three selected MAG/RefSeq pairs.
BRIG uses BLAST to map assembled contigs onto the reference genome. The analysis further supports the high level of similarity and coverage in each comparison. In summary, we have identified the most abundant species from each taxonomic profile type.
3.3. EzTree Robustly Places High-Completeness Bins on Maximum Likelihood Trees
We next used a phylogenomic approach to more robustly find the identity of MBRG-49_bin3, MBRG-50_bin1 and MBRG-51_bin1 (i.e., the three selected bins described above). To do this we first constructed three respective datasets: (i) one including MBRG-49_bin3 plus Photobacterium reference genomes, (ii) one with MBRG-50_bin1 plus Pseudomonas reference genomes, and finally (iii) MBRG-51_bin1 plus Enterobacteriaceae reference genomes. Each dataset was next subjected to a EzTree analysis [33], which identifies single copy marker genes, and then aligns and concatenates the marker genes into one large sequence alignment. The final protein datasets consisted of 96, 282 and 81 concatenated marker genes, respectively. Finally, a Maximum likelihood (ML) tree was generated from each dataset using MEGA v.11 [34], with the JTT+G+I evolutionary model, and the stability of nodes was tested with a bootstrap analysis (ML/JTT+G+I/200 pseudoreplicates).
Figure 5 shows that MBRG 49_bin3 (Type II taxonomic profile) is found nested within the Photobacterium phosphoreum clade and is closely related to P. iliopiscarium. The placement of MBRG 49_bin3 (from the adherent microbiota) is identical to that of MAGs identified as part of the transient gut microbiota (see e.g., MBRG-38_bin1 and MBRG-30_bin1 in Figure 5). MBRG 50_bin1 (Type I taxonomic profile) is placed within the Pseudomonas fluorescens group and branches as sister to P. yamanorum (a bacterium found in Antarctica) (Figure 5B). Finally, MBRG 51_bin1 (Type III taxonomic profile) is positioned within Escherichia/Shigella, and is most closely related to Shigella PAMC 28760 (Figure 5C).
4. Discussion
In this study, we describe for the first time the microbial composition of the mucosal tissues of six Northeast Arctic cod (i.e, “migrating Atlantic cod”) by using DNA extracted from intestinal mucus and performing next-generation shotgun sequencing (i.e., a metagenomics approach). We discovered three different taxonomic profiles, denoted “Type I”, “Type II” and “Type III”, among six specimens. Further analyses revealed high-completeness bins/MAGs from each type corresponding to P. yamanorum, P. iliopiscarium and Shigella PAMC 28760, respectively (Figure 4). The general picture for mucosal samples is therefore different from what has been established in previous studies for the transient part (feces) of the intestine, where Vibrionaceae was consistently identified as the most abundant family, either in the transient gut content alone [21,35], or in the mixed fecal/mucosal material [20,36,37,38,39]. This observation agrees with comparative studies on adherent and non-adherent bacteria in the human intestine, using 16S rRNA sequencing [40] or shotgun metagenomics sequencing [41].
This work demonstrates the technical challenges you may encounter when sequencing DNA that has been isolated from mucus DNA, e.g., from the intestinal tract of fish. Using several different protocols, we were able to recover only small amounts of DNA from the outer mucosal layer from the cod intestine. Most of the DNA turned out to be from the host itself (65.5-96.5 %; see Table 2), and not from colonizing bacteria. Similar proportions of host DNA has been reported by others, when human mucosal intestinal samples were used [41]. Moreover, after removing sequence reads from host DNA and low-quality reads, we obtained relatively few and short sequences of bacterial origin (Table 2). Of these, 54% to 98% (average of 72%) remained unclassified, which suggests either that similar sequences are not found in the current databases, or that the sequences were too short to be robustly classified. Despite the low number of classified reads from a few samples (e.g., 1.8% classified reads for MBRG-47), we were able to recover enough reads from the DNA to establish the bacterial diversity (see rarefaction curve in Figure A1) and identify the most abundant bacteria (Figure 3) in the intestinal mucus of Atlantic cod.
Sequencing of 16S rDNA amplicons represents an alternative method to shotgun DNA sequencing, and it offers some advantages: E.g., amplicon sequencing can be successfully done with much smaller amounts of isolated DNA, and the quality of the DNA is less critical since sequences are generated from DNA that has been PCR amplified and purified before sequencing. These are important benefits, and probably why it represents a widely used method. The downside is however that only partial 16S rDNA sequences are generated, hence no information other than the taxonomic profile can be retrieved.
Although the data is limited, our results show that the most abundant adherent bacteria vary considerably between Atlantic cod individuals, whereas previous data from us and others has firmly established that the transient microbiome is similar even between cod individuals sampled from various coastal locations at different time points and seasons [21,37]. We can only speculate why we observe this conspicuous difference. Factors that contribute to the composition of fish microbiota has been suggested to include e.g., host selection, host genetics, developmental stage of the fish host, diet, and environment [42]. Host selection is used to explain why individuals of same species have similar microbiota despite being scattered into different environments and being exposed to different diets [42]. This explanation fits very well with the transient gut microbiome of Atlantic cod, which is highly dominated in numbers by Photobacterium strains (Vibrionaceae) regardless of sex, yearly season, and geographical location. However, the host selection hypothesis does not agree well with our current observations with highly variable adherent gut microbiomes.
Another possible major determinant for the gut microbiome is genetic diversity among Atlantic cod populations. Several studies have indeed revealed moderate to high genetic diversity between Atlantic cod populations that live in different zones of the same marine area [43,44]. For example, Kent and co-workers used 8,076 SNPs to study genetic diversity among Atlantic cod populations in three different Baltic Sea regions [43]. They found a significant correlation between genetic diversity, and geographic distance and bottom salinity. The Barents Sea's varying salinity is driven by riverine freshwater, the North Atlantic current's saltier waters, and less saline Arctic inflows that create unique habitats [45,46]. To summarize, genetic differences among various groups of NEAC and environmental factors such as salinity and temperature might account for the observed variation in the adherent bacterial communities in their intestinal mucus. Finally, differences in diet among populations of cod due to the availability of different prey animals could also be a contributing factor [47]. For example, it is well documented that the composition of species varies spatially in the Barents Sea, many of which are on the diet of Atlantic cod [48,49].
In our study we describe three types of taxonomic profiles, i.e., Type I, Type II and Type III, to describe the adherent gut microbiome in Atlantic cod. These are dominated in numbers by Pseudomonaceae (44%), Vibrionaceae (65%) and Enterobacteriaceae (76%), respectively. For each profile type, P. fluorescens, P. iliopiscarium and Shigella sp. represent the most abundant bacteria. P. fluorescens (abundant in Type I) is a ubiquitous bacterium found in soil, water, and on plants, noted for its versatile metabolism and production of antimicrobial compounds [50]. In addition, the bacterium is found as part of the normal flora in the intestines of healthy fish [38,51,52], and here it has been observed to exert an antagonistic effect by offering protection against infections, and by contributing to the equilibrium of the gut ecosystem [53]. For example, a study by González-Palacios et al. (2018) revealed that two specific strains of P. fluorescens (strains LE89 and LE141), effectively decrease infections by the stramenophile Saprolegnia parasitica, a known pathogen of Rainbow trout [54]. Similarly, P. fluorescens has been reported to counteract Flavobacterium psychrophilum, which is responsible for high mortality rates in rainbow trout within aquaculture settings, as documented by Korkea-aho et al. (2012) [55]. Further supporting these findings, research by Eissen A et al. (2017) identified three biovars of P. fluorescens with antimicrobial properties against harmful pathogens, including Pseudomonas anguilliseptica and Streptococcus faecium [56]. These studies collectively suggest that P. fluorescens not only competes with other bacteria in the gut of Atlantic cod but can also play crucial roles in preserving the health of its host.
In our study, two fish were populated with mainly P. iliopiscarium (abundant in Type II). P. iliopiscarium can be part of the normal microbial community, particularly in marine animals [57]. It is usually monitored and studied because it is associated with sea food and meat spoiling [58,59,60]. The role of P. iliopiscarium in the fish gut is unfortunately not clear [37]. However, many members of Photobacterium genus (e.g., P.phosphoreum) are considered commensal or mutualistic, contributing to the host's health or engaging in beneficial interactions [57,61]. For example, P. phosphoreum is commonly found in the gut of marine fish, where it is believed to play a role in the digestion of food by degrading chitin from crustacean prey [61,62]. In addition, several studies showed the antagonistic property of Photobacterium [37,63]. Our data support that the adherent microbiota from two fish include P. iliopioscarium as the most abundant bacteria. The very presence of P. iliopiscarium in the mucosal layer of two fish in our study suggest that the bacterium may play a pivotal role in nutrient absorption and immune modulation, e.g., by synthesizing essential vitamins and facilitating the breakdown of complex dietary components, thereby directly influencing the host's nutritional status and energy balance.
Finally, Shigella PAMC 2270 was found as the most abundant bacteria in the Type III profile. It should however be noted that the bioinformatic identification of Shigella is not definitive, with E. coli being an equally likely candidate. This is attributed to the close evolutionary and genetic relationship between Shigella and E. coli [64], the latter of which is typically non-pathogenic and a common constituent of the normal gut flora in warm blooded mammals [65]. Shigella/E.coli are also commonly identified in fish intestines [66,67].
5. Conclusions
In conclusion, our study provides the first glimpses into the microbial diversity of the mucosal layer inside the intestinal tract of Northeast Arctic cod, using shotgun sequencing. However, technical challenges represented significant obstacles and limited the number of samples we were able to provide (with high confidence). Therefore, similar future studies would be of value to verify our results, which suggest that there are greater variations in the adherent microbial composition of the mucosal layer, compared to that of the transient feces.
Author Contributions
TLD collected the samples, performed extraction of the mucosal samples, DNA isolation, shipping DNA samples to the Norwegian Sequencing Center (NSC) in Oslo, bioinformatics analyses, participated in the design of the study and drafted the manuscript, figures and tables. PH conceived the study, participated in the design of the study, coordinated and drafted the manuscript and illustrations. PH also collected the cod intestines and helped handling of the intestines during mucus preparations. Both authors read and approved the final manuscript.
Funding
This study was funded through a strategic program from UiT The Arctic University of Norway (Marval project), and the MicroMBT project (grant no. 257146) funded by the marine Biotechnology ERA-NET (ERA-MarineBiotech). The publication charges for this article were funded by UiT, The Arctic University of Norway.
Data Availability Statement
The metagenomics datasets generated during the current study are available under the BioProject number PRJEB59225 and secondary accession number ERP144281 in the European Nucleotide Archive (ENA) [68] at https://www.ebi.ac.uk/ena/browser/view/PRJEB59225. The six metagenomics raw sequences have been deposited as BioSample from SAMEA112445163 to SAMEA112445168.
Acknowledgments
We are grateful to UiT the Arctic University of Norway and the marine Biotechnology ERA-NET (ERA-MarineBiotech) for funding this project, and the UiT The Arctic University of Norway for covering the publication charges. The funders had no role in study design, data collection, and interpretation, or the decision to submit the work for publication.
Conflicts of Interest
The authors declare that they have no competing interests.
Appendix A
Figure A1.
Rarefaction curves for six sequenced mucosal samples showing the number of detected families per sample as a function of the number of reads. The six samples represented as MBRG-46 to MBRG-51 are shown in the figure.
Figure A1.
Rarefaction curves for six sequenced mucosal samples showing the number of detected families per sample as a function of the number of reads. The six samples represented as MBRG-46 to MBRG-51 are shown in the figure.
References
- Esser, D.; Lange, J.; Marinos, G.; Sieber, M.; Best, L.; Prasse, D.; et al. Functions of the microbiota for the physiology of animal metaorganisms. Journal of innate immunity. 2019, 11, 393–404. [Google Scholar] [CrossRef] [PubMed]
- Runge, S.; Rosshart, S.P. The mammalian metaorganism: A holistic view on how microbes of all Kingdoms and niches shape local and systemic immunity. Frontiers in Immunology. 2021, 12, 702378. [Google Scholar] [CrossRef] [PubMed]
- Sepulveda, J.; Moeller, A.H. The effects of temperature on animal gut microbiomes. Frontiers in microbiology. 2020, 11, 384. [Google Scholar] [CrossRef] [PubMed]
- Sender, R.; Fuchs, S.; Milo, R. Revised estimates for the number of human and bacteria cells in the body. PLoS biology. 2016, 14, e1002533. [Google Scholar] [CrossRef] [PubMed]
- Tuddenham, S.; Sears, C.L. The intestinal microbiome and health. Current opinion in infectious diseases. 2015, 28, 464. [Google Scholar] [CrossRef]
- Oren A, Arahal DR, Rosselló-Móra R, Sutcliffe IC, Moore ER: Emendation of Rules 5b, 8, 15 and 22 of the International Code of Nomenclature of Prokaryotes to include the rank of phylum. In.: Microbiology Society; 2021. [CrossRef]
- Finlayson-Trick, E.C.; Getz, L.J.; Slaine, P.D.; Thornbury, M.; Lamoureux, E.; Cook, J.; et al. Taxonomic differences of gut microbiomes drive cellulolytic enzymatic potential within hind-gut fermenting mammals. PloS one. 2017, 12, e0189404. [Google Scholar] [CrossRef]
- Kim, P.S.; Shin, N.-R.; Lee, J.-B.; Kim, M.-S.; Whon, T.W.; Hyun, D.-W.; et al. Host habitat is the major determinant of the gut microbiome of fish. Microbiome. 2021, 9, 166. [Google Scholar] [CrossRef]
- Consortium, T.H.M.P. Structure, function and diversity of the healthy human microbiome. nature. 2012, 486, 207–214. [Google Scholar] [CrossRef]
- Jandhyala, S.M.; Talukdar, R.; Subramanyam, C.; Vuyyuru, H.; Sasikala, M.; Reddy, D.N. Role of the normal gut microbiota. World journal of gastroenterology: WJG. 2015, 21, 8787. [Google Scholar] [CrossRef]
- Jiang, H.-Y.; Ma, J.-E.; Li, J.; Zhang, X.-J.; Li, L.-M.; He, N.; et al. Diets alter the gut microbiome of crocodile lizards. Frontiers in Microbiology. 2017, 8, 2073. [Google Scholar] [CrossRef]
- Korry, B.J.; Belenky, P. Trophic level and proteobacteria abundance drive antibiotic resistance levels in fish from coastal New England. Animal Microbiome. 2023, 5, 16. [Google Scholar] [CrossRef]
- Johny, T.K.; Puthusseri, R.M.; Bhat, S.G. Metagenomic landscape of taxonomy, metabolic potential and resistome of Sardinella longiceps gut microbiome. Archives of Microbiology. 2022, 204, 87. [Google Scholar] [CrossRef] [PubMed]
- Li, H.; Limenitakis, J.P.; Fuhrer, T.; Geuking, M.B.; Lawson, M.A.; Wyss, M.; et al. The outer mucus layer hosts a distinct intestinal microbial niche. Nature communications. 2015, 6, 8292. [Google Scholar] [CrossRef] [PubMed]
- Thursby, E.; Juge, N. Introduction to the human gut microbiota. Biochemical journal. 2017, 474, 1823–1836. [Google Scholar] [CrossRef]
- Herath, M.; Hosie, S.; Bornstein, J.C.; Franks, A.E.; Hill-Yardin, E.L. The role of the gastrointestinal mucus system in intestinal homeostasis: implications for neurological disorders. Frontiers in cellular and infection microbiology. 2020, 10, 248. [Google Scholar] [CrossRef]
- Gustafsson, J.K.; Johansson, M.E. The role of goblet cells and mucus in intestinal homeostasis. Nature reviews Gastroenterology & hepatology. 2022, 19, 785–803. [Google Scholar] [CrossRef]
- Cornuault, J.K.; Byatt, G.; Paquet, M.-E.; De Koninck, P.; Moineau, S. Zebrafish: a big fish in the study of the gut microbiota. Current Opinion in Biotechnology. 2022, 73, 308–313. [Google Scholar] [CrossRef]
- Star, B.; Haverkamp, T.H.; Jentoft, S.; Jakobsen, K.S. Next generation sequencing shows high variation of the intestinal microbial species composition in Atlantic cod caught at a single location. BMC microbiology. 2013, 13, 1–6. [Google Scholar] [CrossRef] [PubMed]
- Riiser, E.S.; Haverkamp, T.H.; Varadharajan, S.; Borgan, Ø.; Jakobsen, K.S.; Jentoft, S.; et al. Metagenomic shotgun analyses reveal complex patterns of intra-and interspecific variation in the intestinal microbiomes of codfishes. Applied and Environmental Microbiology. 2020, 86, e02788-19. [Google Scholar] [CrossRef]
- Le Doujet, T.; De Santi, C.; Klemetsen, T.; Hjerde, E.; Willassen, N.-P.; Haugen, P. Closely-related Photobacterium strains comprise the majority of bacteria in the gut of migrating Atlantic cod (Gadus morhua). Microbiome. 2019, 7, 1–12. [Google Scholar] [CrossRef]
- Chomczynski, P.; Mackey, K.; Drews, R. Wilfinger WDNAzol®: a reagent for the rapid isolation of genomic DNA. Biotechniques. 1997, 22, 550–553. [Google Scholar] [CrossRef] [PubMed]
- Wingett SW, Andrews S. FastQ Screen: A tool for multi-genome mapping and qualit y control [version 1; peer review: 3 approved, 1 approved with. 2018. [CrossRef]
- Bolger, A.M.; Lohse, M.; Usadel, B. Trimmomatic: a flexible trimmer for Illumina sequence data. Bioinformatics. 2014, 30, 2114–2120. [Google Scholar] [CrossRef]
- Andrews, S. A quality control tool for high throughput sequence data. 2010. http://www.bioinformatics.babraham.ac.uk/projects/fastqc/ (accessed on 2 February 2023).
- Menzel, P.; Ng, K.L.; Krogh, A. Fast and sensitive taxonomic classification for metagenomics with Kaiju. Nature communications. 2016, 7, 11257. [Google Scholar] [CrossRef]
- Klemetsen, T.; Raknes, I.A.; Fu, J.; Agafonov, A.; Balasundaram, S.V.; Tartari, G.; et al. The MAR databases: development and implementation of databases specific for marine metagenomics. Nucleic acids research. 2018, 46, D692-D9. [Google Scholar] [CrossRef] [PubMed]
- Nurk, S.; Meleshko, D.; Korobeynikov, A.; Pevzner, P.A. metaSPAdes: a new versatile metagenomic assembler. Genome research. 2017, 27, 824–834. [Google Scholar] [CrossRef]
- Wu, Y.-W.; Tang, Y.-H.; Tringe, S.G.; Simmons, B.A.; Singer, S.W. MaxBin: an automated binning method to recover individual genomes from metagenomes using an expectation-maximization algorithm. Microbiome. 2014, 2, 1–18. [Google Scholar] [CrossRef]
- Parks, D.H.; Imelfort, M.; Skennerton, C.T.; Hugenholtz, P.; Tyson, G.W. CheckM: assessing the quality of microbial genomes recovered from isolates, single cells, and metagenomes. Genome research. 2015, 25, 1043–1055. [Google Scholar] [CrossRef] [PubMed]
- Bushnell B: BBMap: a fast, accurate, splice-aware aligner. In.: Lawrence Berkeley National Lab.(LBNL), Berkeley, CA (United States); 2014.
- Alikhan, N.-F.; Petty, N.K.; Ben Zakour, N.L.; Beatson, S.A. BLAST Ring Image Generator (BRIG): simple prokaryote genome comparisons. BMC genomics. 2011, 12, 1–10. [Google Scholar] [CrossRef]
- Wu, Y.-W. ezTree: an automated pipeline for identifying phylogenetic marker genes and inferring evolutionary relationships among uncultivated prokaryotic draft genomes. BMC genomics. 2018, 19, 7–16. [Google Scholar] [CrossRef]
- Tamura, K.; Stecher, G.; Kumar, S. MEGA11: molecular evolutionary genetics analysis version 11. Molecular biology and evolution. 2021, 38, 3022–3027. [Google Scholar] [CrossRef]
- Magnuson, J.T.; Monticelli, G.; Schlenk, D.; Bisesi Jr, J.H.; Pampanin, D.M. Connecting gut microbiome changes with fish health conditions in juvenile Atlantic cod (Gadus morhua) exposed to dispersed crude oil. Environmental Research. 2023, 234, 116516. [Google Scholar] [CrossRef]
- Riiser, E.S.; Haverkamp, T.H.; Borgan, Ø.; Jakobsen, K.S.; Jentoft, S.; Star, B. A single Vibrionales 16S rRNA oligotype dominates the intestinal microbiome in two geographically separated Atlantic cod populations. Frontiers in Microbiology. 2018, 1561. [Google Scholar] [CrossRef] [PubMed]
- Riiser, E.S.; Haverkamp, T.H.; Varadharajan, S.; Borgan, Ø.; Jakobsen, K.S.; Jentoft, S.; et al. Switching on the light: using metagenomic shotgun sequencing to characterize the intestinal microbiome of Atlantic cod. Environmental Microbiology. 2019, 21, 2576–2594. [Google Scholar] [CrossRef] [PubMed]
- Ringø, E.; Sperstad, S.; Myklebust, R.; Refstie, S.; Krogdahl, Å. Characterisation of the microbiota associated with intestine of Atlantic cod (Gadus morhua L. ): the effect of fish meal, standard soybean meal and a bioprocessed soybean meal. Aquaculture. 2006, 261, 829–841. [Google Scholar] [CrossRef]
- Dhanasiri, A.K.; Brunvold, L.; Brinchmann, M.F.; Korsnes, K.; Bergh, Ø.; Kiron, V. Changes in the intestinal microbiota of wild Atlantic cod Gadus morhua L. upon captive rearing. Microbial ecology. 2011, 61, 20–30. [Google Scholar] [CrossRef]
- Zoetendal, E.G.; von Wright, A.; Vilpponen-Salmela, T.; Ben-Amor, K.; Akkermans, A.D.; de Vos, W.M. Mucosa-associated bacteria in the human gastrointestinal tract are uniformly distributed along the colon and differ from the community recovered from feces. Applied and environmental microbiology. 2002, 68, 3401–3407. [Google Scholar] [CrossRef] [PubMed]
- Vaga, S.; Lee, S.; Ji, B.; Andreasson, A.; Talley, N.J.; Agréus, L.; et al. Compositional and functional differences of the mucosal microbiota along the intestine of healthy individuals. Scientific reports. 2020, 10, 14977. [Google Scholar] [CrossRef]
- Luan, Y.; Li, M.; Zhou, W.; Yao, Y.; Yang, Y.; Zhang, Z.; et al. The fish microbiota: Research progress and potential applications. Engineering. 2023. [Google Scholar] [CrossRef]
- Wenne, R.; Bernaś, R.; Kijewska, A.; Poćwierz-Kotus, A.; Strand, J.; Petereit, C.; et al. SNP genotyping reveals substructuring in weakly differentiated populations of Atlantic cod (Gadus morhua) from diverse environments in the Baltic Sea. Scientific Reports. 2020, 10, 9738. [Google Scholar] [CrossRef]
- Barney, B.T.; Munkholm, C.; Walt, D.R.; Palumbi, S.R. Highly localized divergence within supergenes in Atlantic cod (Gadus morhua) within the Gulf of Maine. BMC genomics. 2017, 18, 1–14. [Google Scholar] [CrossRef]
- Loeng, H. Features of the physical oceanographic conditions of the Barents Sea. Polar research. 1991, 10, 5–18. [Google Scholar] [CrossRef]
- Sakshaug, E.; Johnsen, G.; Kovacs, K. Ecosystem Barents Sea. Tapir Acad. Press; 2009.
- Ringø, E.; Zhou, Z.; Vecino, J.G.; Wadsworth, S.; Romero, J.; Krogdahl, Å.; et al. Effect of dietary components on the gut microbiota of aquatic animals. A never-ending story? Aquaculture nutrition. 2016, 22, 219–282. [Google Scholar] [CrossRef]
- Johannesen, E.; Høines, Å.S.; Dolgov, A.V.; Fossheim, M. Demersal fish assemblages and spatial diversity patterns in the Arctic-Atlantic transition zone in the Barents Sea. PLoS One. 2012, 7, e34924. [Google Scholar] [CrossRef] [PubMed]
- Bogstad, B.; Gjøsæter, H.; Haug, T.; Lindstrøm, U. A review of the battle for food in the Barents Sea: cod vs. marine mammals. Frontiers in Ecology and Evolution. 2015, 3, 29. [Google Scholar] [CrossRef]
- Scales, B.S.; Dickson, R.P.; LiPuma, J.J.; Huffnagle, G.B. Microbiology, genomics, and clinical significance of the Pseudomonas fluorescens species complex, an unappreciated colonizer of humans. Clinical microbiology reviews. 2014, 27, 927–948. [Google Scholar] [CrossRef]
- Ringø, E.; Strøm, E.; Tabachek, J.A. Intestinal microflora of salmonids: a review. Aquaculture Research. 1995, 26, 773–789. [Google Scholar] [CrossRef]
- Gołaś, I.; Szmyt, M.; Potorski, J.; Łopata, M.; Gotkowska-Płachta, A.; Glińska-Lewczuk, K. Distribution of Pseudomonas fluorescens and Aeromonas hydrophila bacteria in a recirculating aquaculture system during farming of european grayling (Thymallus thymallus L.) Broodstock. Water. 2019, 11, 376. [Google Scholar] [CrossRef]
- Shakila, R.; Saravanakumar, R.; Vyla, S.; Jeyasekaran, G.; Jasmine, G. Antagonistic activity of the gut microflora isolated from farmed tiger shrimp (Penaeus monodon). 2007.
- González-Palacios, C.; Fregeneda-Grandes, J.M.; Aller-Gancedo, J.M. Biocontrol of saprolegniosis in rainbow trout (Oncorhynchus mykiss Walbaum) using two bacterial isolates (LE89 and LE141) of Pseudomonas fluorescens. Journal of fish diseases. 2019, 42, 269–275. [Google Scholar] [CrossRef]
- Korkea-Aho, T.; Papadopoulou, A.; Heikkinen, J.; von Wright, A.; Adams, A.; Austin, B.; et al. Pseudomonas M162 confers protection against rainbow trout fry syndrome by stimulating immunity. Journal of applied microbiology. 2012, 113, 24–35. [Google Scholar] [CrossRef]
- Eissa, N.; Abou El-Gheit, N.; Shaheen, A.A. Protective effect of Pseudomonas fluorescens as a probiotic in controlling fish pathogens. American Journal of BioScience. 2014, 2, 175–181. [Google Scholar] [CrossRef]
- Egerton, S.; Culloty, S.; Whooley, J.; Stanton, C.; Ross, R.P. The gut microbiota of marine fish. Frontiers in Microbiology. 2018, 9. [Google Scholar] [CrossRef] [PubMed]
- Hilgarth, M.; Fuertes, S.; Ehrmann, M.; Vogel, R.F. Photobacterium carnosum sp. nov., isolated from spoiled modified atmosphere packaged poultry meat. Systematic and applied microbiology. 2017. [CrossRef]
- Fuertes-Perez, S.; Hauschild, P.; Hilgarth, M.; Vogel, R.F. Biodiversity of Photobacterium spp. isolated from meats. Frontiers in Microbiology. 2019, 10, 480482. [Google Scholar] [CrossRef]
- Figge, M.J.; Cleenwerck, I.; van Uijen, A.; De Vos, P.; Huys, G.; Robertson, L. Photobacterium piscicola sp. nov., isolated from marine fish and spoiled packed cod. Systematic and applied microbiology. 2014, 37, 329–335. [Google Scholar] [CrossRef] [PubMed]
- Itoi, S.; Okamura, T.; Koyama, Y.; Sugita, H. Chitinolytic bacteria in the intestinal tract of Japanese coastal fishes. Canadian journal of microbiology. 2006, 52, 1158–1163. [Google Scholar] [CrossRef] [PubMed]
- Ringø, E.; Zhou, Z.; Olsen, R.; Song, S. Use of chitin and krill in aquaculture–the effect on gut microbiota and the immune system: a review. Aquaculture Nutrition. 2012, 18, 117–131. [Google Scholar] [CrossRef]
- Caipang, C.M.A.; Brinchmann, M.F.; Kiron, V. Antagonistic activity of bacterial isolates from intestinal microbiota of Atlantic cod, Gadus morhua, and an investigation of their immunomodulatory capabilities. Aquaculture research. 2010, 41, 249–256. [Google Scholar] [CrossRef]
- van den Beld, M.; Reubsaet, F. Differentiation between Shigella, enteroinvasive Escherichia coli (EIEC) and noninvasive Escherichia coli. European journal of clinical microbiology & infectious diseases. 2012, 31, 899–904. [Google Scholar] [CrossRef]
- Carlos, C.; Pires, M.M.; Stoppe, N.C.; Hachich, E.M.; Sato, M.I.; Gomes, T.A.; et al. Escherichia coli phylogenetic group determination and its application in the identification of the major animal source of fecal contamination. BMC microbiology. 2010, 10, 1–10. [Google Scholar] [CrossRef]
- Sun, F.; Wang, Y.; Wang, C.; Zhang, L.; Tu, K.; Zheng, Z. Insights into the intestinal microbiota of several aquatic organisms and association with the surrounding environment. Aquaculture. 2019, 507, 196–202. [Google Scholar] [CrossRef]
- Wu, P.; Liu, Y.; Li, C.; Xiao, Y.; Wang, T.; Lin, L.; et al. The Composition of Intestinal Microbiota From Collichthys lucidus and Its Interaction With Microbiota From Waters Along the Pearl River Estuary in China. Frontiers in Environmental Science. 2021, 9, 675856. [Google Scholar] [CrossRef]
- European Nucleotide Archive (ENA). 2018. https://www.ebi.ac.uk/ena/data/view/%3CACCESSION (accessed on 2 February 2023).
Figure 1.
Photos showing the gastrointestinal tract of freshly obtained Northeast Arctic cod. (A) The intestinal tract was obtained from the end of the processing line at a fish factory near Tromsø, Norway (latitude 69.851620, longitude 18.821799). The stomach is to the left in the photo and was filled with mostly undigested capelins. The stomach is followed by the pylorus and pyloric caeca, then the intestine which ends in the rectum (or distal gut). (B) A section from the middle of the intestine was carefully opened and placed on a petri dish. The inner intestinal wall was rinsed and scraped with a clean plastic spoon to obtain the outer mucus layer.
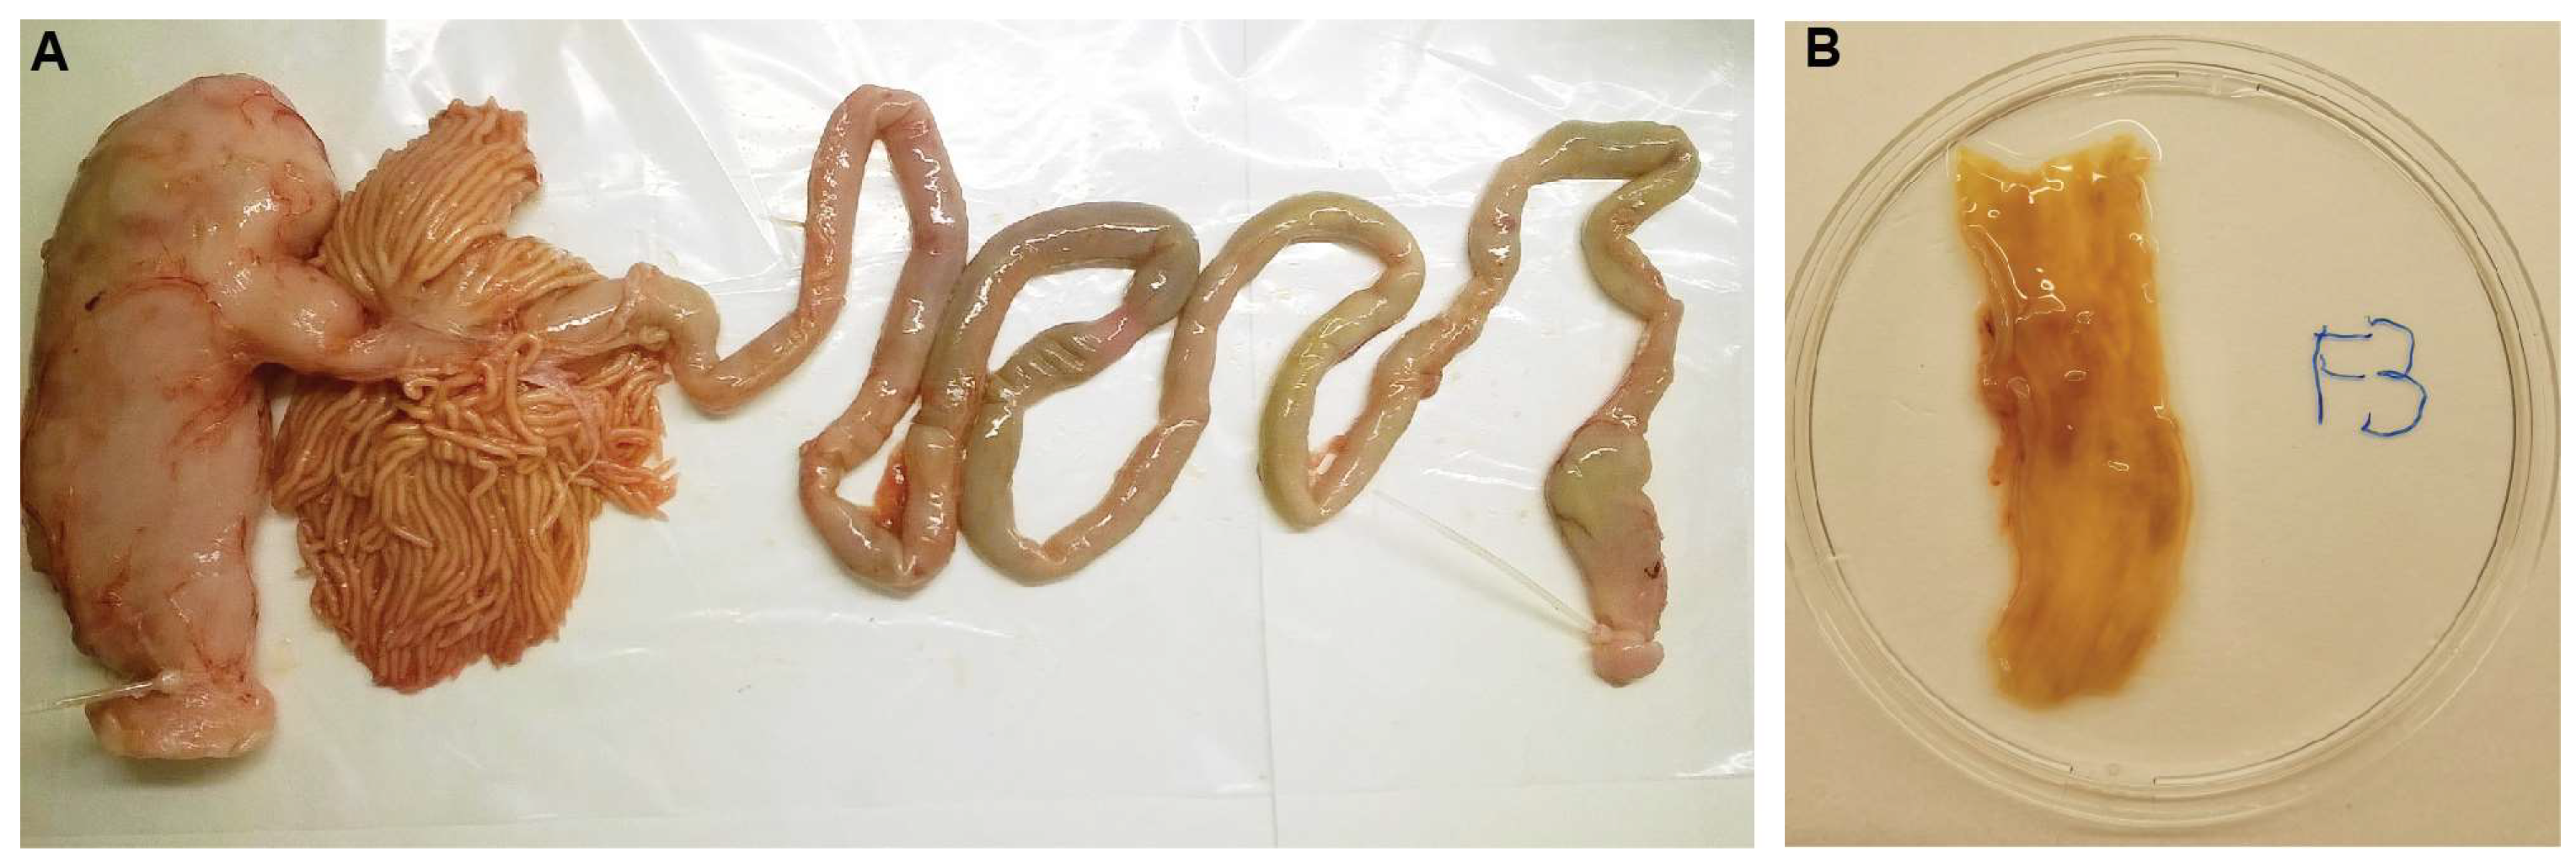
Figure 2.
Schematic representation of the workflow from the handling of fish intestines to analyzing the sequencing data using bioinformatics.
Figure 2.
Schematic representation of the workflow from the handling of fish intestines to analyzing the sequencing data using bioinformatics.
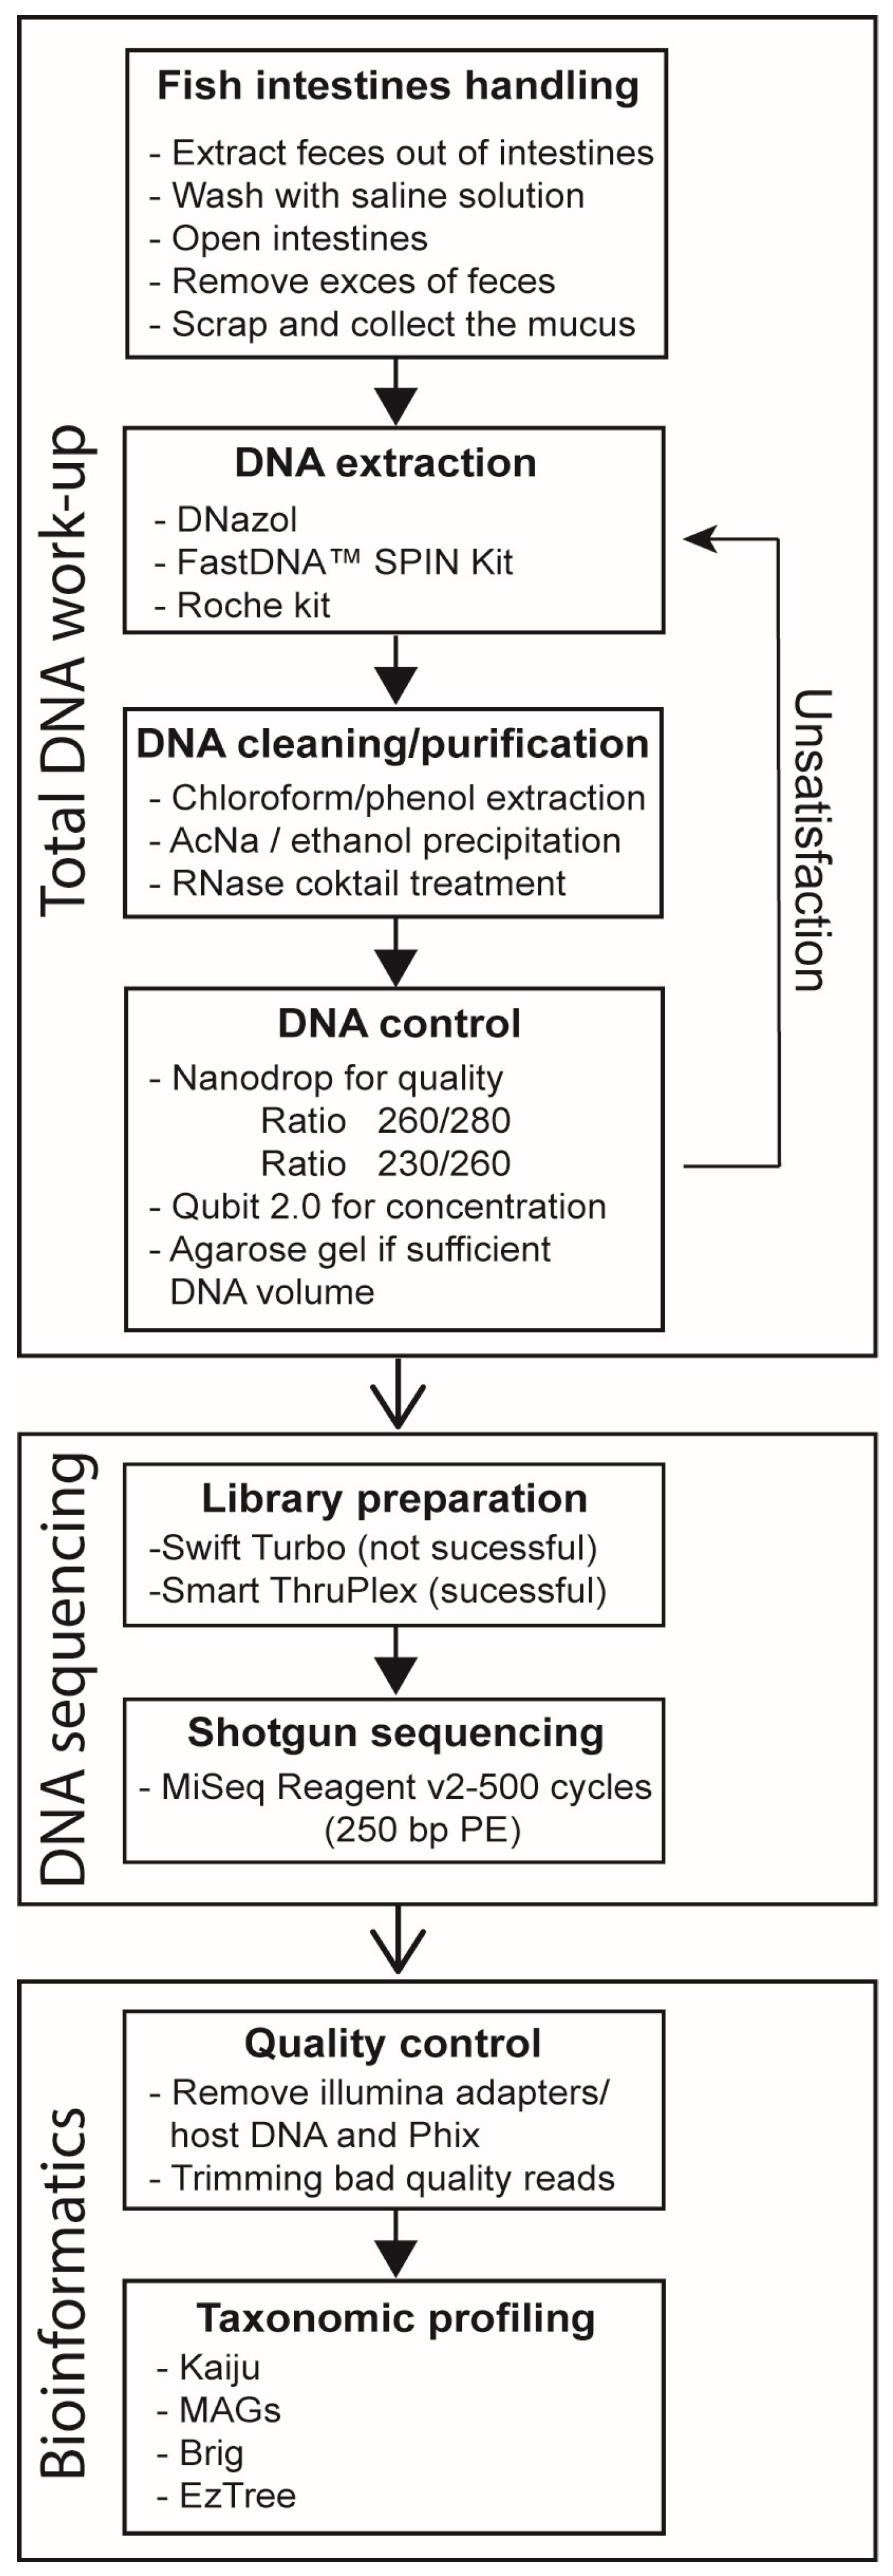
Figure 3.
Bar chart showing the taxonomic profile of the adherent microbiota of the gastrointestinal tract of the Northeast Arctic cod. The most abundant families from six mucosal samples i.e., MBRG-46 to MBRG-51 are shown. Data is based on shotgun DNA sequencing using an Illumina Miseq instrument and the V2 chemistry (250bp end-pair reads). Taxonomic profiles were group into three “types”, i.e., Type I-Type III, based on their most abundant families.
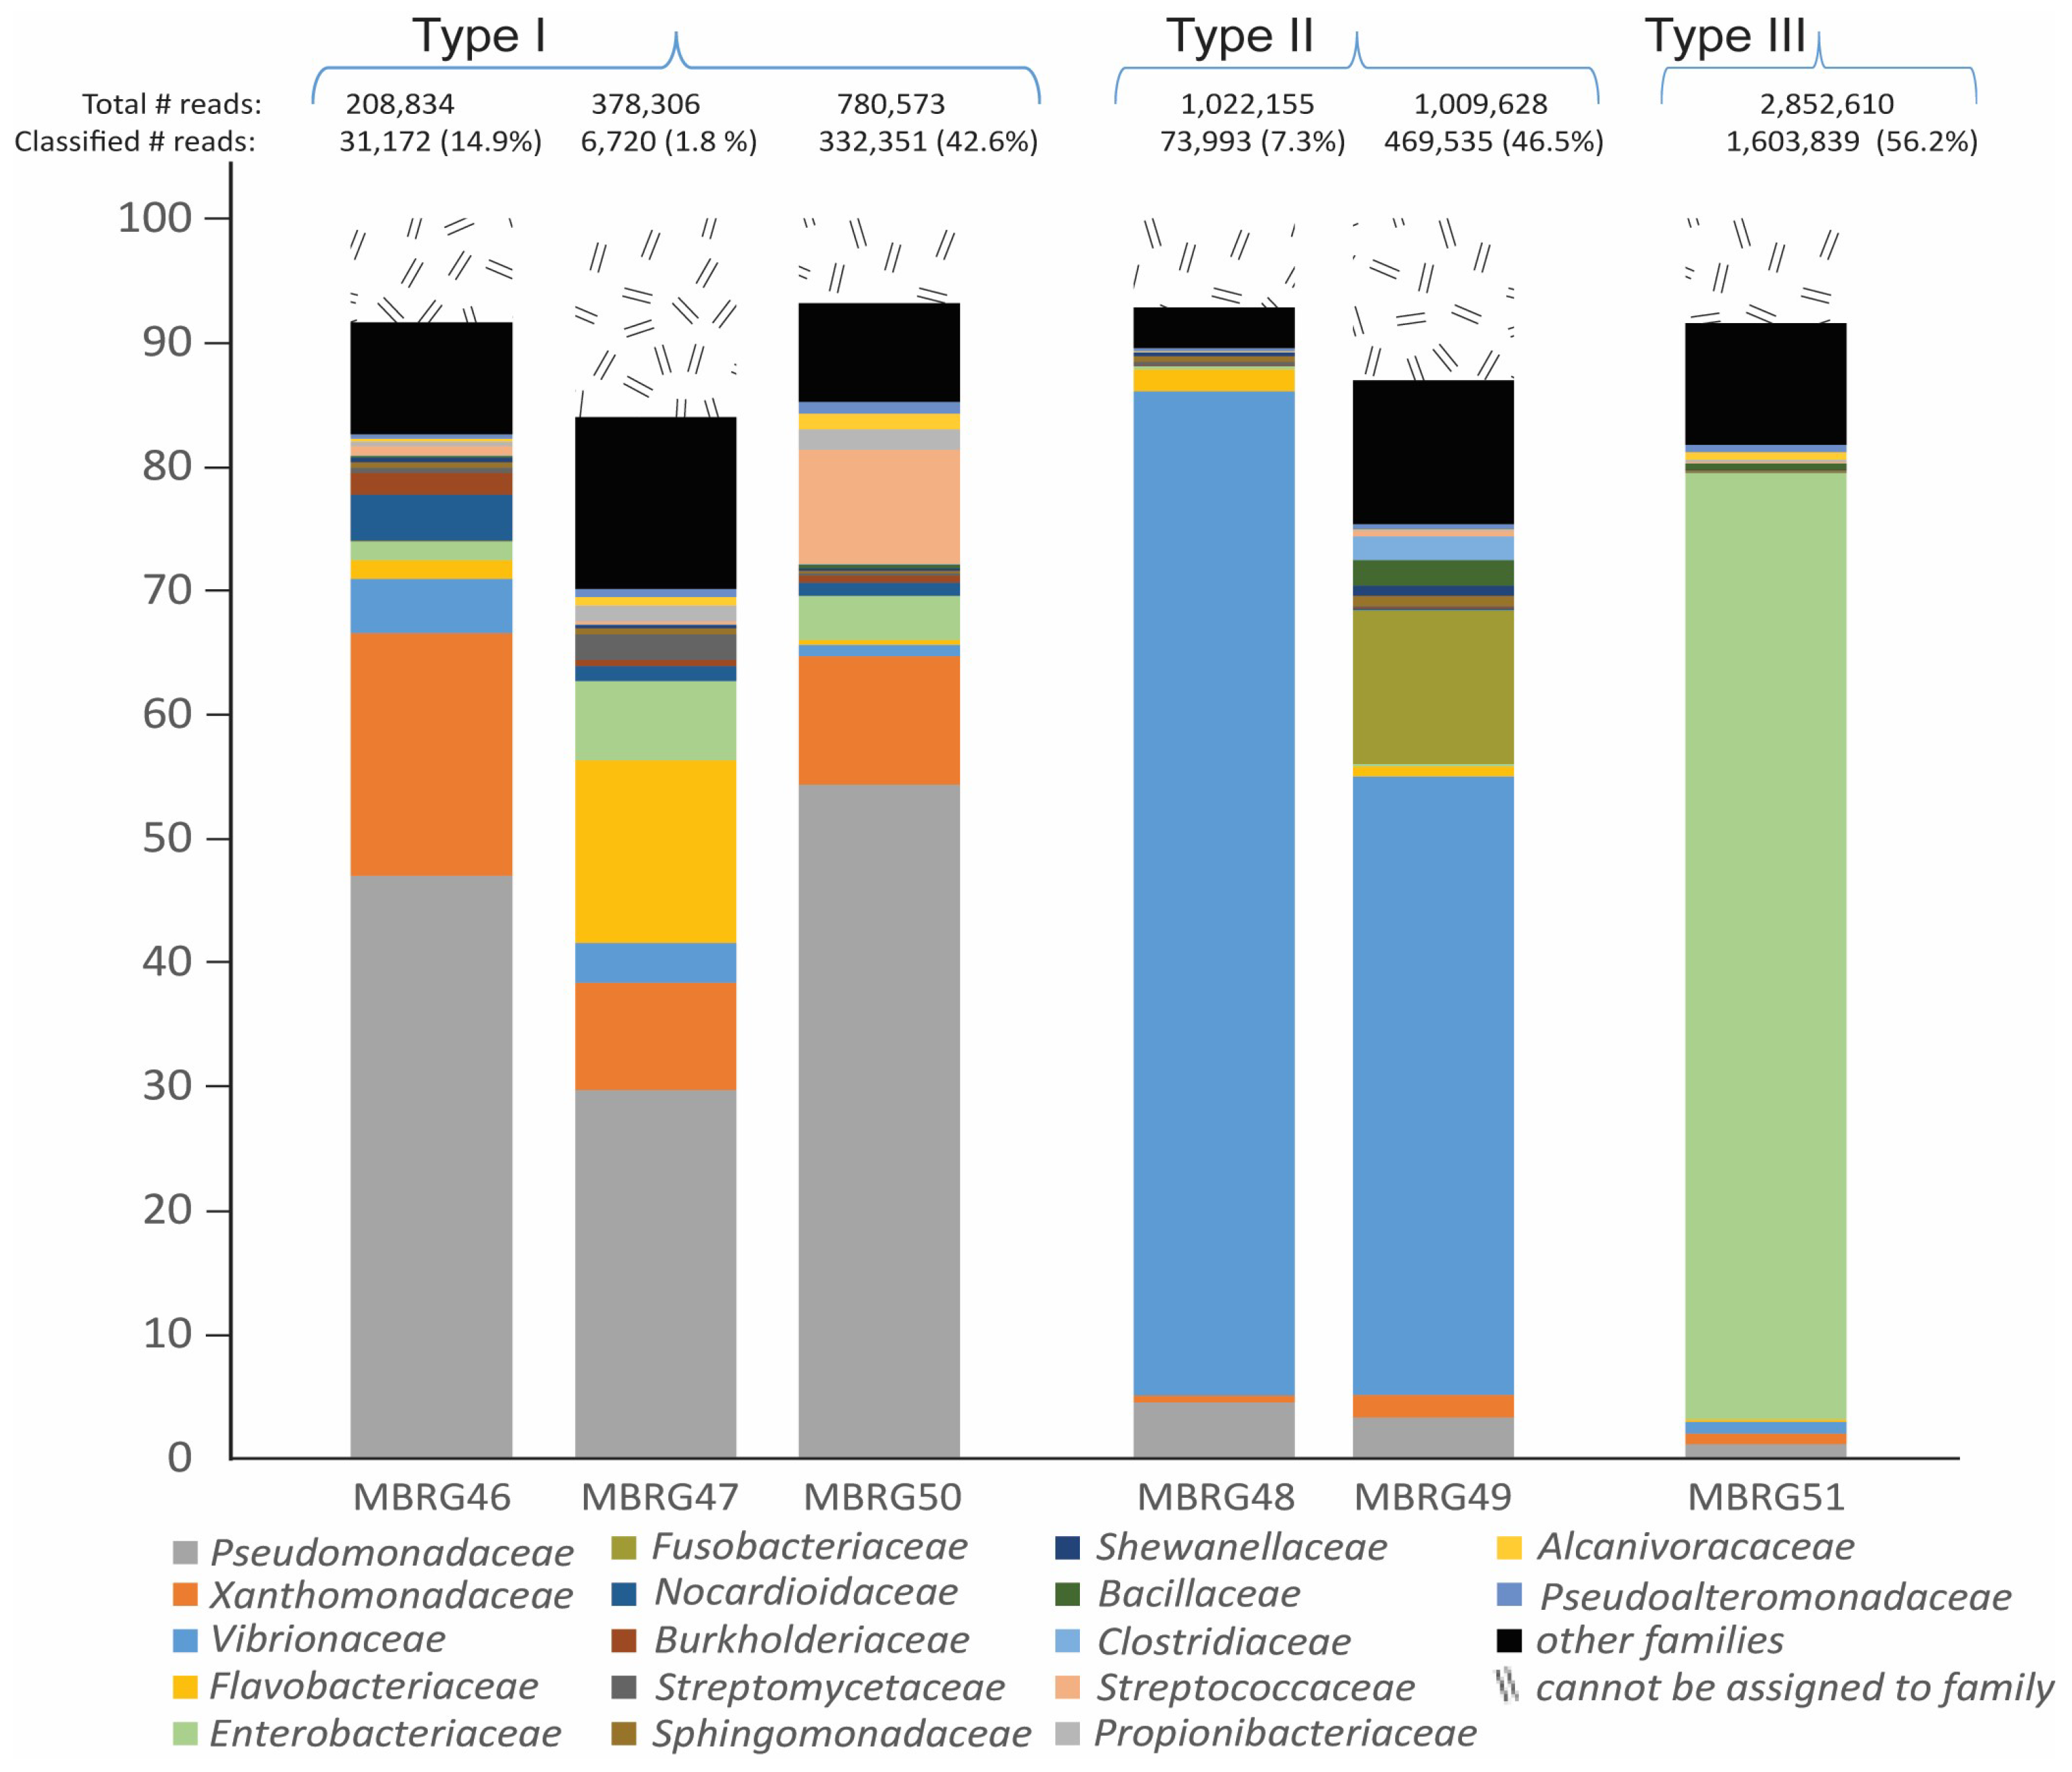
Figure 4.
Comparison between MAGs from each taxonomic profile type and reference genomes. (A) MBRG-49_bin3 (from Type II) was blasted against the reference P. iliopiscarium ATCC 51760, (B) MBRG-50_bin1 (from Type I) was compared with the reference P. fluorescens and (C) MBRG-51_bin1 (from Type III) was compared with the reference Shigella PAMC 28760. The figure was created with the BLAST Ring Image Generator (BRIG) tool. The center black ring represents the reference. GC content and GC skew are displayed as well. Colored rings symbolize the matches between MAGs and the reference, with color intensity showing the identity percentage (100%, 70%, or 50%).
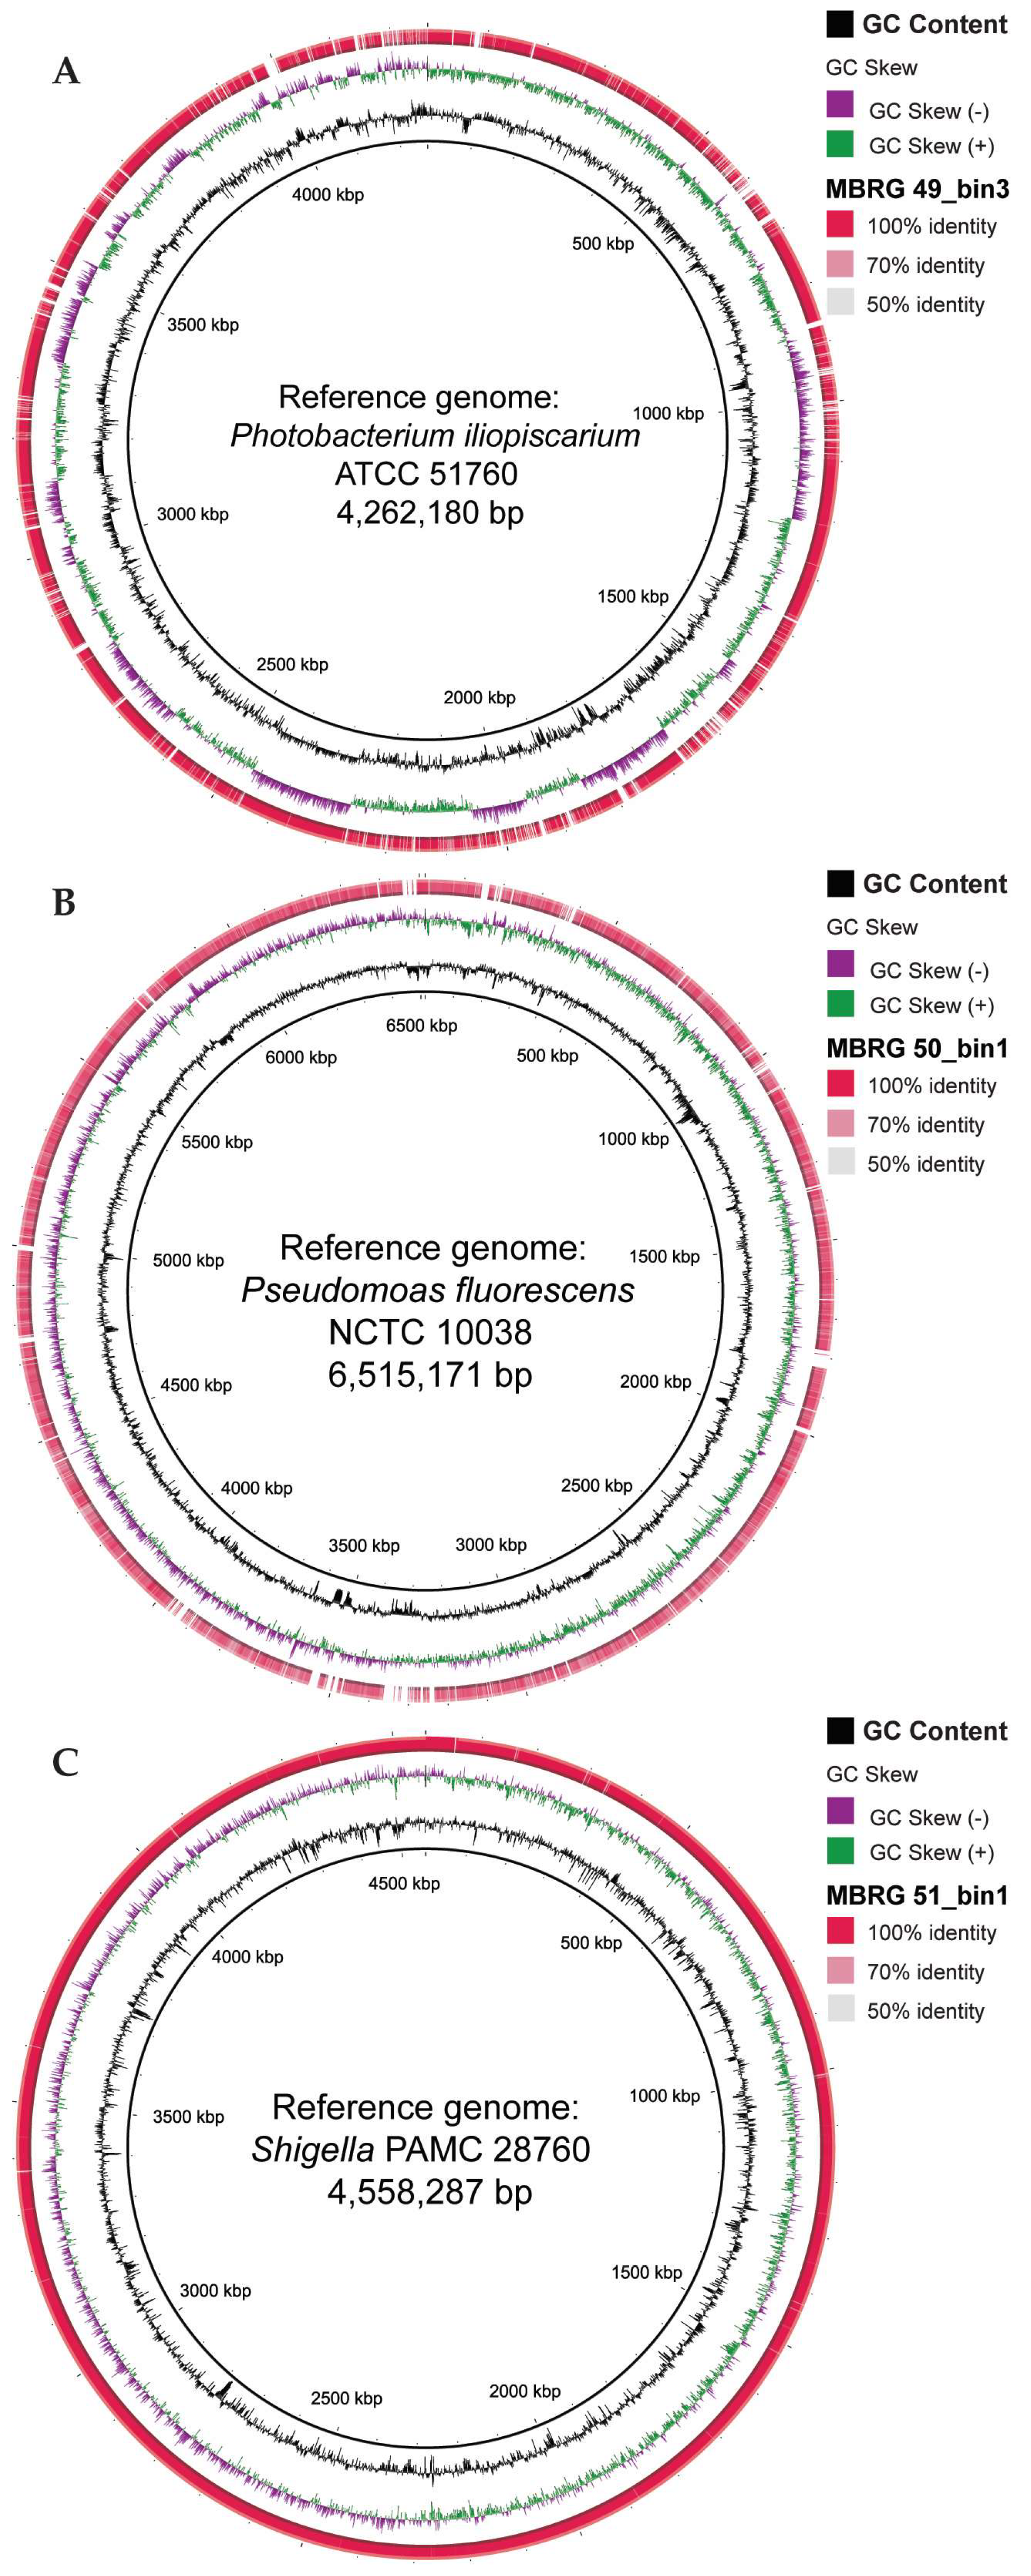
Figure 5.
Phylogenomic analysis of MAGs and reference genomes from the databases. (A) The ML-tree includes MBRG-49_bin3 (highlighted in red bold text), six MAGs from the transient part of the intestine of Atlantic cod [21], twelve reference Photobacterium genomes, and E. coli as the outgroup. (B) The ML-tree shows the phylogenetic relationships between the MAG MBRG-50_bin1 and 19 reference genomes in addition to E. coli (outgroup). (C) ML-tree of MBRG-51_bin1, 15 reference genomes, in addition to two outgroup genomes (Photobacterium). Thick branches represent strong Bootstrap support (≥ 98%). MAGs from this study belong to clades highlighted with a grey vertical bar.
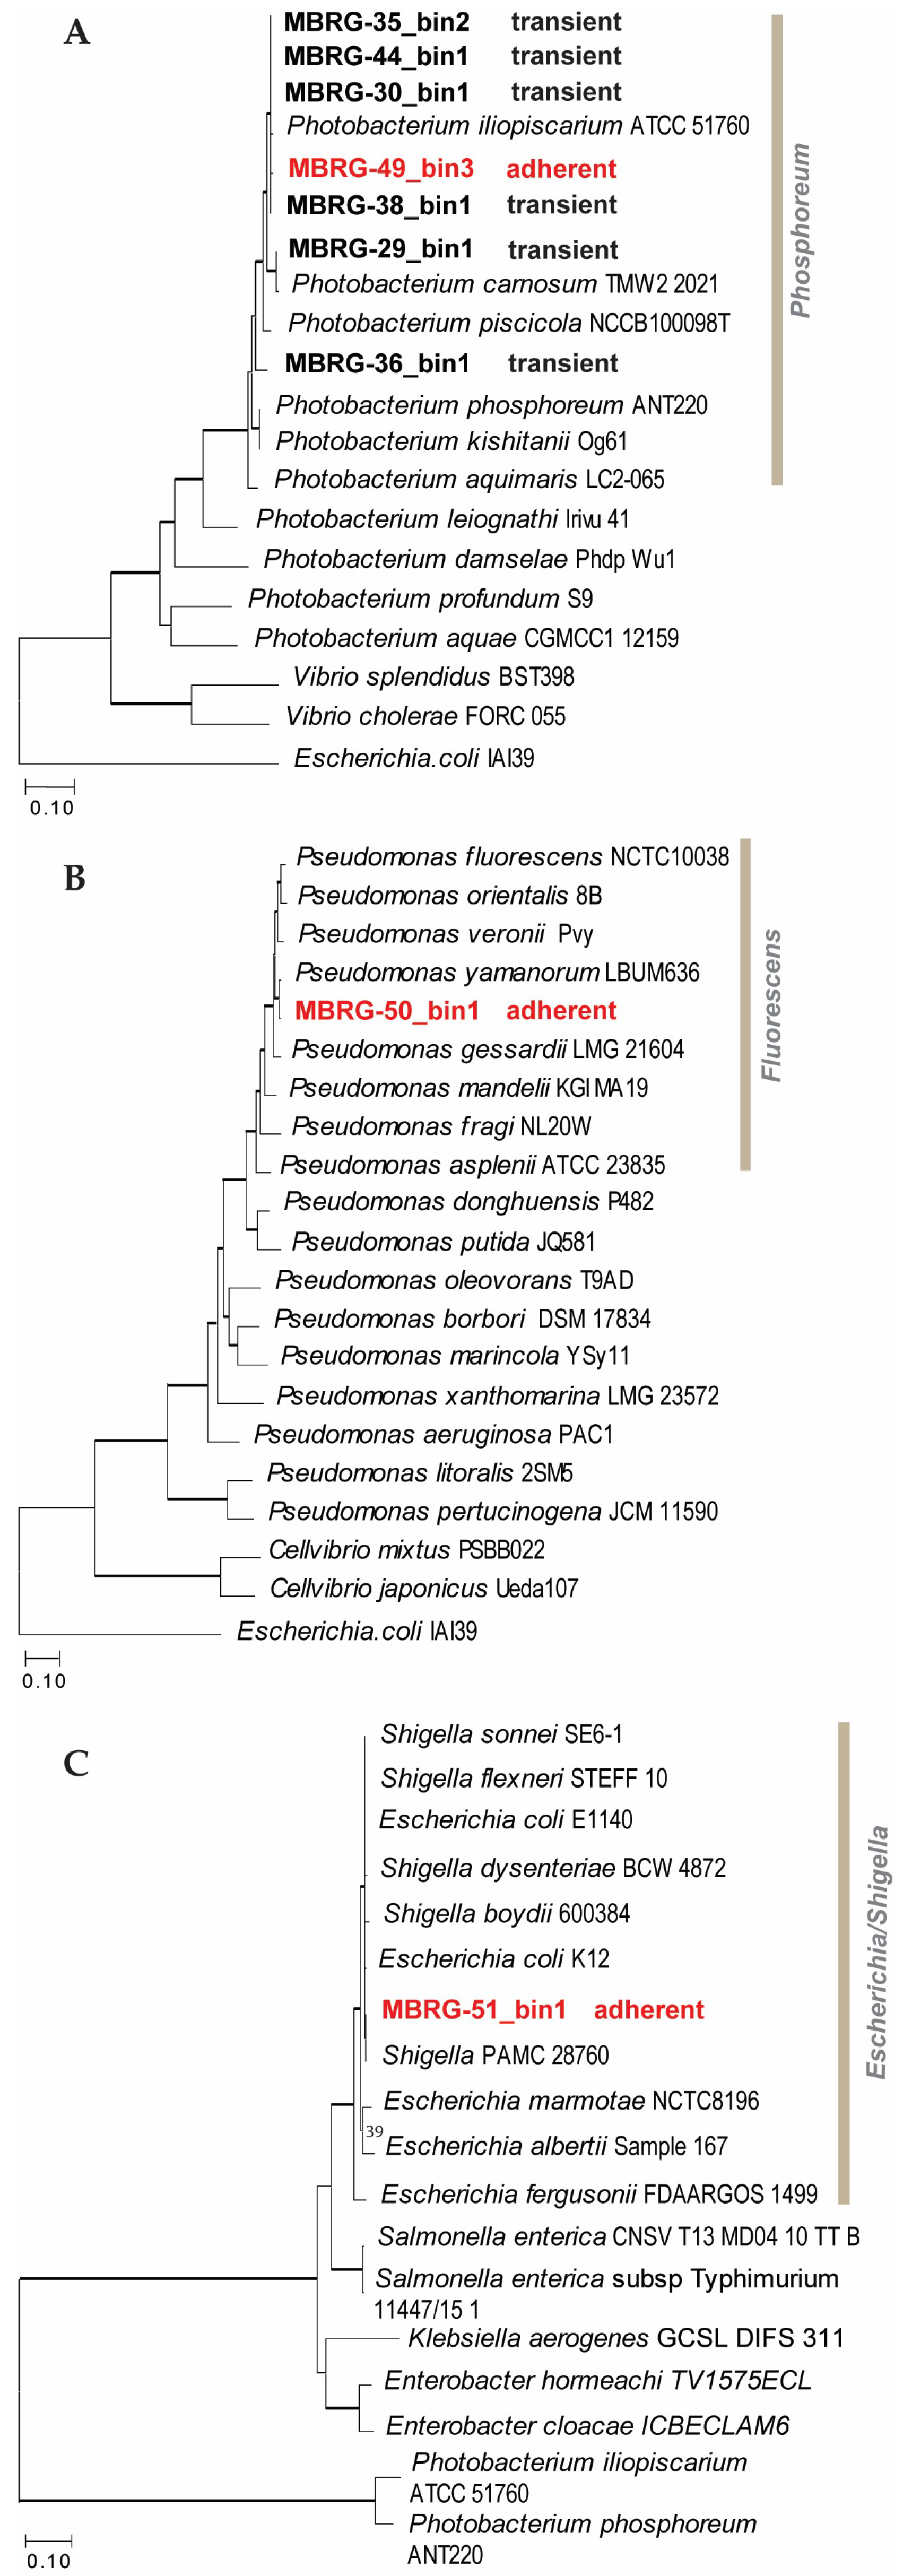

Table 1.
Quality and concentration of DNA extracted from six intestinal mucus samples from Northeast Arctic cod.
Table 1.
Quality and concentration of DNA extracted from six intestinal mucus samples from Northeast Arctic cod.
|
Fish ID |
DNA quality |
DNA Concentration in ng/µL1 |
Available DNA for sequencing |
|||
|---|---|---|---|---|---|---|
| 260/280 | 230/260 | No RNase treatment | Treated with RNase cocktail2 | Volume (µL) | Concentration (ng) | |
| MBRG46 | 1.8 | 1.83 | 2.56 | 0.29 | 15 | 4.35 |
| MBRG47 | 2 | 1.6 | 2.09 | 0.45 | 20 | 9 |
| MBRG48 | 1.86 | 1.84 | 17 | 10 | 19 | 19 |
| MBRG49 | 1.95 | 1.72 | 19.4 | 0.70 | 10| | 7 |
| MBRG50 | 1.91 | 1.73 | 1.6 | 0.11 | 12 | 1.34 |
| MBRG51 | 1.89 | 1.4 | 0.261 | 0.14 | 19 | 2.6 |
1 The concentration of DNA was measured using Qubit 2.0. 2 RNase cocktail contains RNase A and RNase H.
Table 2.
Sequencing information of DNA mucosal samples from the intestines of six Atlantic cod using the MiSeq Illumina platform.
Table 2.
Sequencing information of DNA mucosal samples from the intestines of six Atlantic cod using the MiSeq Illumina platform.
| Fish ID 1 | Raw data | Final dataset | ||
|---|---|---|---|---|
| # reads | Cod DNA (%) | # reads 2 | Average length (bp) | |
| MBRG46 | 9 805 968 | 96.5 | 327 852 | 116 |
| MBRG47* | 12 534 644 | 95.4 | 541 404 | 54 |
| MBRG48* | 21 894 396 | 94.7 | 1 496 529 | 57 |
| MBRG49 | 8 376 018 | 76.4 | 1 964 746 | 106 |
| MBRG50 | 10 955 154 | 86.2 | 1 491 889 | 118 |
| MBRG51* | 16 305 536 | 65.5 | 5 543 182 | 101 |
1 Asterisks denote the samples that were sequenced twice using Miseq Illumina. 2 Number of reads after removal of Cod DNA and trimming of the bad quality reads using trimmomatic v0.39.
Table 3.
Representation of the complete MAGs for each profiling type identified in the intestinal mucus of the Northeast Arctic cod.
Table 3.
Representation of the complete MAGs for each profiling type identified in the intestinal mucus of the Northeast Arctic cod.
| MAXBIN | CHECKM | SENDSKETCH | |||||||||
|---|---|---|---|---|---|---|---|---|---|---|---|
| Sample ID | Bin ID | Rel Abund1 (%) |
Contigs (n) | Comp2 (%) | Genome size (bp) |
GC content (%) | Comp2 (%) | Cont3 (%) | Bacteria IDs | KWID (%) | KID (%) |
| MBRG49 |
1 |
52.5 |
88 |
96.3 |
1 796 209 |
28.5 |
100 |
0 |
Photobacterium iliopiscarium |
1.2 |
0.3 |
| 2 | 34.7 | 274 | 90.7 | 1 902 394 | 30.7 | 98.6 | 0 | Photobacterium iliopiscarium | 12.7 | 3.6 | |
| 3 | 12.8 | 1 396 | 98.1 | 4 168 186 | 41.7 | 95 | 3.2 | Photobacterium iliopiscarium | 80.8 | 50.4 | |
|
MBRG50 |
2 |
36.4 |
653 |
99.1 |
7 662 027 |
60.8 |
96.5 |
6.5 |
Pseudomonas fluorescens |
78.1 |
59.2 |
|
MBRG51 |
3 |
85.3 |
126 |
99.1 |
4 535 891 |
50.6 |
99.4 |
0.2 |
Shigella sp. |
99.9 |
49.8 |
Information for each obtained MAG includes relative abundance of bins, contig number, genome size, GC content, completeness and contamination from Maxbin and CheckM, bacterial ID from sendsketch (RefSeq database's closest matches), % KID (kmer match between query and reference), and KWID (normalized % KID to genome size). 1The abundance of bins as calculated by Maxbin. 2Genome completeness from Maxbin and CheckM. 3Contamination scores from CheckM.
Disclaimer/Publisher’s Note: The statements, opinions and data contained in all publications are solely those of the individual author(s) and contributor(s) and not of MDPI and/or the editor(s). MDPI and/or the editor(s) disclaim responsibility for any injury to people or property resulting from any ideas, methods, instructions or products referred to in the content. |
© 2024 by the authors. Licensee MDPI, Basel, Switzerland. This article is an open access article distributed under the terms and conditions of the Creative Commons Attribution (CC BY) license (http://creativecommons.org/licenses/by/4.0/).
Copyright: This open access article is published under a Creative Commons CC BY 4.0 license, which permit the free download, distribution, and reuse, provided that the author and preprint are cited in any reuse.


