Preprint
Article

The Relationship between Understanding Diversity and Brain Health, Focusing on the Triple Network

Altmetrics

Downloads

75

Views

81

Comments

0

Submitted:

24 September 2024

Posted:

25 September 2024

You are already at the latest version

Alerts
Abstract
Background/Objectives: Interest in diversity is growing worldwide. Today, understanding and social acceptance of diverse people is becoming increasingly important. Therefore, in this study, we aimed to clarify the relationship between gray matter volume (GMV), which is thought to reflect brain health, and understanding of diversity (gender, LGBTQ, and race). Methods: GMV was the value of the Gray Matter Brain Healthcare Quotient (GM-BHQ) based on MRI image analysis. Meanwhile, diversity was calculated from the answers to the psychological questions included in the World Values Survey Wave 7 (WVS7). Results: As a result of the analysis, in the group of participants with the highest understanding of diversity (PHUD. n = 11), not only the GMV at the whole brain level but also the GMV of the central executive network (CEN) and saliency network (SN) were shown to be significantly higher than the theoretical value estimated from sex, age, and BMI at the 5% level. In addition, the GMV of the default mode network (DMN) was also shown to be higher than the theoretical value at the 10% level. Meanwhile, in the group of others (n = 10), there was no significant difference from the theoretical value. These differences between PHUD and others were also observed when comparing the two. Conclusions: These results suggest that understanding diversity requires a healthy brain, centered on three networks that govern rational judgment, emotion regulation, other-awareness, self-awareness, and the valuing of actions. This is the first study to show that brain structure is related to understanding and acceptance of diverse people.
Keywords: 
Subject: Medicine and Pharmacology  -   Psychiatry and Mental Health

1. Introduction

As interest in diversity grows, there is an increasingly lively discussion today about how we can accept diverse people. In the field of neuroscience, there is active research on the differences in brain structure and function between men and women, LGBTQ, and races [1,2,3,4]. On the other hand, there has been little research on what the brains of people who accept such diversity are like. However, to realize a society in which women, LGBTQ, and people of different races can thrive, understanding of and compassion for diversity is necessary. Compassion is said to be the ability to empathize with the suffering of others [5]. Therefore, it is not impossible to hypothesize and analyze the relationship between brain health and understanding of diversity by referring to the mechanism of empathy that has been dealt with in the field of neuroscience. Here, the triple network model [6], which consists of three networks, the saliency network (SN), the central executive network (CEN), and the default mode network (DMN), is essential for dealing with empathy. See Figure 1 for the location of each network.
Of these, the CEN, composed of the dorsolateral prefrontal cortex and the posterior parietal cortex, is important for the active retention and manipulation of information in working memory, attention, problem-solving, decision-making, and self-awareness [7,8,9,10,11,12,13]. The SN is also a network that includes the ventrolateral prefrontal cortex (VLPFC) and the anterior insula (collectively referred to as the frontal insular cortex FIC) and the anterior cingulate cortex (ACC) [14], responding to subjective degrees of salience, whether cognitive, homeostatic, or emotional [15]. The SN also acts as a switch between the CEN and the DMN, inhibiting the latter and activating the former when a salient stimulus or cognitive task is at hand, a process essential for attention and flexible cognitive control [16,17,18,19,20,21]. On the other hand, the DMN includes the medial posterior cortex, including the posterior cingulate cortex (PCC) and part of the frontal bone, the medial prefrontal cortex (MPFC), and the posterior temporal region around the temporoparietal junction (TPJ), including the inferior parietal lobule (IPL) [22,23,24]. The DMN is preferentially activated when the individual is not focused on the external environment [23] and is involved in various areas of cognitive and social processing. That is, the medial prefrontal cortex (MPFC) plays an important role in the social understanding of others, and the connections between the anterior MPFC (aMPFC) and the posterior and anterior cingulate cortices primarily contribute to self-other discrimination. On the other hand, the relationship between the dorsal MPFC (dMPFC) and the temporoparietal junction (TPJ) is mainly related to understanding the mental state of others [25].
Interactions between these networks are related to everyday self-regulation and empathy for others [26,27,28,29,30,31]. However, to the best of our knowledge, no research deals with the relationship between brain structure and function centered on these triple networks and understanding of diversity such as gender, LGBTQ, and race. Therefore, in this study, we will contribute to the development of diversity research by clarifying the characteristics of the brain structure, centered on the triple network, of people who accept diversity.

2. Materials and Methods

2.1. Participants

In this study, GMV values and diversity acceptance were obtained to clarify the brain structure of people who accept diversity. GMV values were obtained from the GM-BHQ based on MRI image analysis. Diversity acceptance was obtained from a questionnaire survey using items included in the WVS7. The MRI images were obtained at the Tokyo Institute of Technology from October to November 2022, and responses to the questionnaire were obtained online from April to May 2023. Twenty-two people (20 men and 2 women) participated in both studies, with a mean age of 47.6 ± 12.7 years. Of the 22 participants in this study, one had type 1 diabetes. Because several previous studies have shown an association between diabetes and brain atrophy [32,33], the data for this one subject were excluded. As a result, the final number of participants was twenty-one people (19 men and 2 women) with a mean age of 47.2 ± 12.8 years. A total of 113 people (91 men and 22 women) with a mean age of 44.8 ± 11.8 years, including these 21 people, participated in obtaining MRI images to be used to calculate theoretical GM-BHQ values controlled for gender, age, and BMI. It should be noted that the 21 people were those who responded to a call to participate in a diversity survey. This type of sampling is prone to bias, with many participants being highly interested in diversity. To control for this bias, a group of participants with the highest understanding of diversity (PHUD) was defined and extracted based on the absolute value of the responses, as described later. All methods were carried out in accordance with the relevant guidelines and regulations, and all participants gave written informed consent before participating, and anonymity was maintained. The study was conducted with the approval of the Tokyo Institute of Technology’s ethical committee for “Brain information cloud (research ethics review committee for human subjects: permission number 2019007)”.

2.2. Questionnaire Items

Gender, LGBTQ, and race questions from the World Value Survey WAVE7 [34], which collects information on the values and beliefs of people around the world were extracted. Below are the three questions that were selected.
  • (i) Gender: Please tell me how essential you think it is as a characteristic of democracy.
  • “Women have the same rights as men.” (Q249)
  • (ii) LGBTQ: Could you please mention any that you would not like to have as neighbors?
  • “Homosexual” (Q22)
  • (iii) Different race: Could you please mention any that you would not like to have as neighbors? “People of a different race” (Q19)
Question (i) above has 10 answers ranging from “1: Not an essential characteristic of democracy” to “10: An essential characteristic of democracy,” and questions (ii) and (iii) have 6 answers ranging from “1: I don’t want to live in the neighborhood” to “6: I can live in the neighborhood,” both on a Likert scale.

2.3. Calculation of ΔGMV

GM-BHQ was used to calculate GMV. GM-BHQ is a standardized index of brain gray matter volume calculated from T1-weighted images with an average of 100 and a standard deviation of 15. It has been approved as an international standard by the standardization organization ITU-T as a “numerical index representing the physical characteristics of the brain that indicate health-related conditions” (approval number: ITU-TH.861.0). In previous research, GM-BHQ at the whole-brain level was positively correlated with curiosity [35], empathic concern [36], and cognitive ability [37], and negatively correlated with stress [38], unbalanced diet [39], and unhealthy lifestyle [40]. See Nemoto et al. [41] for details of the GM-BHQ estimation method.
Previous studies have shown that GM-BHQ can be predicted by multiple regression using age, gender, and BMI as variables [41]. Based on this, we created a multiple regression equation with age, gender, and BMI as independent variables and GM-BHQ as dependent variables from the data of 113 people, and calculated the difference between the actual GM-BHQ value and the predicted GM-BHQ value, that is, ΔGMV, from the equation. By using ΔGMV, we analyzed the relationship between participants’ brain health and diversity understanding controlling for the effects of age, gender, and BMI.

2.4. Analytical Method

This study tested the hypothesis that people who are more inclusive about gender, LGBTQ, and different races have higher GMV. To that end, we first selected people who showed the highest degree of acceptance in the three questions shown above. Specifically, we extracted the respondents who chose ”10: An essential characteristic of democracy” for question (i), and ”6: I can live in the neighborhood” for question (ii) and (iii). Next, we identified respondents who selected the most positive options for all three questions as PHUD. Finally, one-sample t-test to confirm whether the mean value of ΔGMV was greater than zero and independent-sample t-test to confirm whether the mean value of ΔGMV was different between PHUD and others were performed. As evaluation targets, in addition to whole brain ΔGMV, we analyzed regional ΔGMV for CEN, SN, and DMN. All statistical analyses were performed using IBM SPSS Statistics Version 28 (IBM Corp., Armonk, NY, USA).

3. Results

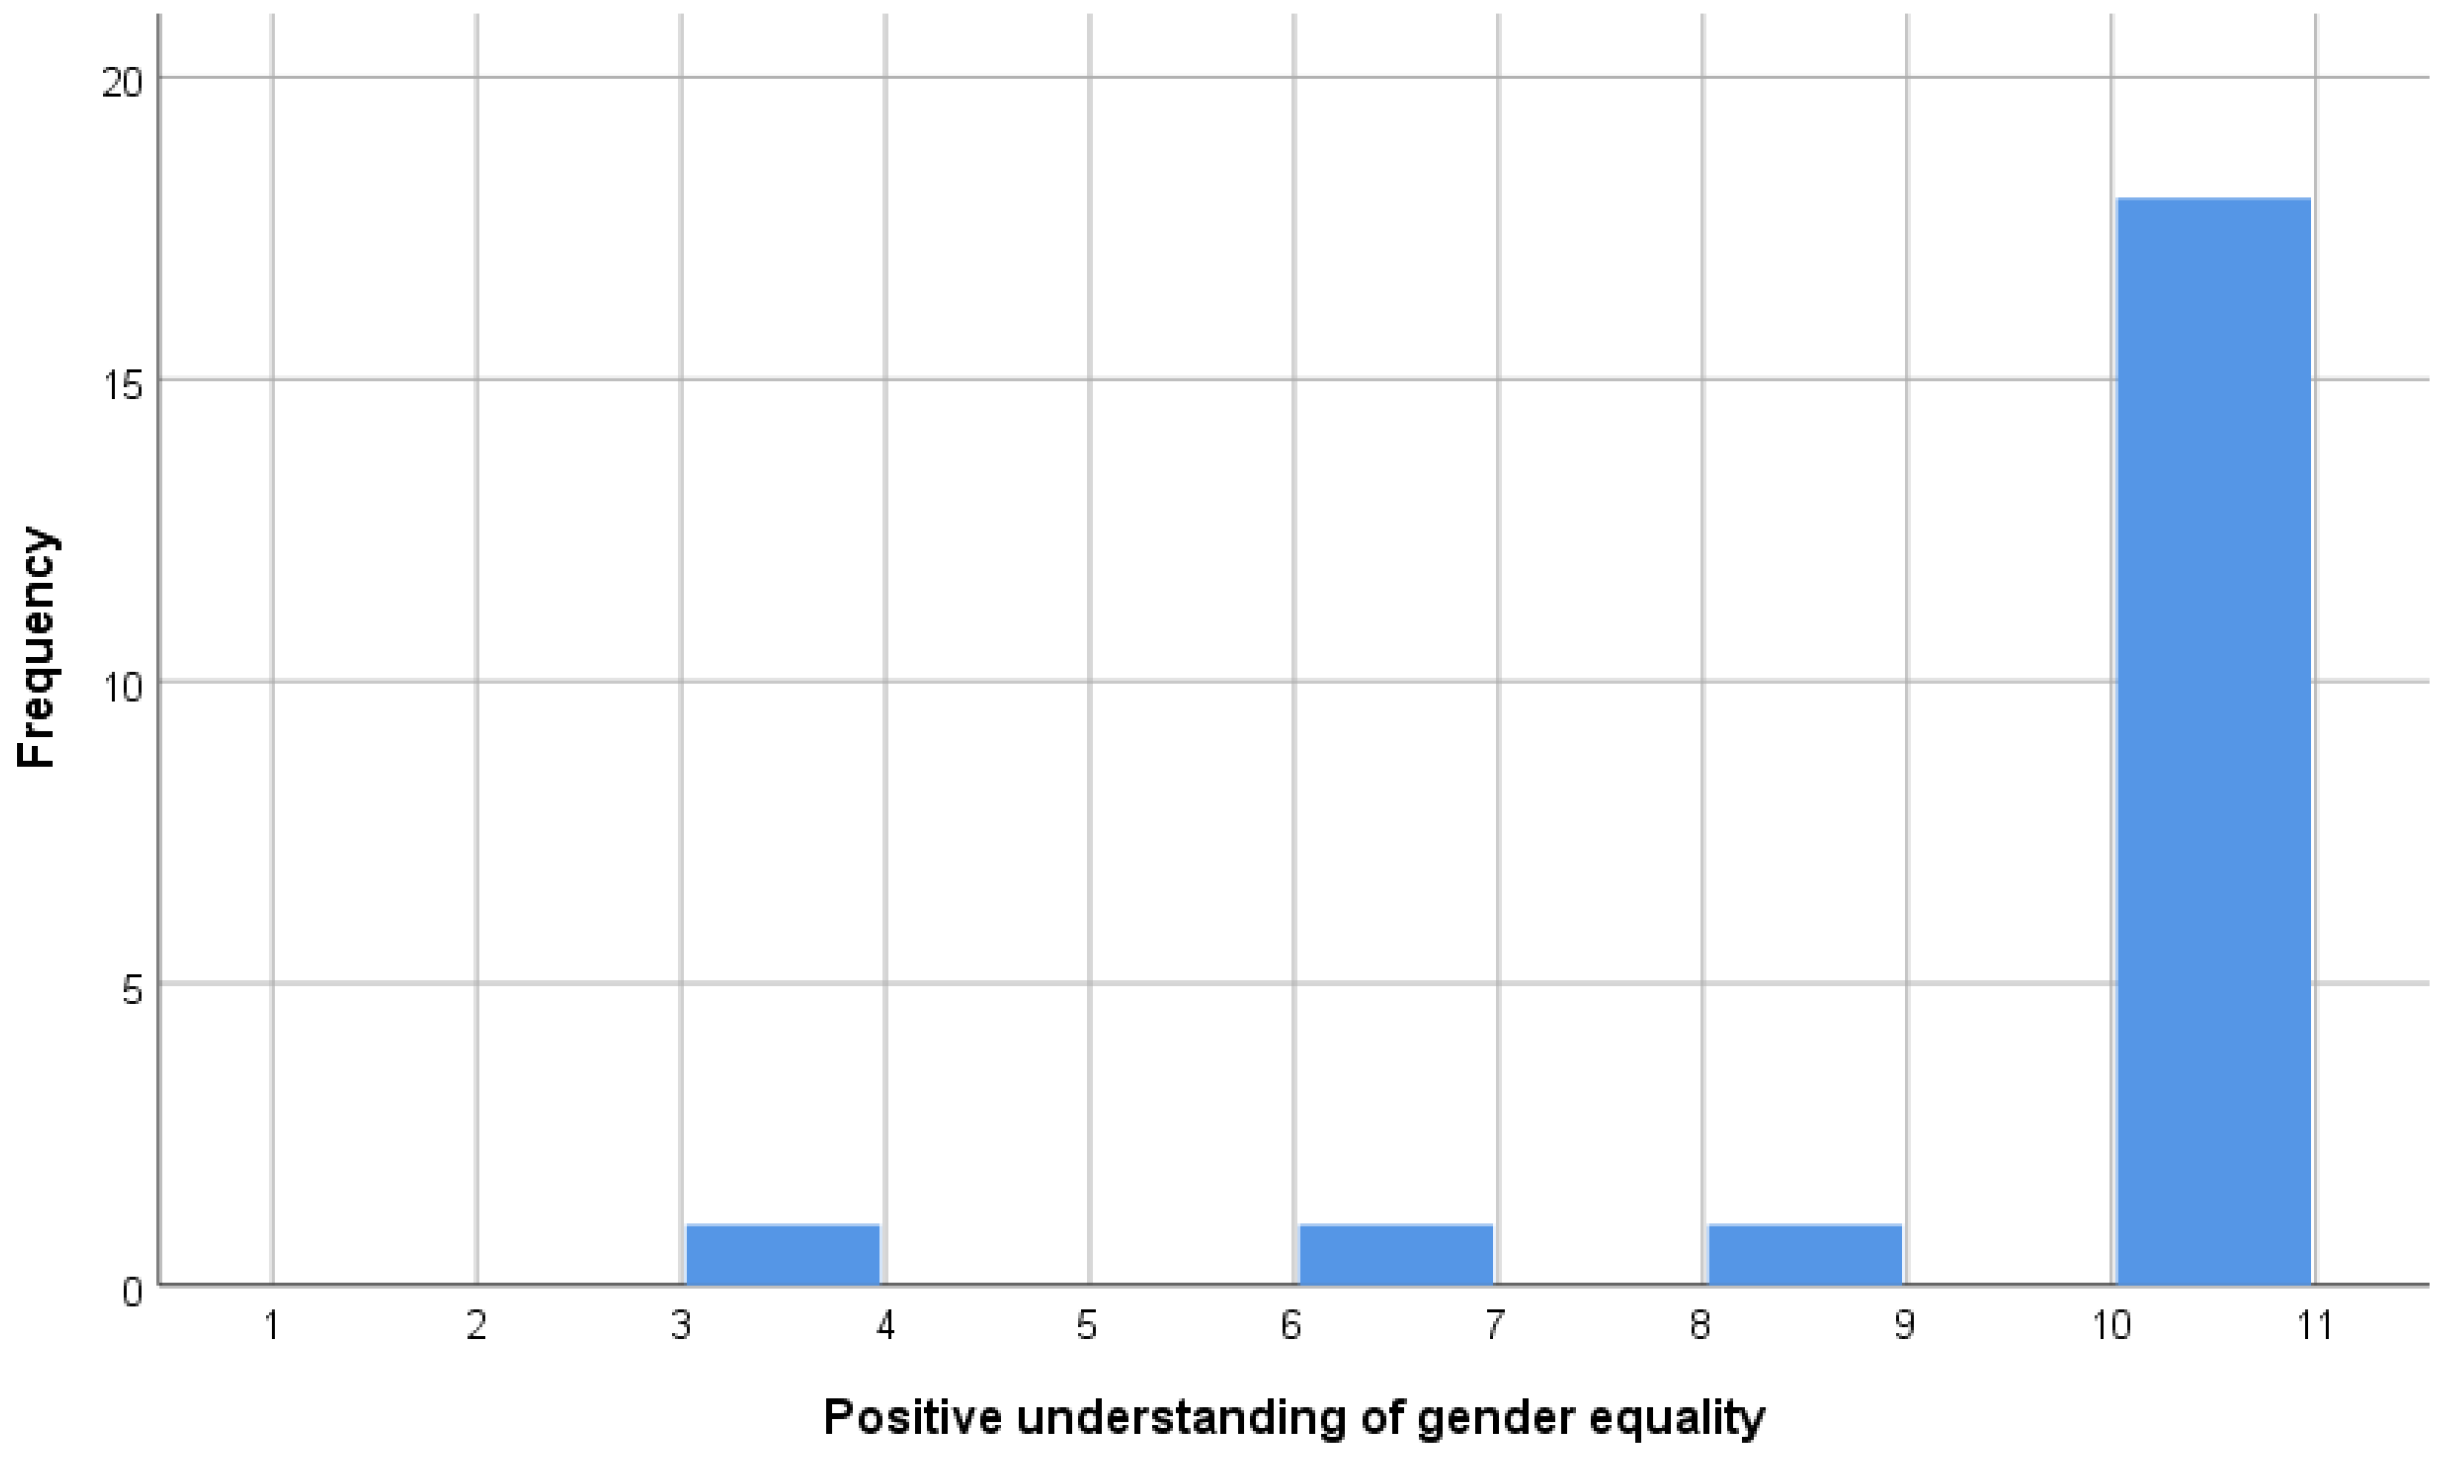
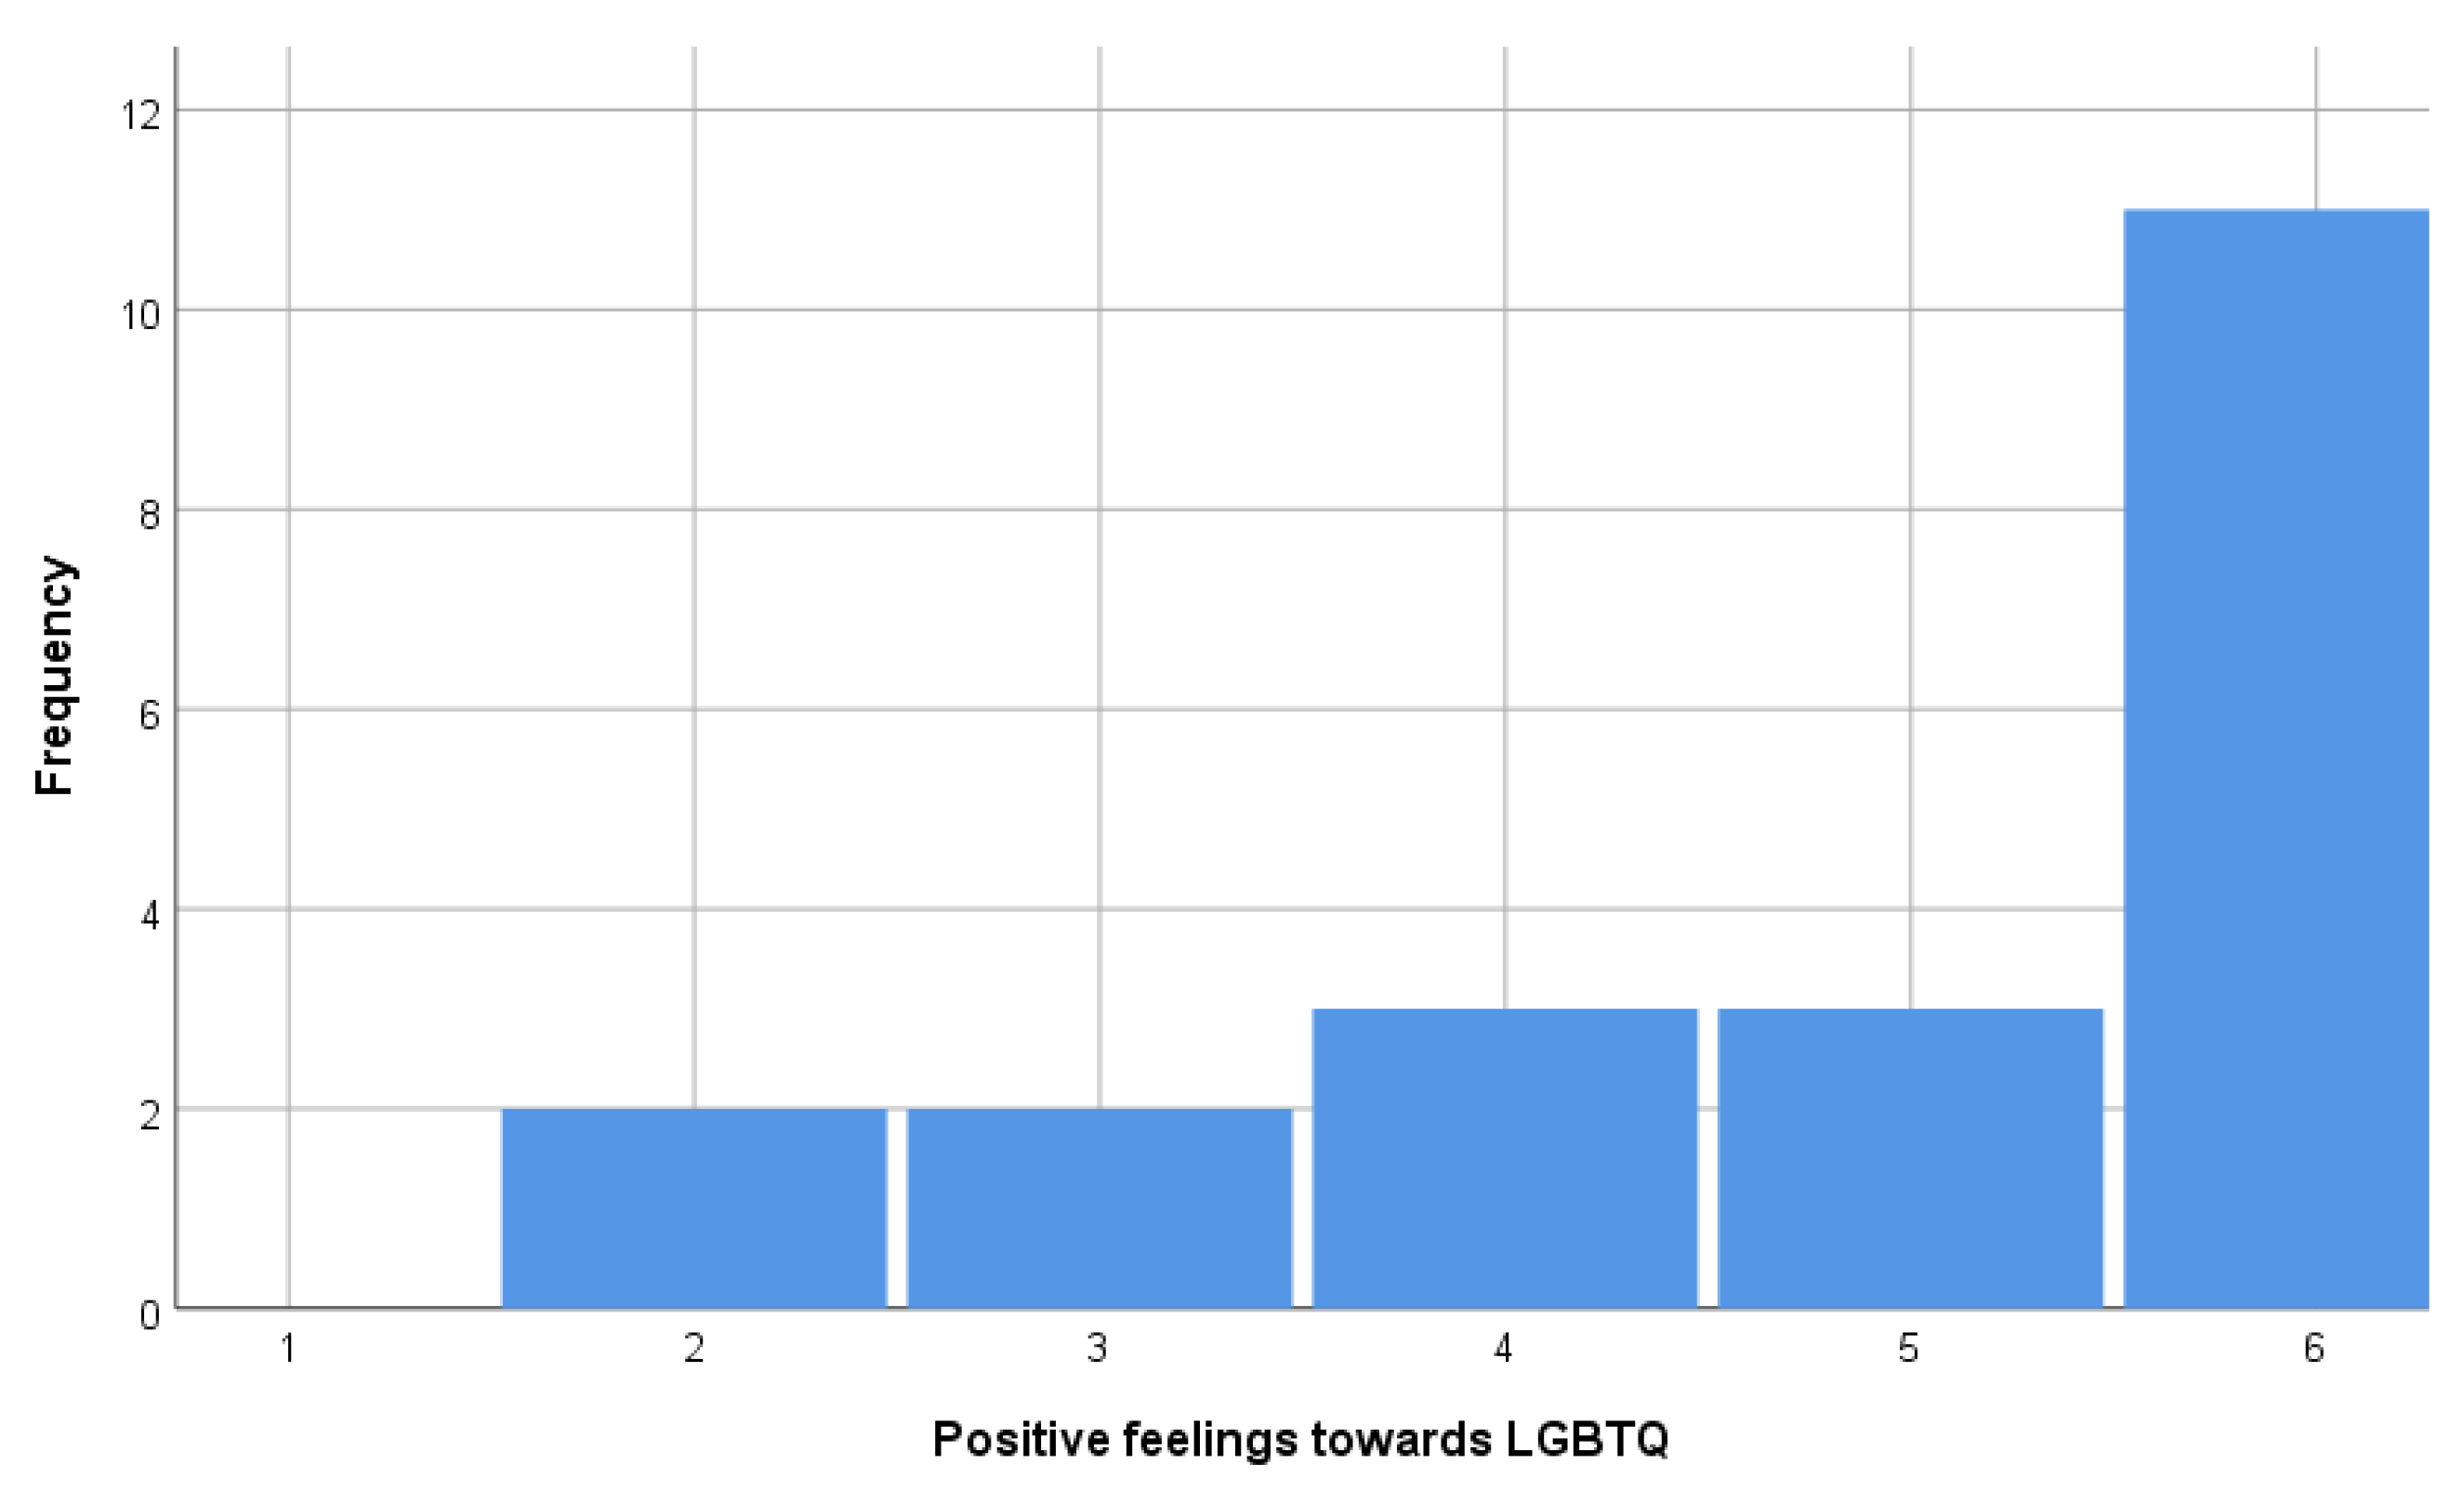
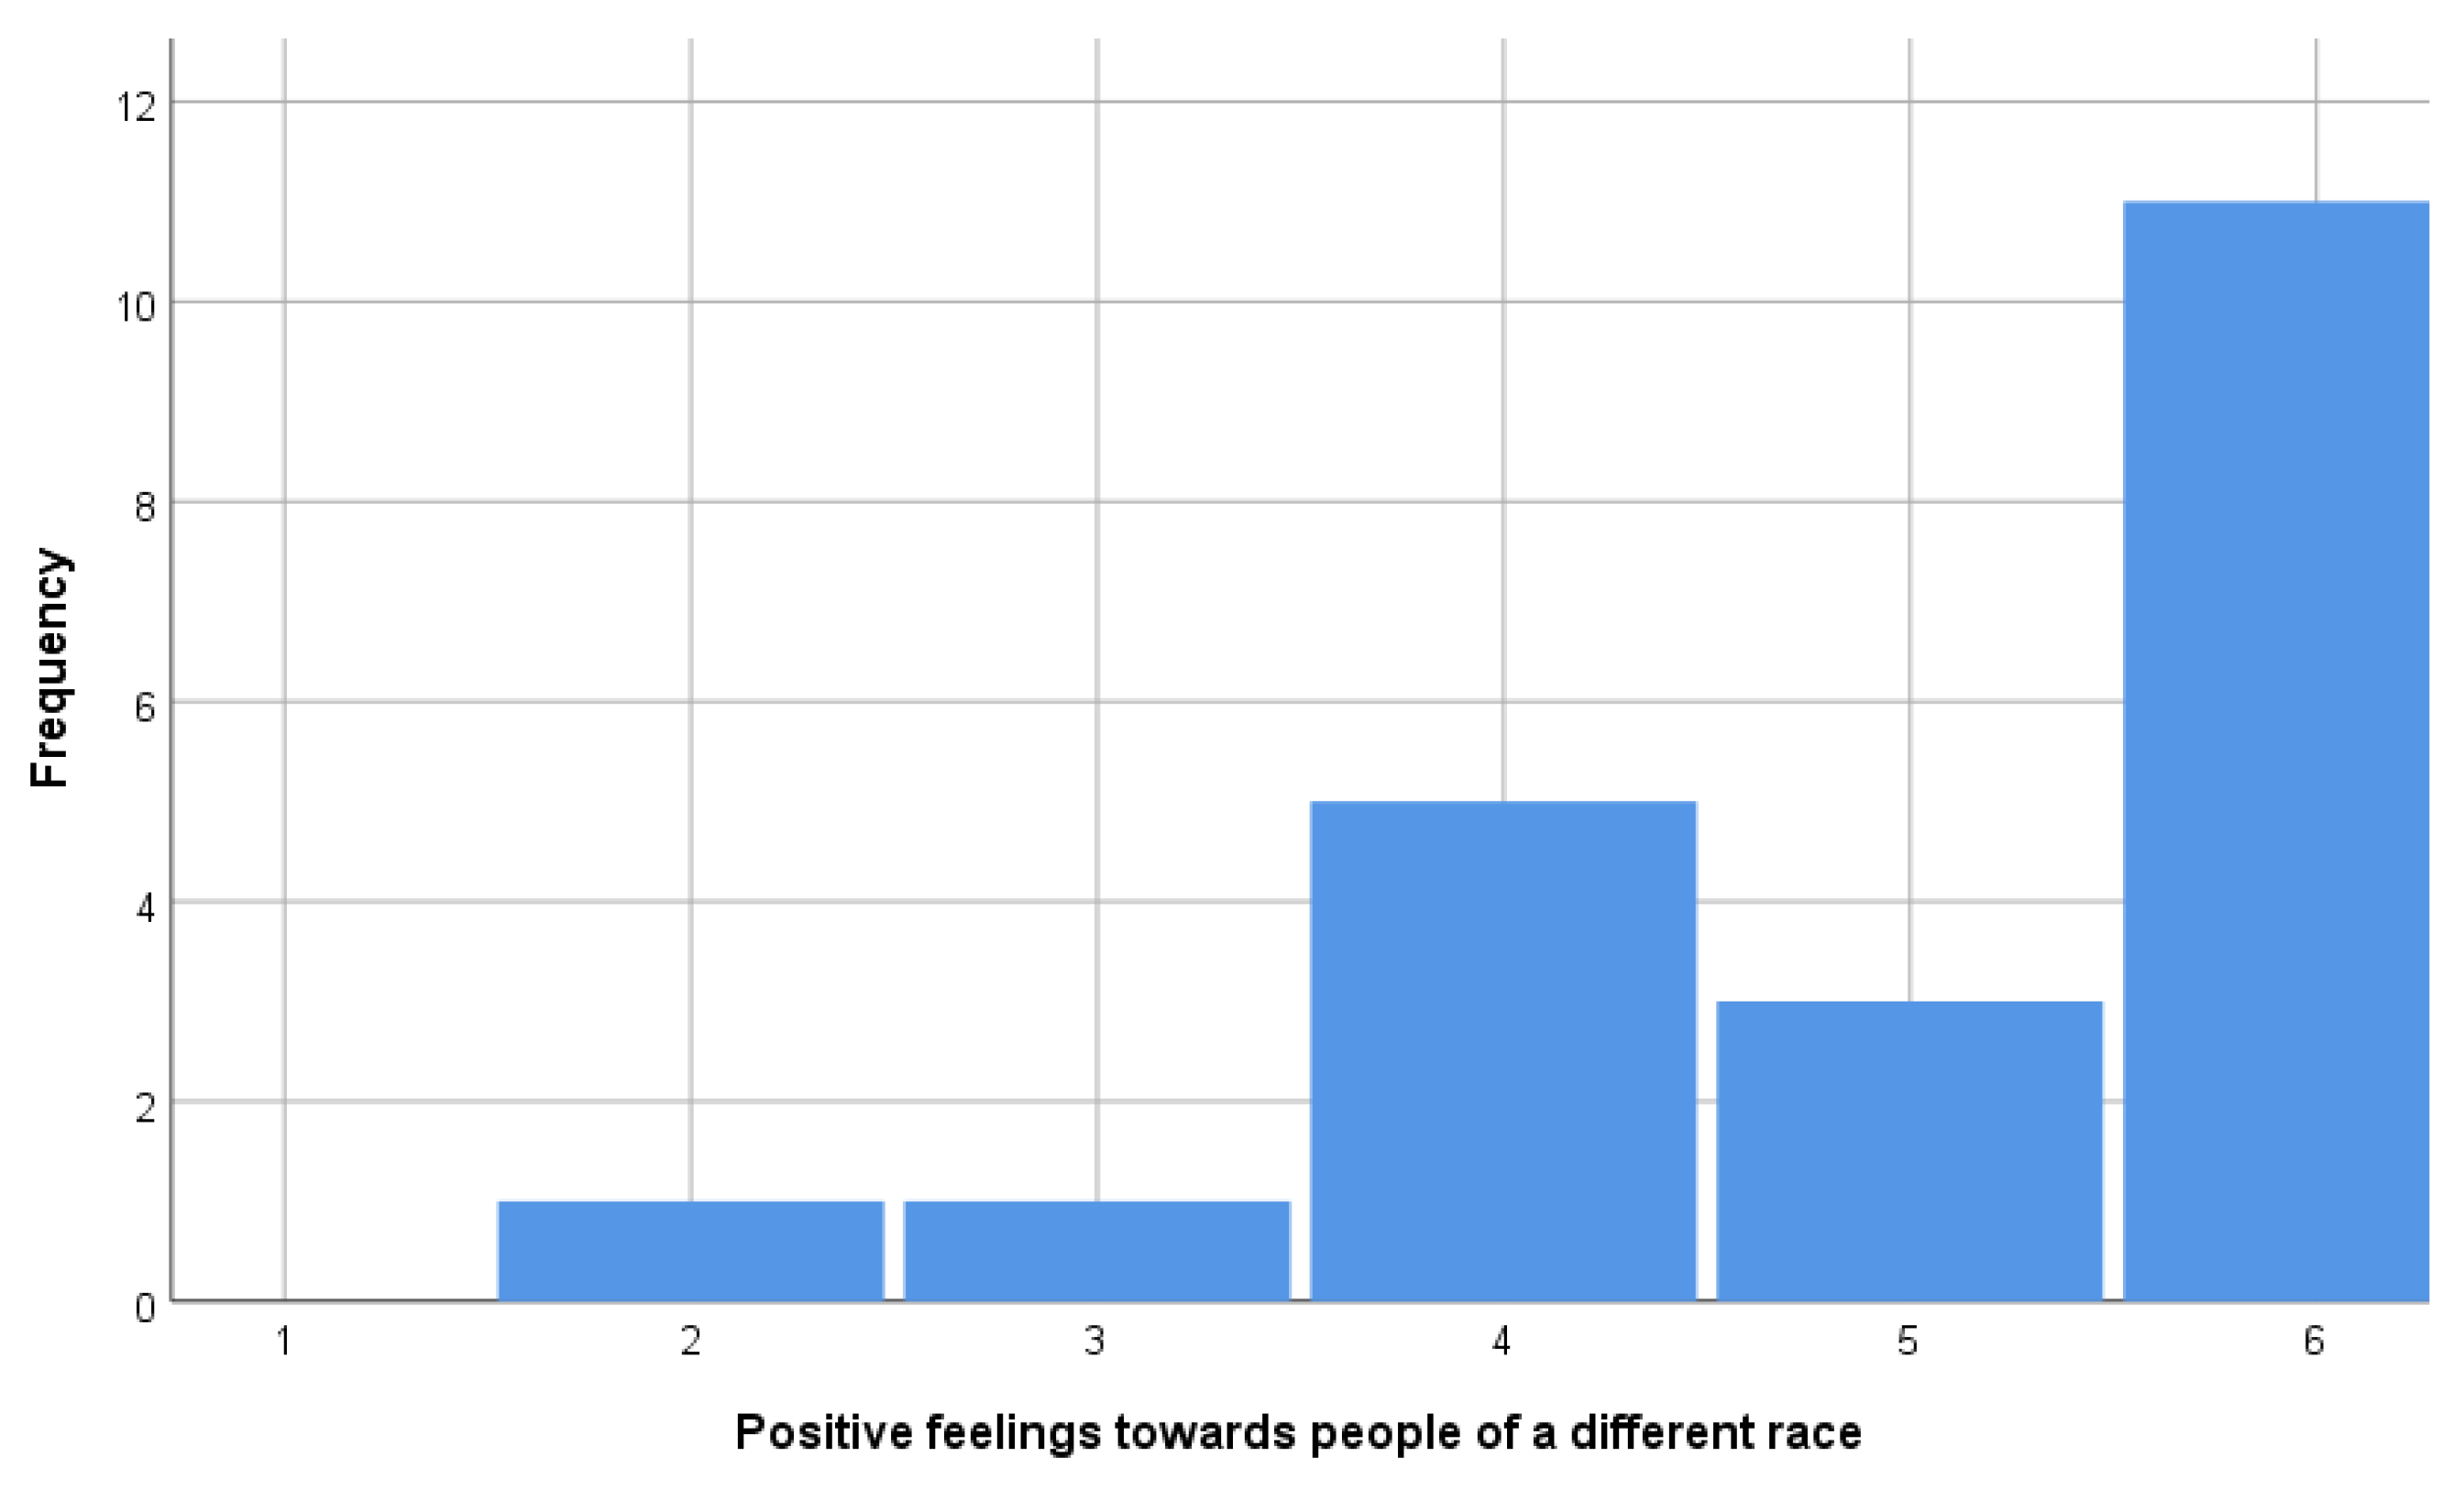
Based on the method above, PHUD (n = 11) and others (n = 10) were extracted. PHUD are identical to the respondents who answered the highest score choices in questions (ii) and (iii) and are among the 18 respondents who answered the highest score choices in question (i). The histograms showing the distribution of answers to questions (i), (ii), and (iii) are shown in Figure 2, Figure 3, and Figure 4. Table 1 and Table 2 compare the attributes of PHUD and others. There were no significant differences in the t-test or chi-square test for any of the items. Considering previous research showing that lifestyle [40] and socioeconomic factors [42] influence brain development, such marginal differences between groups indicate that these are good samples.
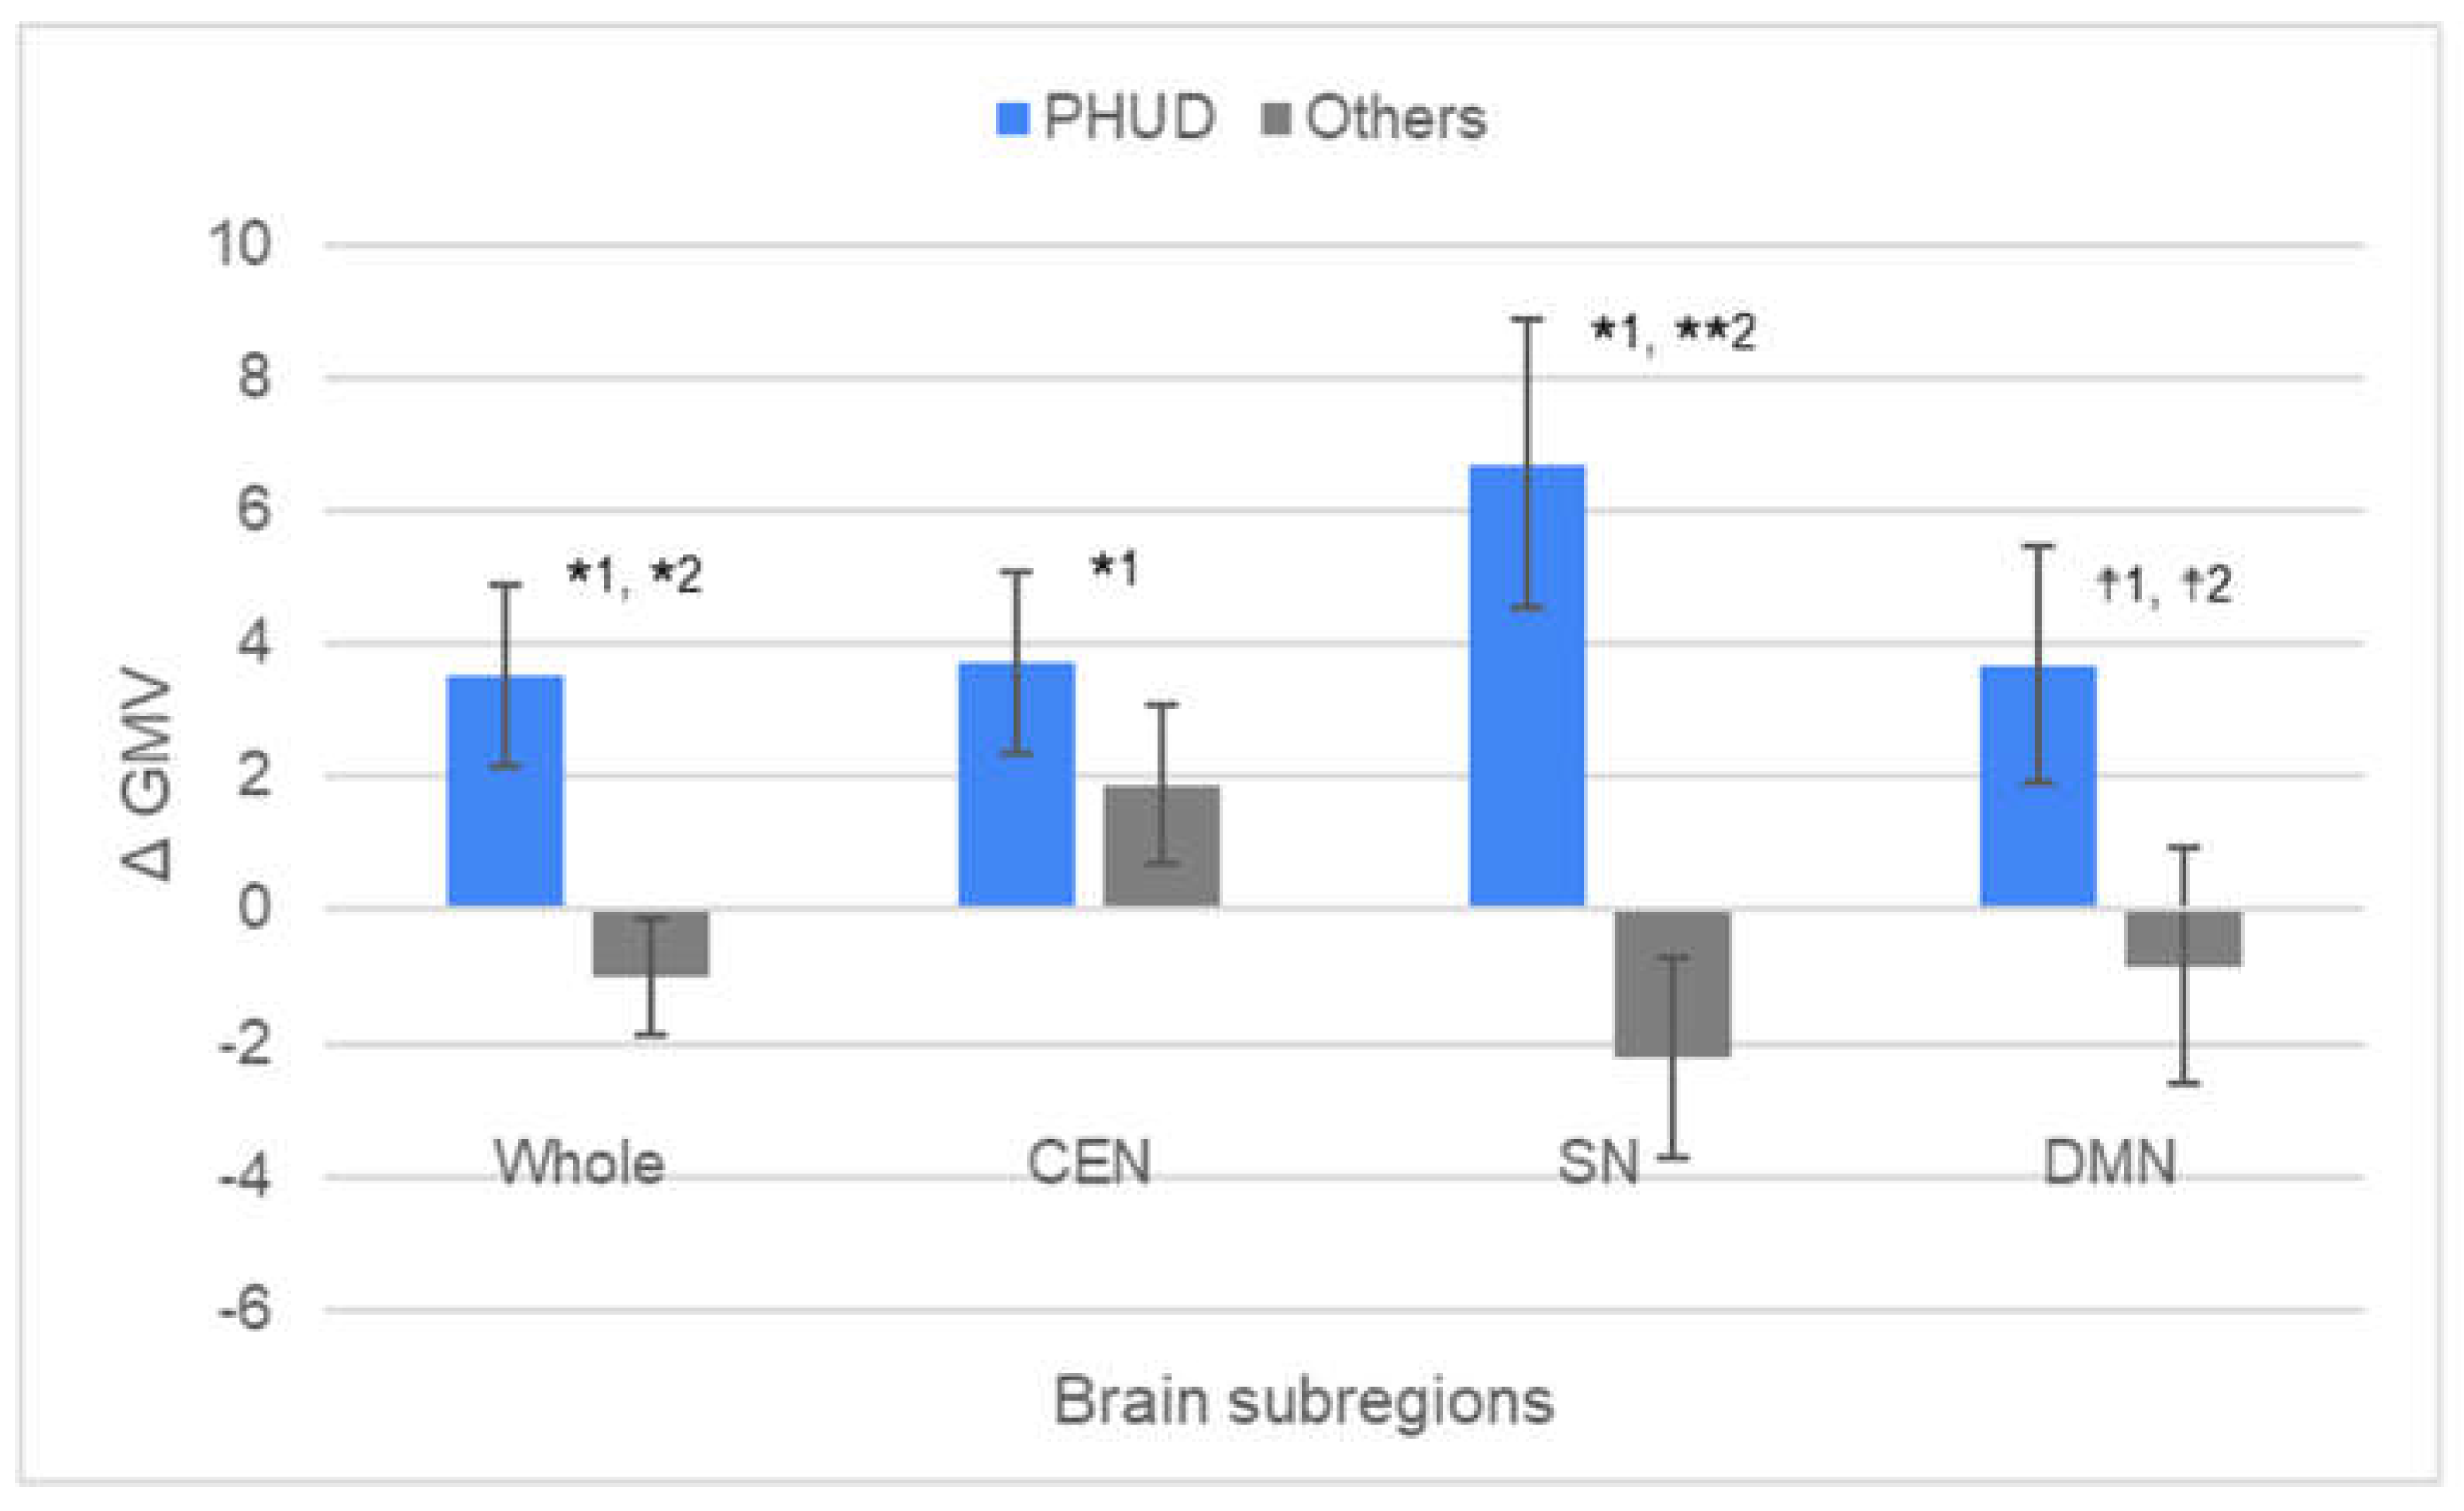
In the Figure 5, the results of one-sample t-test to confirm whether the mean value of ΔGMV was greater than zero and independent-sample t-test to confirm whether the mean value of ΔGMV was different between PHUD and others were indicated. Table 3 details the results of these analyses. For ΔGMV in the whole brain, PHUD had an average value of 3.544 (SD = 4.542), which was significantly higher than 0 (t = 2.587, p = 0.027, d = 0.780). ΔGMV by regions also showed a level significantly higher than 0 in CEN and SN, with an average value of 3.732 (SD = 4.584, t= 2.700, p= 0.022, d = 0.814) and 6.712 (SD = 7.181, t= 3.100, p= 0.011, d = 0.935), respectively. The mean value of DMN was 3.697 (SD = 5.943, t= 2.063, p= 0.066, d = 0.622), so the difference between ΔGMV and 0 was a significant at the 10% level. In contrast, the results for “others” were all not significantly different from the theoretical values. PHUD’s ΔGMV was generally higher than that of others: GMV in the whole brain (t = 2.728, p = 0.013, d = 1.206), CEN (t = 0.994, p = 0.333, d = 0.436), SN (t = 3.308, p = 0.004, d = 1.460), and DMN (t = 1.795, p = 0.089, d = 0.786).

4. Discussion

In this study, people with a high level of diversity-awareness had significantly higher GMV for whole and subscale brain networks, CEN and SN, and relatively higher GMV for DMN than those estimated from age, sex, and BMI. This indicates that to accept diversity, the health of CEN, which is involved in cognitive control, is important. The CEN is a brain region involved in working memory and rational judgment, such as the dorsolateral prefrontal cortex and superior parietal lobule [7,8,9,10,11,12,13]. In addition, the analysis results showed that the health of the SN, which is responsible for external monitoring functions, and the DMN, which is closely related to sociality, are important. The SN, which includes the insular cortex, anterior cingulate gyrus, and paracingulate gyrus, is a brain region involved in emotional reactions and regulation [15,16,17,18,19,20,21]. On the other hand, the DMN includes the posterior cingulate gyrus, medial superior frontal gyrus, precuneus, angular gyrus, and infraorbital frontal lobe [22,23,24,25]. A previous study performed an analysis on resting brain activity and showed that emotional empathy scores correlated with functional connectivity in the CEN, SN, and DMN [28]. This is consistent with empathy responses in previous studies using fMRI [27,29,30,31], showing that emotional empathy involves movement, attention, and self-referential processing. Here, affective empathy refers to the ability to understand, infer, judge, and share the emotional experiences of others [31,43], and is important in social interaction [44,45]. As such, previous studies have shown that deficits in emotional empathy are associated with alcoholism [46] and social anxiety disorder [47].
Previous research also indicates that CEN, SN, and DMN are uniquely associated with empathy. fMRI experiments showed that both empathetic and permissive judgments activate the superior frontal gyrus that spans the CEN and DMN [48]. The superior frontal gyrus is thought to contribute to cognitive functions such as self-awareness [8] and working memory in conjunction with the action of the sensory system [49,50]. This suggests that empathy activates specific brain regions and contributes to social cohesion [50]. Similarly, studies on racial bias show that activation of regions of the frontal cortex associated with control and regulation modulates amygdala activity, thereby suppressing racist emotions [51]. Also, some fMRI studies suggest that the lack of empathy is primarily due to a defective SN switching function. Dysfunctional SNs are involved in the activation of the DMN, which leads to self-focused attention and empathy disorders such as narcissism [52]. Furthermore, the AIs and dACCs that make up the SN have been associated with empathy themselves [53,54,55].
Alternatively, data-driven quantitative reasoning studies suggest that SN and CEN facilitate individuals to build long-term social relationships through emotional processing and cognitive control and that DMN facilitates individuals to develop long-term social relationships through mentalizing processes. It has been suggested that it predicts the experiences, beliefs, and intentions of others and facilitates interaction [56]. DMN has been implicated in both functional and structural studies as prosocial personality traits such as extraversion and agreeableness [57,58,59], and it is associated with self-cognitive empathy [60,61]. On the other hand, a recent systematic review shows that people with low compassion tend to have either low reward-related neuronal area activity or gray matter volume [62]. Consistent with this, our previous studies have shown that whole-brain gray matter is positively correlated with psychological variables representing behavioral activation, empathic concern, and self-monitoring [36].
The results of the current study are consistent with this series of previous studies and at the same time, provide a compelling reason why a triple network consisting of CEN, SN, and DMN is necessary to understand diversity. First, given that women account for half of the world’s population and that no compelling evidence has been found to show differences in work ability between men and women [63] gender role division of labor should distort the allocation of human resources and lead to lower productivity. A study on the relationship between women’s participation in parliament and the economy has shown that a 10-percentage point increase in the number of female members of parliament increases GDP growth by 0.74 percentage points [64]. On the other hand, LGBTQ and people of different races are not easily recognized as familiar in some countries and societies. Therefore, in such countries and societies, it may be difficult to make a movement to accept them. However, in a survey asking managers of companies with diversity management strategies “What are the benefits of embracing diversity?”, responses included “attracting talent,” “improving business performance,” “improving brand power and reputation,” and “stimulating innovation” [65]. This suggests that it is important for business and political leaders to embrace diverse perspectives not only for the purpose of contributing to the realization of a fair society, but also to strengthen the economic profit structure at the corporate and national levels. Therefore, people with a high level of understanding of diversity are thought to have an inclusive mindset, not only because they are considerate of others, but also because they can make rational judgments at the same time by empathizing with various things, thinking logically, and designing new strategies [66,67].
Previous research has attempted to clarify brain diversity [1,2,3,4] and the pathways of empathy in the brain [e.g., 7,8,9,10]. In recent years, following the concept of “neurodiversity”, advanced workplaces where people with not only developmental disorders but also LGBTQ and other personalities are actively evaluated and given opportunities to flourish while achieving high performance have emerged [68,69]. Recent research argues that as the nature of work evolves and jobs become more specialized, organizational diversity is likely to become an increasingly important aspect and play a key role in terms of both individual employees and organizational success [70]. However, no matter how productive collaboration with diverse people may be, it is difficult to create a diverse society if the people do not have the ability to understand and empathize with them. There is a paradox in diversity: while it fosters innovation, it also sometimes brings difficult challenges to both organizations and society. Therefore, people need to have “cultural evolvability” to embrace diversity [71]. Despite this, to the authors’ knowledge, there has been no research to date that clarifies the brain characteristics necessary for understanding and empathizing with diversity. Given that gender and race-related differences in brain and cognitive function are often discussed in an evolutionary context [42,63], it is not surprising if it is that in today’s world of globalization and the increasing need for teamwork among people of different backgrounds to perform complex tasks, people with brains that are able to understand and empathize with diversity have a better chance of survival. Culture changes the brain and cognitive functions, and changes in the brain and cognitive functions also affect culture [42]. Understanding how the brain works should increase people’s interest in methods for maintaining and treating brain health, with the aim of realizing a more diverse society. This study is the first to demonstrate that understanding diversity in areas such as gender, LGBTQ, and race requires brain health centered on the triple network, and will contribute to the development of diversity research in brain science and social science.

5. Limitation

The small sample size casts doubt on the robustness of the results. Future studies should validate this study by performing similar studies with larger sample sizes. In addition, the cross-sectional analysis showed a correlation, not a causal relationship between variables. In the future, the method of longitudinal analysis should be adopted to verify the results of this study.

6. Conclusions

In this study, an analysis was conducted using GMV assessed by the GM-BHQ based on MRI image analysis and the results of a psychological questionnaire, and it was found that people with a high level of understanding of diversity, such as gender, LGBTQ, and different races, had healthier brains centered on a triple network consisting of the CEN, SN, and DMN, compared to values estimated from age, gender, and BMI.

Author Contributions

Conceptualization, T.O.; methodology, T.O. and Y.Y.; software, K.K.; validation, Y.Y.; formal analysis, K.K.; investigation, T.O.; resources, T.O.; data curation, Y.Y.; writing—original draft preparation, T.O. and K.K.; writing—review and editing, M.O. and Y.Y.; visualization, M.O.; supervision, Y.Y.; project administration, M.O.; funding acquisition, Y.Y. All authors have read and agreed to the published version of the manuscript.

Funding

This work was funded by the ImPACT Program of Council for Science, Technology, and Innovation (Cabinet Office, Government of Japan) and supported by JSPS KAKENHI (Grant Number JP17H06151).

Institutional Review Board Statement

The study was conducted in accordance with the Declaration of Helsinki and approved by the Tokyo Institute of Technology’s ethical committee for “Brain information cloud (research ethics review committee for human subjects: permission number 2019007)”.

Informed Consent Statement

Informed consent was obtained from all subjects involved in the study.

Data Availability Statement

The datasets used and/or analyzed in the current study are available from the corresponding author upon reasonable request.

Acknowledgments

An earlier version of this article is published on the following preprint server: https://doi.org/10.1101/2023.06.05.23290953 (accessed on 21 September 2024).

Conflicts of Interest

The authors declare no conflicts of interest.

References

  1. Moonen, J.E.; Nasrallah, I.M.; Detre, J.A.; Dolui, S.; Erus, G.; Davatzikos, C.; Meirelles, O.; Bryan, R.N.; Launer, L.J. Race, sex, and mid-life changes in brain health: Cardia MRI substudy. Alzheimers Dement. 2022, 18, 2428–2437. [Google Scholar] [CrossRef] [PubMed]
  2. Zheng, Z.; Liu, Y.; Wang, Z.; Yin, H.; Zhang, D.; Yang, J. Evaluating age-and gender-related changes in brain volumes in normal adult using synthetic magnetic resonance imaging. Brain Behav. 2024, 14, e3619. [Google Scholar] [CrossRef] [PubMed]
  3. García, J.J. Heart, brain and mental health disparities for LGBTQ people of color; Palgrave Macmillan: London, United Kingdom, 2021. [Google Scholar]
  4. Lanz, K.; Brown, P. All the brains in the business: the engendered brain in the 21st century organisation (The neuroscience of business); Palgrave Macmillan: London, United Kingdom, 2019. [Google Scholar] [CrossRef]
  5. Rodríguez-Nieto, G.; Mercadillo, R.E.; Pasaye, E.H.; Barrios, F.A. Affective and cognitive brain-networks are differently integrated in women and men while experiencing compassion. Front. Psychol. 2022, 5693. [Google Scholar] [CrossRef] [PubMed]
  6. Menon, B. Towards a new model of understanding–The triple network, psychopathology and the structure of the mind. Med. Hypotheses 2019, 133, 109385. [Google Scholar] [CrossRef] [PubMed]
  7. Fox, M.D.; Corbetta, M.; Snyder, A.Z.; Vincent, J.L.; Raichle, M.E. Spontaneous neuronal activity distinguishes human dorsal and ventral attention systems. Proc. Natl. Acad. Sci. U. S. A. 2006, 103, 10046–10051. [Google Scholar] [CrossRef] [PubMed]
  8. Goldberg, I.; Harel, M.; Malach, R. When the brain loses its self: prefrontal inactivation during sensorimotor processing. Neuron 2006, 50, 329–339. [Google Scholar] [CrossRef]
  9. Koechlin, E.; Summerfield, C. An information theoretical approach to prefrontal executive function. Trends Cogn. Sci. 2007, 11, 229–235. [Google Scholar] [CrossRef]
  10. Miller, E.K.; Cohen, J.D. An integrative theory of prefrontal cortex function. Annu. Rev. Neurosci. 2001, 24, 167–202. [Google Scholar] [CrossRef]
  11. Owen, A.M.; McMillan, K.M.; Laird, A.R.; Bullmore, E. N-back working memory paradigm: A meta-analysis of normative functional neuroimaging studies. Hum. Brain Mapp. 2005, 25, 46–59. [Google Scholar] [CrossRef]
  12. Smith, E.E.; Jonides, J. Neuroimaging analyses of human working memory. Proc. Natl. Acad. Sci. U. S. A. 1998, 95, 12061–12068. [Google Scholar] [CrossRef]
  13. Wager, T.D.; Smith, E.E. Neuroimaging studies of working memory: a meta-analysis. Cogn. Affect. Behav. Neurosci. 2003, 3, 255–274. [Google Scholar] [CrossRef] [PubMed]
  14. Seeley, W.W.; Menon, V.; Schatzberg, A.F.; Keller, J.; Glover, G.H.; Kenna, H.; Reiss, A.L.; Greicius, M.D. Dissociable intrinsic connectivity networks for salience processing and executive control. J. Neurosci. 2007, 27, 2349–2356. [Google Scholar] [CrossRef] [PubMed]
  15. Goulden, N.; Khusnulina, A.; Davis, N.J.; Bracewell, R.M.; Bokde, A.L.; McNulty, J.P.; Mullins, P.G. The salience network is responsible for switching between the default mode network and the central executive network: replication from DCM. Neuroimage. 2014, 99, 180–190. [Google Scholar] [CrossRef] [PubMed]
  16. Cai, W.; Chen, T.; Ryali, S.; Kochalka, J.; Li, C.S.R.; Menon, V. Causal interactions within a frontal-cingulate-parietal network during cognitive control: Convergent evidence from a multisite–multitask investigation. Cereb. Cortex. 2016, 26, 2140–2153. [Google Scholar] [CrossRef]
  17. Chen, T.; Michels, L.; Supekar, K.; Kochalka, J.; Ryali, S.; Menon, V. Role of the anterior insular cortex in integrative causal signaling during multisensory auditory–visual attention. Eur J Neurosci. 2015, 41, 264–274. [Google Scholar] [CrossRef]
  18. Ham, T.; Leff, A.; de Boissezon, X.; Joffe, A.; Sharp, D.J. Cognitive control and the salience network: an investigation of error processing and effective connectivity. J. Neurosci. 2013, 33, 7091–7098. [Google Scholar] [CrossRef]
  19. Menon, V.; Uddin, L.Q. Saliency, switching, attention and control: a network model of insula function. Brain Struct. Funct. 2010, 214, 655–667. [Google Scholar] [CrossRef]
  20. Sridharan, D.; Levitin, D.J.; Menon, V. A critical role for the right fronto-insular cortex in switching between central-executive and default-mode networks. Proc. Natl. Acad. Sci. U. S. A. 2008, 105, 12569–12574. [Google Scholar] [CrossRef]
  21. Uddin, L.Q. Salience processing and insular cortical function and dysfunction. Nat. Rev. Neurosci. 2015, 16, 55–61. [Google Scholar] [CrossRef]
  22. Andrews-Hanna, J.R.; Reidler, J.S.; Sepulcre, J.; Poulin, R.; Buckner, R.L. Functional-anatomic fractionation of the brain’s default network. Neuron 2010, 65, 550–562. [Google Scholar] [CrossRef]
  23. Buckner, R.L.; Andrews-Hanna, J.R.; Schacter, D.L. The brain’s default network - anatomy, function, and relevance to disease. Ann. N.Y. Acad. Sci. 2008, 1124, 1–38. [Google Scholar] [CrossRef] [PubMed]
  24. Shulman, G.L.; Fiez, J.A.; Corbetta, M.; Buckner, R.L.; Miezin, F.M.; Raichle, M.E.; Petersen, S.E. Common blood flow changes across visual tasks.2. Decreases in cerebral cortex. J. Cogn. Neurosci. 1997, 9, 648–663. [Google Scholar] [CrossRef]
  25. Li, W.; Mai, X.; Liu, C. The default mode network and social understanding of others: what do brain connectivity studies tell us. Front. Hum. Neurosci. 2014, 8, 74. [Google Scholar] [CrossRef] [PubMed]
  26. Krönke, K.M.; Wolff, M.; Shi, Y.; Kräplin, A.; Smolka, M.N.; Bühringer, G.; Goschke, T. Functional connectivity in a triple-network saliency model is associated with real-life self-control. Neuropsychologia 2020, 149, 107667. [Google Scholar] [CrossRef]
  27. Acevedo, B.P.; Aron, E.N.; Aron, A.; Sangster, M.D.; Collins, N.; Brown, L.L. The highly sensitive brain: an fMRI study of sensory processing sensitivity and response to others’ emotions. Brain Behav. 2014, 4, 580–594. [Google Scholar] [CrossRef] [PubMed]
  28. Bilevicius, E.; Kolesar, T.A.; Smith, S.D.; Trapnell, P.D.; Kornelsen, J. Trait emotional empathy and resting state functional connectivity in default mode, salience, and central executive networks. Brain Sci. 2018, 8, 128. [Google Scholar] [CrossRef]
  29. Kim, S.J.; Kim, S.E.; Kim, H.E.; Han, K.; Jeong, B.; Kim, J.J.; Namkoong, K.; Kim, J.W. Altered functional connectivity of the default mode network in low-empathy subjects. Yonsei Med J. 2017, 58, 1061–1065. [Google Scholar] [CrossRef]
  30. Nummenmaa, L.; Hirvonen, J.; Parkkola, R.; Hietanen, J.K. Is emotional contagion special? An fMRI study on neural systems for affective and cognitive empathy. NeuroImage 2008, 43, 571–580. [Google Scholar] [CrossRef]
  31. Shamay-Tsoory, S.G.; Aharon-Peretz, J.; Perry, D. Two systems for empathy: a double dissociation between emotional and cognitive empathy in inferior frontal gyrus versus ventromedial prefrontal lesions. Brain 2009, 132, 617–627. [Google Scholar] [CrossRef]
  32. Hansen, T.M.; Muthulingam, J.A.; Brock, B.; Drewes, A.M.; Juhl, A.; Vorum, H.; Jakobsen, P.E.; Karmisholt, J.; Brock, C.; Frøkjær, J.B. Reduced gray matter brain volume and cortical thickness in adults with type 1 diabetes and neuropathy. Neurosci. Res. 2022, 176, 66–72. [Google Scholar] [CrossRef]
  33. Ferguson, S.C.; Blane, A.; Wardlaw, J.; Frier, B.M.; Perros, P.; McCrimmon, R.J.; Deary, I.J. Influence of an early-onset age of type 1 diabetes on cerebral structure and cognitive function. Diabetes Care 2005, 28, 1431–1437. [Google Scholar] [CrossRef] [PubMed]
  34. World values survey: round seven - country-pooled datafile version 5.0. Madrid; Haerpfer, C.; Inglehart, R.; Moreno, A.; Welzel, C.; Kizilova, K.; Diez-Medrano, J.; Lagos, M.; Norris, P.; Ponarin, E.; Puranen, B. (Eds.) JD Systems Institute & WVSA Secretariat: Spain & Vienna, Austria, 2022. [Google Scholar] [CrossRef]
  35. Kokubun, K.; Yamakawa, Y.; Hiraki, K. Association between behavioral ambidexterity and brain health. Brain Sci. 2020, 10, 137. [Google Scholar] [CrossRef]
  36. Kokubun, K.; Yamakawa, Y.; Nemoto, K. The link between the brain volume derived index and the determinants of social performance. Curr. Psychol. 2023, 42, 12309–12321. [Google Scholar] [CrossRef]
  37. Watanabe, K.; Kakeda, S.; Nemoto, K.; Onoda, K.; Yamaguchi, S.; Kobayashi, S.; Yamakawa, Y. Grey-matter brain healthcare quotient and cognitive function: A large cohort study of an MRI brain screening system in Japan. Cortex 2021, 145, 97–104. [Google Scholar] [CrossRef] [PubMed]
  38. Kokubun, K.; Nemoto, K.; Oka, H.; Fukuda, H.; Yamakawa, Y.; Watanabe, Y. Association of fatigue and stress with gray matter volume. Front. Behav. Neurosci. 2018, 12, 154. [Google Scholar] [CrossRef] [PubMed]
  39. Kokubun, K.; Yamakawa, Y. Association between food patterns and gray matter volume. Front. Hum. Neurosci. 2019, 13, 384. [Google Scholar] [CrossRef]
  40. Kokubun, K.; Pineda, J.C.D.; Yamakawa, Y. Unhealthy lifestyles and brain condition: Examining the relations of BMI, living alone, alcohol intake, short sleep, smoking, and lack of exercise with gray matter volume. Plos one 2021, 16, e0255285. [Google Scholar] [CrossRef]
  41. Nemoto, K.; Oka, H.; Fukuda, H.; Yamakawa, Y. MRI-based Brain Healthcare Quotients: A bridge between neural and behavioral analyses for keeping the brain healthy. PLoS One. 2017, 12, e0187137. [Google Scholar] [CrossRef]
  42. Farah, M.J. The neuroscience of socioeconomic status: Correlates, causes, and consequences. Neuron 2017, 96, 56–71. [Google Scholar] [CrossRef]
  43. Gallese, V. The roots of empathy: the shared manifold hypothesis and the neural basis of intersubjectivity. Psychopathology 2003, 36, 171–180. [Google Scholar] [CrossRef]
  44. Baron-Cohen, S.; Wheelwright, S.; Hill, J.; Raste, Y.; Plumb, I. The “Reading the Mind in the Eyes” Test revised version: a study with normal adults, and adults with Asperger syndrome or high-functioning autism. J Child Psychol Psychiatry. 2001, 42, 241–251. [Google Scholar] [CrossRef] [PubMed]
  45. Baron-Cohen, S.; Wheelwright, S. The empathy quotient: an investigation of adults with Asperger syndrome or high functioning autism, and normal sex differences. J. Autism. Dev. Disord. 2004, 34, 163–175. [Google Scholar] [CrossRef] [PubMed]
  46. Maurage, P.; Grynberg, D.; Noël, X.; Joassin, F.; Philippot, P.; Hanak, C.; Verbanck, P.; Luminet, O.; de Timary, P.; Campanella, S. Dissociation between affective and cognitive empathy in alcoholism: a specific deficit for the emotional dimension. Alcohol. Clin. Exp. Res. 2011, 35, 1662–1668. [Google Scholar] [CrossRef] [PubMed]
  47. Morrison, A.S.; Mateen, M.A.; Brozovich, F.A.; Zaki, J.; Goldin, P.R.; Heimberg, R.G.; Gross, J.J. Empathy for positive and negative emotions in social anxiety disorder. Behav. Res. Ther. 2016, 87, 232–242. [Google Scholar] [CrossRef]
  48. Farrow, T.F.; Zheng, Y.; Wilkinson, I.D.; Spence, S.A.; Deakin, J.F.W.; Tarrier, N.; Griffiths, P.D.; Woodruff, P.W.R. Investigating the functional anatomy of empathy and forgiveness. Neuroreport 2001, 12, 2433–2438. [Google Scholar] [CrossRef]
  49. Alagapan, S.; Lustenberger, C.; Hadar, E.; Shin, H.W.; Frӧhlich, F. Low-frequency direct cortical stimulation of left superior frontal gyrus enhances working memory performance. Neuroimage 2019, 184, 697–706. [Google Scholar] [CrossRef]
  50. Boisgueheneuc, F.D.; Levy, R.; Volle, E.; Seassau, M.; Duffau, H.; Kinkingnehun, S.; Samson, Y.; Zhang, S.; Dubois, B. Functions of the left superior frontal gyrus in humans: a lesion study. Brain 2006, 129, 3315–3328. [Google Scholar] [CrossRef]
  51. Banaji, M.R.; Baron, A.S.; Dunham, Y.; Olson, K. The development of intergroup social cognition. In Intergroup attitudes and relations in childhood through adulthood; Levy, S.R., Killen, M., Eds.; Oxford University Press: New York, NY, USA, 2008; pp. 87–102. [Google Scholar]
  52. Jankowiak-Siuda, K.; Zajkowski, W. A neural model of mechanisms of empathy deficits in narcissism. Med. Sci. Monit. 2013, 19, 934–941. [Google Scholar] [CrossRef]
  53. Fallon, N.; Roberts, C.; Stancak, A. Shared and distinct functional networks for empathy and pain processing: a systematic review and meta-analysis of fMRI studies. Soc. Cogn. Affect. Neurosci. 2020, 15, 709–723. [Google Scholar] [CrossRef]
  54. Gu, X.; Liu, X.; Guise, K.G.; Naidich, T.P.; Hof, P.R.; Fan, J. Functional dissociation of the frontoinsular and anterior cingulate cortices in empathy for pain. J. Neurosci. 2010, 30, 3739–3744. [Google Scholar] [CrossRef]
  55. Timmers, I.; Park, A.L.; Fischer, M.D.; Kronman, C.A.; Heathcote, L.C.; Hernandez, J.M.; Simons, L.E. Is empathy for pain unique in its neural correlates? A meta-analysis of neuroimaging studies of empathy. Front Behav Neurosci. 2018, 12, 289. [Google Scholar] [CrossRef] [PubMed]
  56. Li, T.; Pei, Z.; Zhu, Z.; Wu, X.; Feng, C. Intrinsic brain activity patterns across large-scale networks predict reciprocity propensity. Hum. Brain Mapp. 2022, 43, 5616–5629. [Google Scholar] [CrossRef] [PubMed]
  57. Mars, R.B.; Neubert, F.X.; Noonan, M.A.P.; Sallet, J.; Toni, I.; Rushworth, M.F.S. On the relationship between the “default mode network” and the “social brain”. Front. Hum. Neurosci. 2012, 6, 189. [Google Scholar] [CrossRef]
  58. Sampaio, A.; Soares, J.M.; Coutinho, J.; Sousa, N.; Gonçalves, Ó.F. The Big Five default brain: functional evidence. Brain. Struct. Funct. 2014, 219, 1913–1922. [Google Scholar] [CrossRef]
  59. Coutinho, J.F.; Sampaio, A.; Ferreira, M.; Soares, J.M.; Gonçalves, O.F. Brain correlates of pro-social personality traits: a voxel-based morphometry study. Brain Imaging Behav. 2013, 7, 293–299. [Google Scholar] [CrossRef]
  60. Silva, P.O.; Maia, L.; Coutinho, J.; Frank, B.; Soares, J.M.; Sampaio, A.; Gonçalves, Ó. Empathy by default: Correlates in the brain at rest. Psicothema 2018, 30, 97–103. [Google Scholar] [CrossRef]
  61. Esménio, S.; Soares, J.M.; Oliveira-Silva, P.; Zeidman, P.; Razi, A.; Gonçalves, O.F.; Friston, K.; Coutinho, J. Using resting-state DMN effective connectivity to characterize the neurofunctional architecture of empathy. Sci Rep. 2019, 9, 2603. [Google Scholar] [CrossRef]
  62. Novak, L.; Malinakova, K.; Mikoska, P.; van Dijk, J.P.; Tavel, P. Neural correlates of compassion–An integrative systematic review. Int. J. Psychophysiol. 2022, 172, 46–59. [Google Scholar] [CrossRef]
  63. Kheloui, S.; Jacmin-Park, S.; Larocque, O.; Kerr, P.; Rossi, M.; Cartier, L.; Juster, R.P. Sex/gender differences in cognitive abilities. Neurosci. Biobehav. Rev. 2023, 105333. [Google Scholar] [CrossRef]
  64. Mirziyoyeva, Z.; Salahodjaev, R. Does representation of women in parliament promote economic growth? Considering evidence from Europe and Central Asia. Front. Polit. Sci. 2023, 5, 1120287. [Google Scholar] [CrossRef]
  65. Ministry of Economy, Trade and Industry. Diversity 2.0: One step ahead of competitive strategy. Economic and Social Policy Office; Economic and Industrial Policy Bureau: Tokyo, Japan, September 2020. [Google Scholar]
  66. Cross, N. Design thinking: Understanding how designers think and work. Bloomsbury Publishing: London, United Kingdom, 2023. [Google Scholar]
  67. Stickdorn, M.; Schneider, J. This is service design thinking: Basics, tools, cases; John Wiley & Sons: New York, United States, 2012. [Google Scholar]
  68. Sinha, S.; Sinha, D. Neurodiversity at the workplace: The new paradigm of talent acquisition and retention. In Global Practices on Effective Talent Acquisition and Retention; Christiansen, B., Aziz, M.A., O’Keeffe, E.L., Eds.; IGI Global: Pennsylvania, United States, 2024; pp. 333–348. [Google Scholar] [CrossRef]
  69. Kirby, A.; Smith, T. Neurodiversity at work: Drive innovation, performance and productivity with a neurodiverse workforce; Kogan Page Publishers: London, United Kingdom, 2021. [Google Scholar]
  70. LeFevre-Levy, R.; Melson-Silimon, A.; Harmata, R.; Hulett, A.L.; Carter, N.T. Neurodiversity in the workplace: Considering neuroatypicality as a form of diversity. Ind. Organ. Psych. 2023, 16, 1–19. [Google Scholar] [CrossRef]
  71. Schimmelpfennig, R.; Razek, L.; Schnell, E.; Muthukrishna, M. Paradox of diversity in the collective brain. Philos. Trans. R. Soc. B 2022, 377, 20200316. [Google Scholar] [CrossRef] [PubMed]
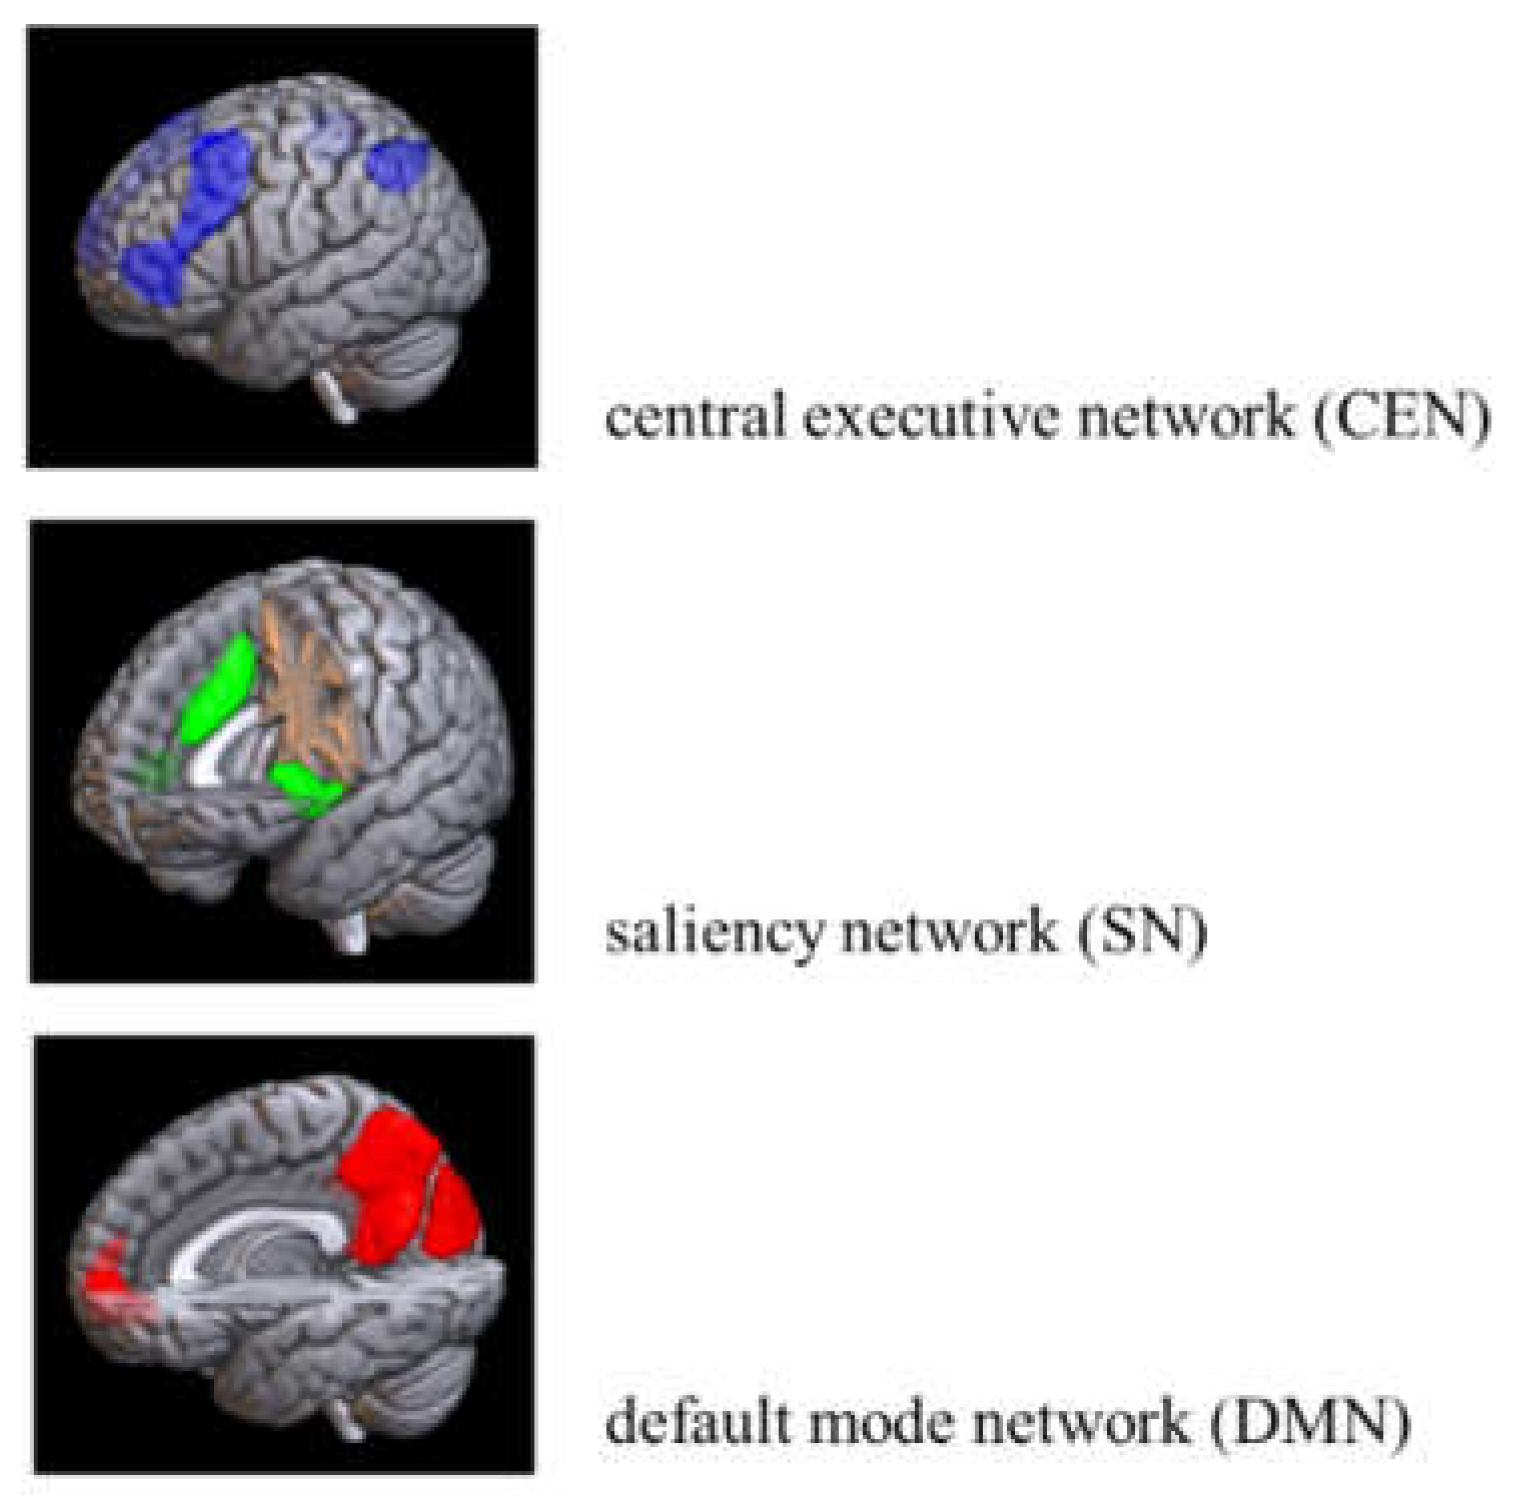
Figure 1. Triple network model Retrieved from: https://prtimes.jp/main/html/rd/p/000000002.000063078.html (accessed on 21 September 2024).
Preprints 119213 g001
Figure 2. Frequency of “positive understanding of gender equality” by score.
Preprints 119213 g002
Figure 3. Frequency of “positive feelings towards LGBTQ” by score.
Preprints 119213 g003
Figure 4. Frequency of “positive feelings towards people of a different race” by score.
Preprints 119213 g004
Figure 5. Difference in GMV from baseline by region for PHUD. 1one-sample t-test to confirm whether the mean value of ΔGMV was greater than zero. 2independent-sample t-test to confirm whether the mean value of ΔGMV was different between PHUD and others. *p < .05; p < .10. PHUD: participants with the highest understanding of diversity. Error bars represent standard error.
Preprints 119213 g005
Table 1. Attribute comparison between PHUD and others.
PHUD Others
Mean SD Mean SD t p
GMV
   Whole 102.569 7.316 98.853 8.062 1.108 0.282
   DMN 102.479 8.292 99.427 10.044 0.762 0.455
   CEN 104.527 6.147 104.036 7.734 0.162 0.873
   SN 103.576 10.605 95.884 10.319 1.681 0.109
Years of schooling 17.550 2.296 17.500 1.080 0.057 0.955
BMI 22.342 2.331 23.606 3.080 1.066 0.300
Age 50.000 12.116 44.100 13.486 1.056 0.304
CEN: central executive network. DMN: default mode network. PHUD: participants with the highest understanding of diversity. SD: standard deviation. SN: saliency network.
Table 2. Attribute comparison between PHUD and others (continued).
PHUD Others
Drinking frequency
   Every day 3 2
   5-6 days a week 1 0
   3-4 days a week 3 1
   1-2 days a week 1 2
   1-3 days a month 1 2
   Seldom drink 1 1
   Quitted 1 0
   Don’t drink (can’t drink) 0 2
χ2 5.832
p 0.559
Smoking frequency
Every day 0 3
Haven’t smoked for over a month 2 2
Don’t smoke 9 5
χ2 4.105
p 0.128
Marriage
Married 10 8
Single 1 2
χ2 0.509
p 0.476
Occupation
Professional/technical 5 7
Management 4 3
Sales 1 0
Service/security 1 0
χ2 2.434
p 0.487
PHUD: participants with the highest understanding of diversity.
Table 3. ΔGMV by region for PHUD and others.
N Mean SD SE t1 p1 d1 t2 p2 d2
PHUD
   Whole 11 3.544 4.542 1.369 2.587 0.027* 0.780 2.728 0.013* 1.206
   CEN 11 3.732 4.584 1.382 2.700 0.022* 0.814 0.994 0.333 0.436
   SN 11 6.712 7.181 2.165 3.100 0.011* 0.935 3.308 0.004** 1.460
DMN 11 3.696 5.943 1.792 2.063 0.066 0.622 1.795 0.089 0.786
Others
Whole 10 -1.011 2.811 0.889 1.137 0.285 0.360
CEN 10 1.896 3.791 1.199 1.582 0.148 0.500
SN 10 -2.202 4.797 1.517 1.452 0.181 0.459
DMN 10 -0.831 5.575 1.763 -0.472 0.648 0.149
1one-sample t-test to confirm whether the mean value of ΔGMV was greater than zero. 2independent-sample t-test to confirm whether the mean value of ΔGMV was different between PHUD and others. *p < .05; p < .10. N: number of samples. PHUD: participants with the highest understanding of diversity. SD: standard deviation. SE: standard error. d: Cohen’s d.
Disclaimer/Publisher’s Note: The statements, opinions and data contained in all publications are solely those of the individual author(s) and contributor(s) and not of MDPI and/or the editor(s). MDPI and/or the editor(s) disclaim responsibility for any injury to people or property resulting from any ideas, methods, instructions or products referred to in the content.
Copyright: This open access article is published under a Creative Commons CC BY 4.0 license, which permit the free download, distribution, and reuse, provided that the author and preprint are cited in any reuse.
Prerpints.org logo

Preprints.org is a free preprint server supported by MDPI in Basel, Switzerland.

Subscribe

© 2024 MDPI (Basel, Switzerland) unless otherwise stated