1. The Importance of Customer Retention
In the dynamic and competitive world of business, many companies focus their efforts on attracting new customers, convinced that expansion is the path to success. However, this "constant hunting" mentality can lead to an endless cycle of costly acquisition, neglecting a crucial element: customer retention [
1].
Customer retention is not just a strategy; it is a paradigm shift[
2,
3]. Companies that understand this truth recognize that keeping an existing customer is significantly more profitable than acquiring a new one. A loyal customer not only generates recurring revenue, but also acts as a brand ambassador, recommending products or services, and elevating the perceived value of the company within their community. This is where the concept of Lifetime Value (LTV) comes into play [
1,
2].
What is Lifetime Value (LTV)?
Lifetime Value (LTV) measures the total value a customer brings throughout their relationship with the company. The longer a customer remains loyal, the greater this value becomes [
4,
5]. Simply put, LTV helps companies understand how much revenue a customer generates over their lifetime with the business. For a service company, the calculation of LTV is fundamental to assessing the profitability of retention efforts and optimizing the customer experience [
6].
LTV Formula for a Service Company
LTV can be calculated using the following formula:
Where:
ARPU (Average Revenue Per User): The average monthly revenue generated by a customer. For a service company, this could include subscription income, additional services, or any other source of recurring revenue.
Customer Lifetime: The average time (in months or years) that a customer remains active before canceling or ending the service. This reflects the average duration of the customer relationship with the company.
Gross Profit Margin: The percentage of revenue left after deducting direct service costs, such as operating costs, infrastructure, and support.
For example, if a service company has an ARPU of USD 15, a Customer Lifetime of 14 months, and a Gross Profit Margin of 40%, the LTV would be:
This value indicates that, on average, each customer contributes 84 USD in gross value during their lifecycle with the company. Understanding LTV allows a company to make strategic decisions about how much to invest in acquiring and retaining customers, thereby optimizing long-term profitability.
Five Key Benefits of Improving Customer Retention
Increase in Lifetime Value (LTV): Enhances profitability by generating more revenue per customer over time.
Reduction in Customer Acquisition Cost (CAC): By retaining more customers, the need to spend on acquiring new ones is reduced, lowering overall acquisition costs.
Greater Ability to Compete in Acquisition Costs (CPA): A higher LTV allows for higher acquisition costs when acquiring new customers, strengthening competitiveness.
Improvement in Virality: Loyal customers are more likely to recommend the company, driving organic growth.
Positive Impact on Cash Flow and Investment Capacity: Revenue stability improves cash flow, allowing for greater strategic investments in long-term growth.
So, how do you maximize LTV? The answer lies in focusing on retention [
2,
3]. Leading companies have discovered that by improving the customer experience and consistently meeting their needs, they not only retain customers but also turn them into passionate brand advocates [
6,
7].
In a saturated market, where products and services are often perceived as interchangeable, customer experience becomes the true differentiator [
7]. Companies that invest in understanding and improving every interaction with their customers, from the first to the last, succeed in retaining those who have already trusted them [
4,
6].
This whitepaper proposes a scientific and structured approach for companies to optimize retention and, therefore, LTV. Inspired by the scientific method, this approach will help organizations formulate relevant questions, develop meaningful hypotheses, and conduct experiments that provide concrete data. Ultimately, the goal is simple: to create deeper and longer-lasting relationships with customers, resulting not only in revenue but also in sustainable and meaningful business growth [
1,
5].
Focusing efforts on customer retention is not just a good practice; it is the key to building a resilient and prosperous company.
2. The Scientific Method Applied to Customer Retention
Imagine a process that allows you to tackle customer retention challenges with the precision and clarity science provides. That is exactly what the scientific method offers. Instead of relying on intuitions or assumptions, you can follow a structured, data-driven approach to discover what truly drives customer loyalty and, most importantly, how to maintain it [
8,
9,
10].
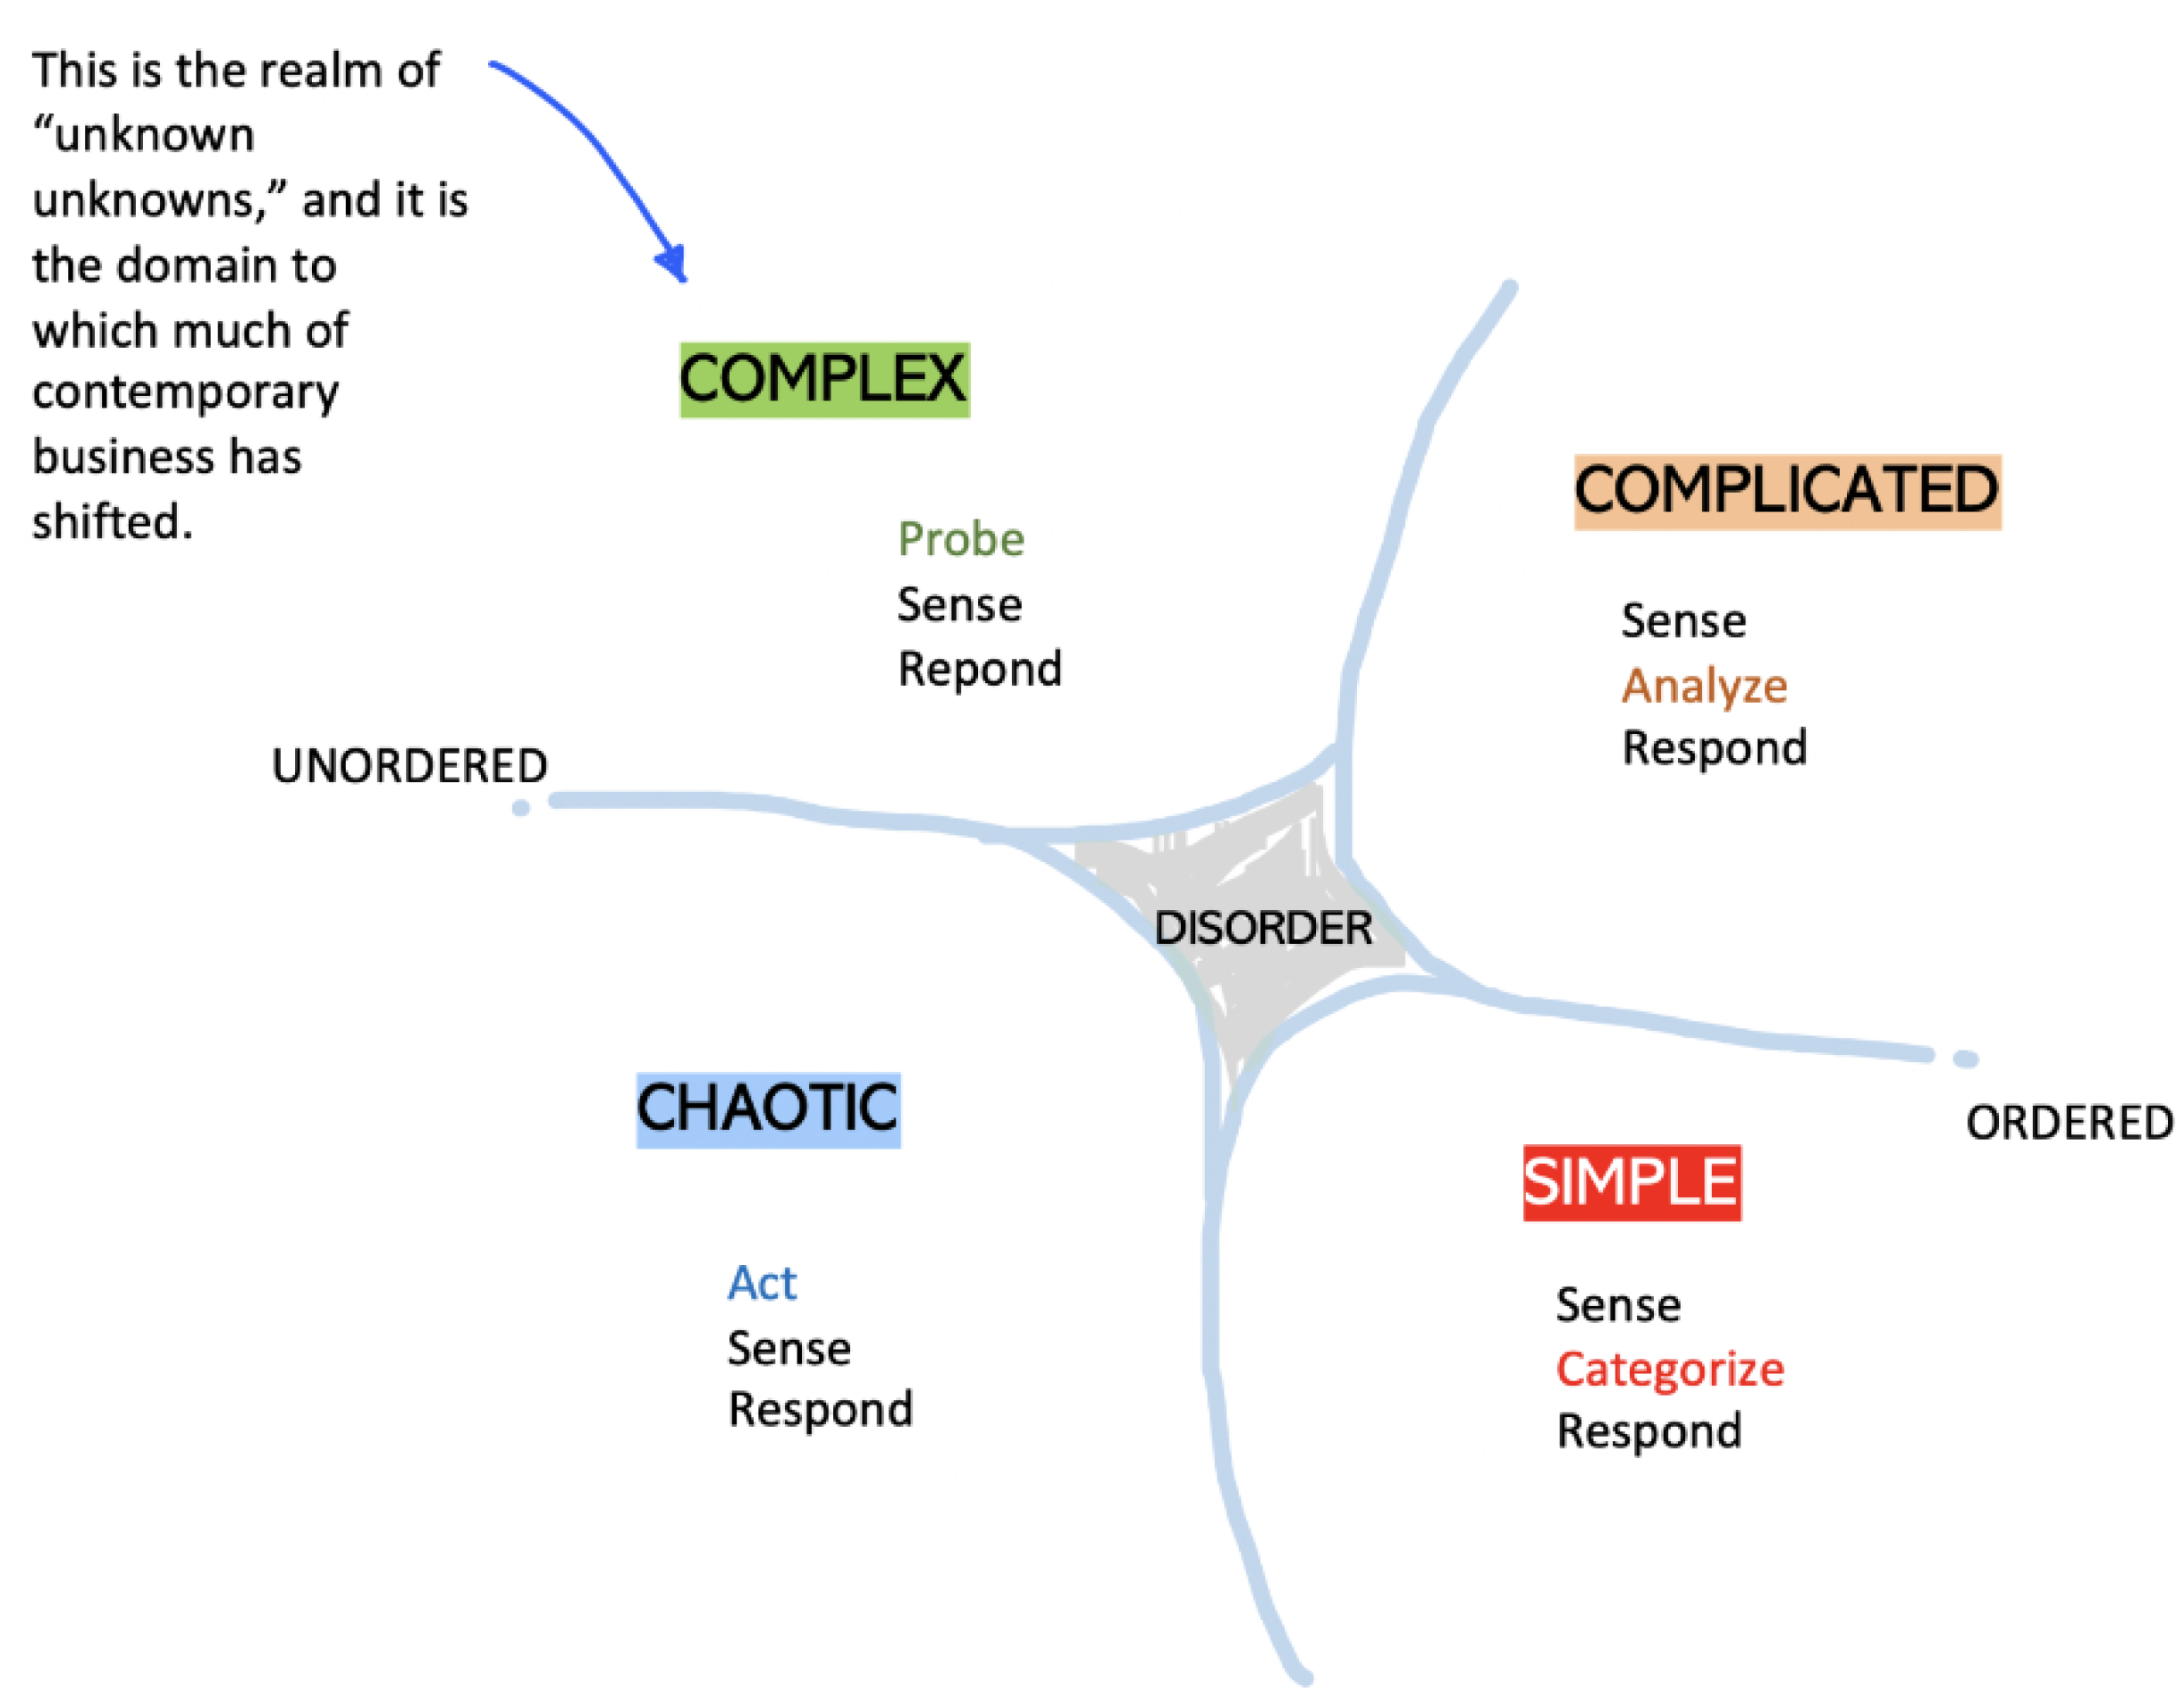
To better understand where and how to apply the scientific method in customer retention, it is useful to situate it within the Cynefin framework, which categorizes problems into different contexts: simple, complicated, complex, and chaotic [
11]. The scientific method shines particularly in complicated and complex domains, where an iterative, evidence-based approach is required [
8].
Figure 1.
Cynefin framework.
Figure 1.
Cynefin framework.
In the complicated domain, where cause-and-effect relationships are discernible but not obvious to everyone, the scientific method provides a powerful tool [
11]. For example, you might observe that customer satisfaction (CSAT
1) is decreasing, but the causes are not immediately clear.
Figure 2.
CSAT Trend with Turning Point and Post-Drop Stability.
Figure 2.
CSAT Trend with Turning Point and Post-Drop Stability.
Here, careful observation and data analysis allow you to ask precise questions like, "What aspect of the service is causing dissatisfaction?" Once you have the question, you can develop informed hypotheses and design controlled experiments to test them, such as adjusting after-sales service in a control group and comparing the results with an untreated group [
12].
The scientific method is even more valuable in the complex domain, where cause-and-effect relationships can only be identified retrospectively [
11]. In a complex environment, such as the multifaceted interaction between customers and multiple touchpoints with a company, an iterative and continuous learning approach is crucial. Here, experimentation is not only useful; it is essential [
10,
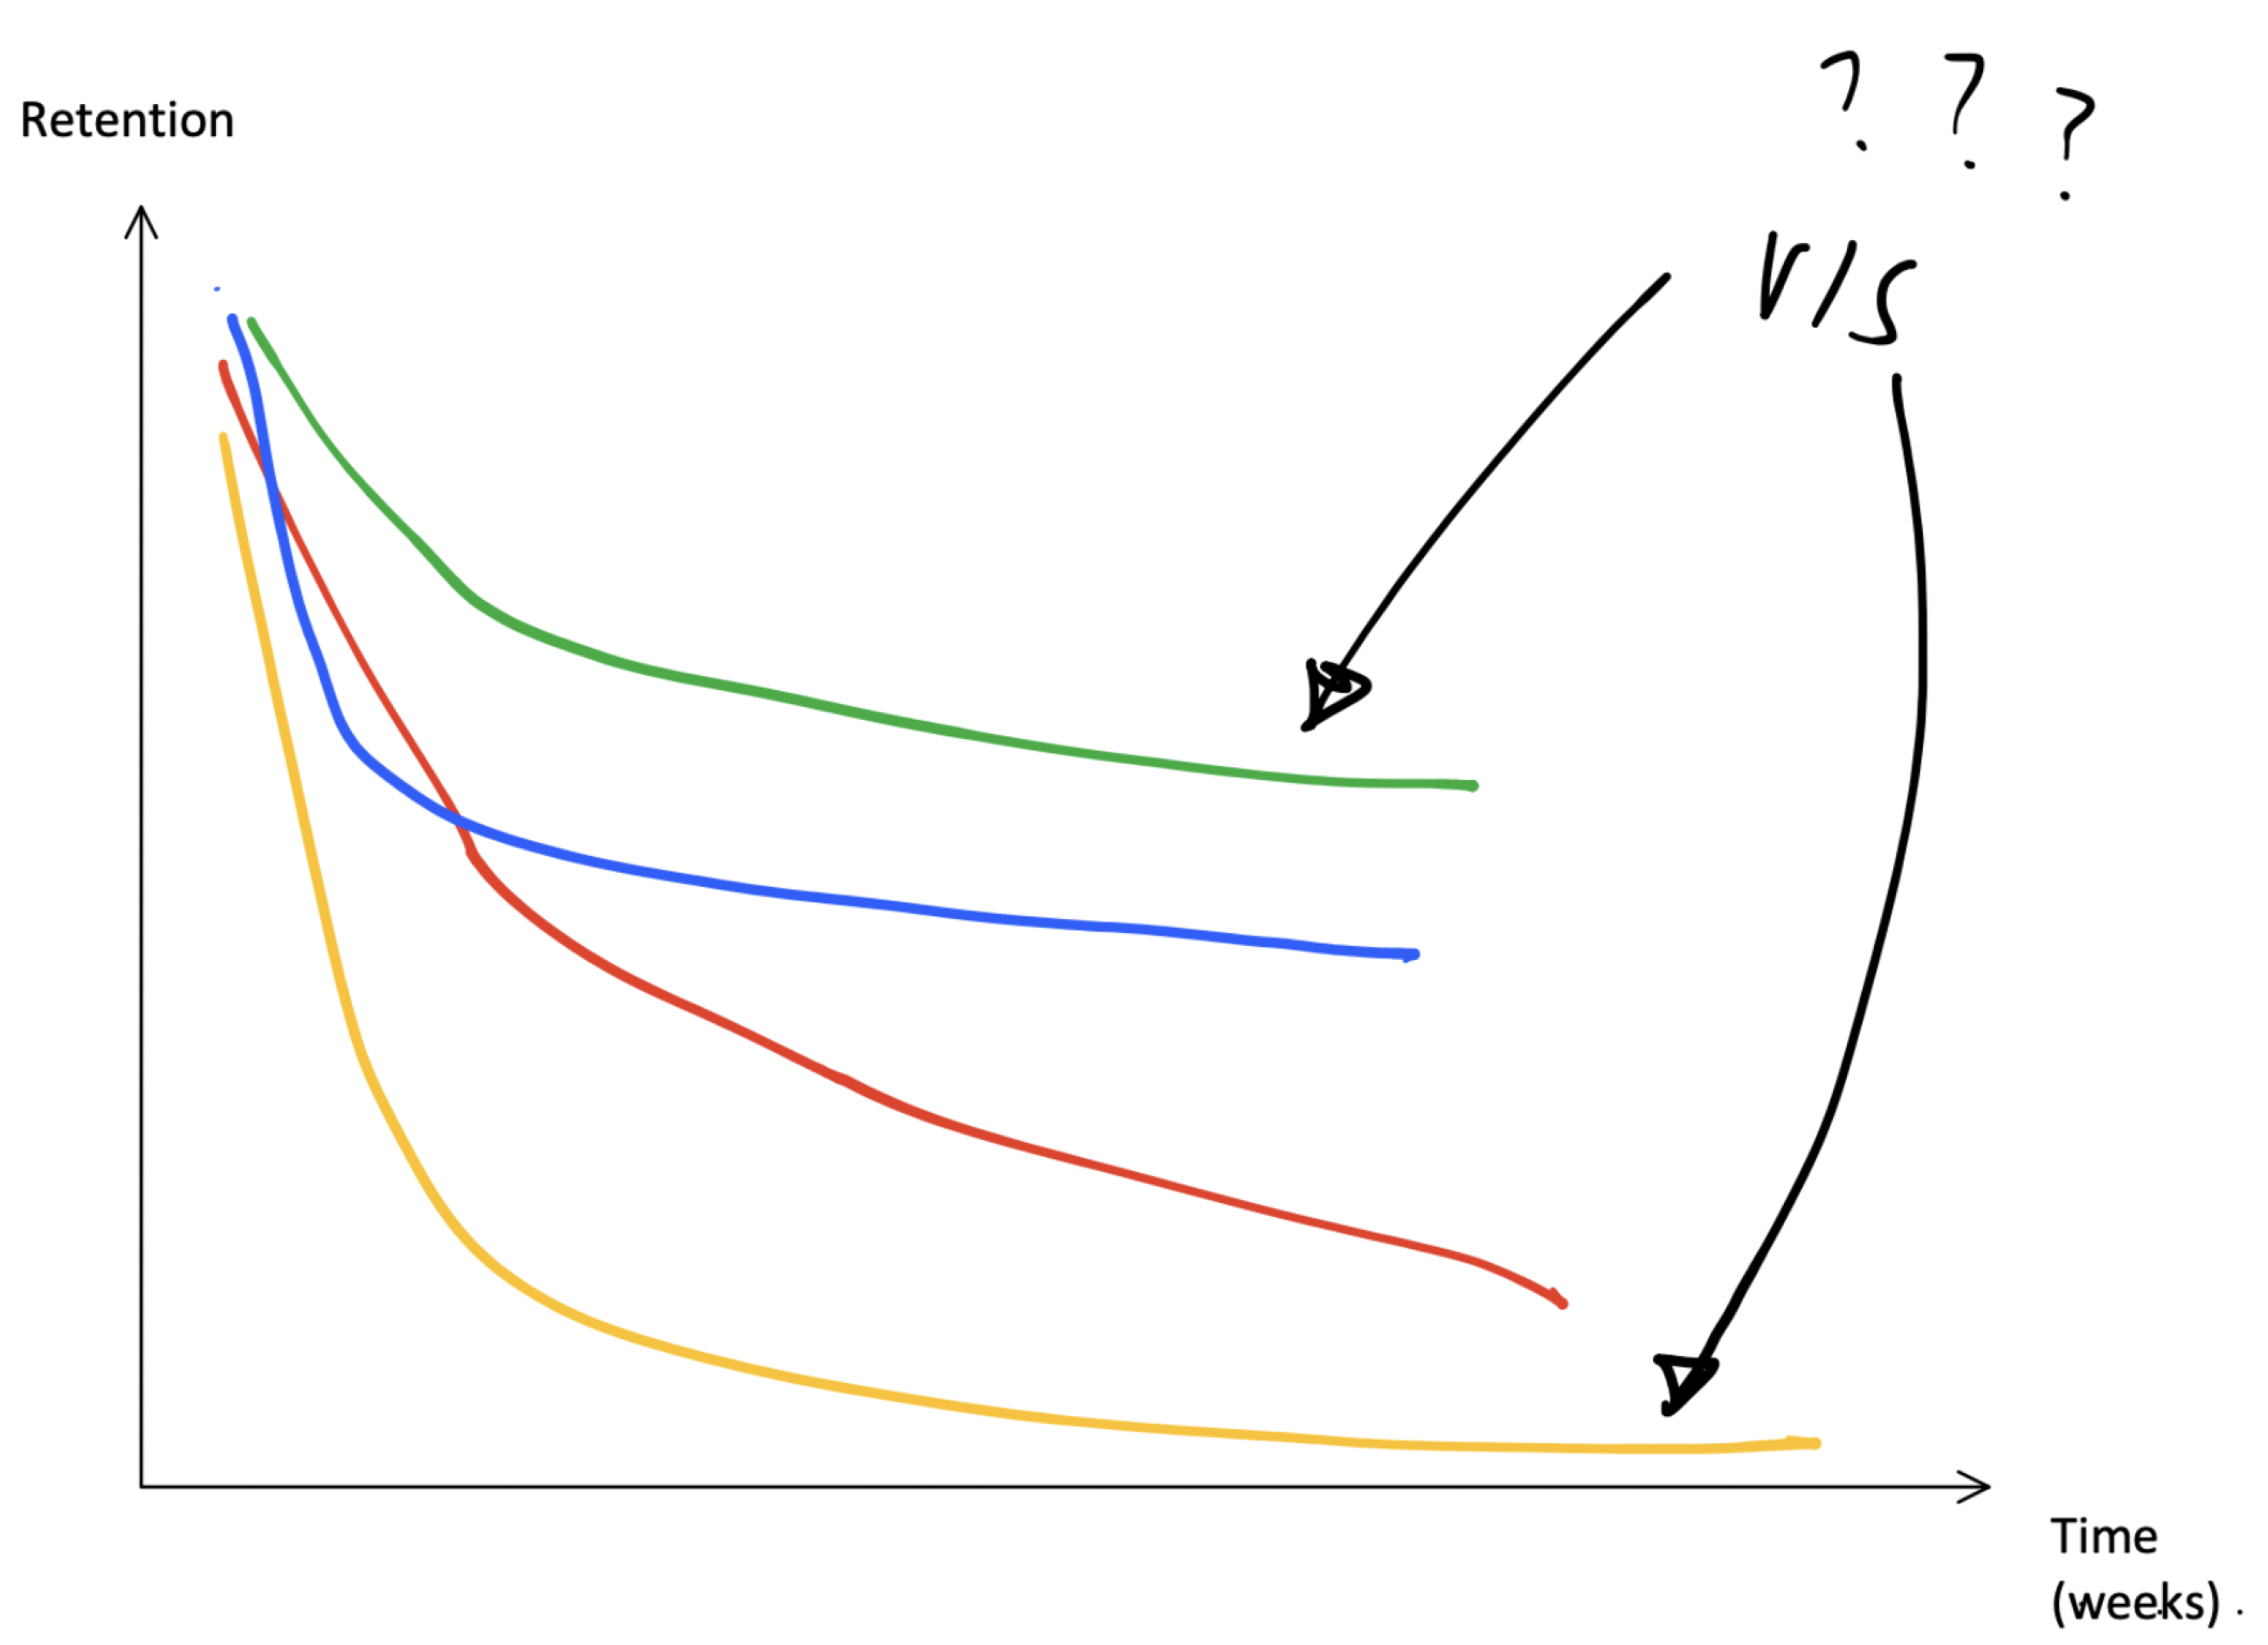
12]. For example, you may notice that churn patterns vary widely between different customer cohorts without an apparent cause.
Figure 3.
Retention Curves Over Time: Comparing Different Cohorts.
Figure 3.
Retention Curves Over Time: Comparing Different Cohorts.
You formulate hypotheses about these patterns and test various interventions in small iterations. The results of these experiments help you identify emerging patterns and adjust your strategies in real time [
13,
14]. In both contexts, the key is the ability to progressively generate knowledge through cycles of observation, hypothesis, experimentation, and analysis. This approach allows companies to solve problems while dynamically adapting to a constantly changing environment [
8,
15].
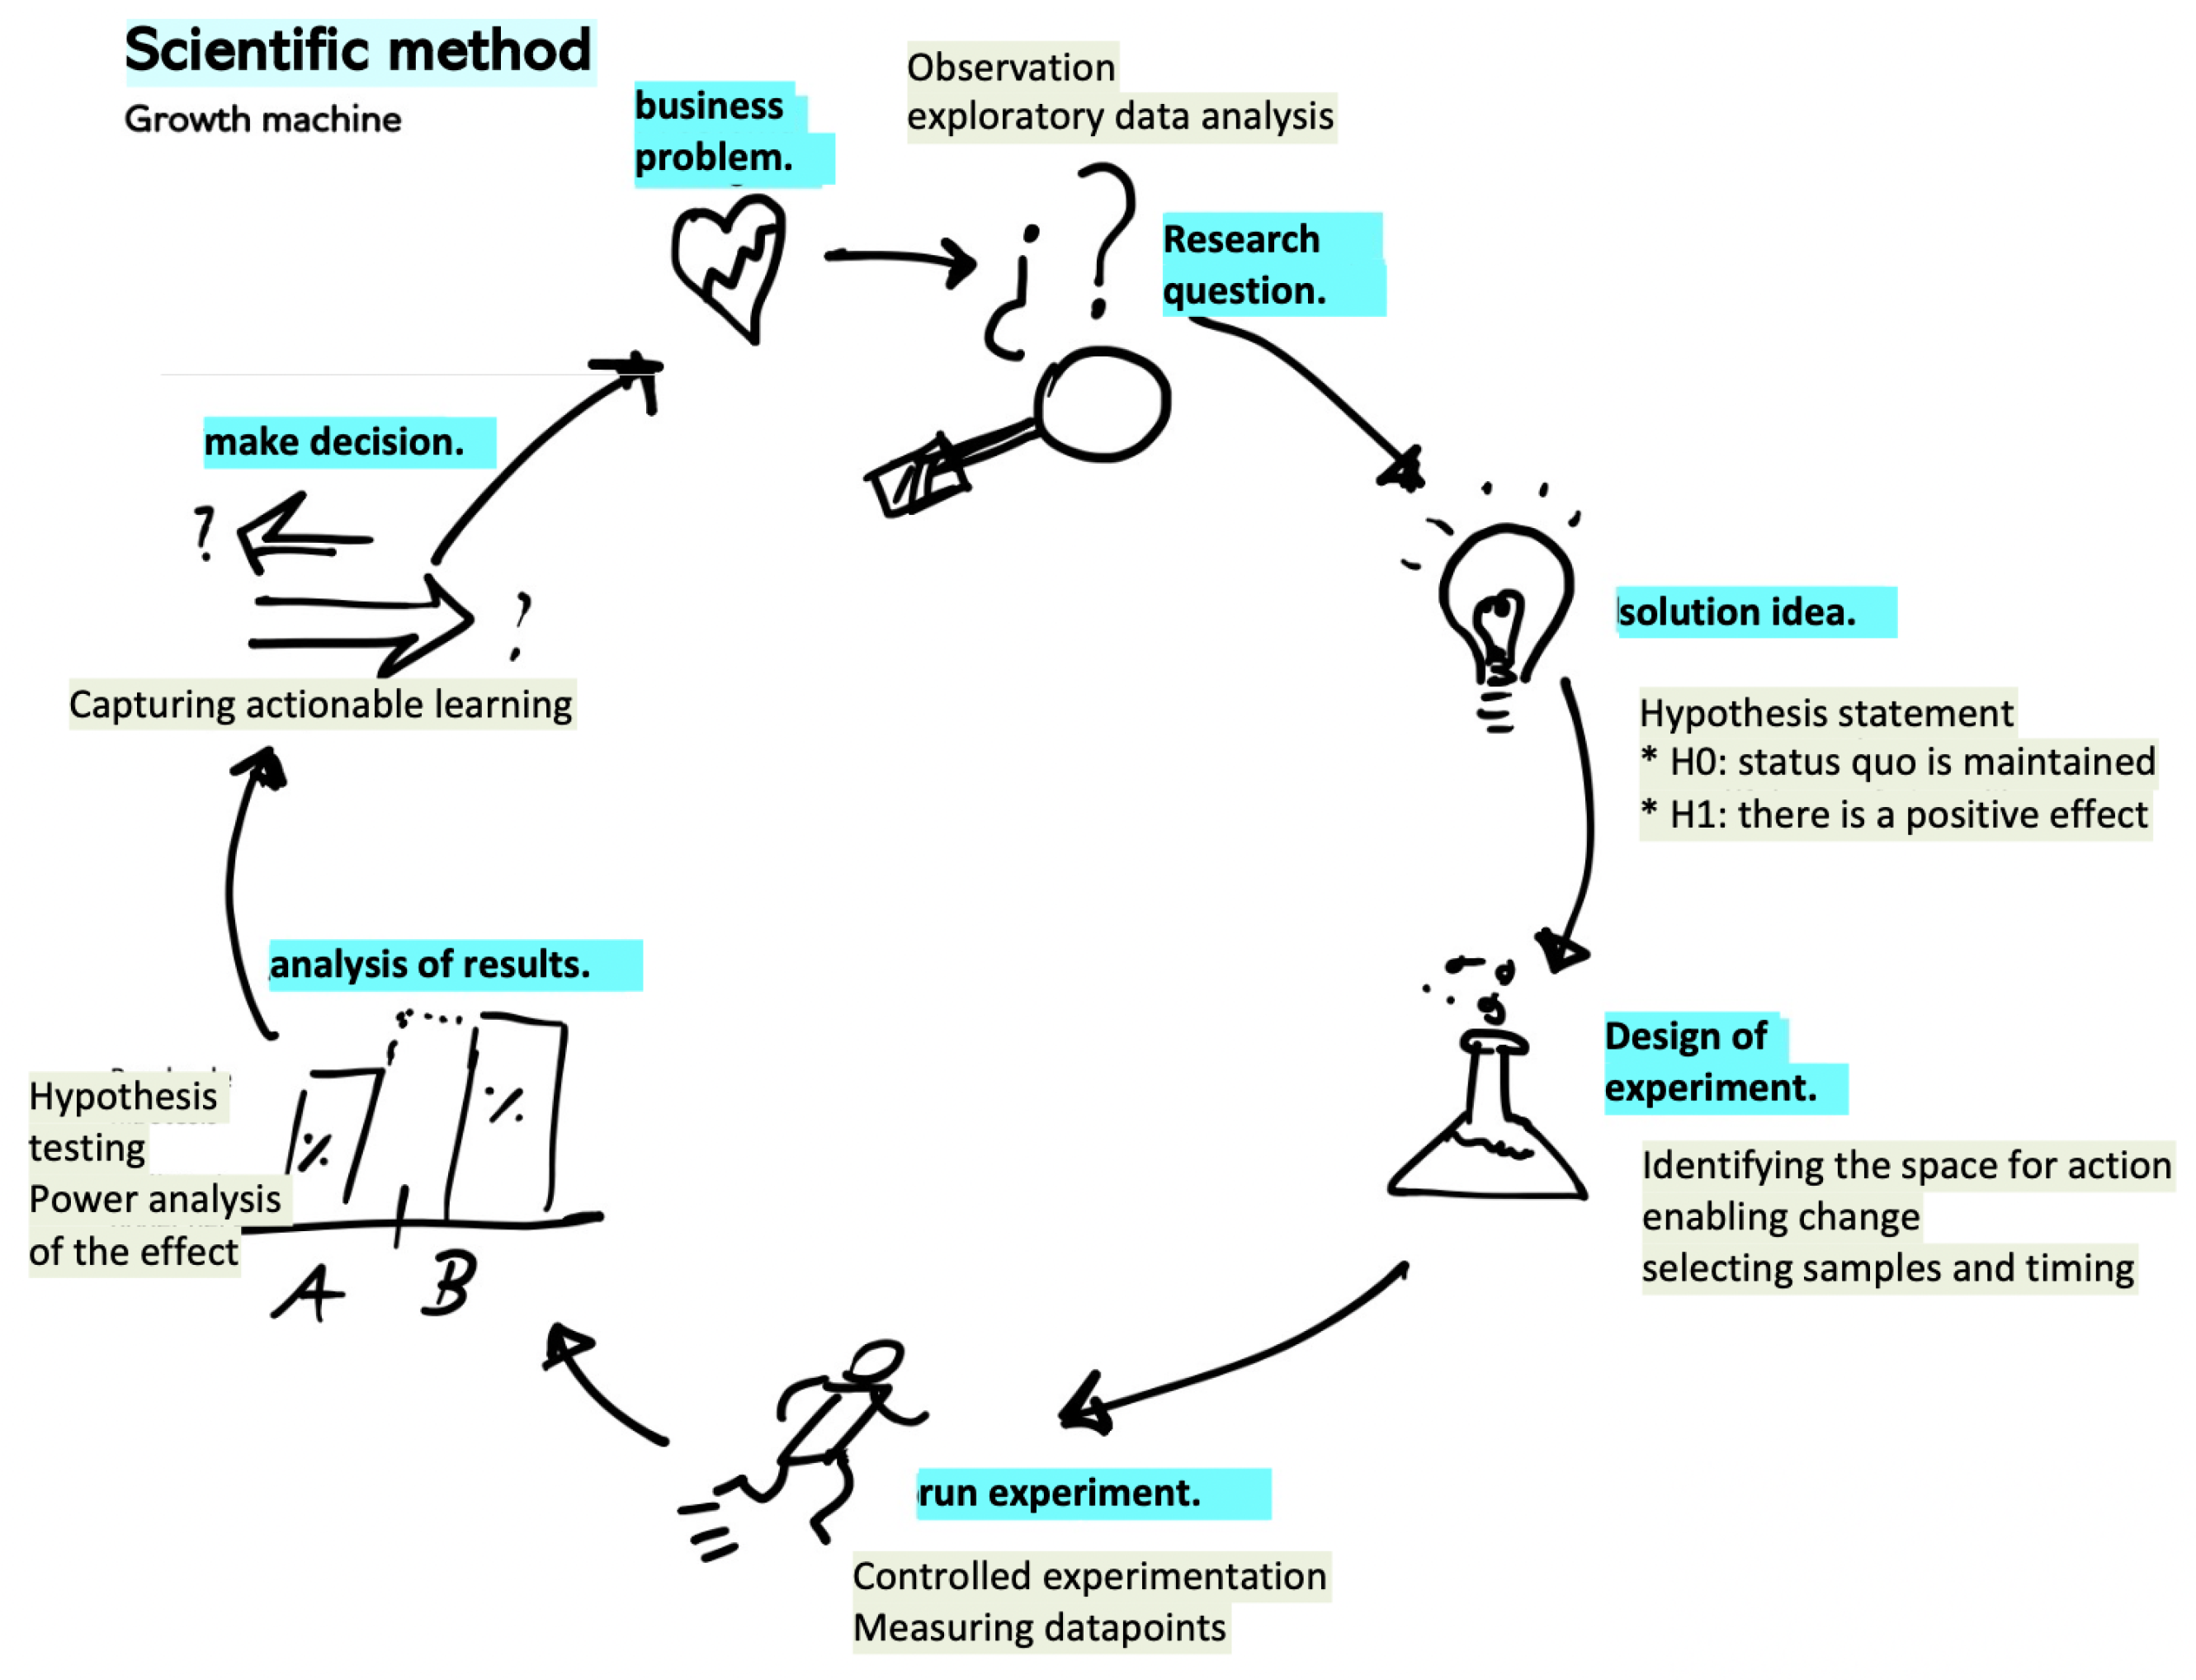
Applying the Scientific Method for Business Experimentation
Observation: Analyze data and detect problems in the customer experience.
Research Question: Formulate specific questions to address the identified problem.
Hypothesis: Develop hypotheses about possible solutions.
Experimentation: Conduct controlled tests, such as A/B testing
2, to validate hypotheses.
Analysis: Evaluate results and adjust strategy.
Conclusion: Implement effective solutions and document learnings for future iterations.
Figure 4.
Scientific method diagram.
Figure 4.
Scientific method diagram.
Applying the scientific method to customer retention, within the Cynefin framework, not only provides answers; it offers a path to successfully navigate the complexity of the modern market [
11]. Each iteration brings you closer to deeply understanding your customers, improving their experience, and maximizing their long-term value. This approach not only optimizes retention but also fosters sustainable and resilient business growth [
10].
3. Problem Definition: Observation and Data Analysis
Every great discovery begins with observation. It is the first step toward deep understanding and continuous improvement [
6,
16,
17]. In the context of customer retention, observation is where everything starts. It is the moment we decide to set aside assumptions and truly listen to what the data is telling us.
Observation involves carefully examining the key indicators of your business. Metrics like ARPU (Average Revenue Per User), frequency and duration of service usage, customer satisfaction rates, or even the number and mix of interactions across service channels are the pulse of your customer relationship. But observation is not simply about seeing; it is about understanding what those numbers reveal about the customer experience [
6].
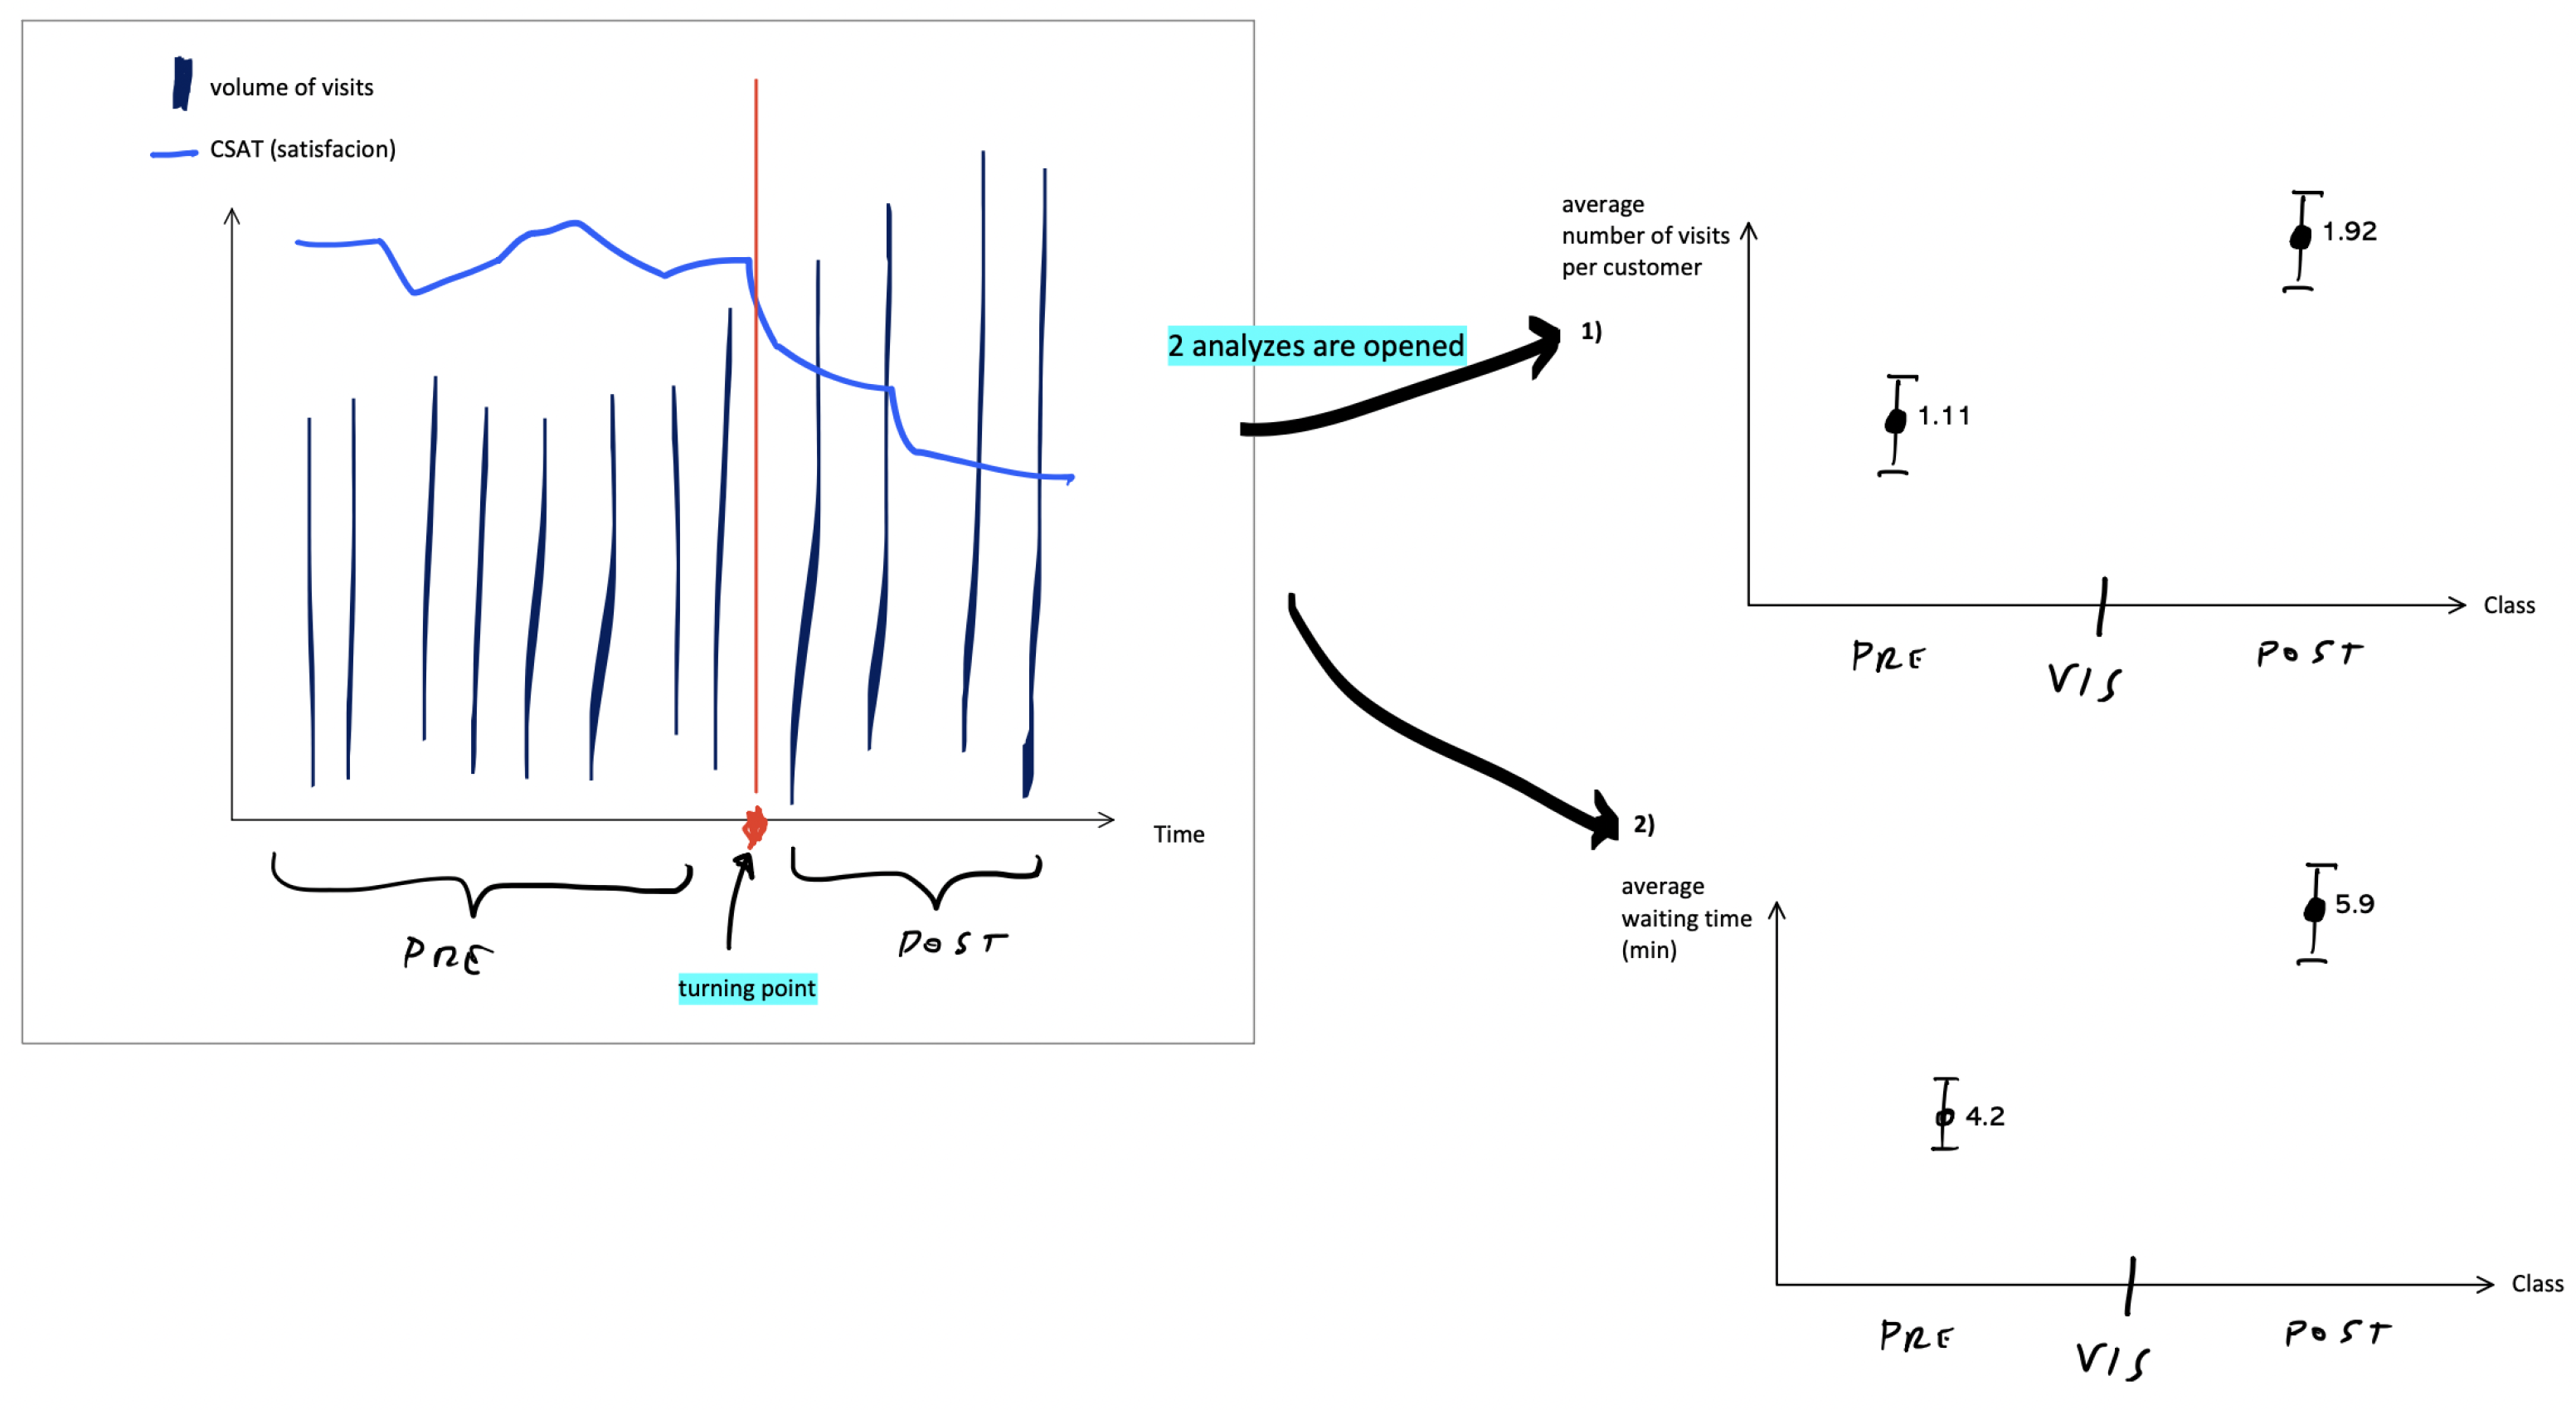
Imagine, for example, that the data shows an increase in visits to physical stores, but at the same time, a decrease in customer satisfaction.
Figure 5.
Pre and Post Turning Point Insights.
Figure 5.
Pre and Post Turning Point Insights.
This is where true investigation begins. These data points alone are just fragments, but together they can tell a powerful story. The key is to be curious, to ask yourself why these things are happening. Is it a problem with wait times? Or maybe staff are not resolving issues effectively?
Observation naturally leads to problem definition. This is a crucial step because it defines the focus of your effort. It is not enough to identify a trend; you need to dig deeper and understand the root cause of the problem [
16,
17]. This is the moment when teams come together to analyze the data and, through a collaborative approach, begin to form a clear picture of what is happening [
14].
Once the problem is defined, you can use tools like cohort analysis to segment your customers and see how different groups respond at various stages of their lifecycle [
18,
19]. This type of analysis can reveal patterns that are not immediately obvious. For example, you might discover that customers who visit the store two or more times a month have a significantly lower retention rate than those who visit only once. These types of insights are invaluable for formulating the right questions in the next phase.
Figure 6.
Post-sales Cohort Analysis - Active users.
Figure 6.
Post-sales Cohort Analysis - Active users.
Observation and data analysis are not passive processes; they are an active pursuit of understanding [
17]. They are the foundation on which success in customer retention is built. By taking the time to truly understand what the data are saying, you can identify problems with precision and, most importantly, prepare to solve them effectively and strategically. This is the first step toward creating a customer experience that not only satisfies but also retains and fosters loyalty [
5].
4. Hypothesis Formulation and Experiment Design
Once the problem is clearly defined, the next step is to turn that understanding into hypotheses that guide action. A well-formulated hypothesis is not just an informed assumption; it is a powerful tool for directing experiments that generate practical knowledge [
8]. This is where data becomes the foundation on which solutions are built [
10,
17].
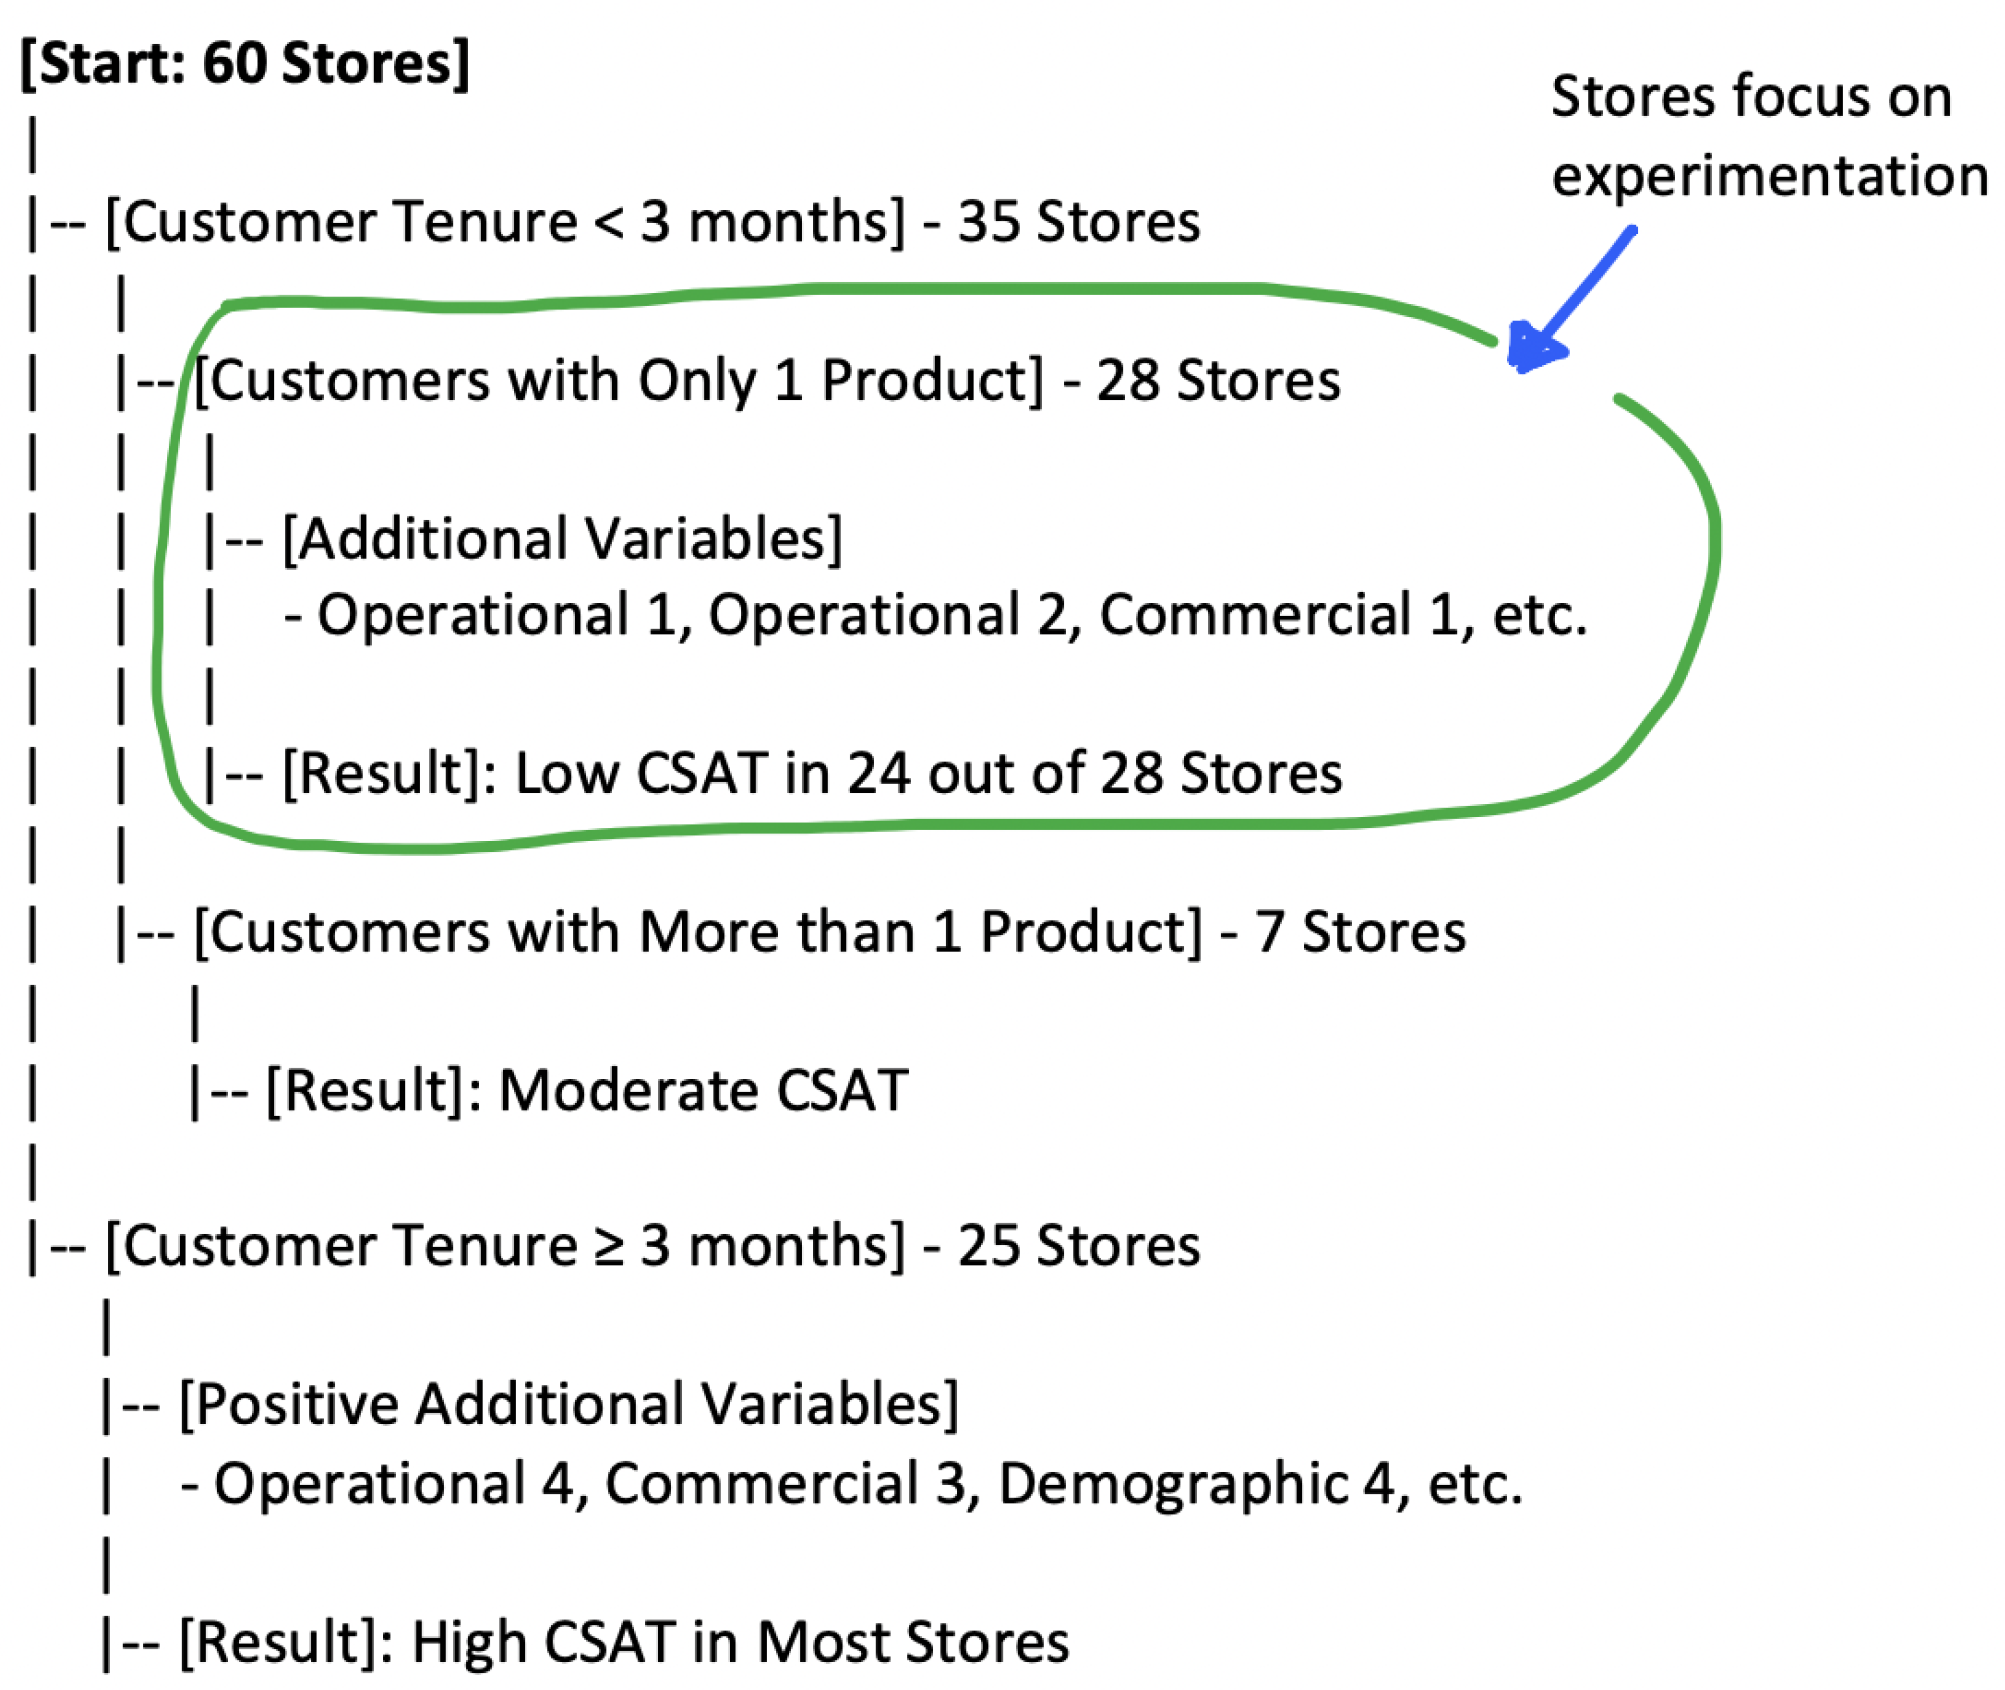
Suppose your unit of analysis is customer service stores across a country or region. The data shows that, although visit volumes have returned to normal monthly levels, customer satisfaction (CSAT) remains low, negatively impacting customer retention. In this situation, data analysis could be conducted to identify the causes of this behavior.
Applying a classification tree or XGBoost
3 model [
20]to a dataset that includes all stores, with variables such as CSAT, service volume, post-sales service metrics, as well as customer demographic and commercial variables, could detect patterns. For example, you might find that low-CSAT stores, representing 40% of the total, are responsible for the lack of improvement in satisfaction levels. By characterizing these stores, you might discover, for example, that most customers visiting these stores have been with the company for less than three months and only hold one of the three available products/features. Other analyses show that customers with more products (a+b+c) tend to have higher CSAT, retention, and ARPU, which ultimately positively impacts LTV (Lifetime Value).
Figure 7.
CSAT Decision Tree.
Figure 7.
CSAT Decision Tree.
Based on this analysis, you could formulate a testable hypothesis such as: "Offering personalized incentives for acquiring more products to customers with less than three months of tenure will improve their satisfaction and retention." This type of hypothesis would be ideal for a low-cost controlled experiment.
Here is where advice from Michael Schrage, author of Investing in Big Ideas is Bad Business, is key. Schrage reminds us that we do not need significant investments to validate great ideas; instead, we should focus on simple and accessible experiments [
14]. This approach is particularly useful in multi-store scenarios, allowing ideas to be tested without draining significant resources.
For example, rather than implementing an expensive technological overhaul across all stores in the country, you could design a simple experiment. Select two groups of stores from the 40% with low CSAT. In one group (experimental group "B"), implement a targeted campaign offering personalized incentives to customers with less than three months of tenure to promote the acquisition of additional products. The other group (control group "A") will serve as a reference, maintaining current conditions without offering incentives. This A/B test will allow you to evaluate the intervention’s impact in real-time [
12], using key metrics such as average service time, customer satisfaction measured through post-service surveys, and retention and conversion rates associated with the campaign.
This approach will enable you to validate or refute the hypothesis efficiently and economically. Additionally, it is important to remember that experiment design is an iterative process; not all experiments will confirm your hypotheses, but each one will provide valuable information [
14,
15]. Even when results are not as expected, you will be one step closer to understanding what truly works [
10].
In the end, by applying this data-driven, low-cost experimentation approach, you can continuously refine your strategy [
15], improving customer retention and maximizing LTV, all while optimizing resources and tailoring processes to the specific needs of each store and its customers.
5. Results Analysis and Conclusion Generation
The true value of any experiment lies in what we learn from it. Once experiments are conducted, we reach the crucial moment of data analysis, where decision-making must be based on objective information and not subjective opinions [
14]. This is an essentially data-driven approach that allows companies to move with confidence in a highly complex environment [
8,
17].
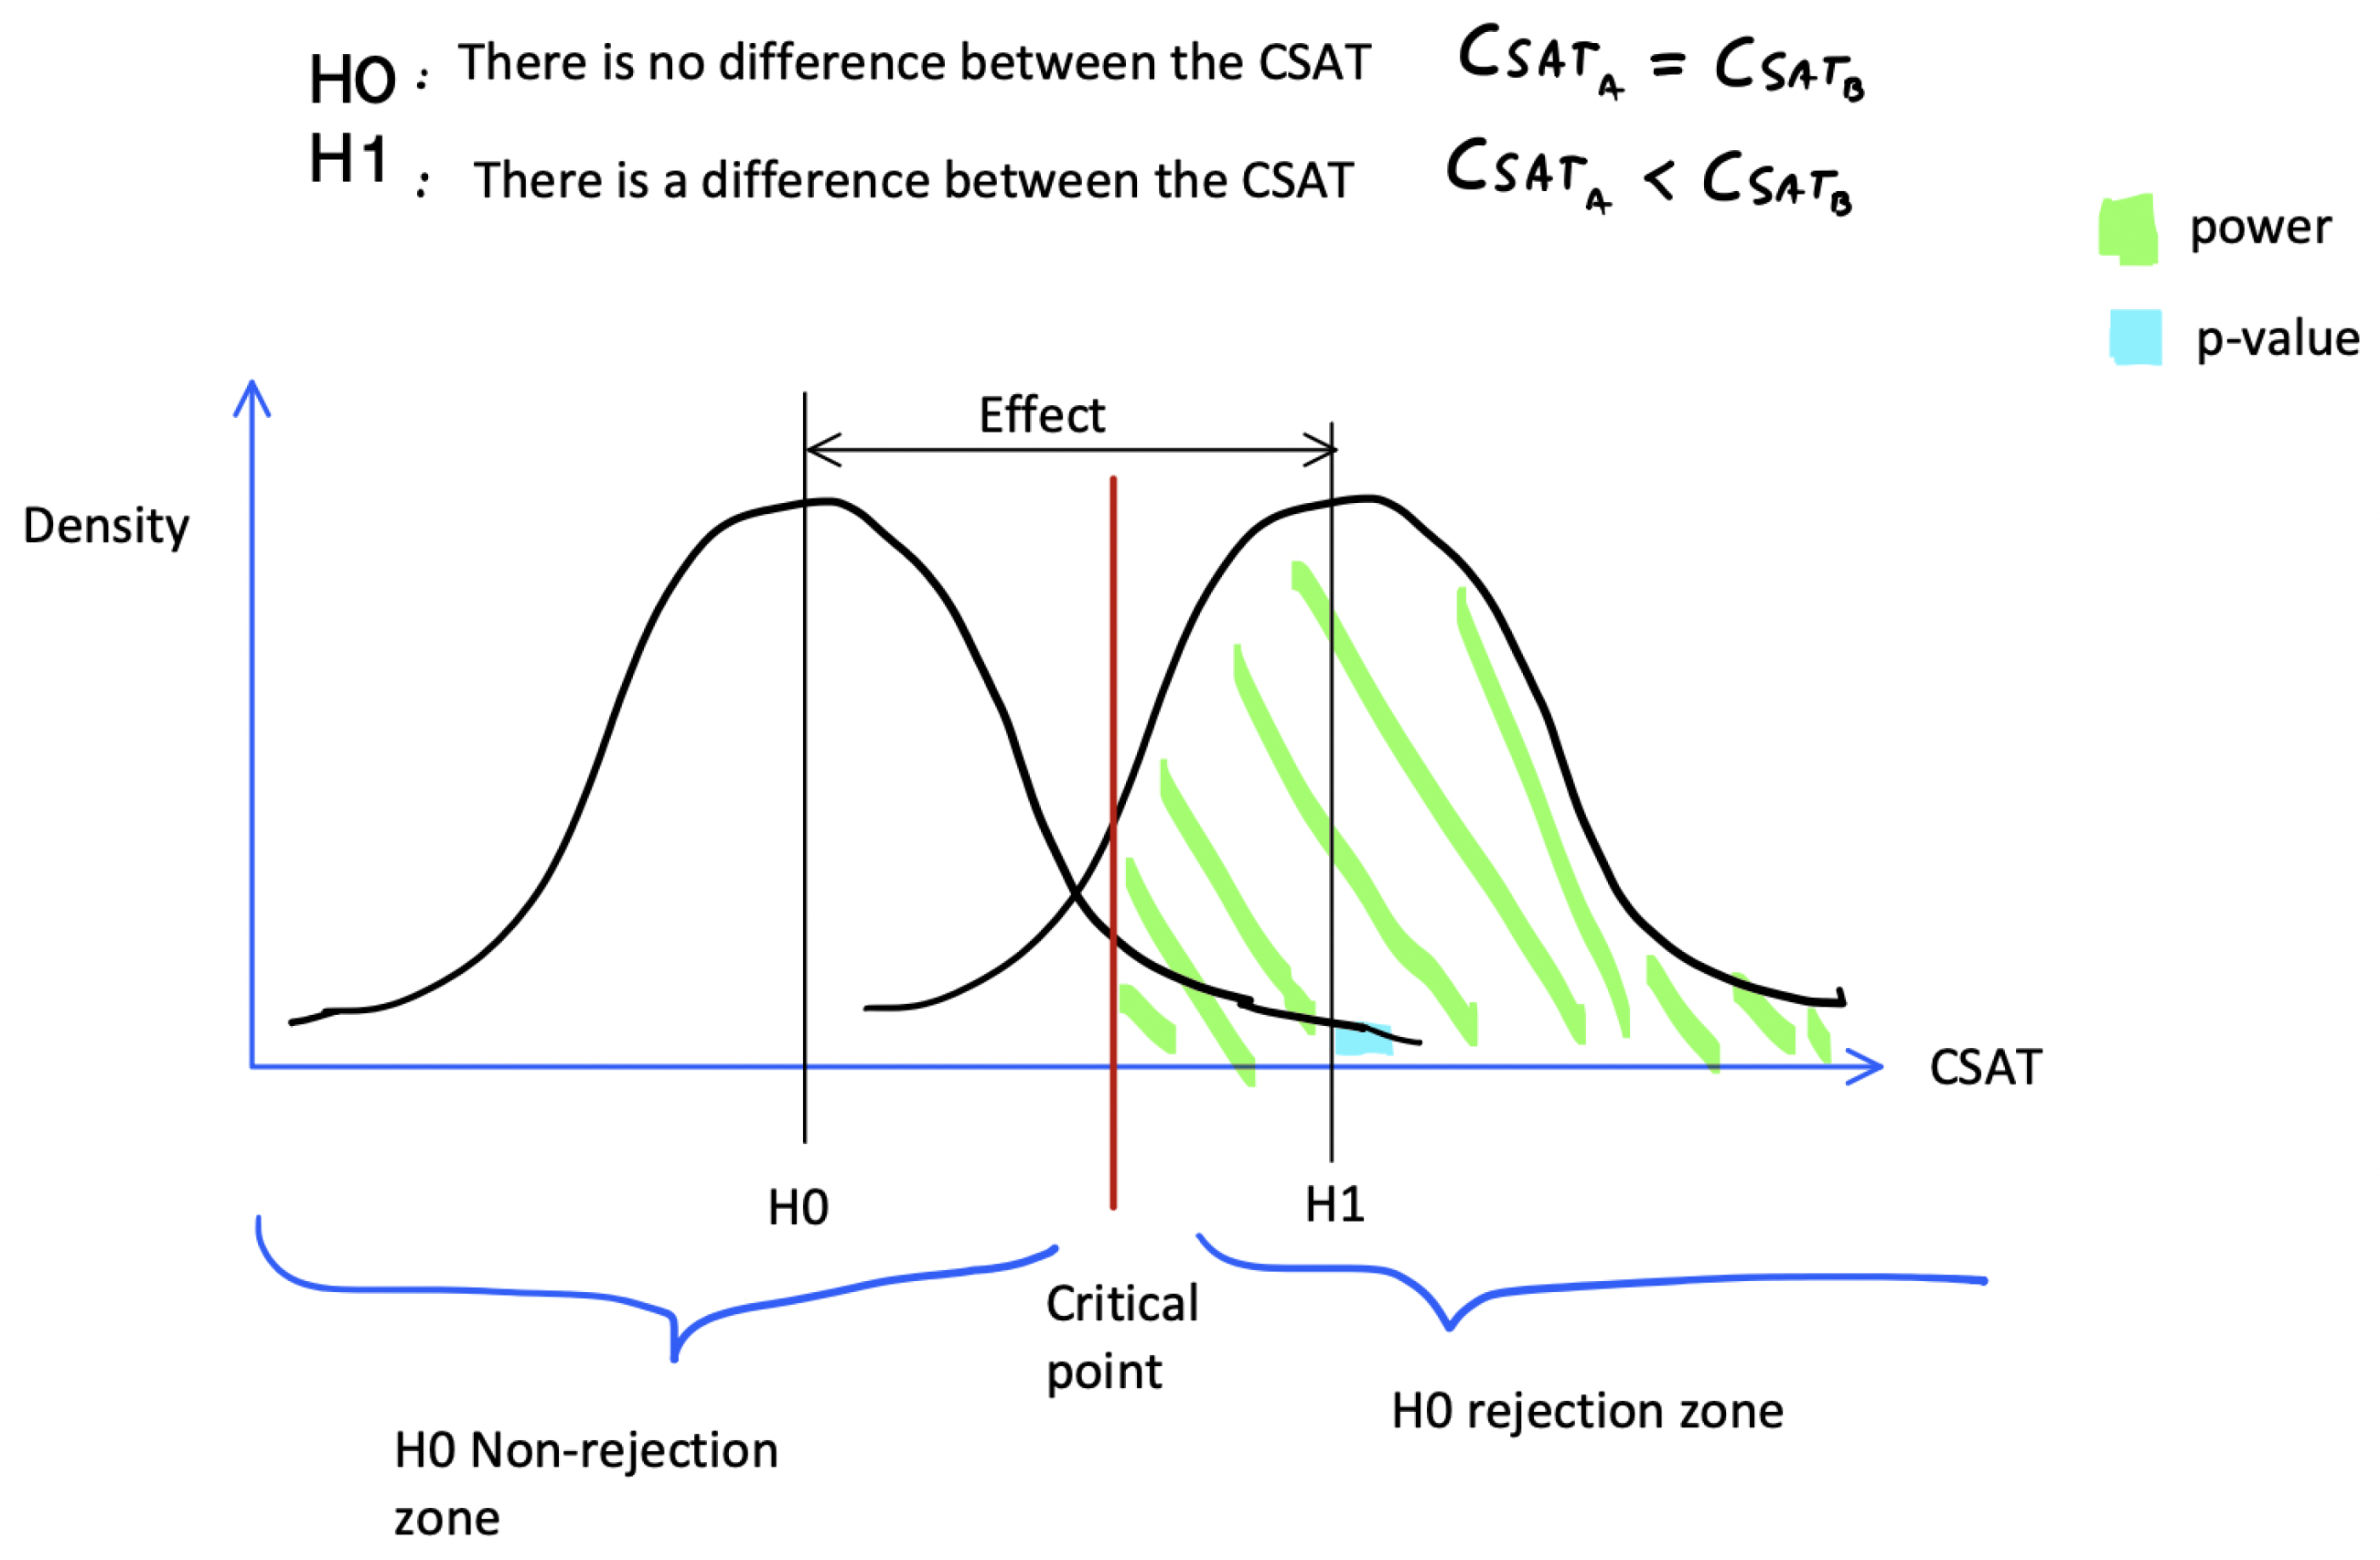
To make well-founded decisions, one of the key methods is hypothesis testing combined with statistical power analysis [
12,
21]. In the
Figure 8, you can see an example of how a hypothesis is evaluated using the distribution of the CSAT variable. Here, two hypotheses are proposed:
H0 (null hypothesis): There is no difference in CSAT between two store groups.
H1 (alternative hypothesis): There is a difference, with CSAT B being higher than CSAT A.
Figure 8.
Hypothesis testing with power analysis.
Figure 8.
Hypothesis testing with power analysis.
The goal of the analysis is to determine whether the observed results are significant enough to reject the null hypothesis. The
p-value (blue area) indicates the likelihood of the observed results occurring under the null hypothesis, while the green area indicates the power of the analysis, or the probability of detecting a real difference when it exists [
21].
If the
p-value is low enough (below a common threshold, such as 0.05), we can conclude that there is sufficient evidence to reject H0 and validate H1 [
21,
22], suggesting that the commercial treatment in the proposed campaign is responsible for improving customer satisfaction.
In these types of experiments, it is not only crucial to identify whether the difference is statistically significant but also to quantify the effect size, which corresponds to the practical business difference [
21]. Power analysis helps determine whether the observed difference has a sufficiently relevant impact to justify an intervention [
22]. In this case, if the hypothesis is validated and a positive impact on CSAT and/or retention is detected, scalable action can be considered across all stores in the organization.
———————————
Next Steps and Scaling: If the hypothesis is validated, meaning that a positive impact on CSAT and/or retention is observed, the next step to continue and scale this initiative could be to integrate advanced technologies such as generative AI (genAI) [
23]. This technology would allow for automating and simplifying campaign personalization, efficiently creating scripts for sales executives. In doing so, the need for executives to manually analyze customer information in IT systems to generate personalized messages during calls would be eliminated.
Additionally, incorporating genAI could increase not only operational efficiency but also the campaign’s effectiveness in terms of conversion and retention [
23,
24]. In this way, the process would be more agile and scalable, maximizing the validated action’s impact, making continuous experimentation a key strategy for driving sustainable growth [
13,
15,
25].
———————————
This objective data-driven approach prevents decisions based solely on perceptions, ensuring that conclusions result from rigorous analysis [
9,
10]. The ability to conduct frequent, low-cost experiments and validate hypotheses with robust statistical analysis ensures that any intervention is scalable only when its positive impact has been demonstrated [
14,
17].
The Value of Continuous Experimentation
The Cynefin framework teaches us that in obvious contexts (simple domain), solutions tend to be clearer and success rates higher. However, in today’s business world, obvious and simple problems are increasingly rare [
11]. When we seek new value and frontier opportunities, we move primarily in complex contexts, where it is necessary to embrace uncertainty and learn through constant experimentation [
15]. Here, success is not measured solely by the confirmation of a hypothesis but by the ability to learn and adapt quickly [
13]. It is important to remember that not all experiments will confirm our hypotheses, and that is okay—especially in complex contexts, where success rates are typically low [
8,
11].
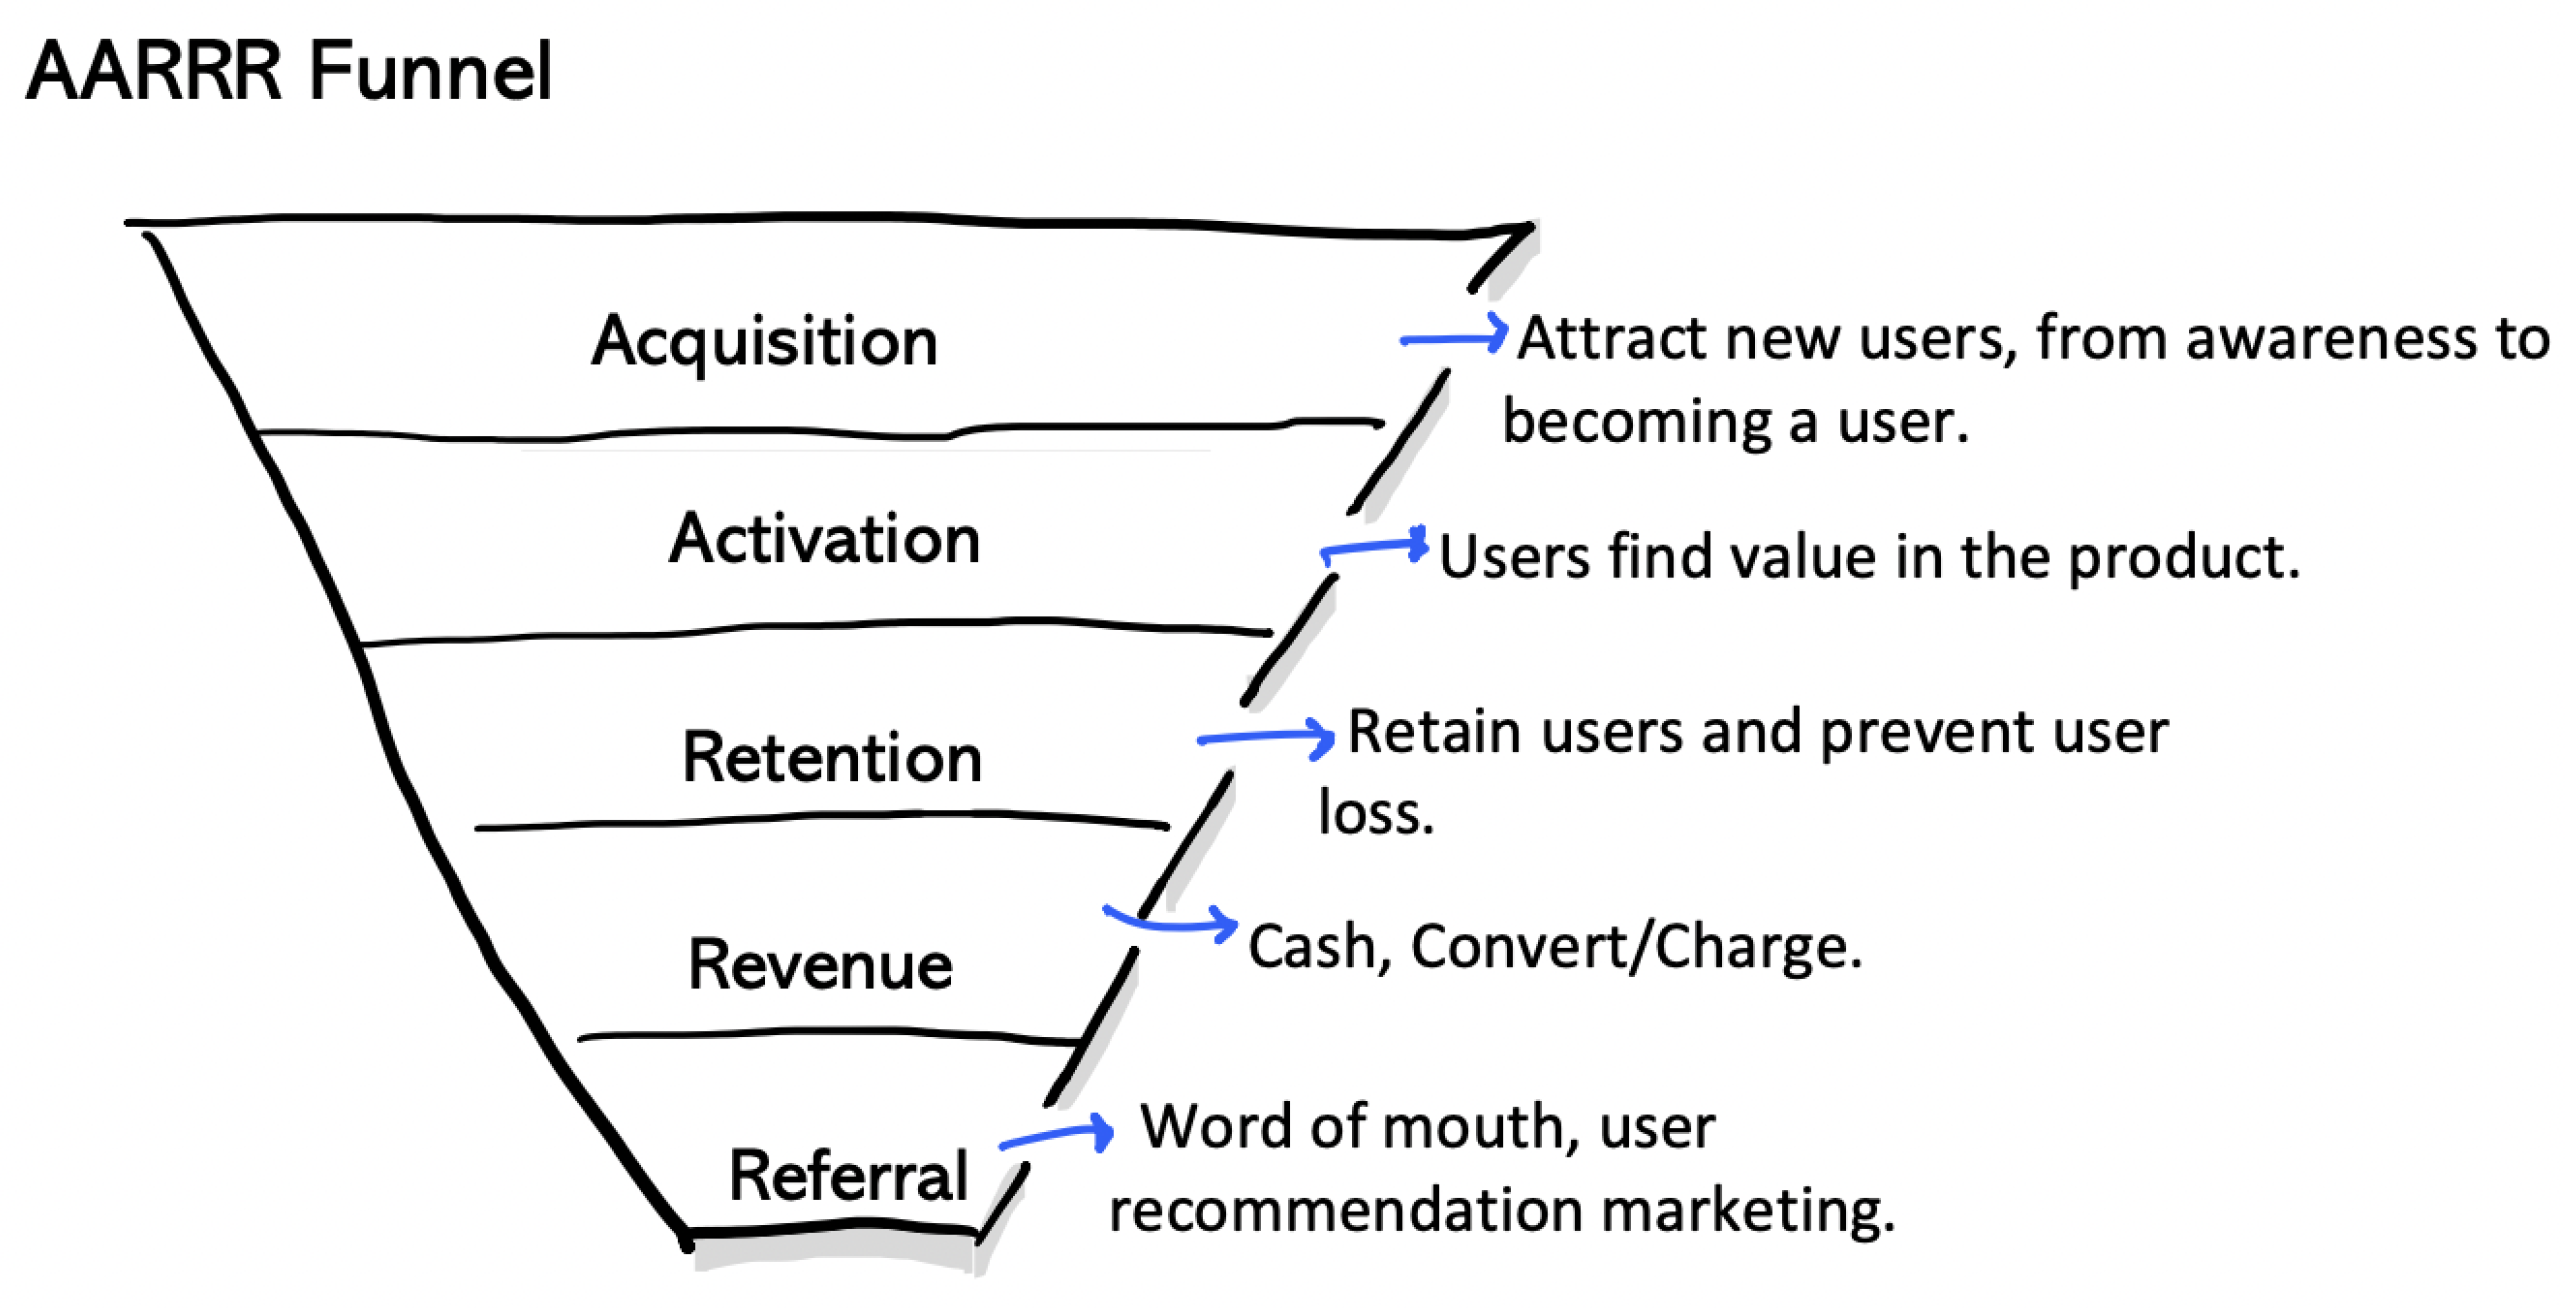
This approach is at the heart of growth, a mindset and methodology that relies on continuous experimentation to identify the most effective growth strategies. Growth hacking takes a holistic, end-to-end view that encompasses the entire customer lifecycle, from acquisition to retention [
26]. This approach not only breaks down traditional departmental silos but also challenges the conventional sales paradigm by focusing on understanding and improving every customer touchpoint [
26,
27].
When analyzing the results of your experiments, it is essential to consider the impact across the entire growth funnel [
27]. How has the intervention in the service stores affected the retention rate? What impact has it had on customer satisfaction and Lifetime Value? The key is to have a customer-centered analytics architecture that allows you to see the full picture and not just isolated fragments [
26].
Data-Driven Decisions
The statistical approach provides an objective framework for generating solid conclusions. It is not just about confirming or refuting a hypothesis; it is about deeply understanding what the data reveals about your customers and your operation [
14]. Sharing this knowledge throughout the organization is key to creating a culture of learning and collaboration, where data becomes the foundation of strategic decisions [
15,
28].
6. Discussion
In an increasingly dynamic and competitive business environment, a company’s ability to adapt quickly and learn from its mistakes has become an essential pillar for sustainable growth. Continuous experimentation is no longer an option—it has become a critical strategy [
15]. Organizations that fail to adopt this agile, iterative learning approach risk becoming obsolete [
25].
The experimentation process is more than just testing hypotheses; it is an invaluable tool for gaining deep insights into customer behavior and market dynamics. Every experiment, regardless of its outcome, offers an opportunity to learn, adjust, and improve. If an experiment does not validate a hypothesis, it provides crucial information about what does not work and often helps identify new opportunities before the competition.
Leadership in this context involves fostering a culture where continuous learning and agility are priorities. Companies that adopt this approach not only seek successful results but also value the knowledge gained from every attempt. Agility in adjusting strategies on the fly, based on concrete data rather than opinions, becomes a key differentiator.
As technology advances and consumer behavior evolves, companies must integrate experimentation across all areas, breaking down silos and promoting interdisciplinary collaboration. This way, deeper relationships with customers are built, based on a dynamic understanding of their needs and preferences.
True sustainable growth lies in the ability to learn quickly, adapt, and optimize every interaction with customers. Experimentation becomes the engine that drives organizations toward a future of success and relevance in the market.
Author Contributions
Conceptualization, R.M.D. and J.J.B.; Formal analysis, R.M.D.; Methodology, R.M.D.; Project administration, R.M.D. and J.J.B.; Resources, R.M.D. and J.J.B.; Software, R.M.D.; Supervision, R.M.D.; Validation, R.M.D. and J.J.B.; Writing—original draft, R.M.D.; Writing—review and editing, R.M.D. and J.J.B. All authors have read and agreed to the published version of the manuscript.
Acknowledgments
We would like to express our gratitude to all colleagues and collaborators who contributed to this work. Their insights, feedback, and continuous support were invaluable throughout the development of this project. We also extend our thanks to the organizations that provided the data and resources necessary for this research.
Conflicts of Interest
No conflicting interests were disclosed.
References
- Dixon, M.; Toman, N.; DeLisi, R. The Effortless Experience: Conquering the New Battleground for Customer Loyalty; Portfolio/Penguin: Nueva York, 2013.
- . [CrossRef]
- Eyal, N. Hooked: How to Build Habit-Forming Products; Portfolio/Penguin: Nueva York, 2014.
- Berger, P.D.; Nasr, N.I. Customer Lifetime Value: Marketing Models and Applications. Journal of Interactive Marketing 1998, 12, 17–30.
- Kumar, V. Customer Lifetime Value: The Path to Profitability; Now Publishers Inc.: Hanover, MA, 2008.
- Lemon, K.N.; Verhoef, P.C. Understanding Customer Experience Throughout the Customer Journey. Journal of Marketing 2016, 80, 69 – 96.
- Pai, A. The Five Design Thinking Elements for the Digital Customer Experience. TCS 2021, 1.
- Thomke, S. Experimentation Works: The Surprising Power of Business Experiments; Harvard Business Review Press: Boston, 2020.
- Thomke, S.; Manzi, J. The Discipline of Business Experimentation. Harvard Business Review 2014, 92, 70–79.
- Luca, M.; Bazerman, M.H. The Power of Experiments: Decision Making in a Data-Driven World; MIT Press: Cambridge, MA, 2020.
- Snowden, D.J.; Boone, M.E. A Leader’s Framework for Decision Making. Harvard Business Review 2007, 85, 68–76.
- Kohavi, R.; Longbotham, R. Online Controlled Experiments and A/B Testing. In Encyclopedia of Machine Learning and Data Mining; Sammut, C.; Webb, G.I., Eds.; Springer: Nueva York, 2017; pp. 922–929.
- Blank, S.; Dorf, B. The Startup Owner’s Manual: The Step-by-Step Guide for Building a Great Company; K&S Ranch: Pescadero, CA, 2012.
- Schrage, M. The Innovator’s Hypothesis: How Cheap Experiments Are Worth More than Good Ideas; MIT Press: Cambridge, MA, 2014.
- Hamel, G.; Zanini, M. The Power of Experimentation. Innovations: Technology, Governance, Globalization 2023, 13, 52–58. [CrossRef]
- Chen, H.; Chiang, R.H.L.; Storey, V.C. Business Intelligence and Analytics: From Big Data to Big Impact. MIS Quarterly 2012, 36, 1165–1188.
- Provost, F.; Fawcett, T. Data Science for Business: What You Need to Know About Data Mining and Data-Analytic Thinking; O’Reilly Media: Sebastopol, CA, 2013.
- Grigsby, M. Advanced Customer Analytics: Targeting, Valuation, and Loyalty; Wiley: Indianapolis, IN, 2016.
- Blanchard, T.; Behera, D.; Bhatnagar, P. Data Science for Marketing Analytics; CRC Press: Boca Raton, FL, 2019.
- Chen, T.; Guestrin, C. XGBoost: A Scalable Tree Boosting System. Proceedings of the 22nd ACM SIGKDD International Conference on Knowledge Discovery and Data Mining. ACM, 2016, pp. 785–794.
- Cohen, J. Statistical Power Analysis for the Behavioral Sciences, 2nd ed.; Routledge: New York, 1988.
- Cumming, G. Understanding the New Statistics: Effect Sizes, Confidence Intervals, and Meta-Analysis, 1st ed.; Routledge: Nueva York, 2011.
- TCS. From potential to performance by design. Technical report, Tata Consultancy Services, Mumbai, India, 2023.
- McKinsey.; Company. How Generative AI Can Boost Consumer Marketing 2023.
- Denning, S. The age of agile: How smart companies are transforming the way work gets done; Amacom, 2018.
- Ellis, S.; Brown, M. Hacking Growth: How Today’s Fastest-Growing Companies Drive Breakout Success; Crown Currency: Nueva York, 2017.
- Fong, R.; Riddersen, C. Growth Hacking: Silicon Valley’s Best Kept Secret; Lioncrest Publishing: Nueva York, 2016.
- Ellis, S. Mastering Retention: The Ultimate Guide, 2023.
| 1 |
CSAT (Customer Satisfaction Score) is a metric used to measure how satisfied customers are with a product, service, or interaction, typically collected through surveys. |
| 2 |
A/B Testing is a method to compare two versions of a webpage or product to see which one performs better by showing each version to different users and analyzing the results. |
| 3 |
XGBoost (Extreme Gradient Boosting) is a machine learning algorithm that is highly efficient for structured data, known for its accuracy and speed in predictive modeling tasks |
|
Disclaimer/Publisher’s Note: The statements, opinions and data contained in all publications are solely those of the individual author(s) and contributor(s) and not of MDPI and/or the editor(s). MDPI and/or the editor(s) disclaim responsibility for any injury to people or property resulting from any ideas, methods, instructions or products referred to in the content. |
© 2024 by the authors. Licensee MDPI, Basel, Switzerland. This article is an open access article distributed under the terms and conditions of the Creative Commons Attribution (CC BY) license (http://creativecommons.org/licenses/by/4.0/).
