Submitted:
19 September 2024
Posted:
26 September 2024
You are already at the latest version
Abstract
Keywords:
Introduction
Imaging based classification of pediatric meningeal diseases
- Meningeal
- Parenchymal
- Variable
| PROMINENT MENINGEAL FEATURES |
VARIABLE | PROMINENT PARENCHYMAL FEATURES |
|
|---|---|---|---|
| Infectious | Viral (Except HSV) | Group B Streptococci | HSV |
| Algae (Prototheca) | Tuberculosis | Fungal | |
| Autoimmune | Neurosarcoid | Anti-MOG Demyelination |
|
| Guillian Barre Syndrome | ANCA vasculitis |
||
| Idiopathic Hypertrophic Pachymeningitis |
NMDA Encephalitis | ||
| Neoplastic | Meningioma | Drop Metastasis(Primary CNS tumors) |
|
| Glioneuronal tumor | Systemic Metastasis | ||
| Meningeal Rhabdomyosarcoma | |||
| Vascular | Moya Moya disease | PRES | |
| Pial Angiomatosis | |||
| Other | Intracranial hypotension | LCH | |
| ALK positive Histiocytosis |
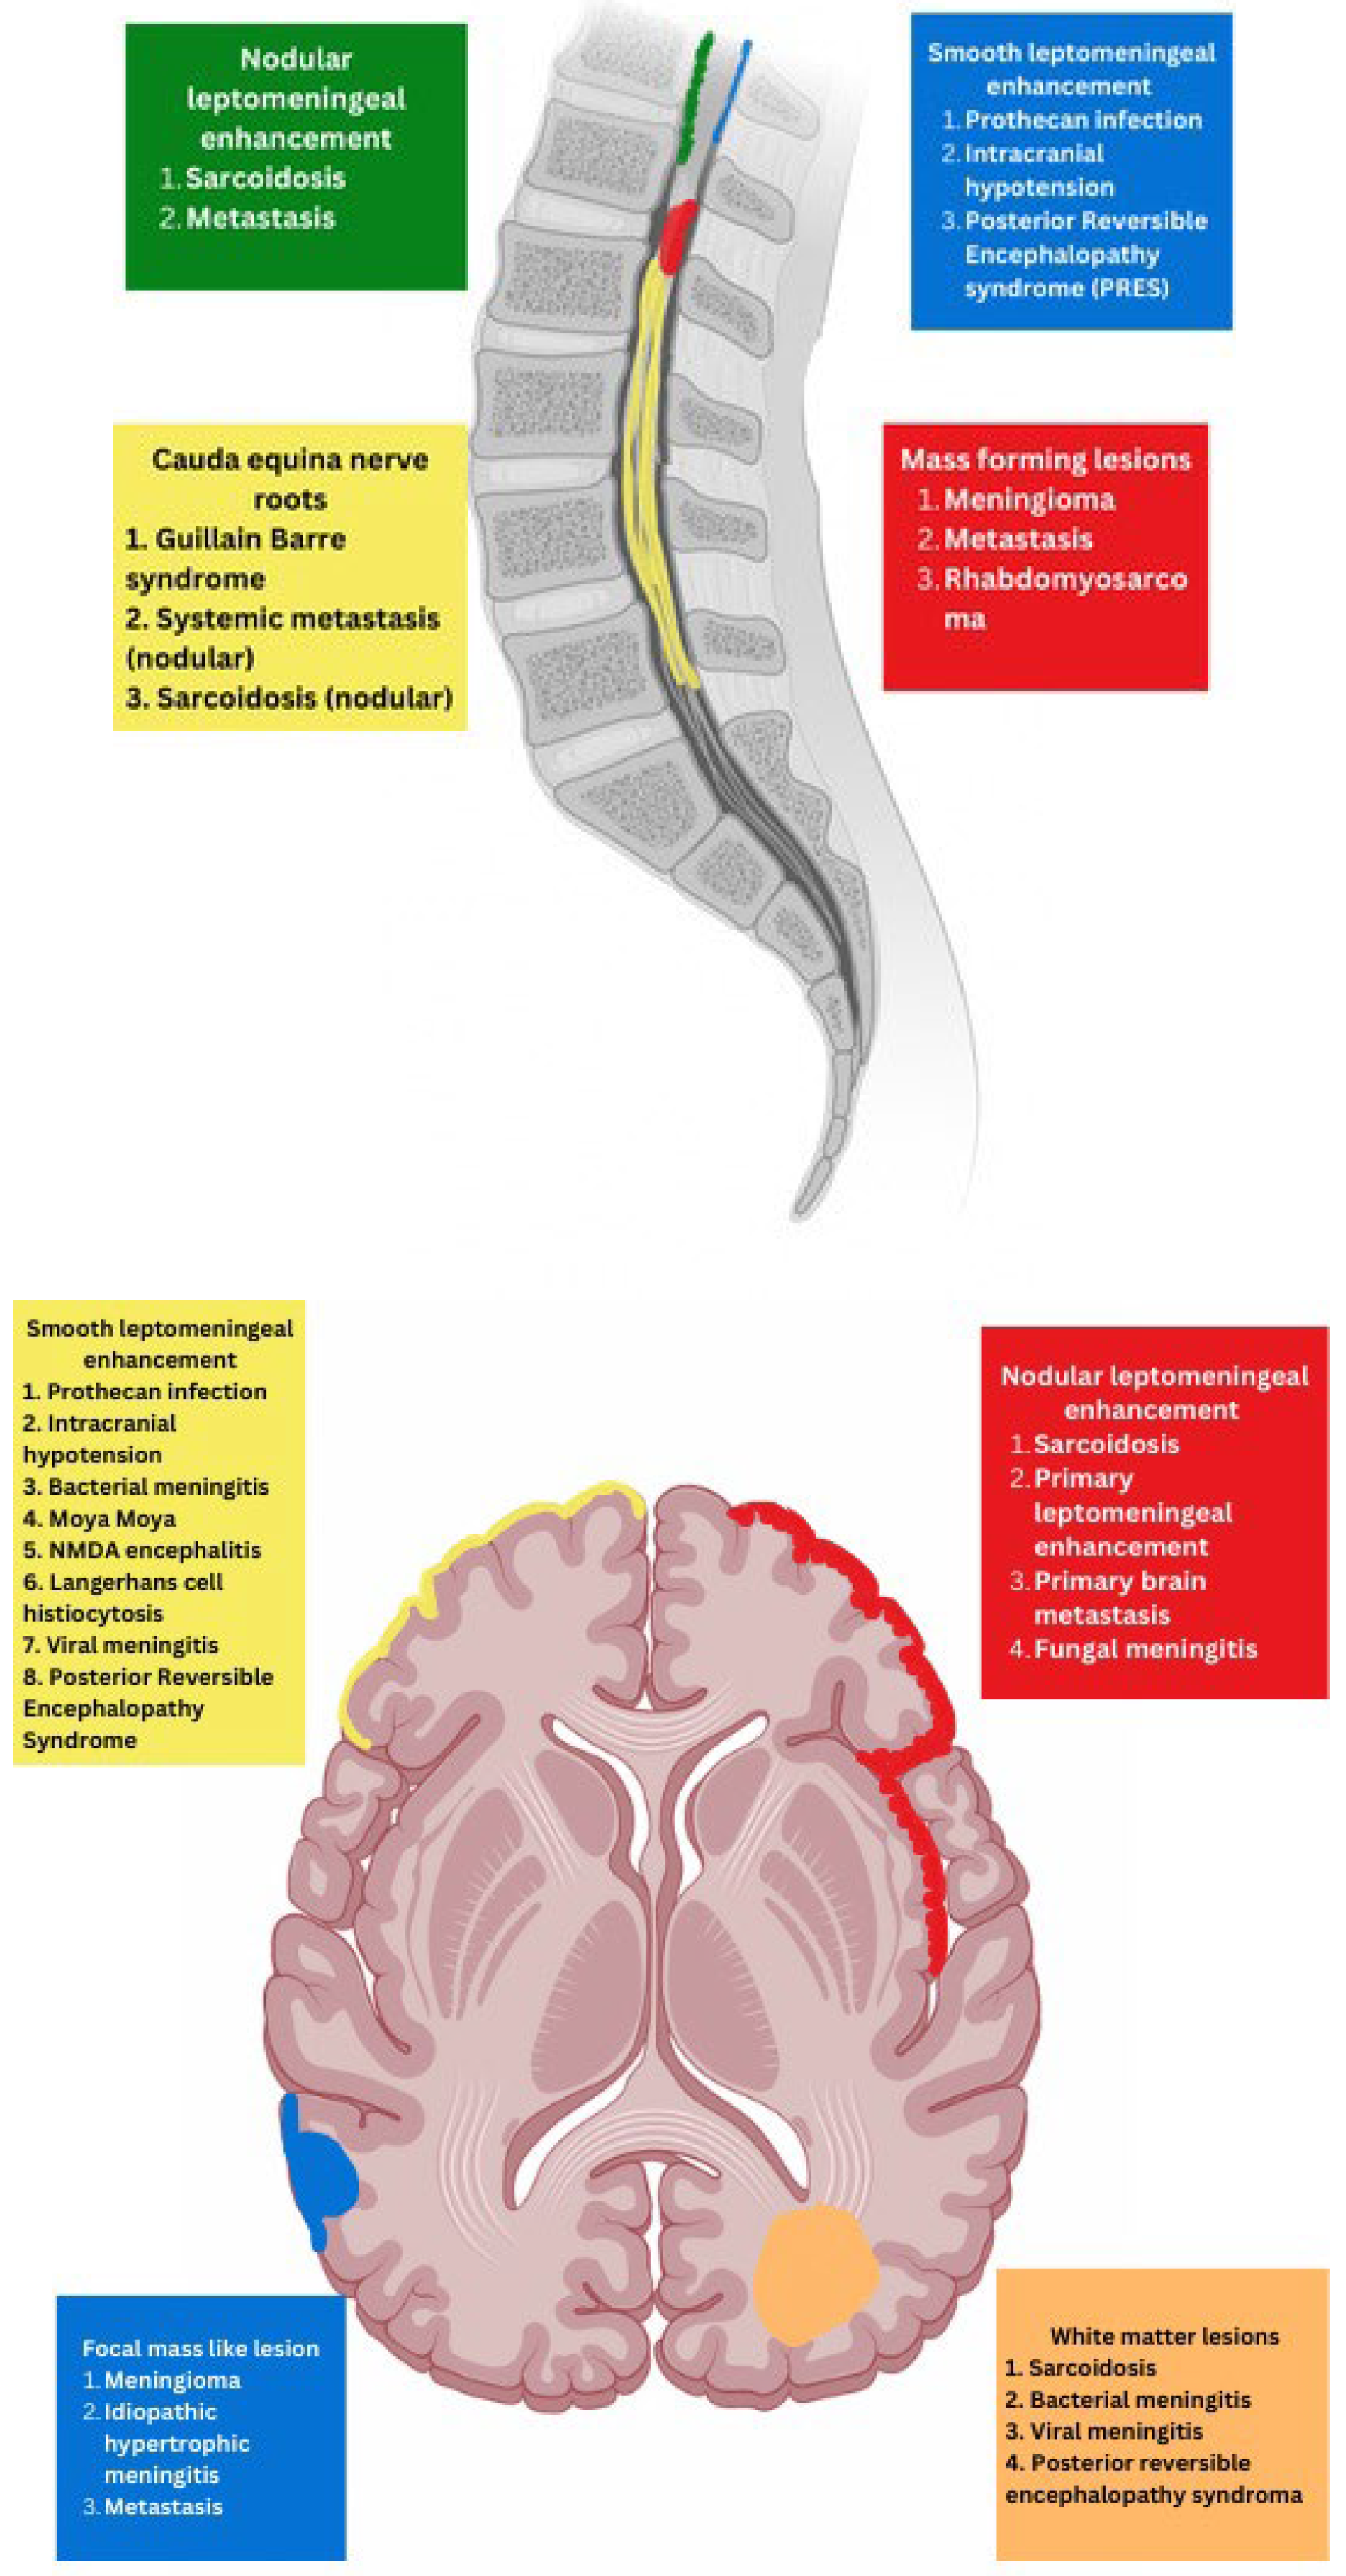
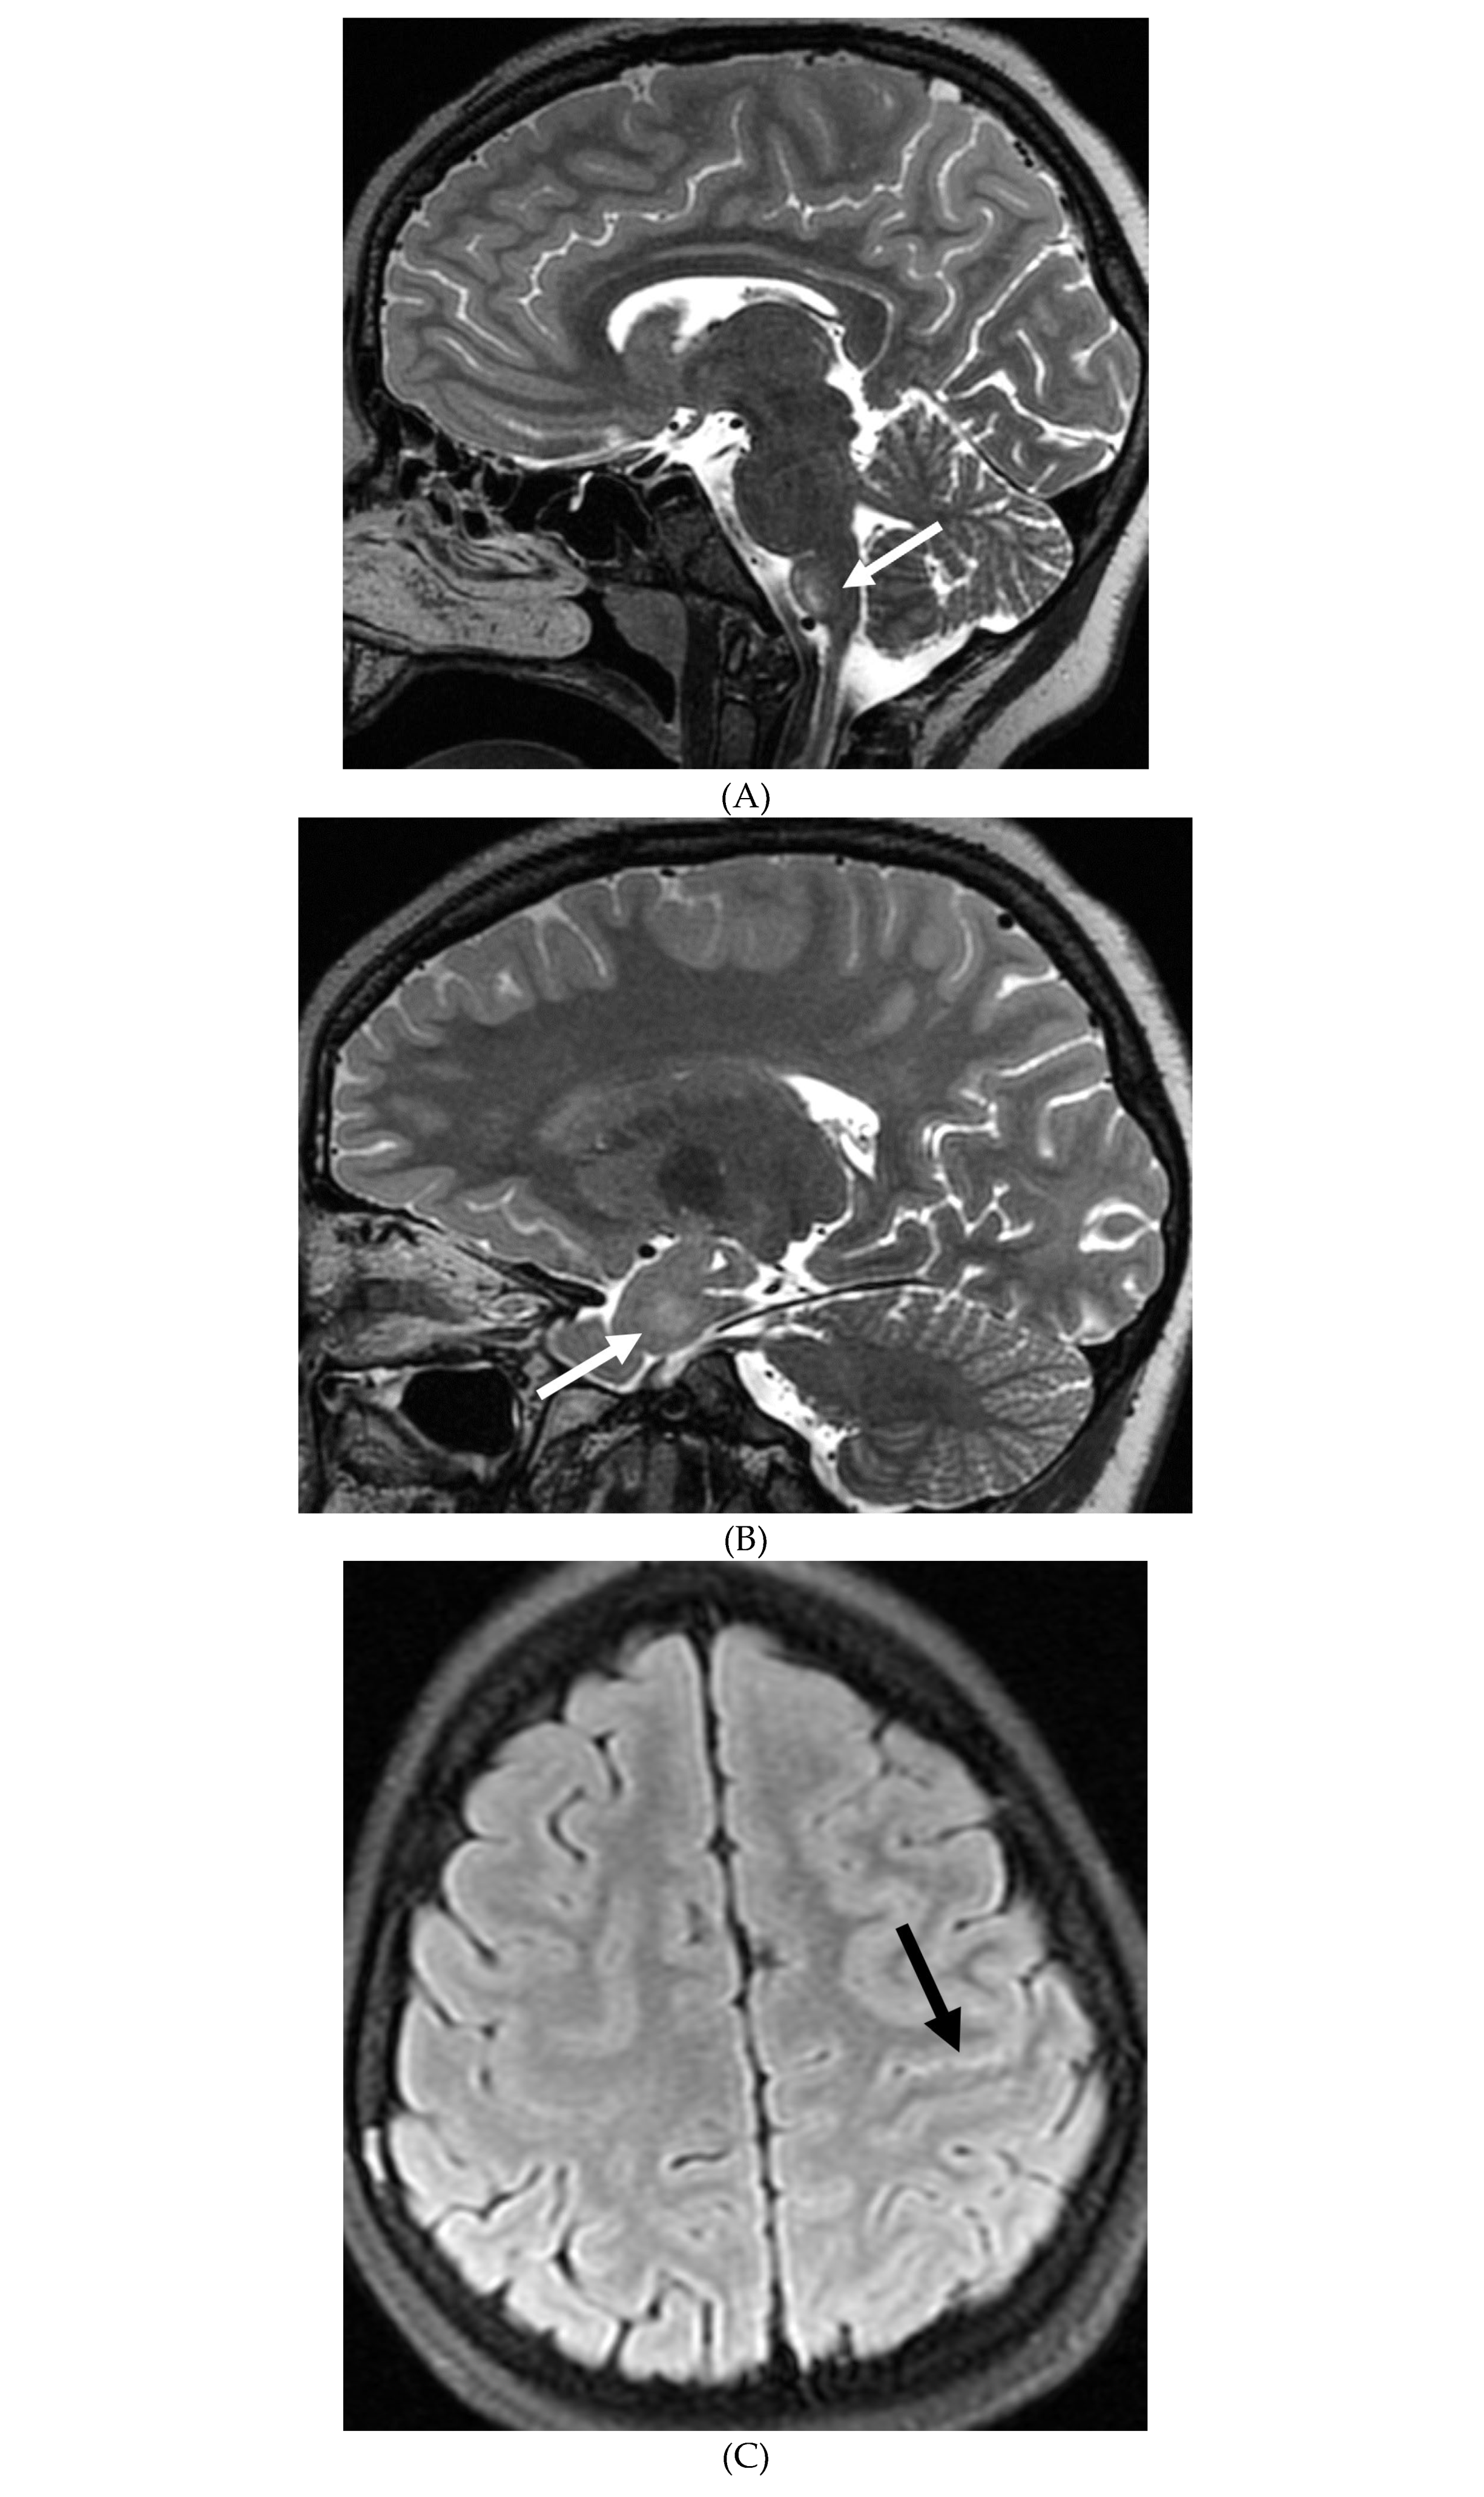
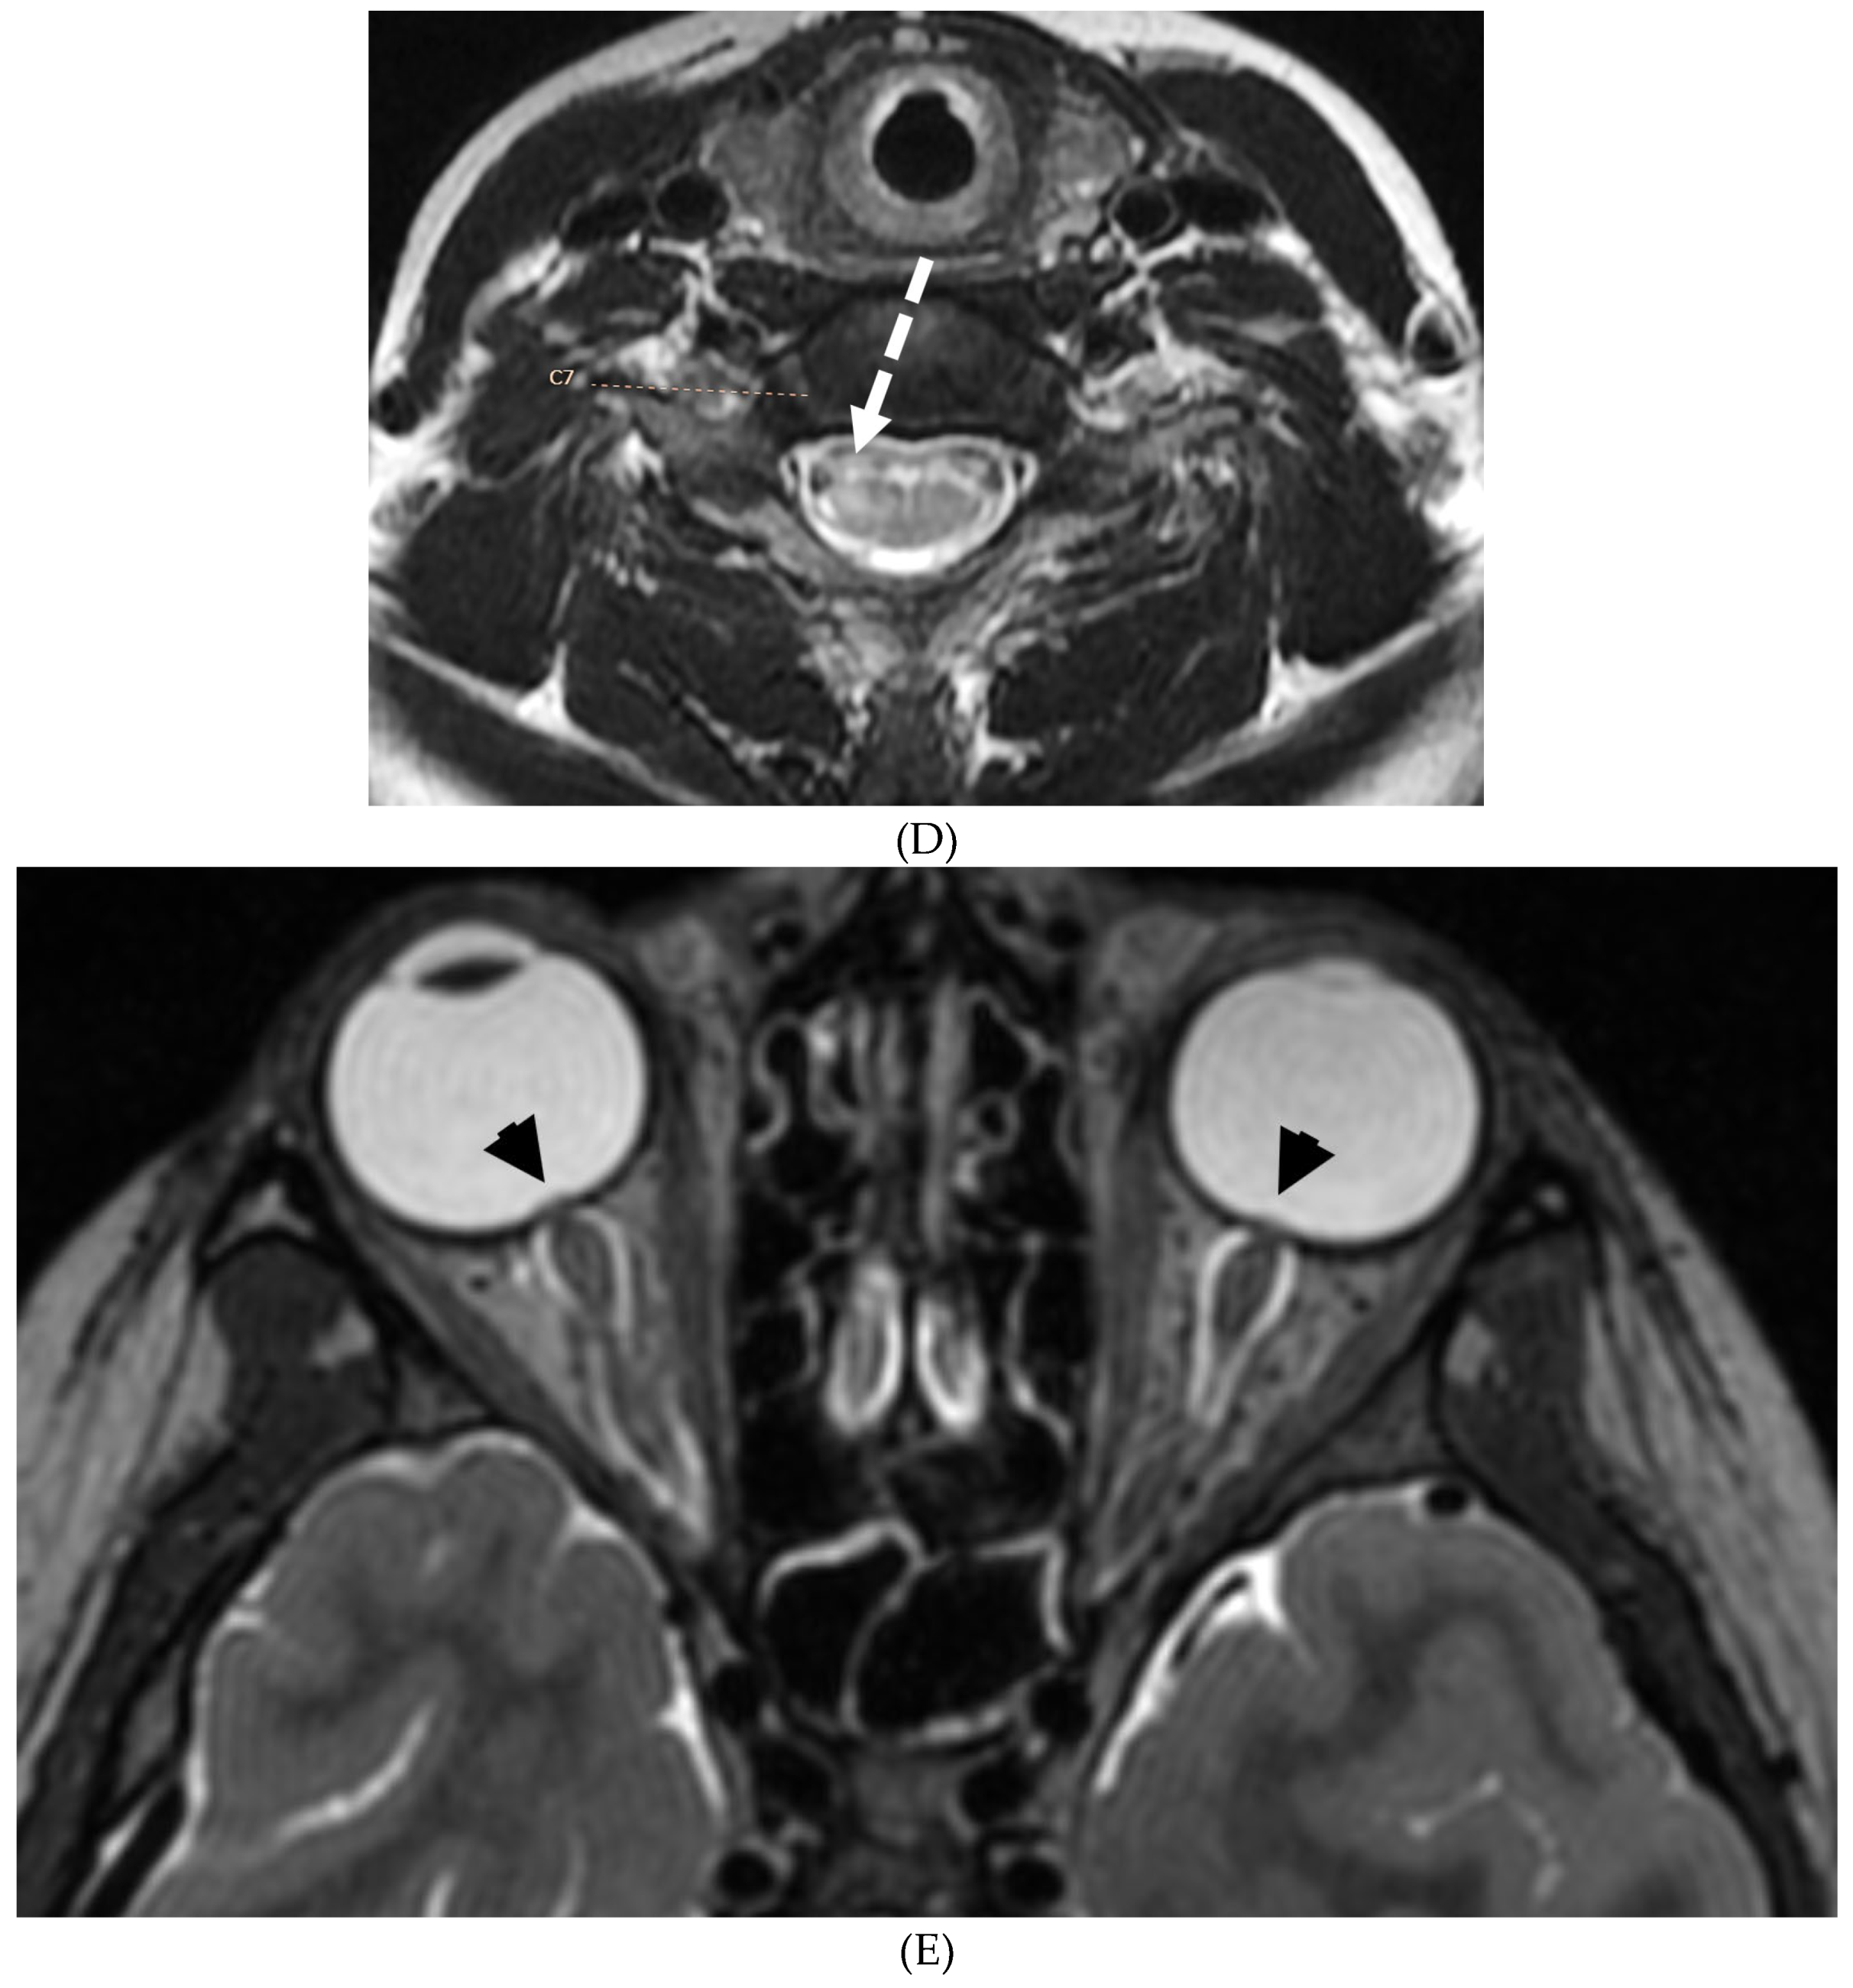
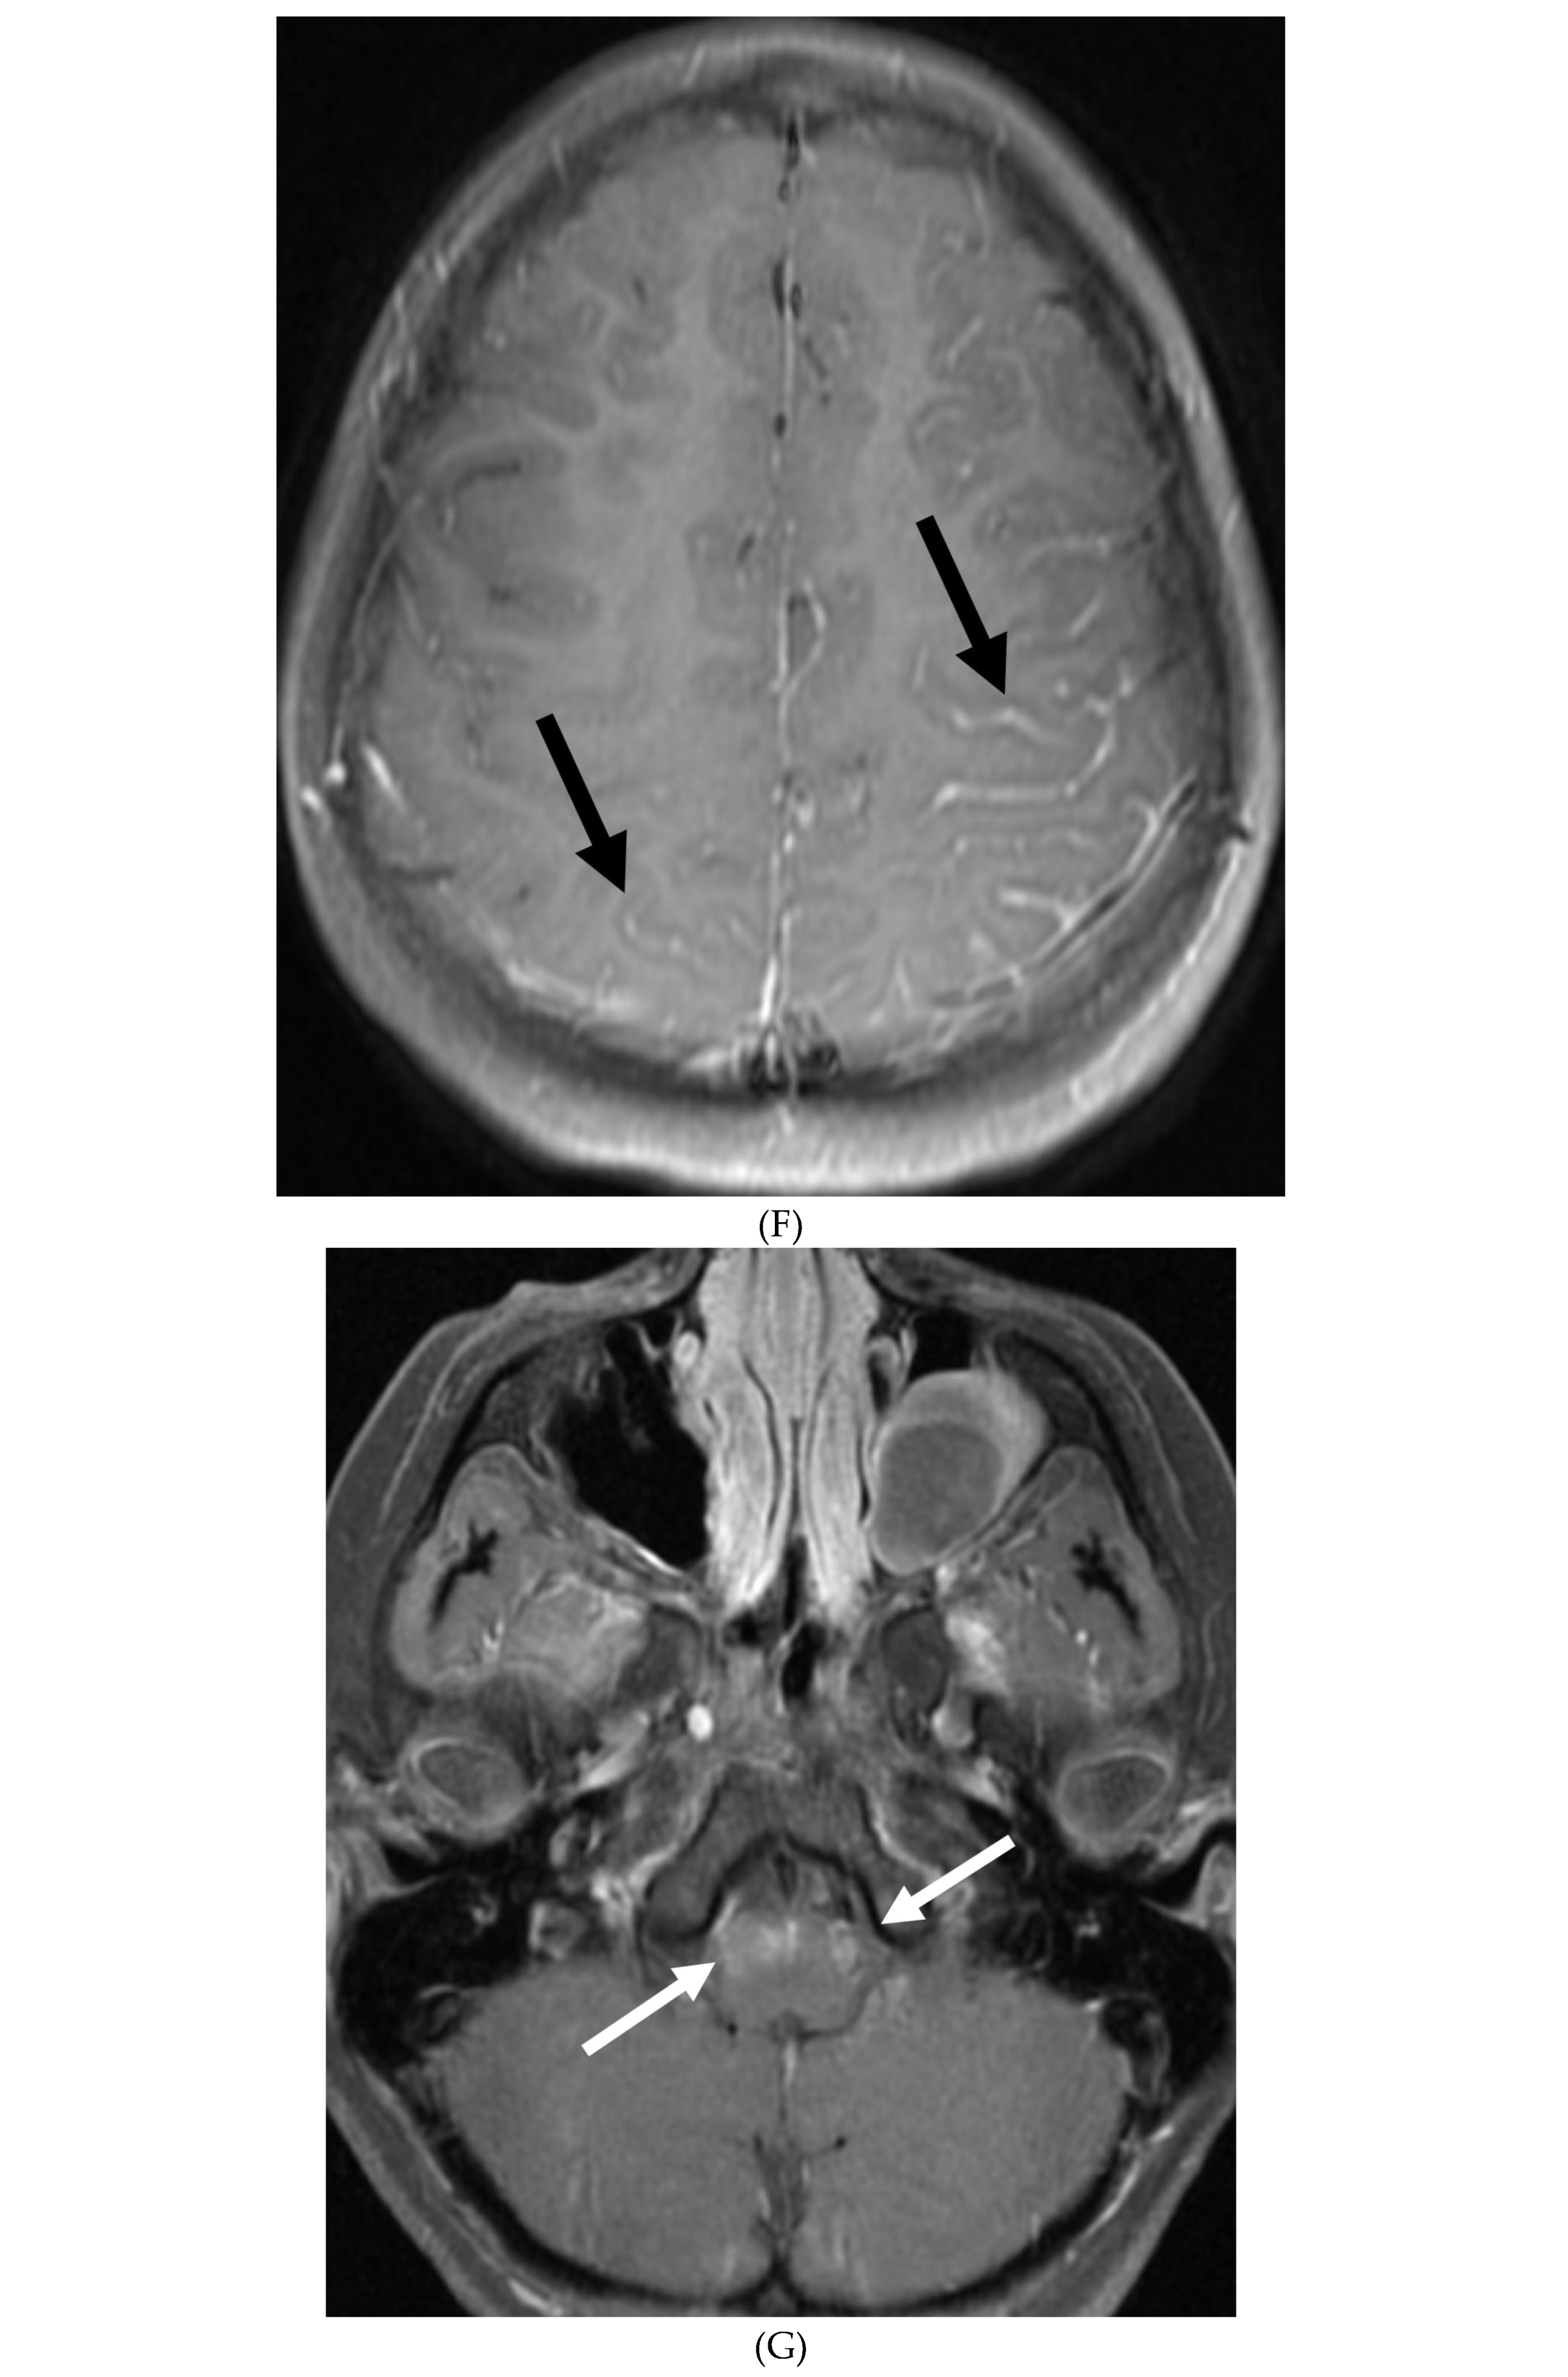
PREDOMINANT MENINGEAL FEATURES
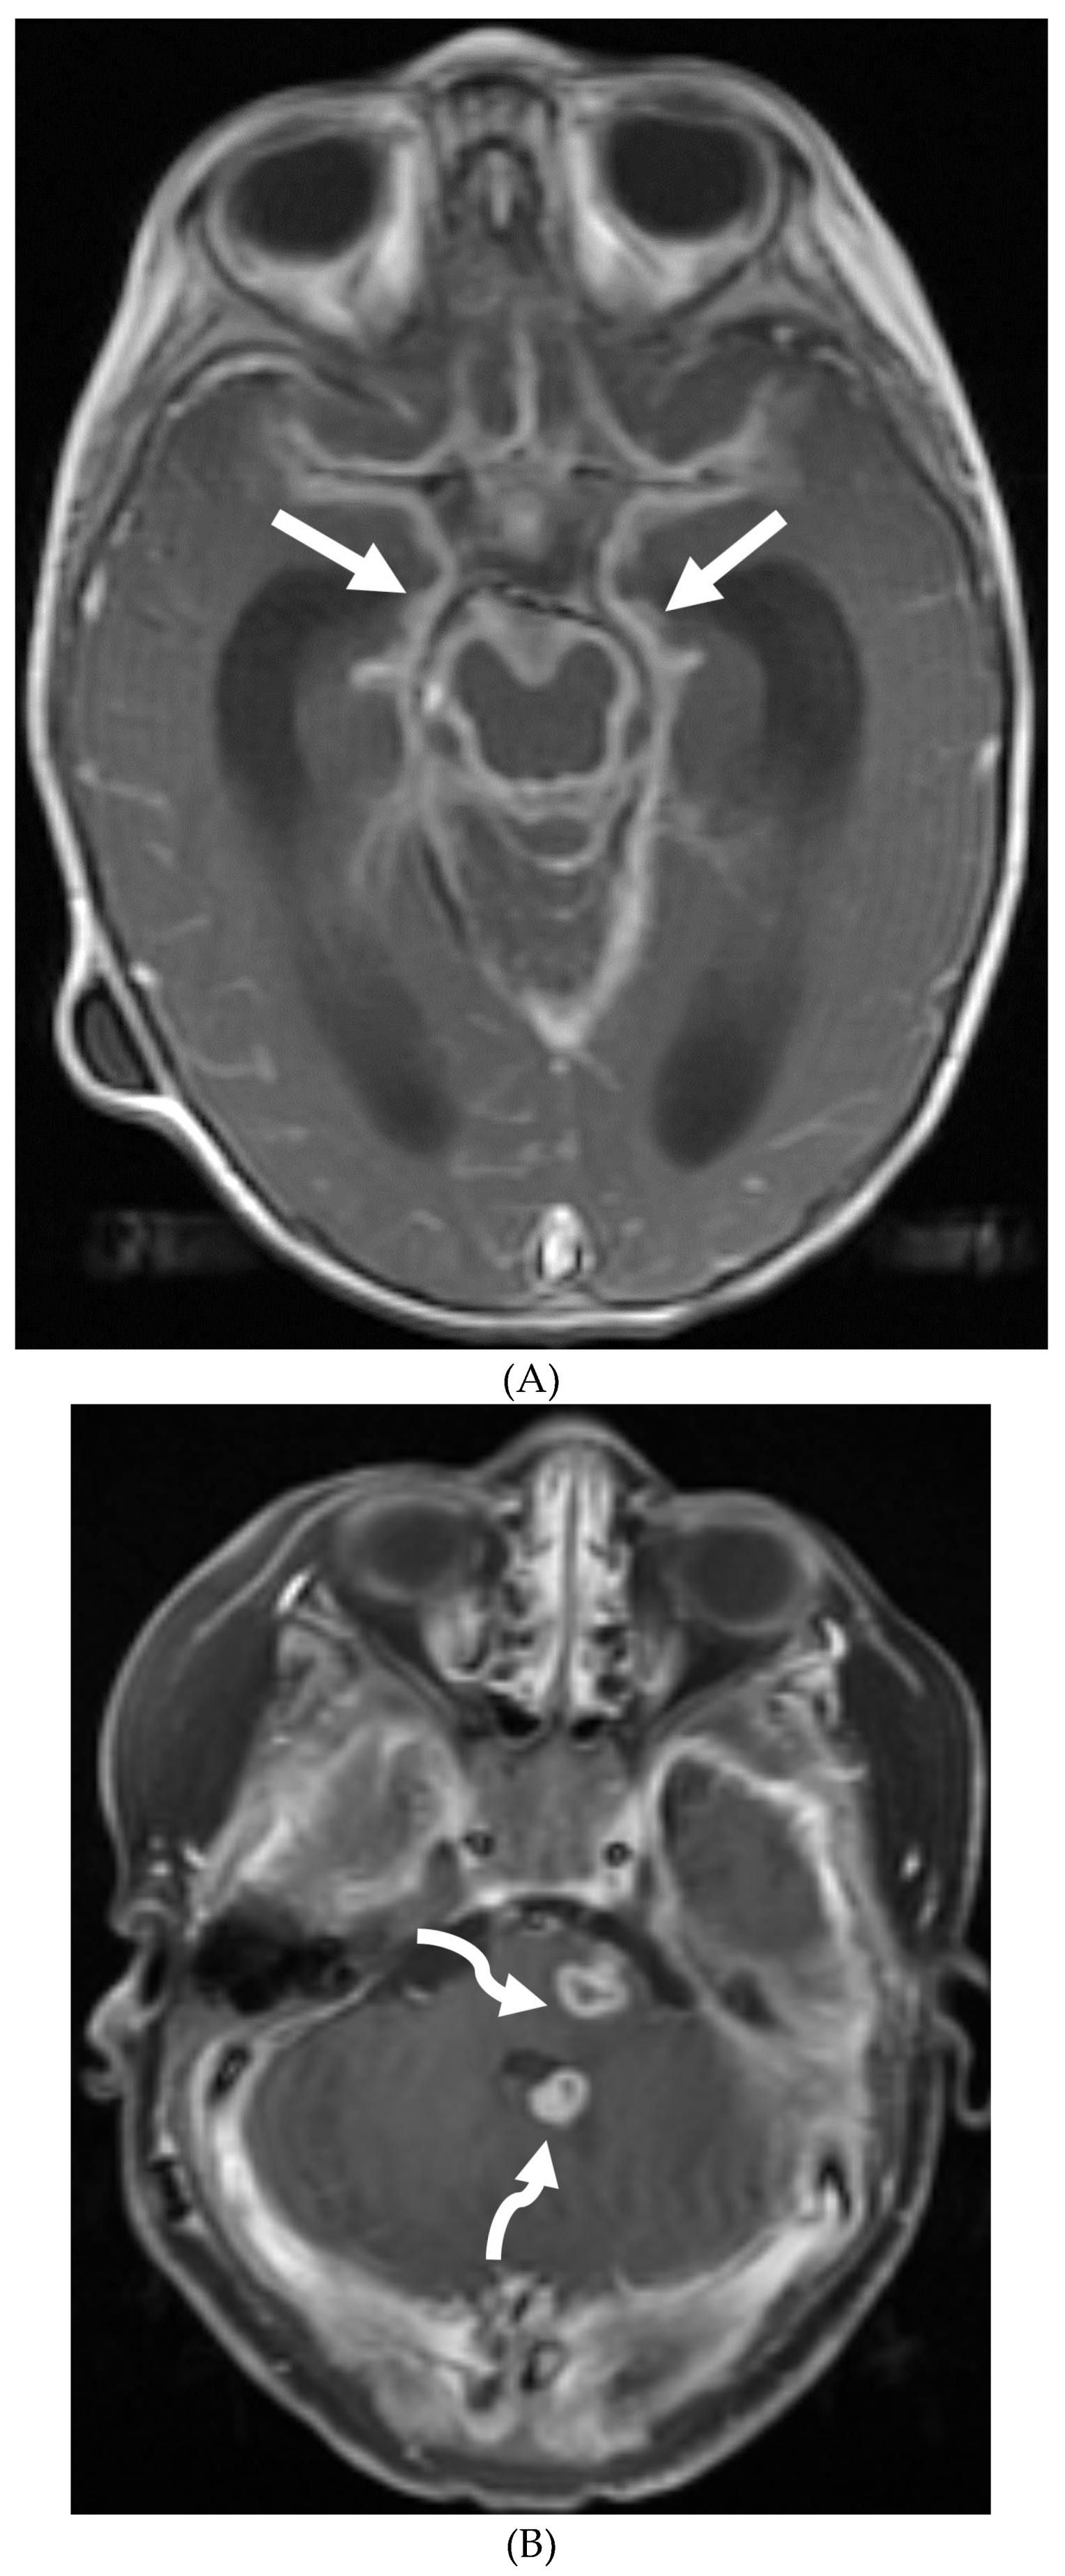
- INFECTION
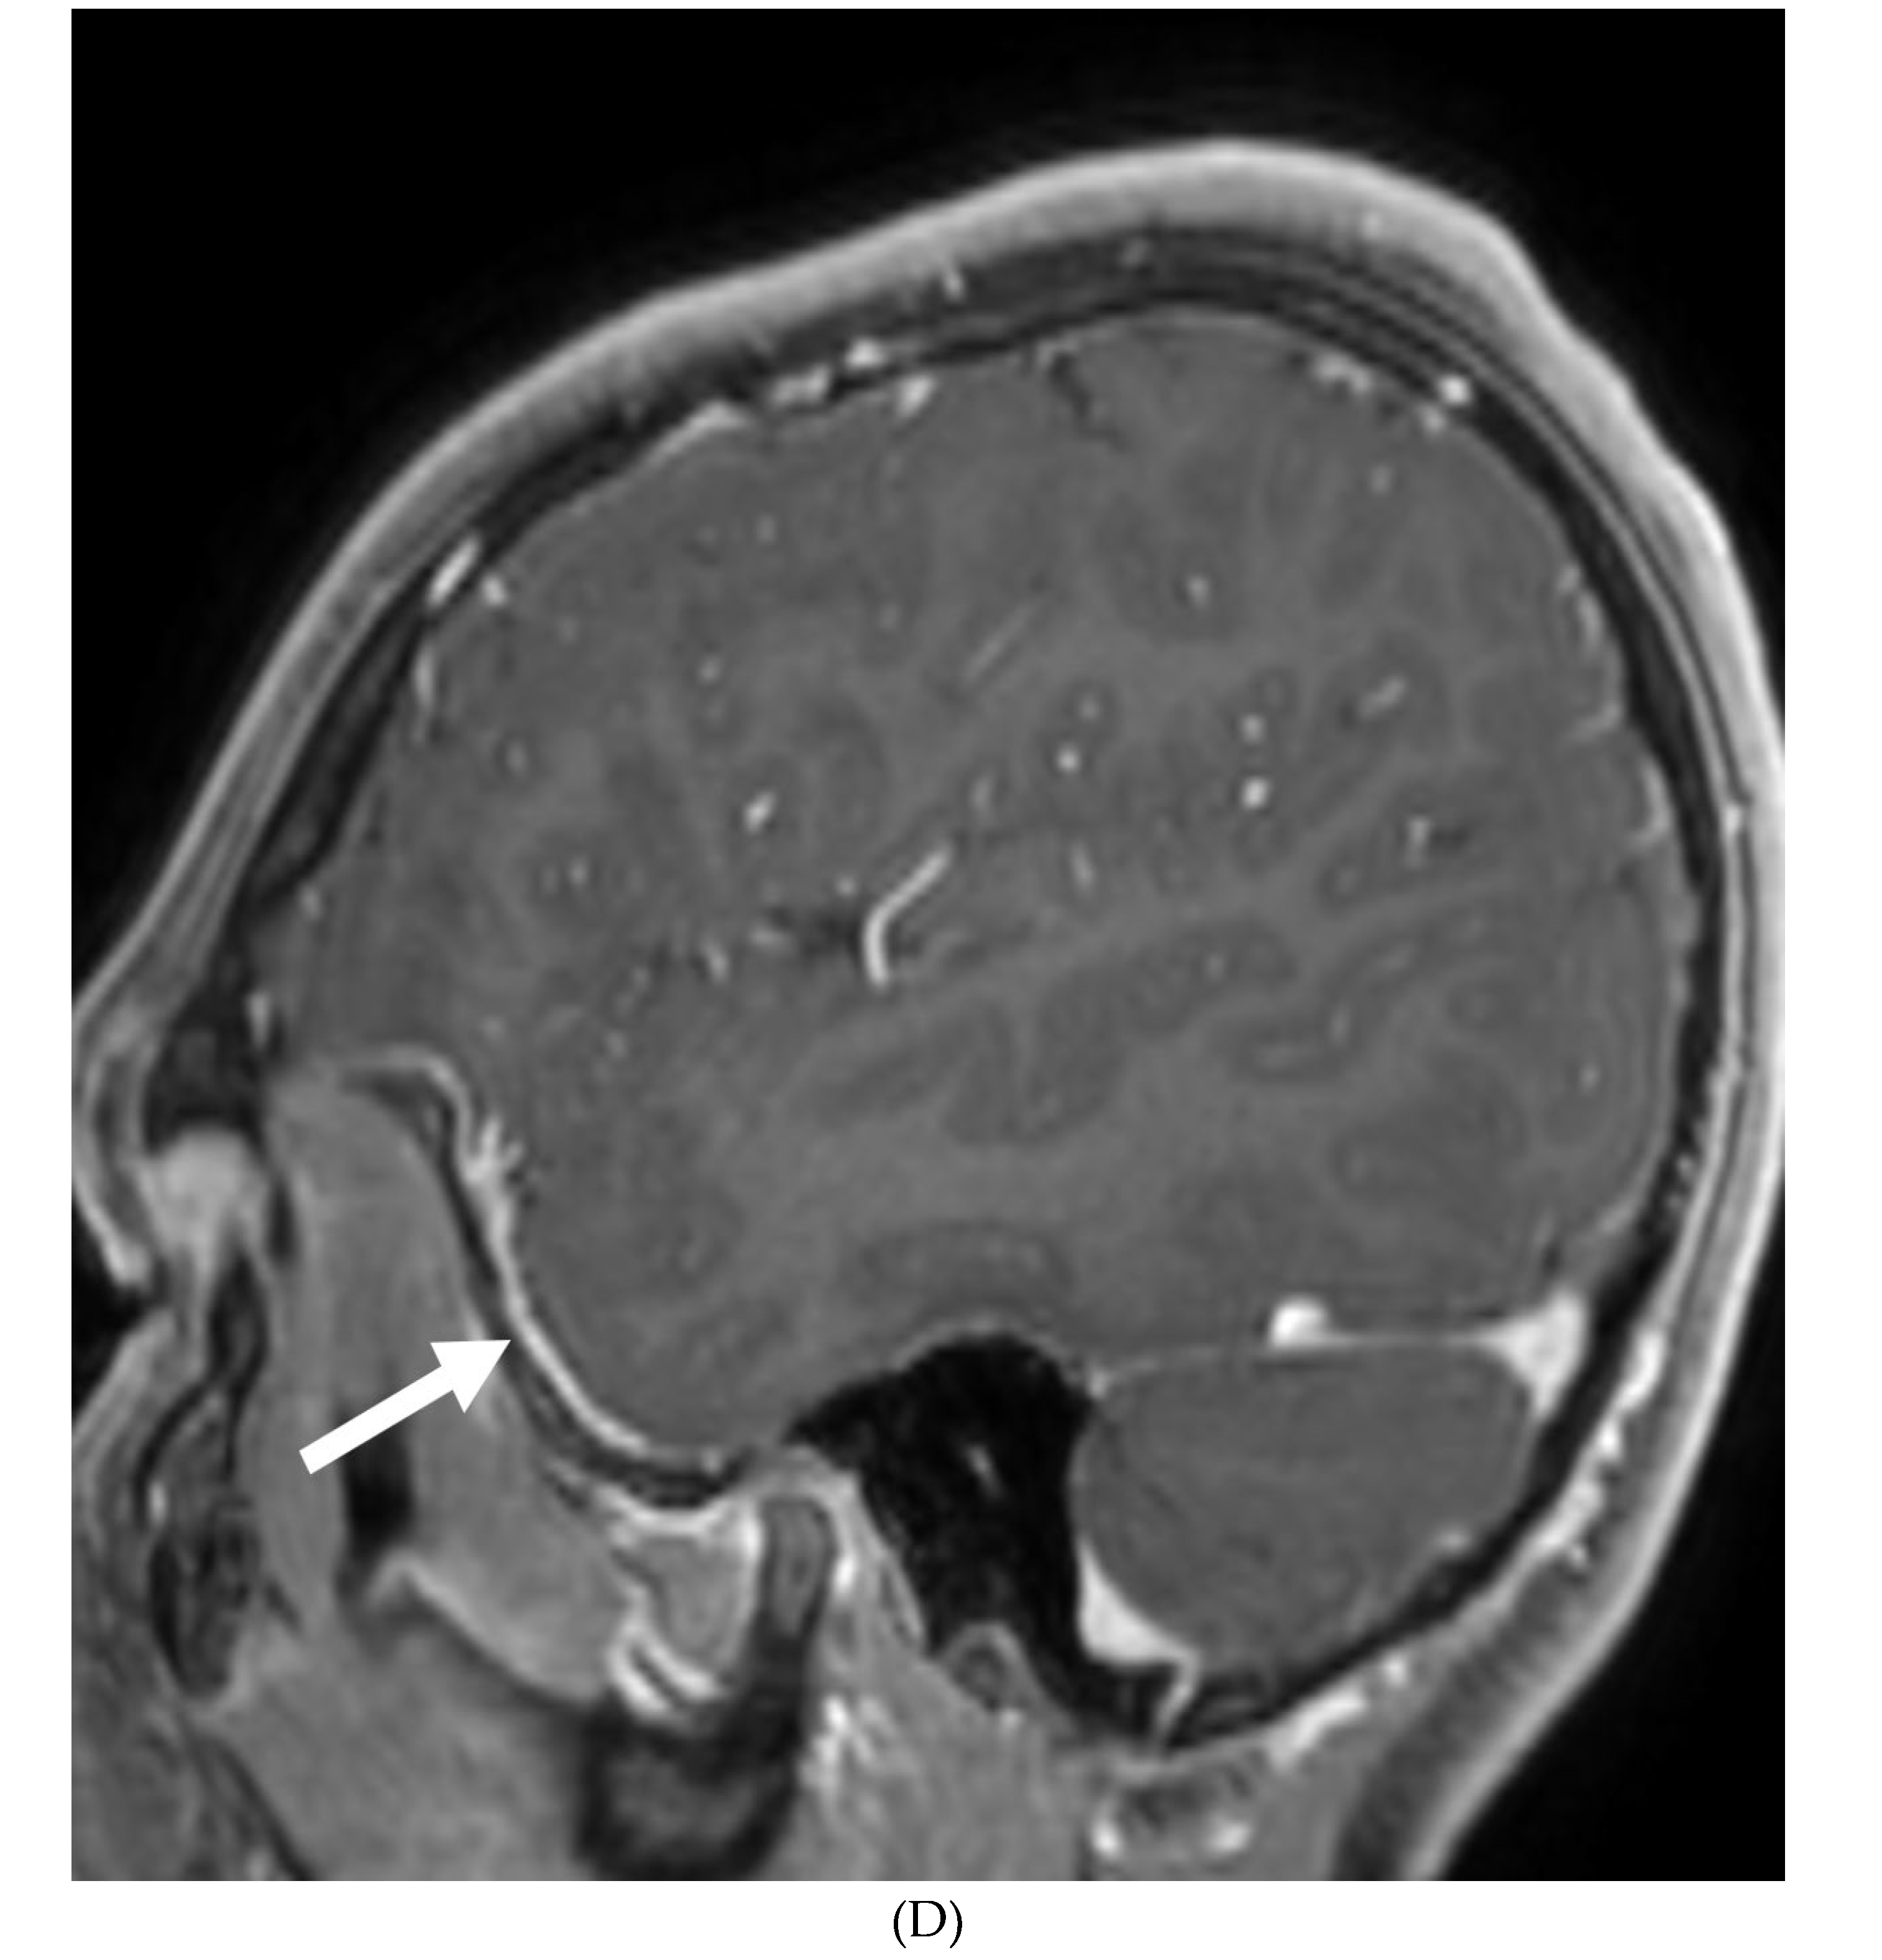
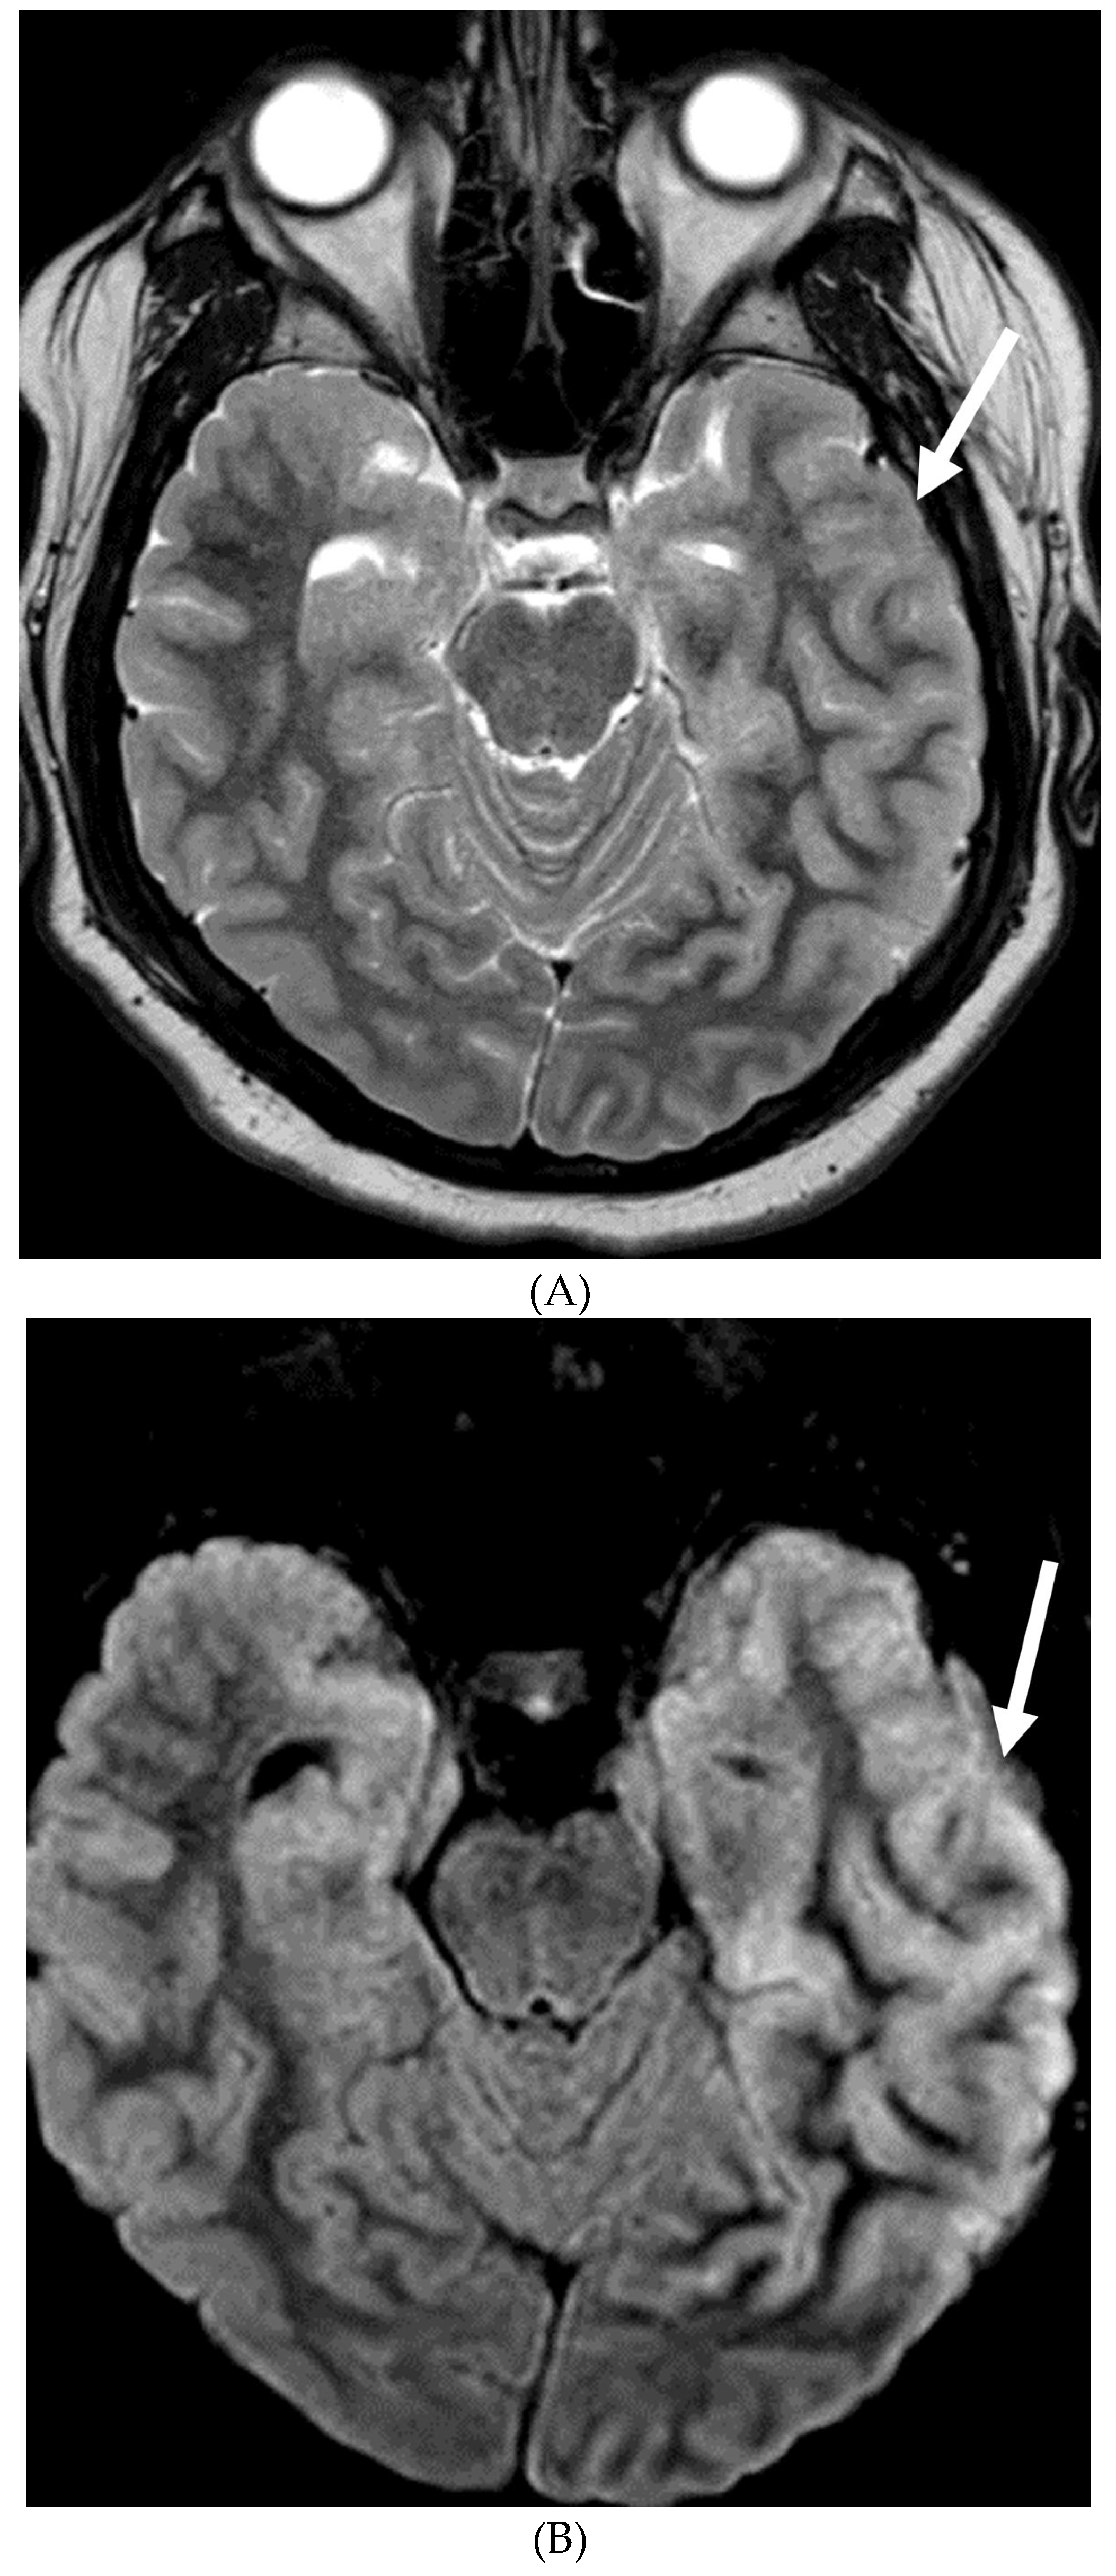
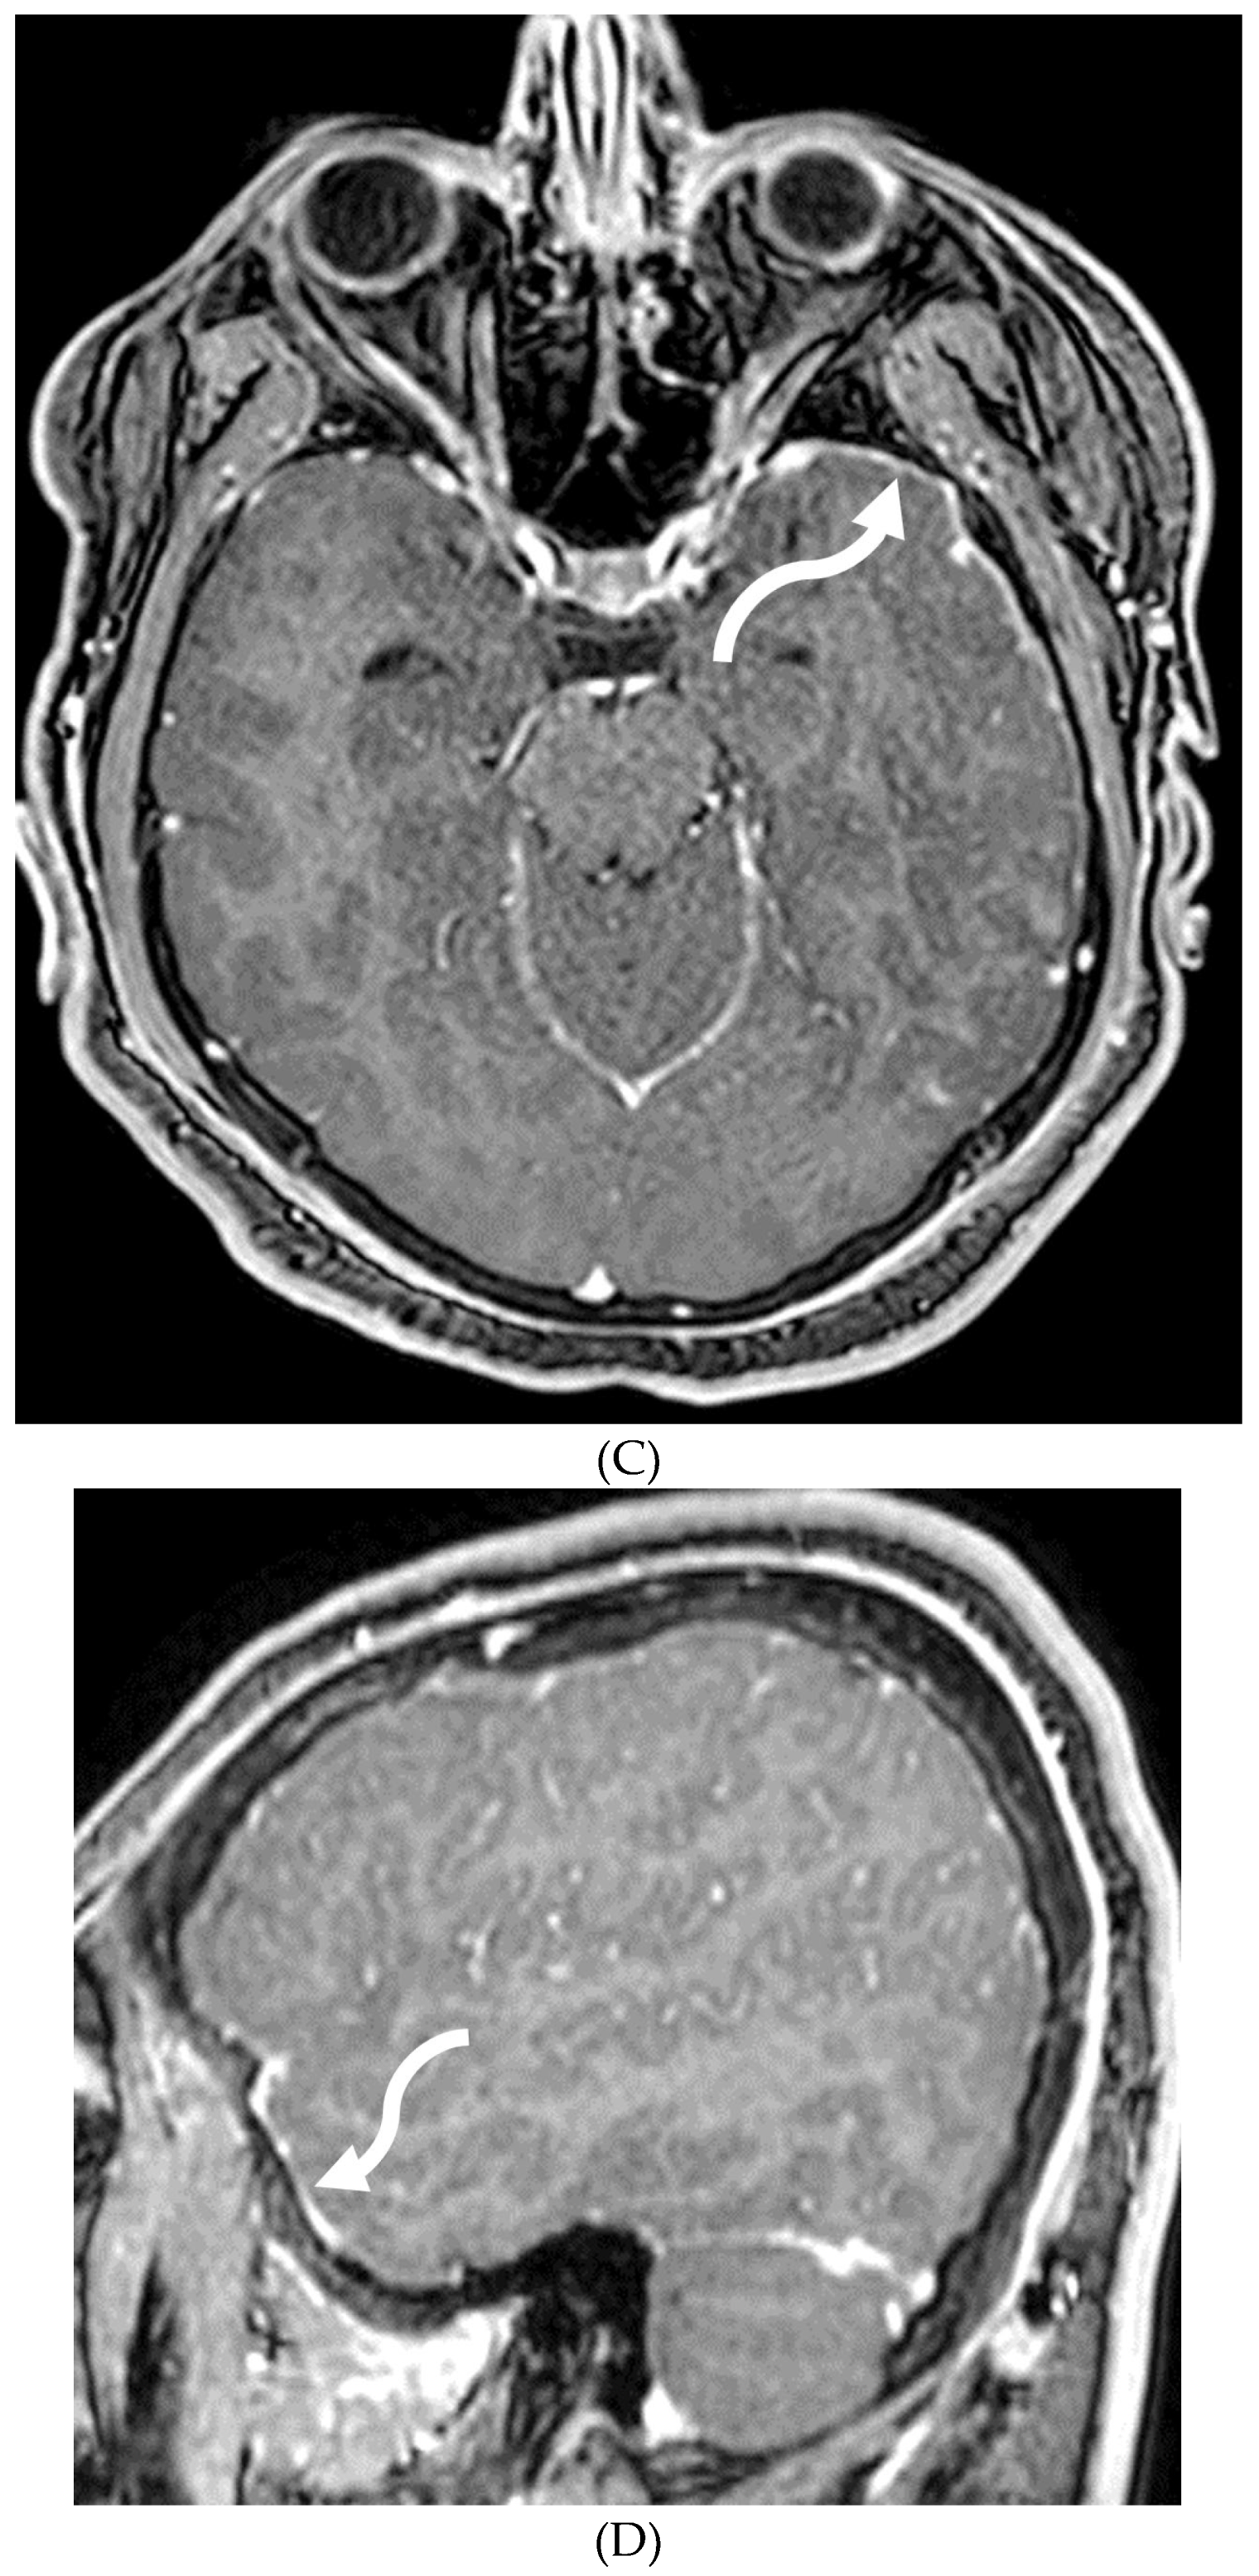
PROTOTHECANS
NEUROSARCOIDOSIS
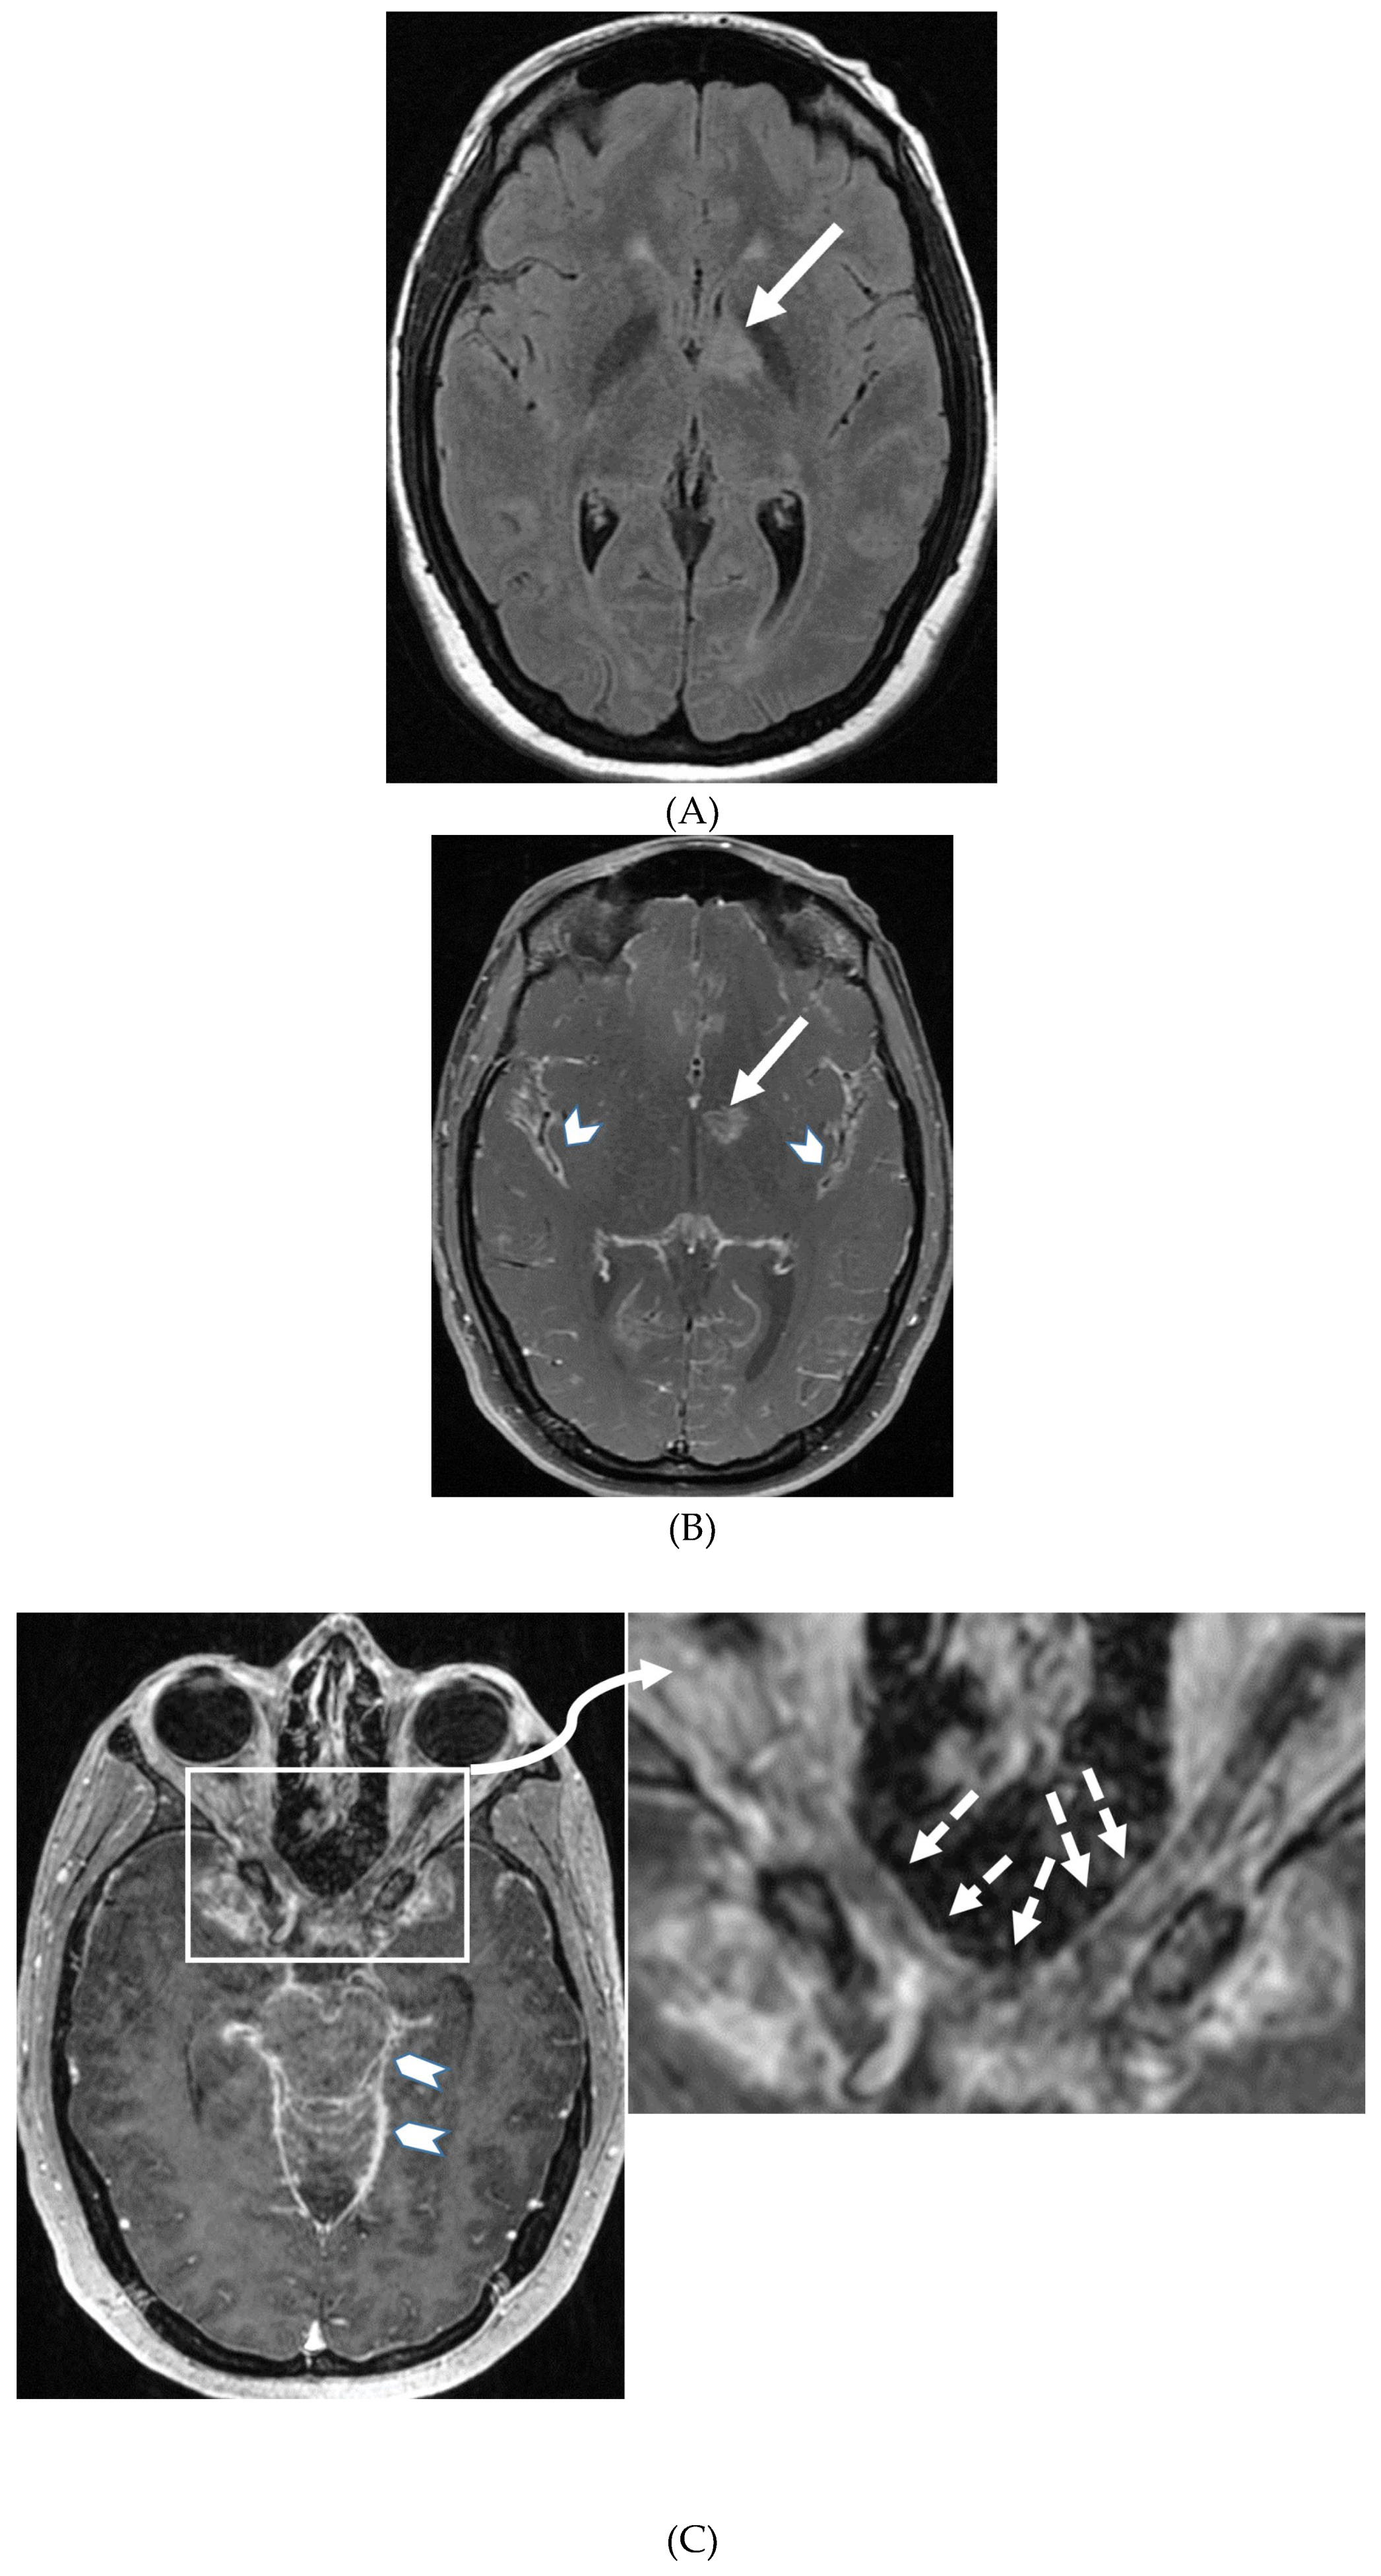
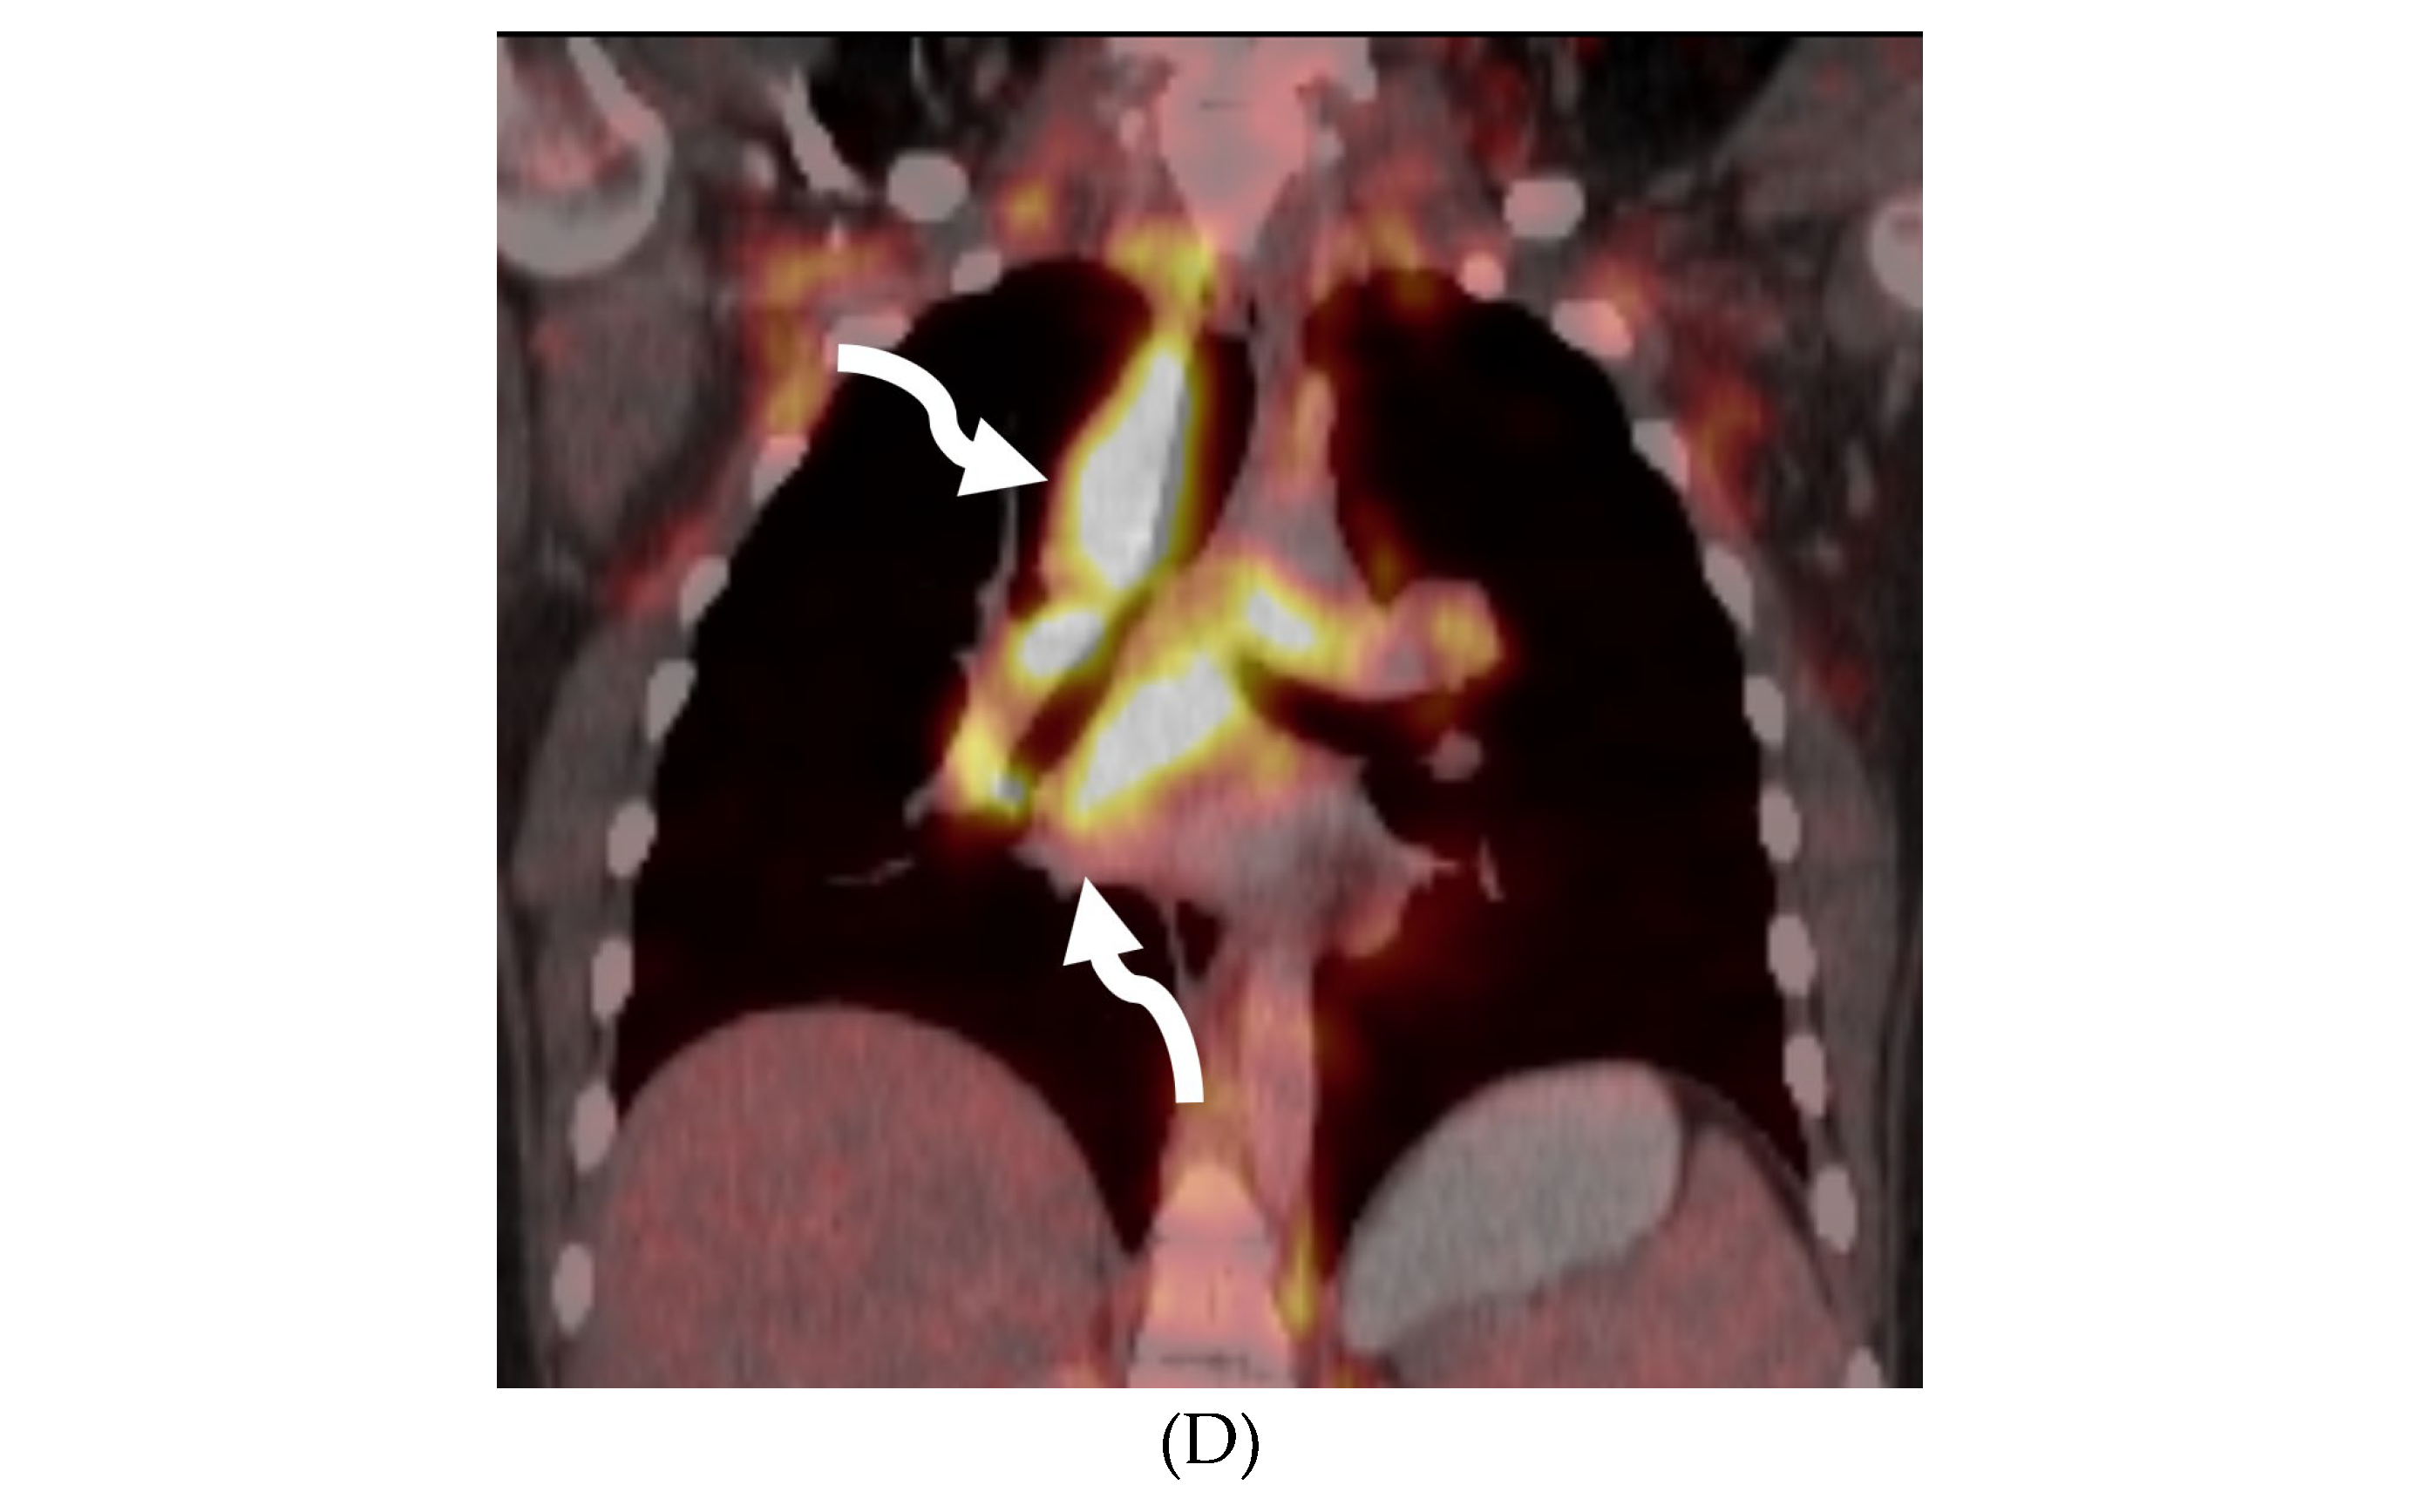
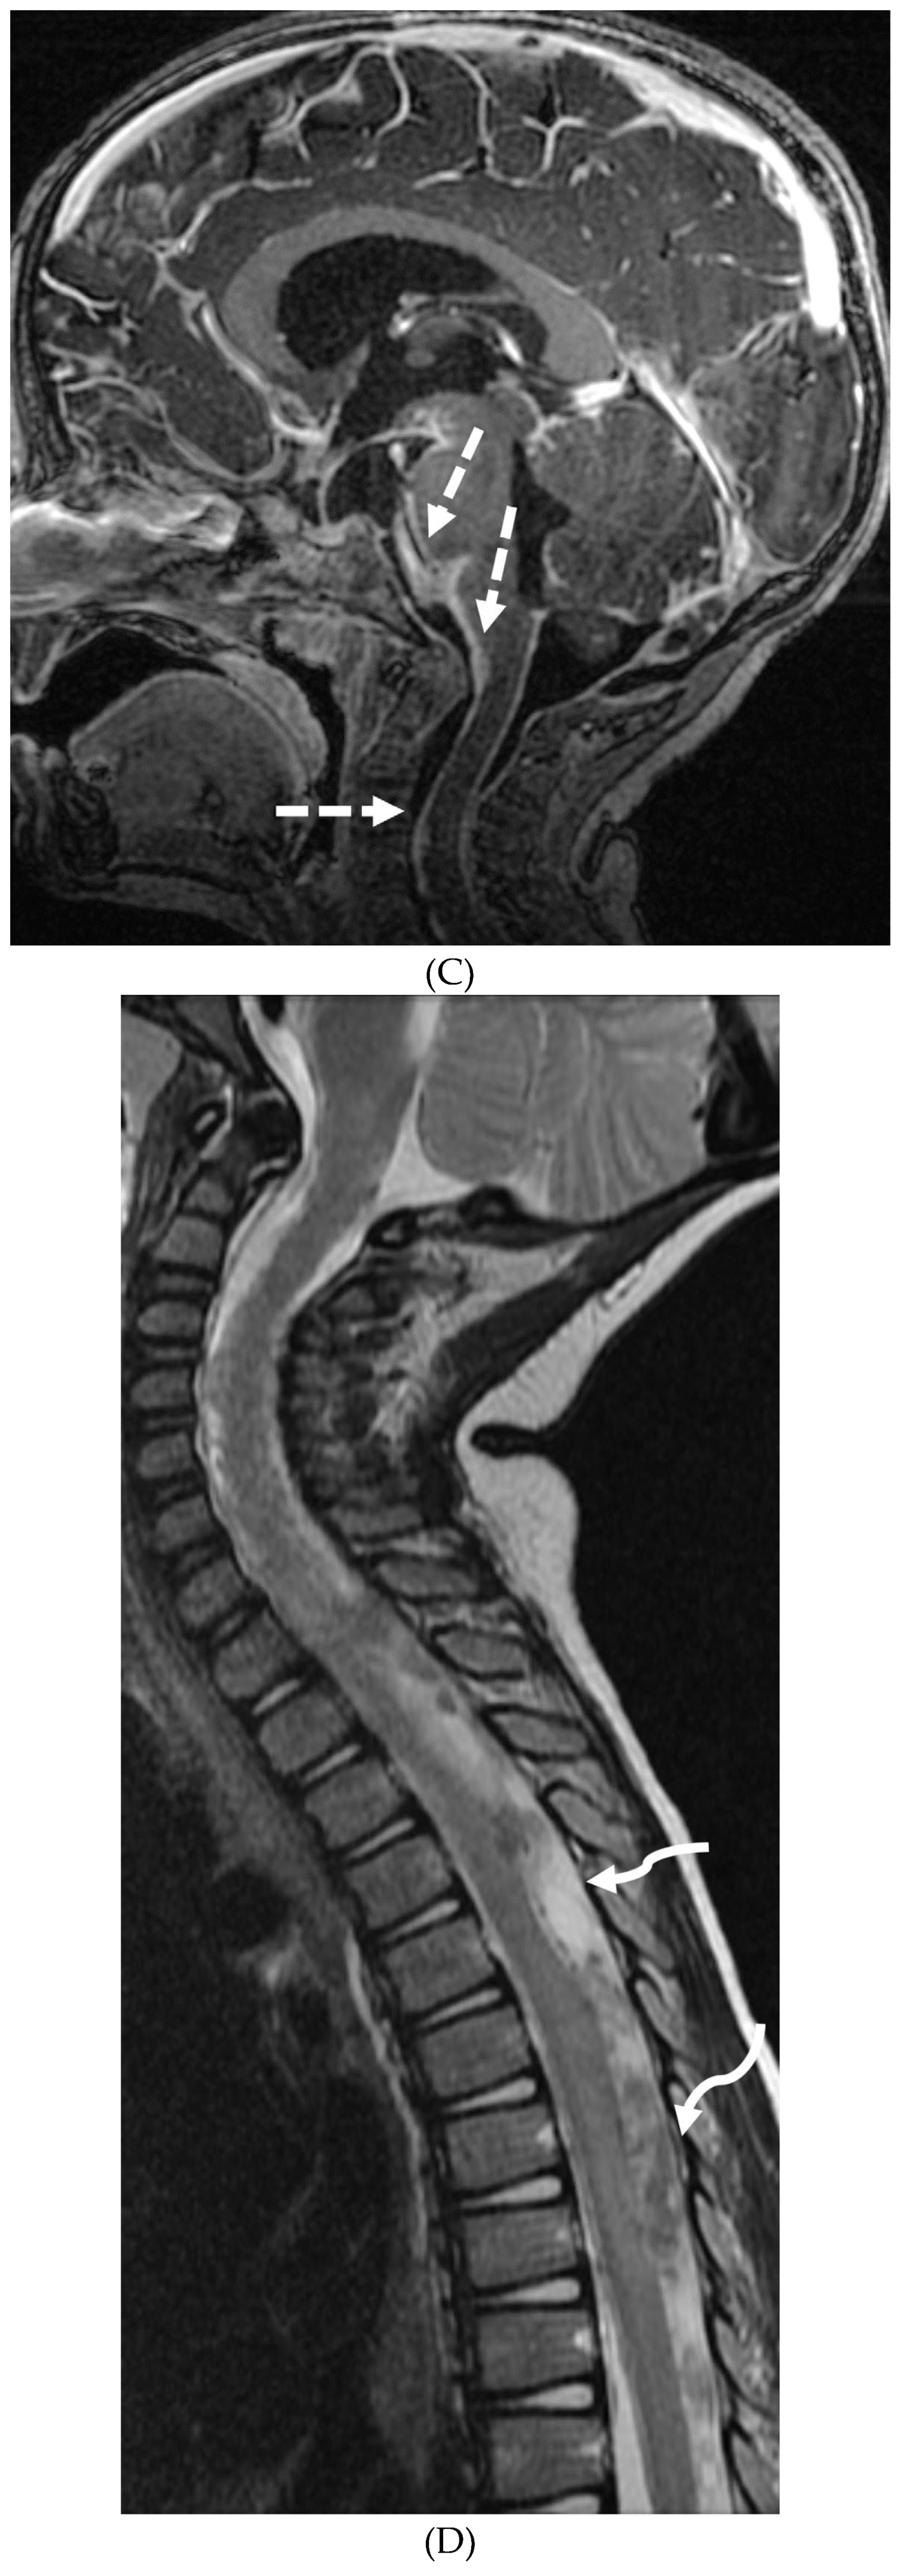
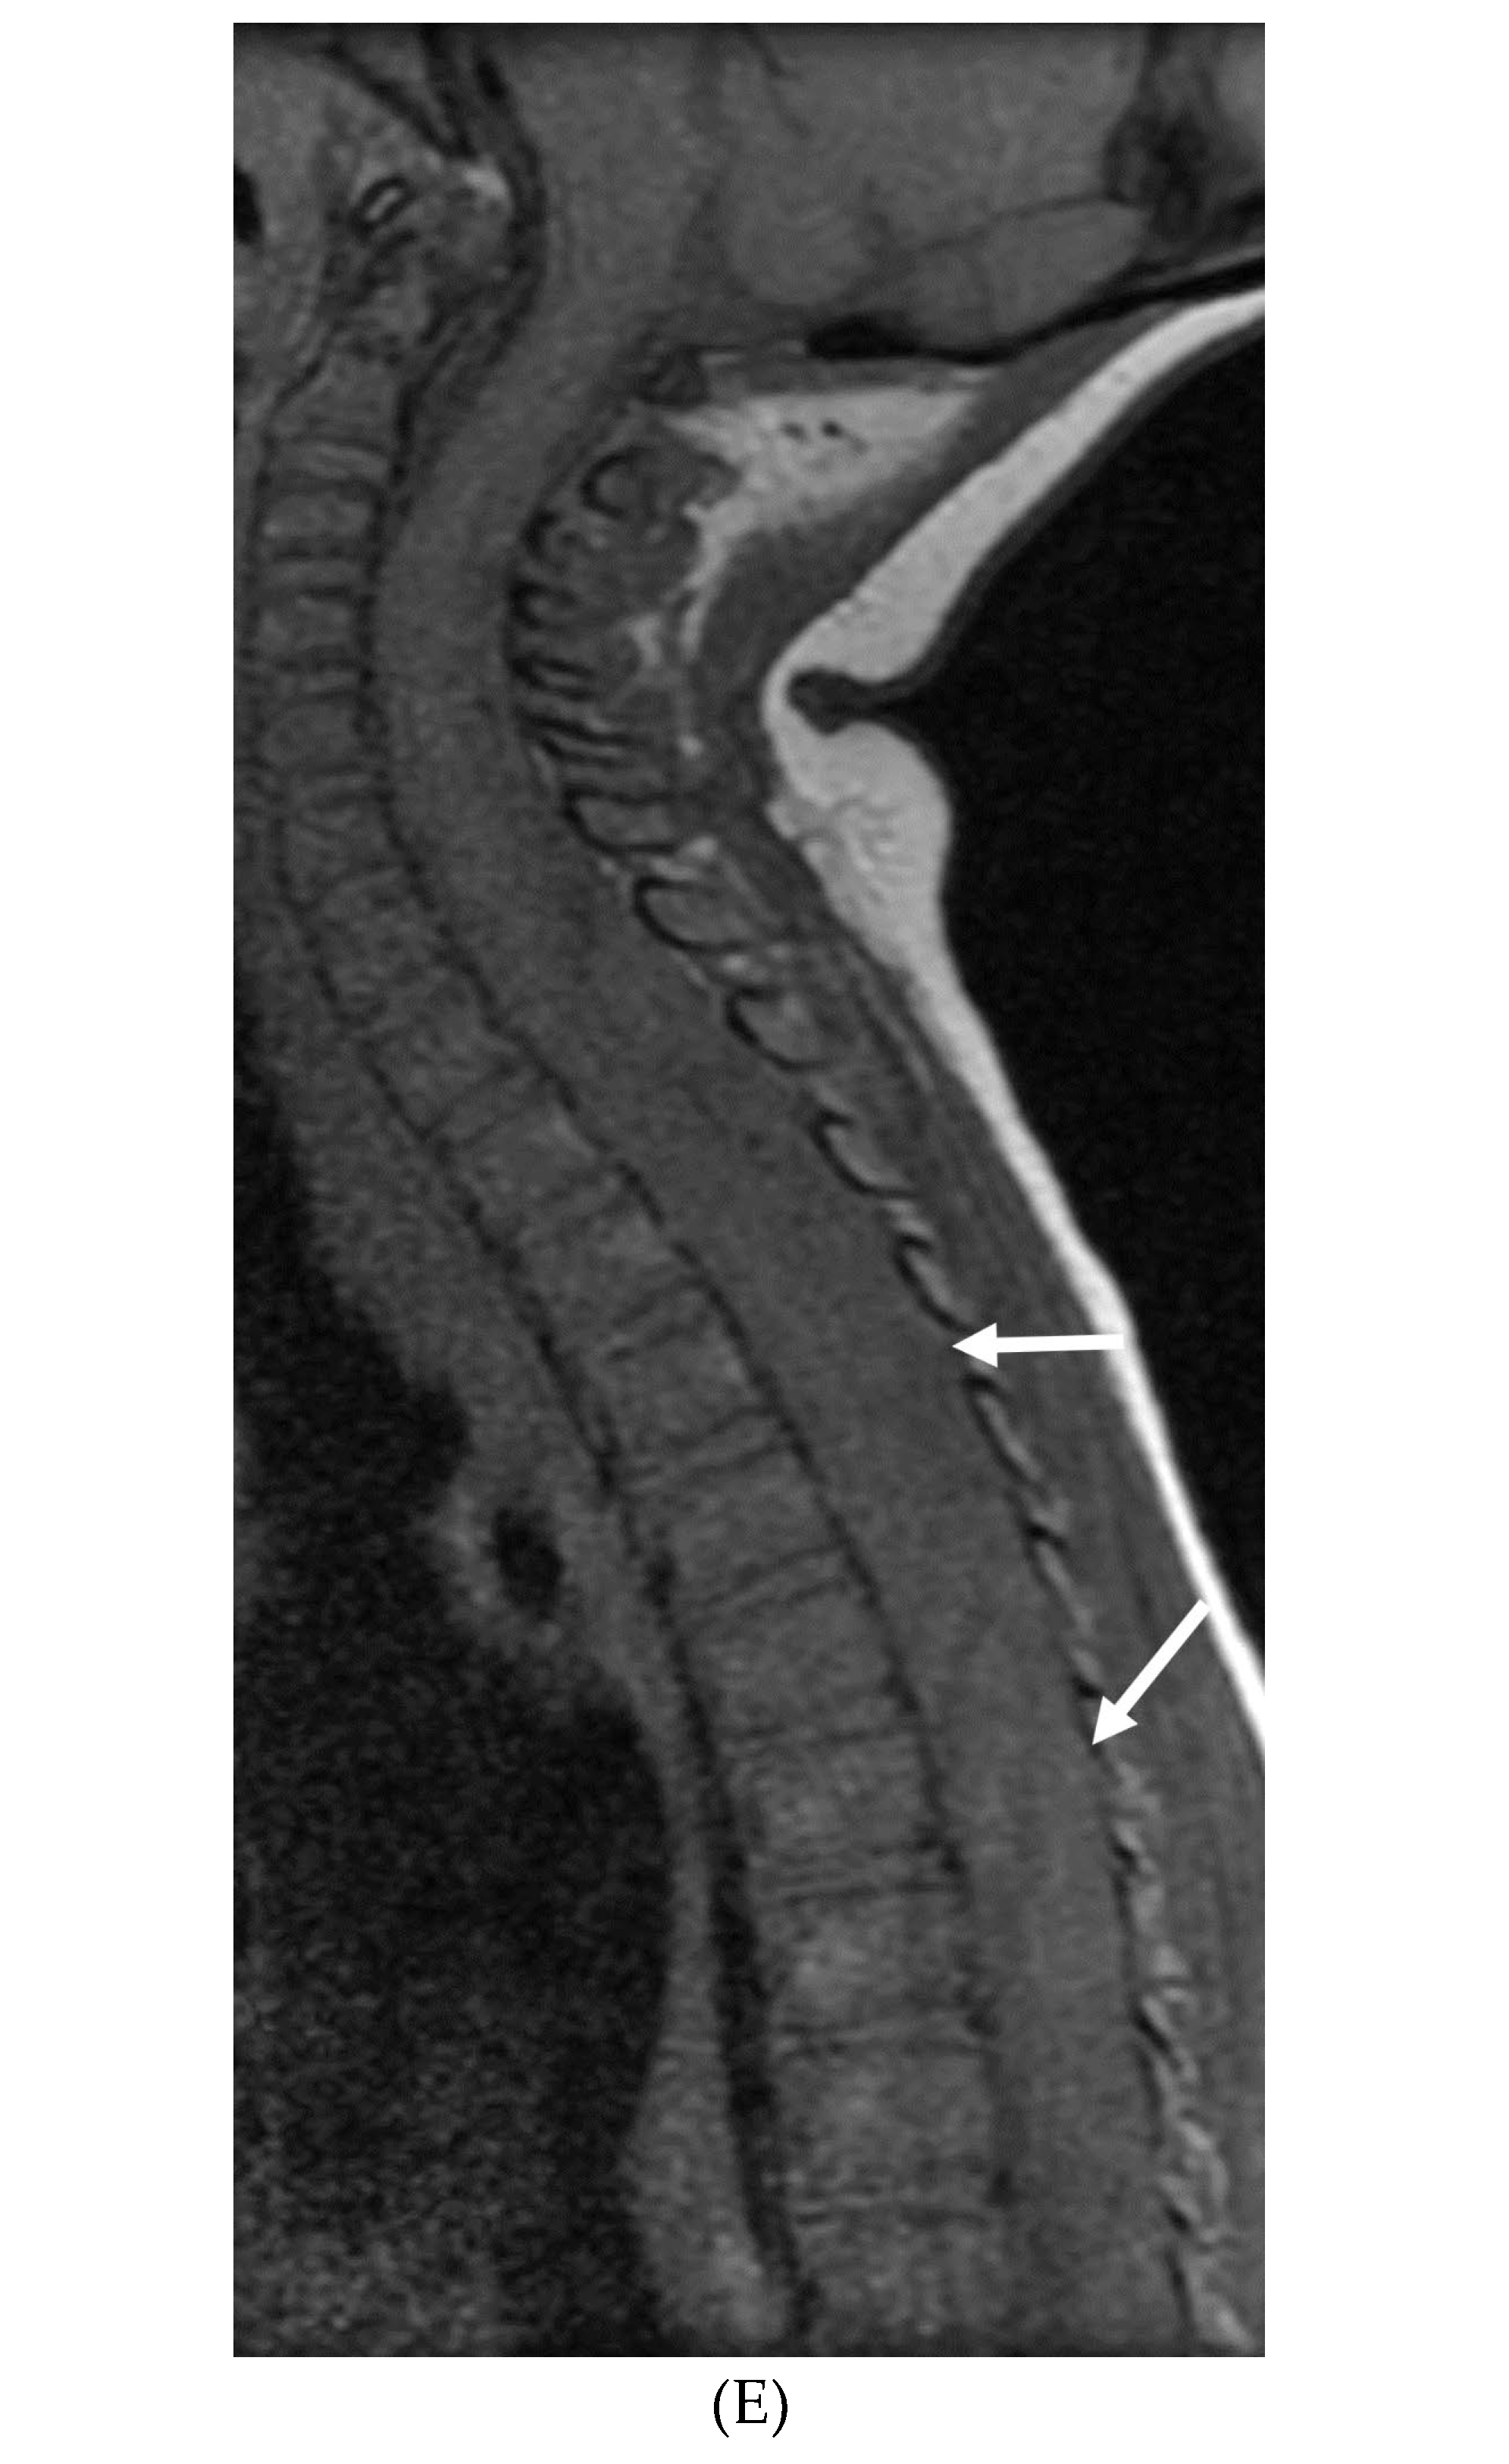
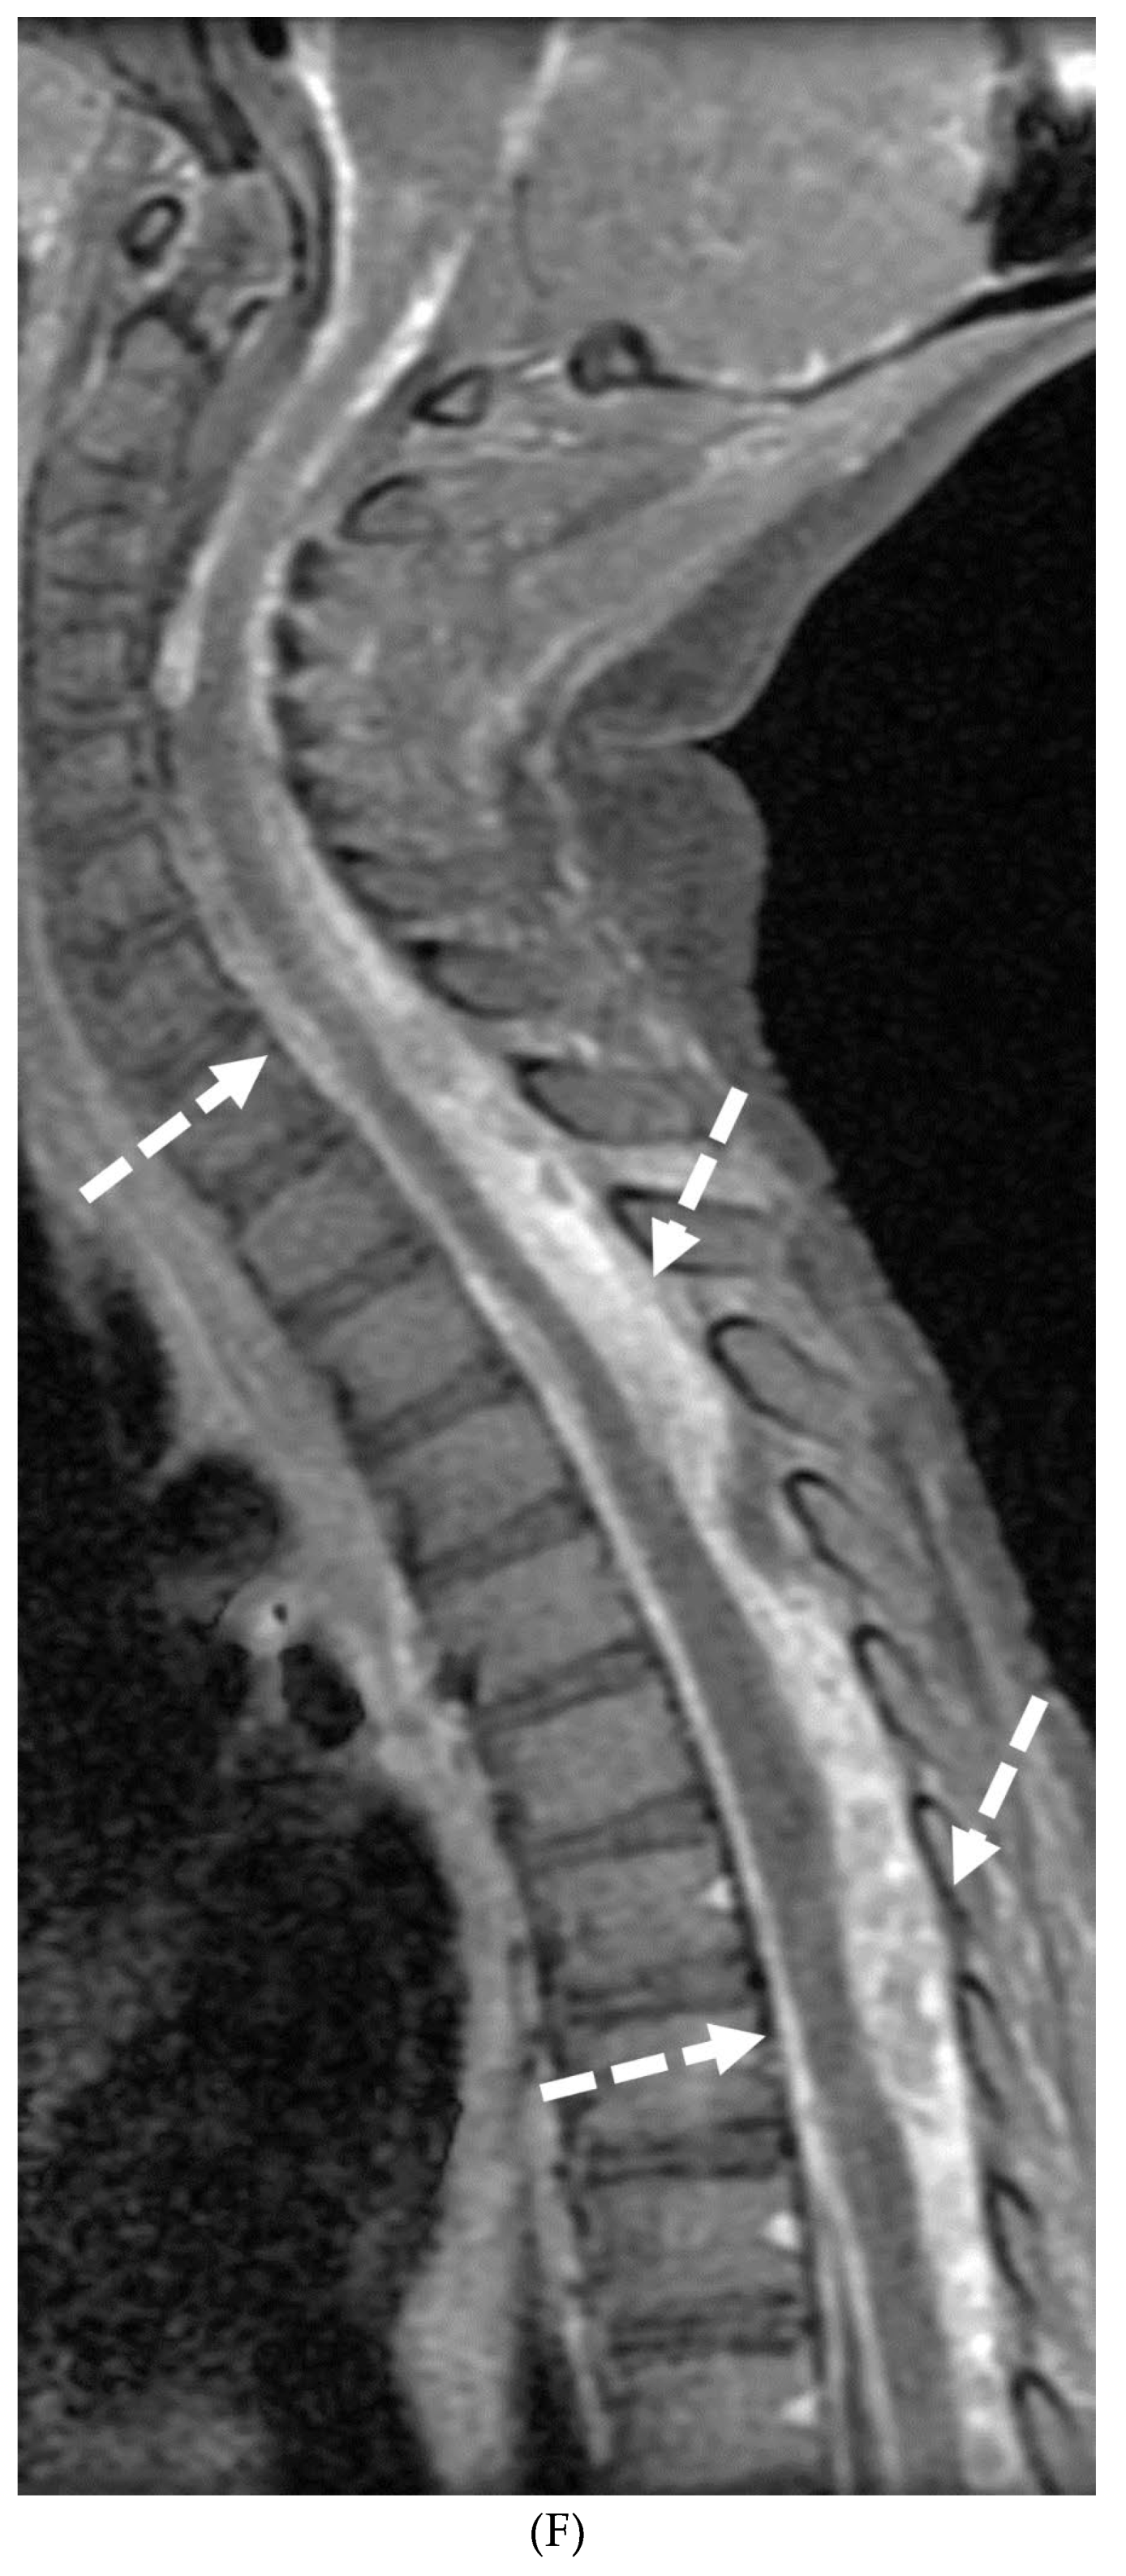
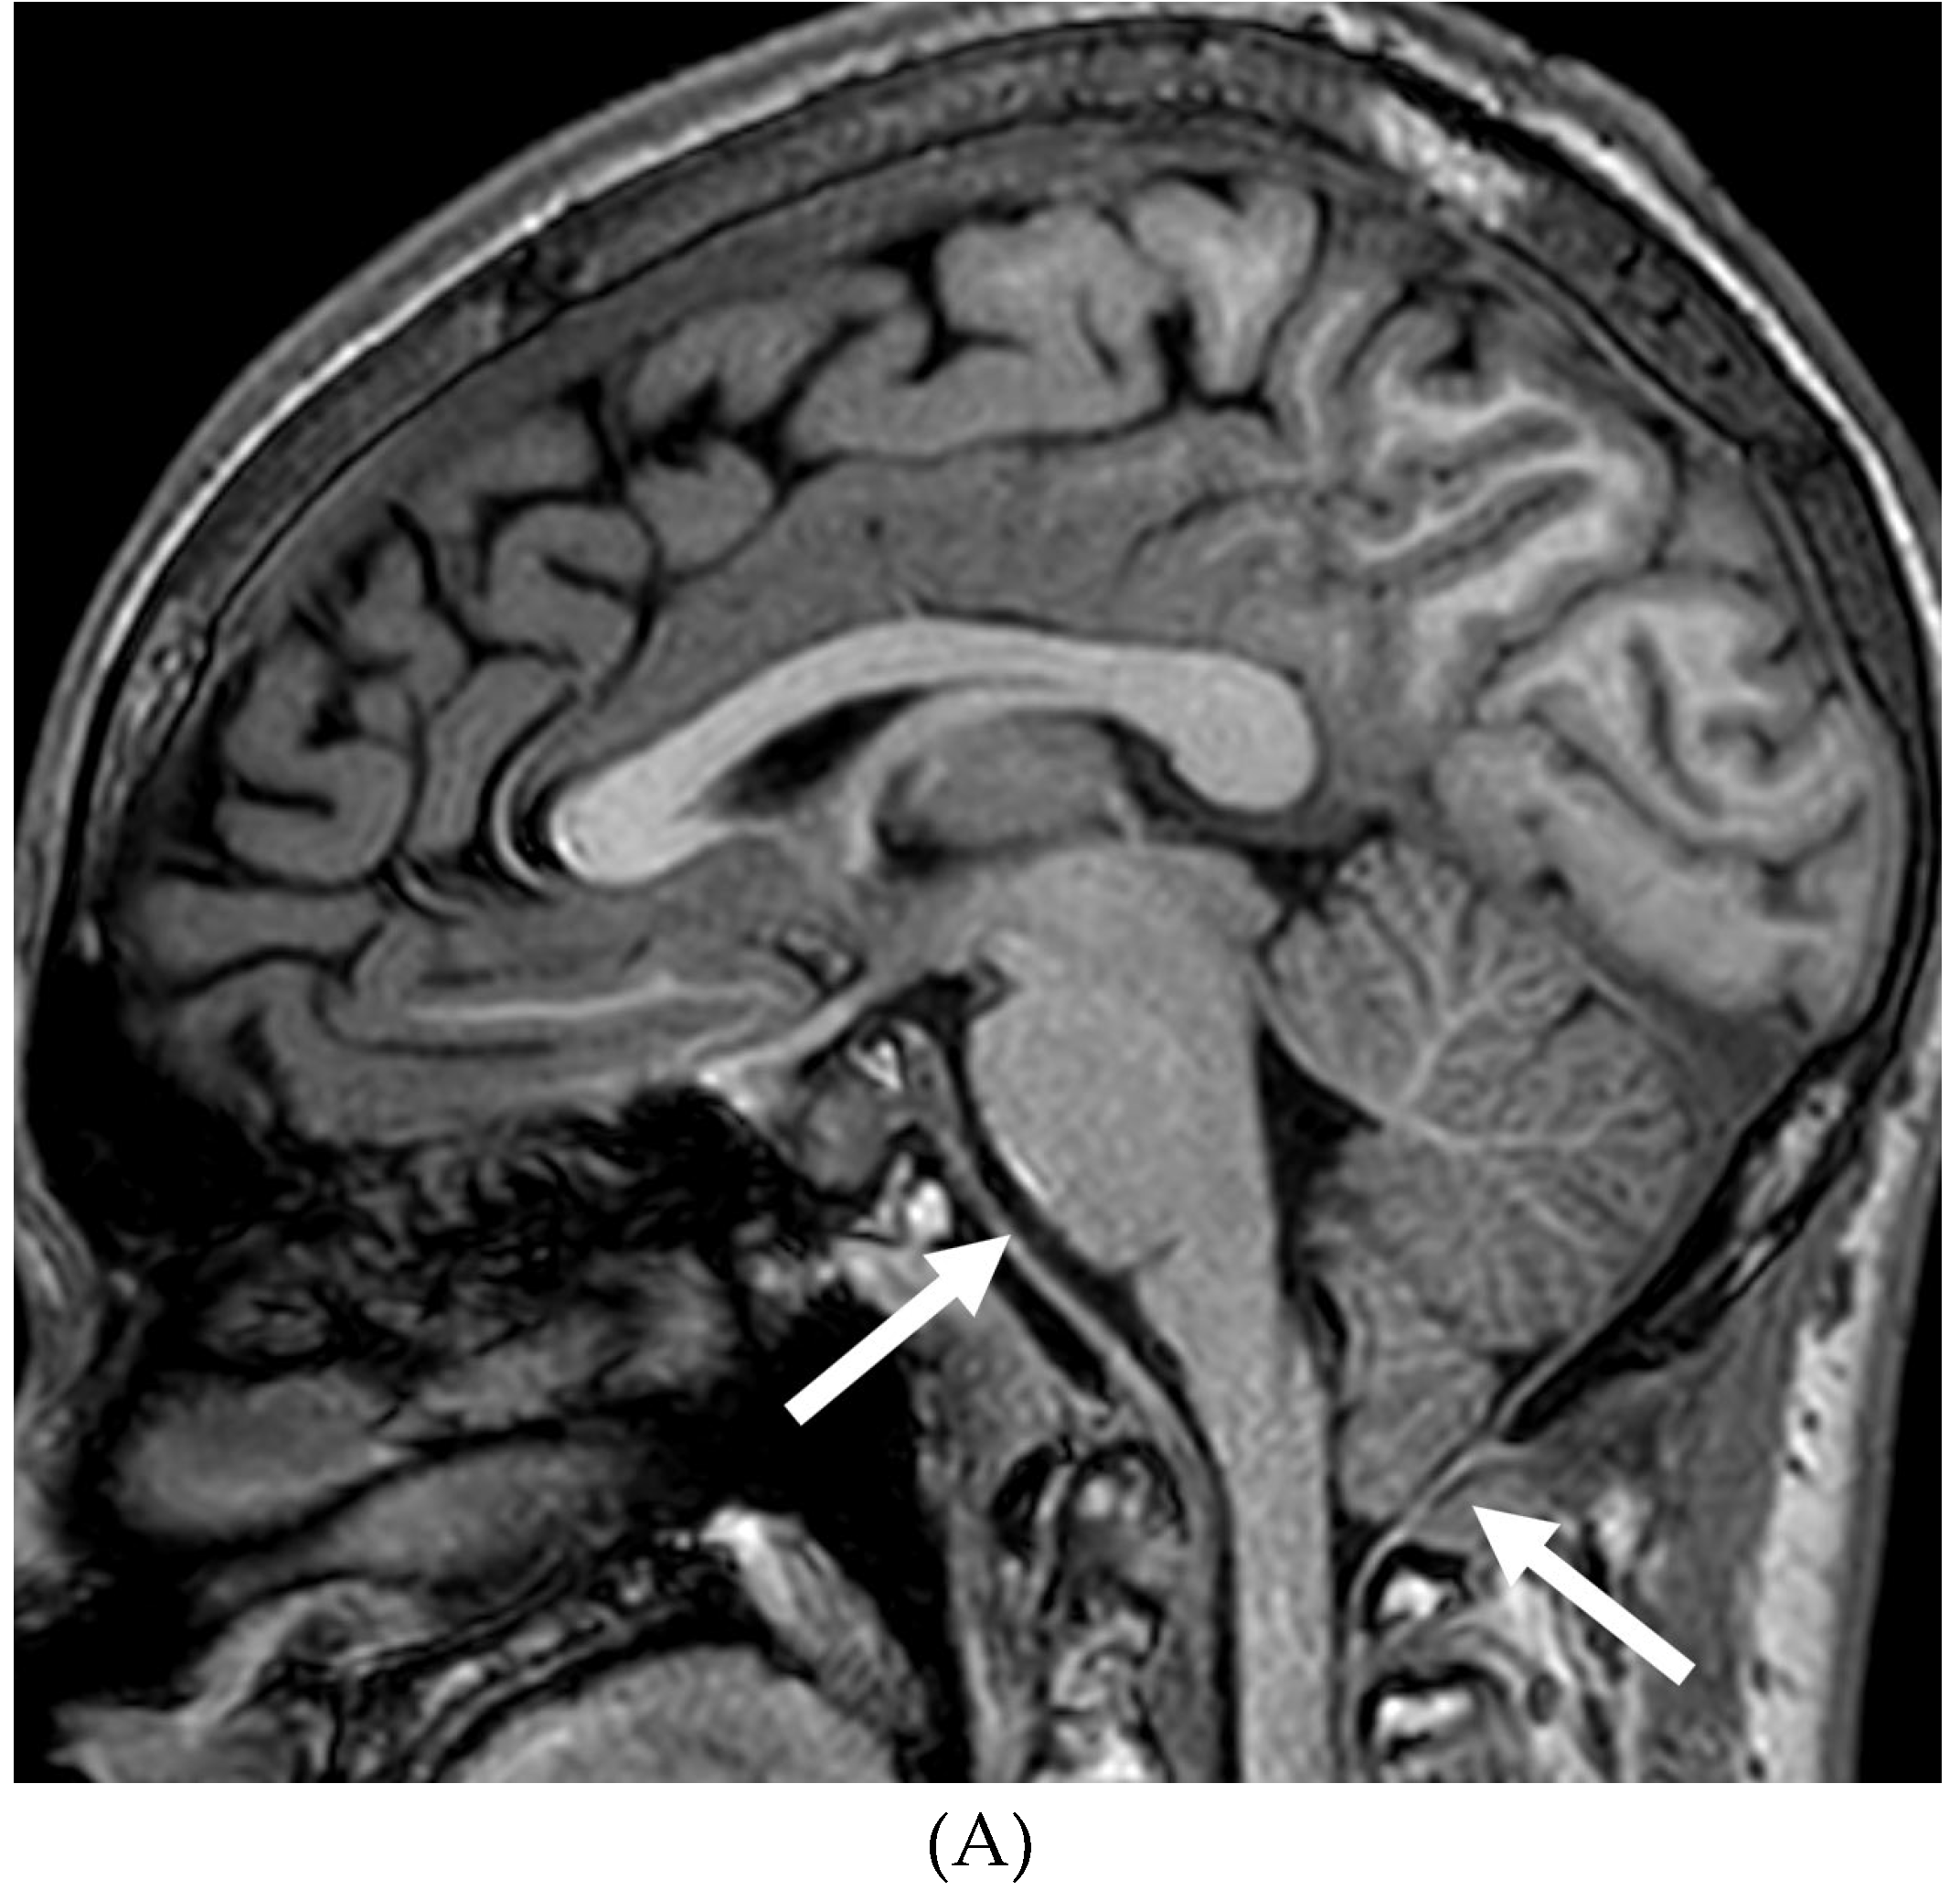
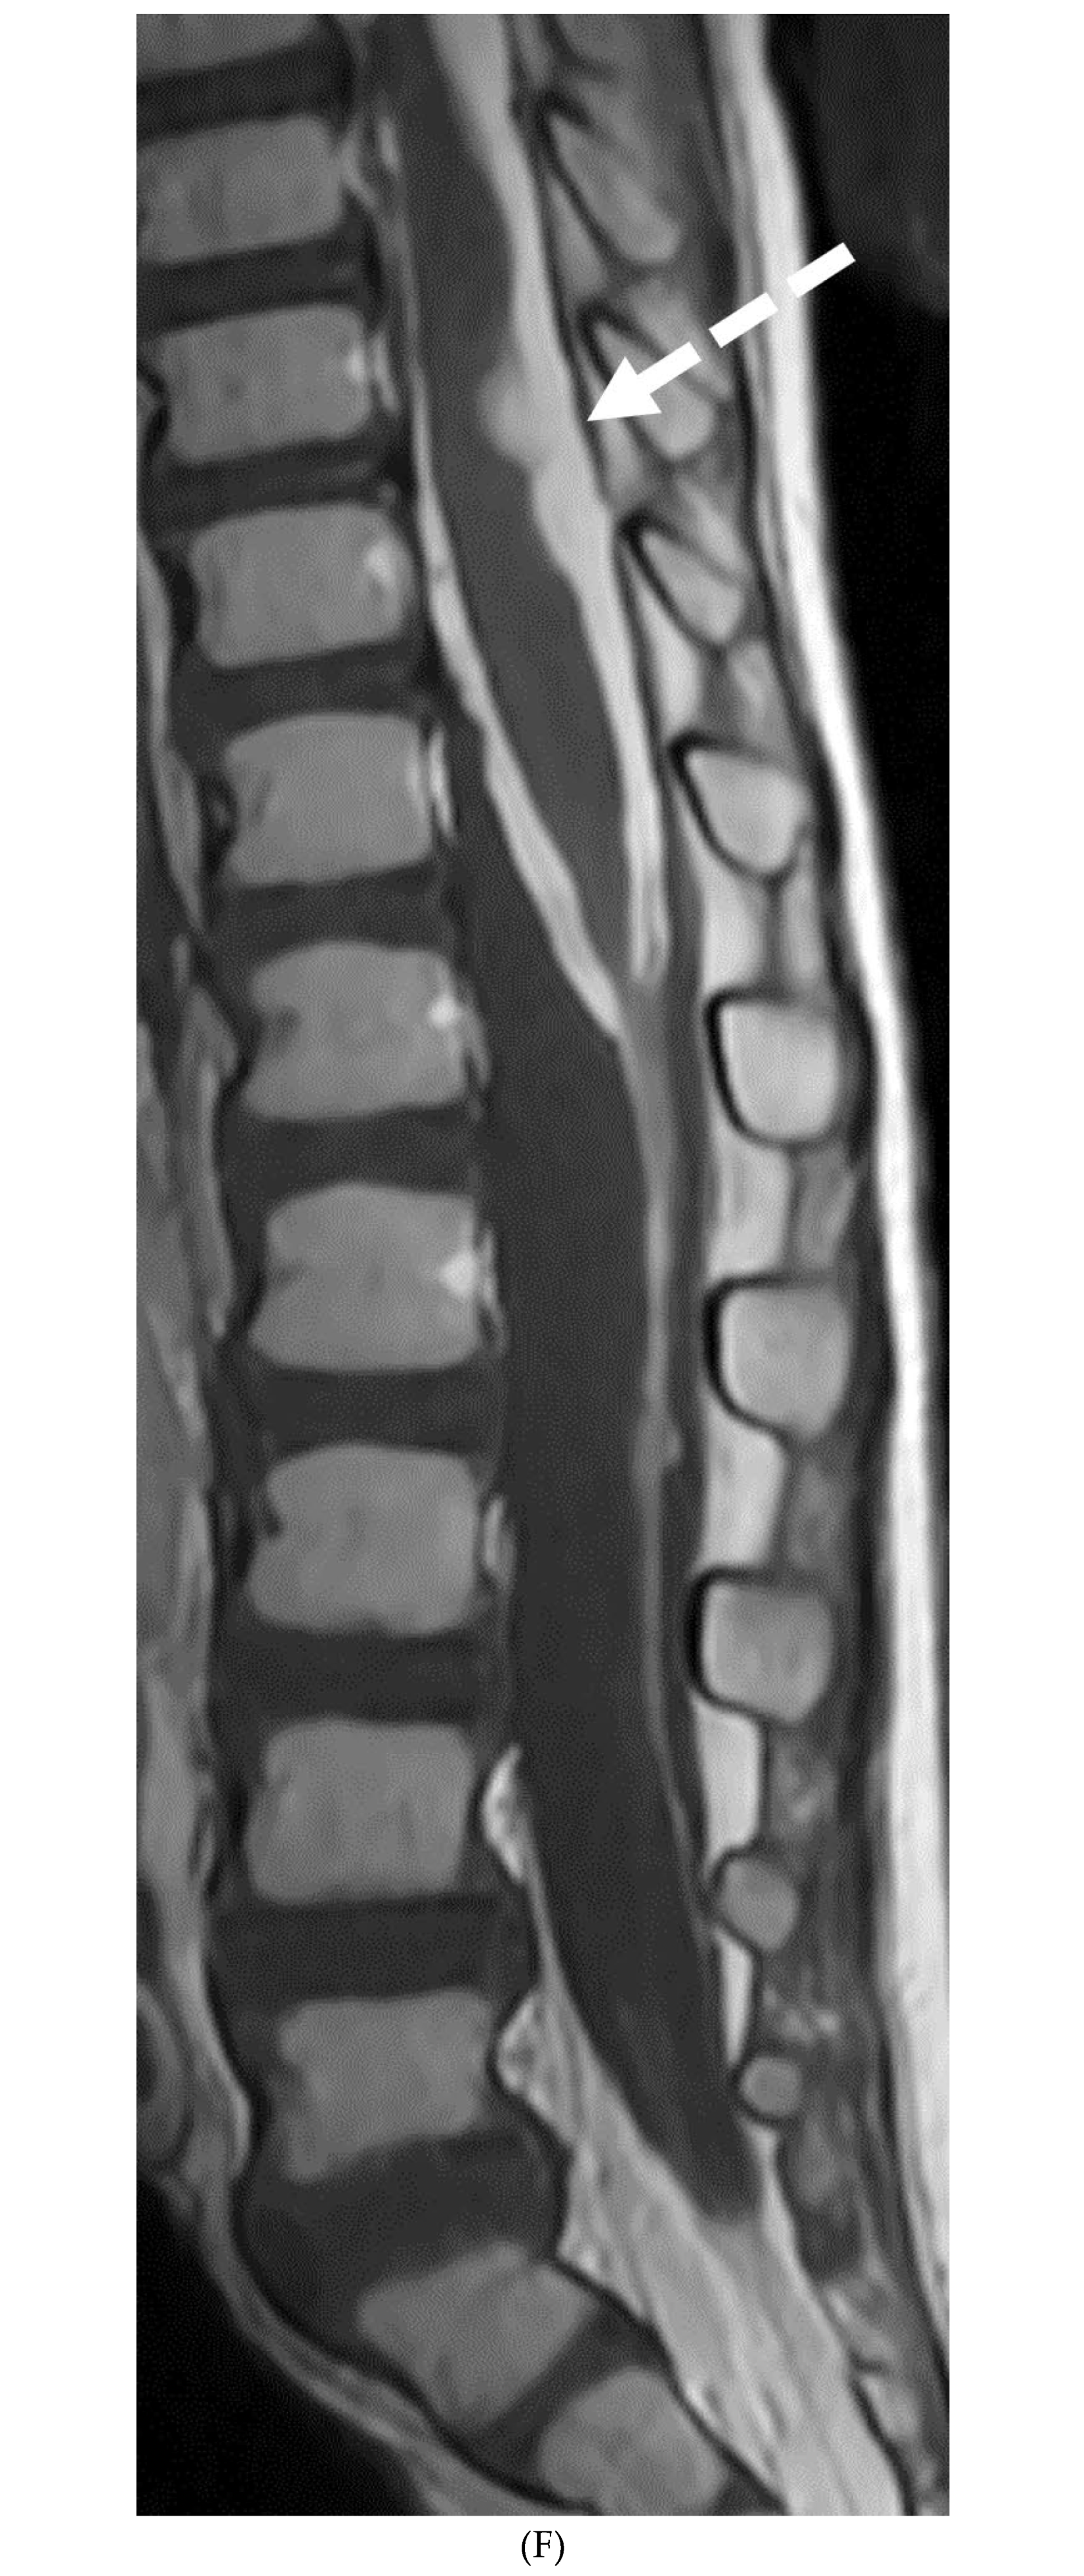
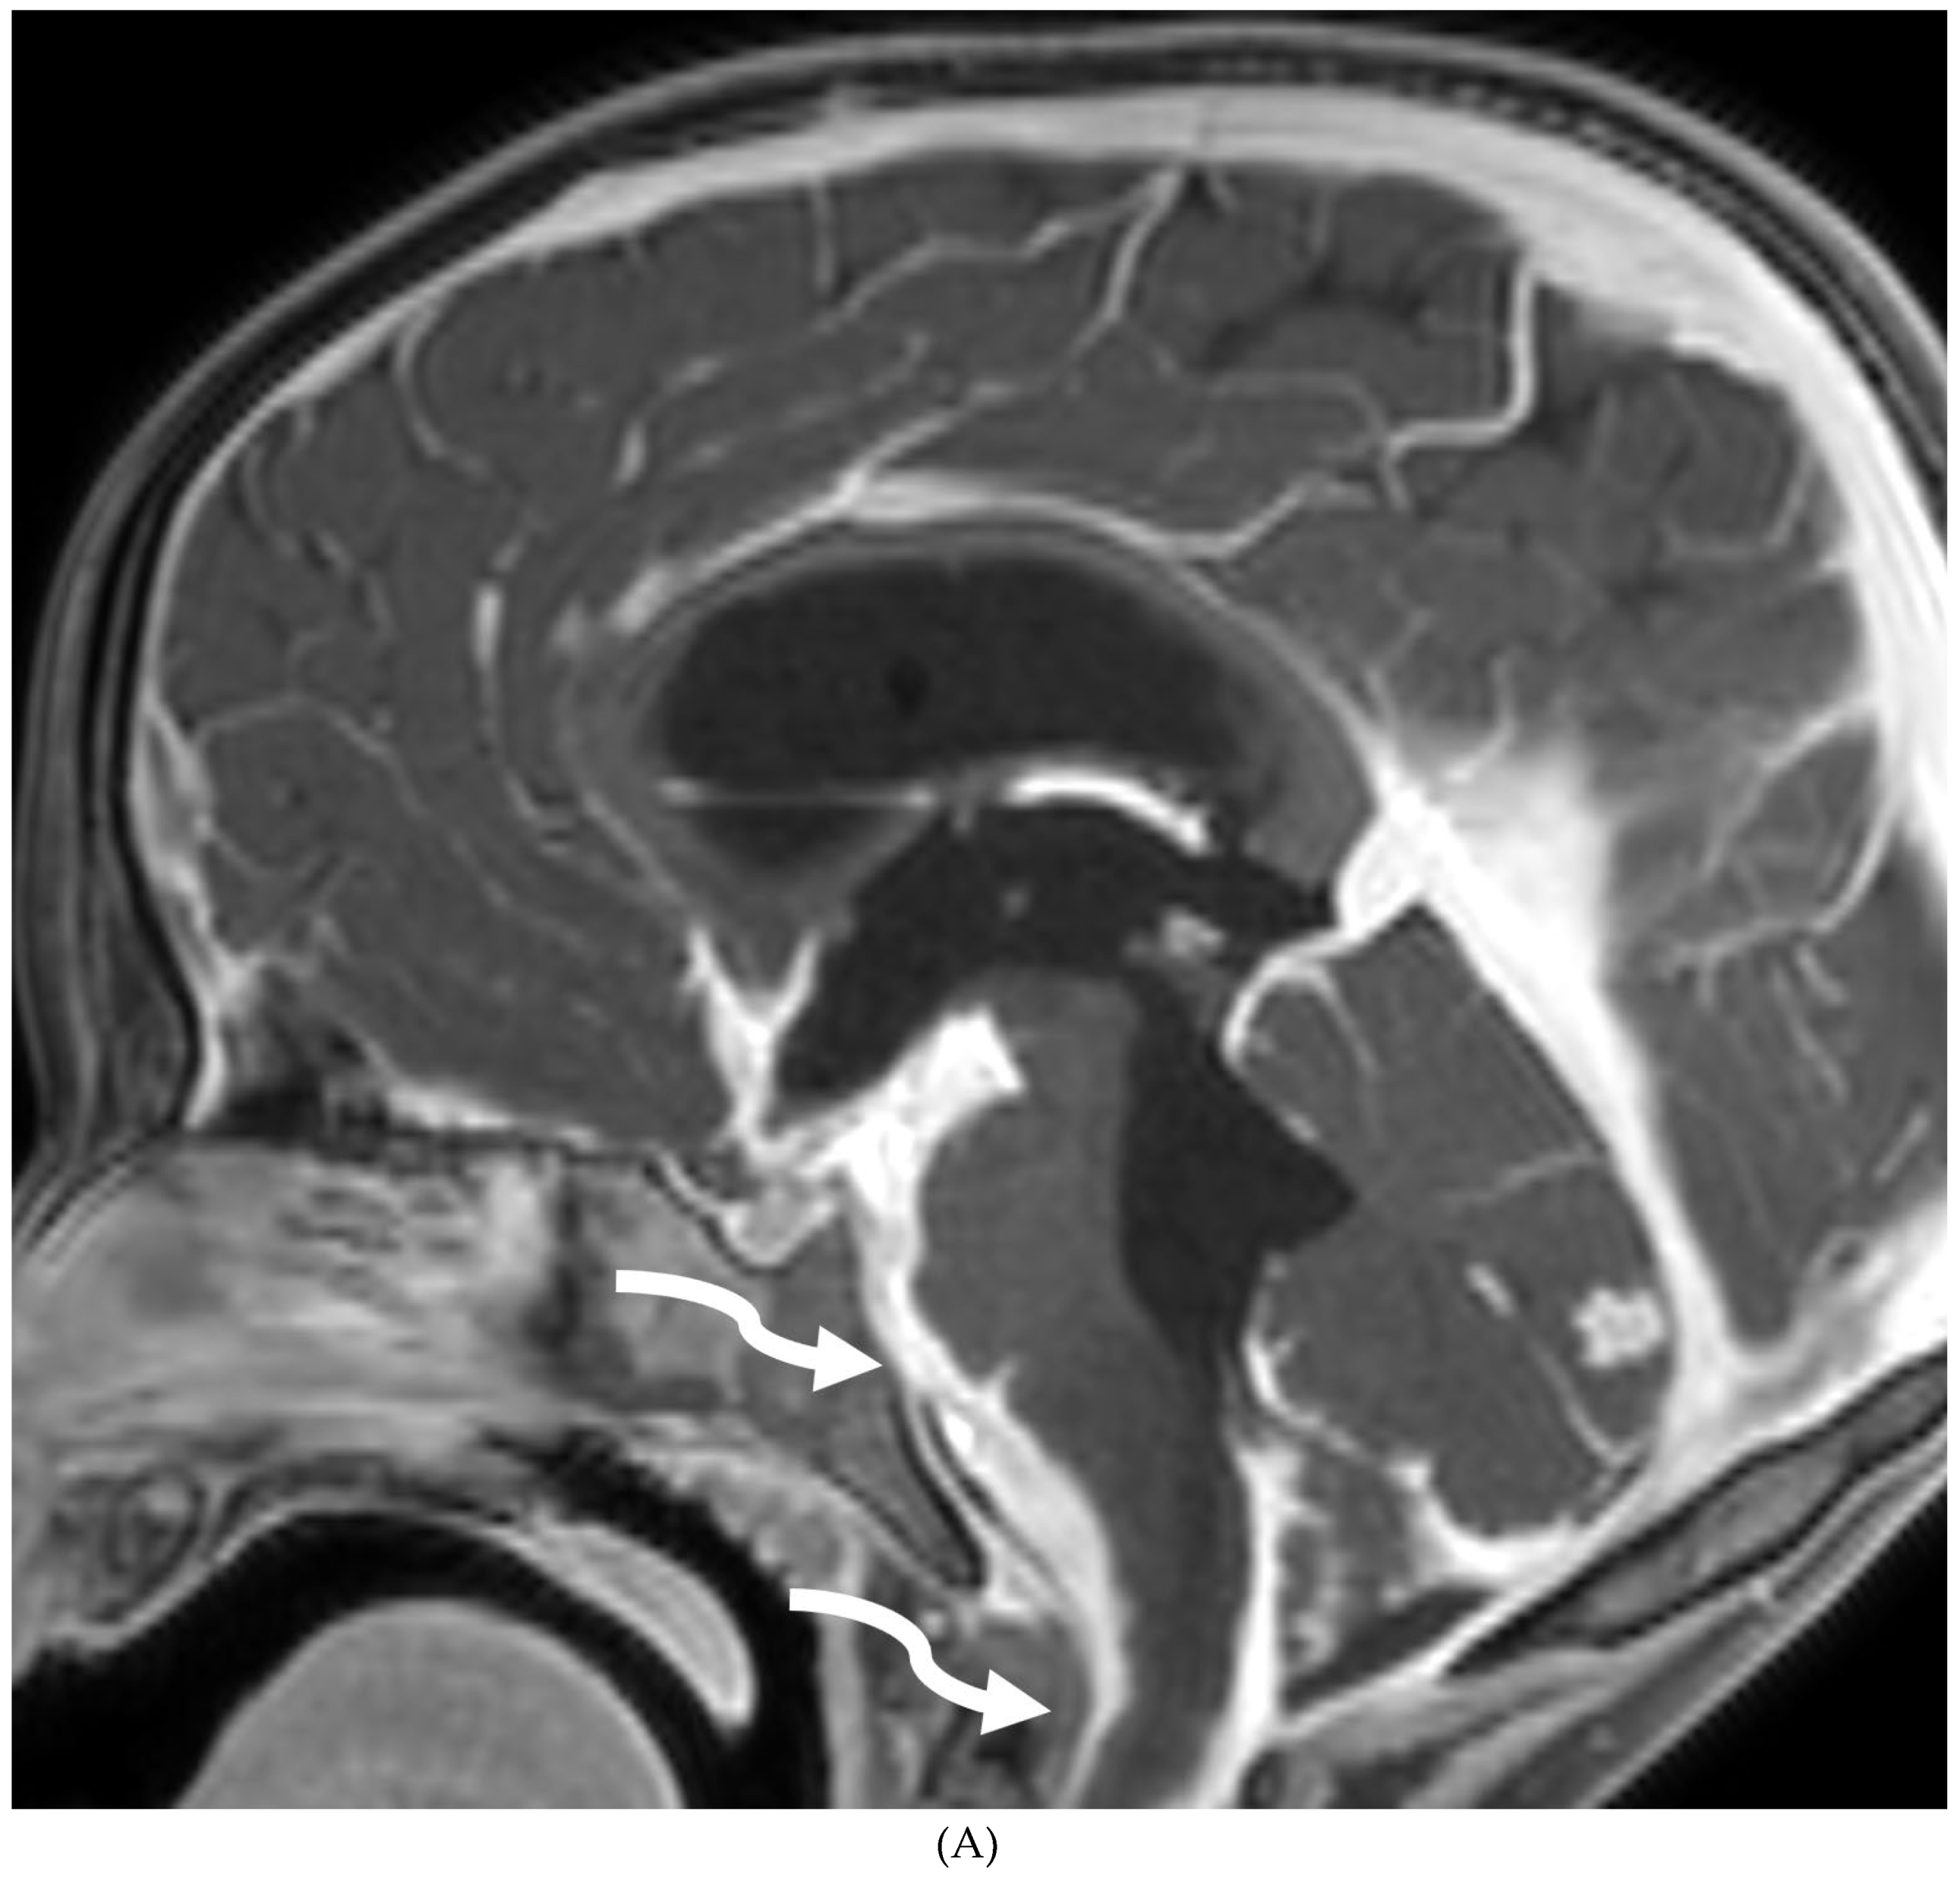
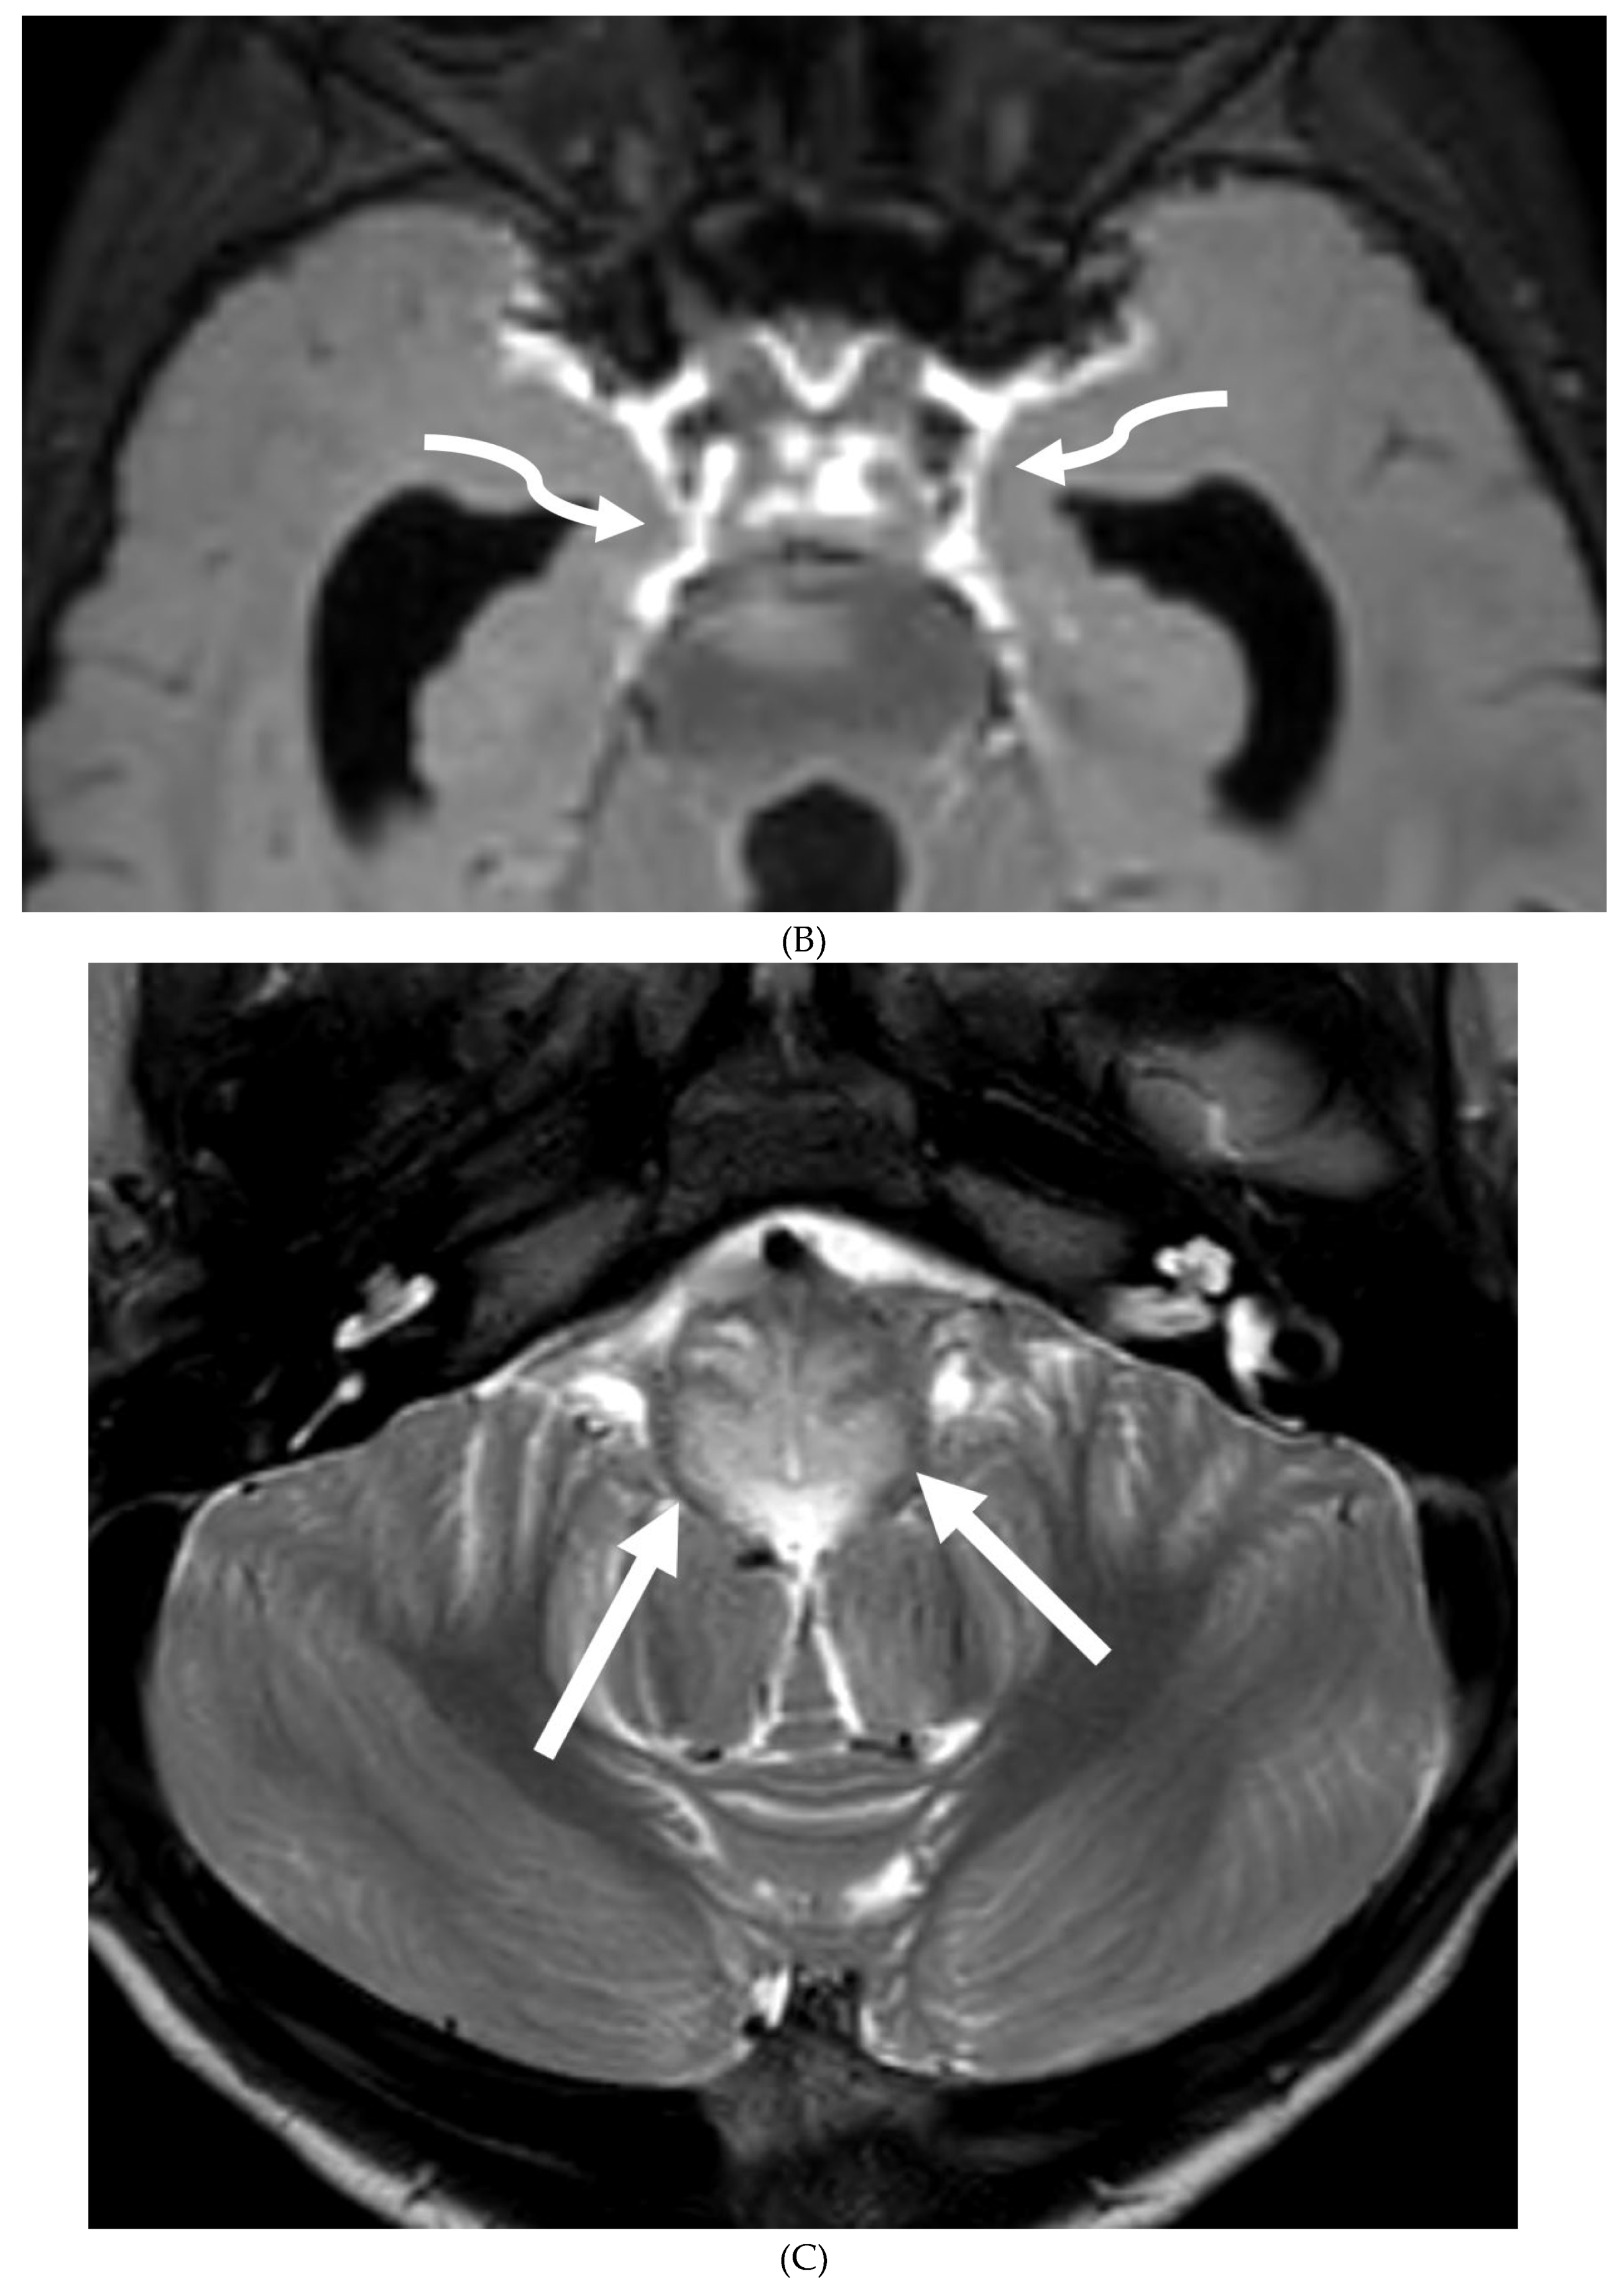
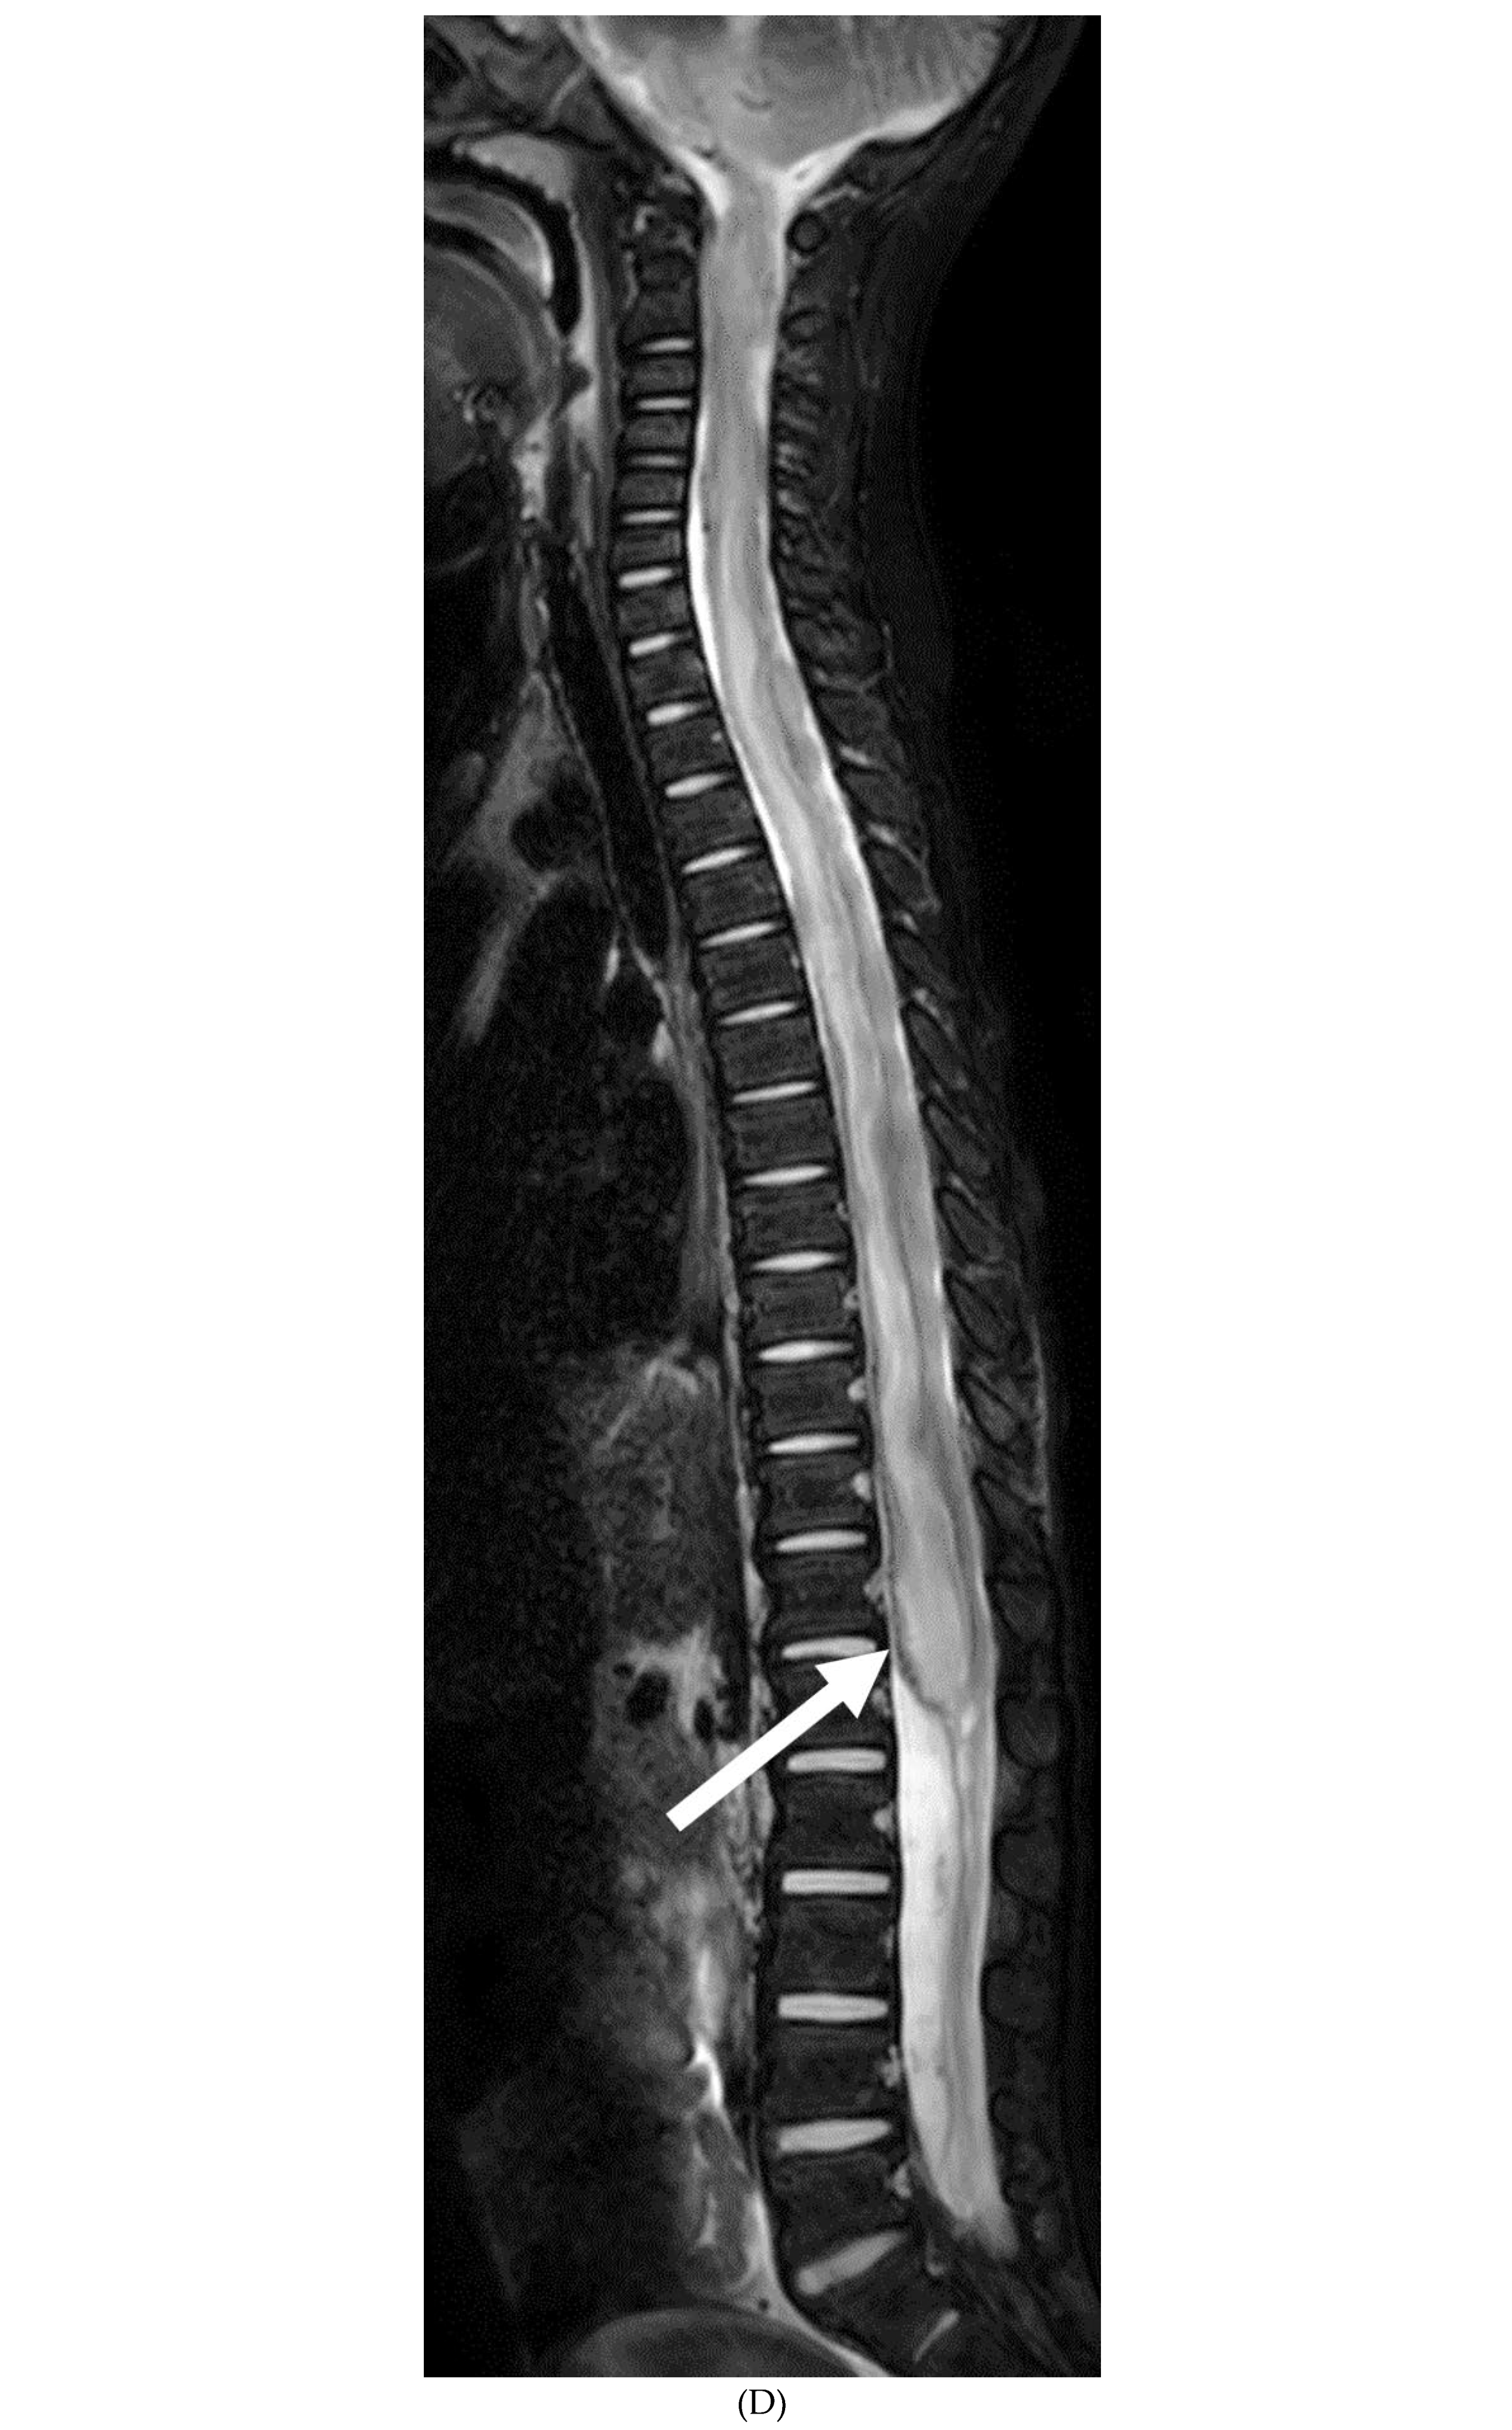
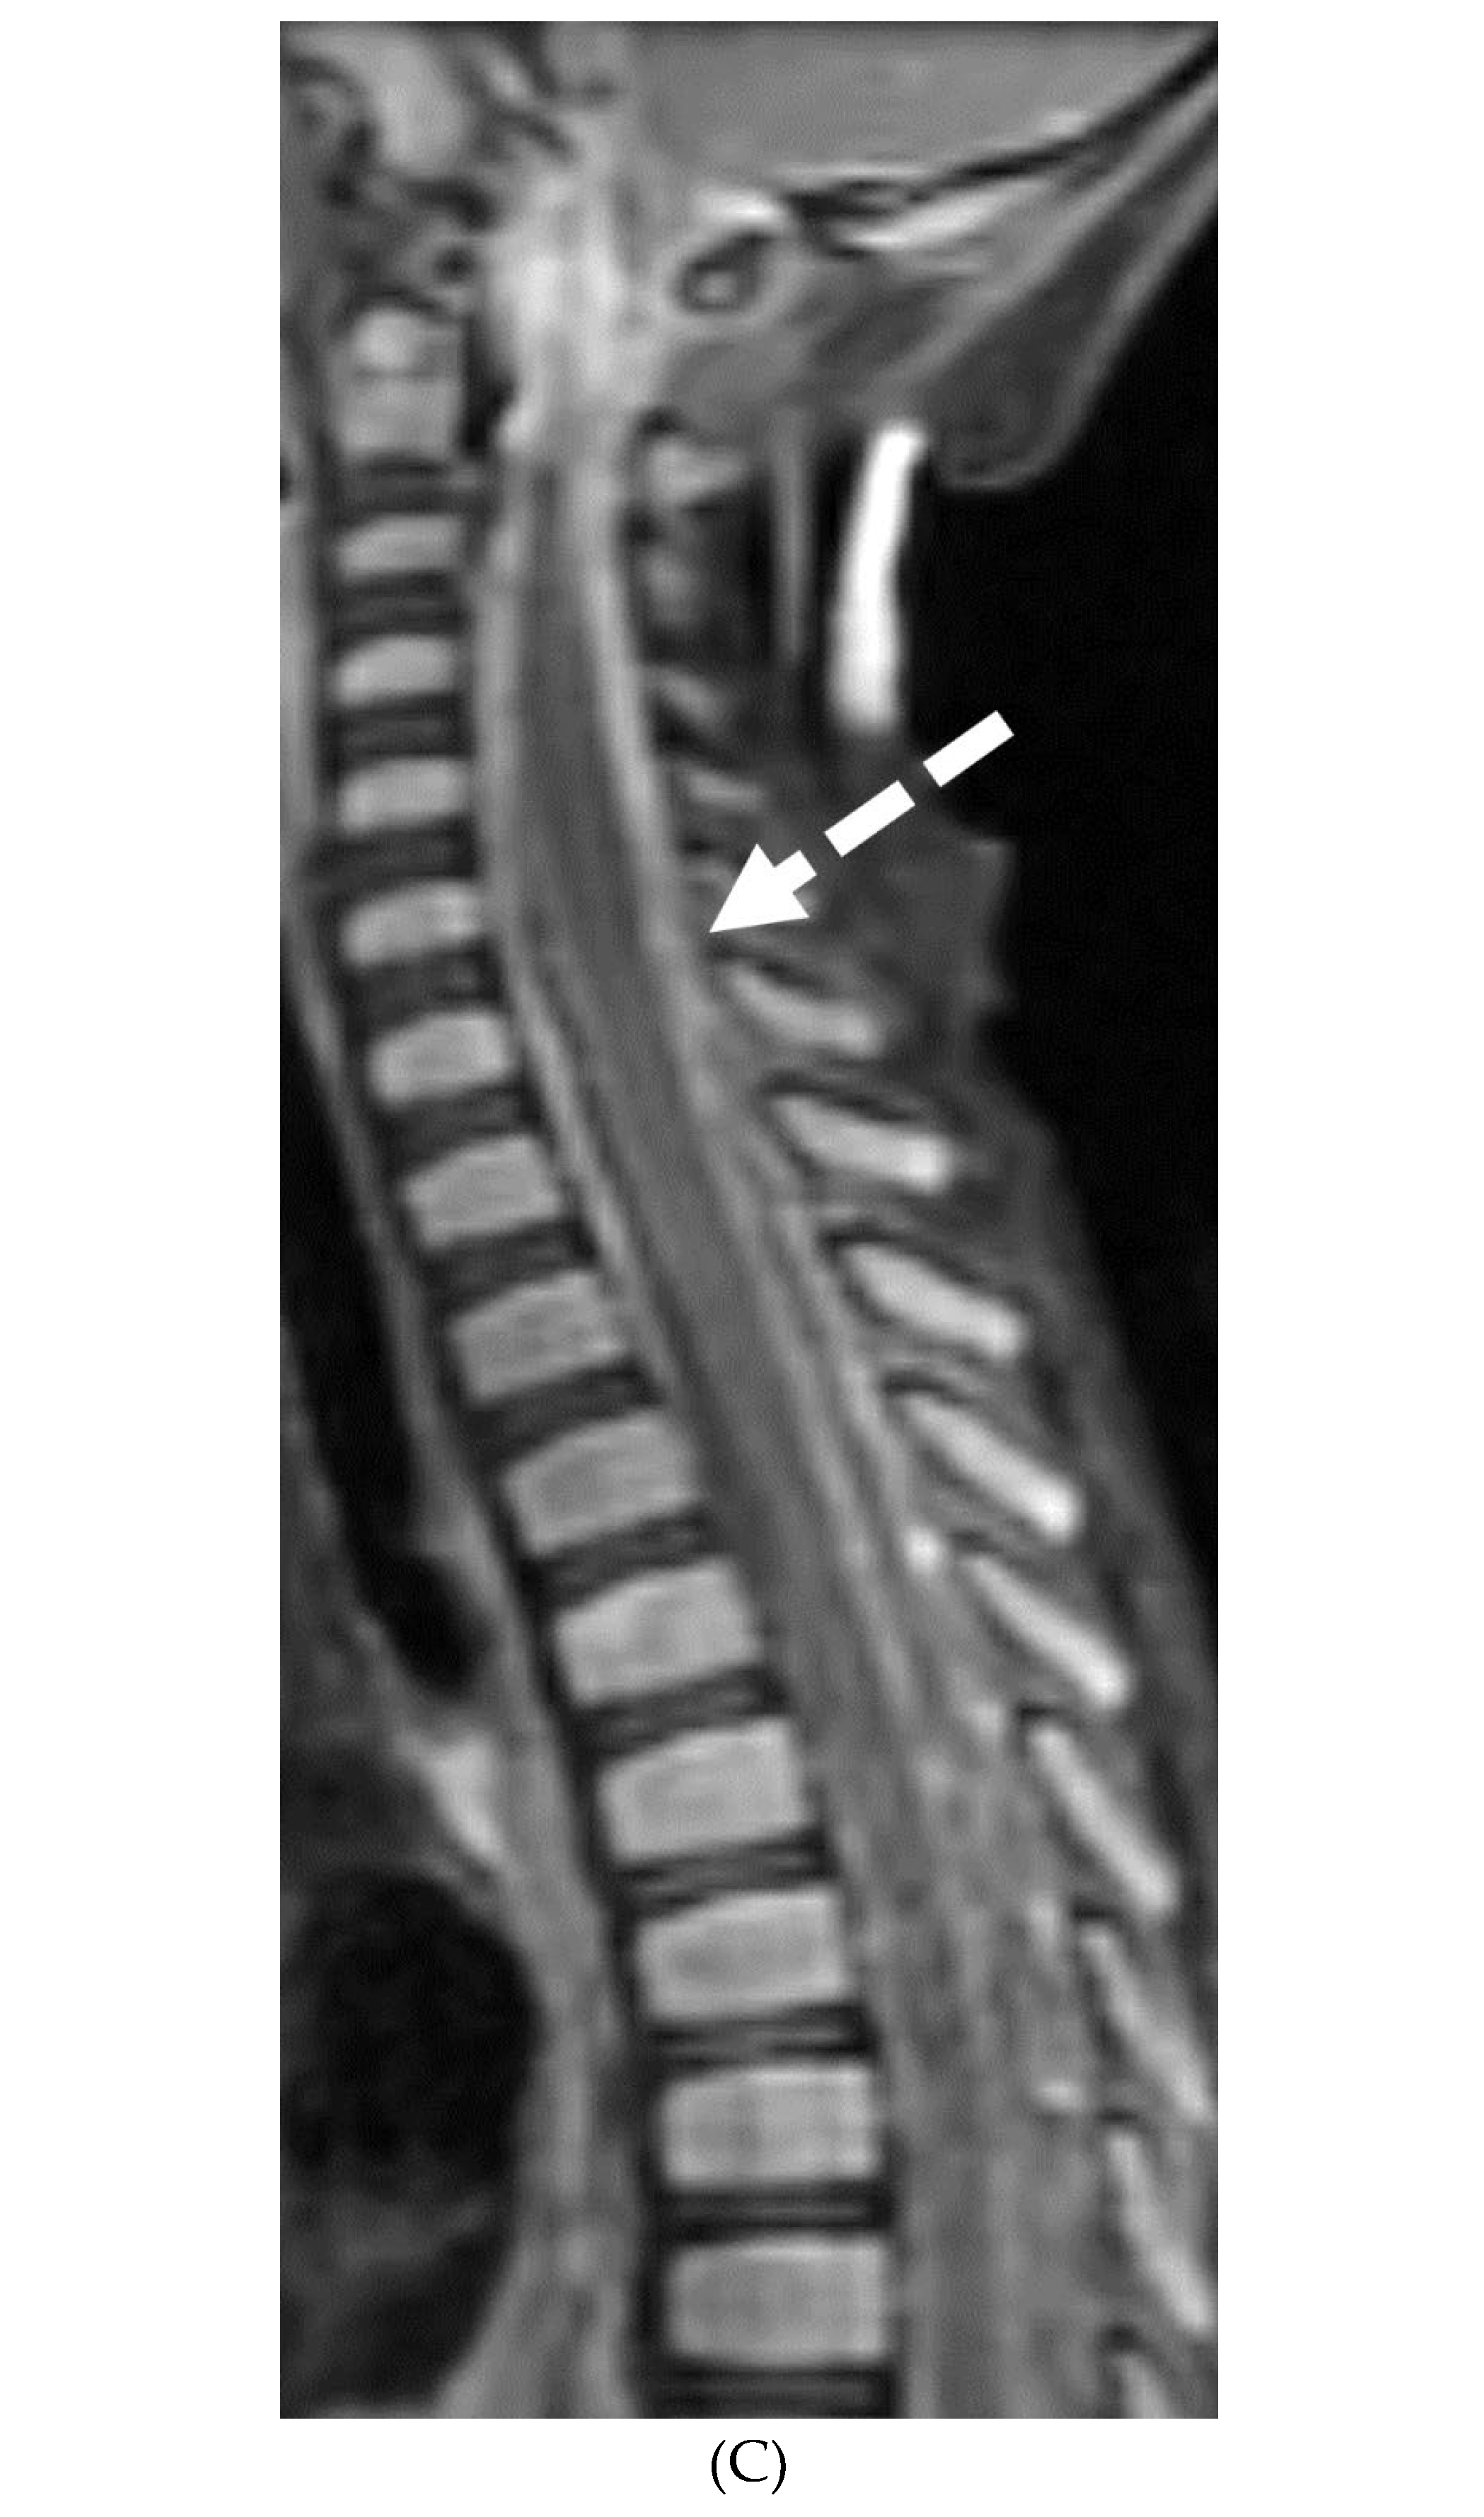
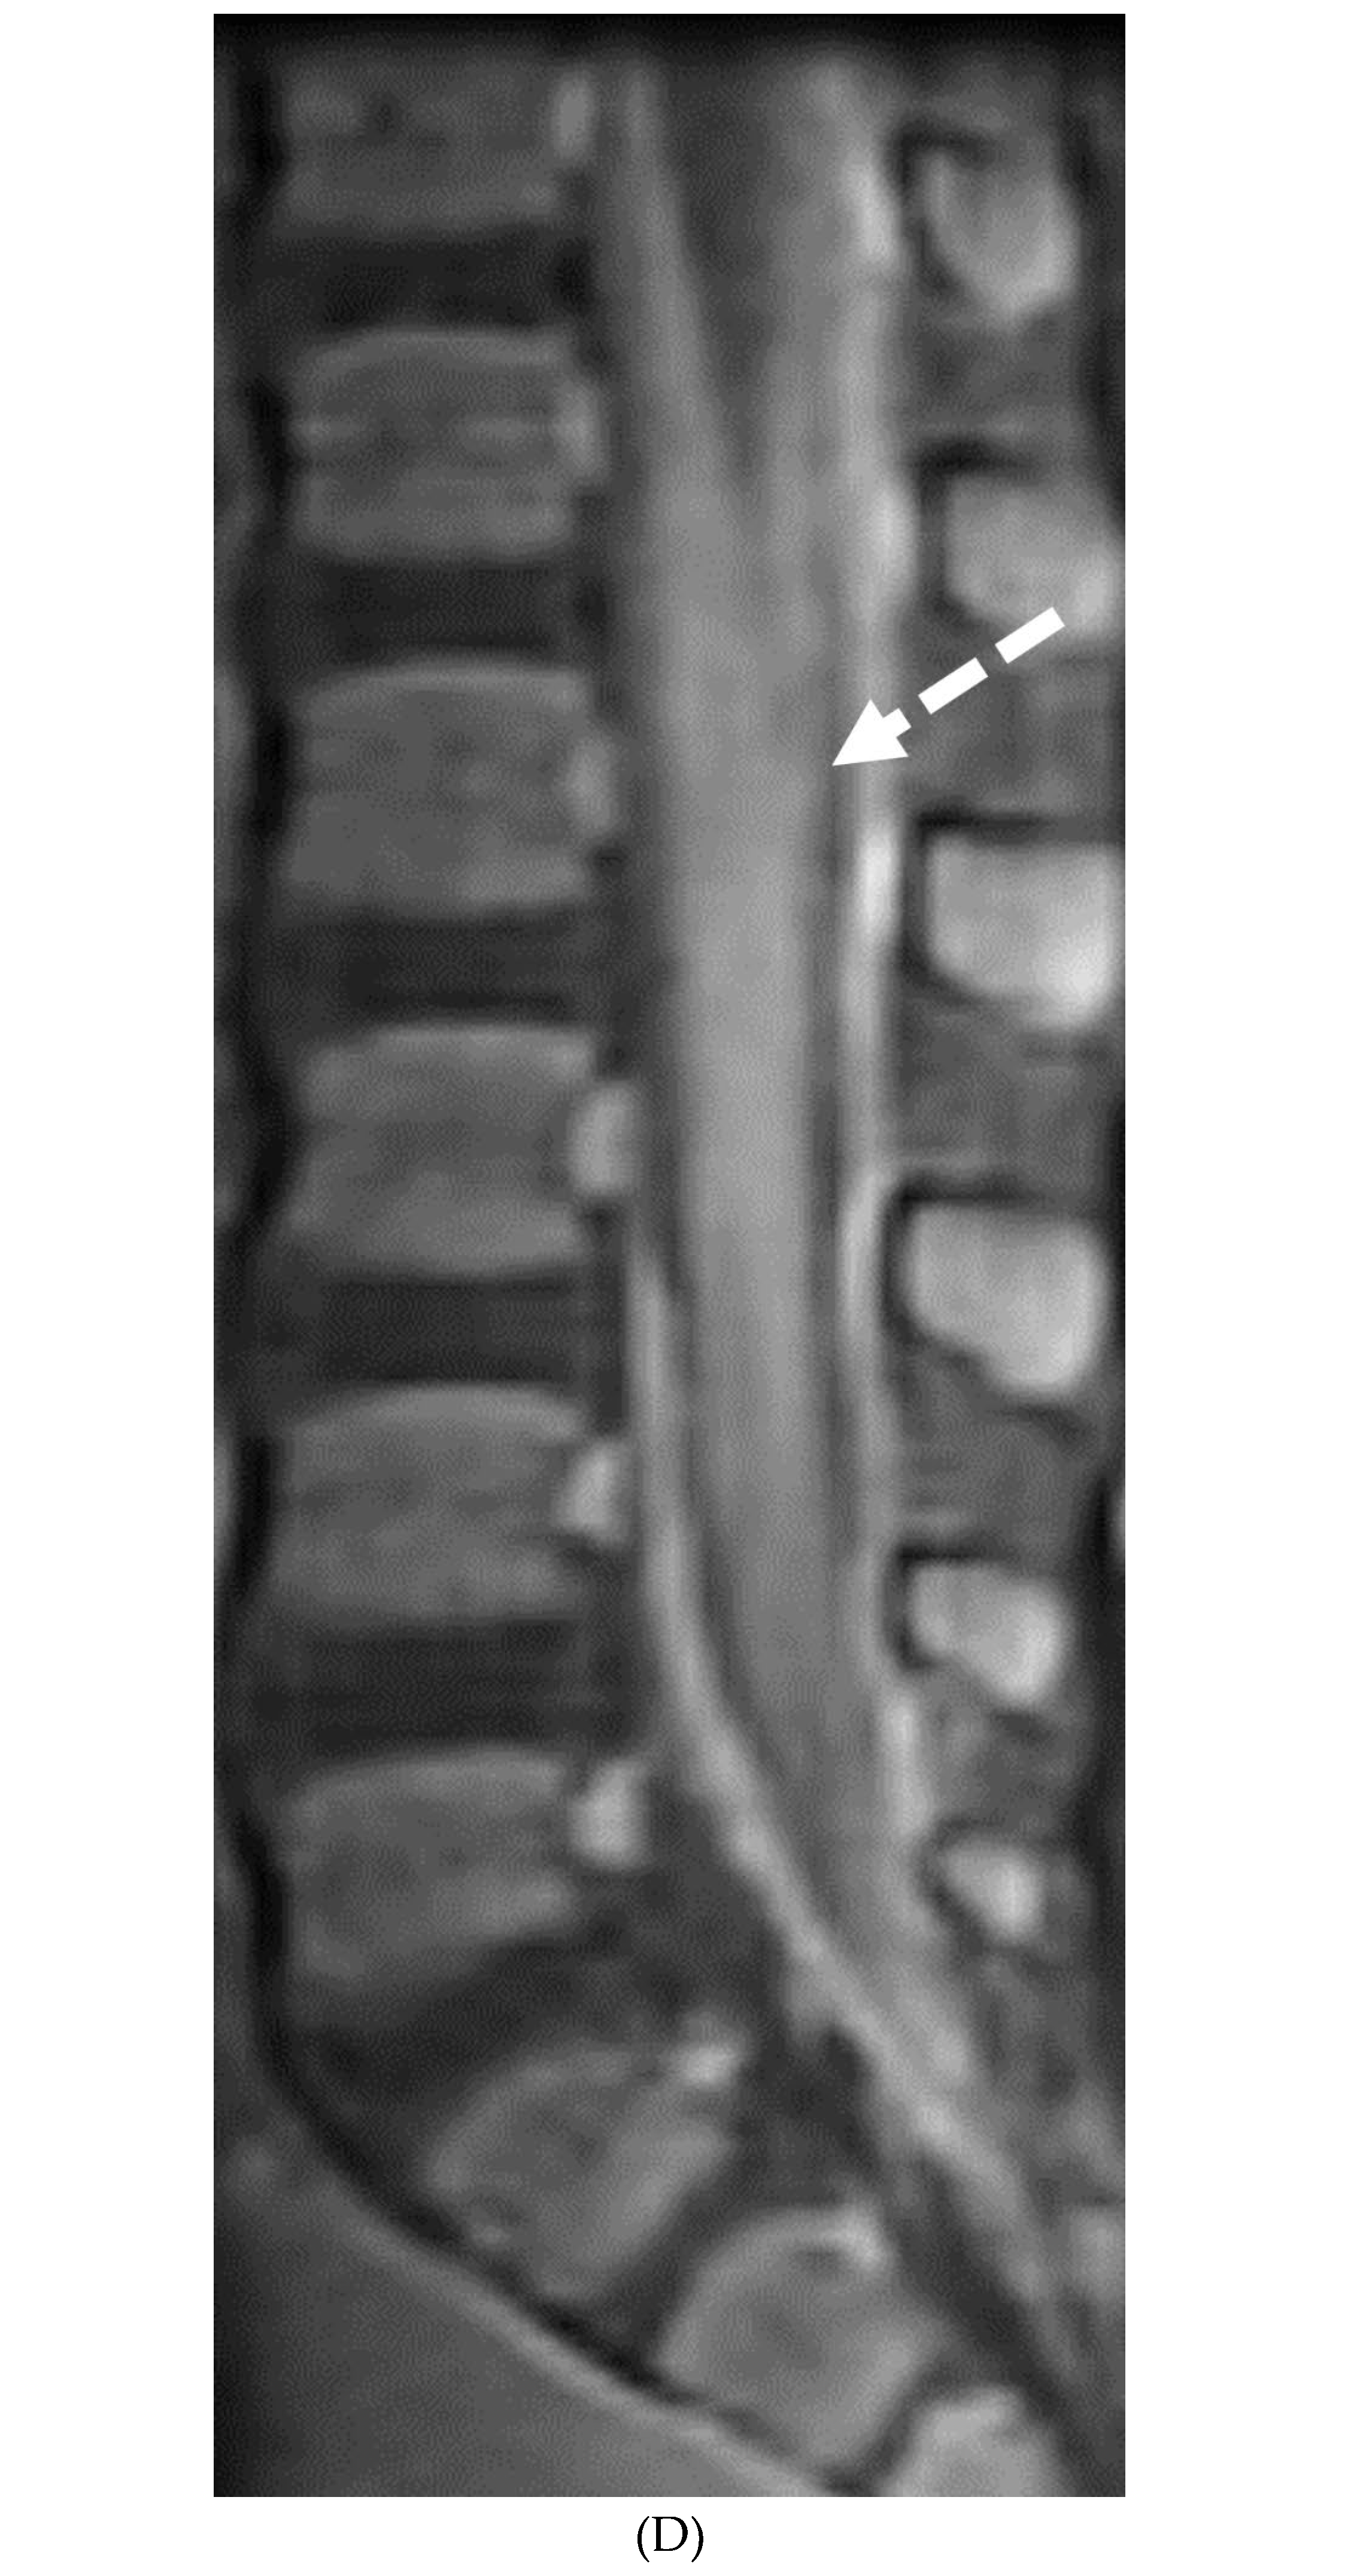
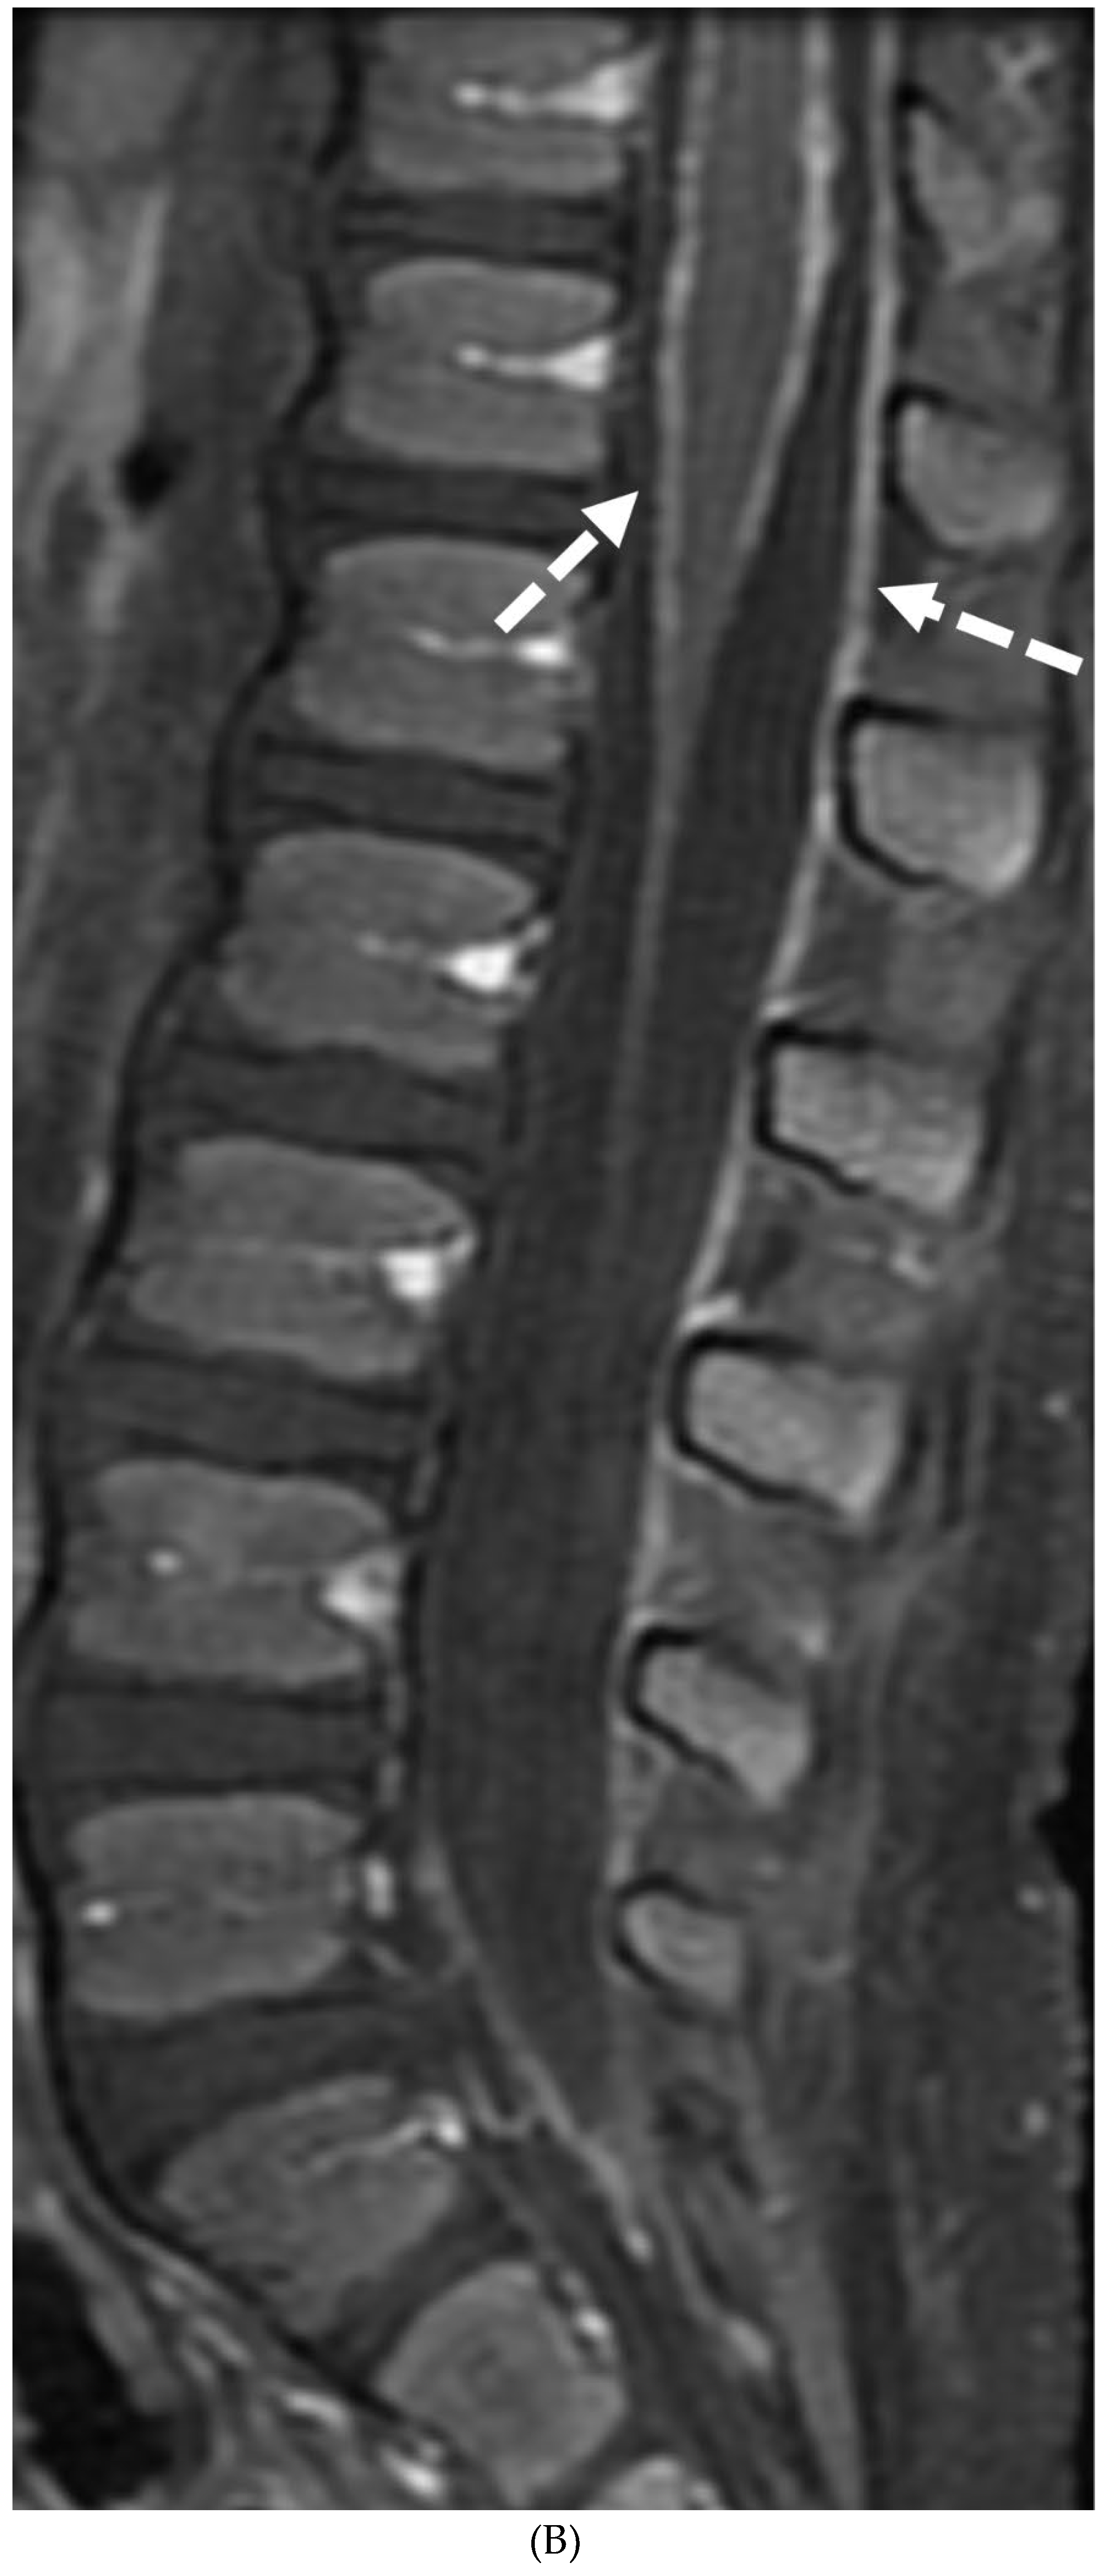
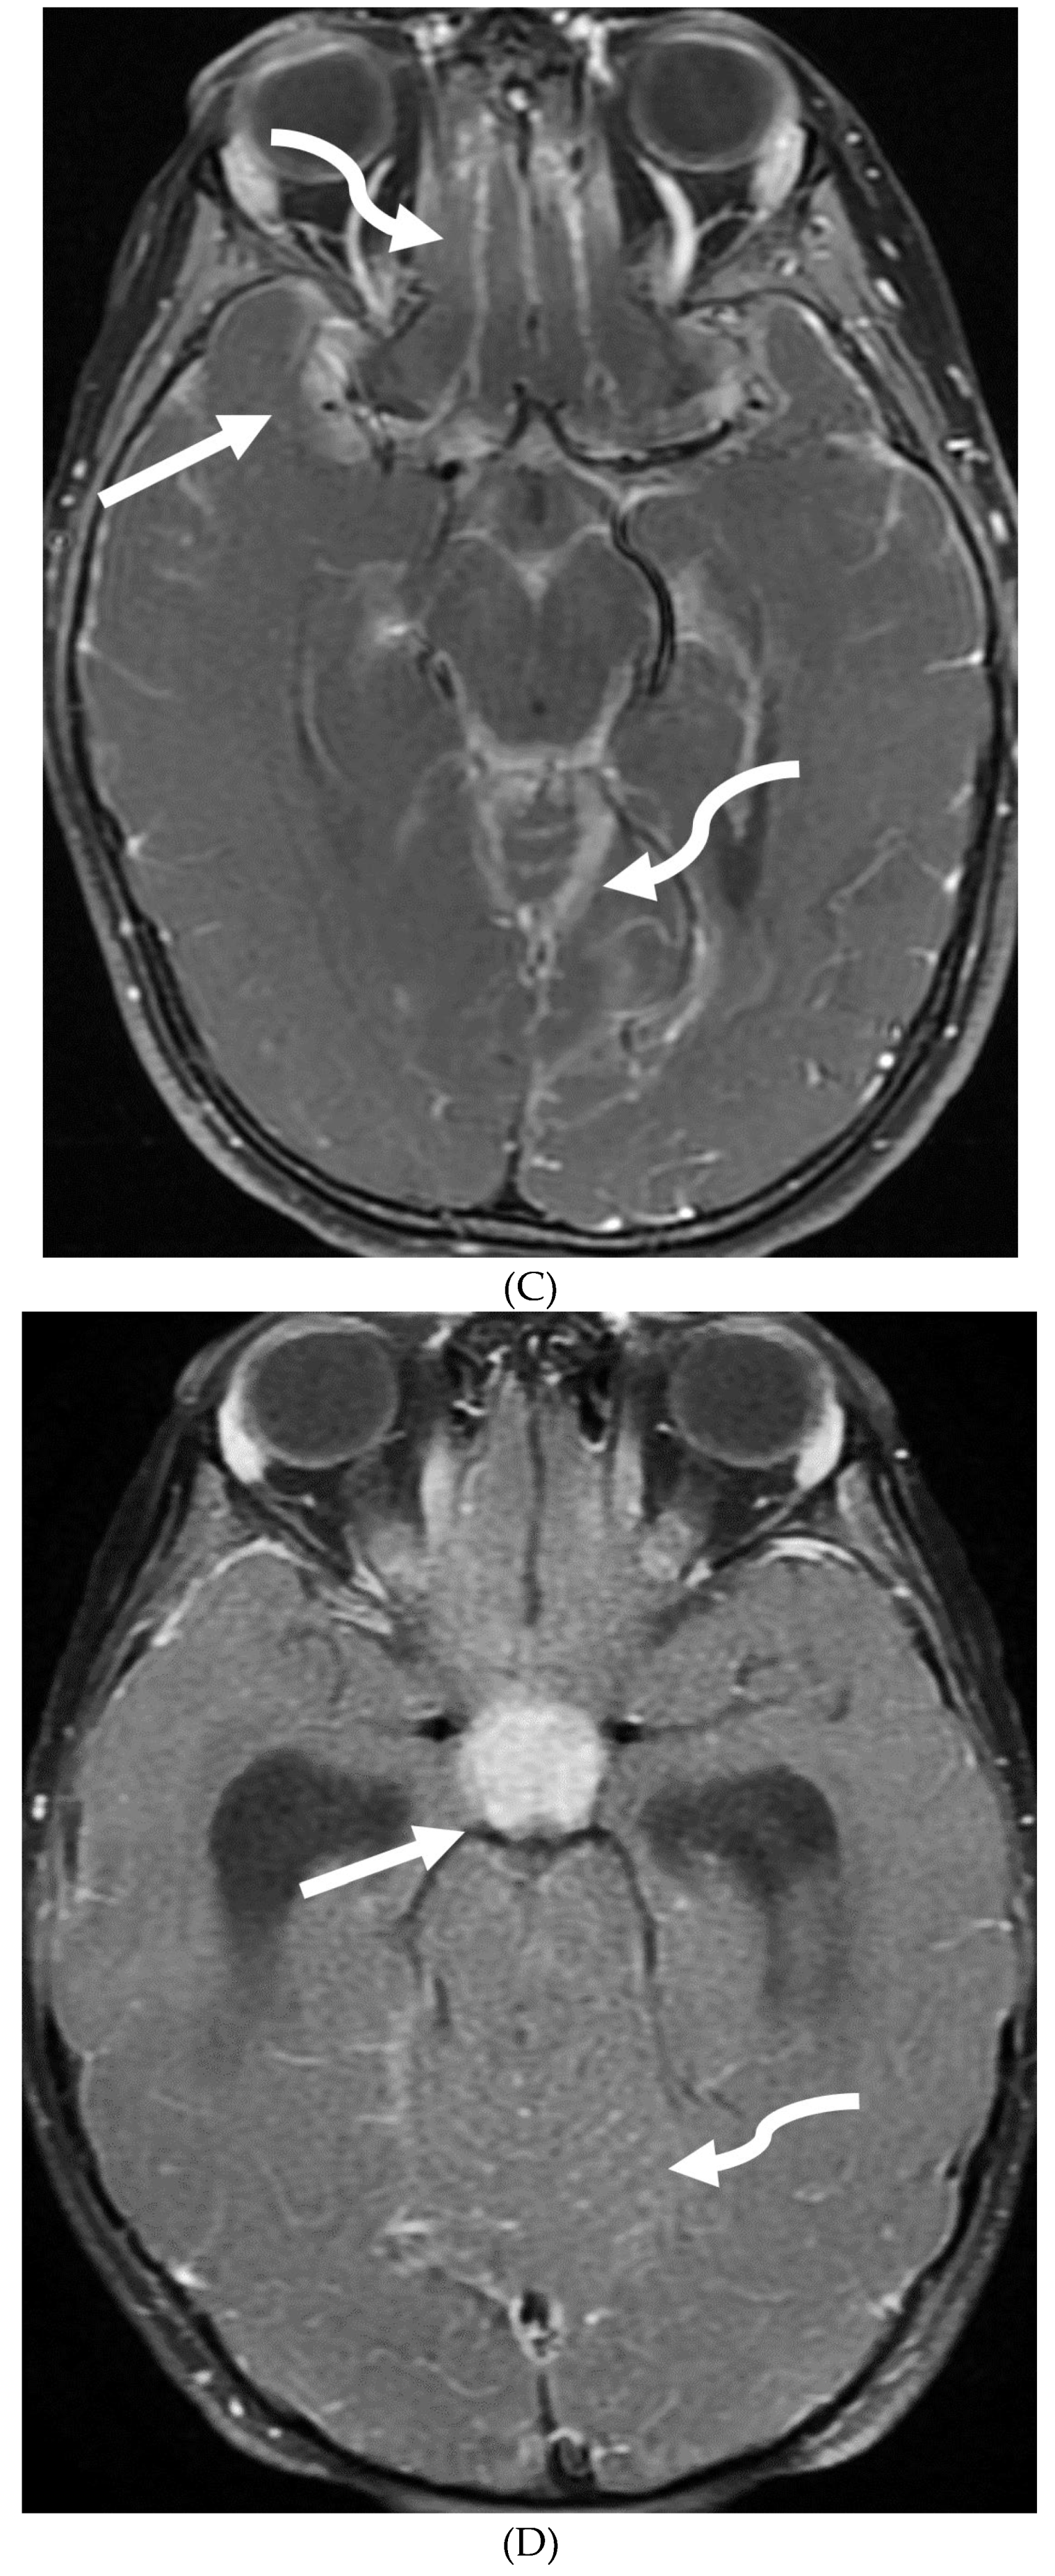
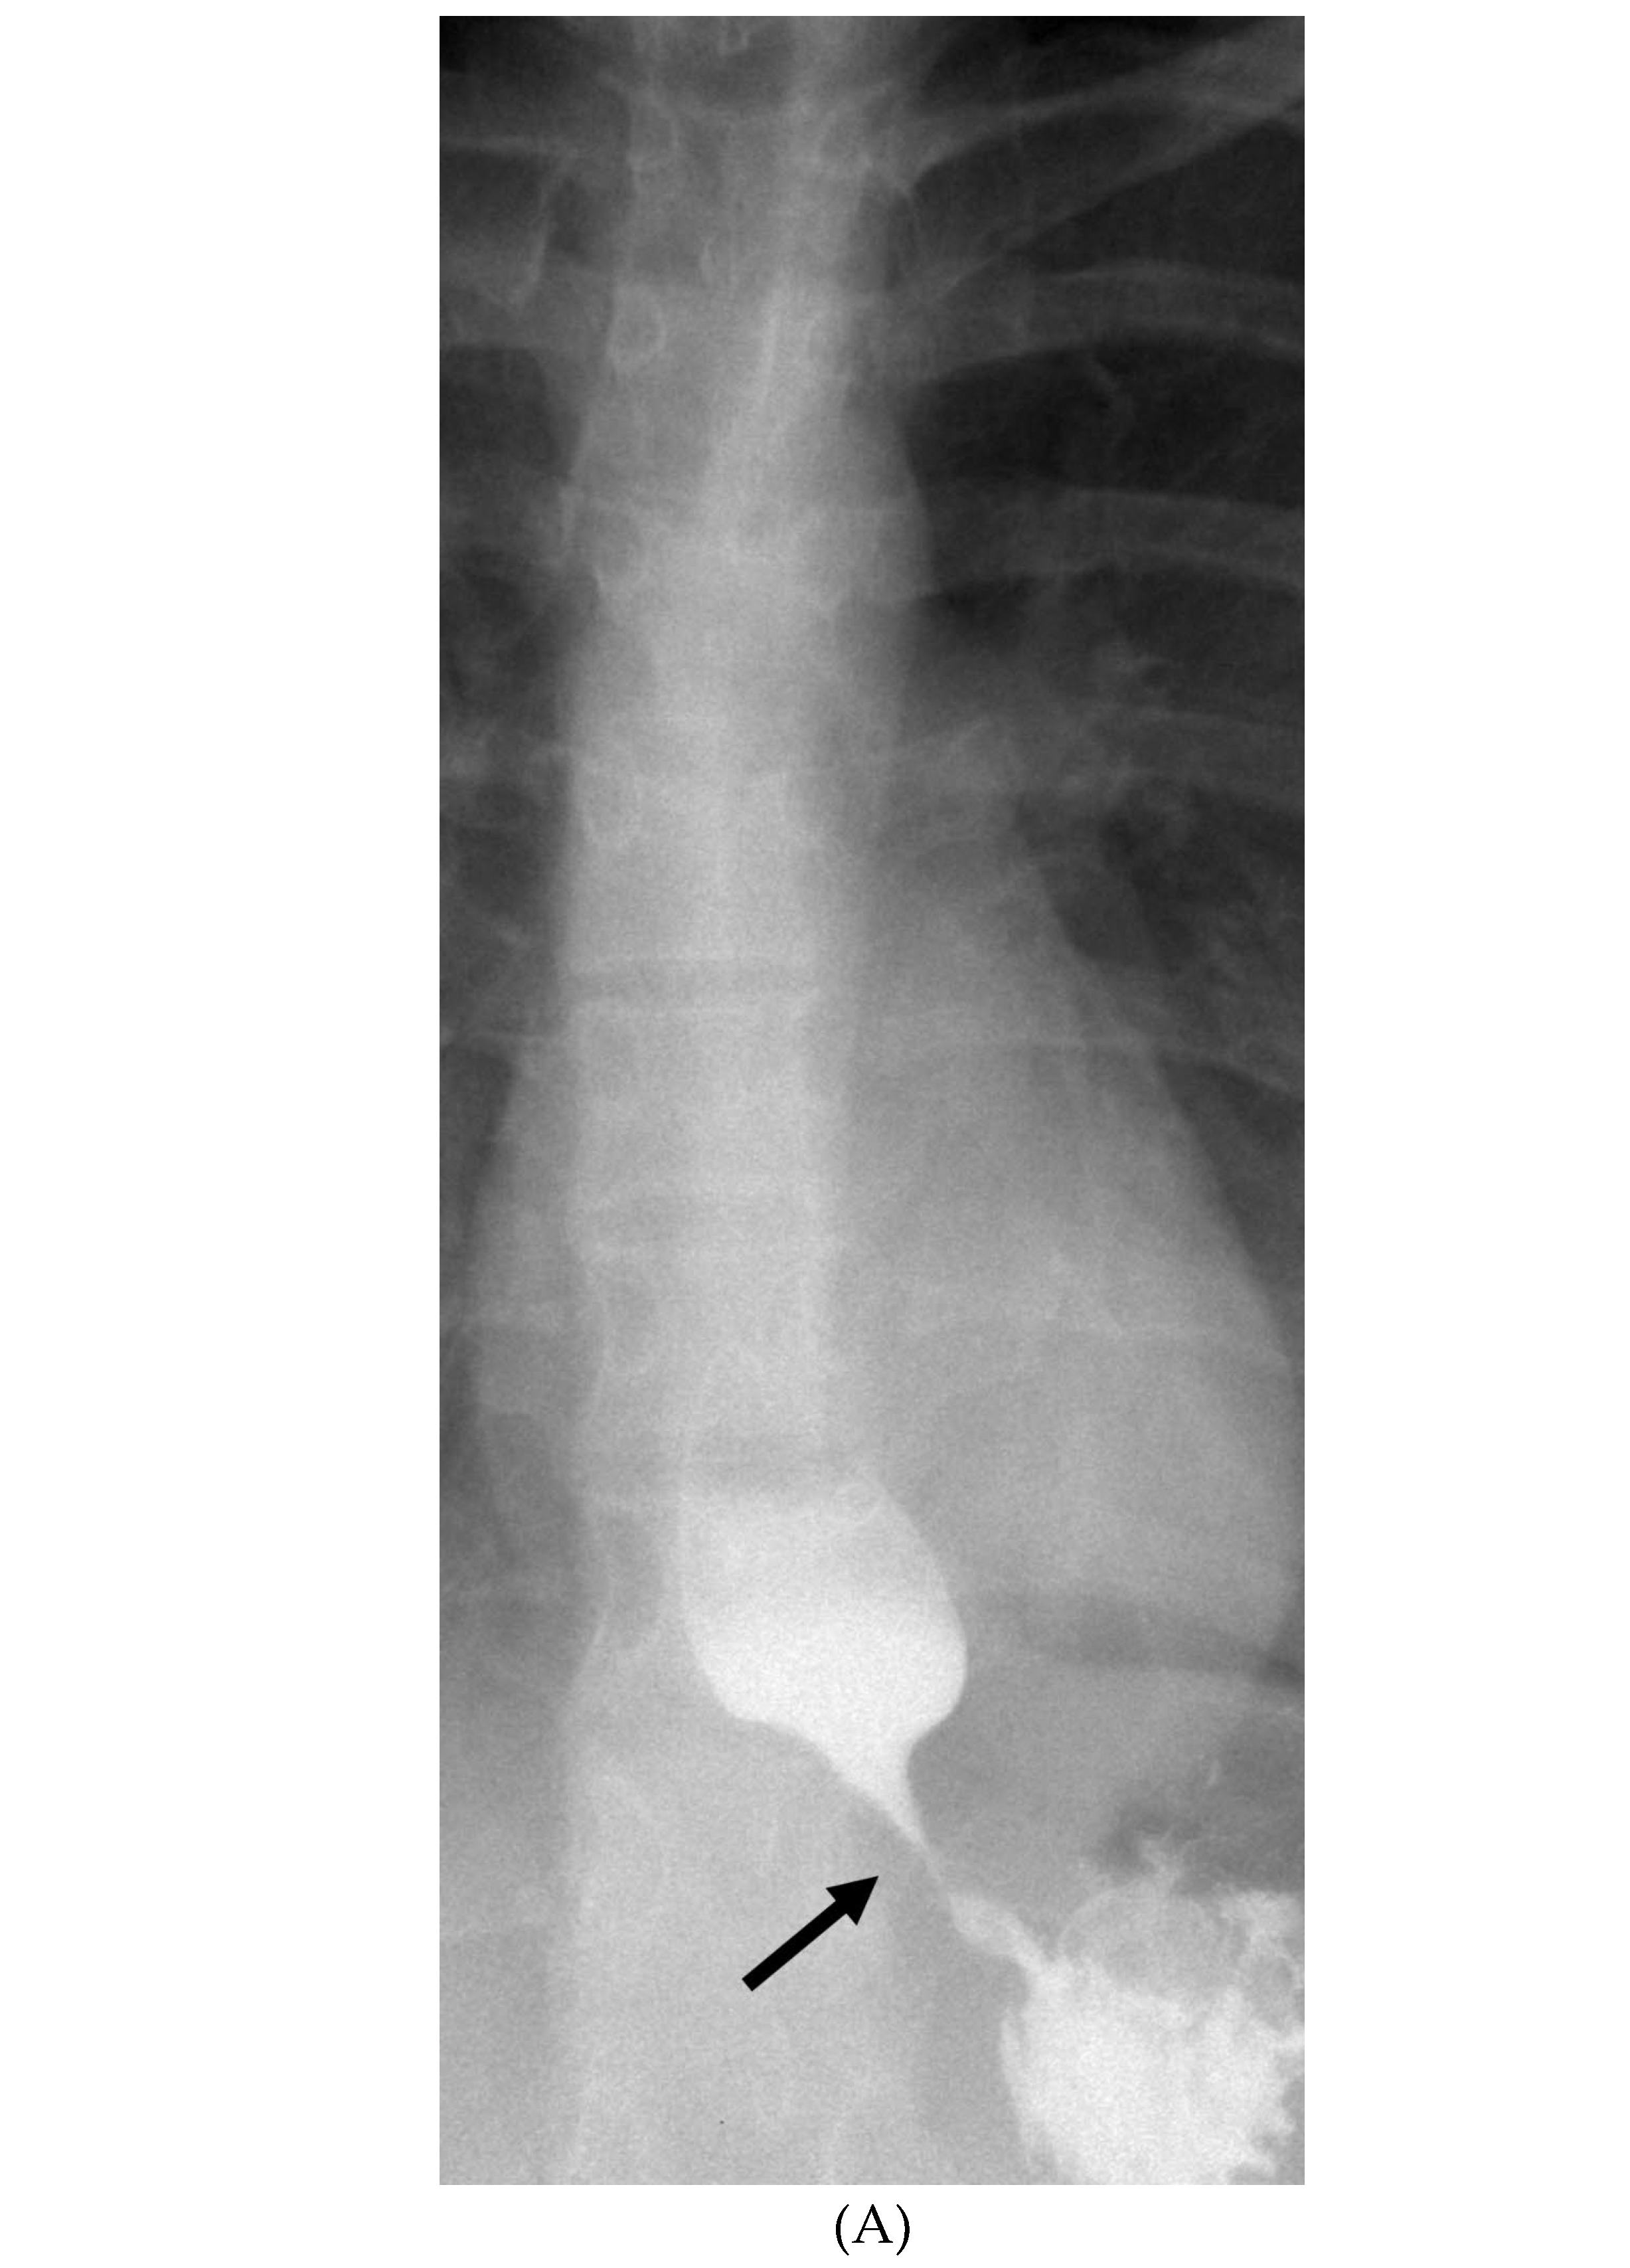
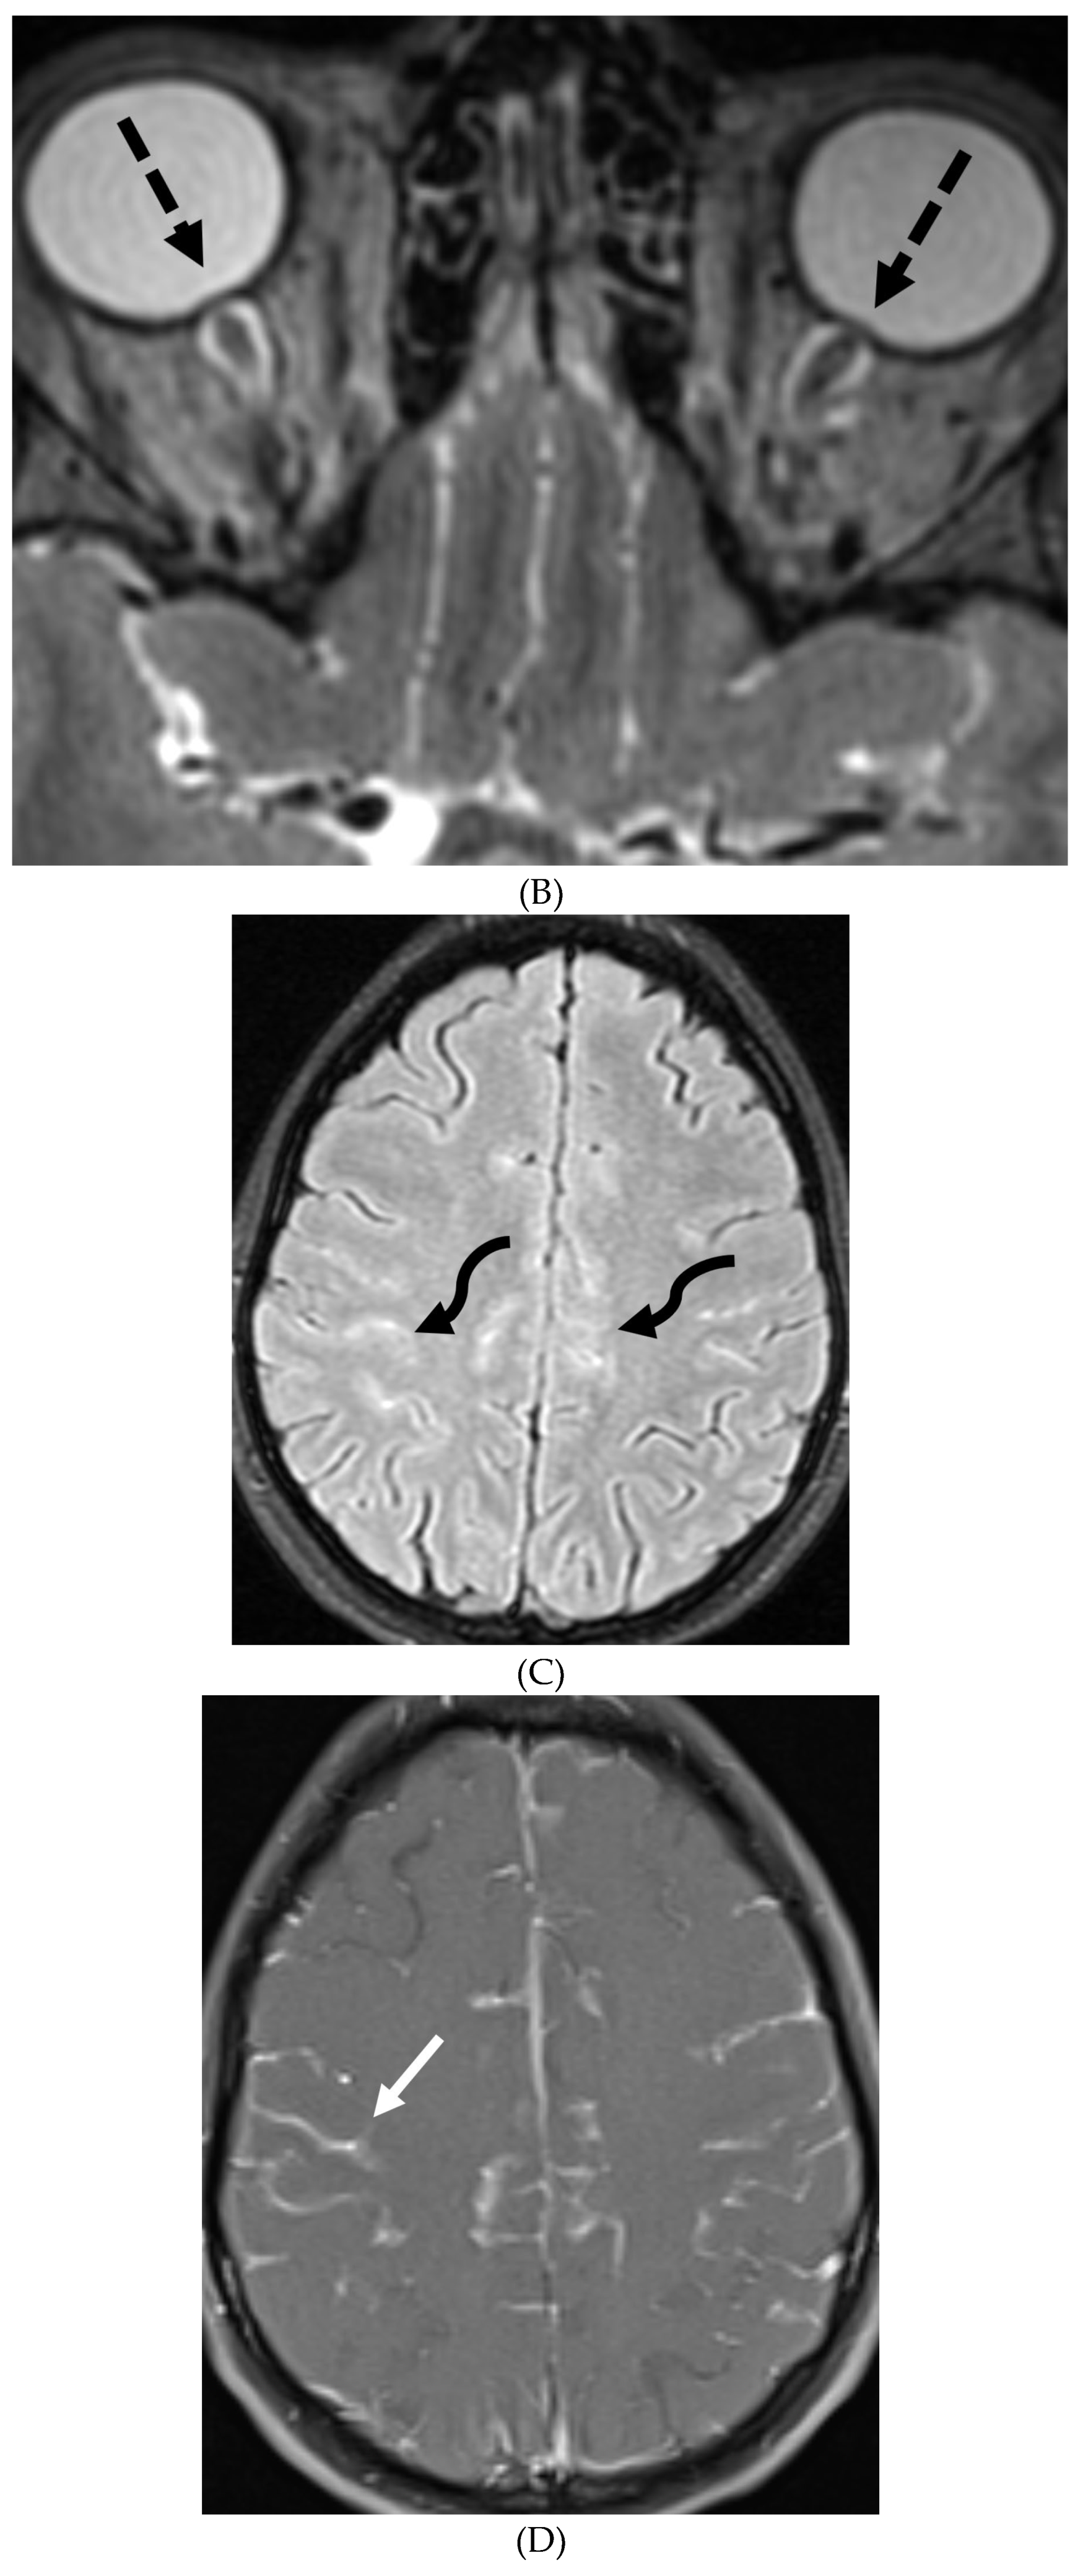
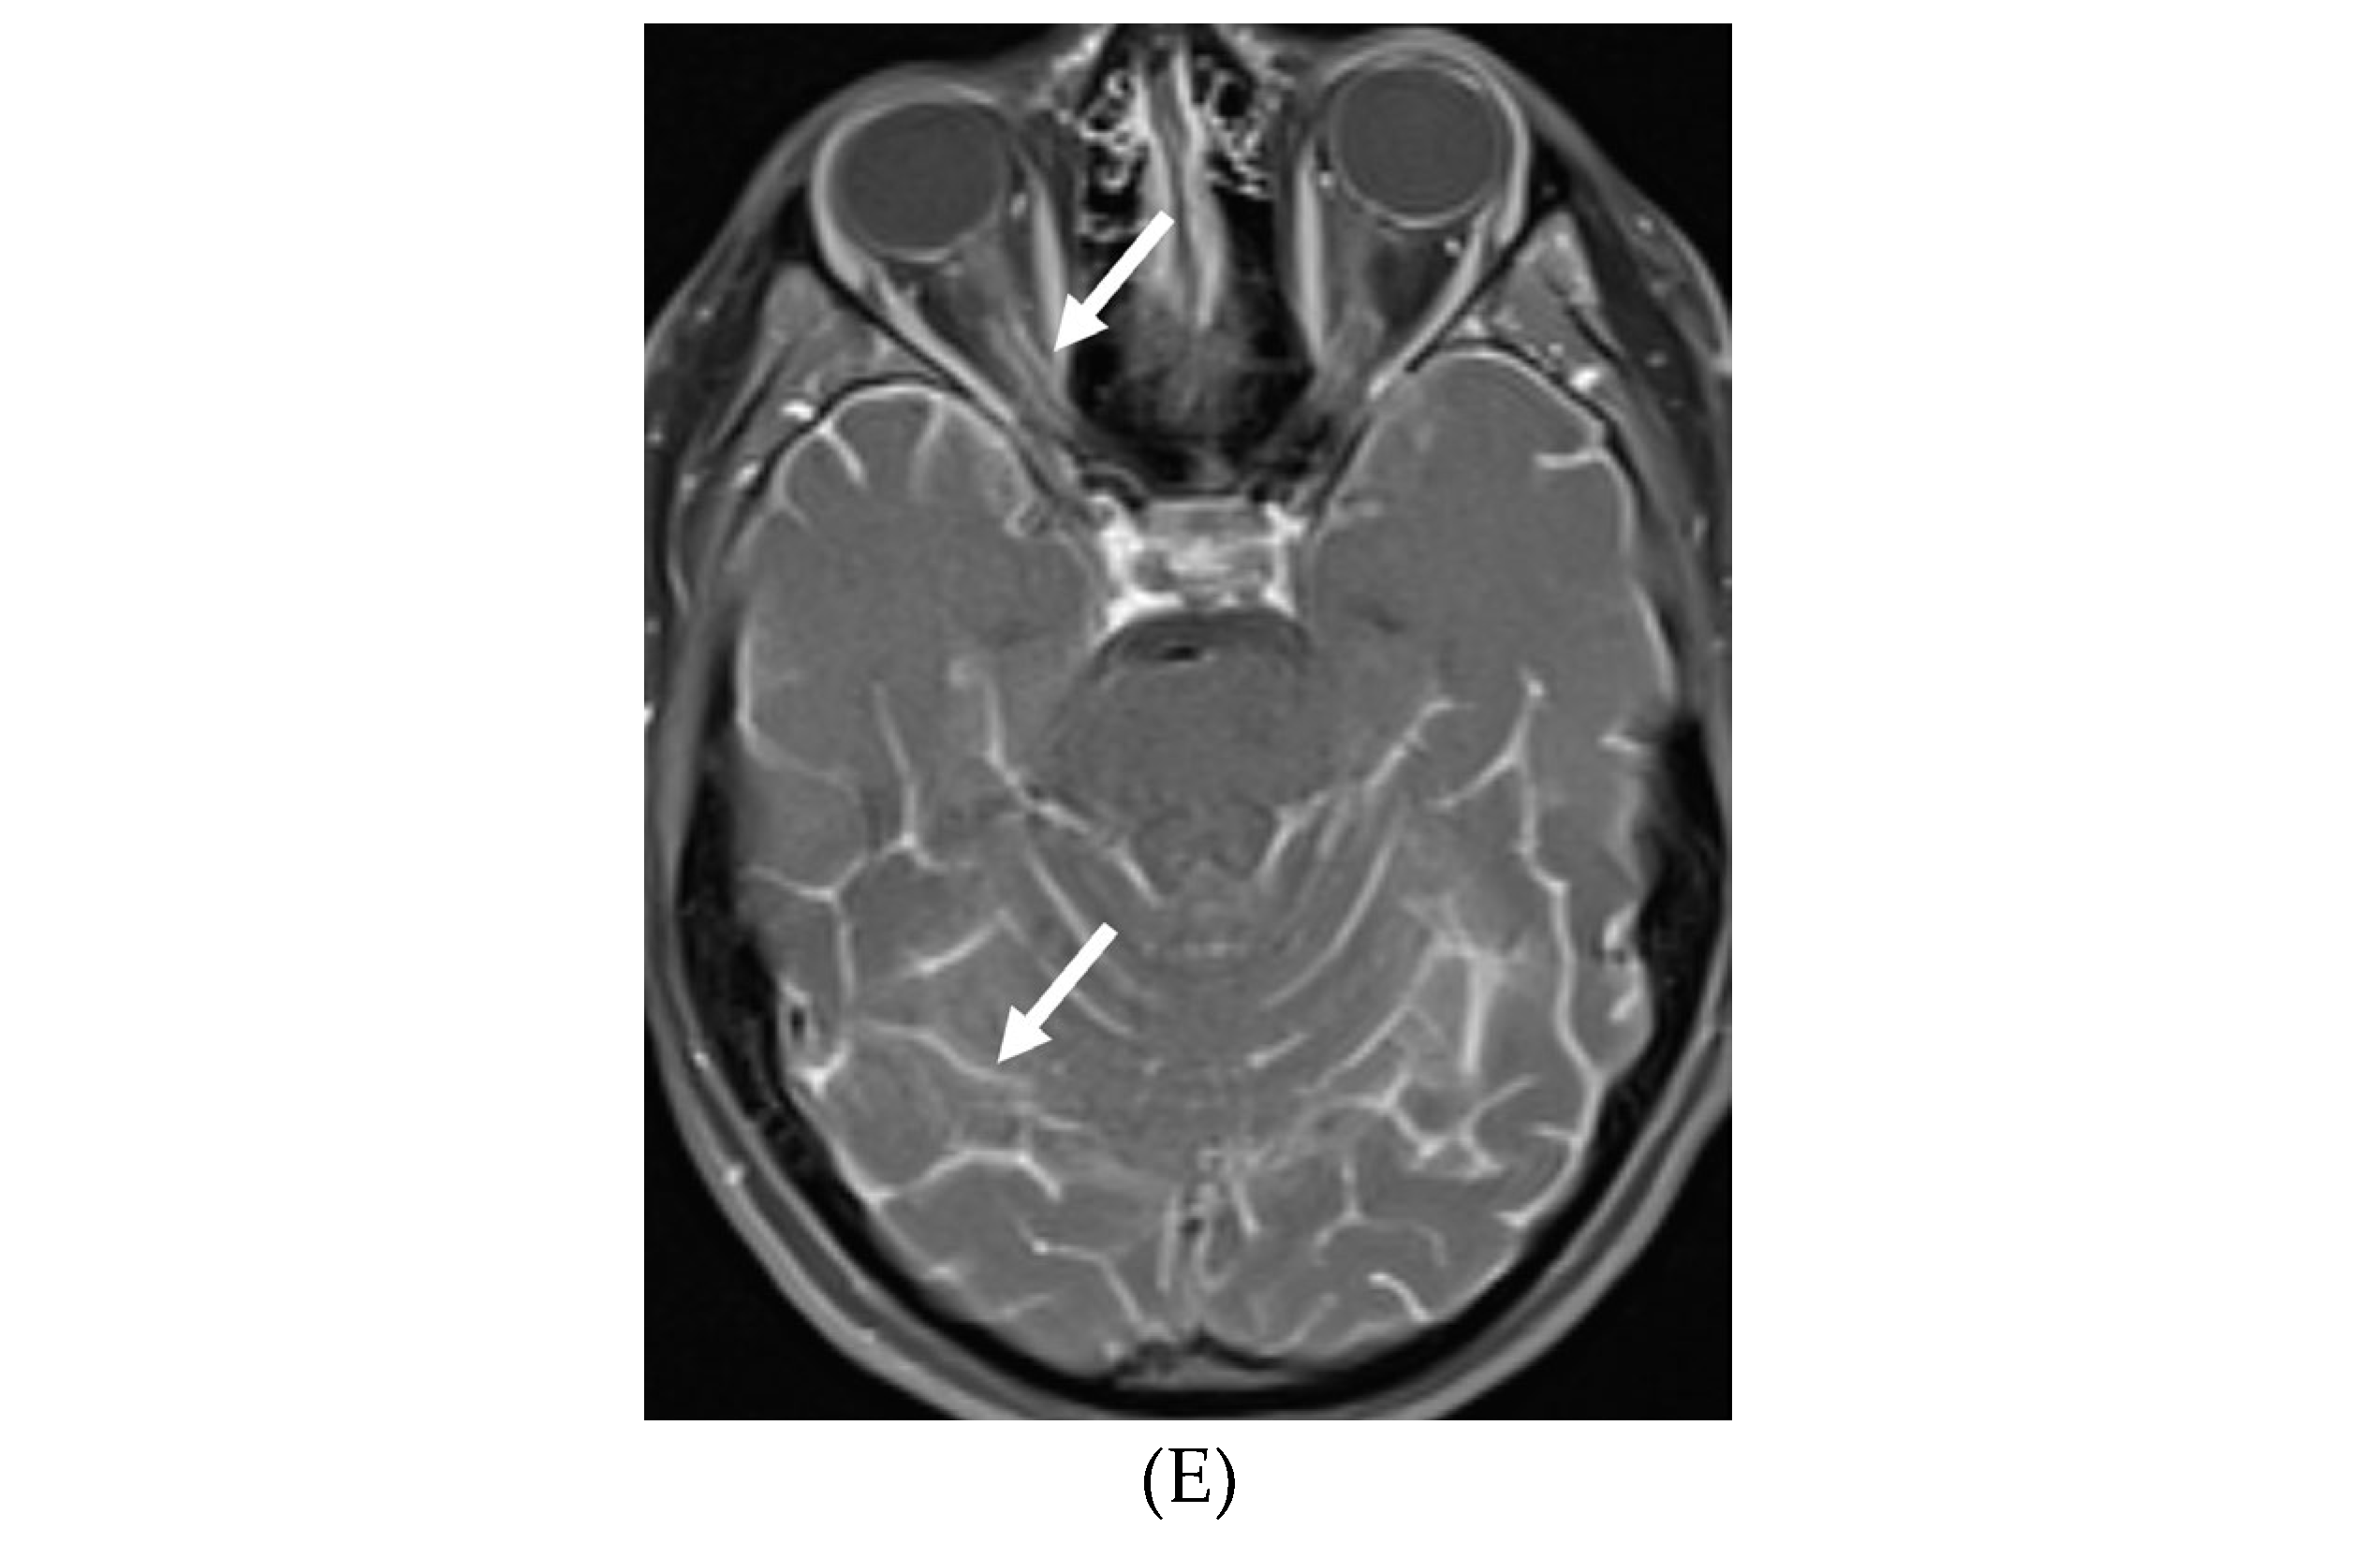
GUILLAIN BARRE SYNDROME
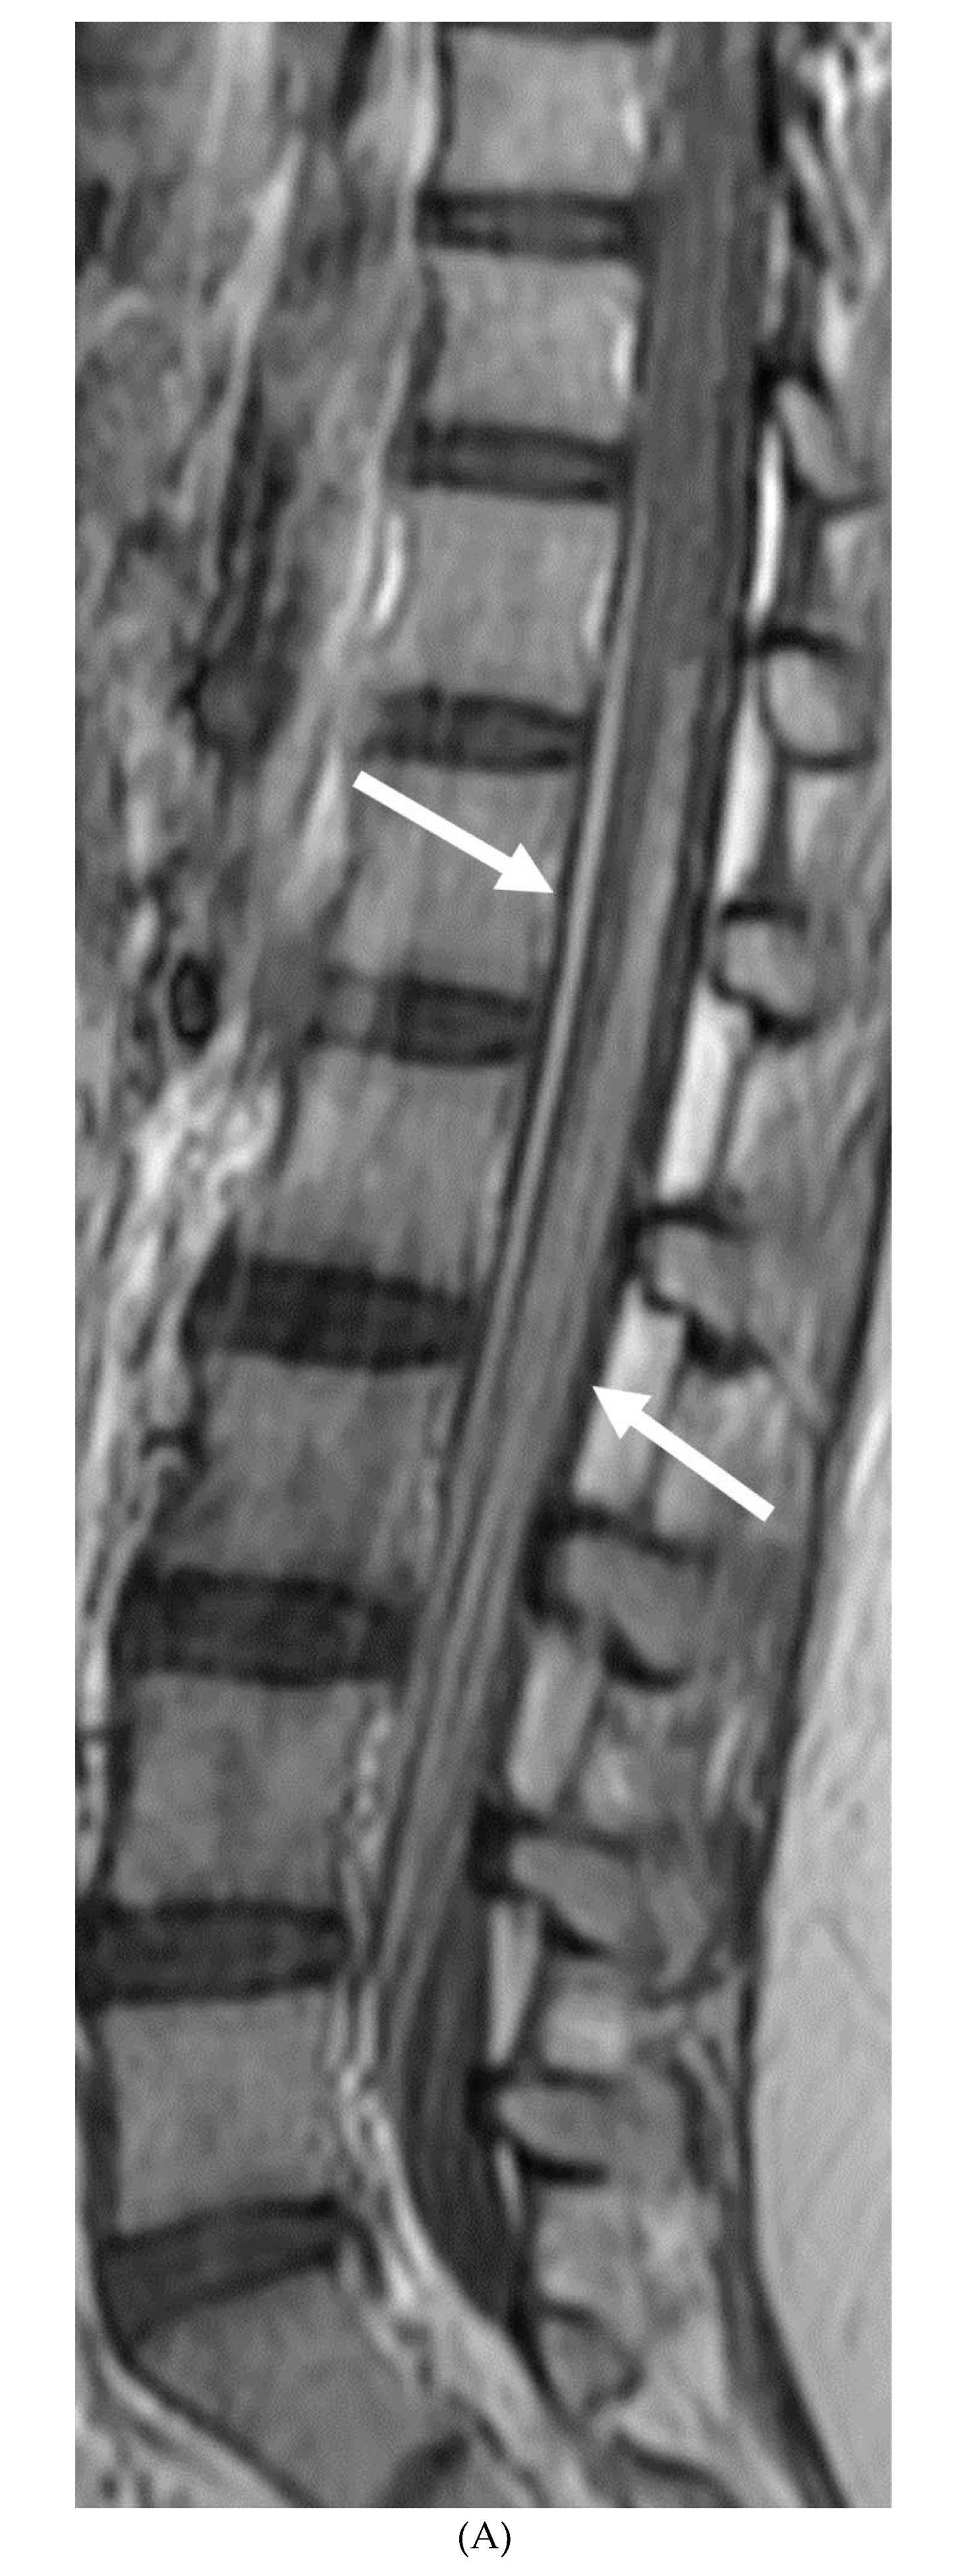
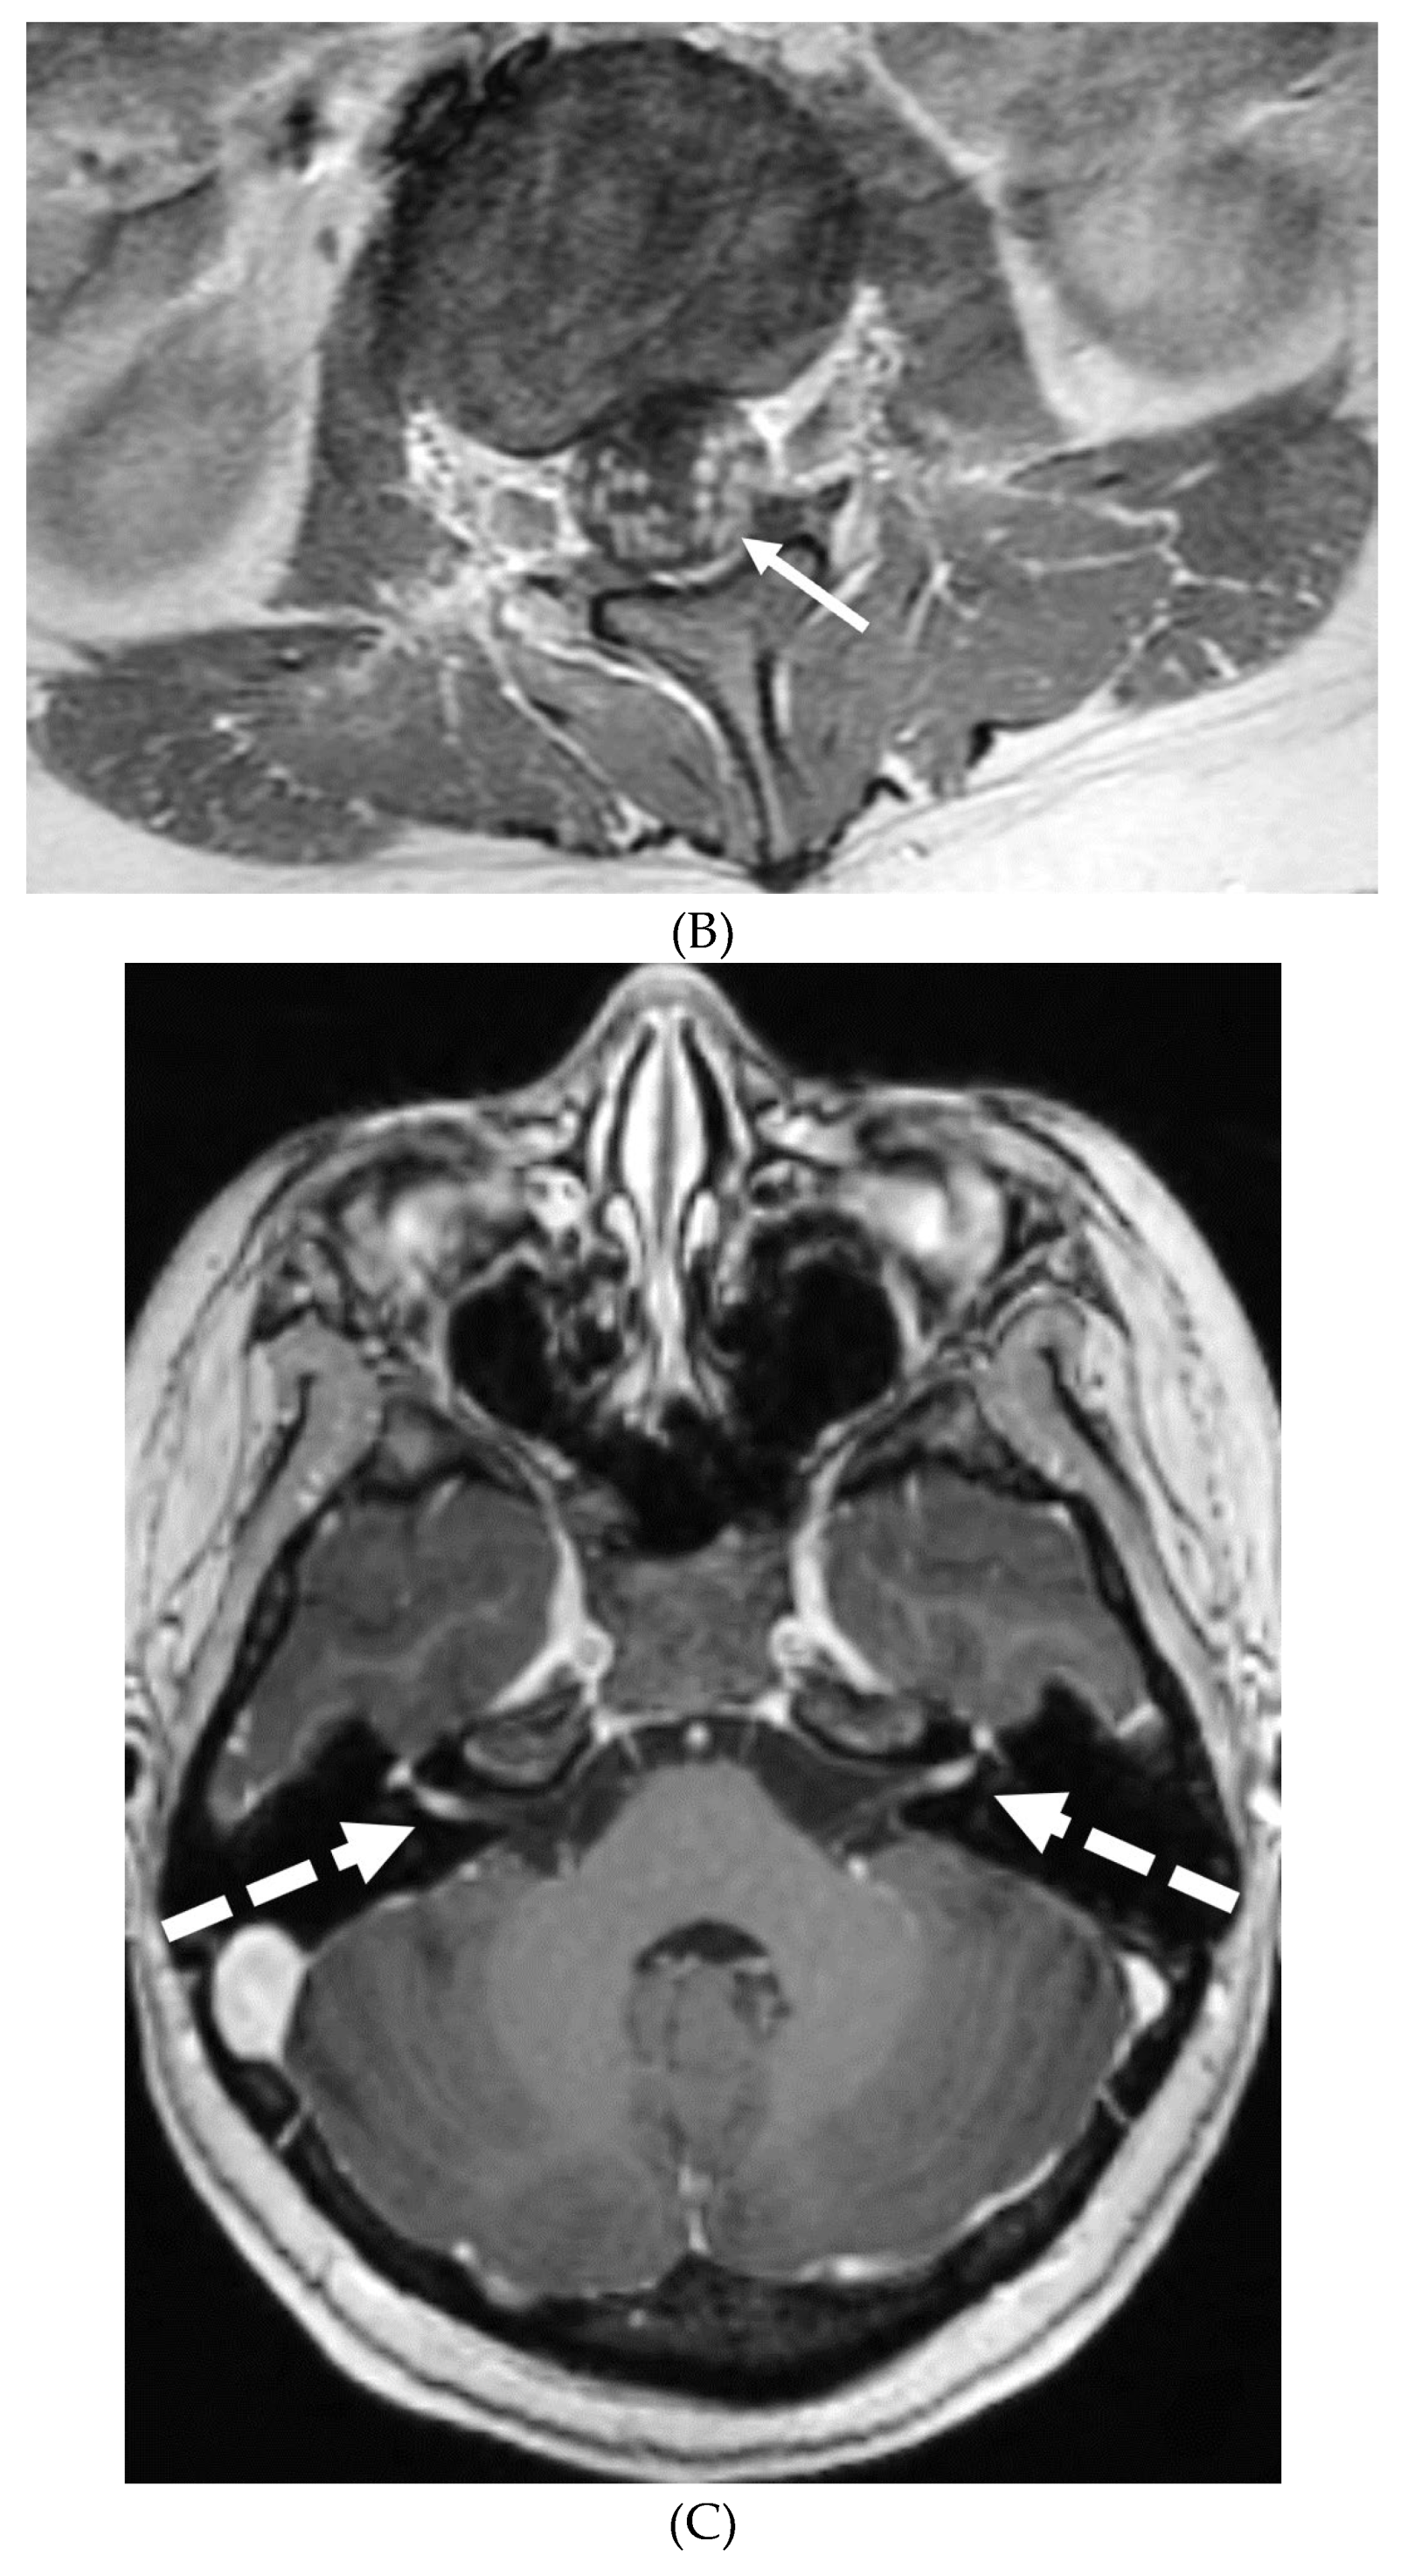
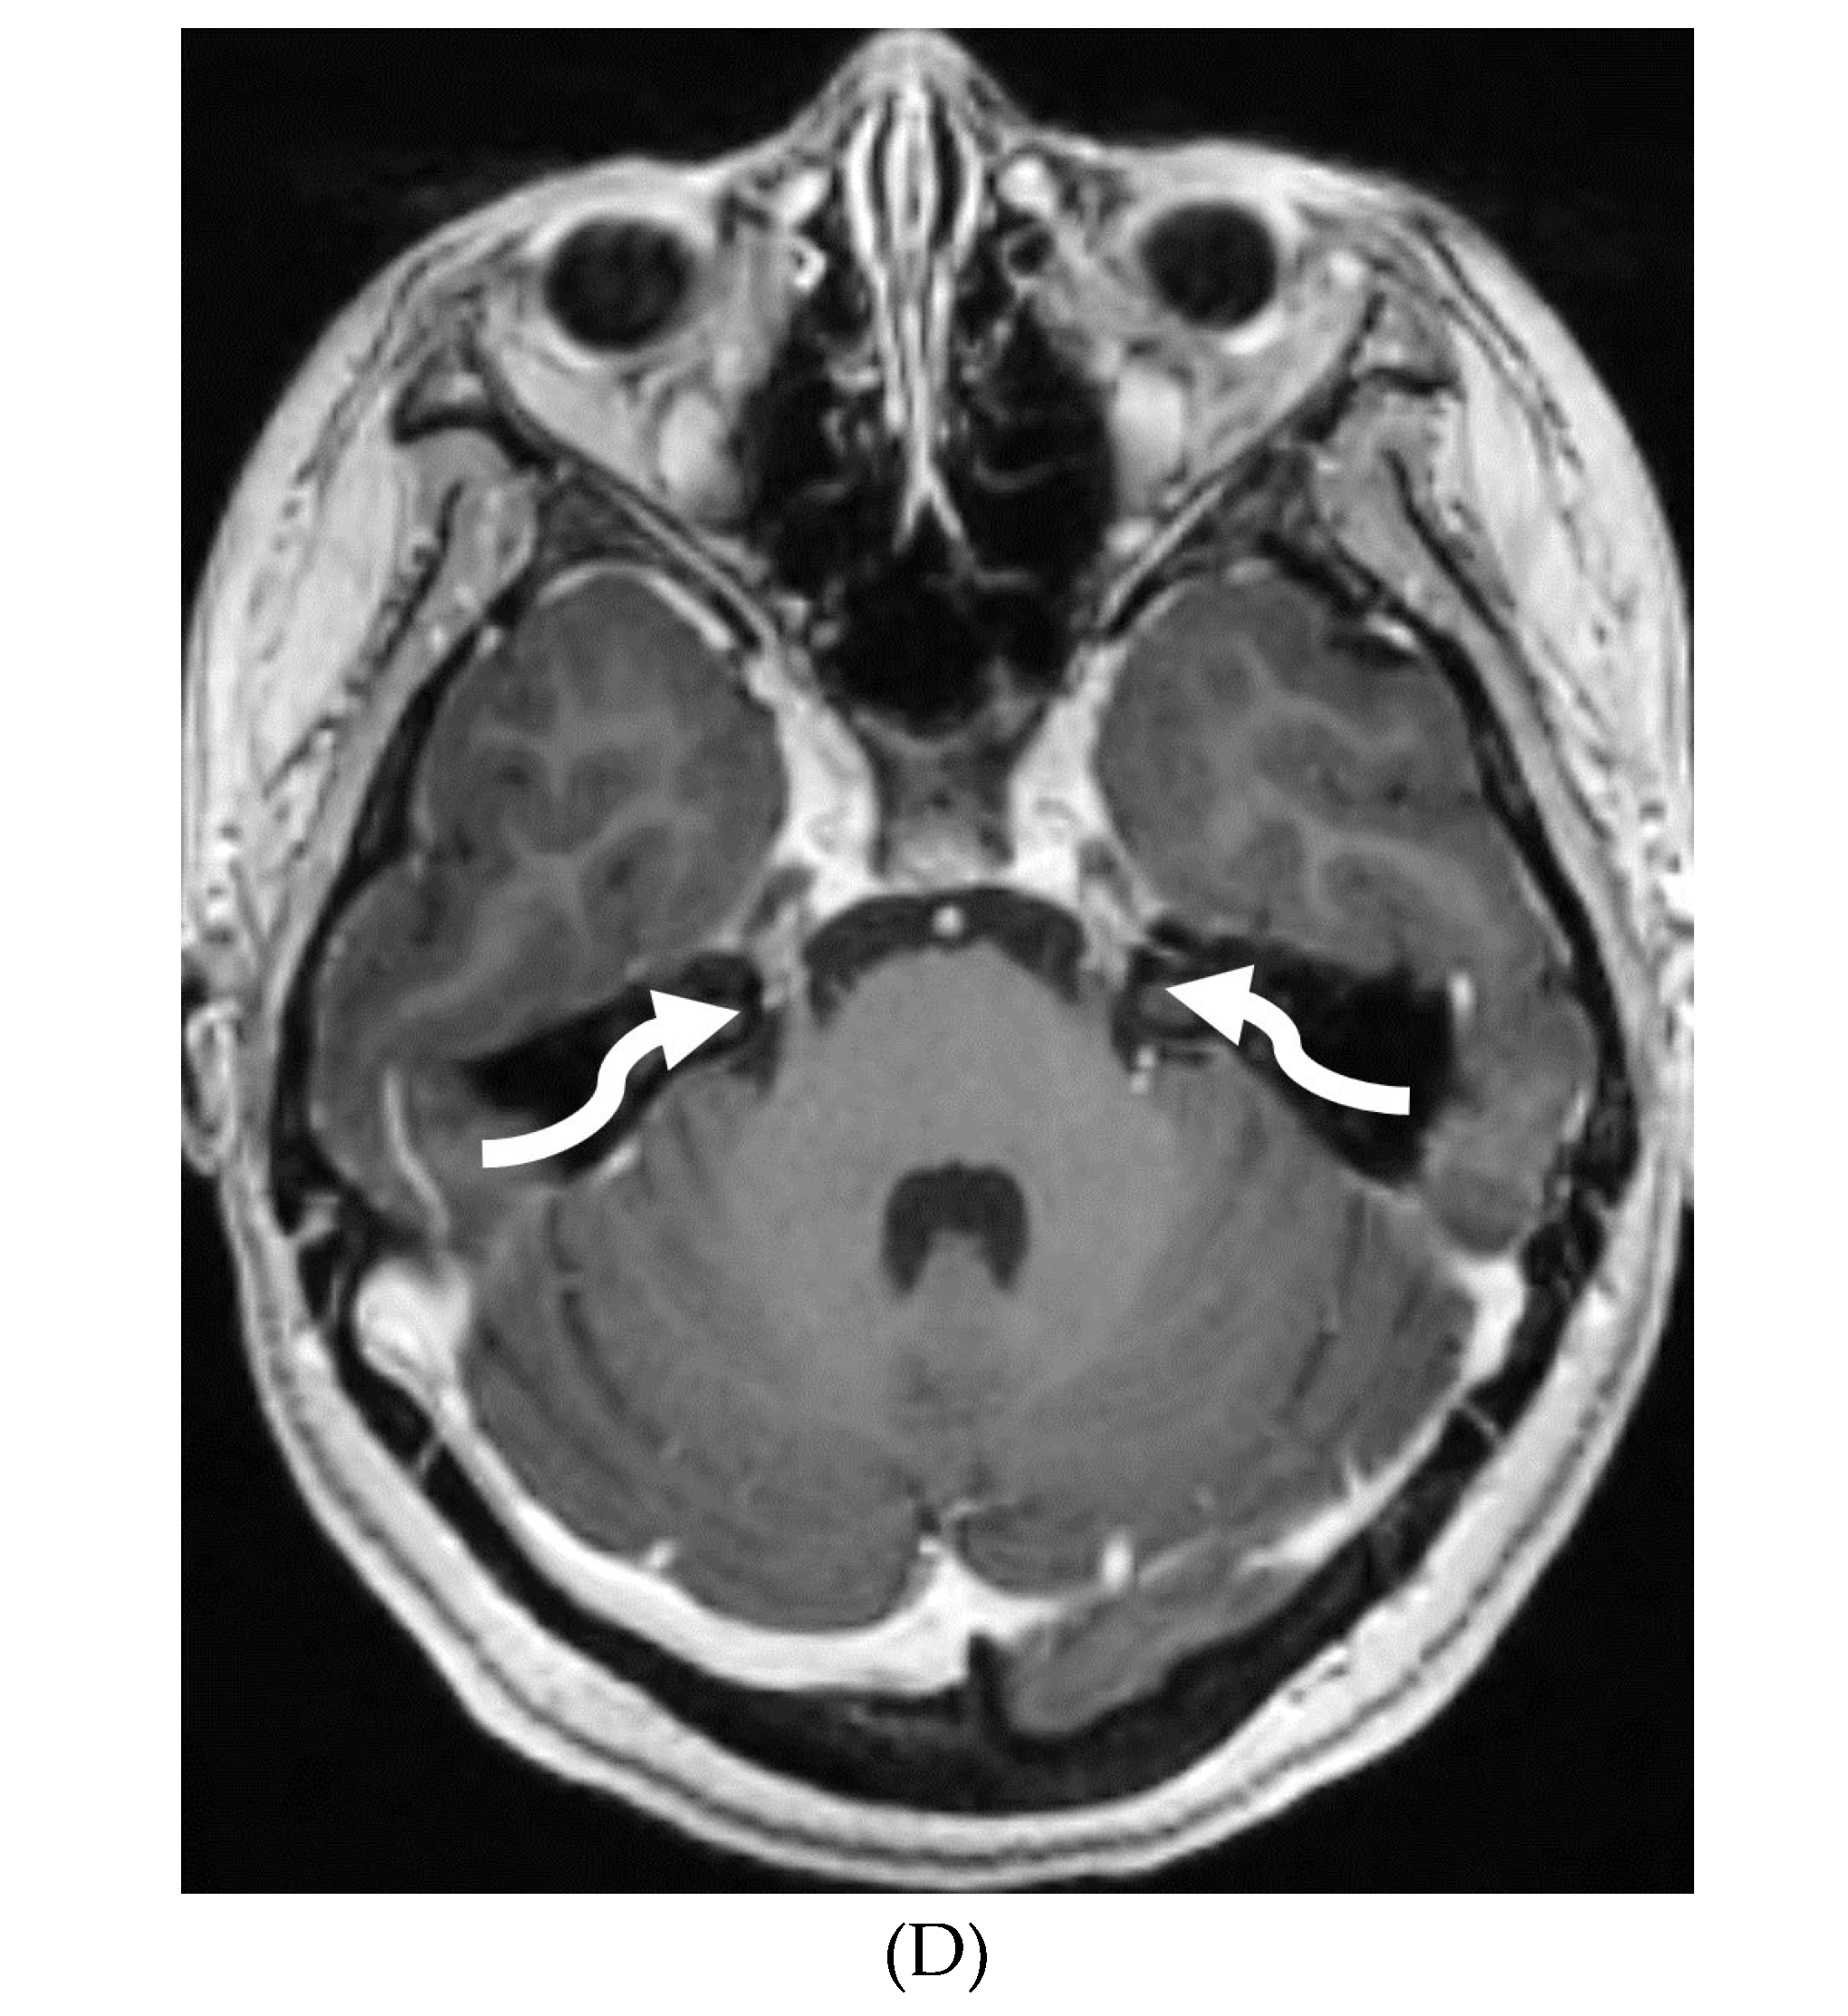
IDIOPATHIC HYPERTROPHIC MENINGITIS (IHP)
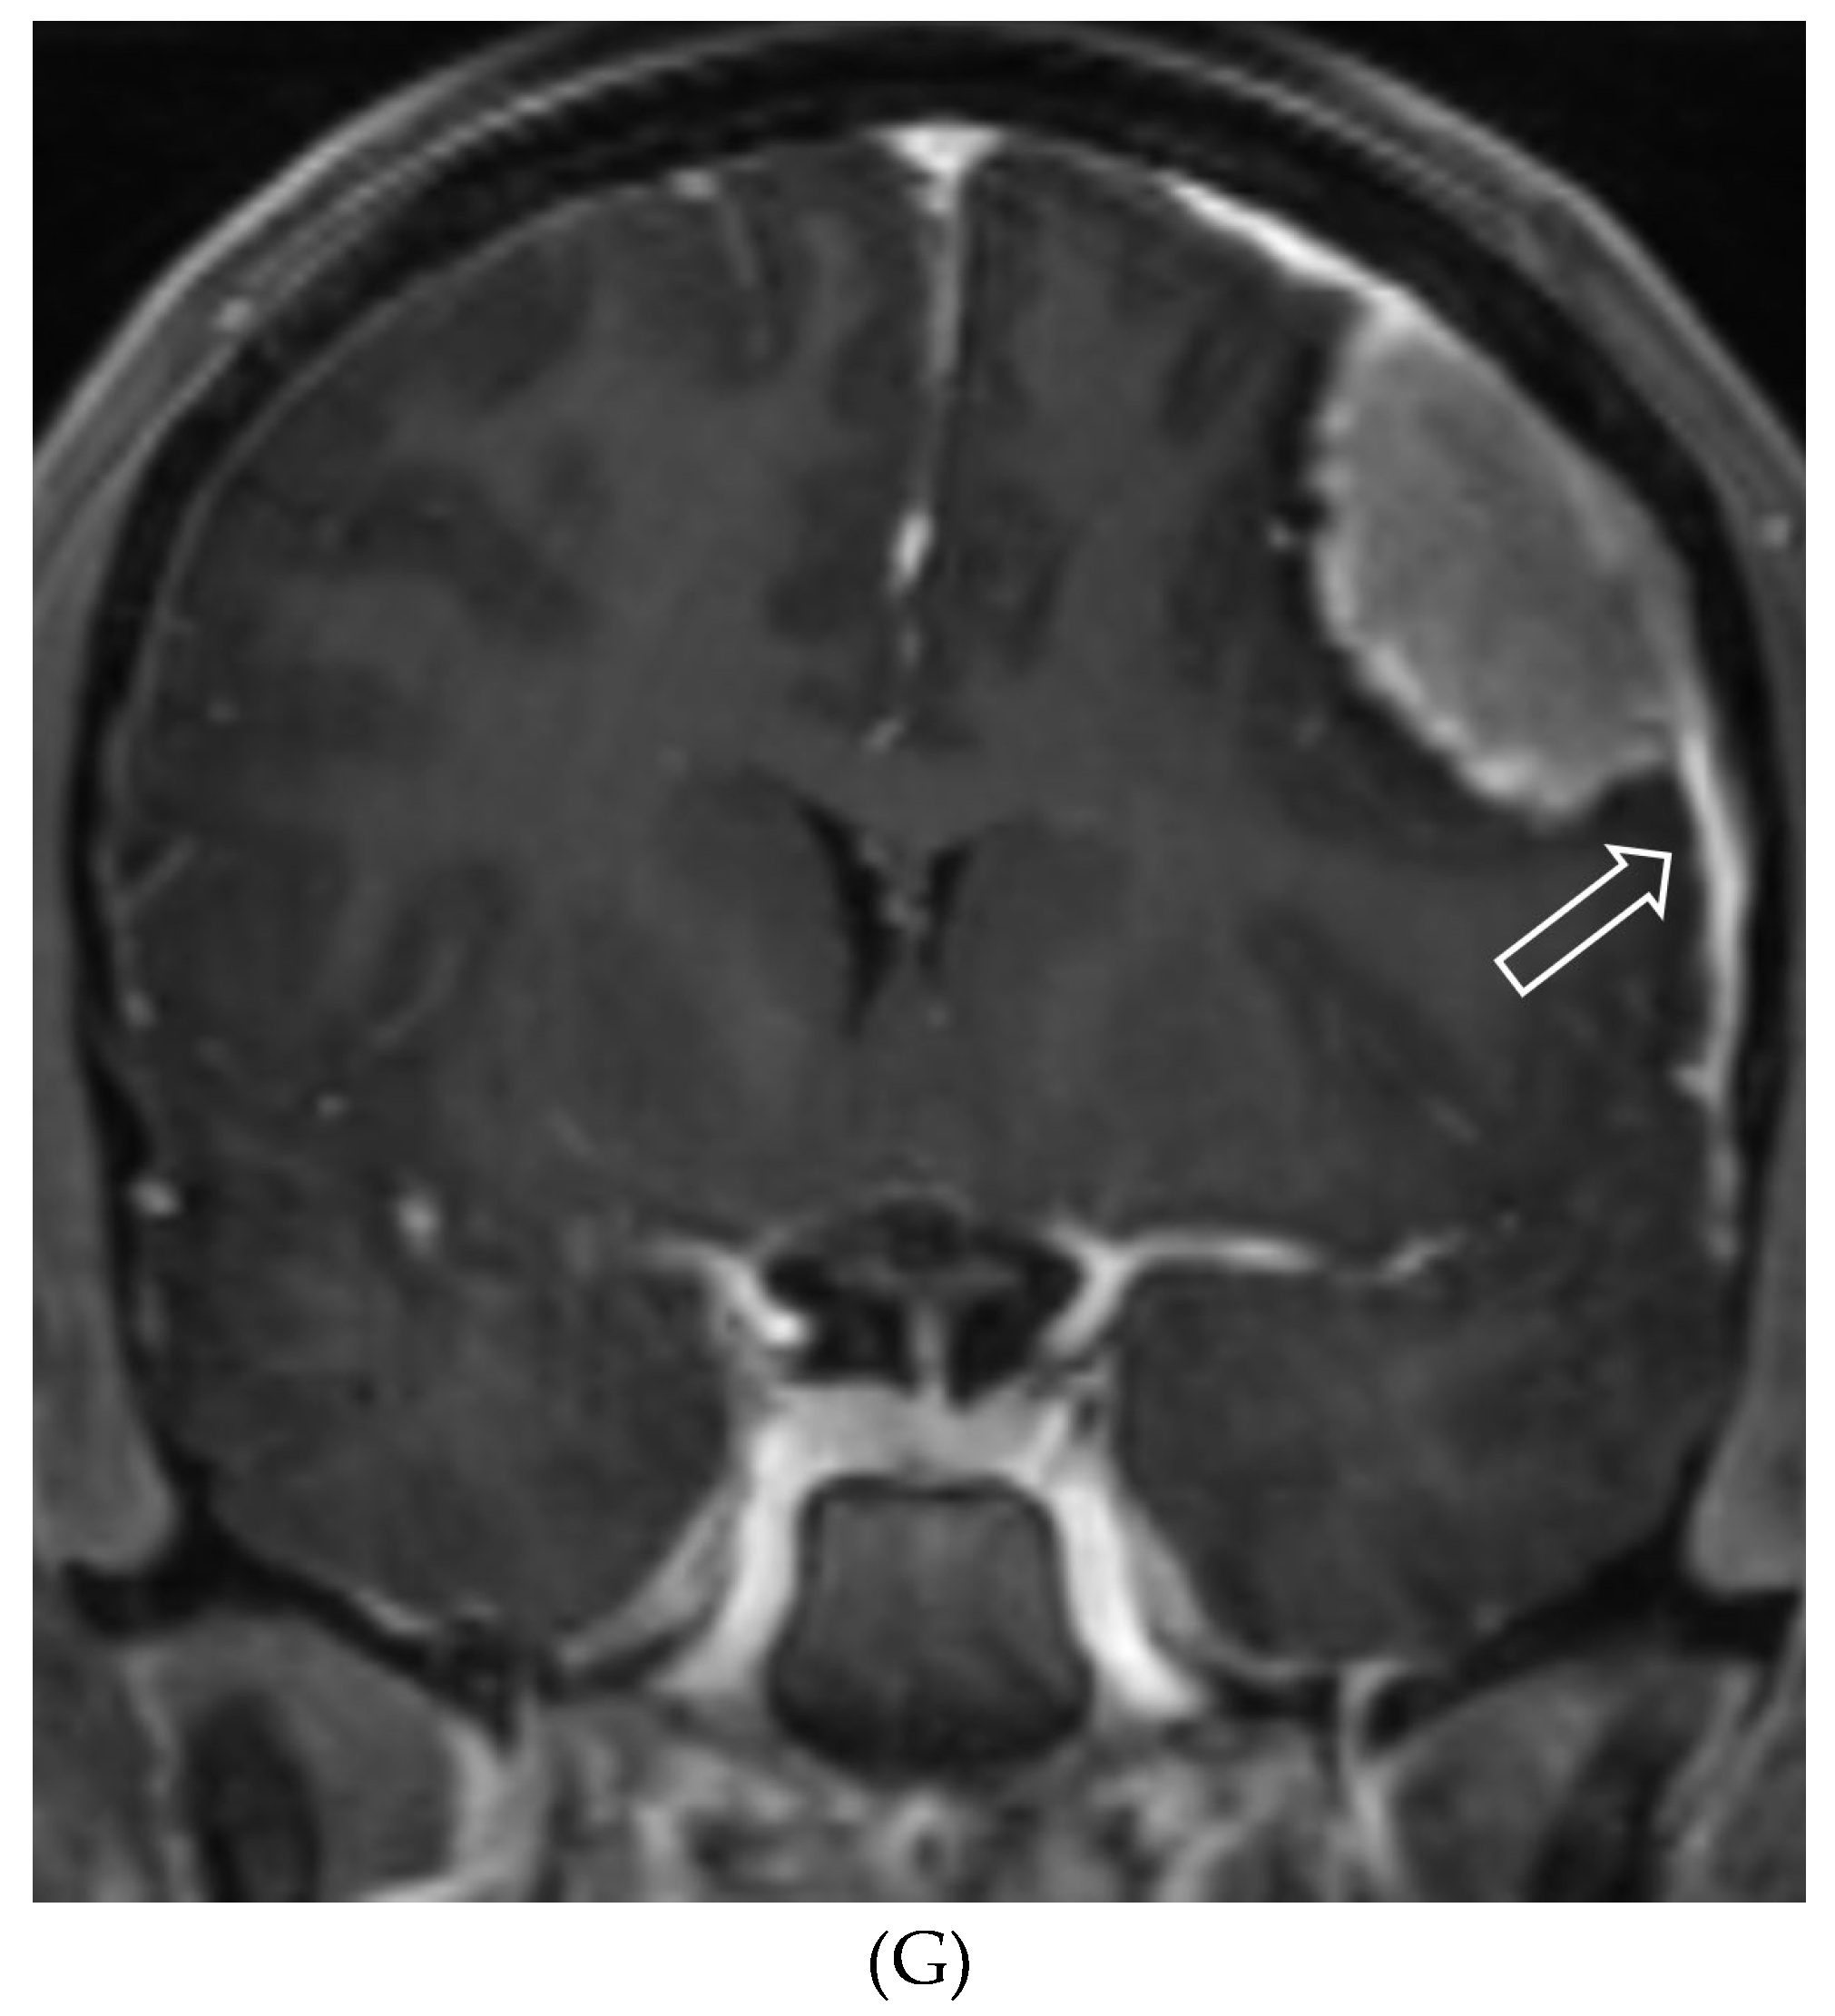
MENINGIOMA
GLIONEURONAL TUMOR
PRIMARY LEPTOMENINGEAL RHABDOMYOSARCOMA
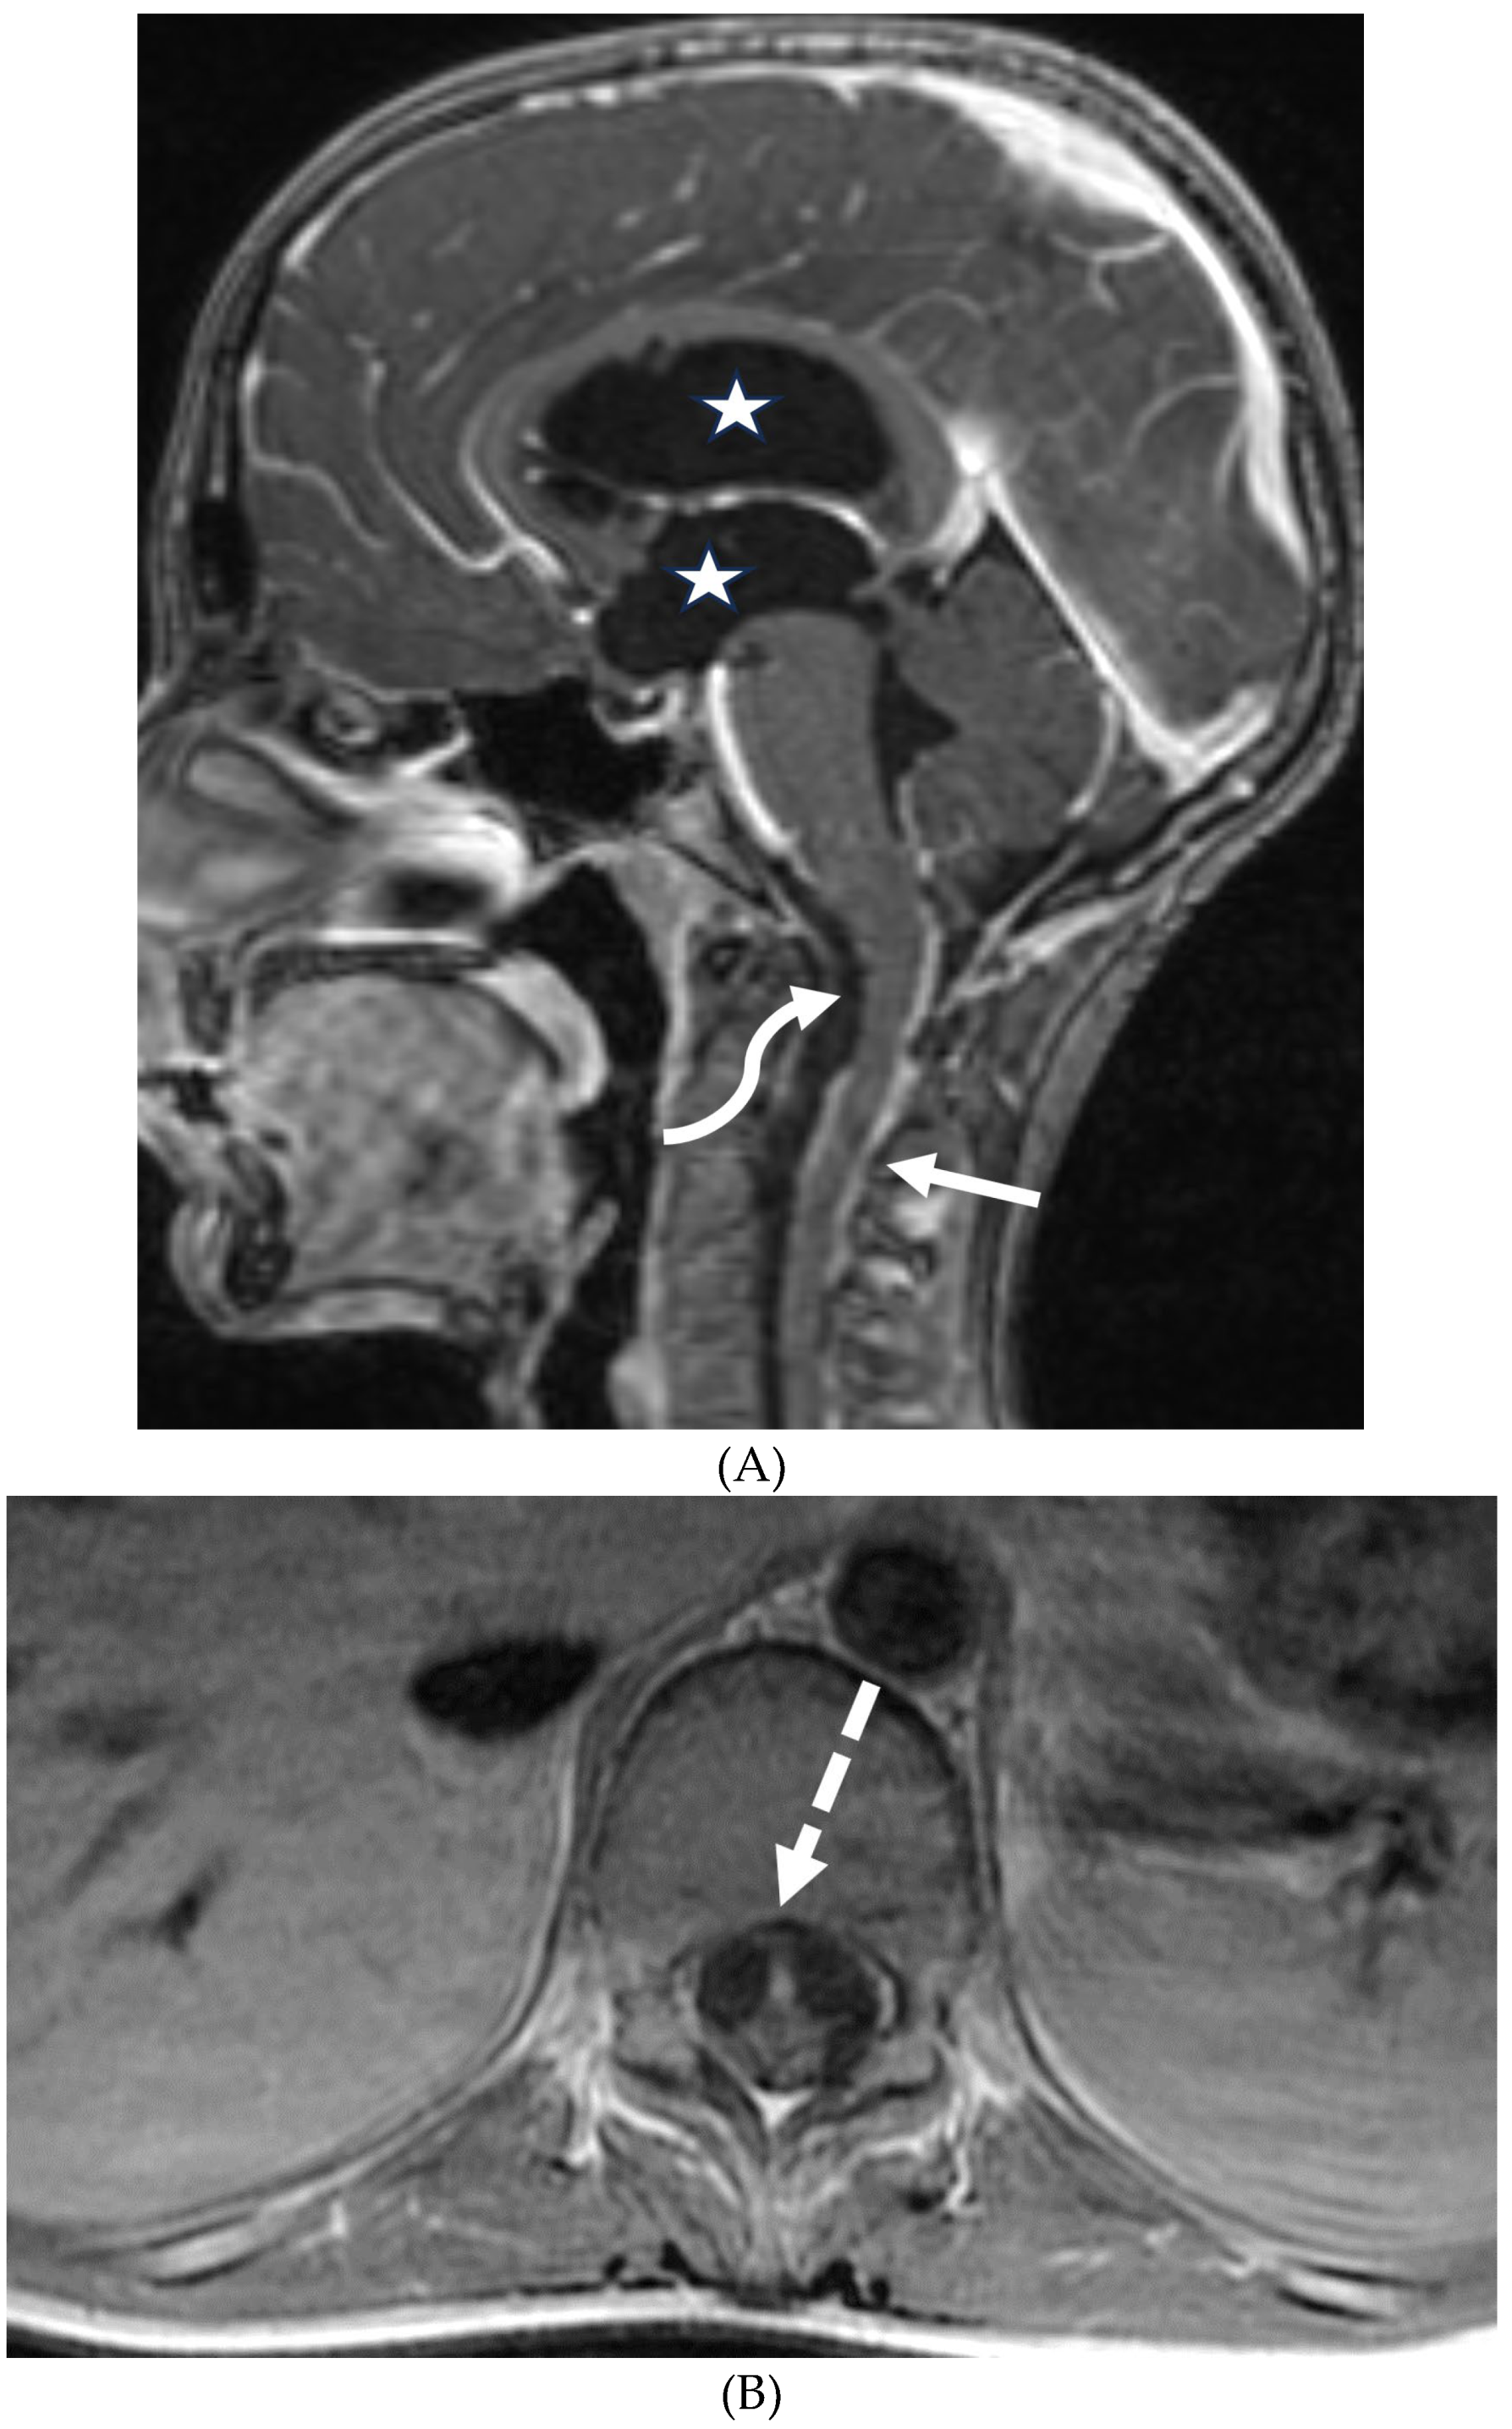
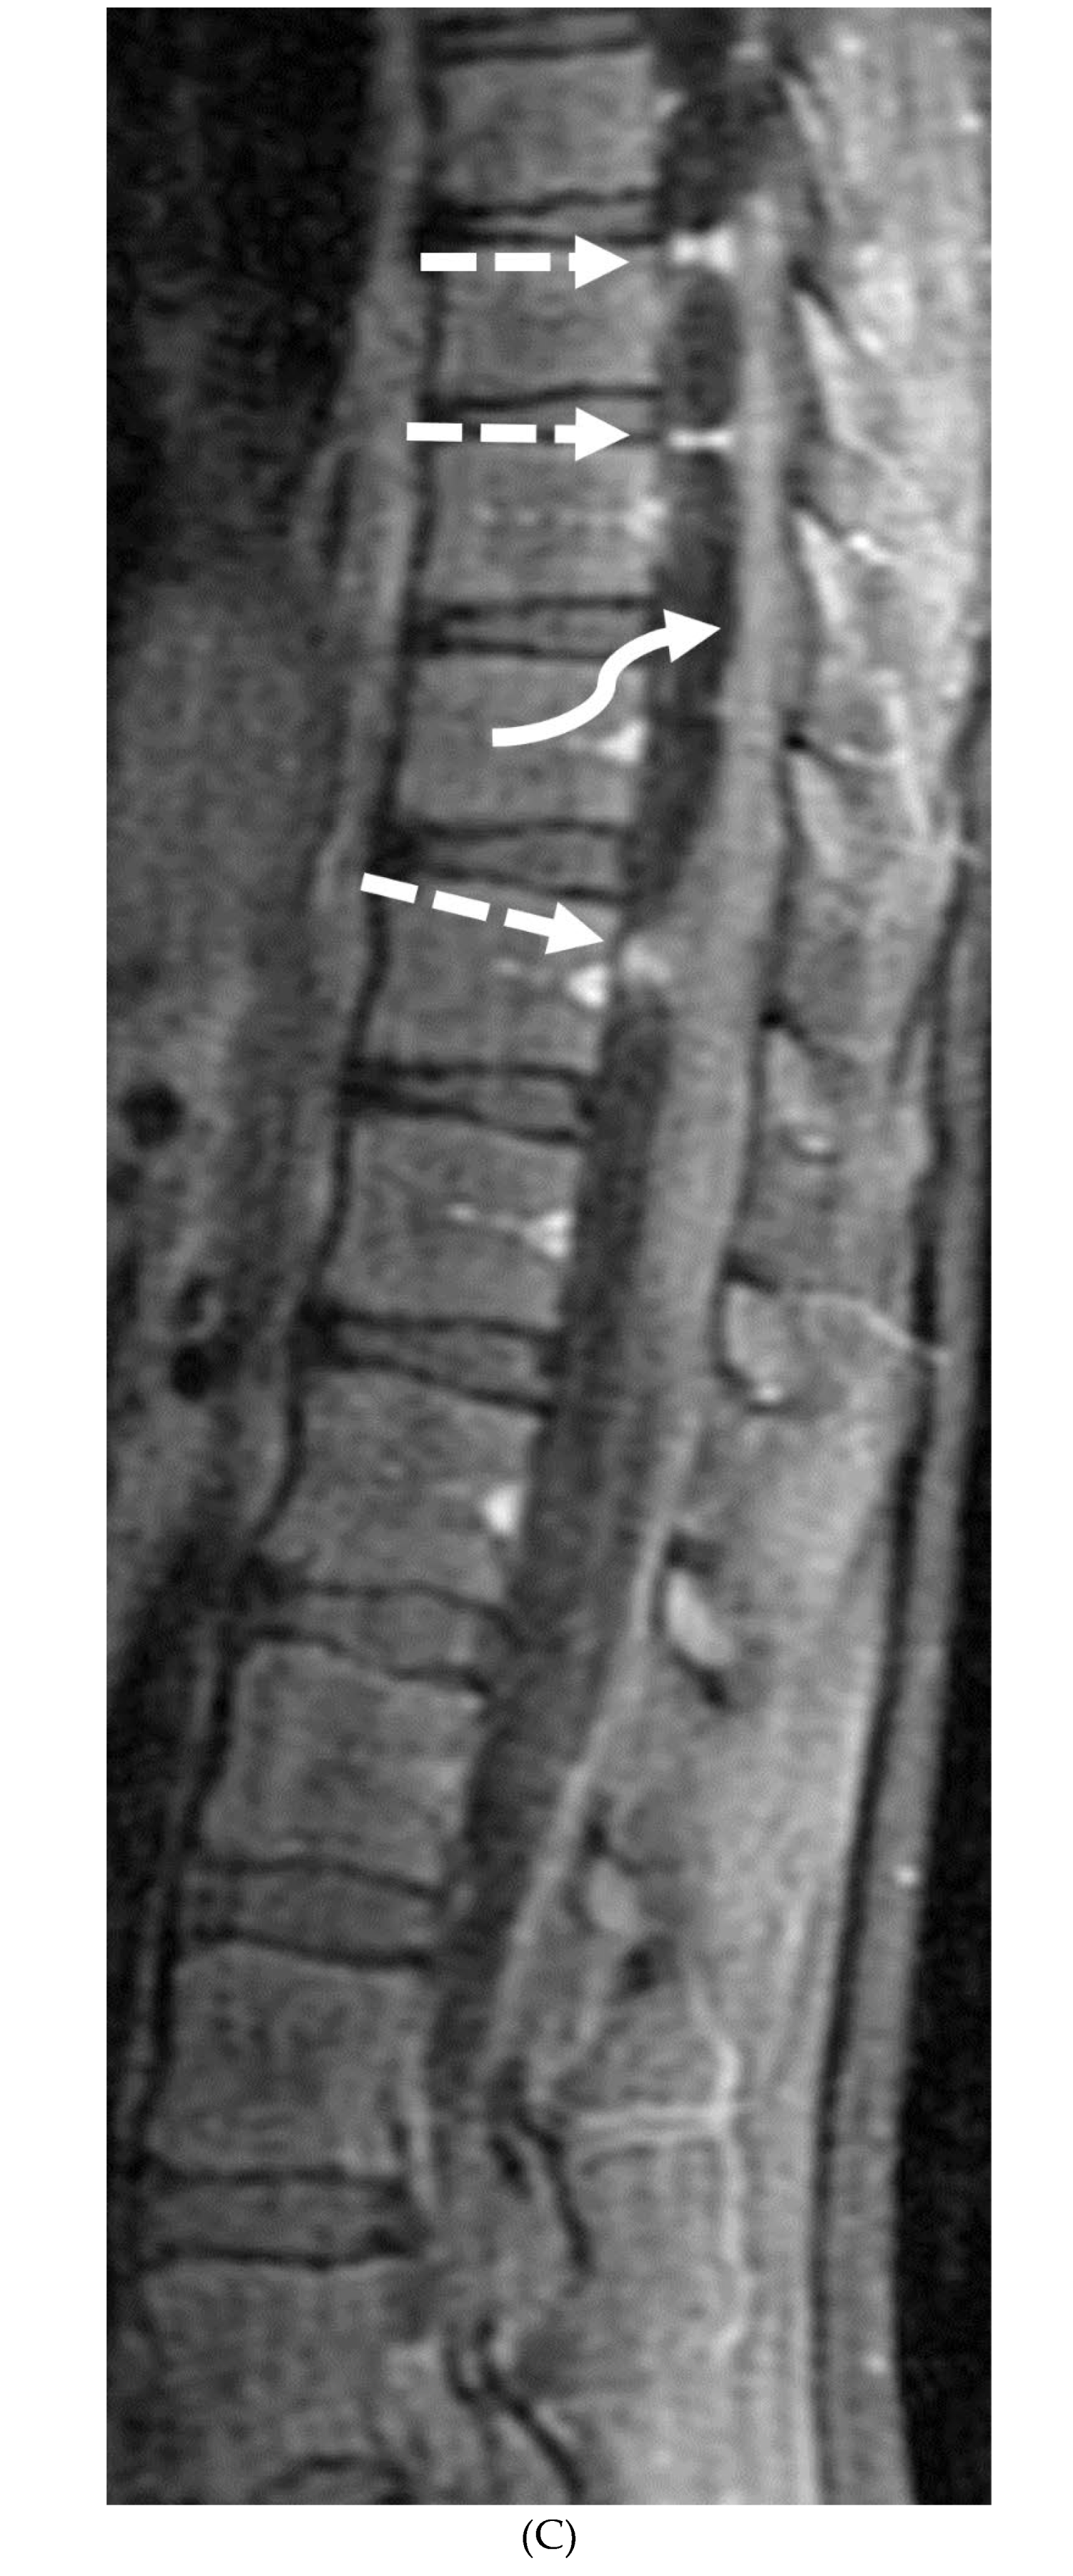
INTRACRANIAL HYPOTENSION (IH)
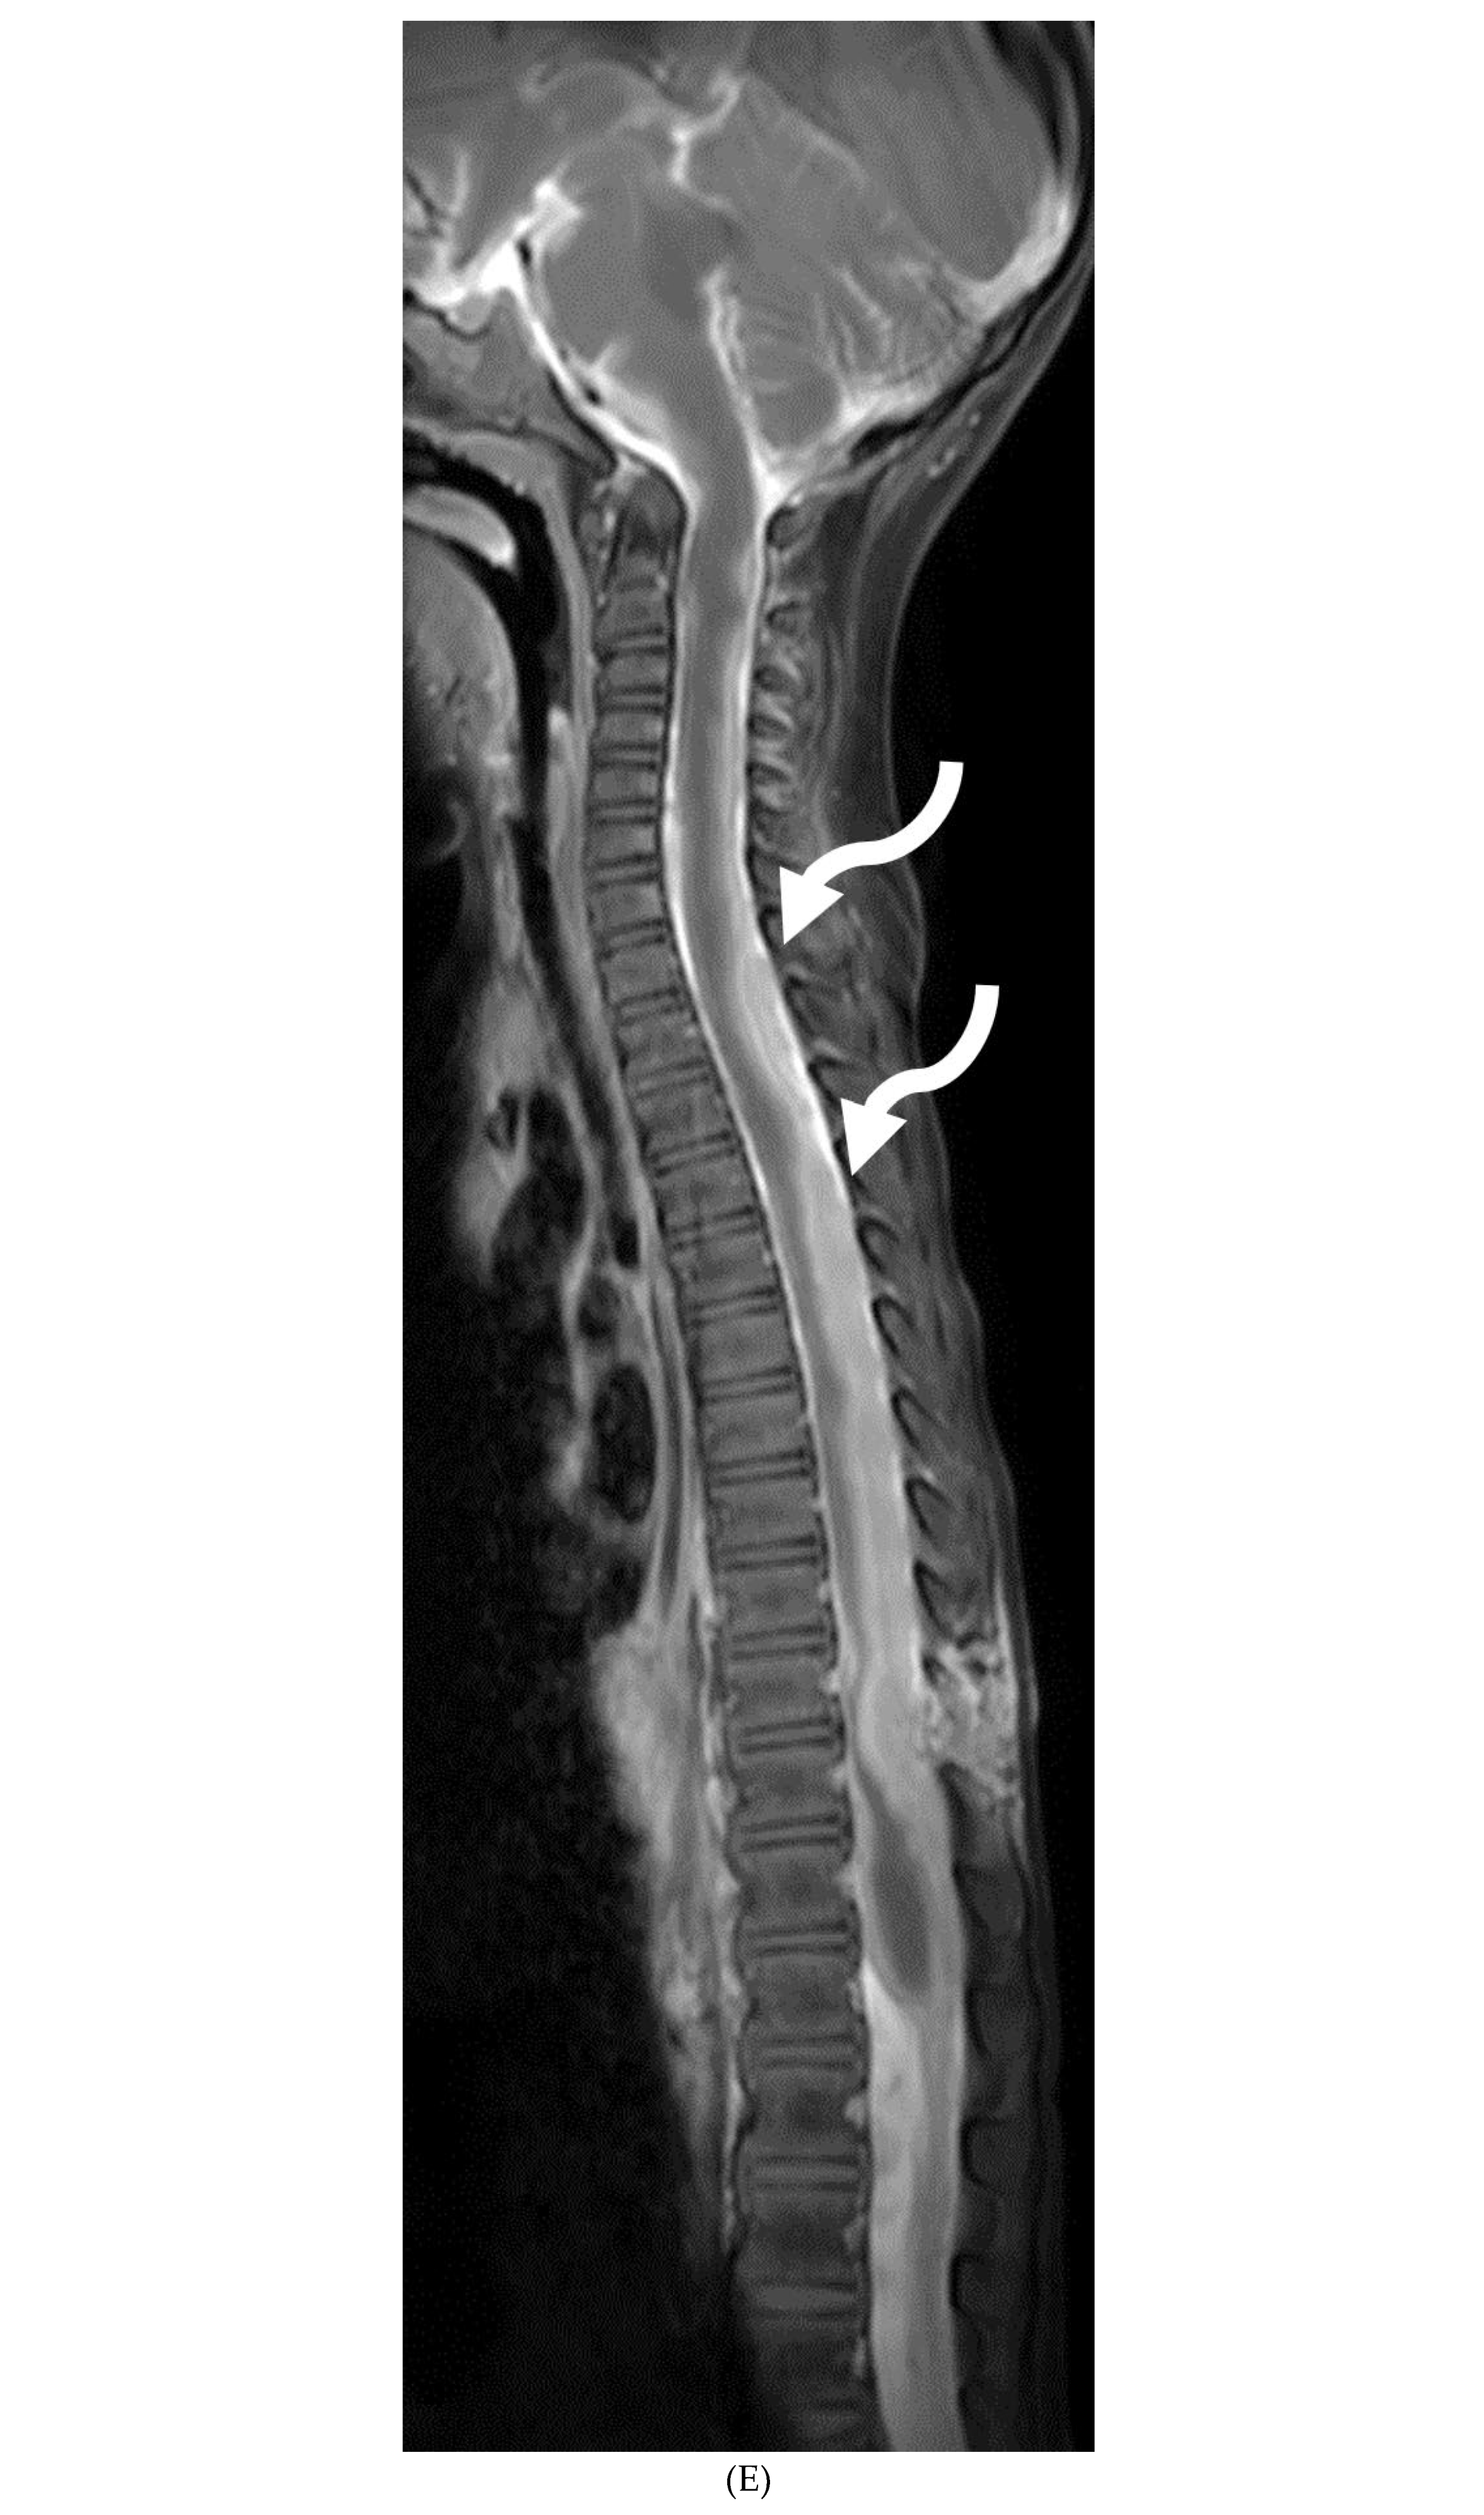
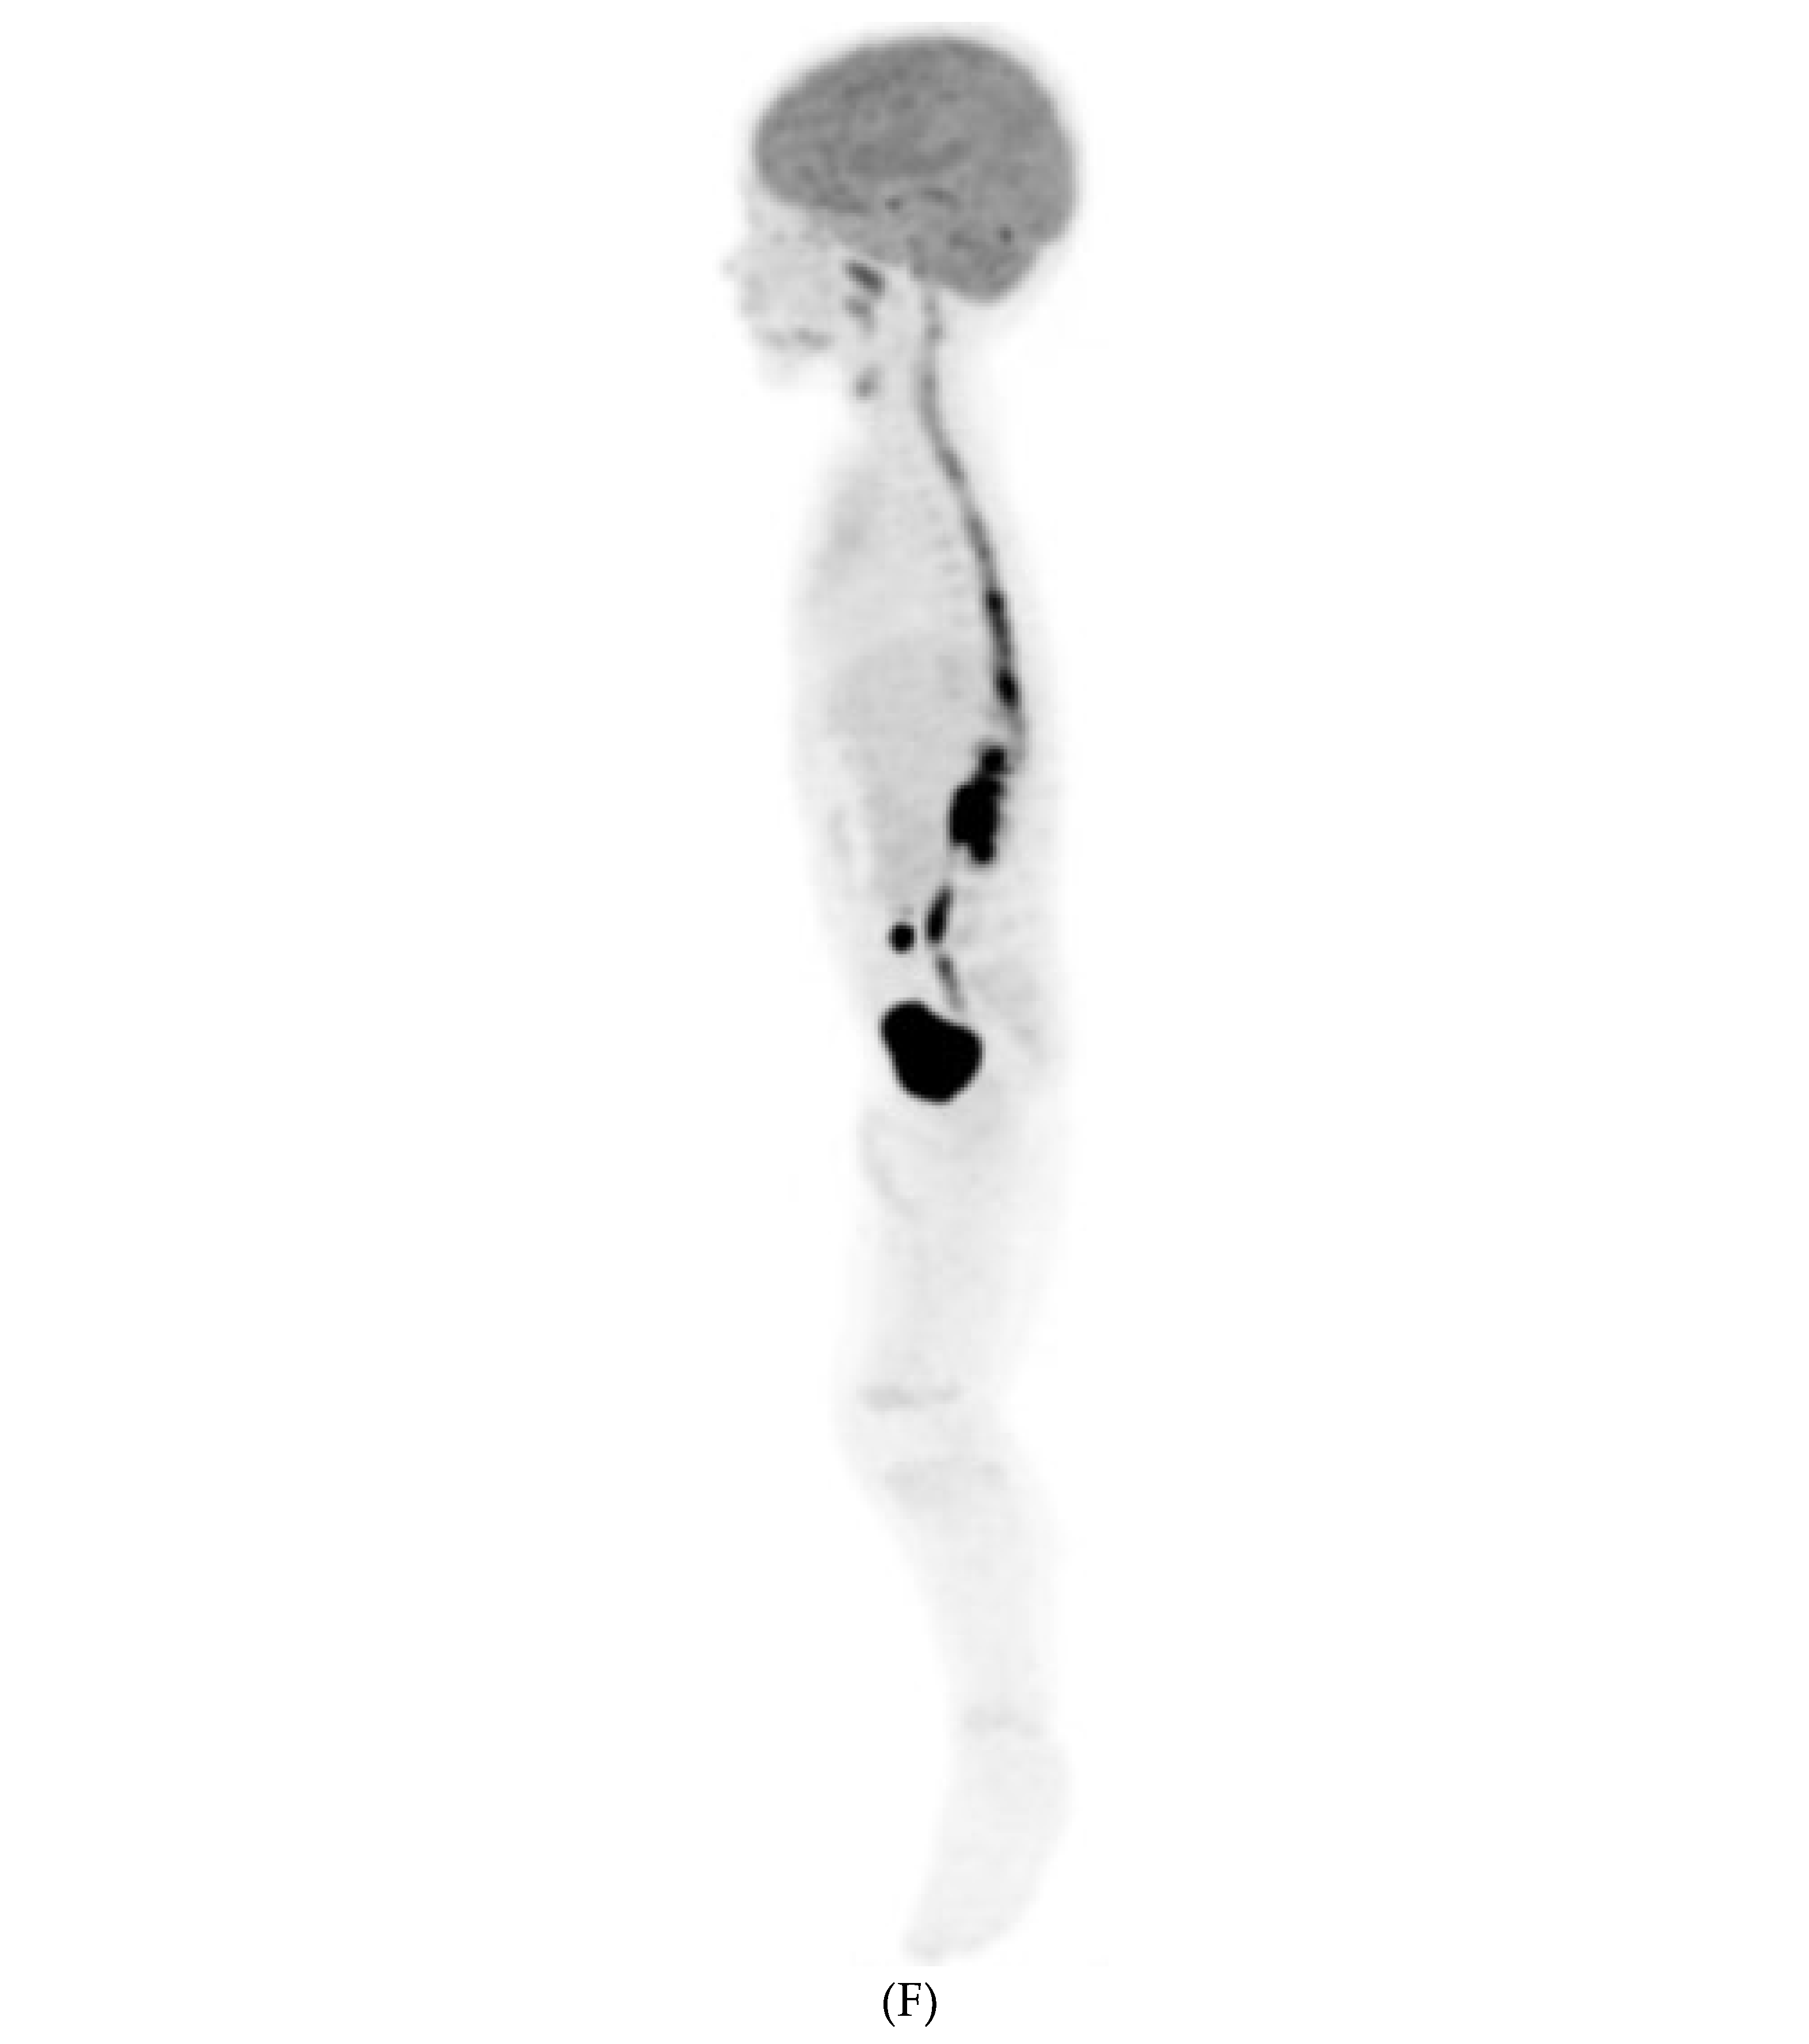
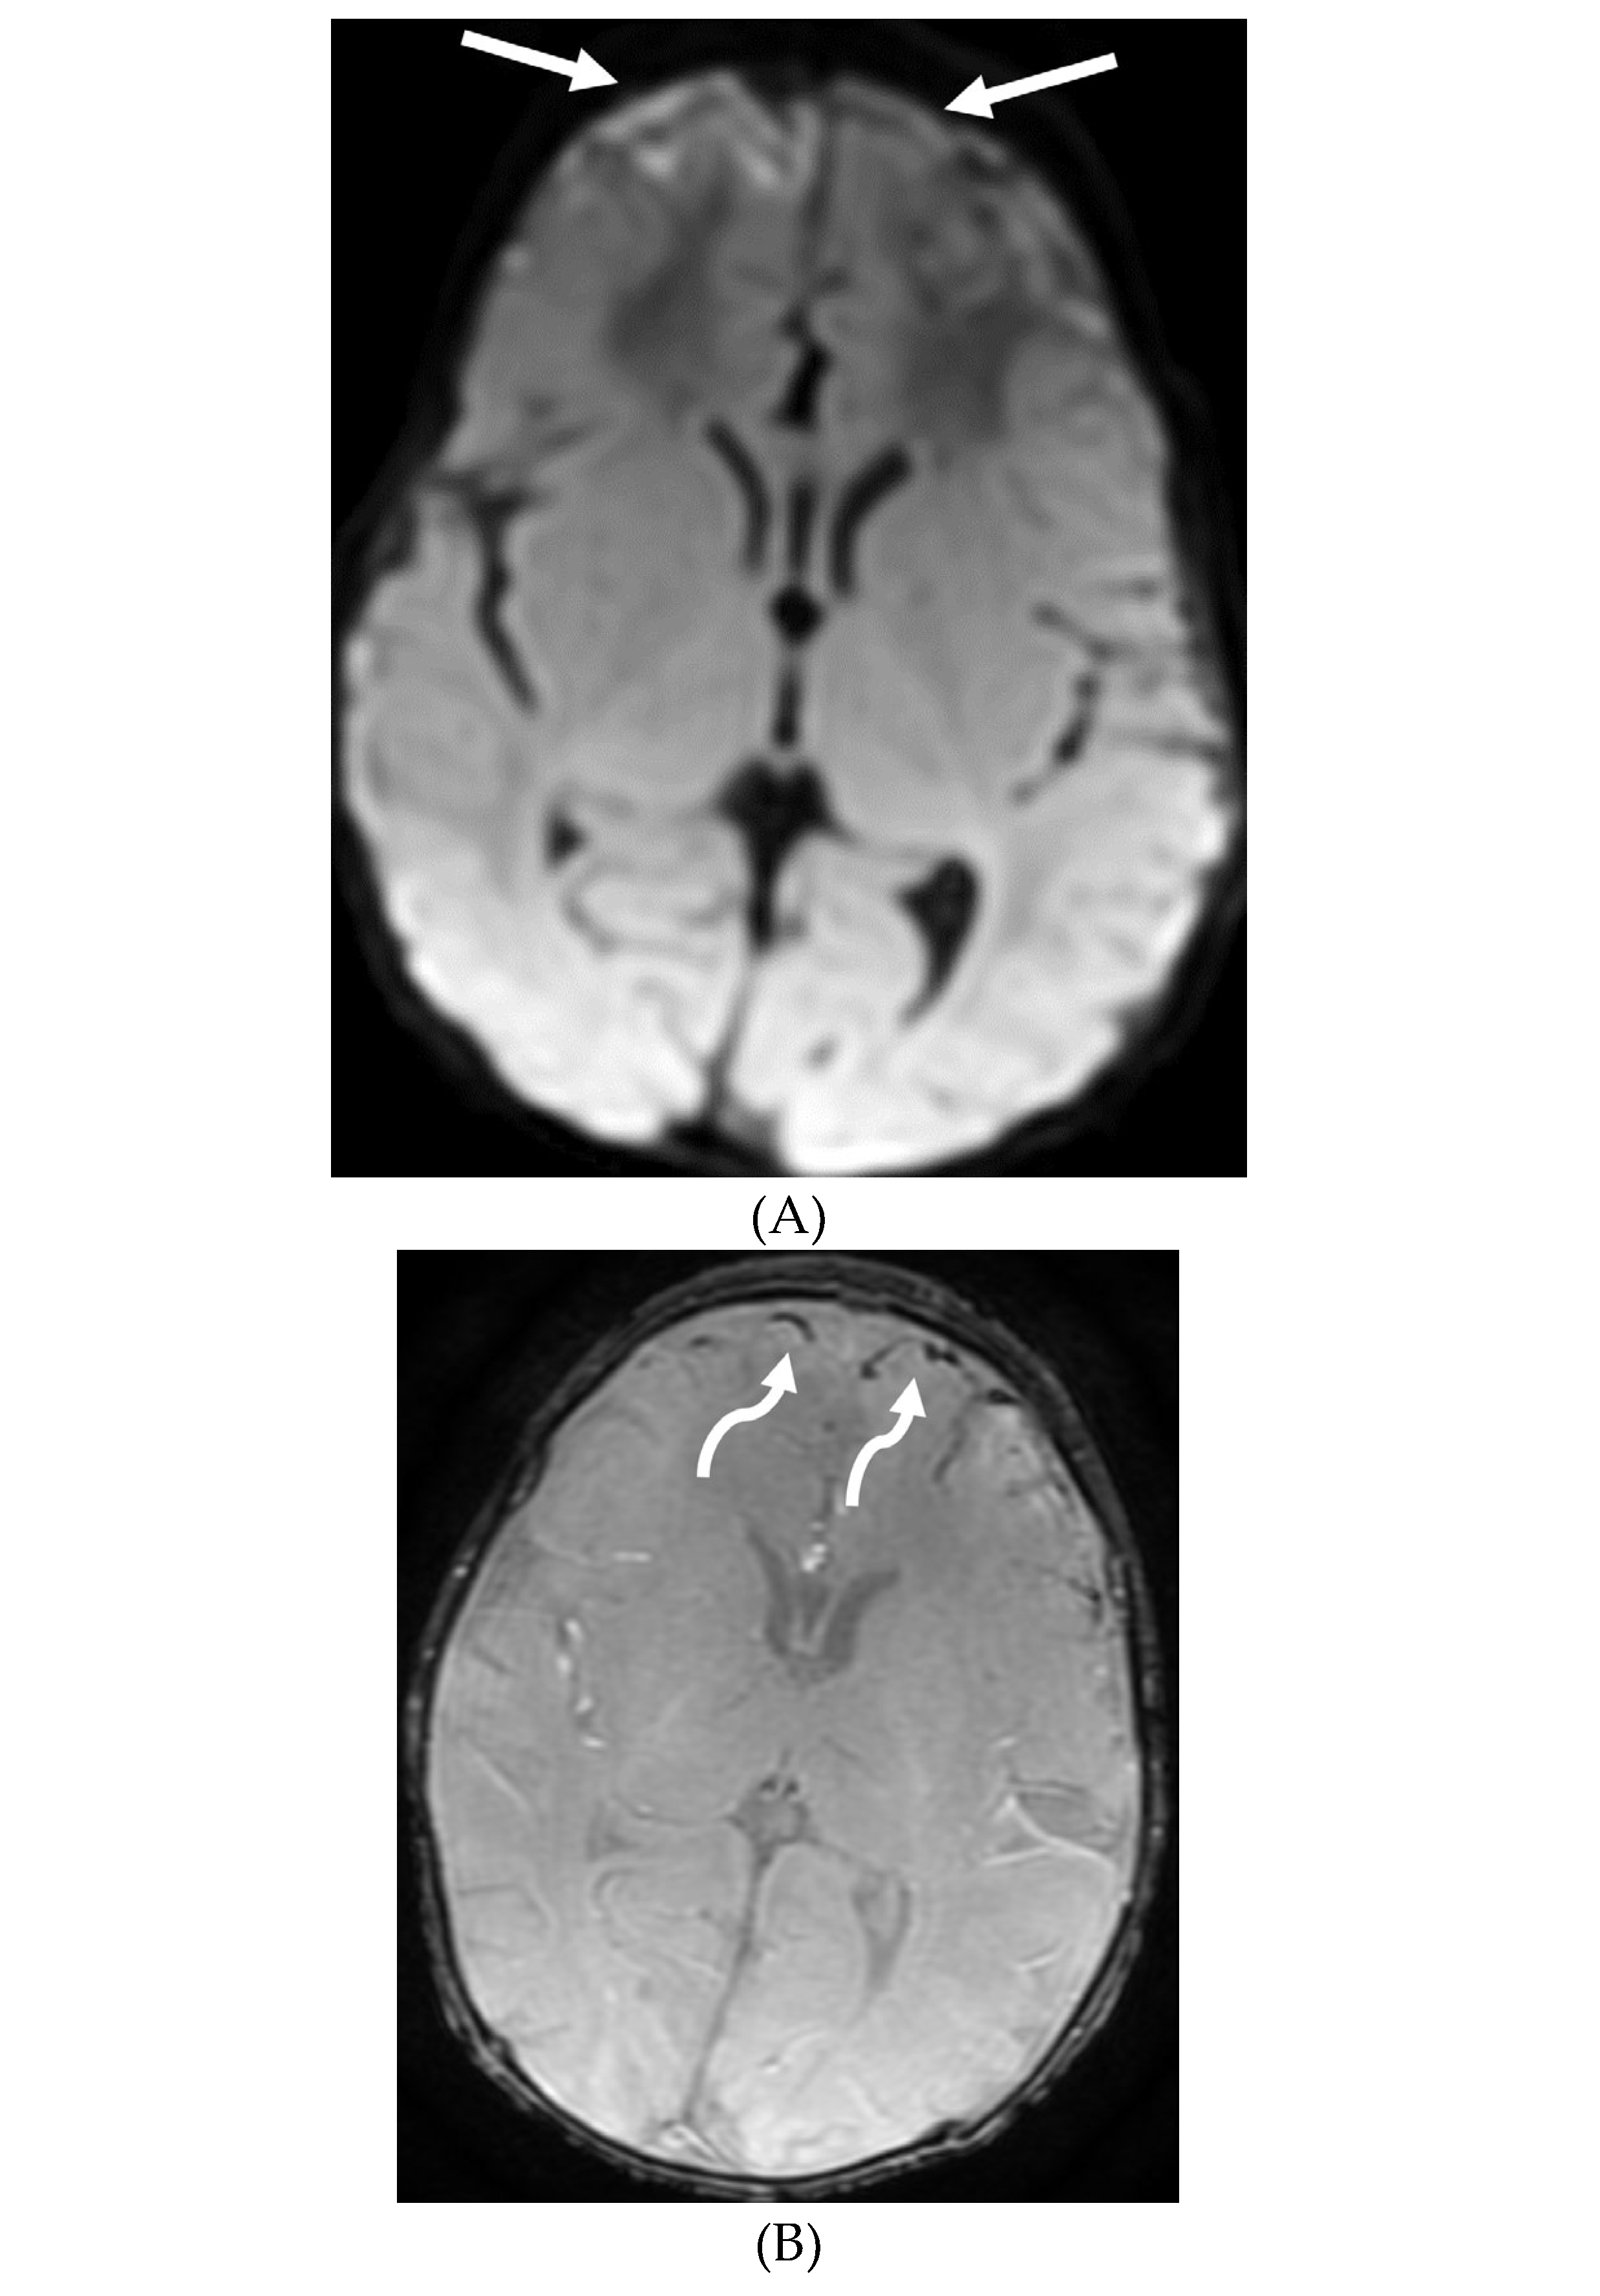
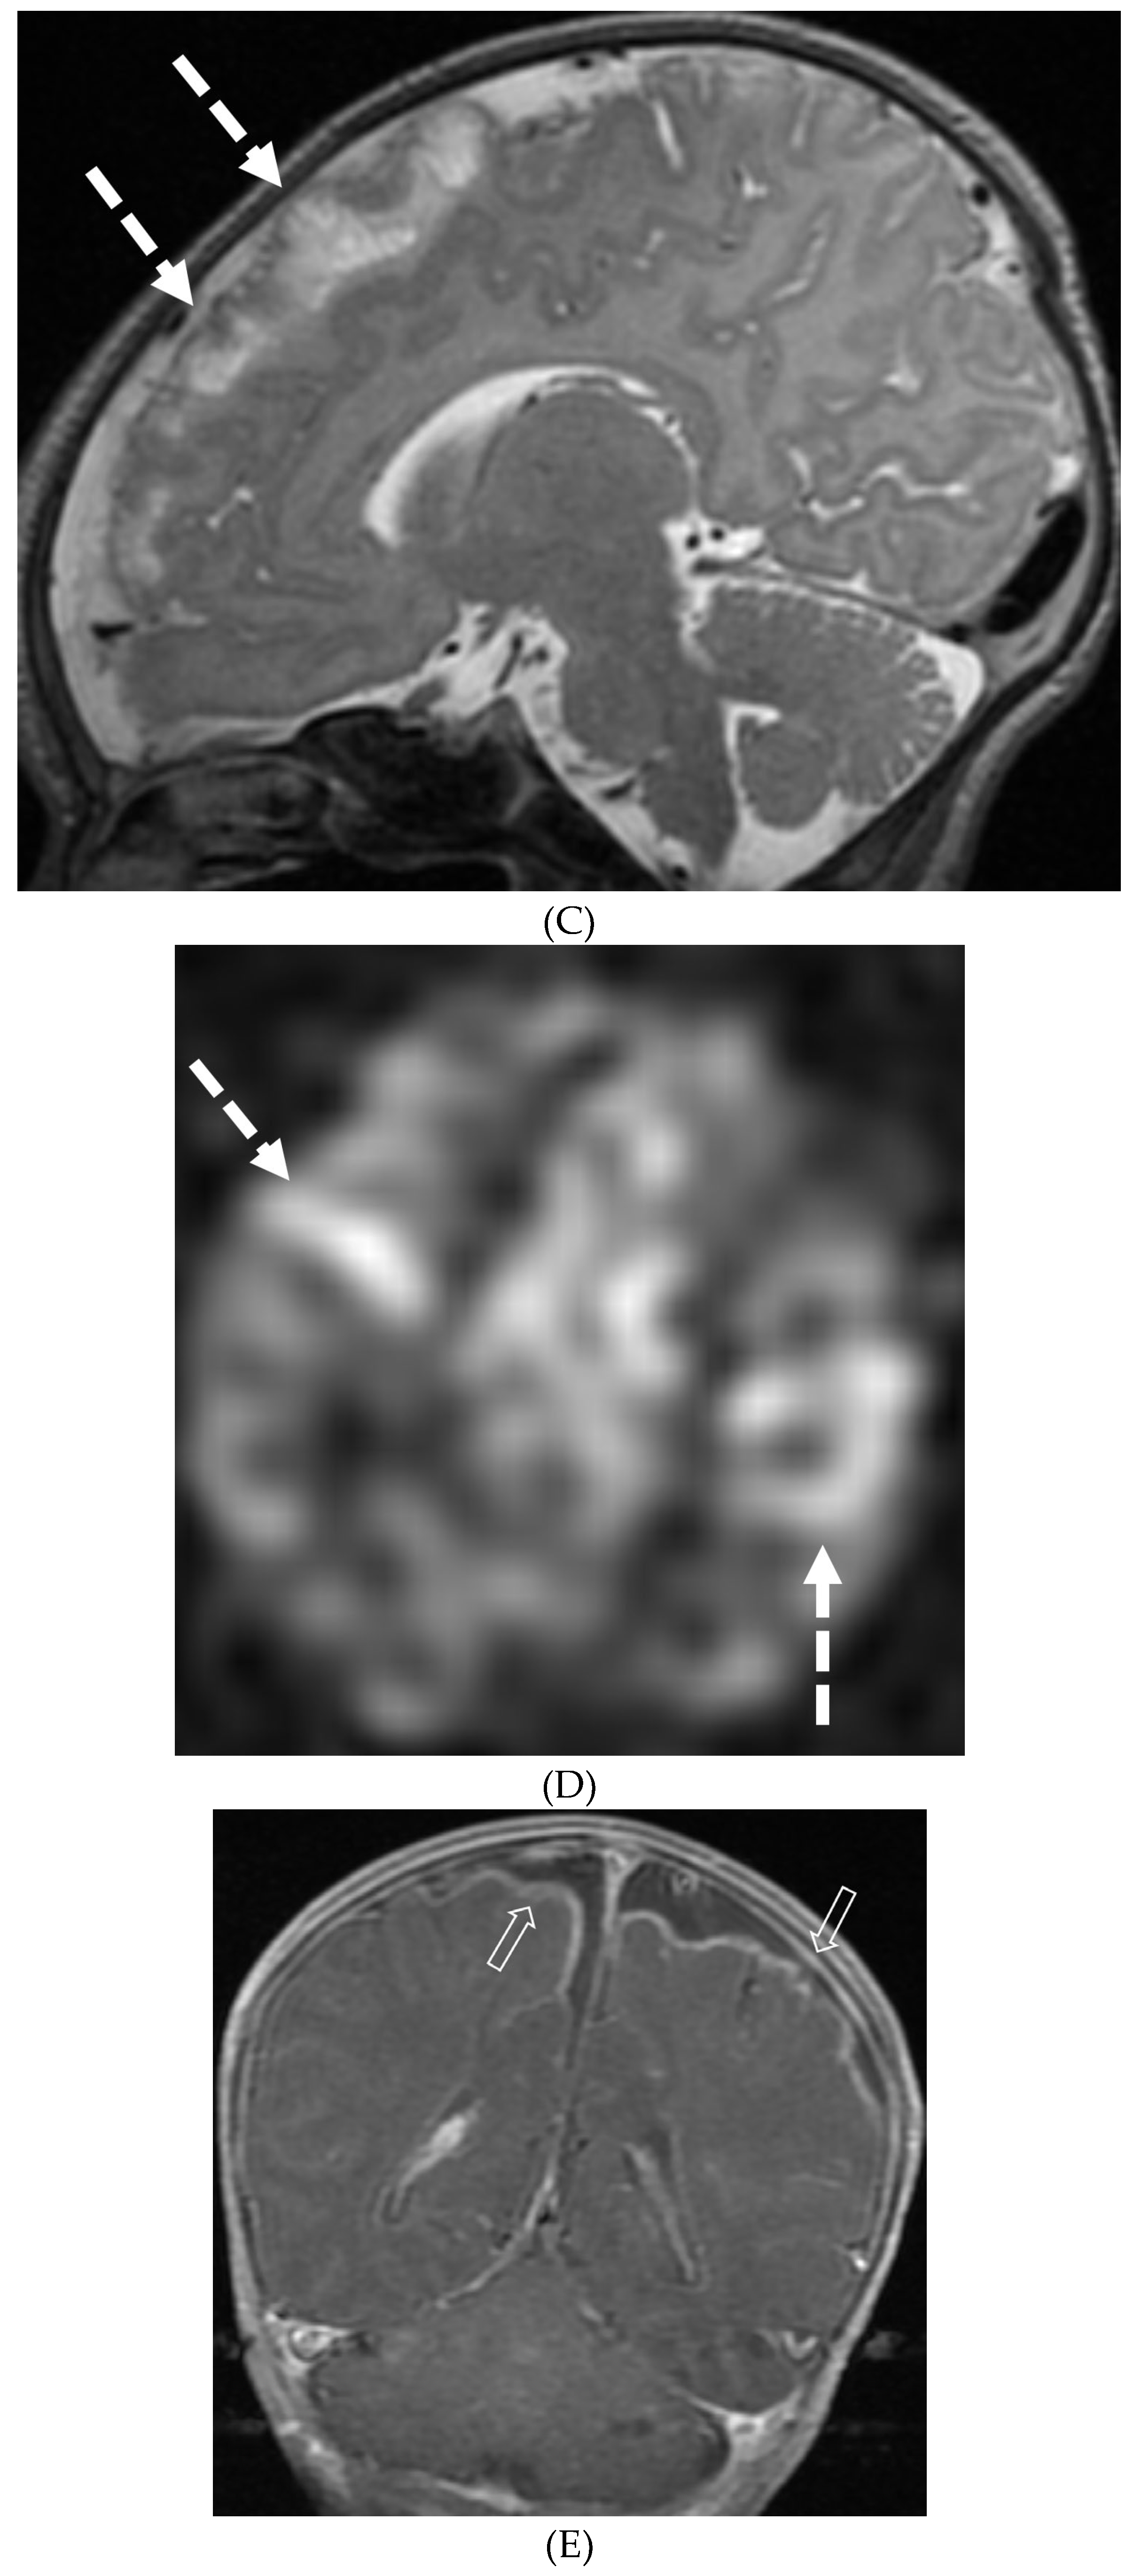
ALK-POSITIVE HISTIOCYTOSIS
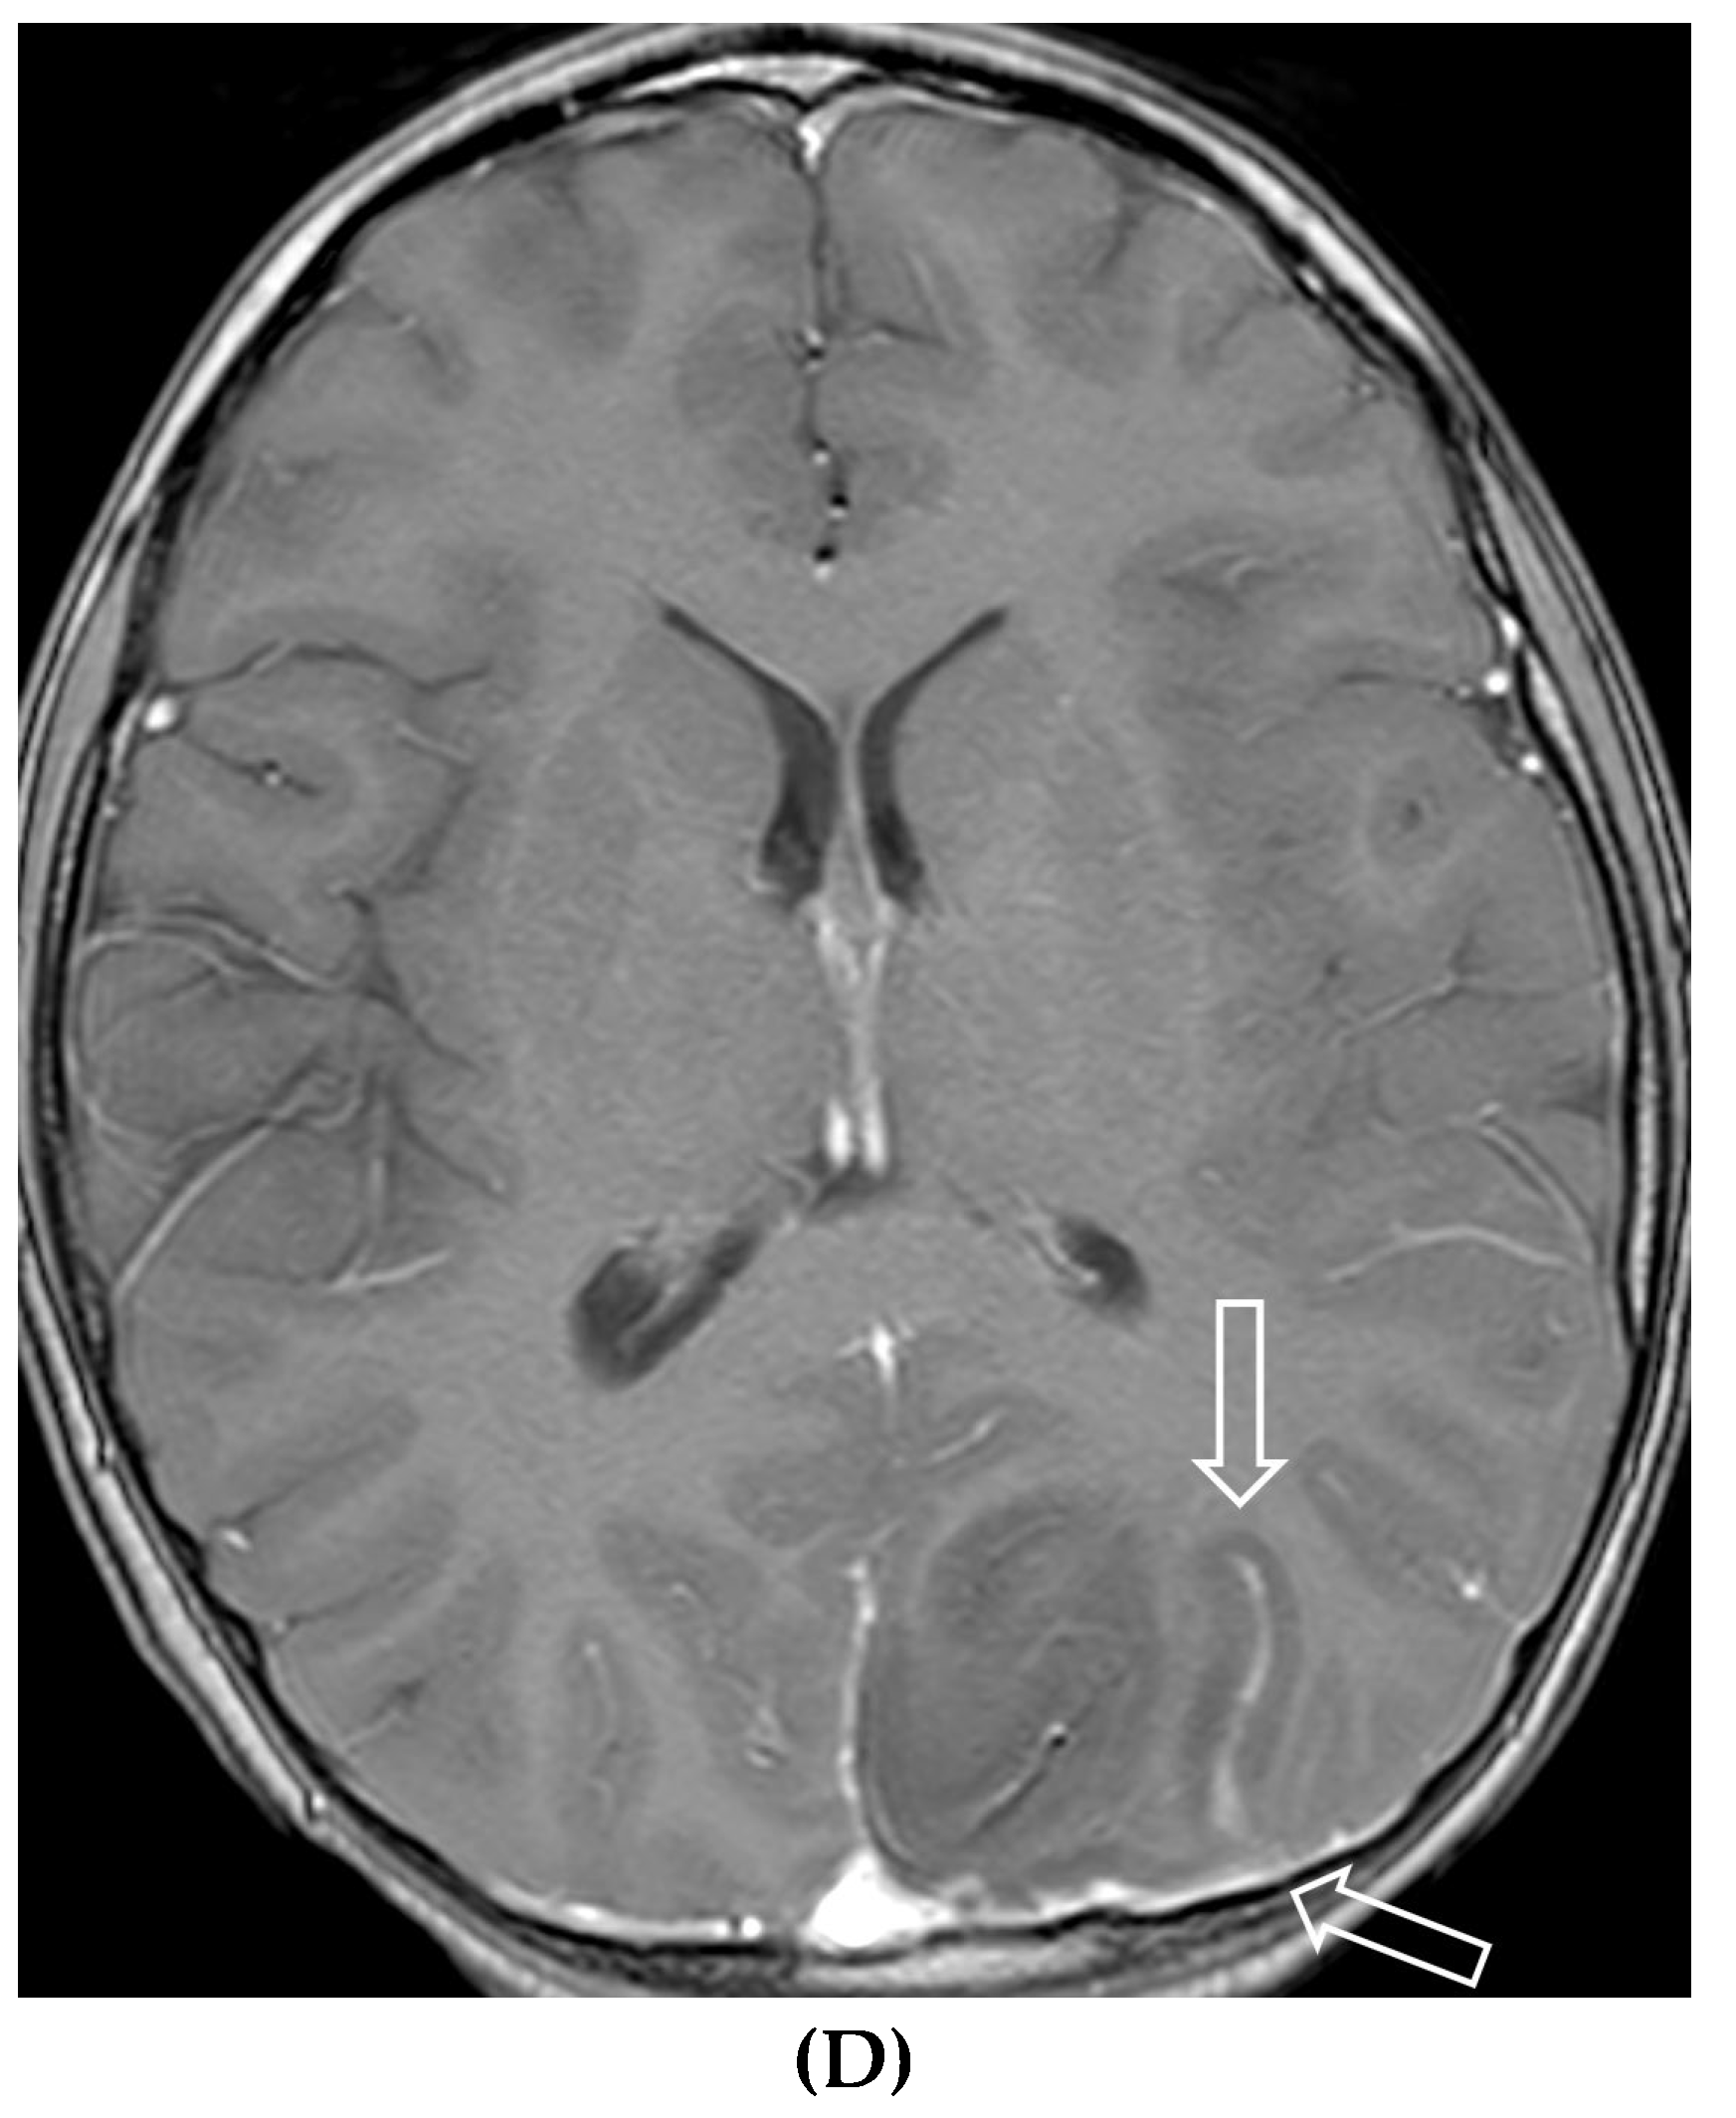
VARIABLE MENINGEAL AND PARENCHYMAL FEATURES
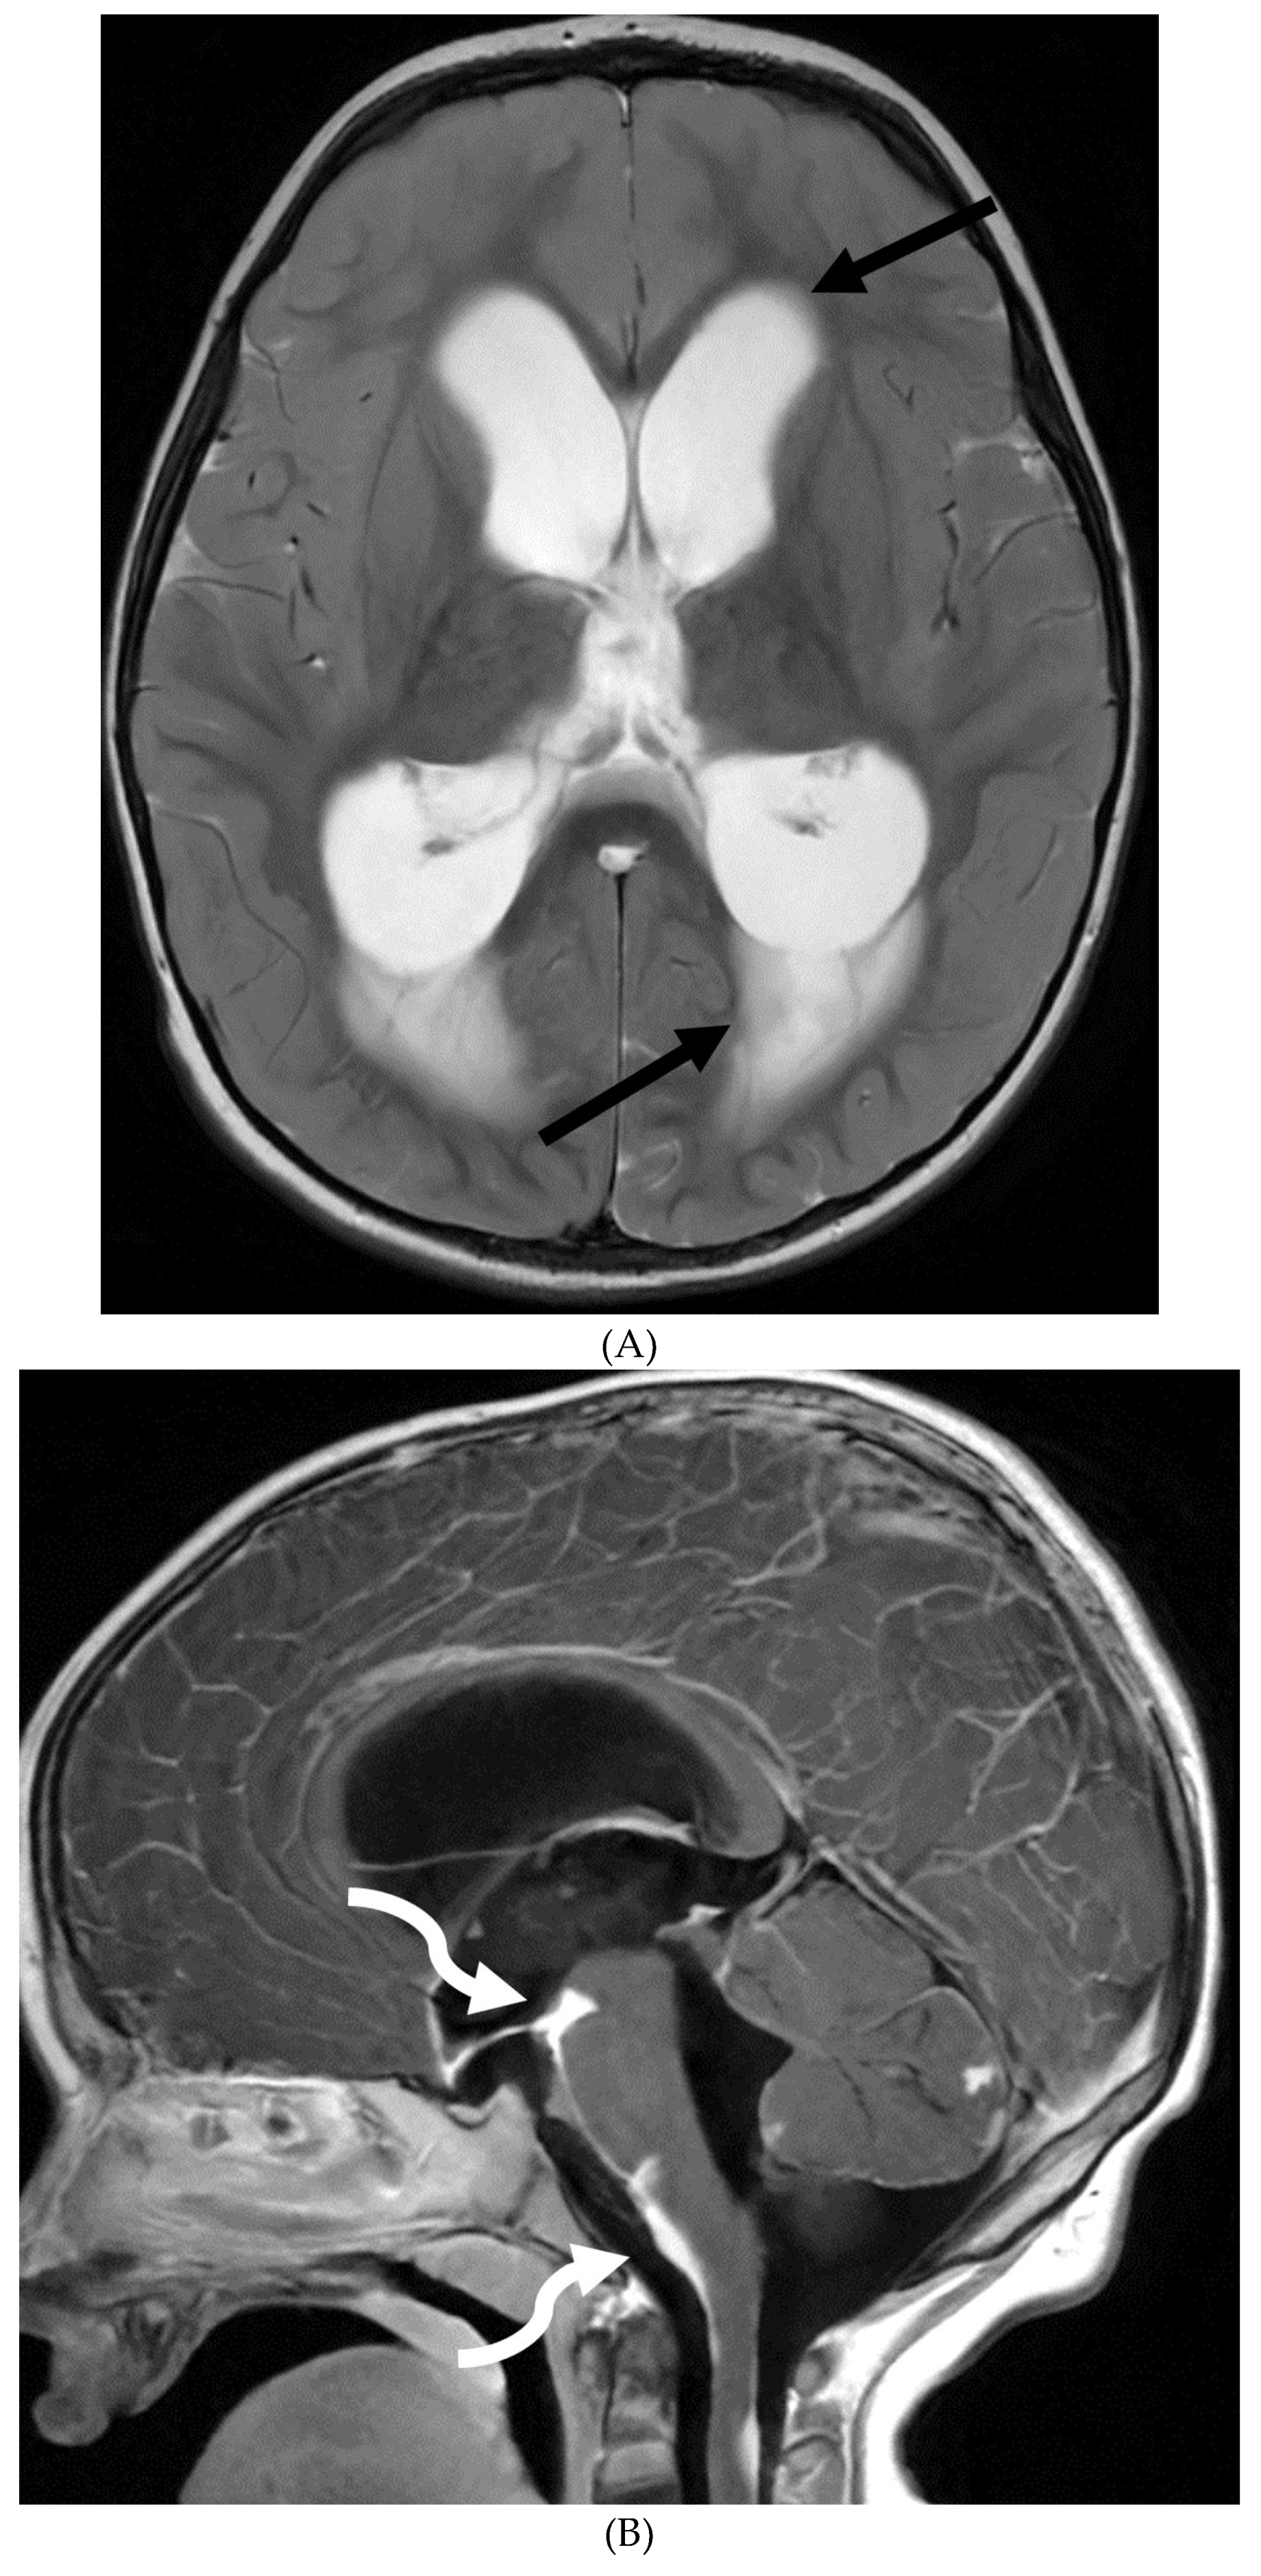
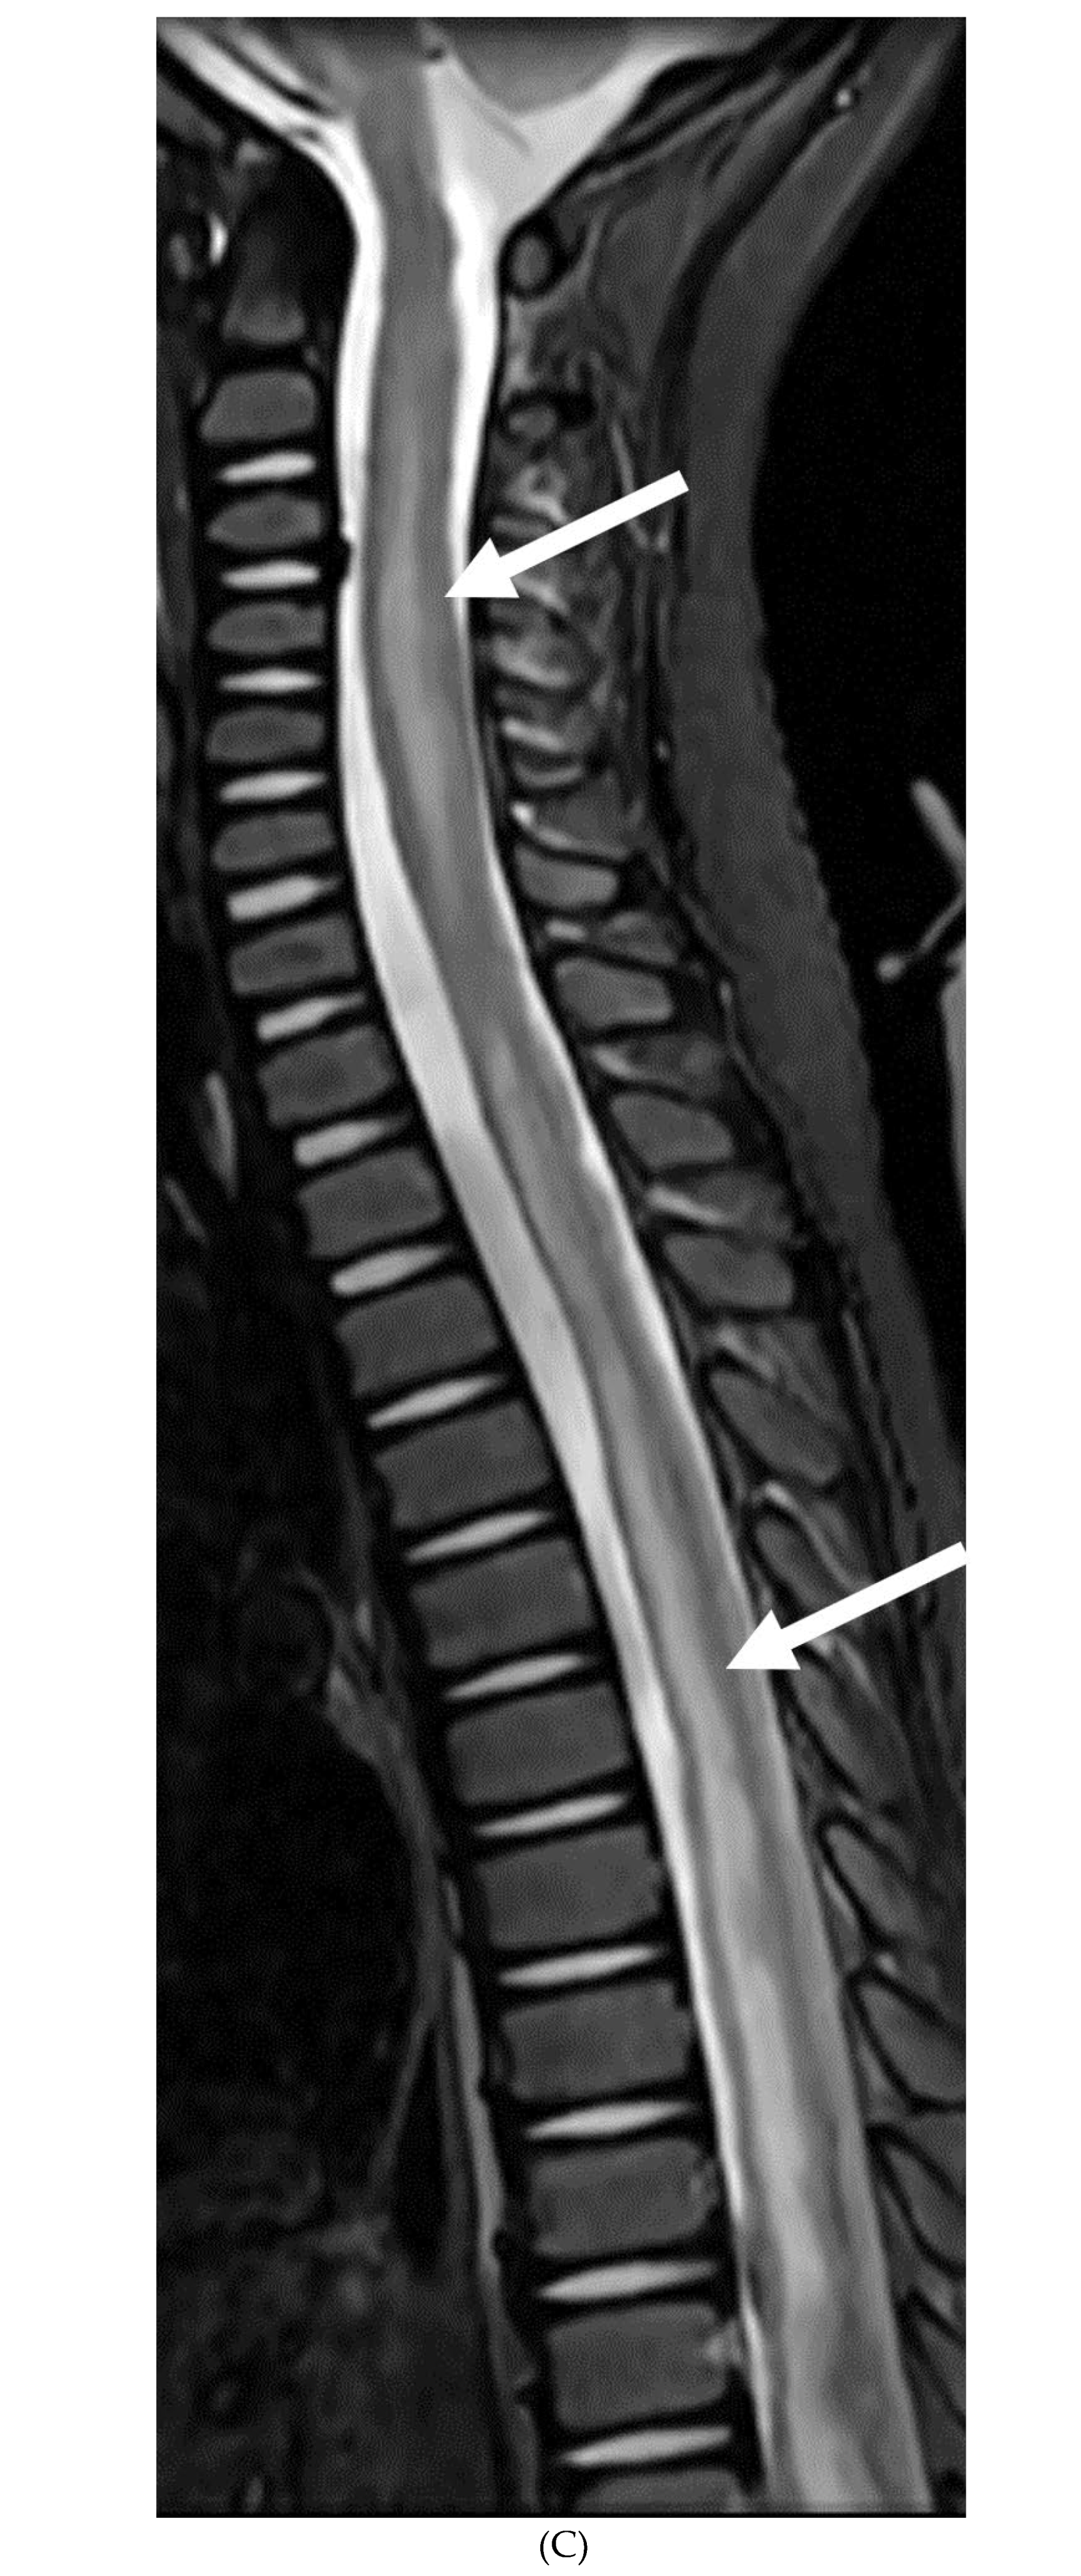
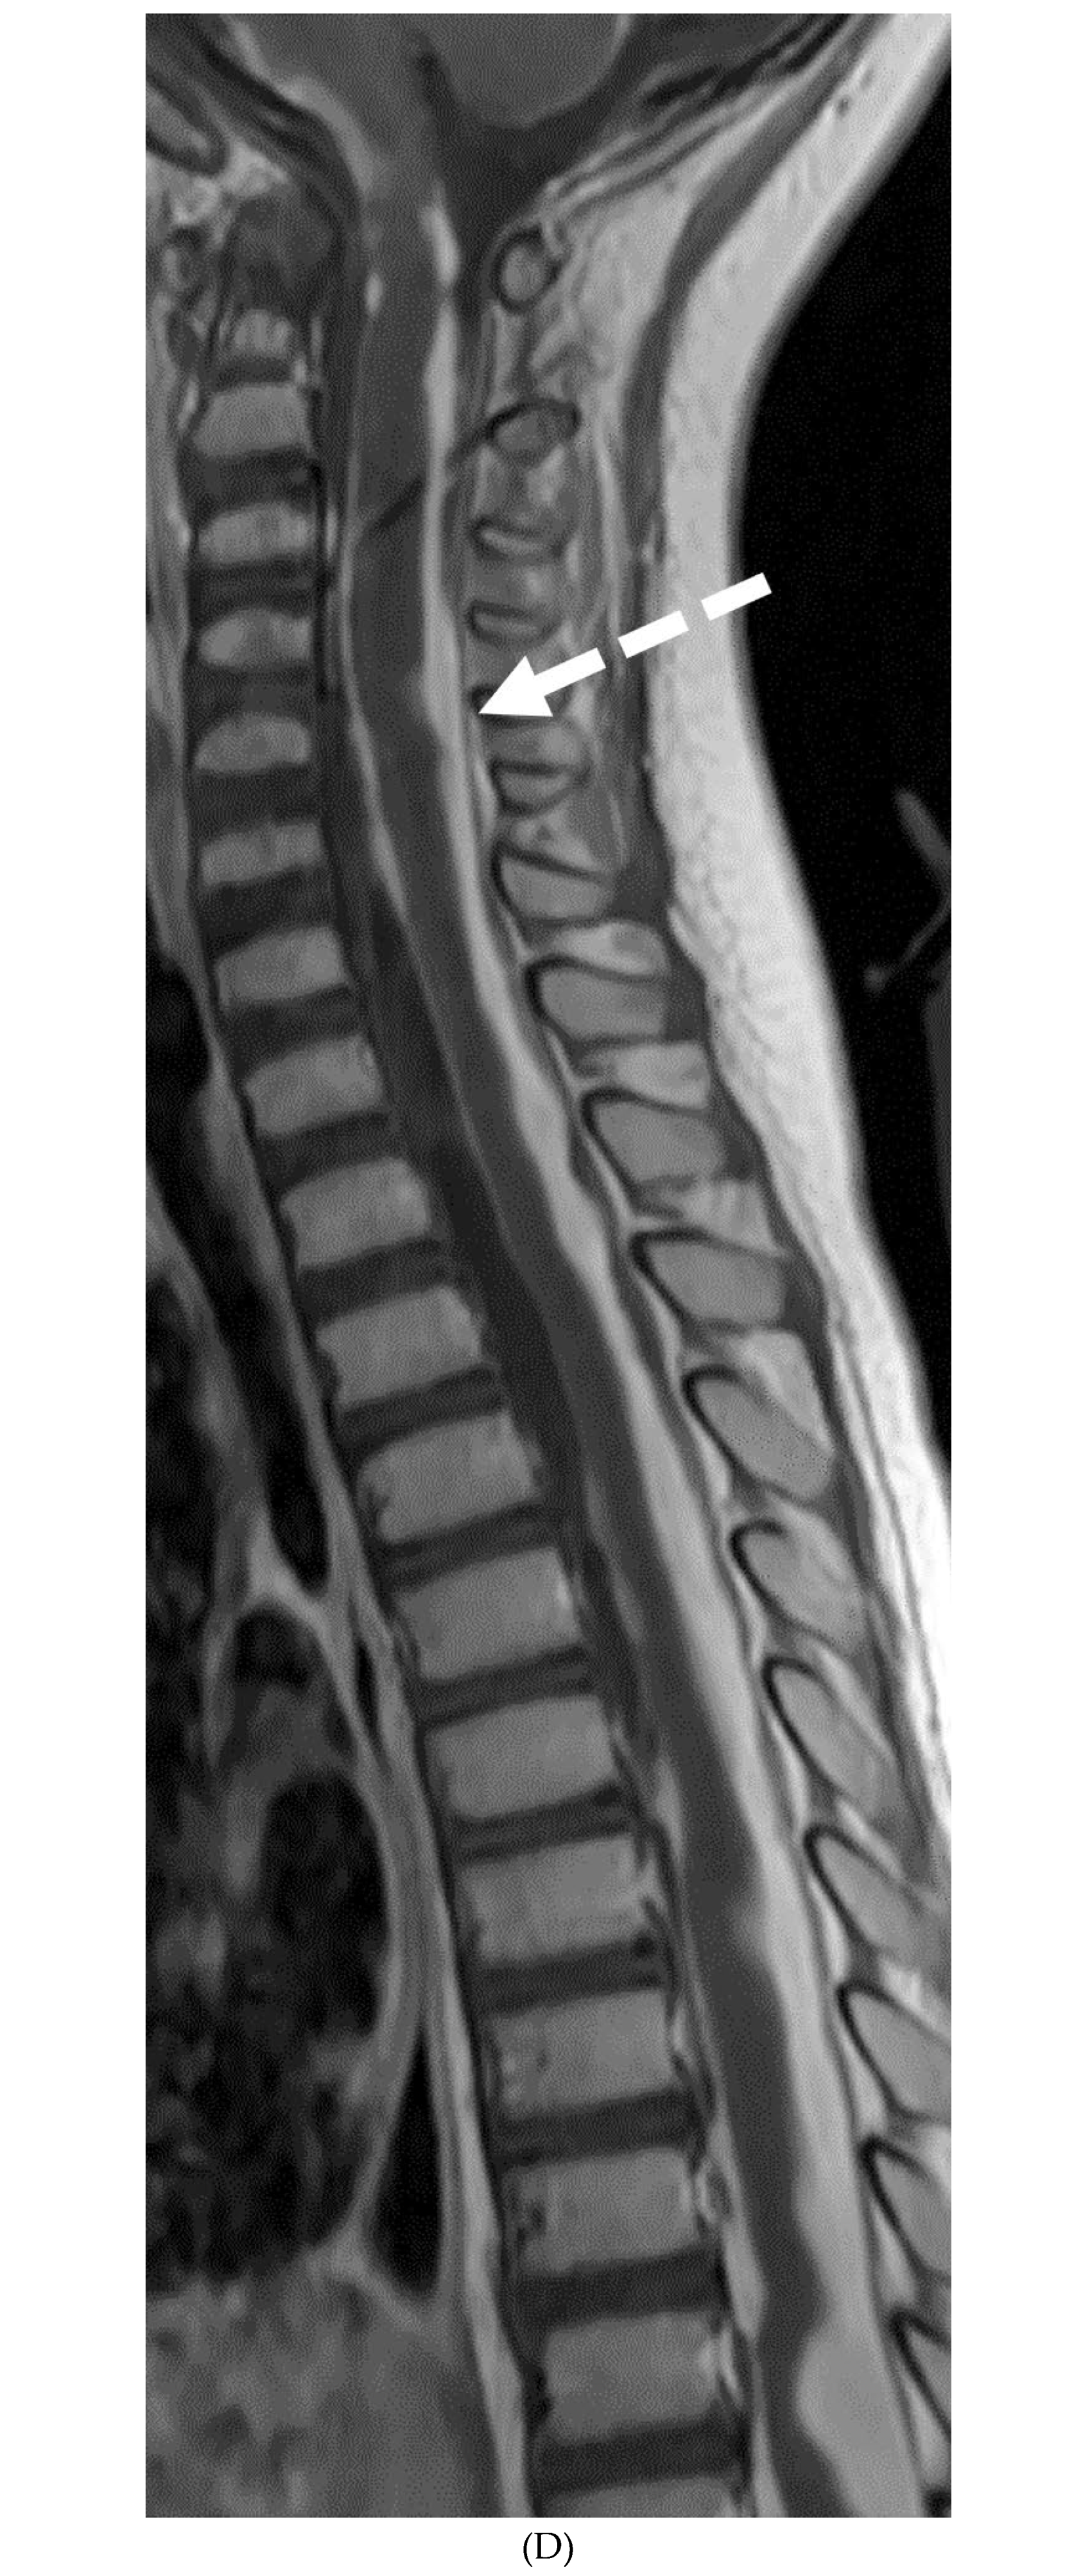
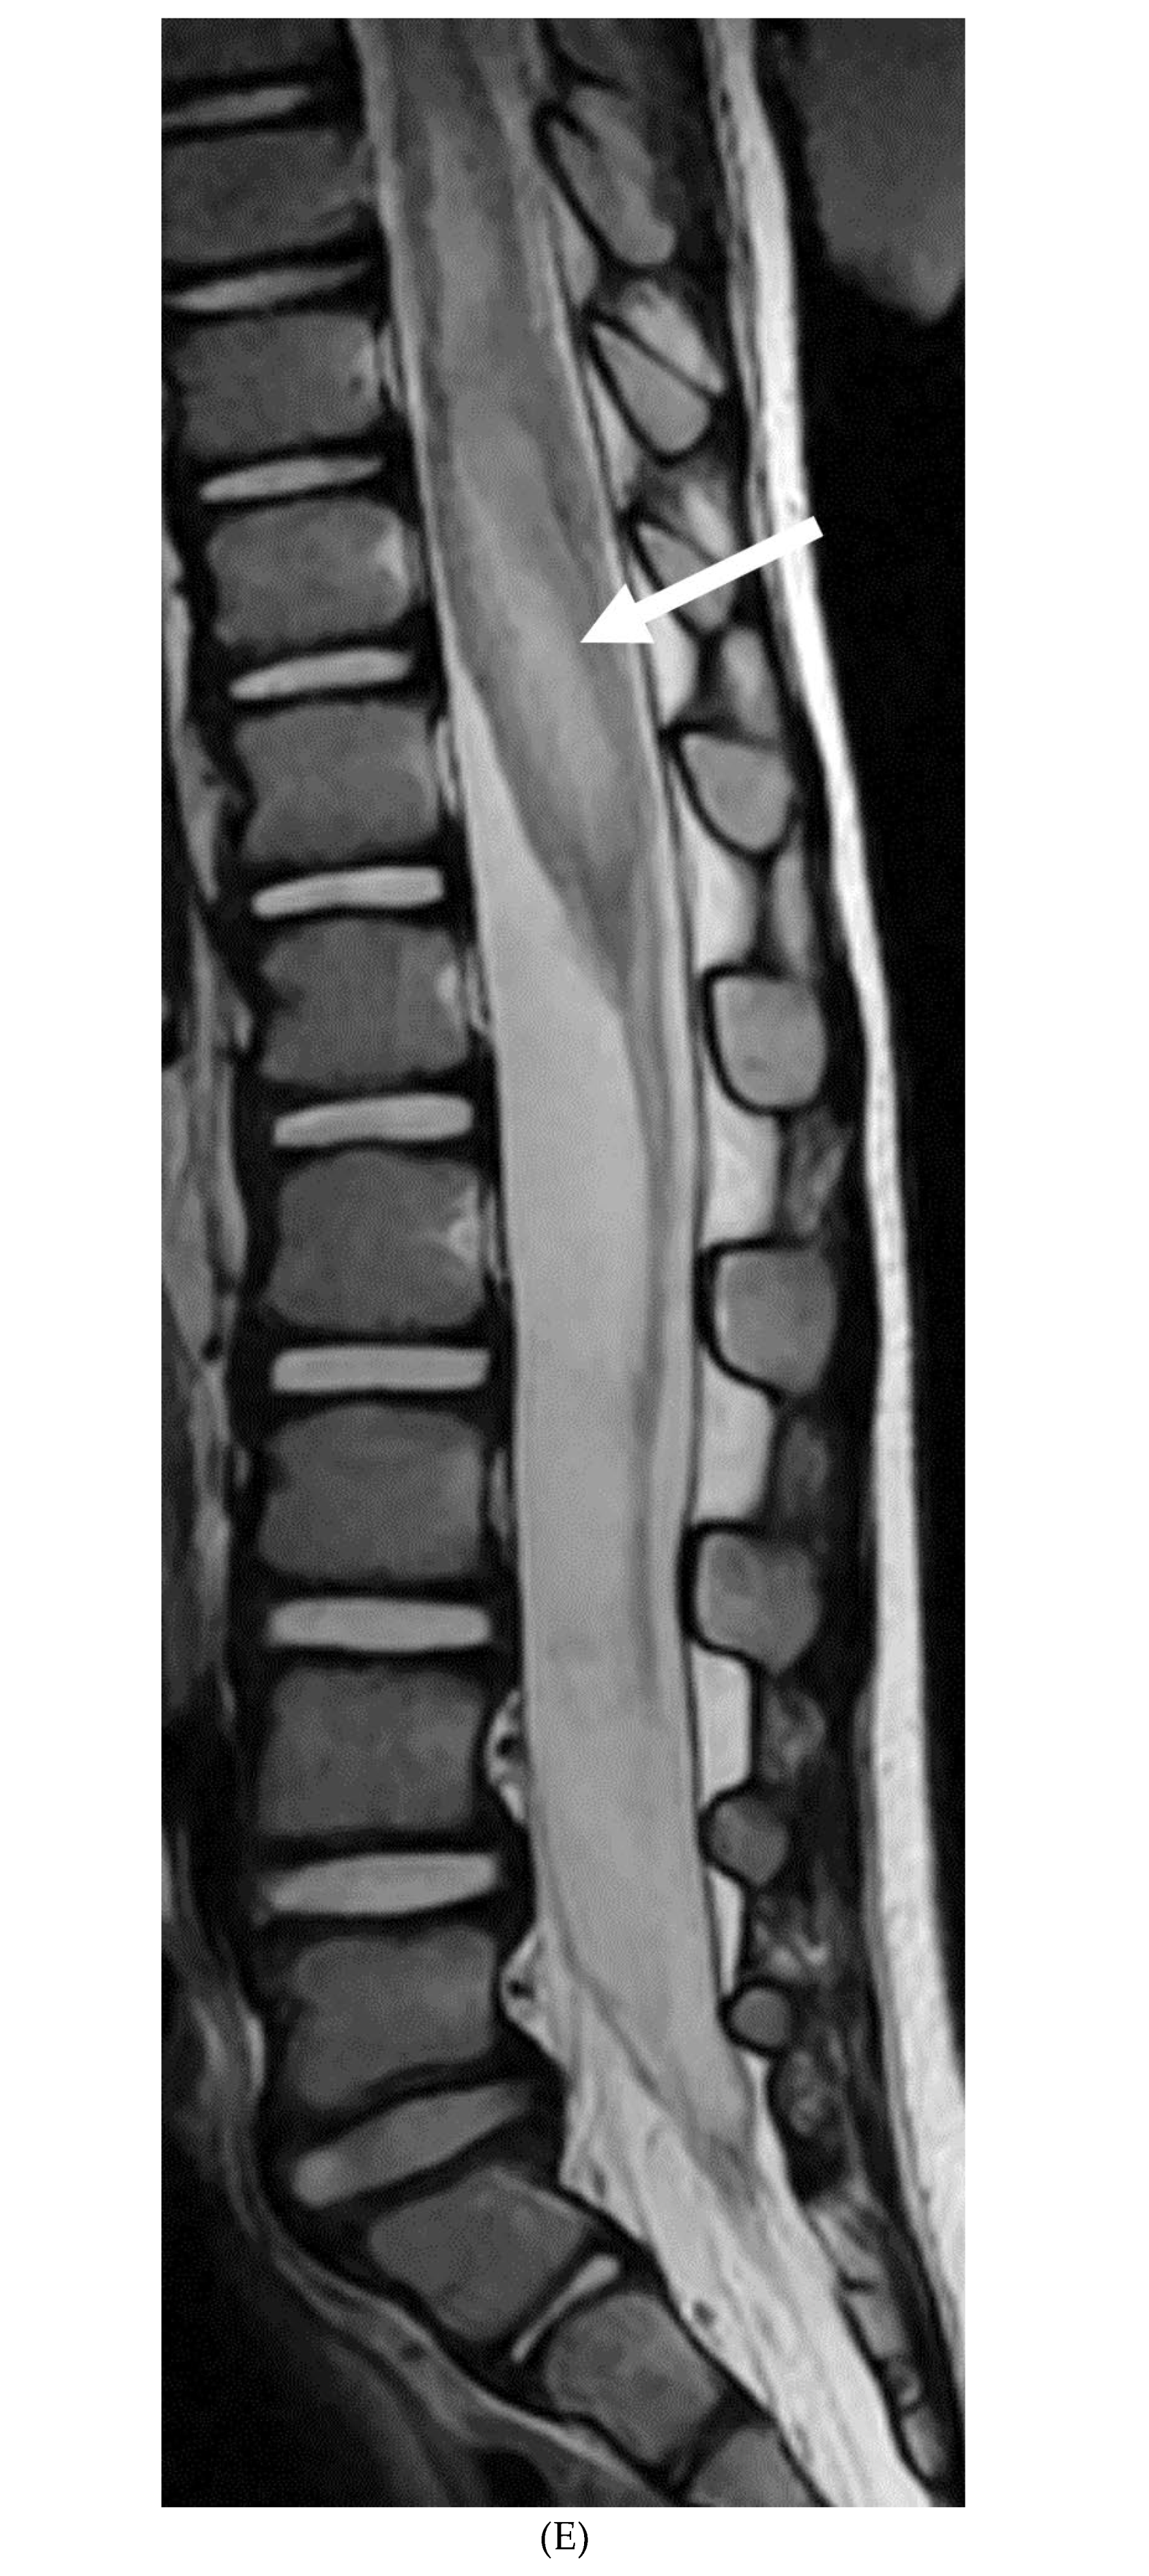
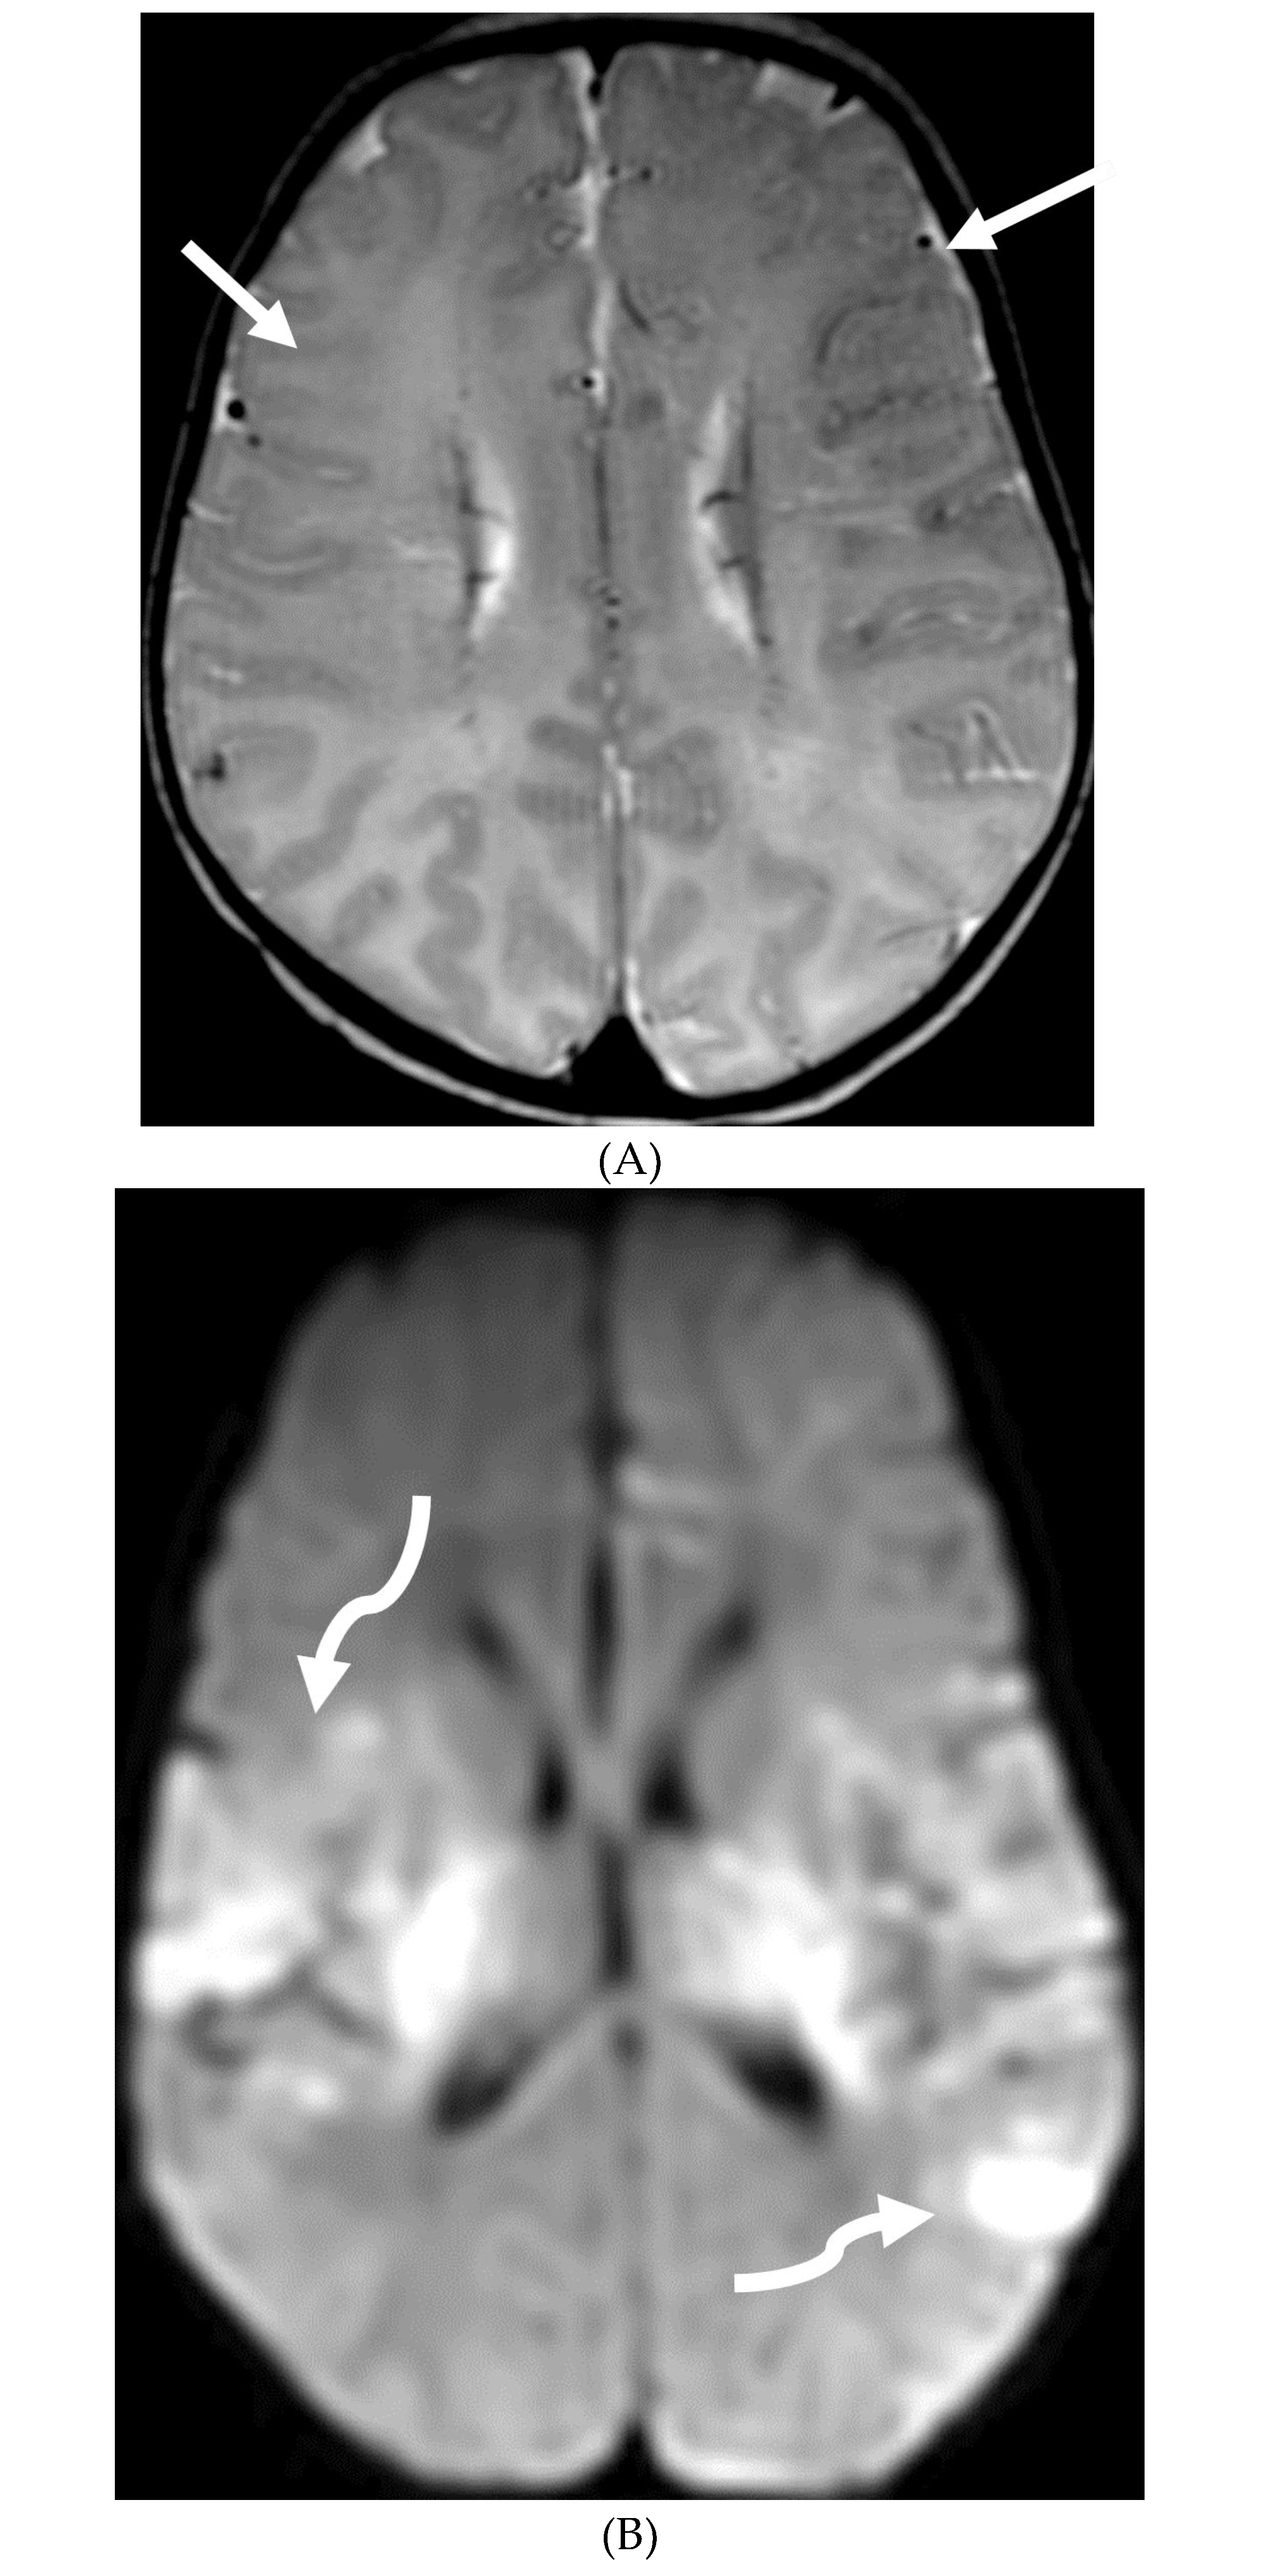
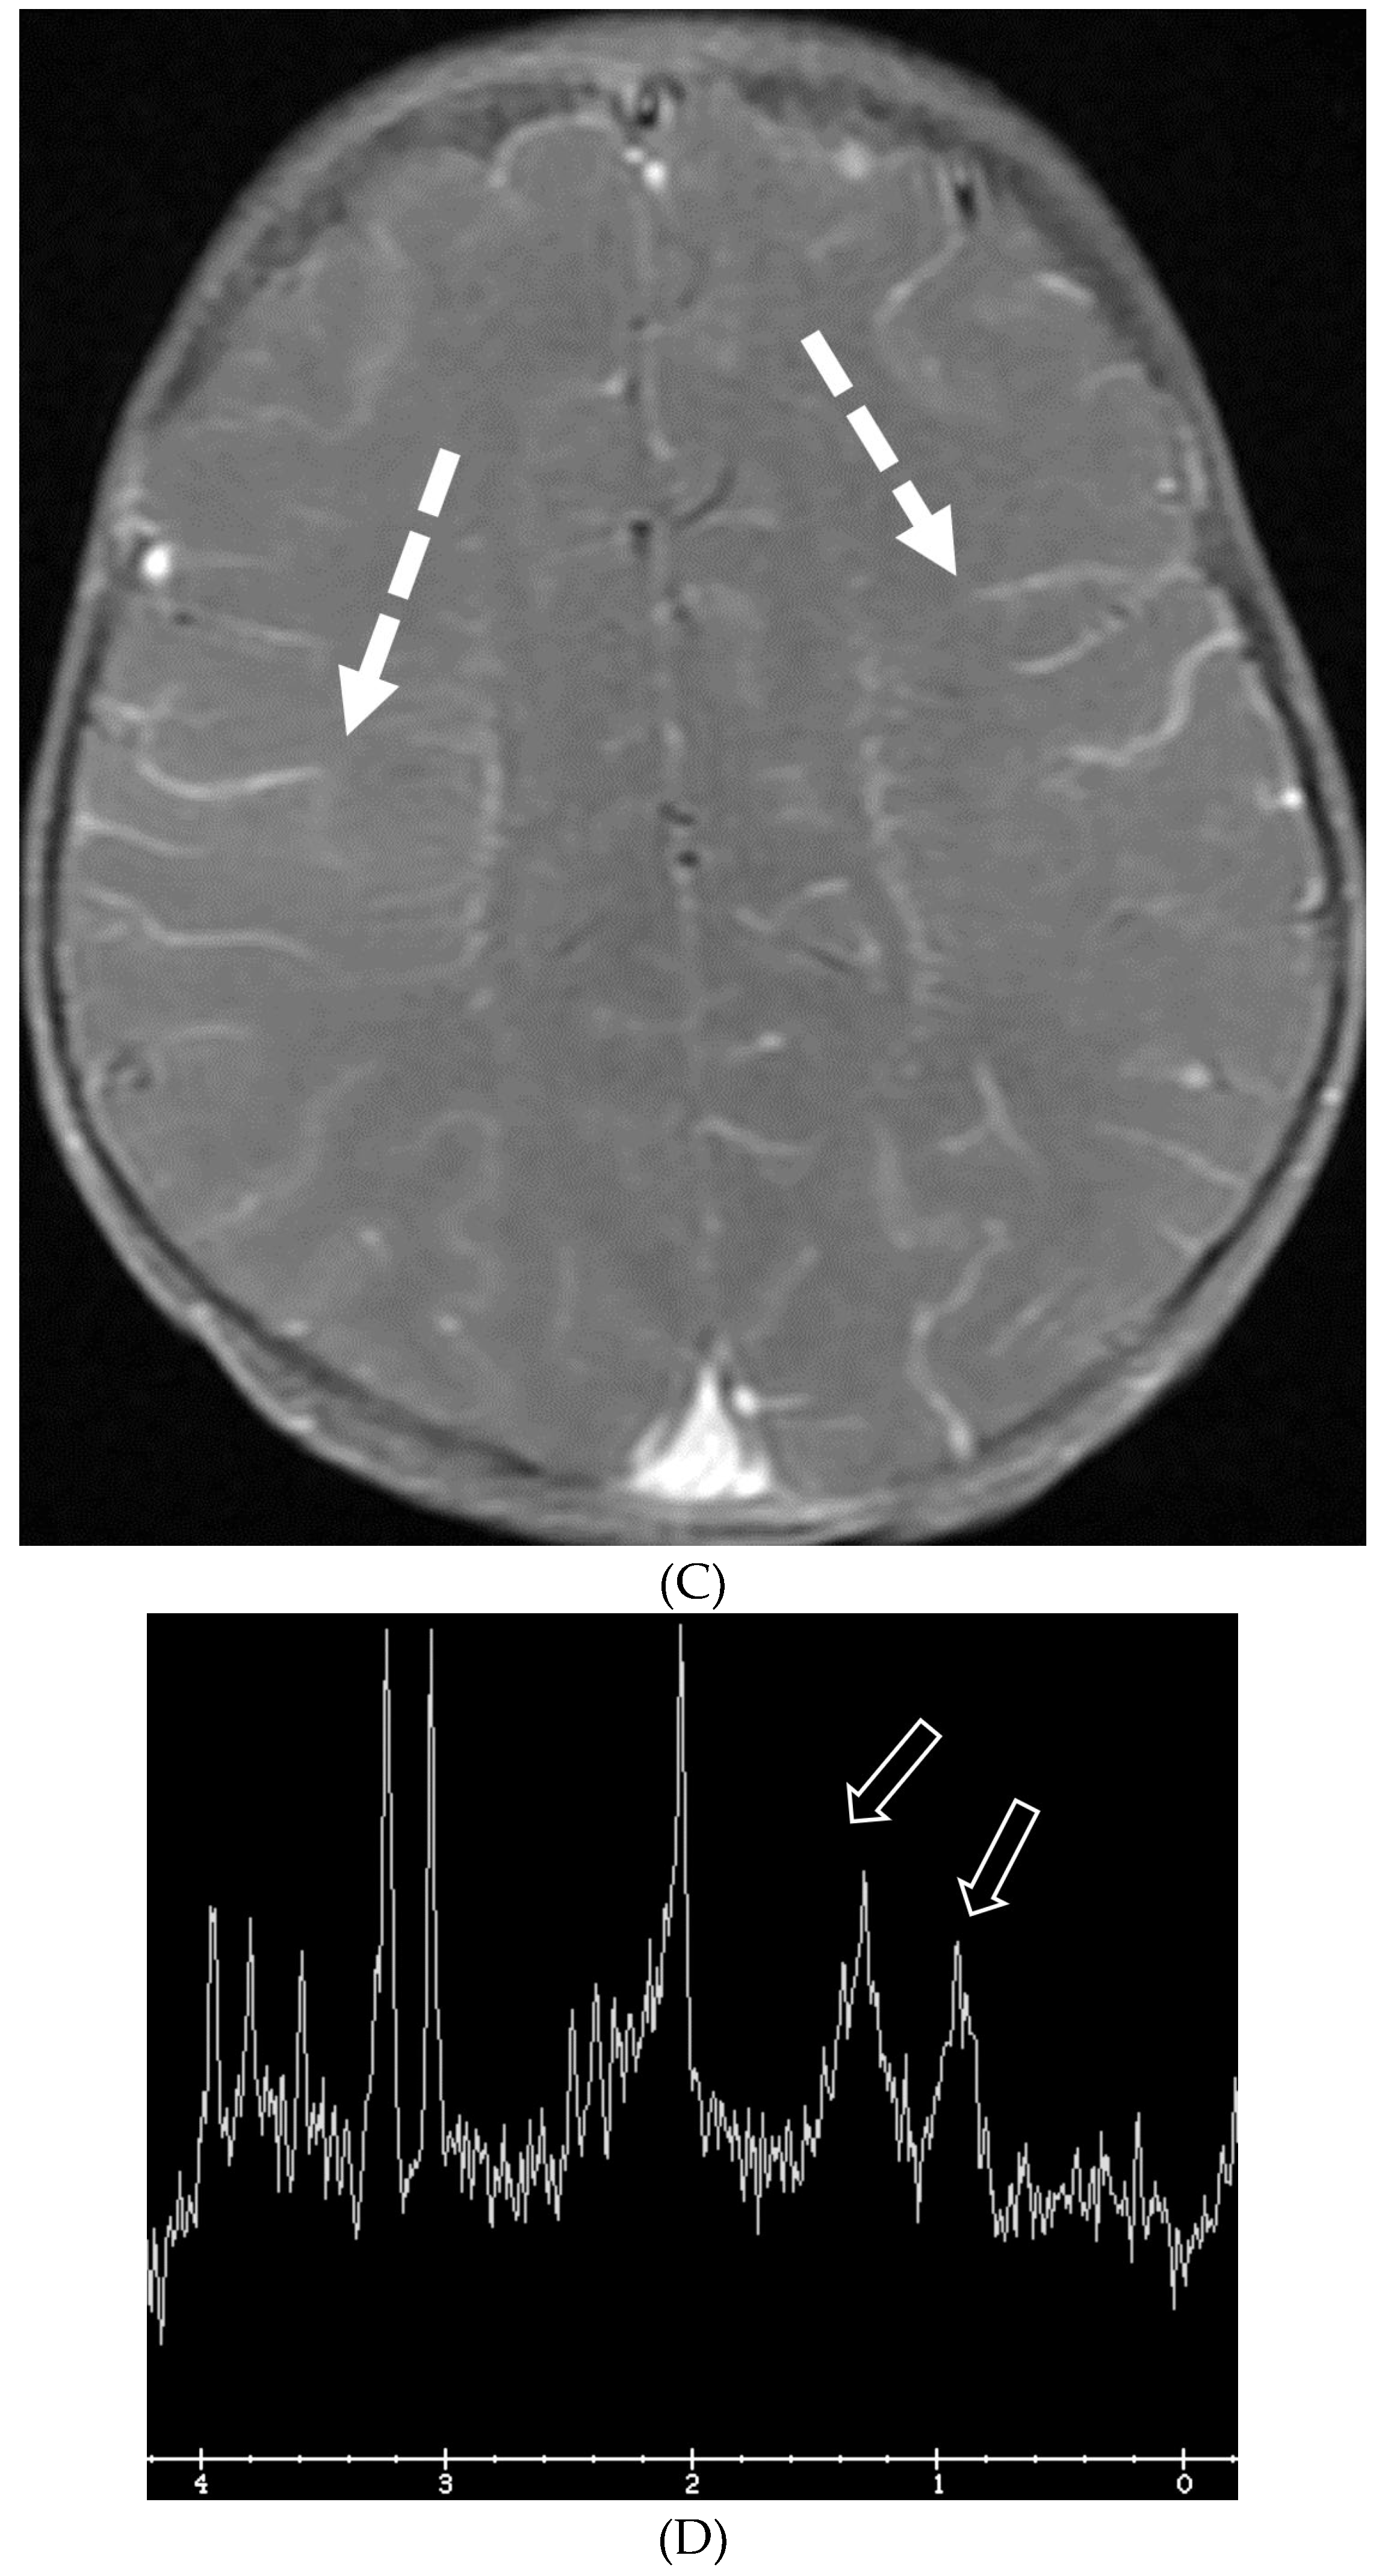
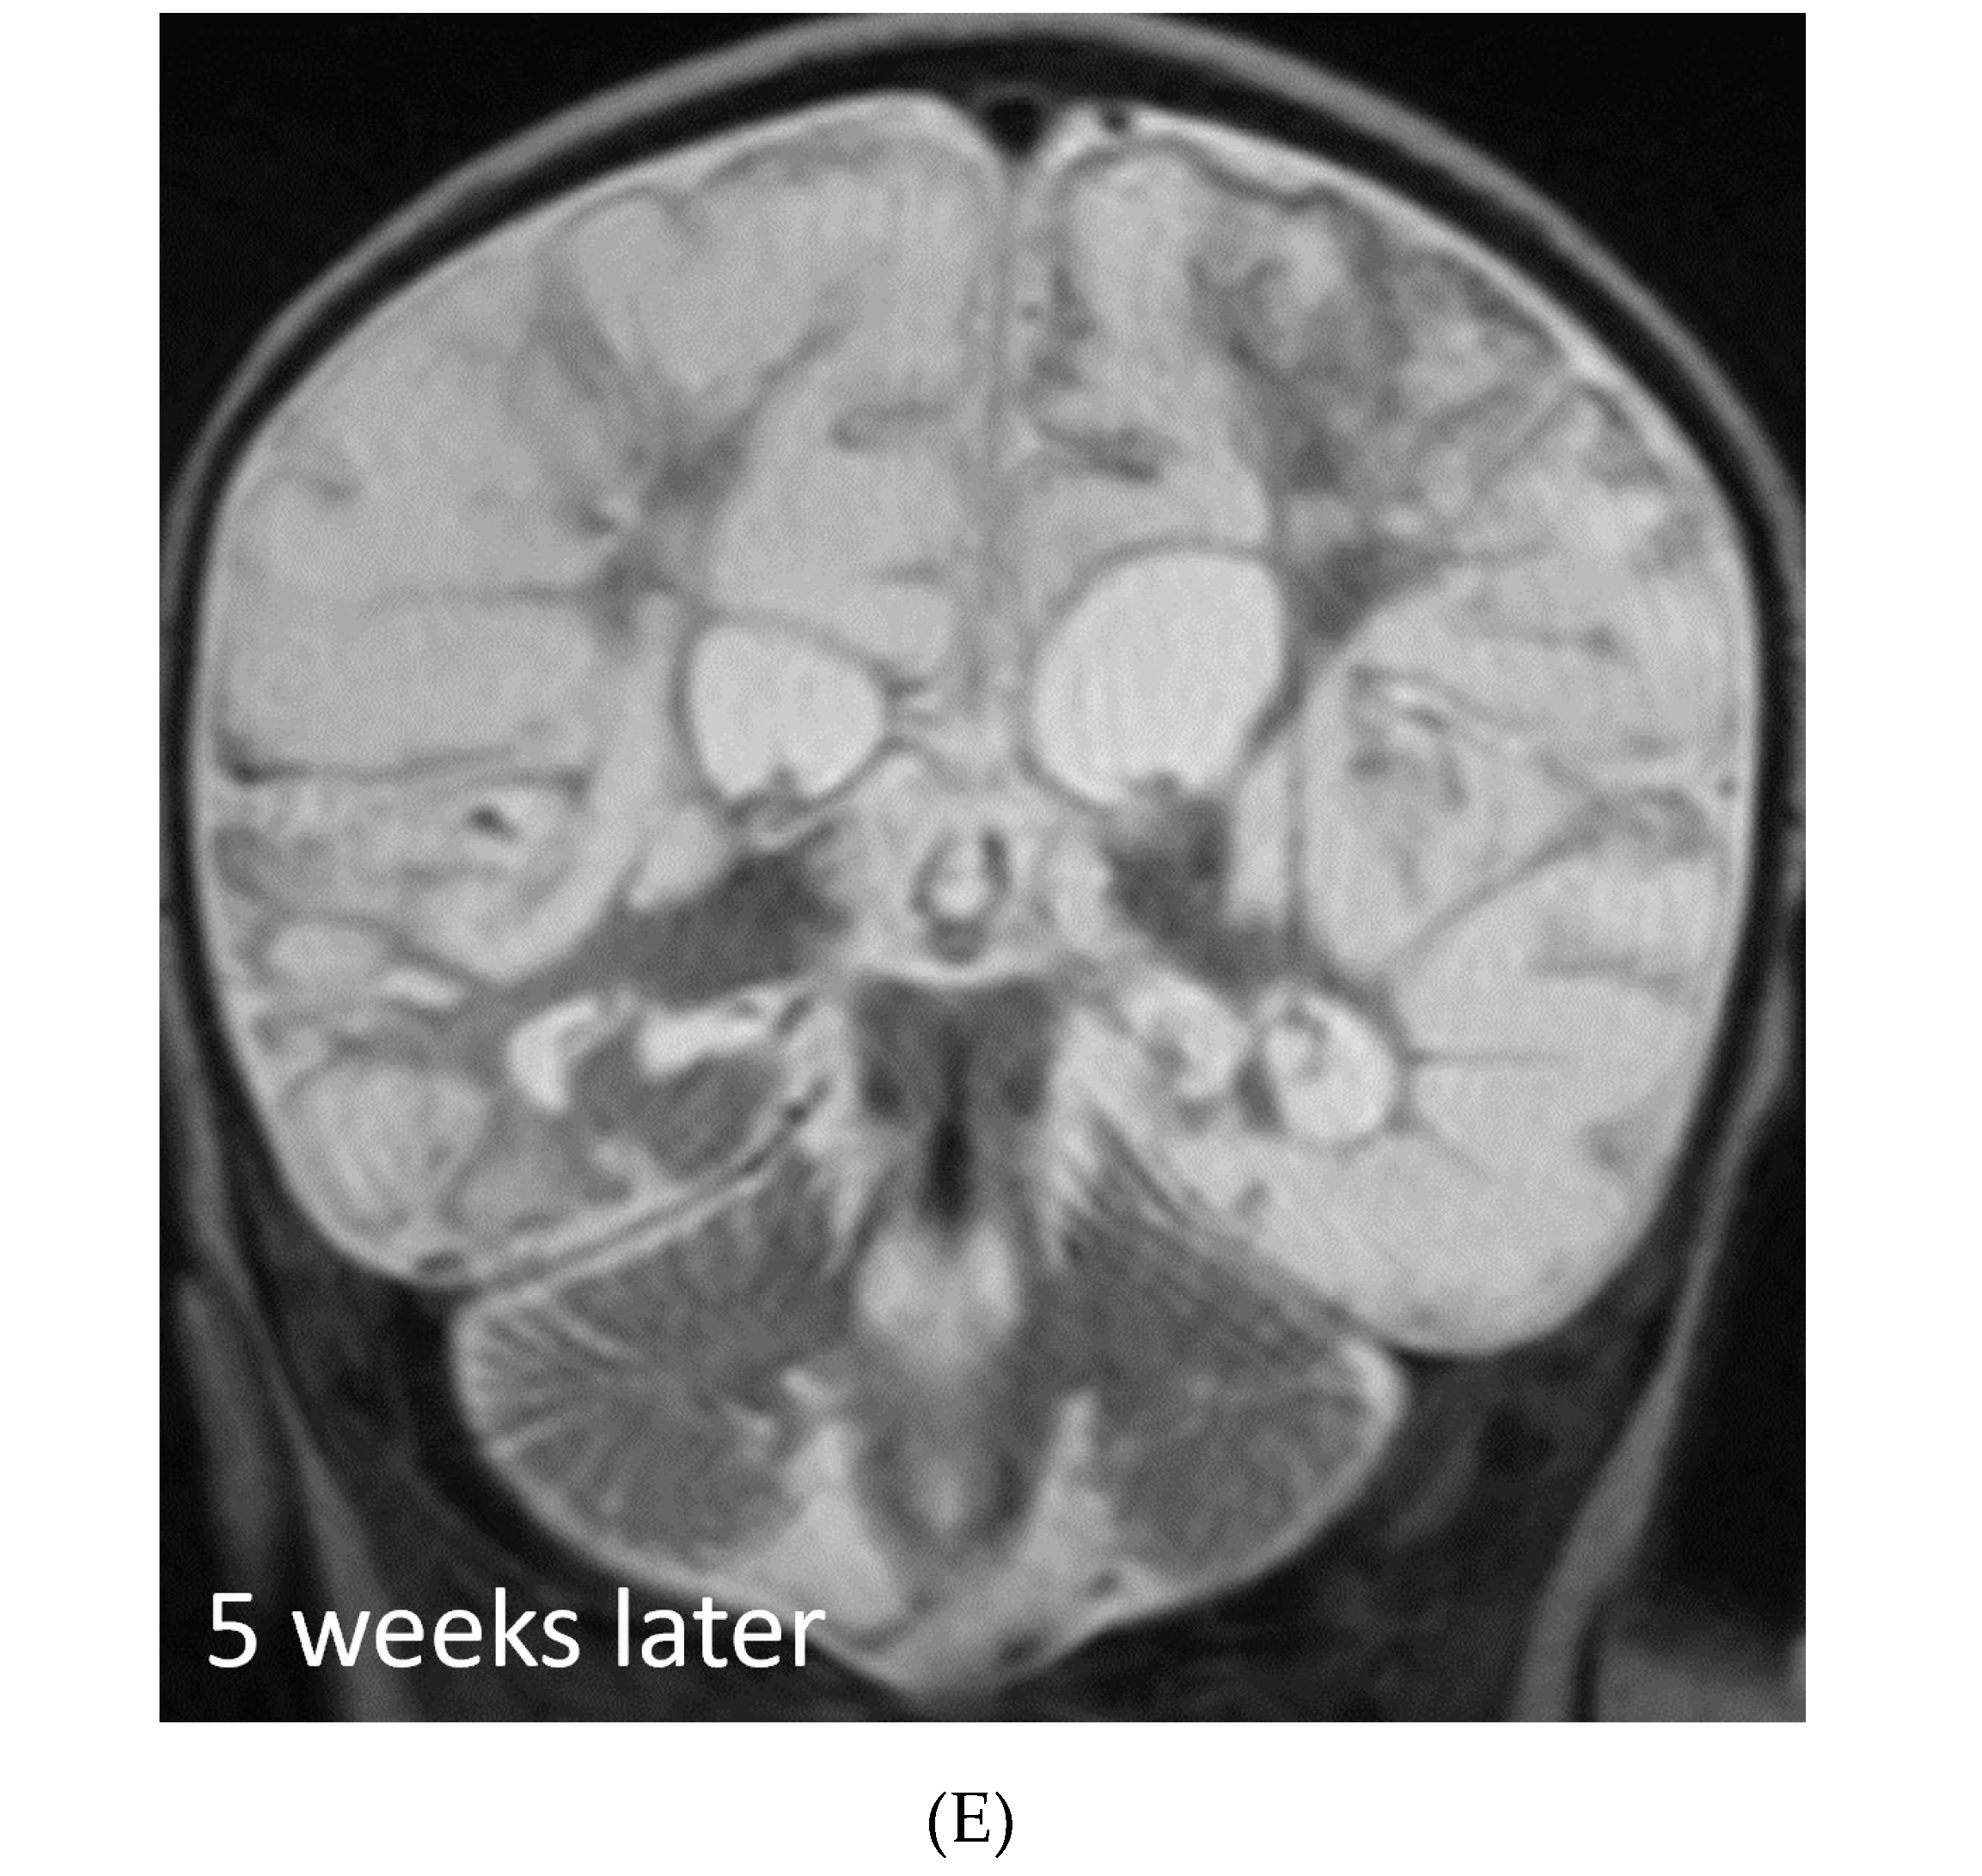
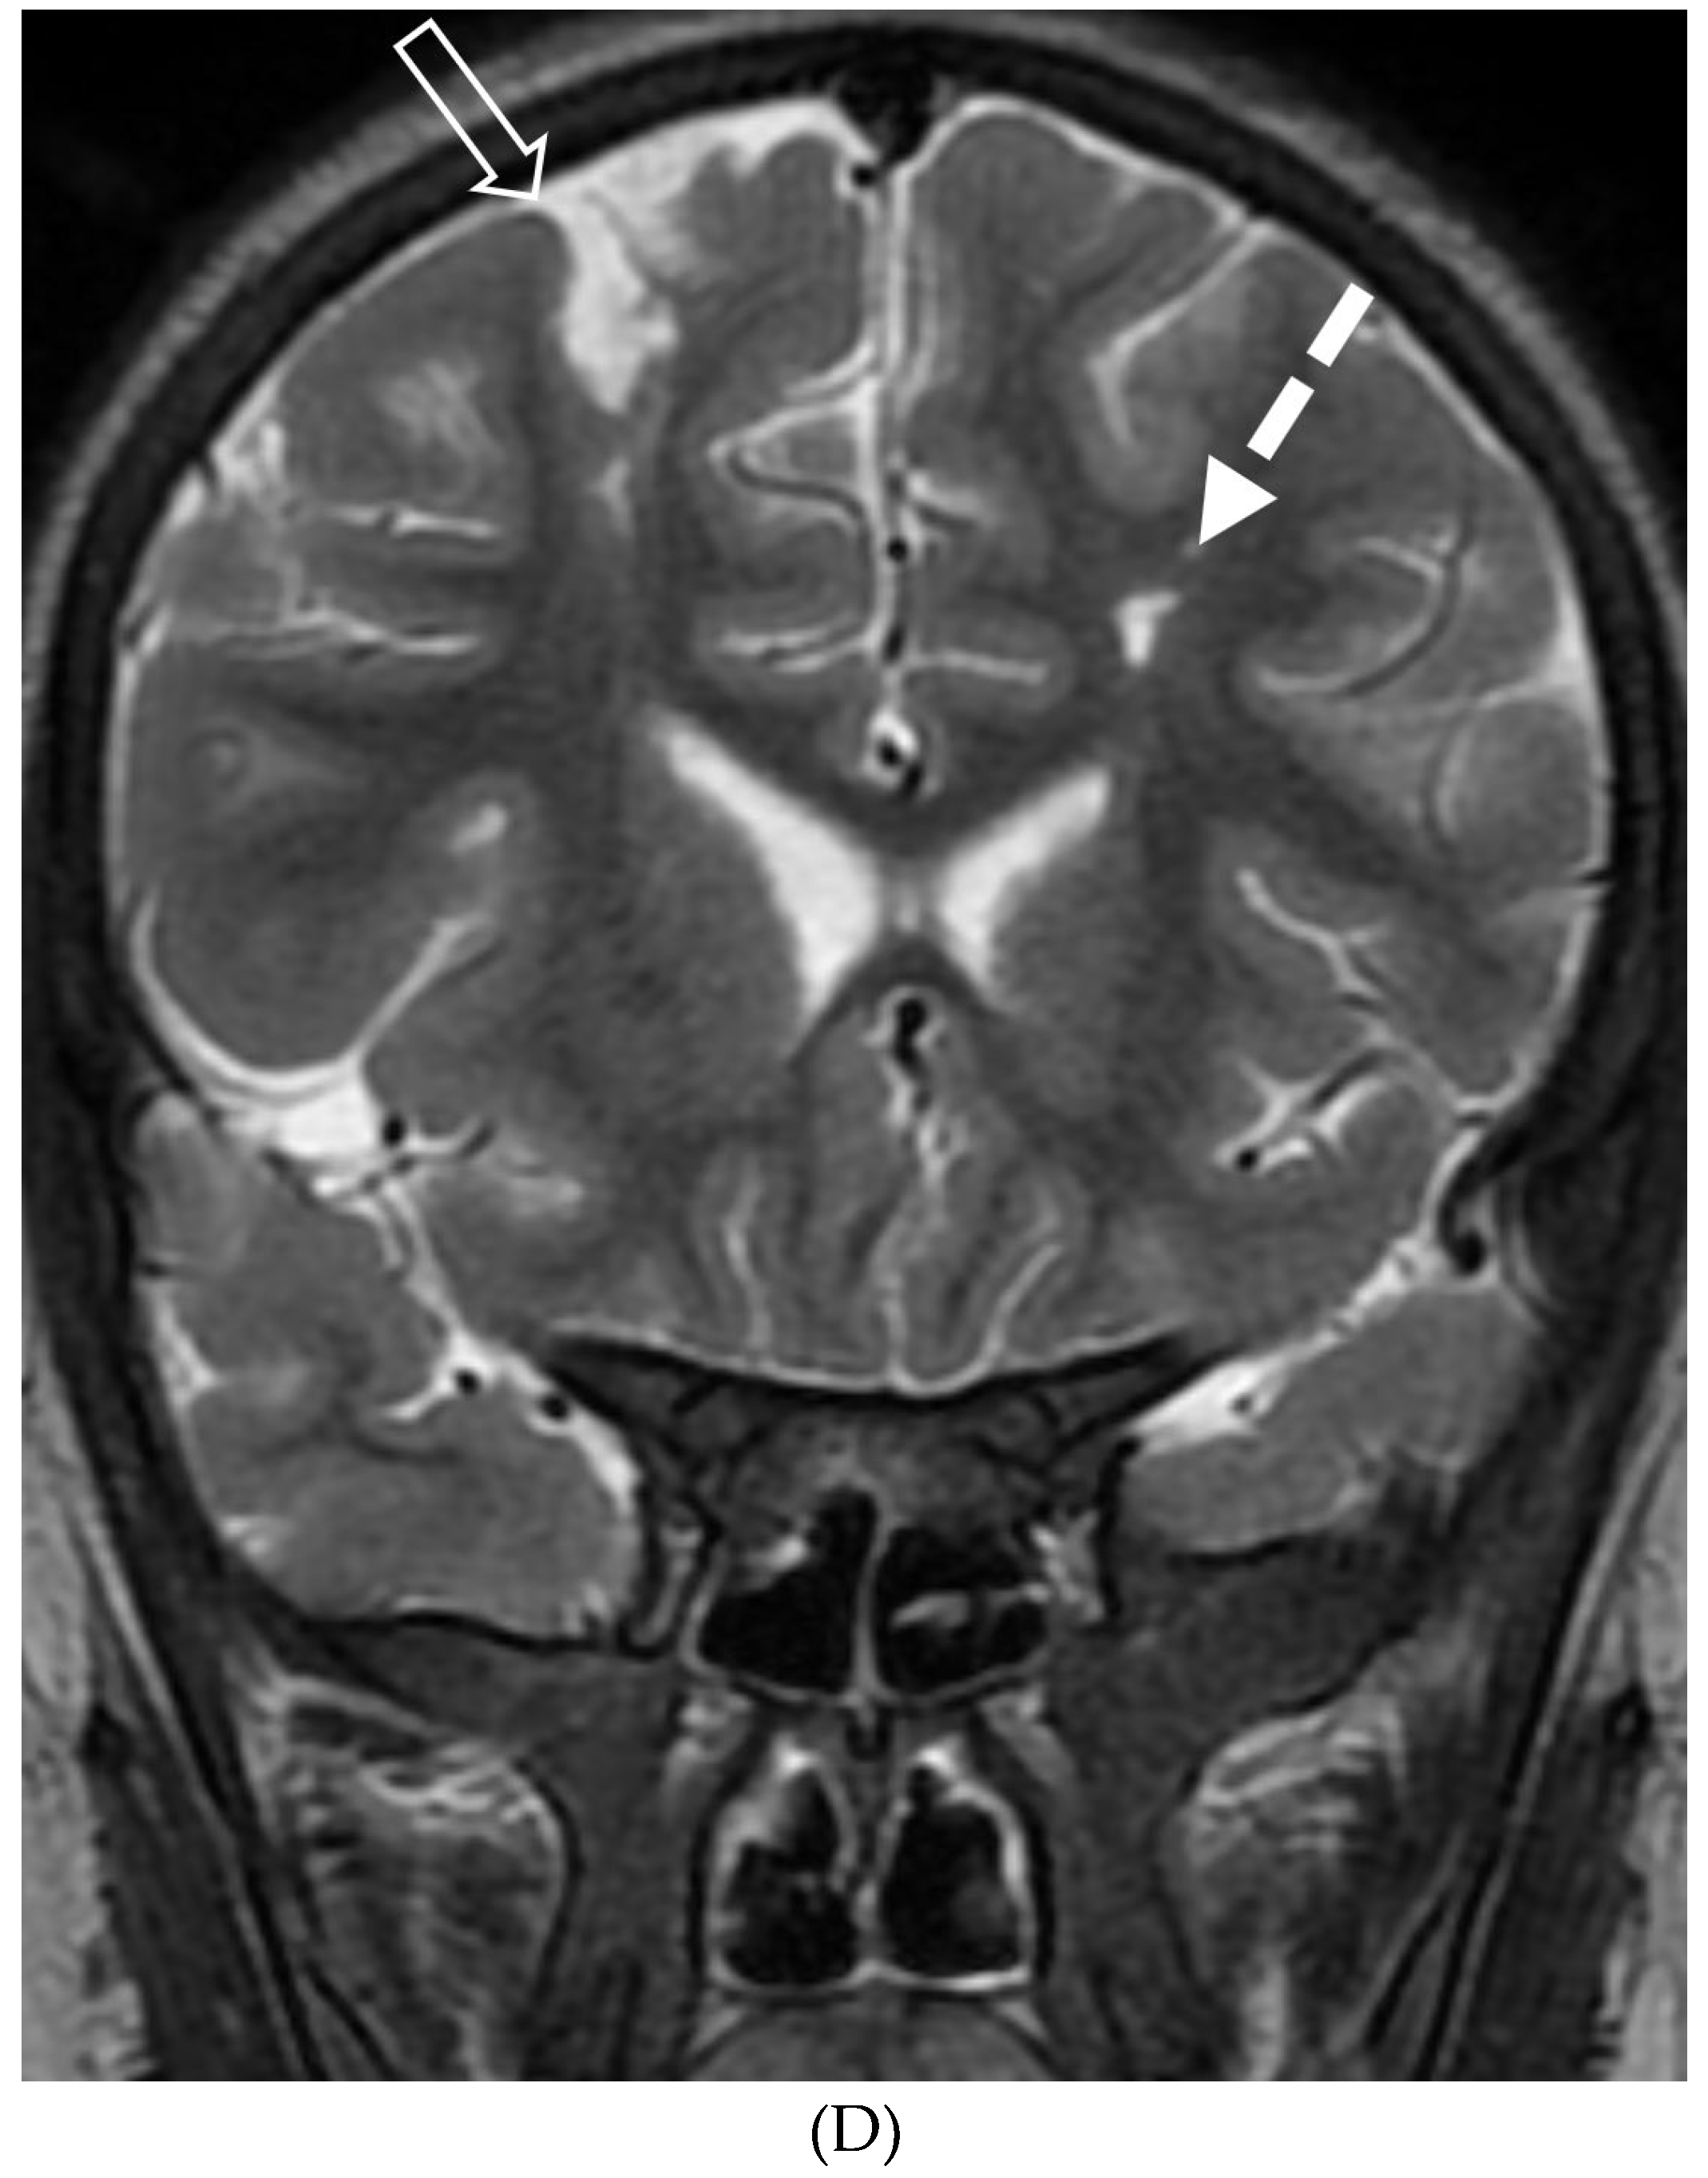
BACTERIAL MENINGITIS
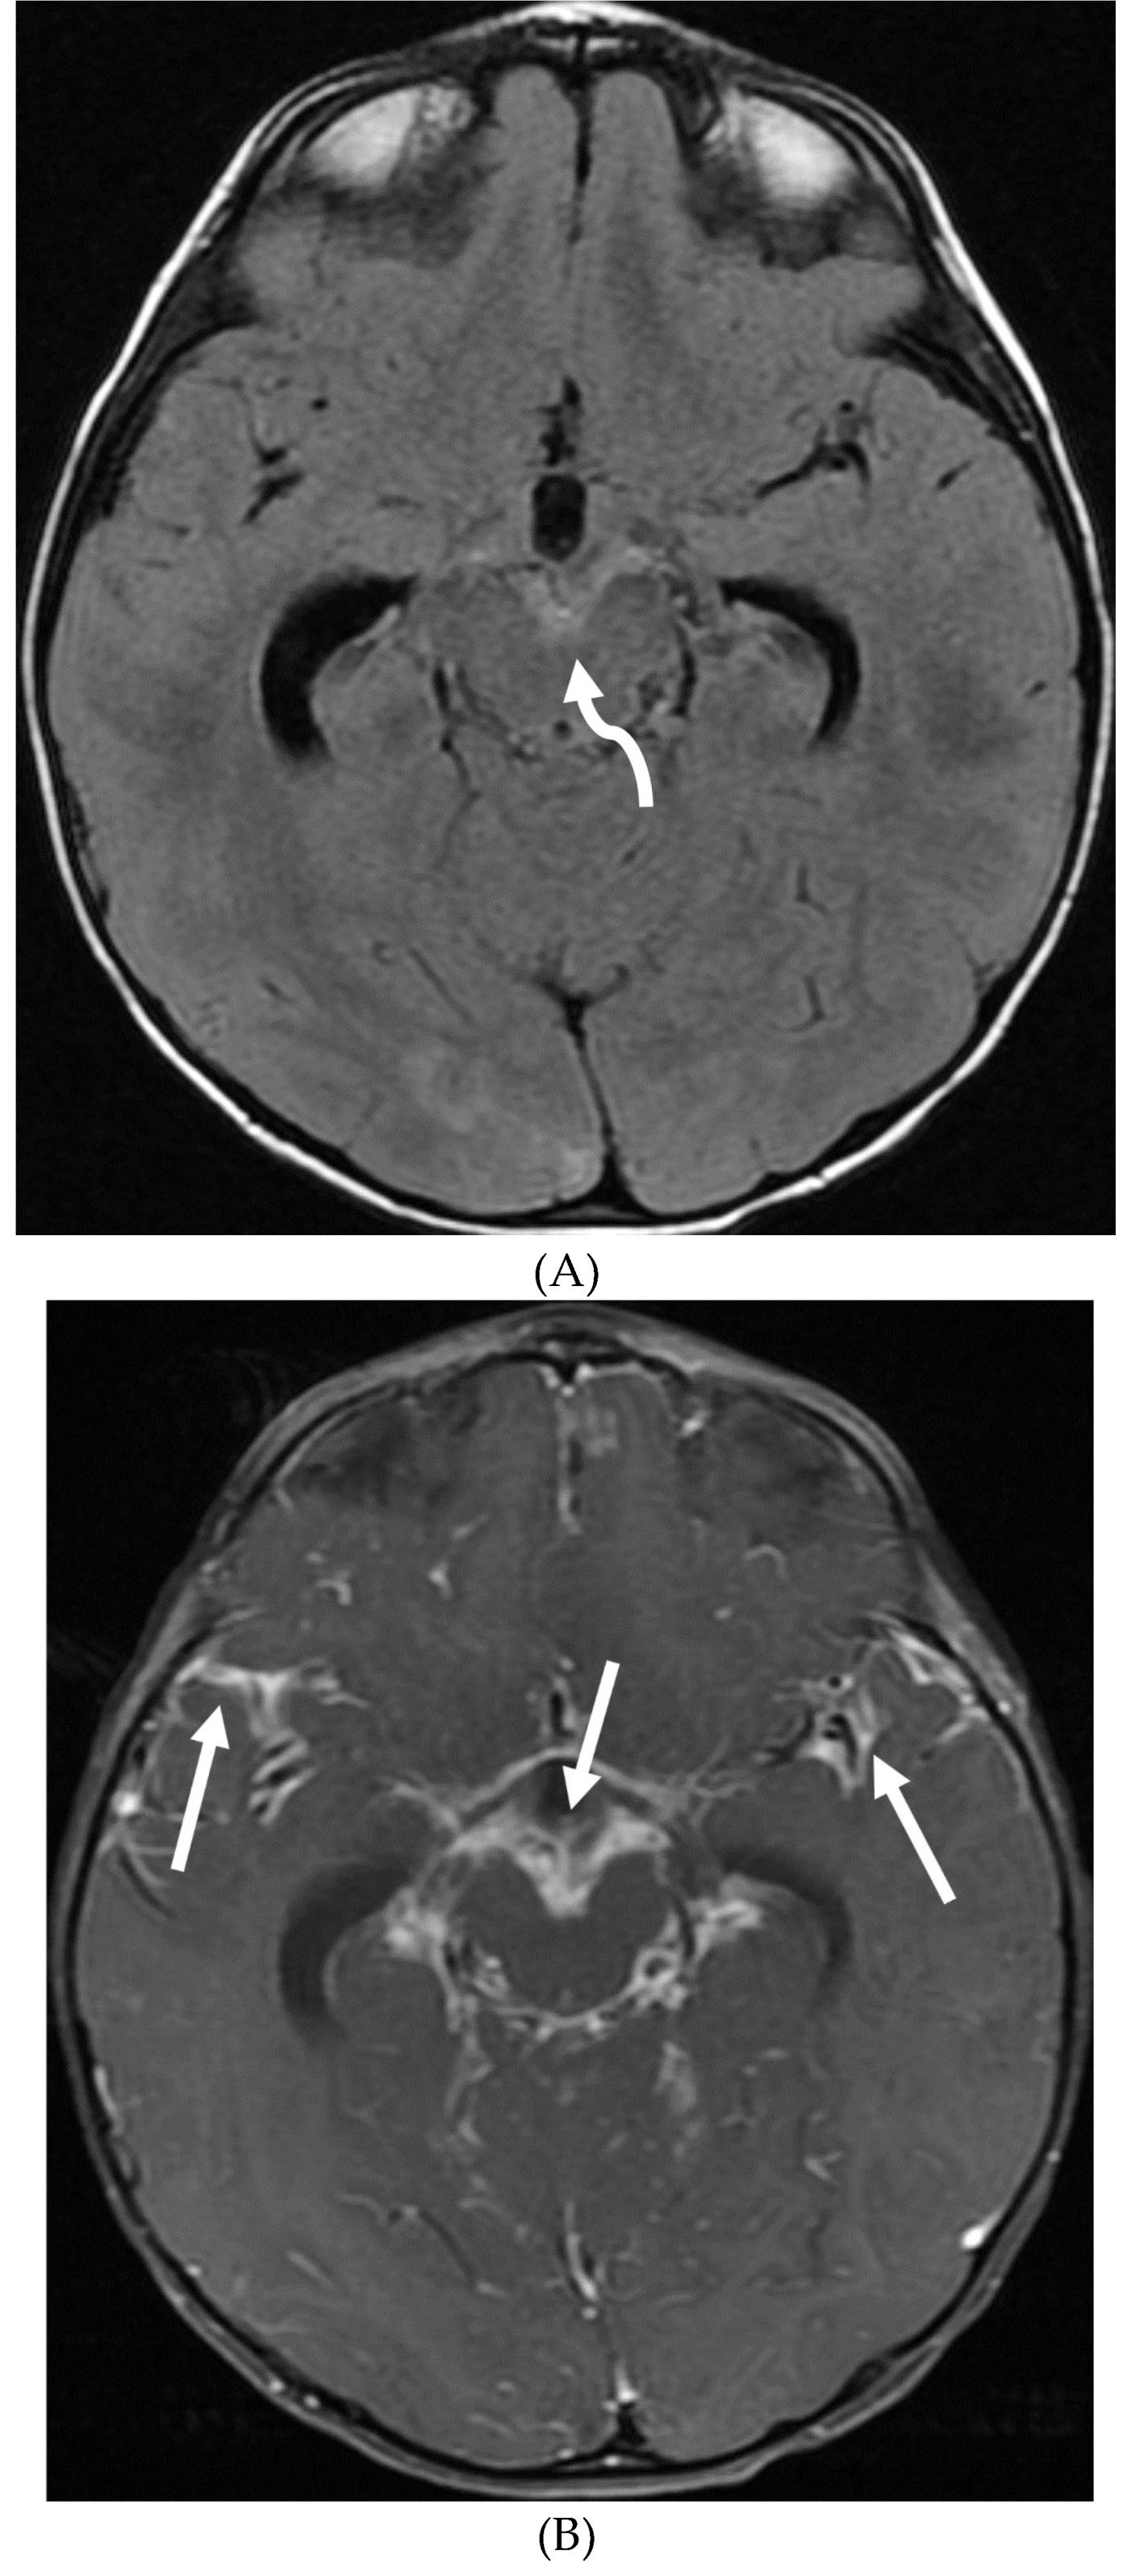
TUBERCULOSIS
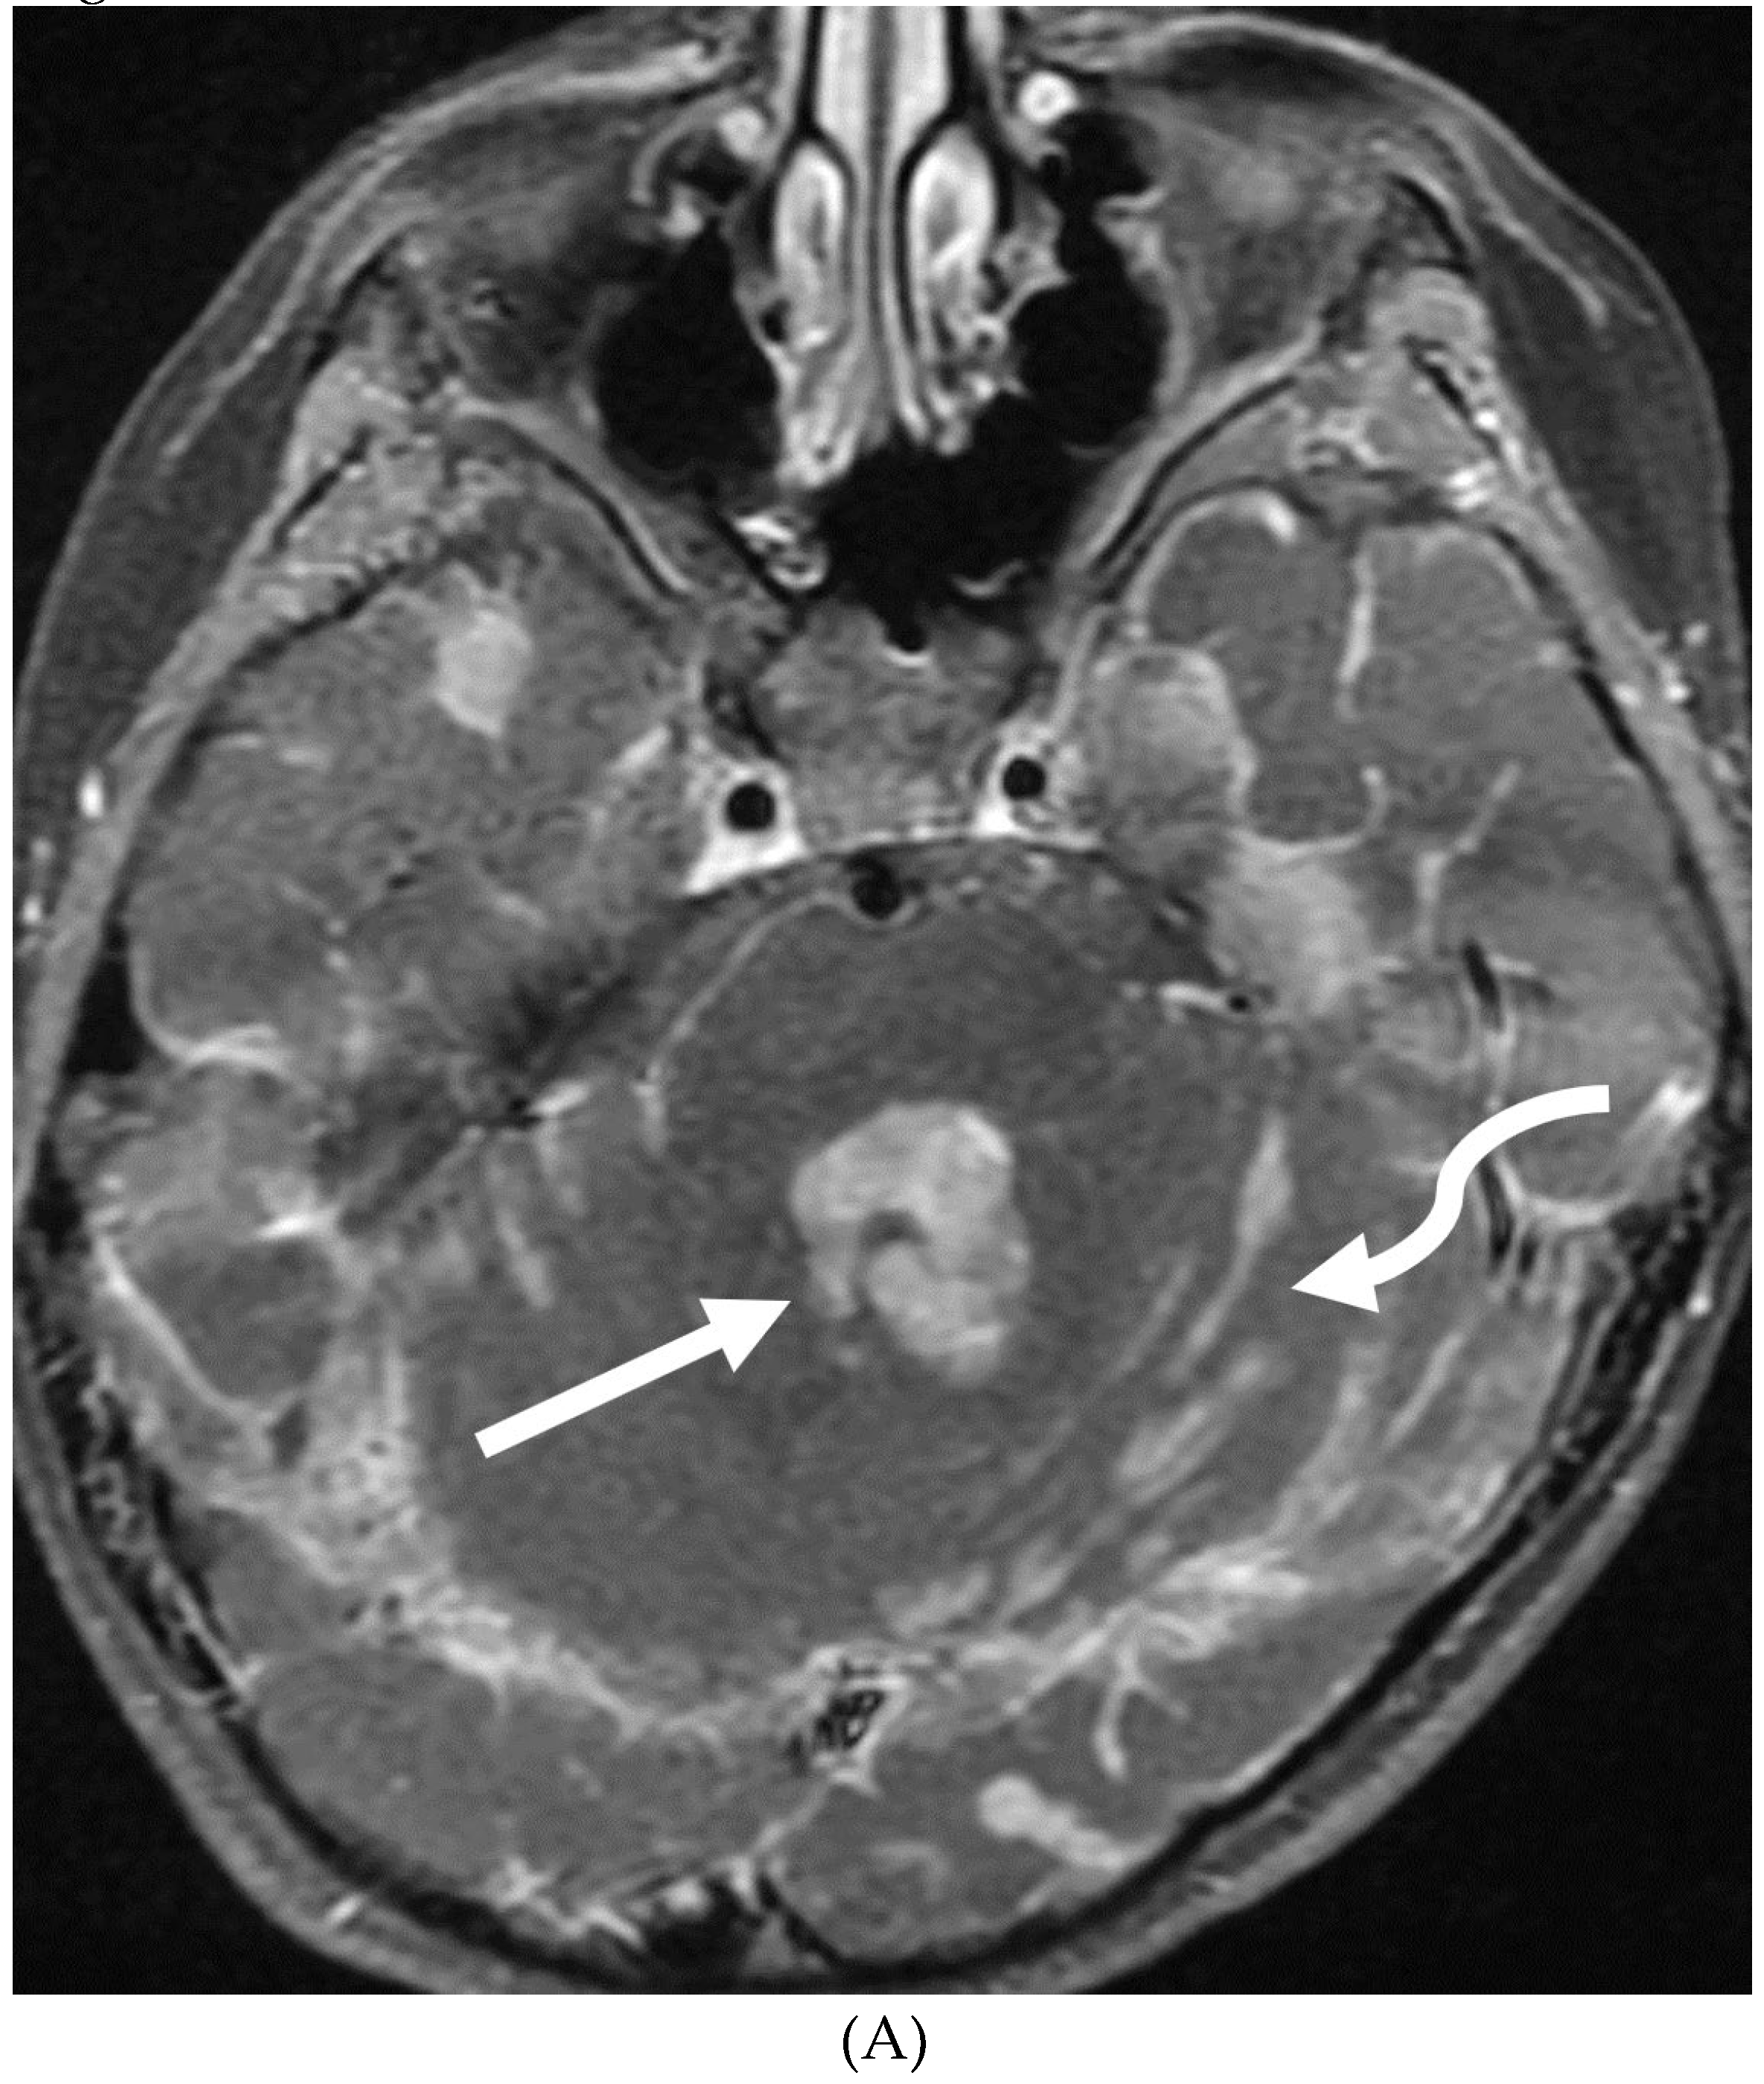
PRIMARY BRAIN TUMOR LEPTOMENINGEAL METASTASES
SYSTEMIC MENINGEAL METASTASES (SMM)
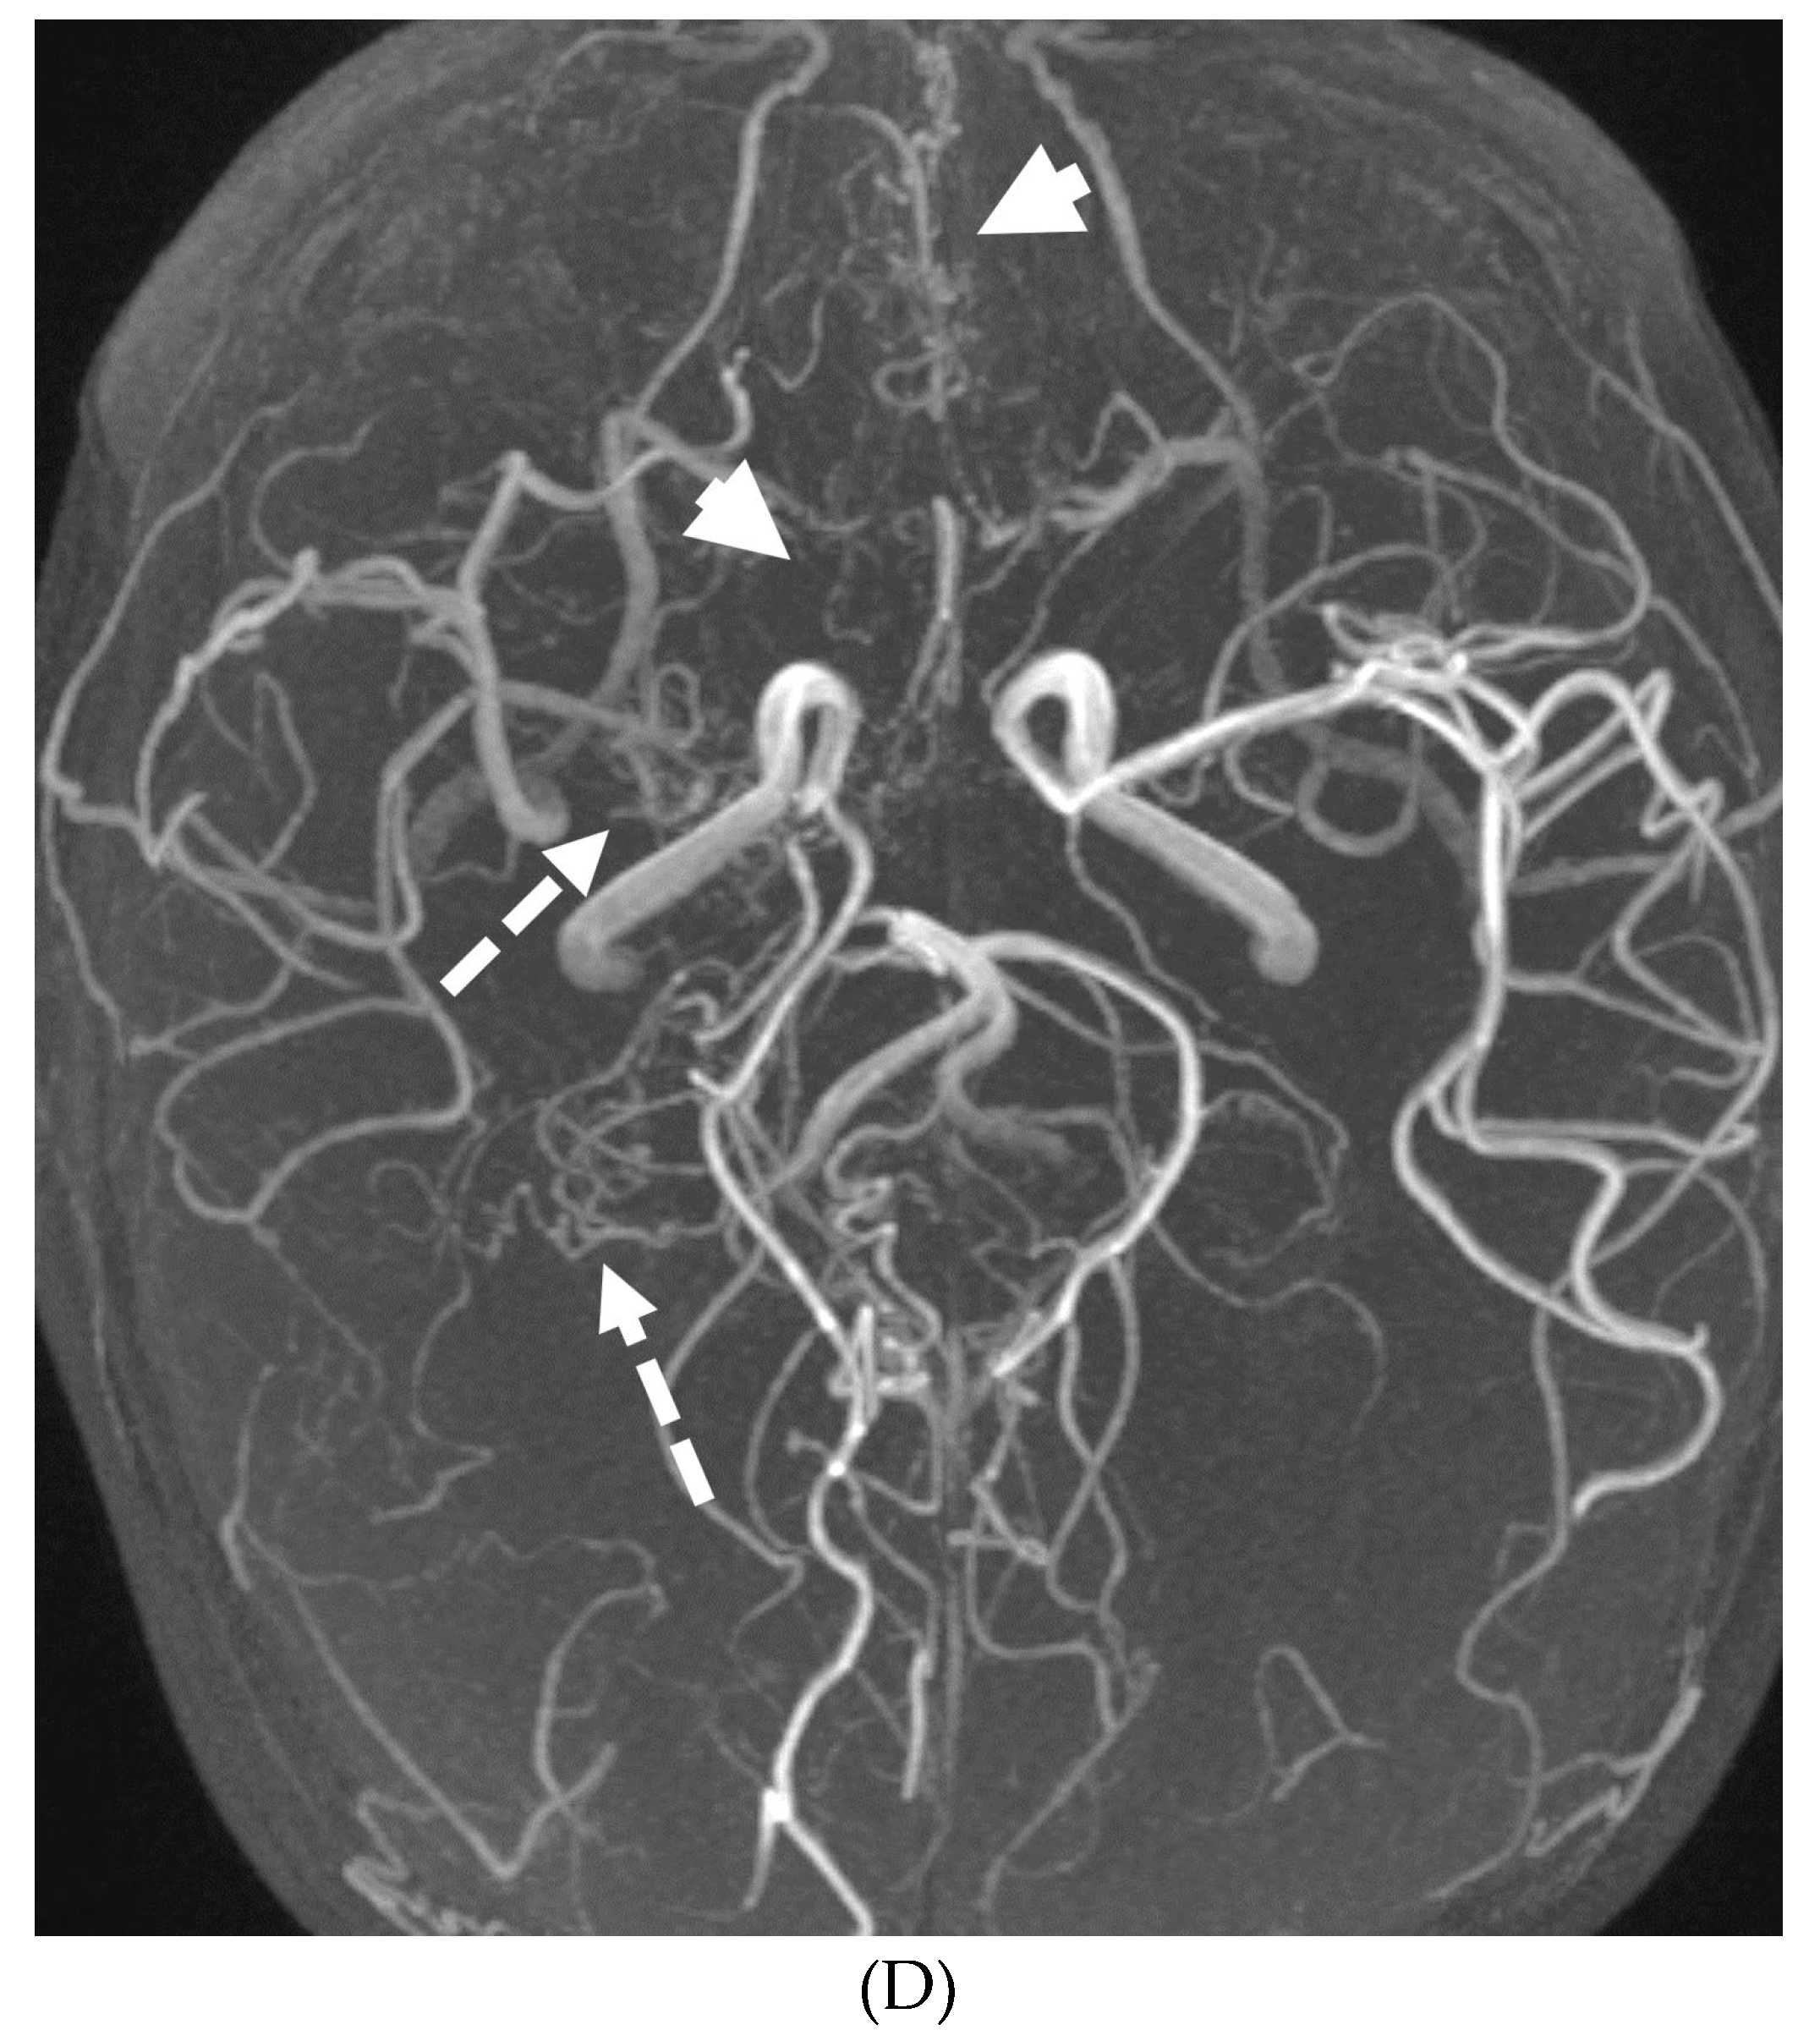
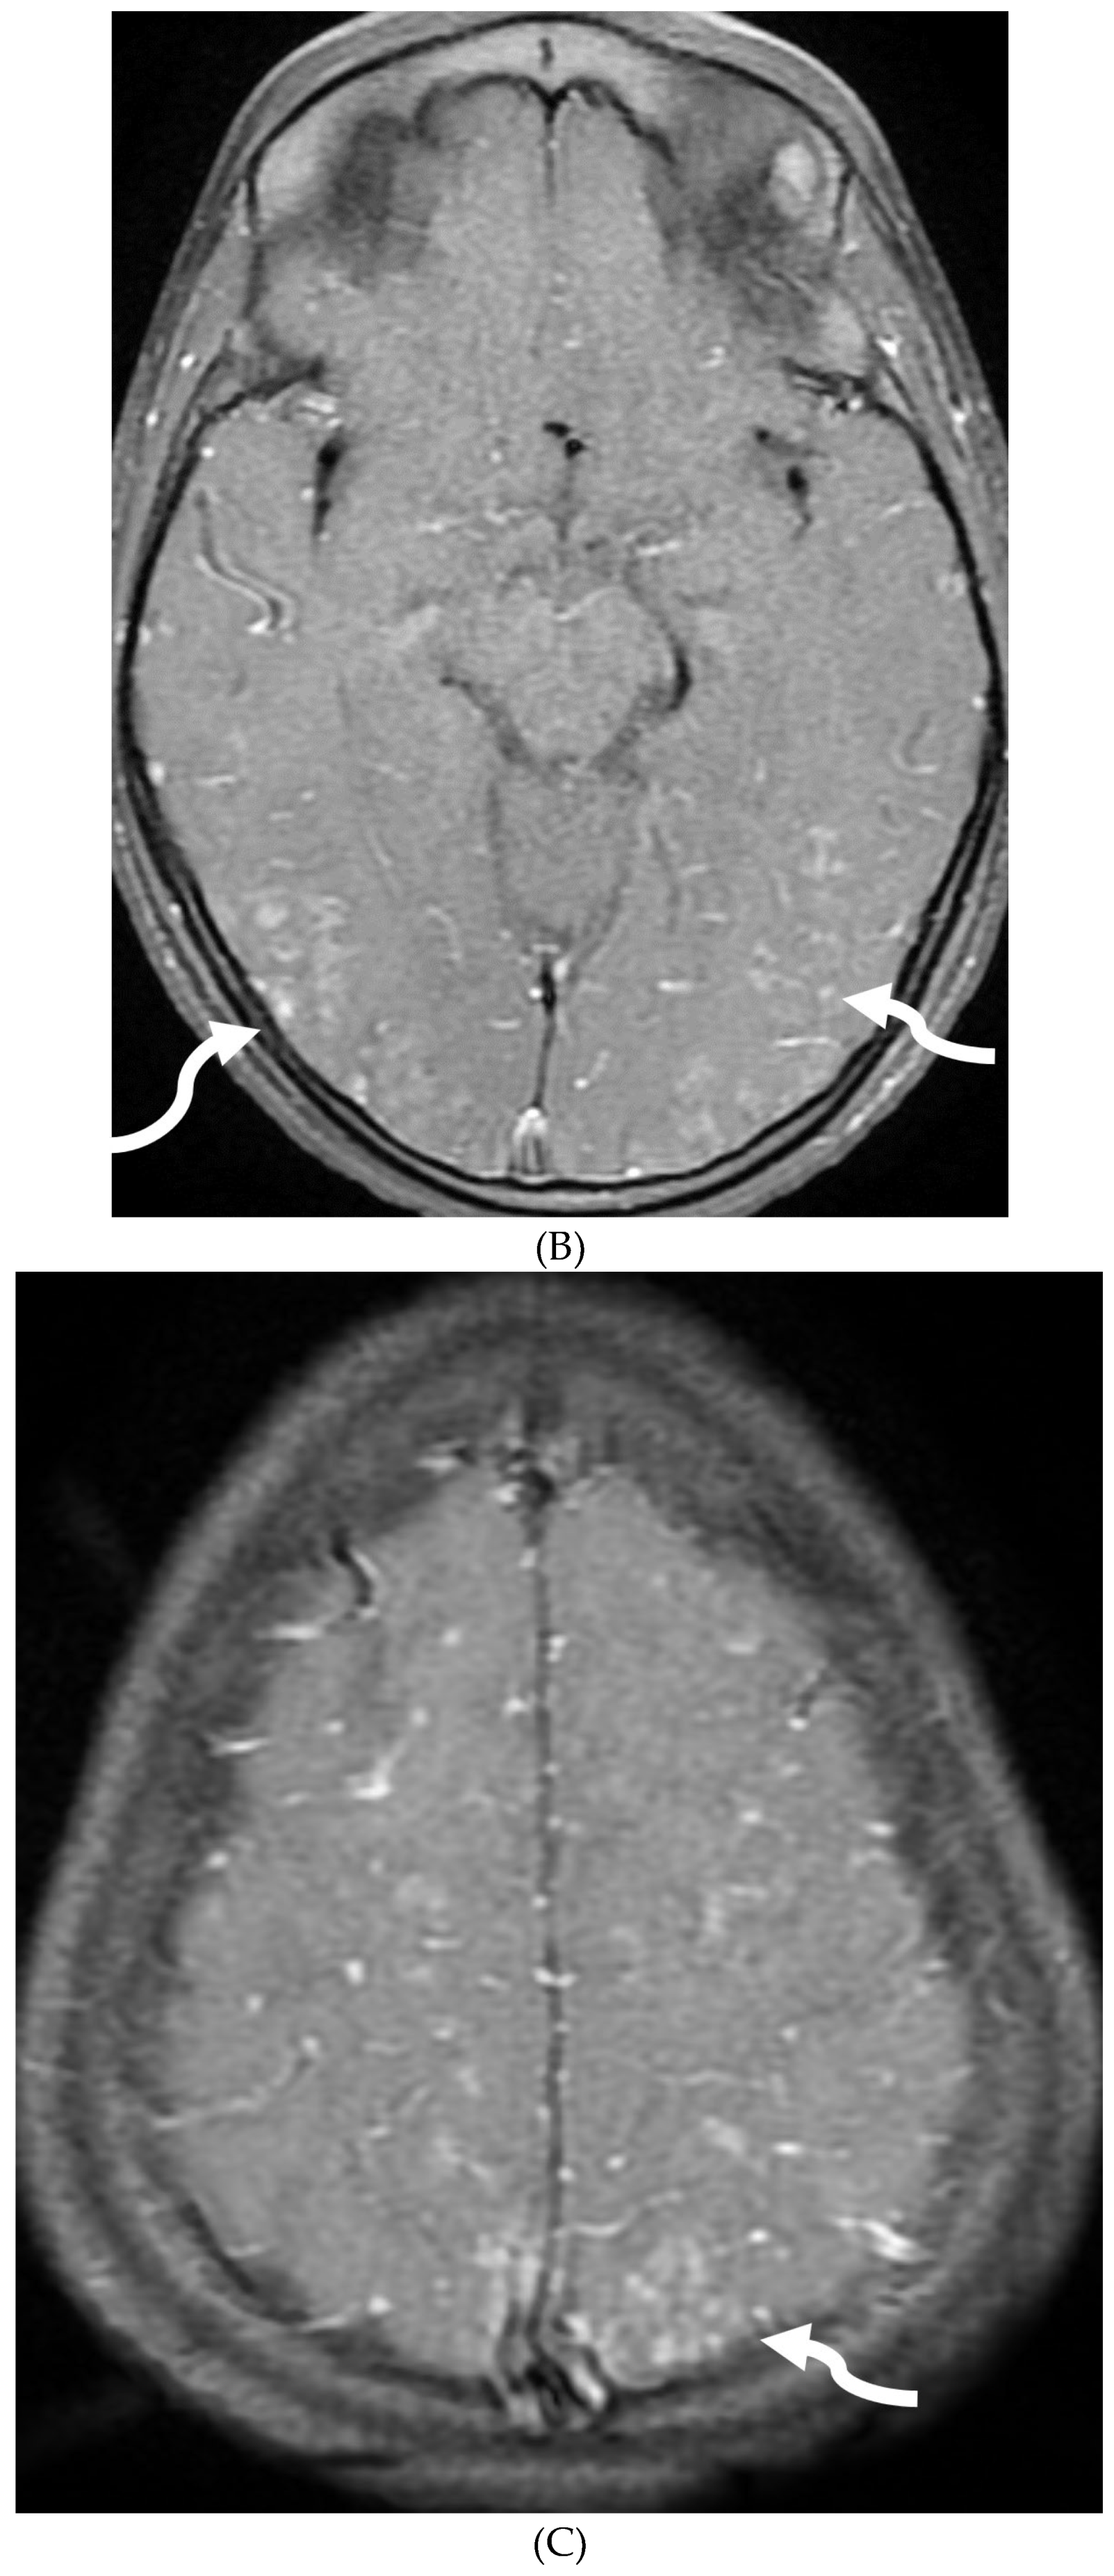
MOYA MOYA
VIRAL MENINGITIS
FUNGAL MENINGITIS
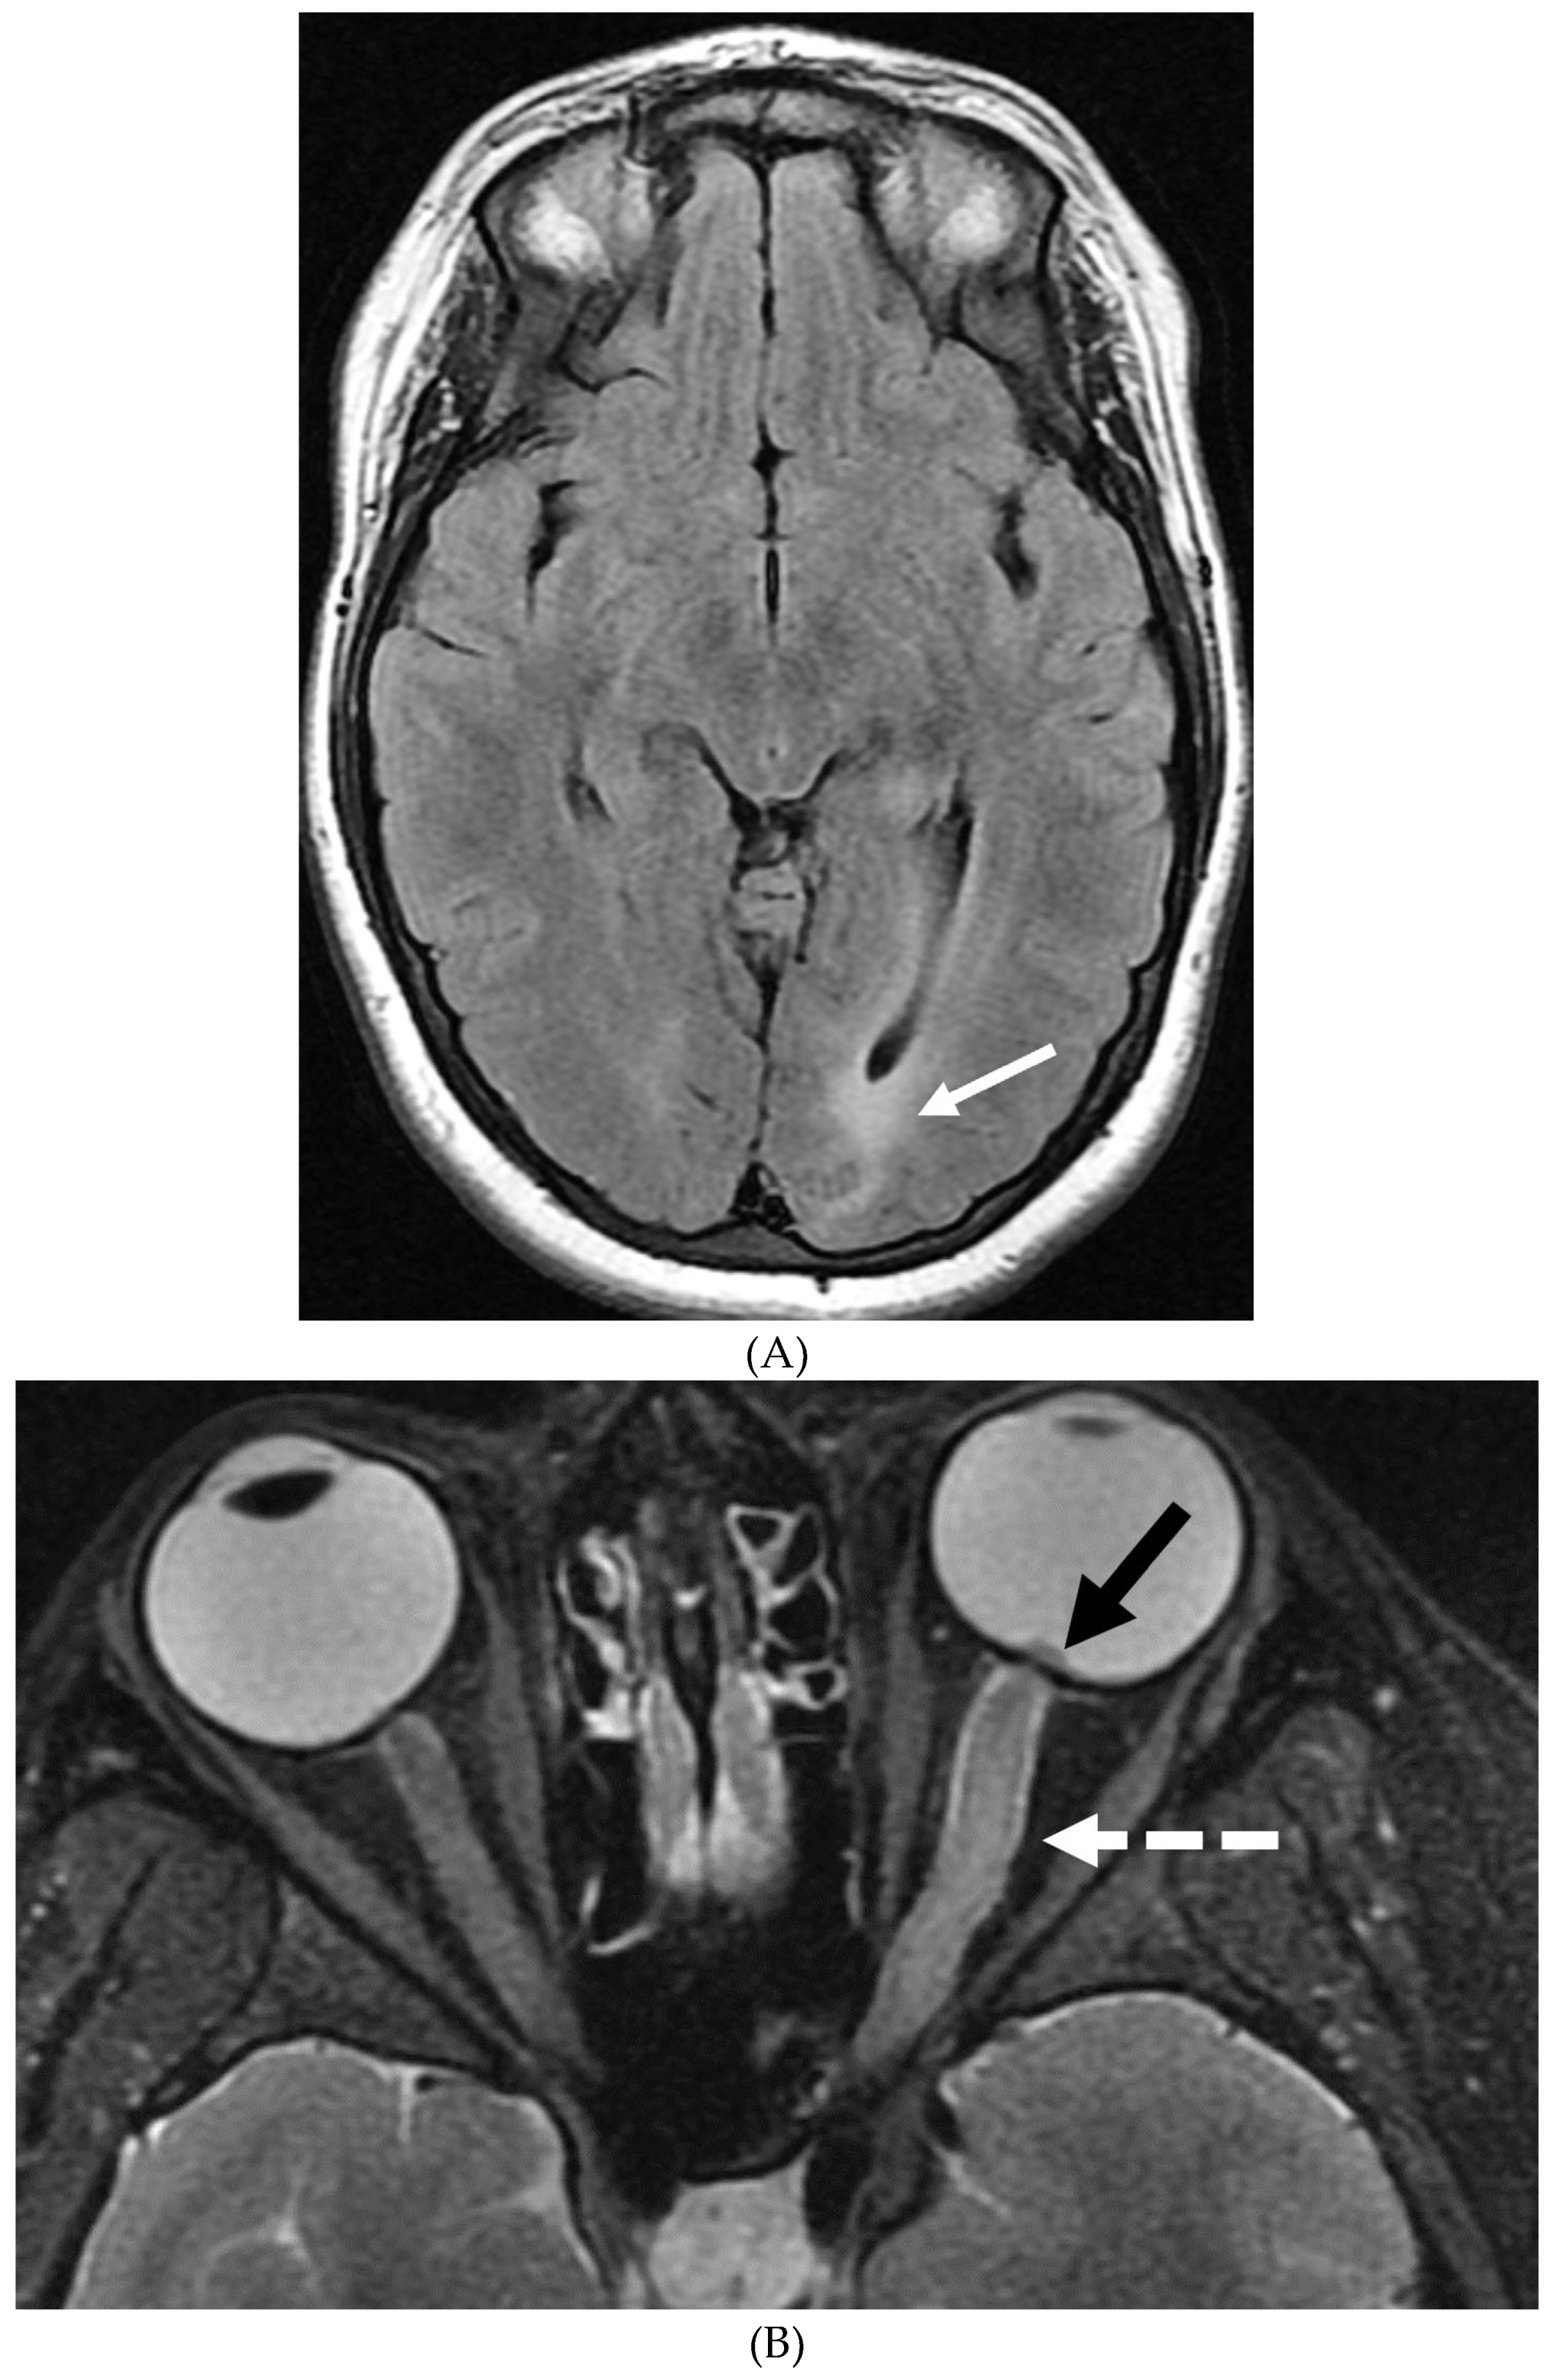
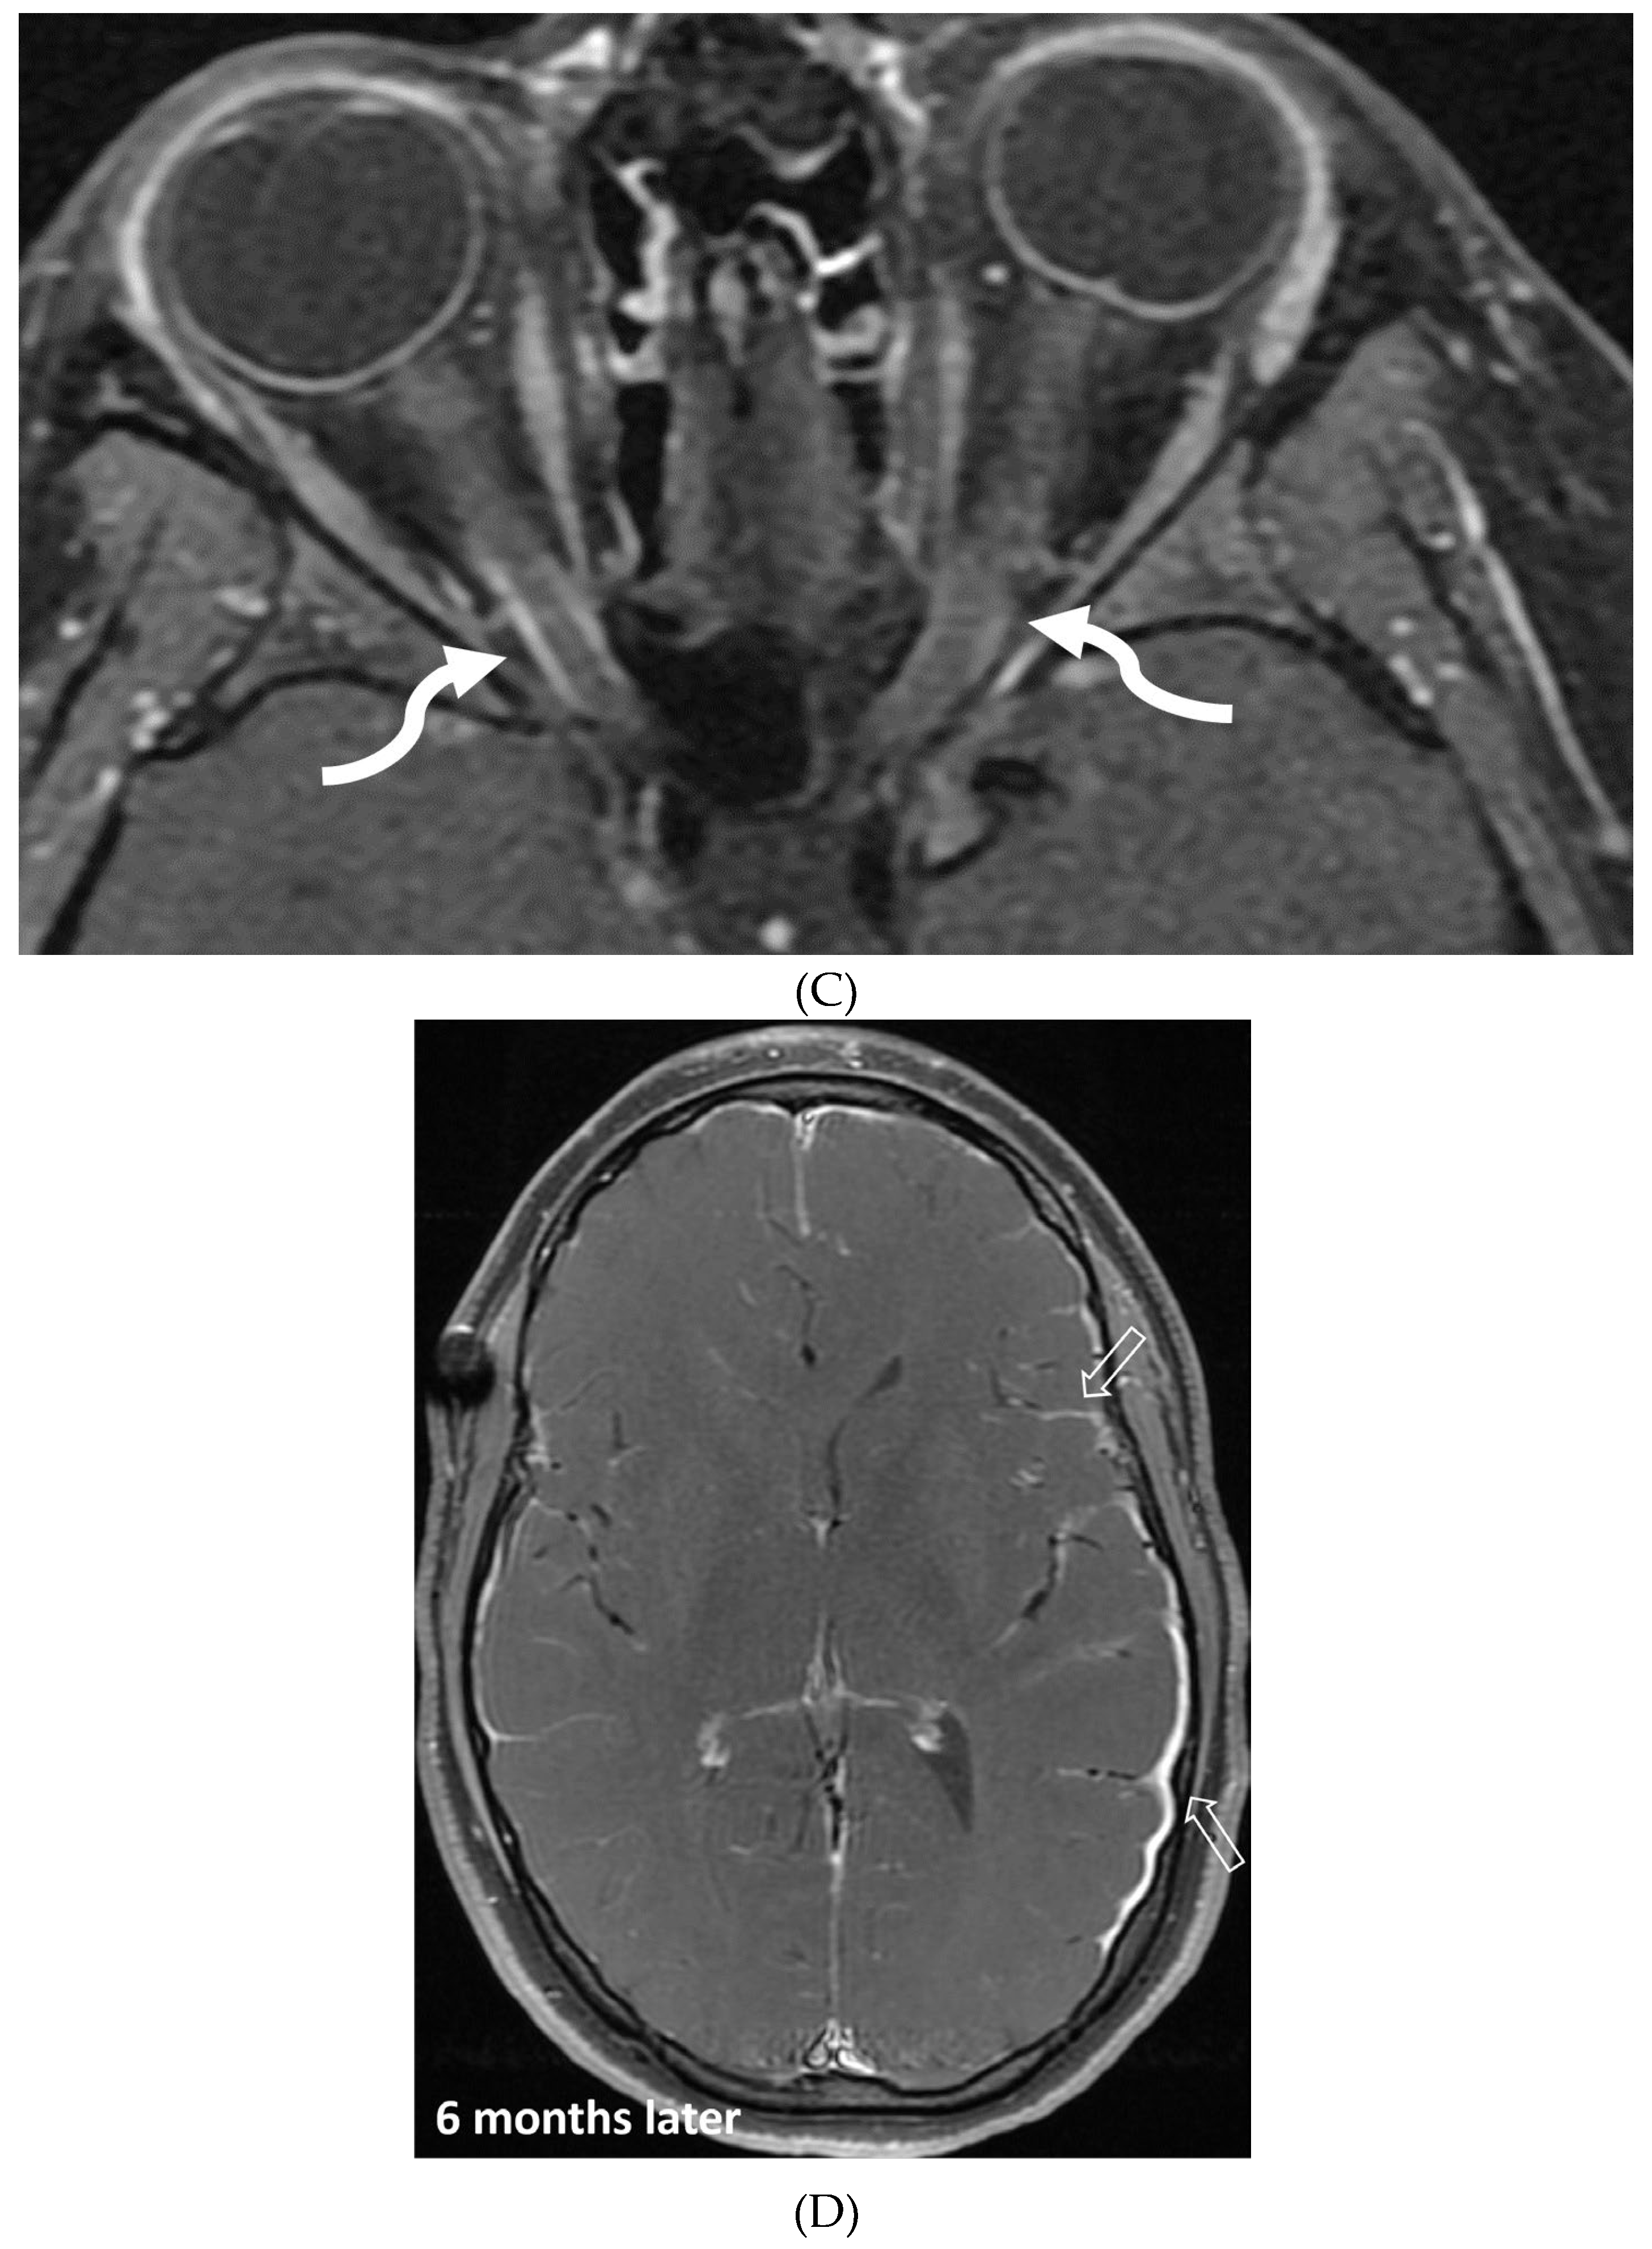
ANTI-MYELIN OLIGODENDROCYTE GLYCOPROTEIN (MOG) DEMYELINATION
GRANULOMATOSIS POLYARTERITIS (GPA)
NMDA ENCEPHALITIS
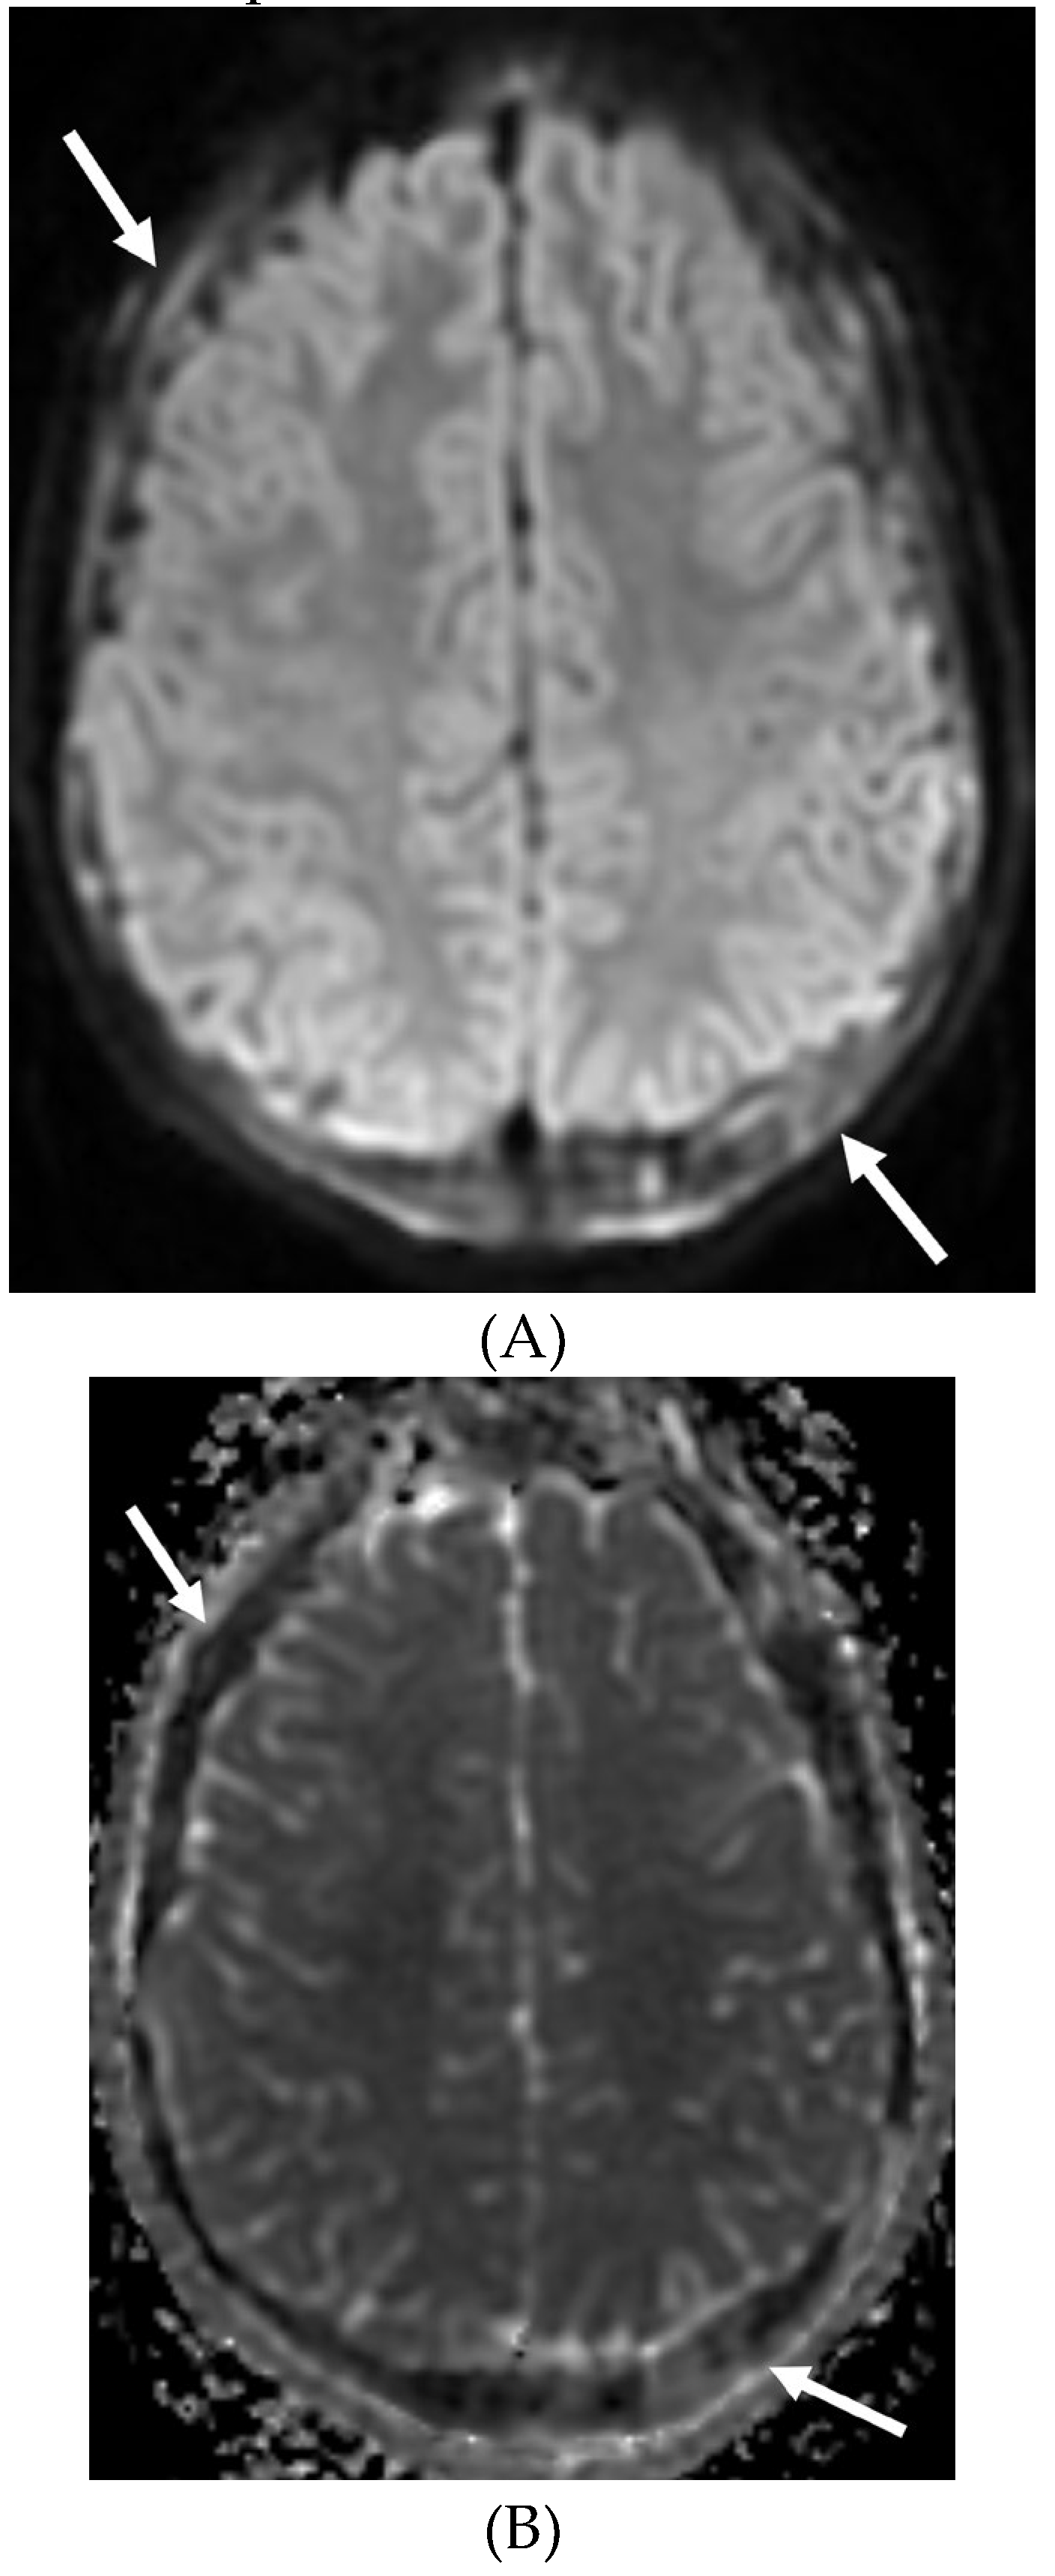
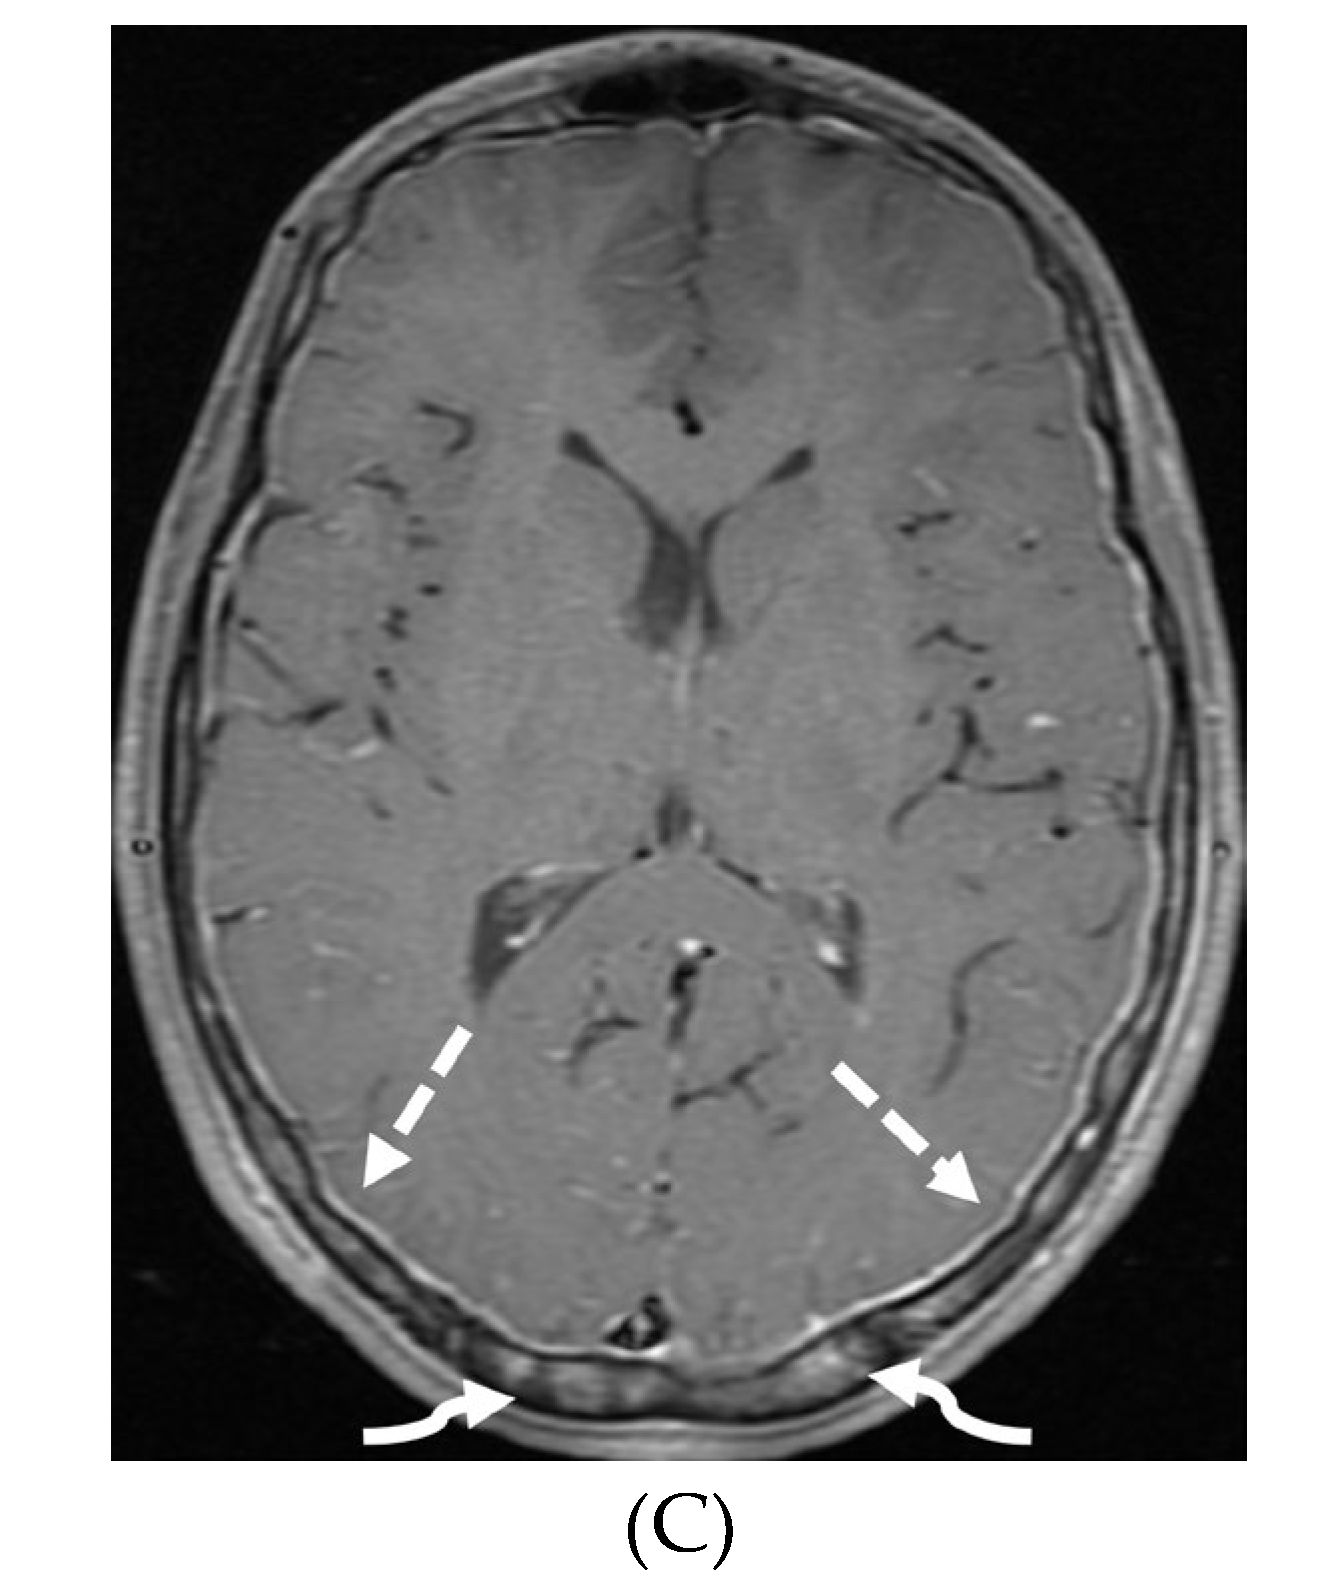
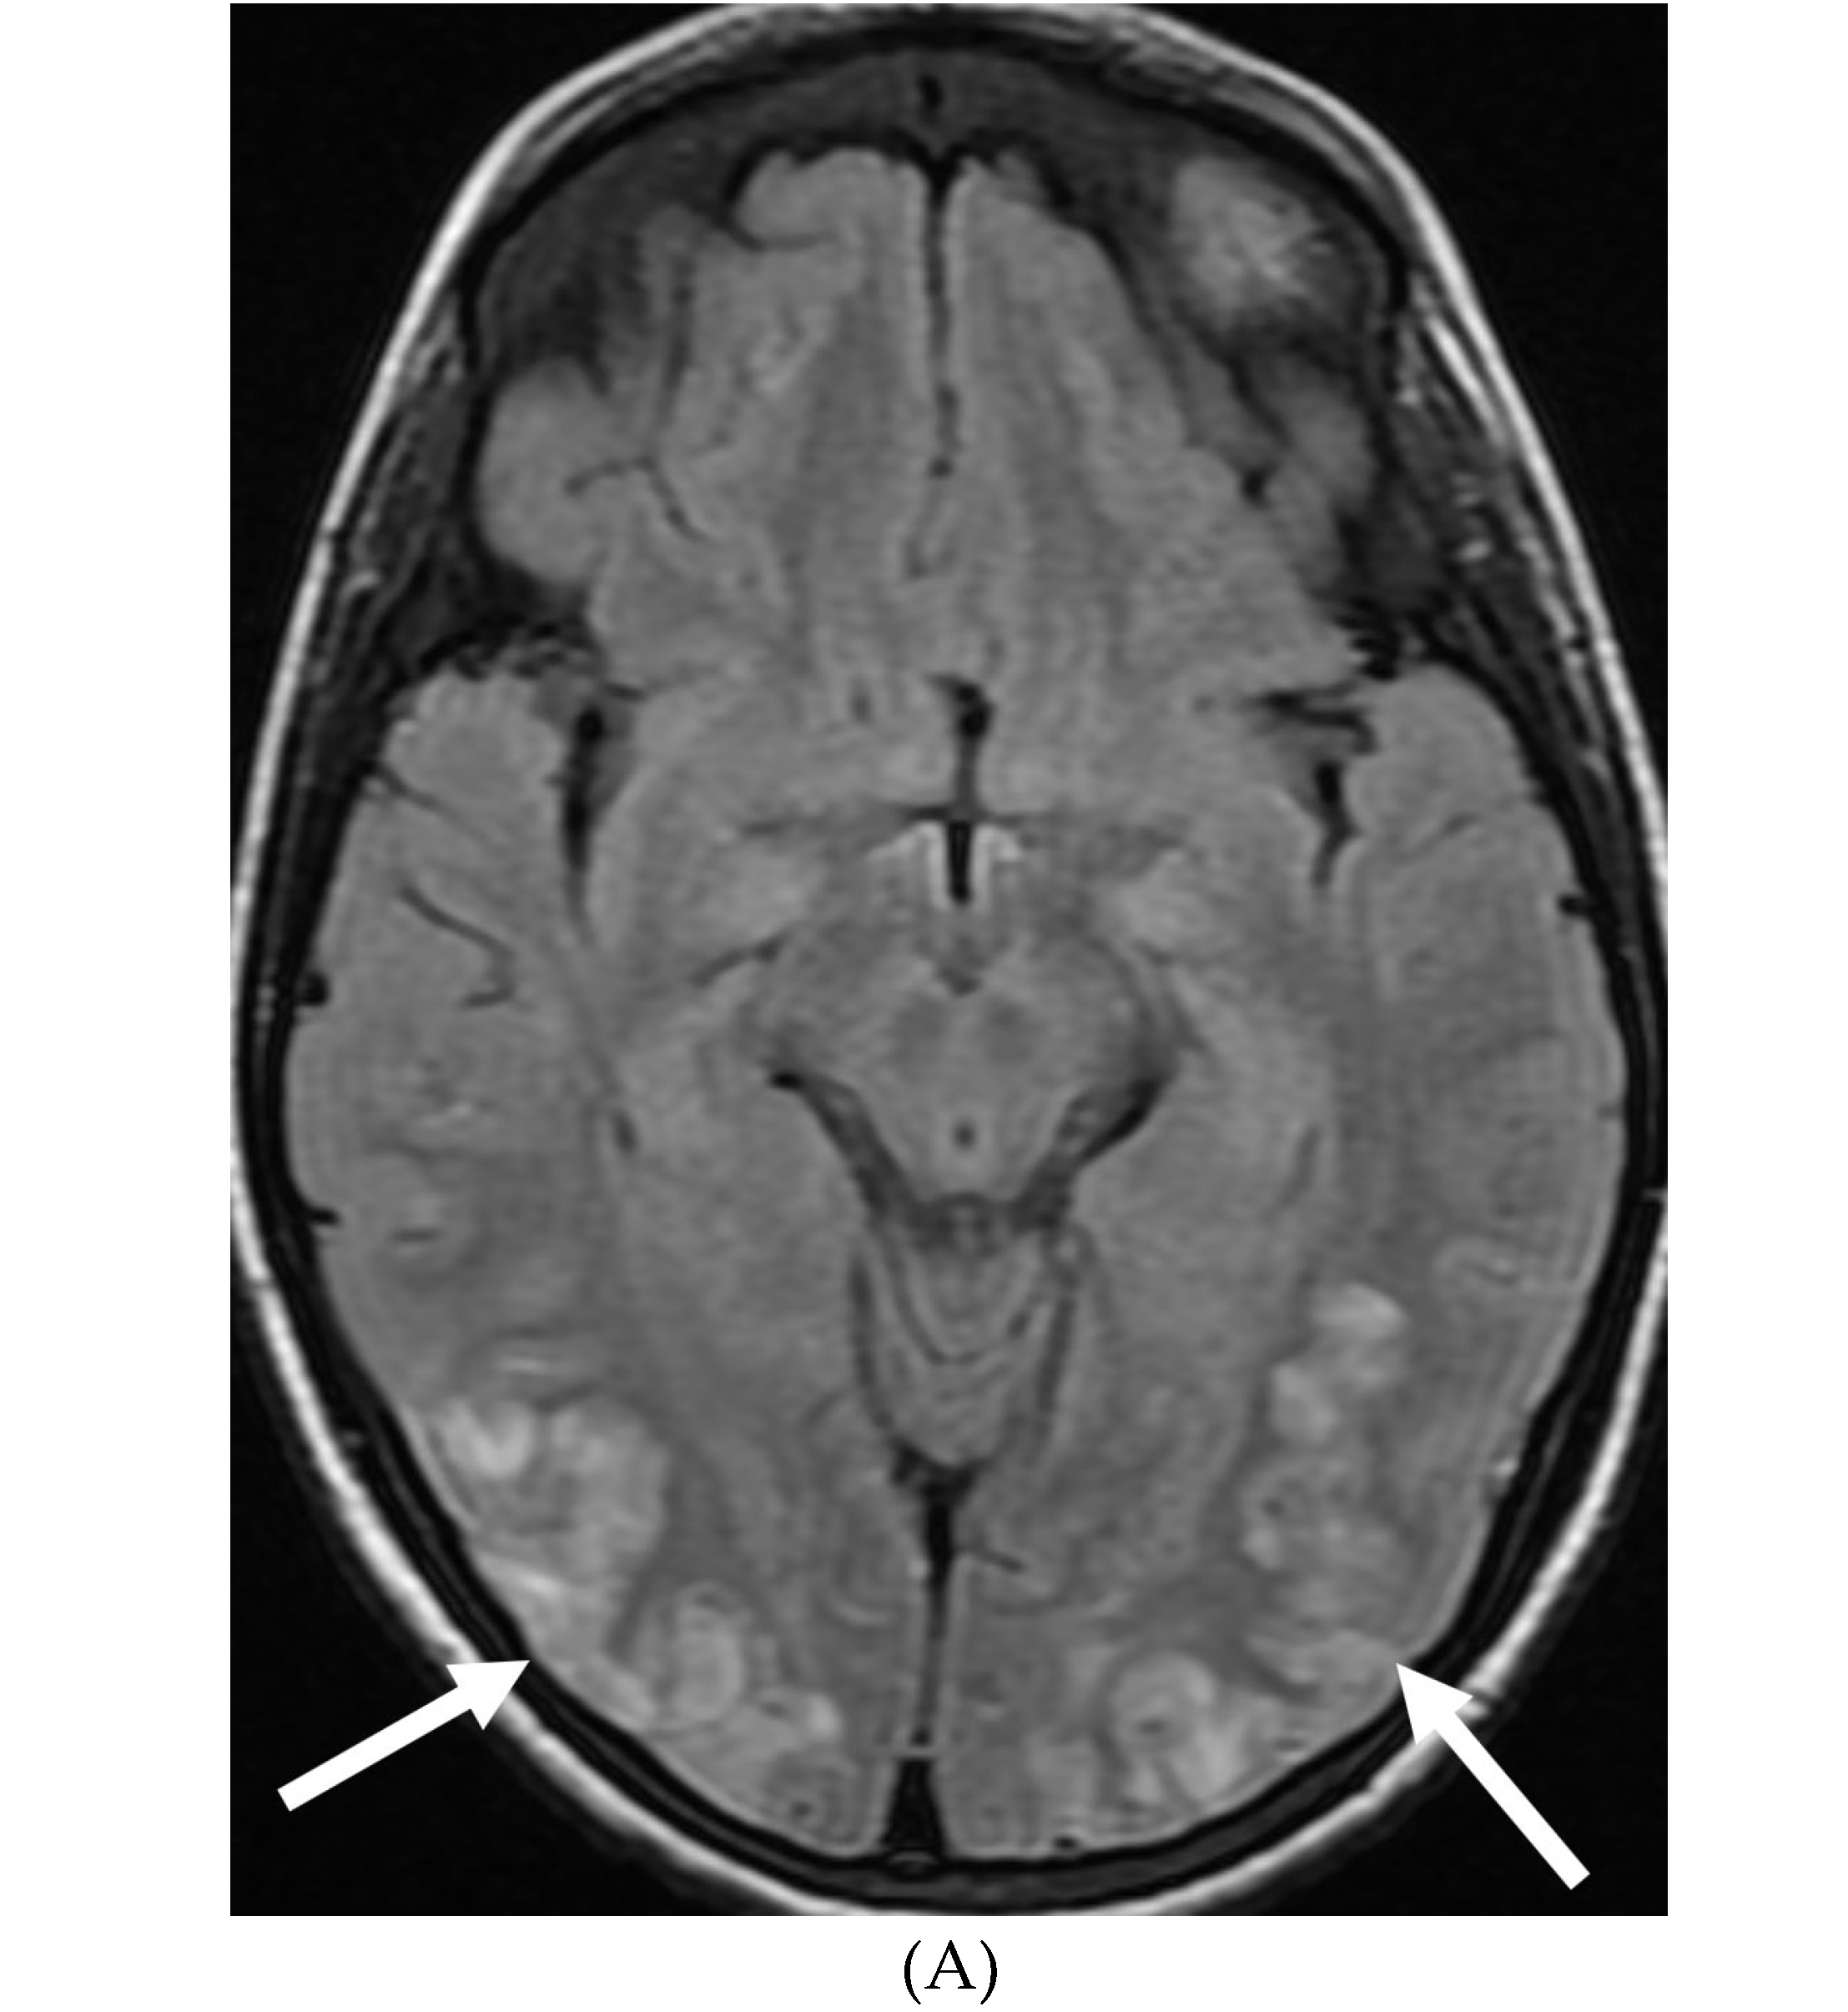
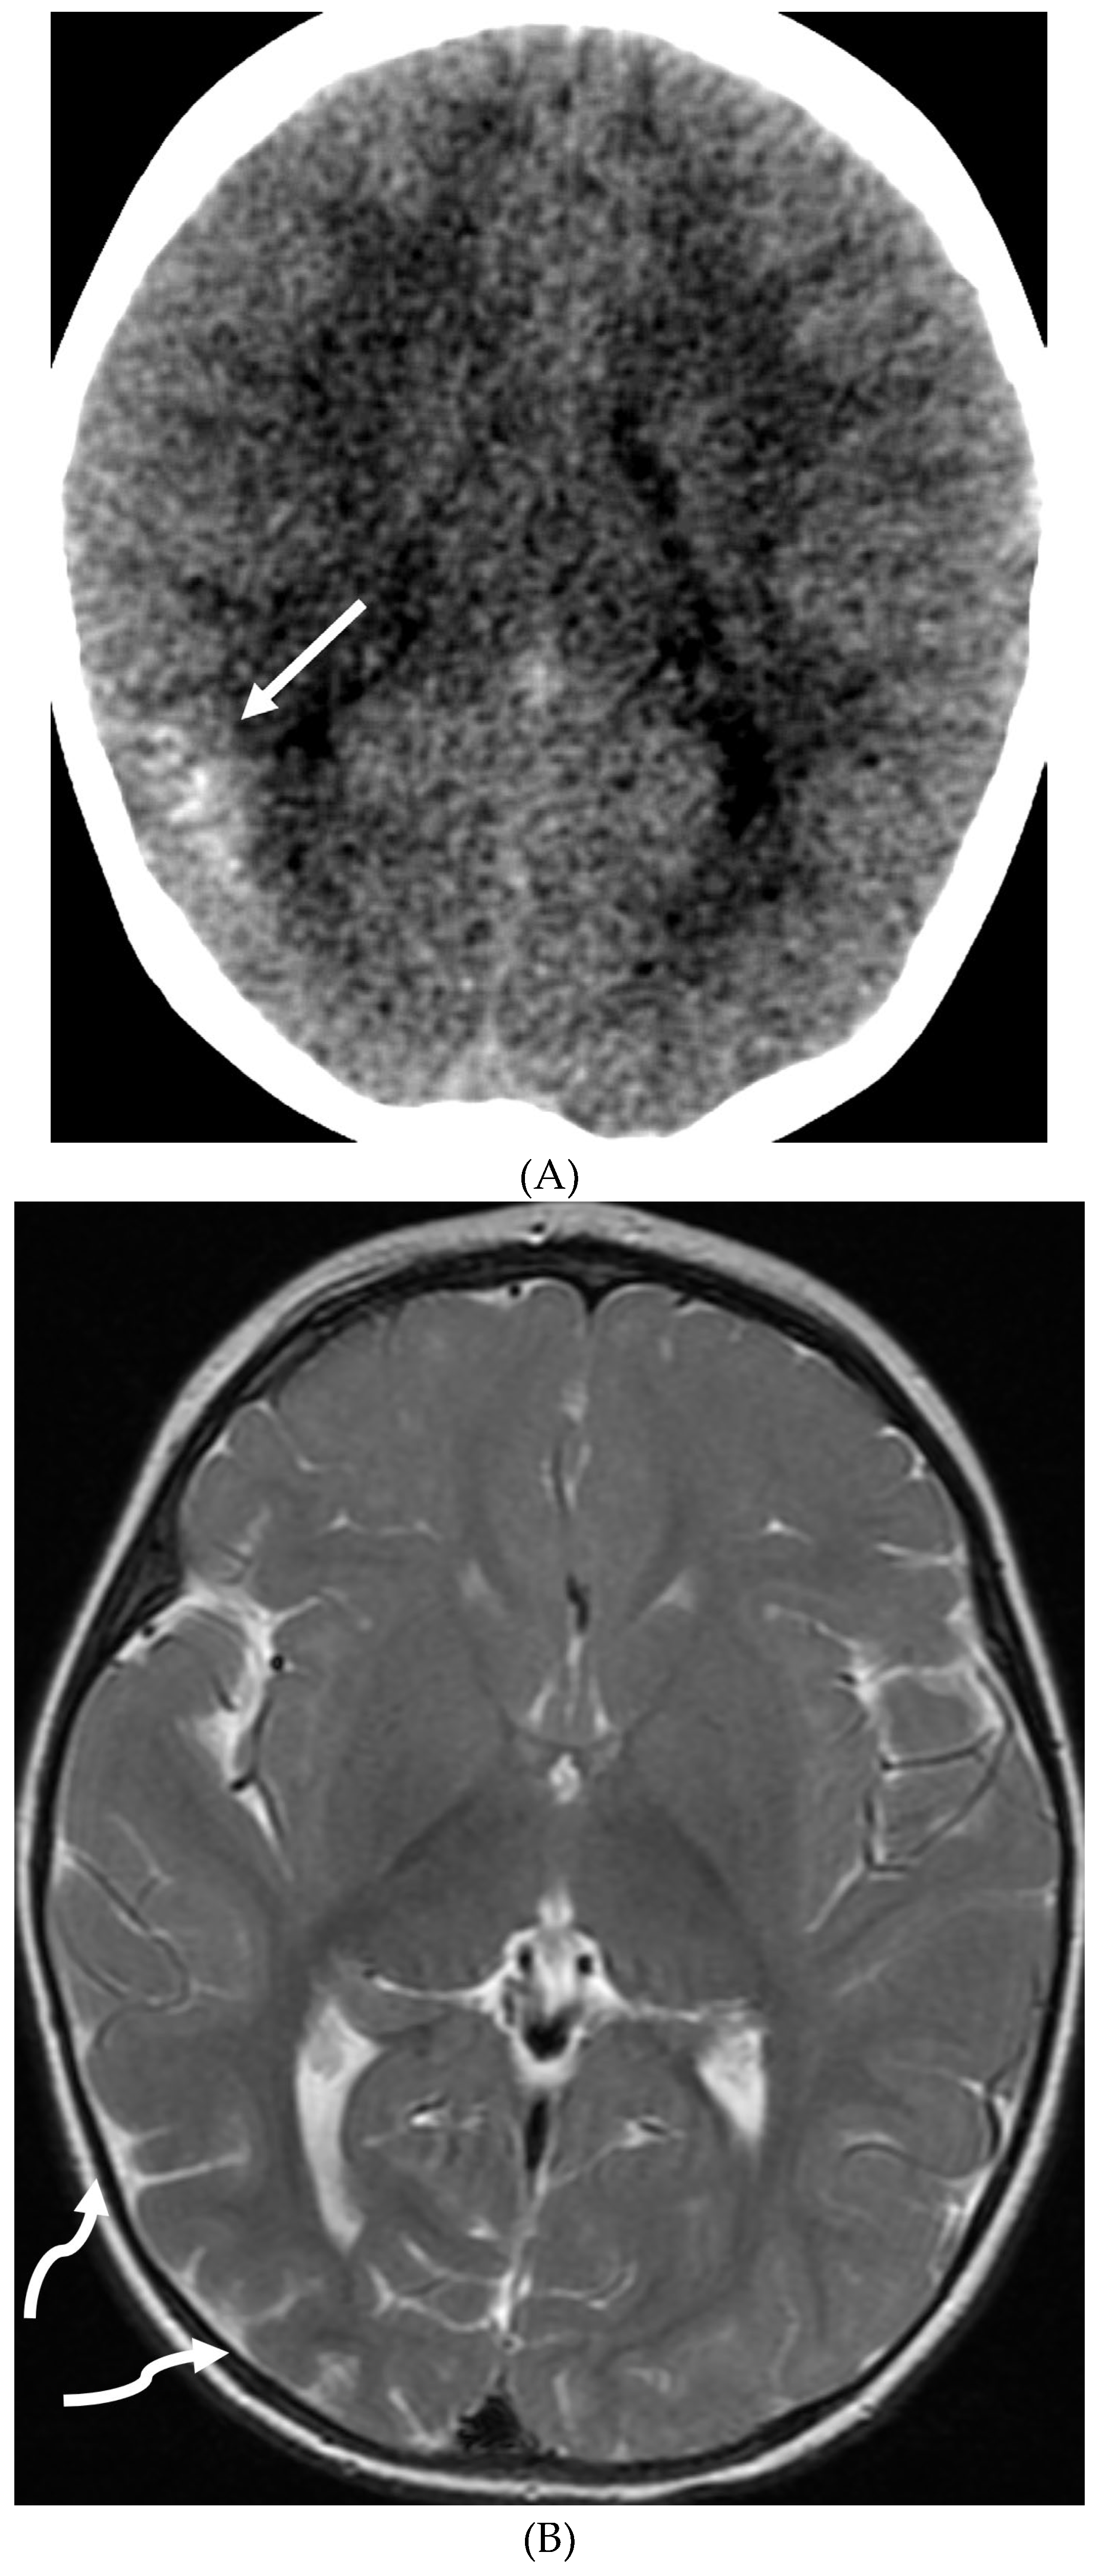
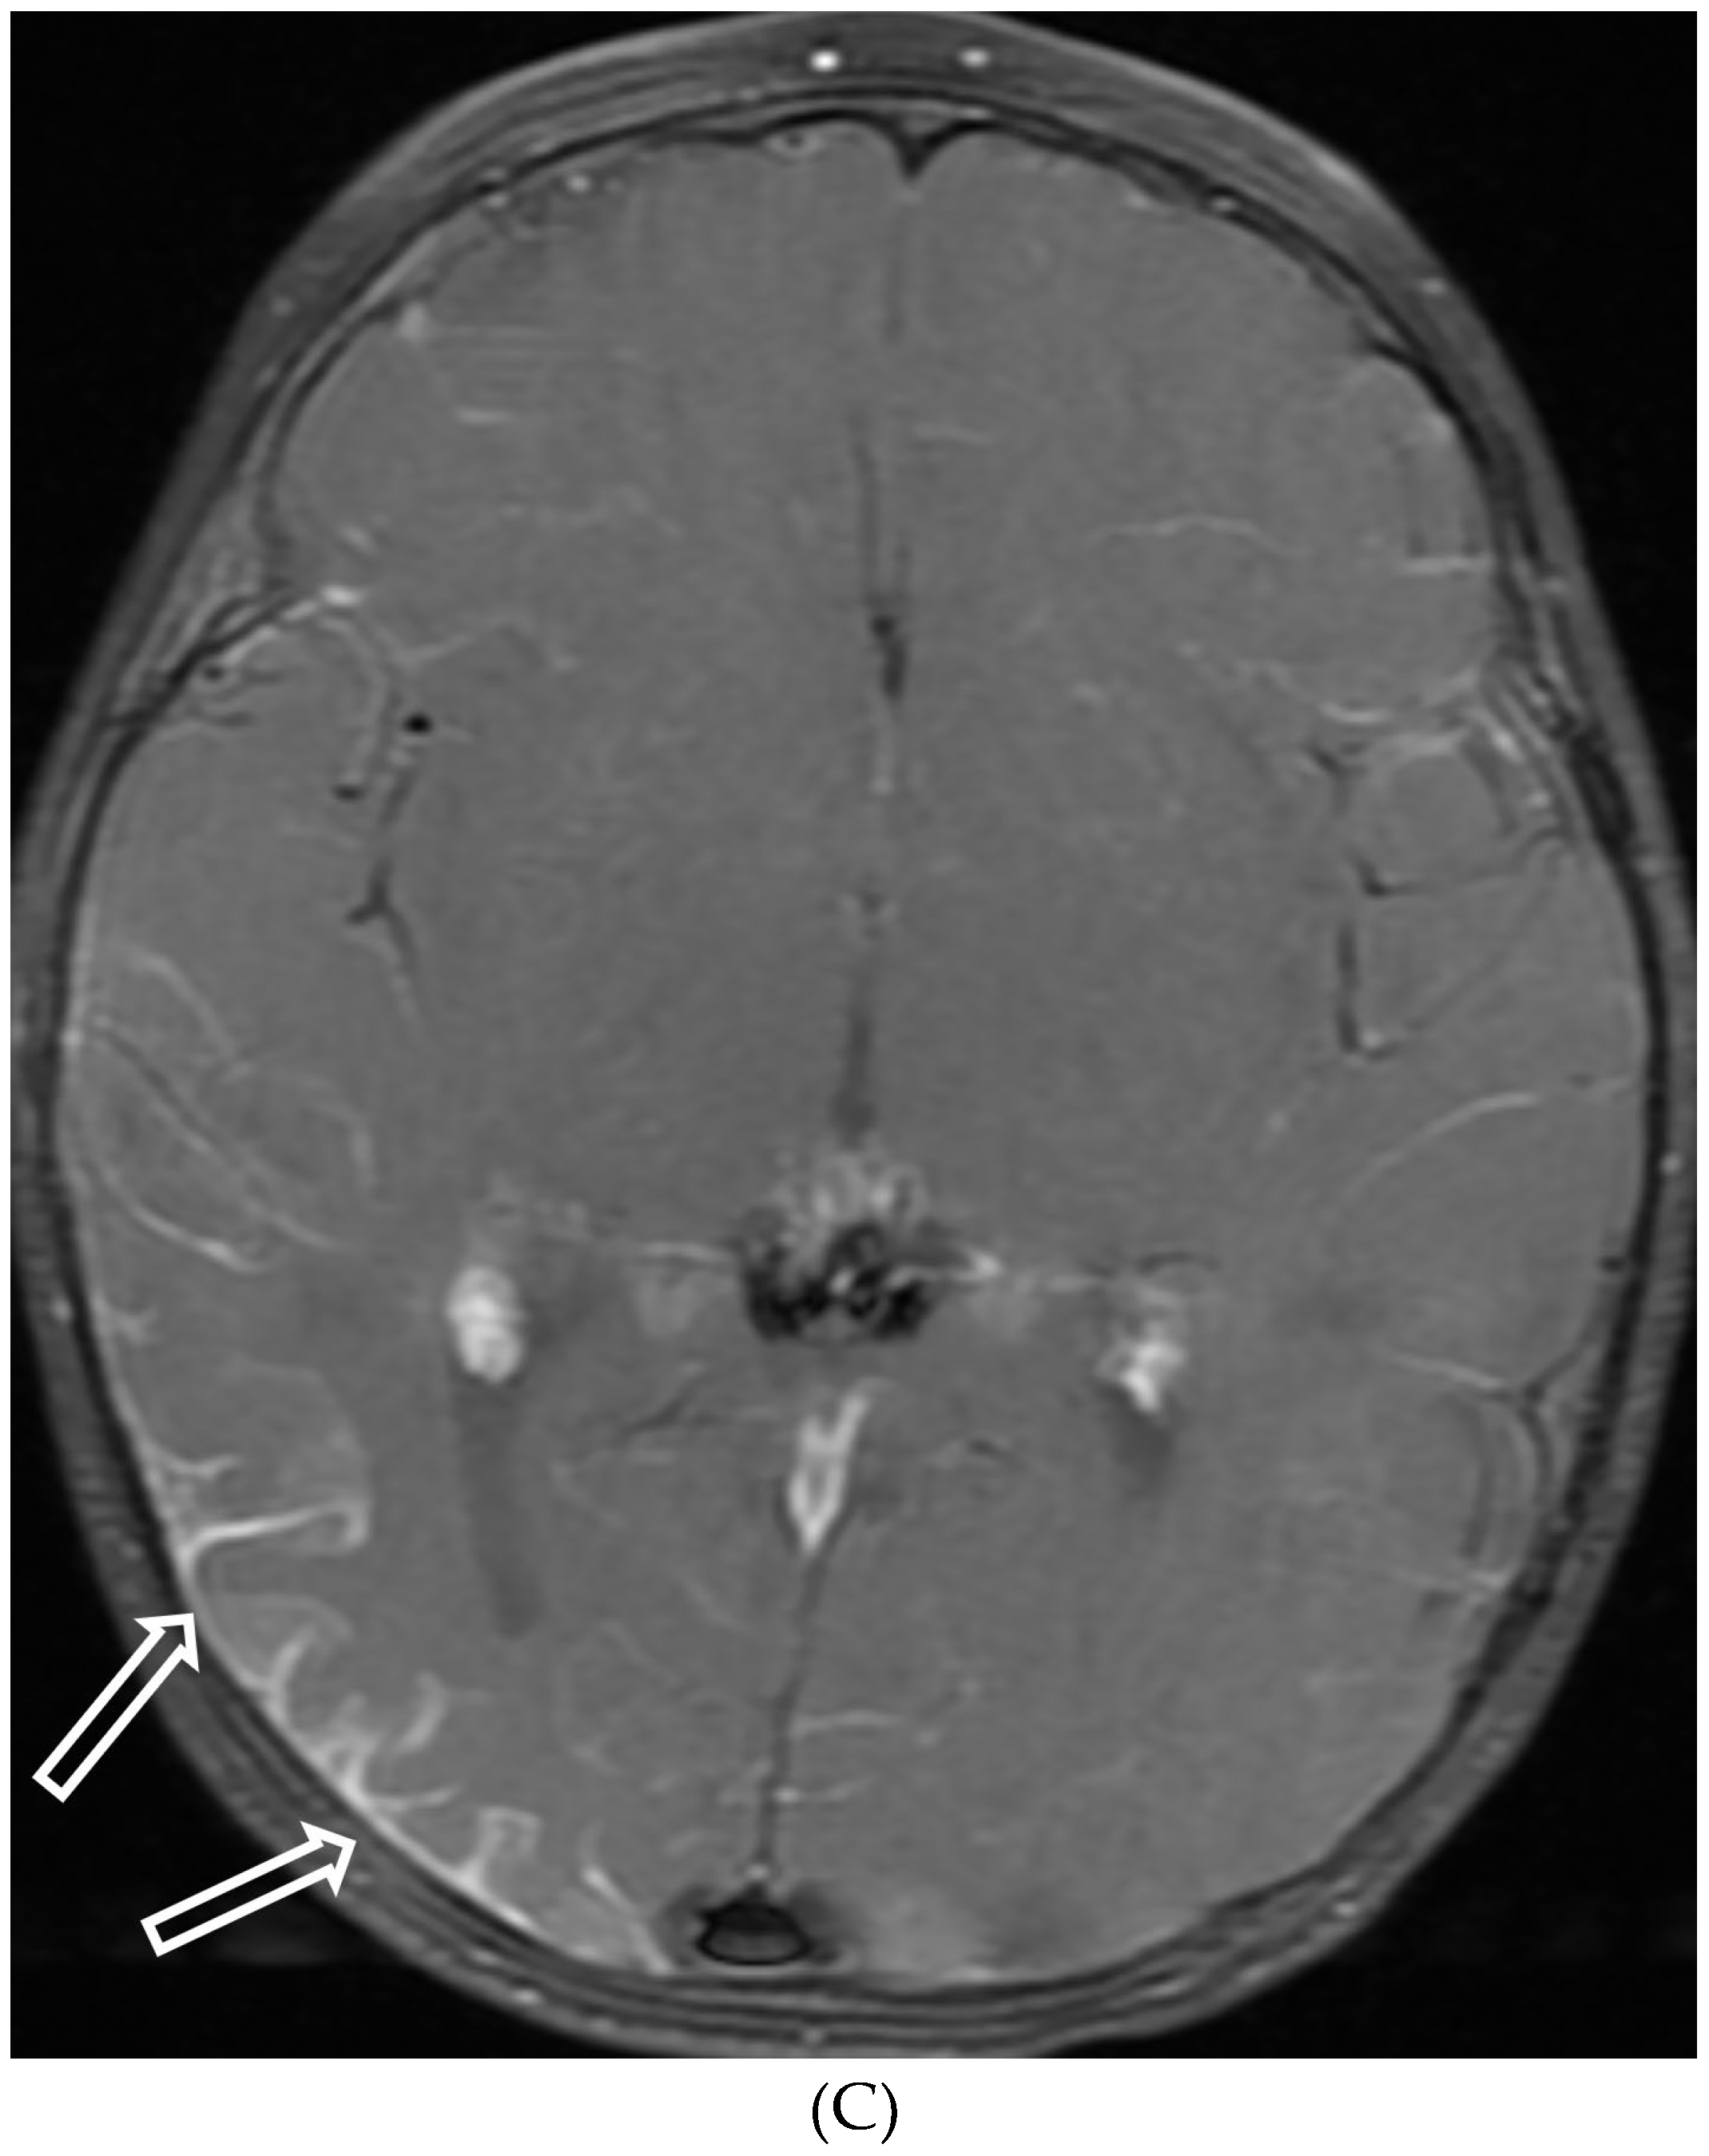
POSTERIOR REVERSIBLE ENCEPHALOPATHY SYNDROME (PRES)
PIAL ANGIOMATOSIS
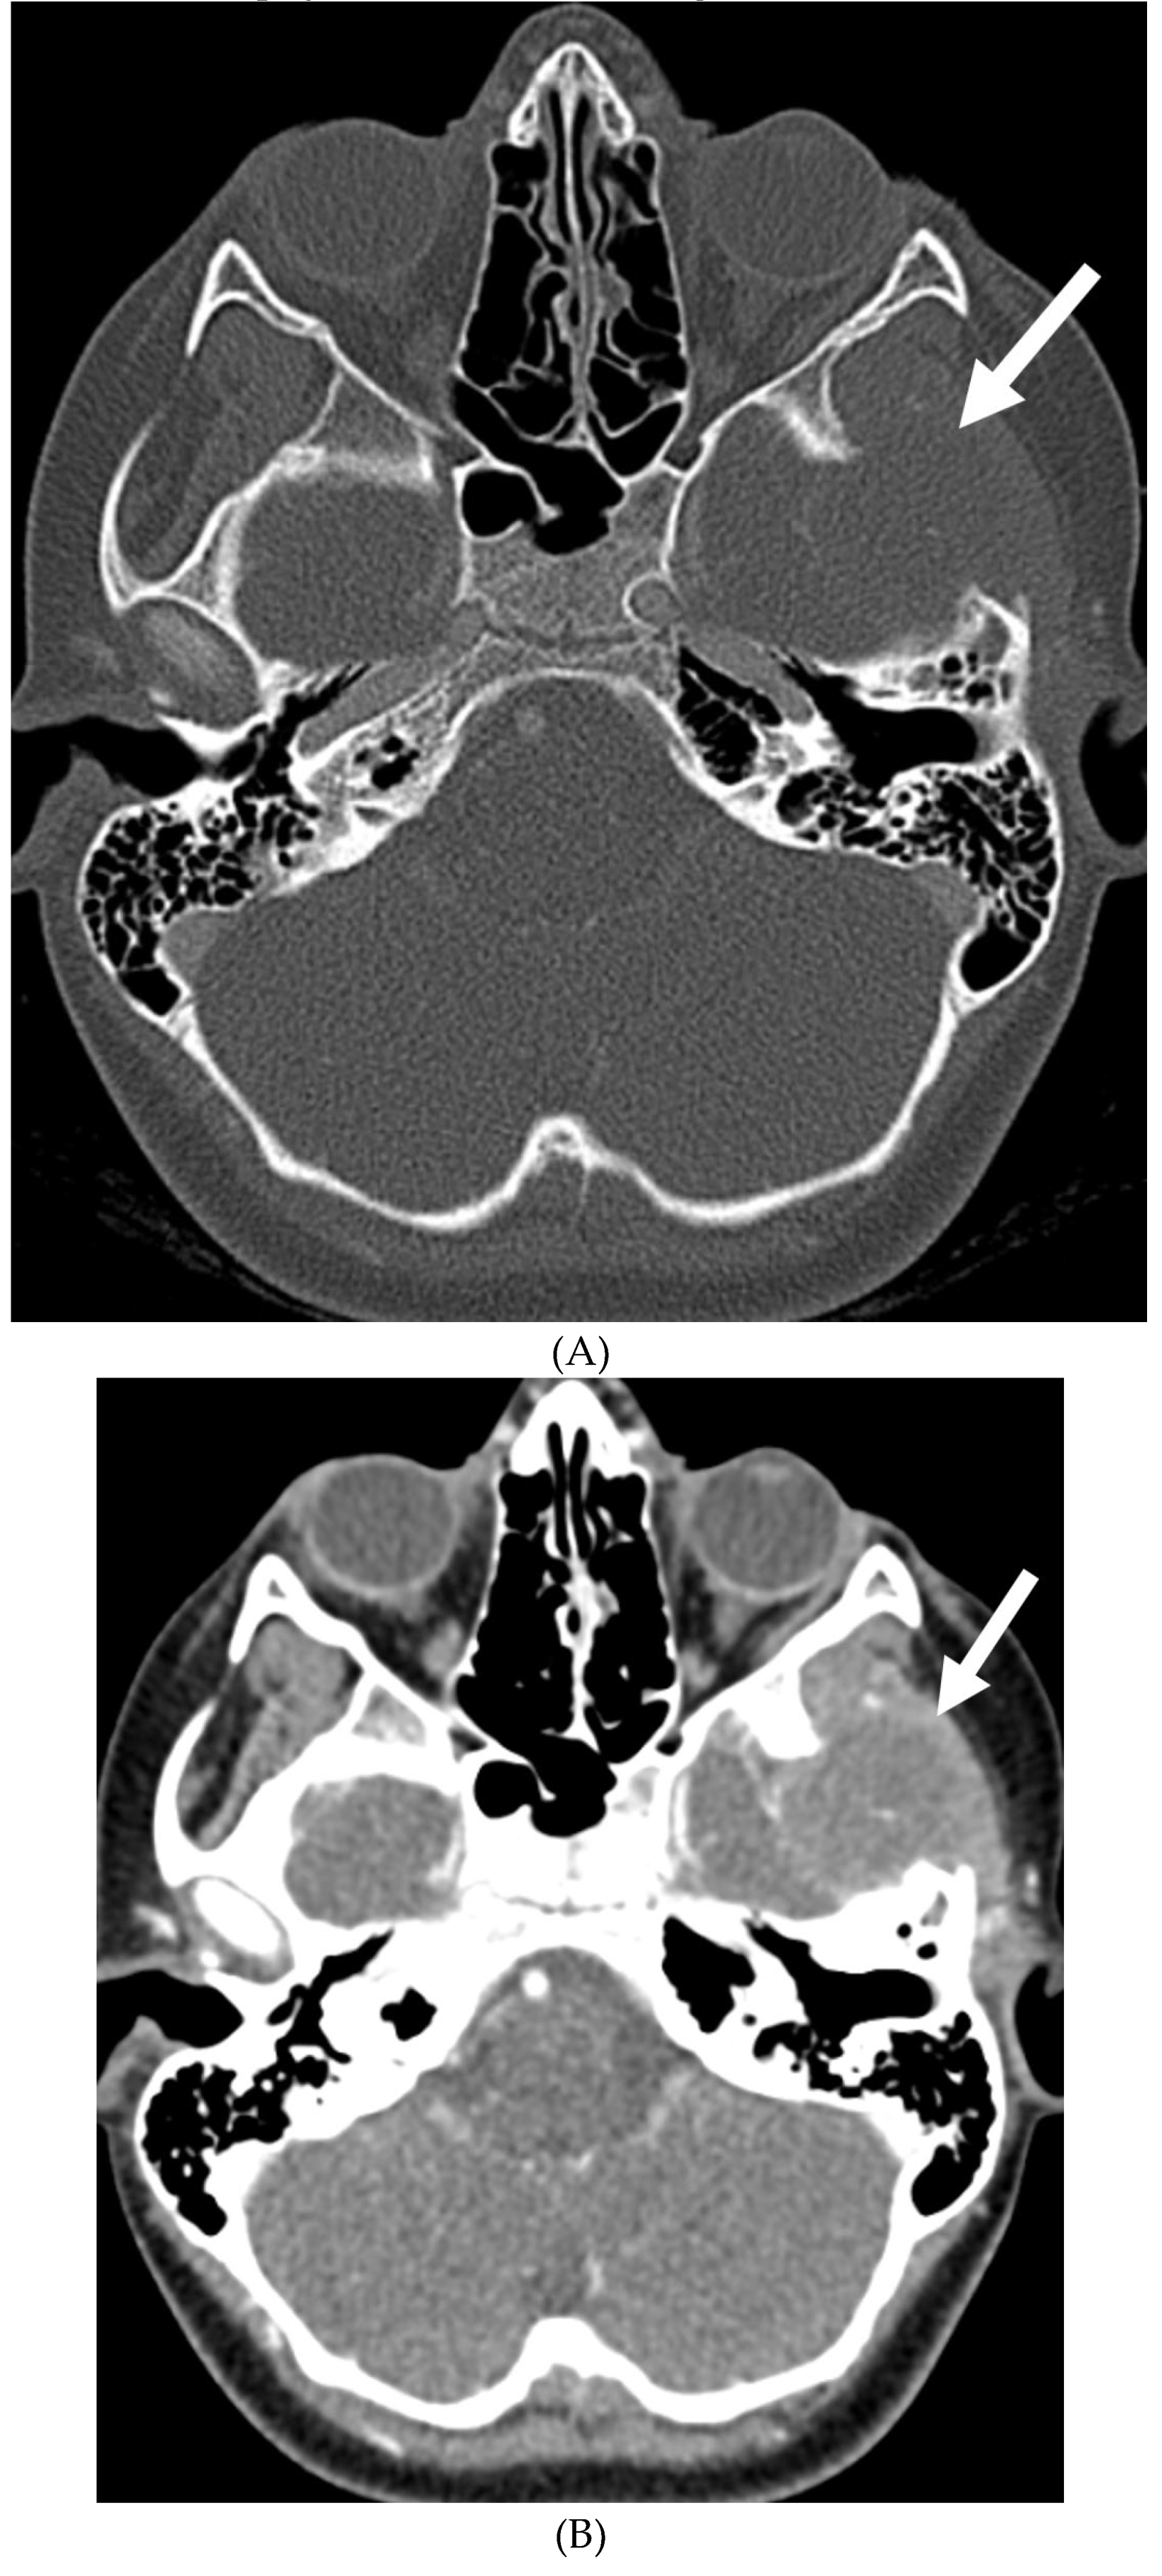
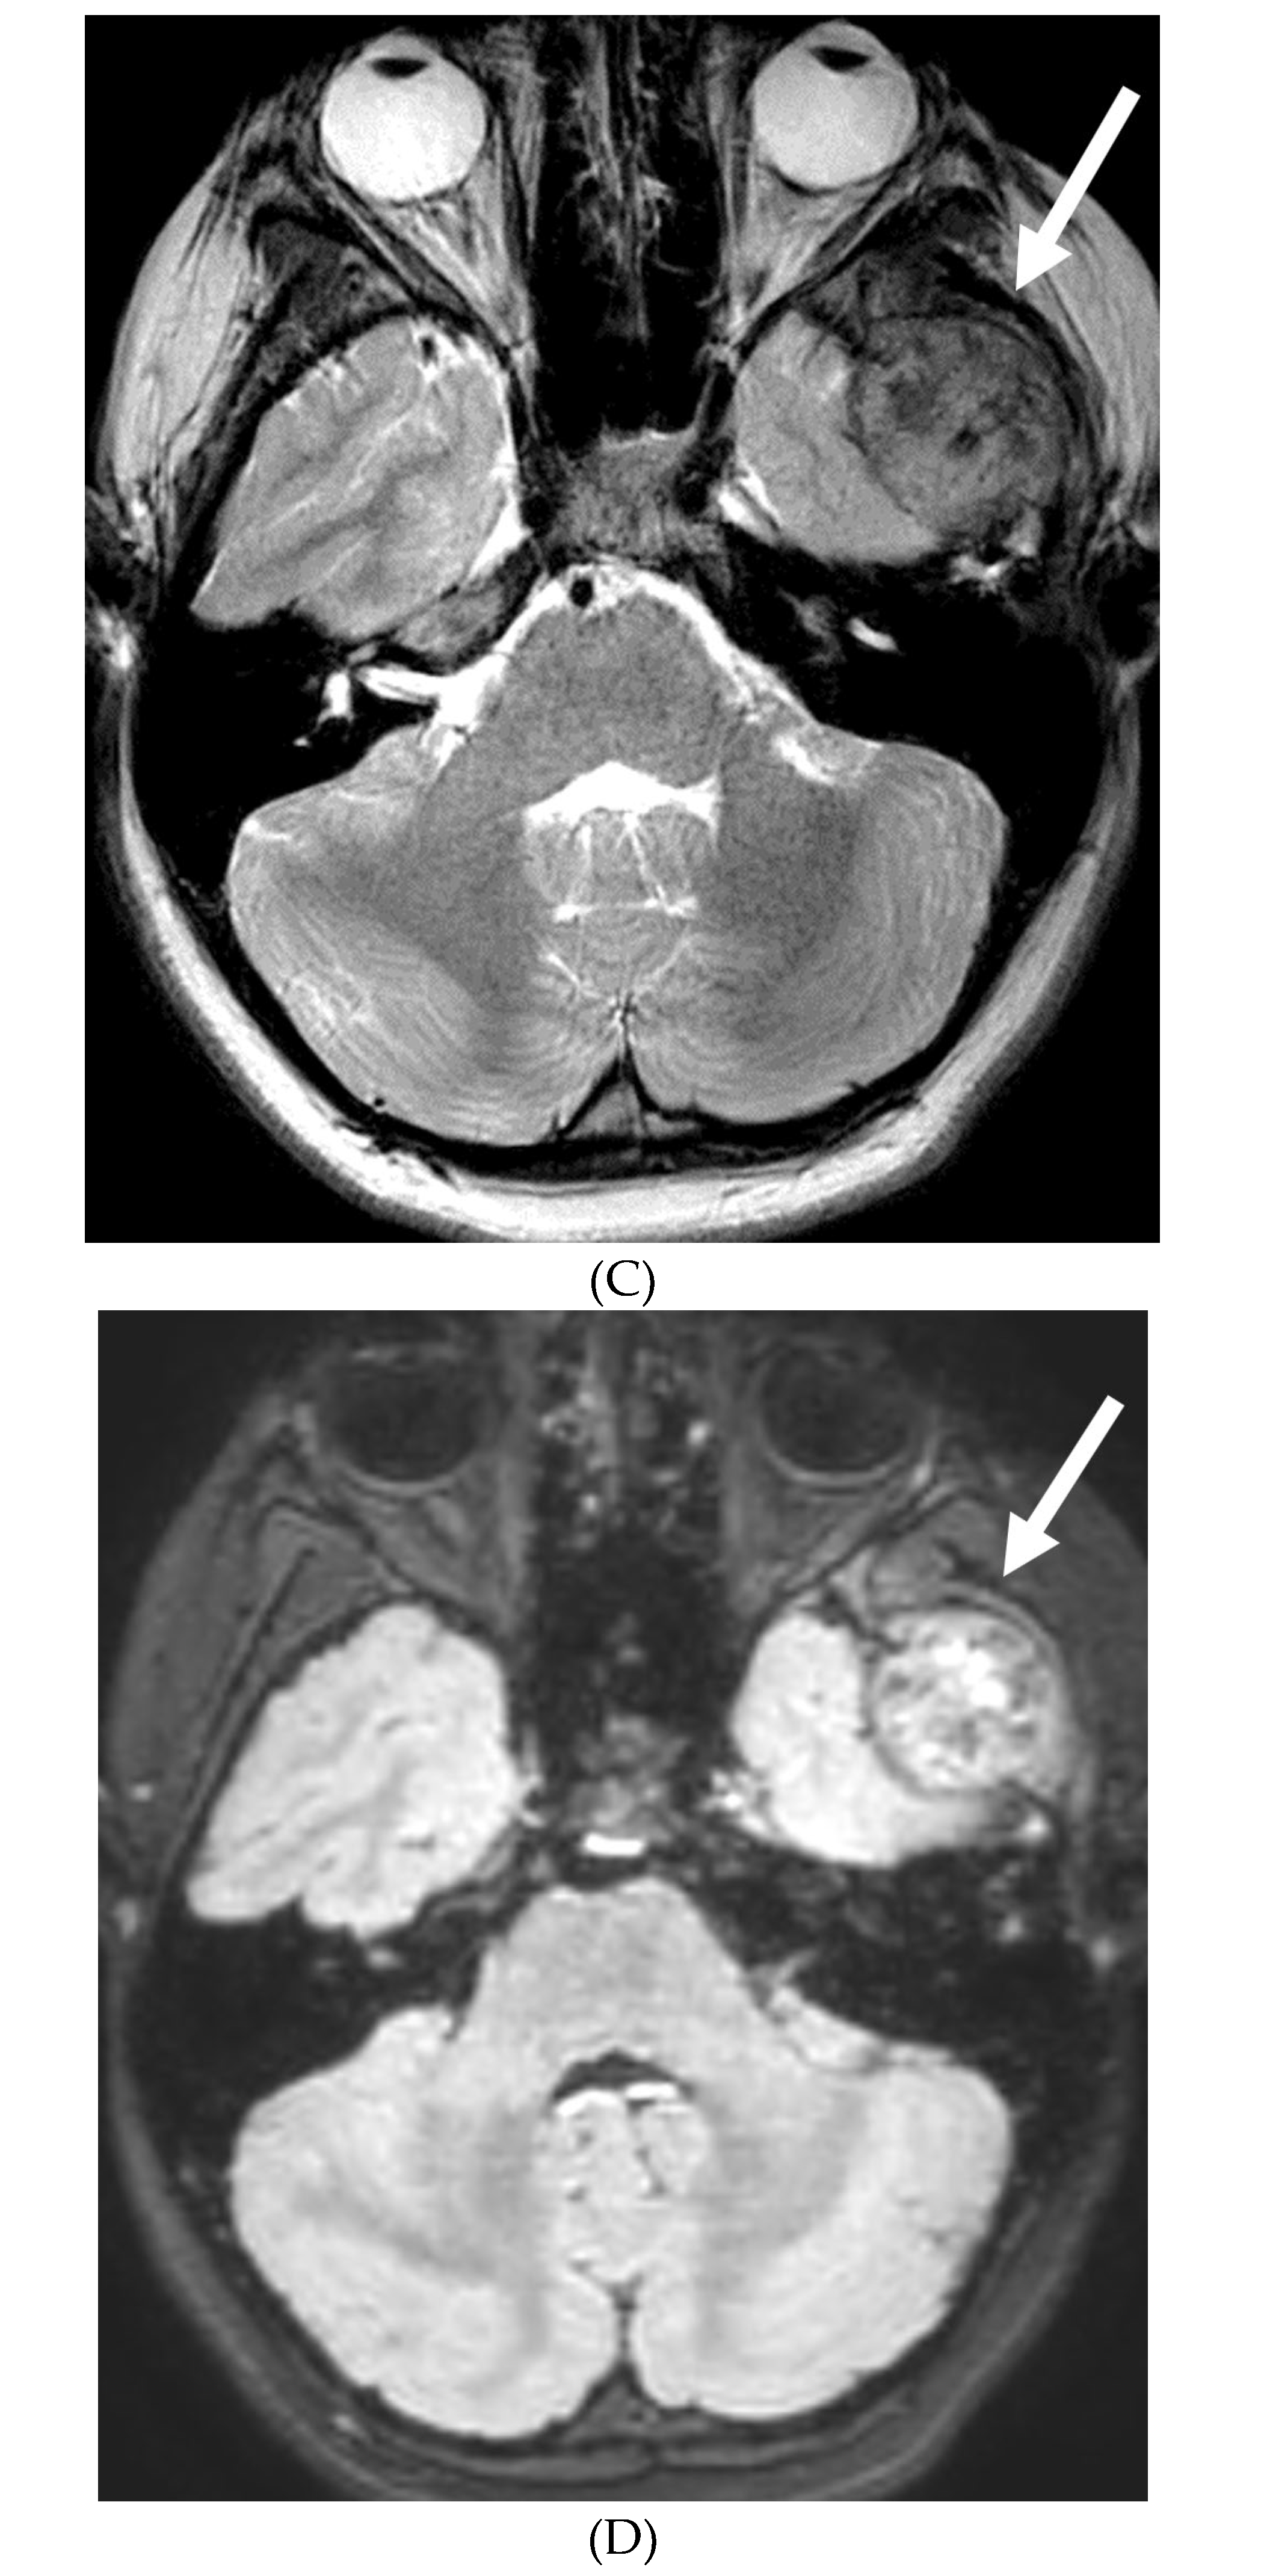
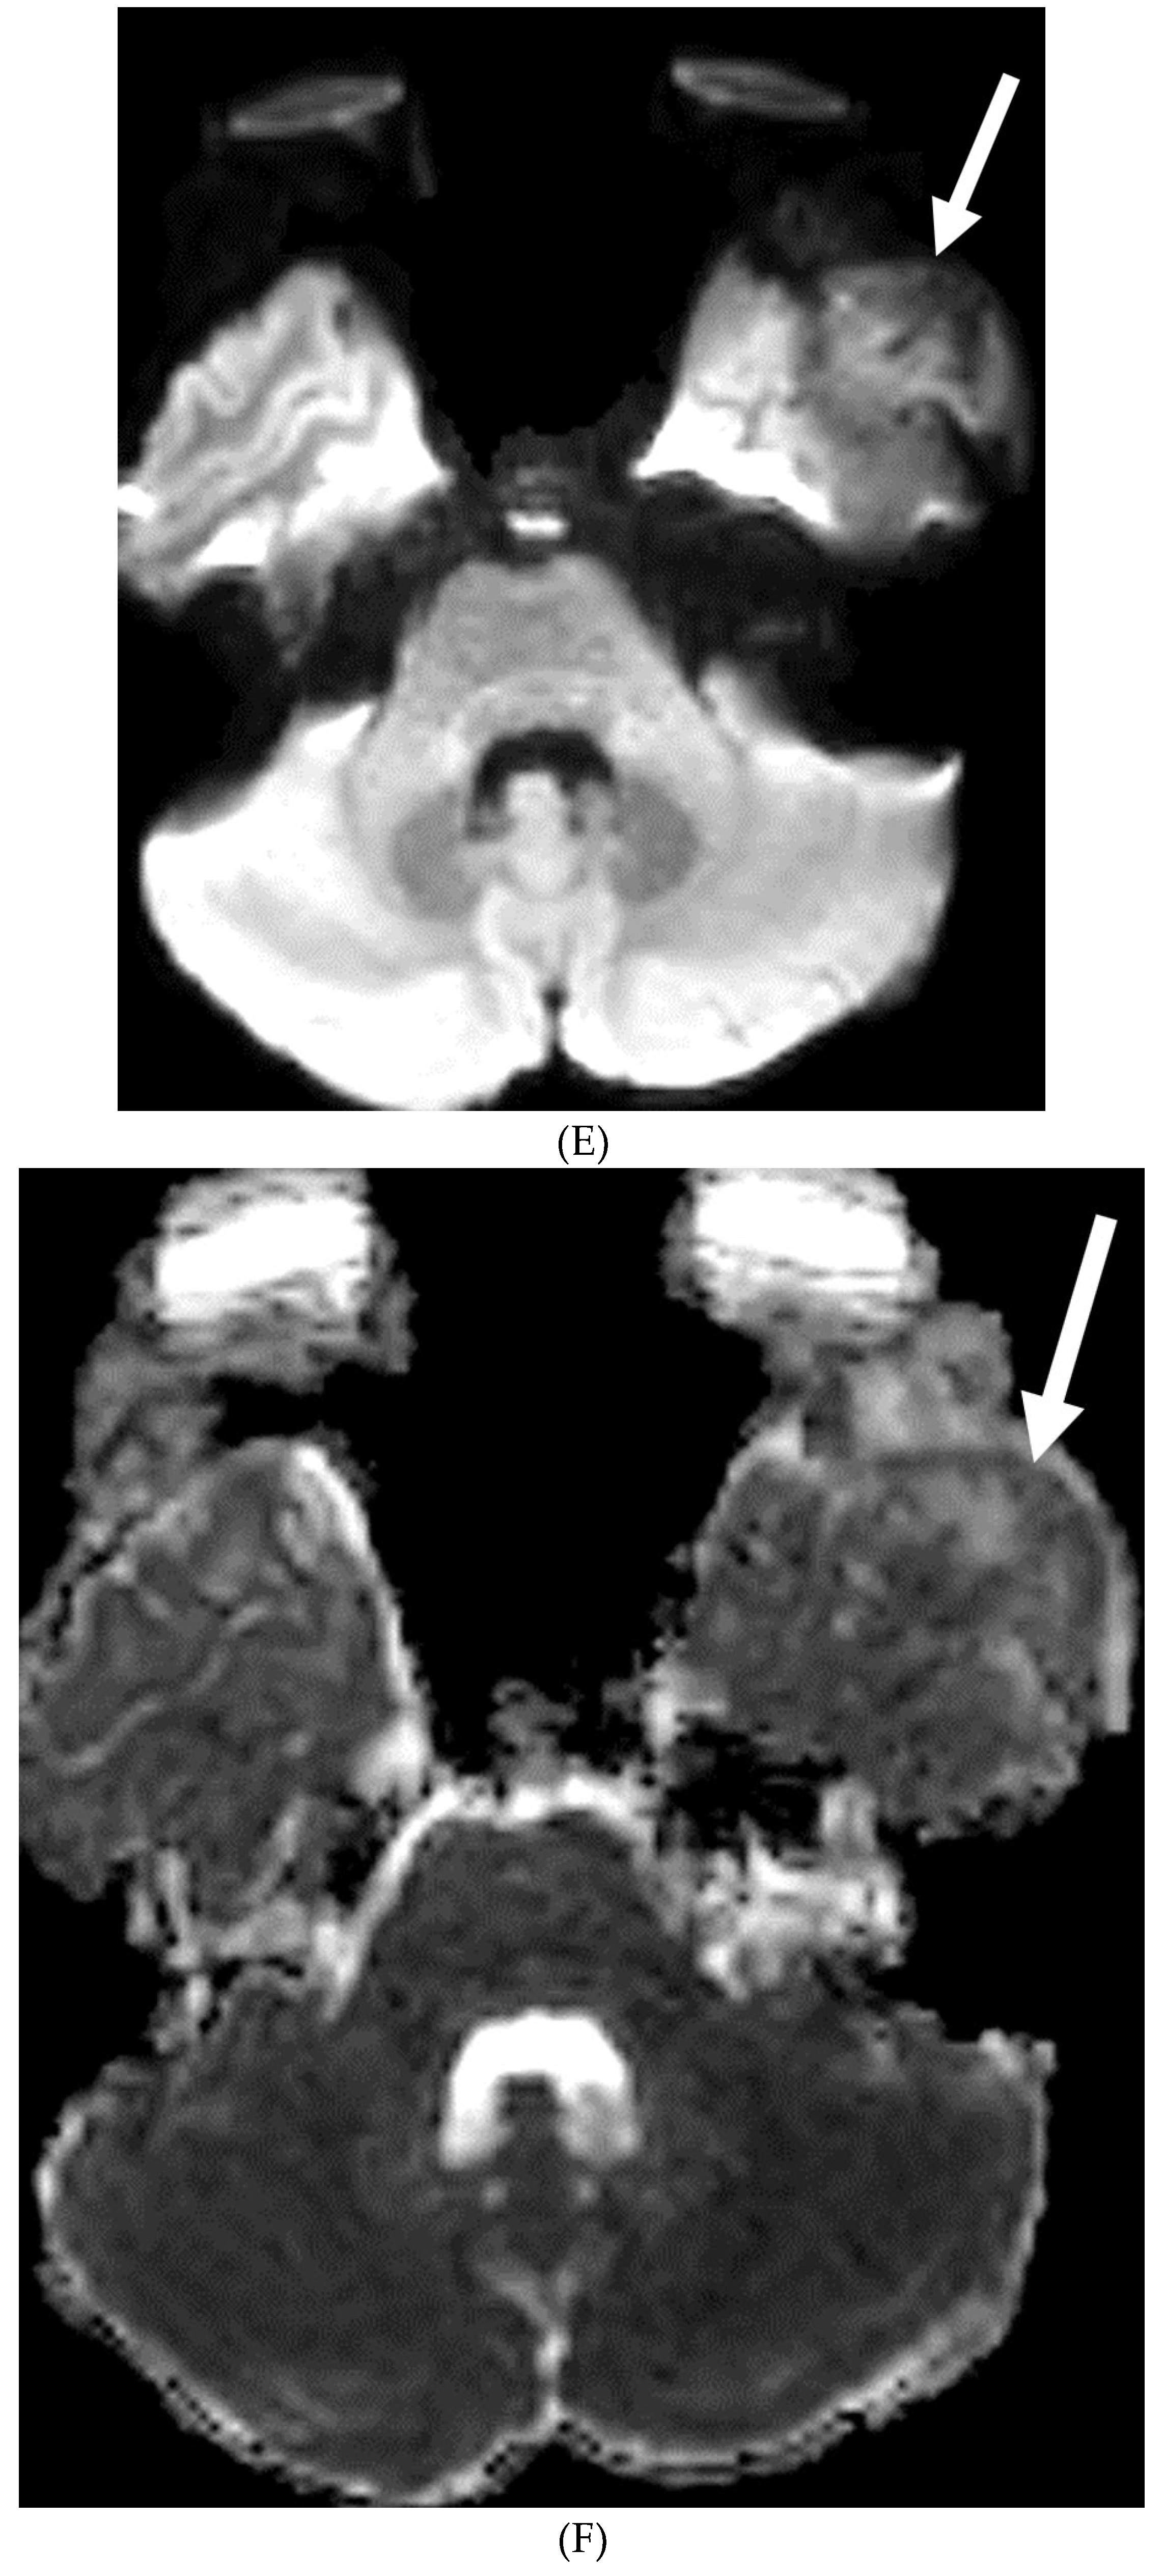
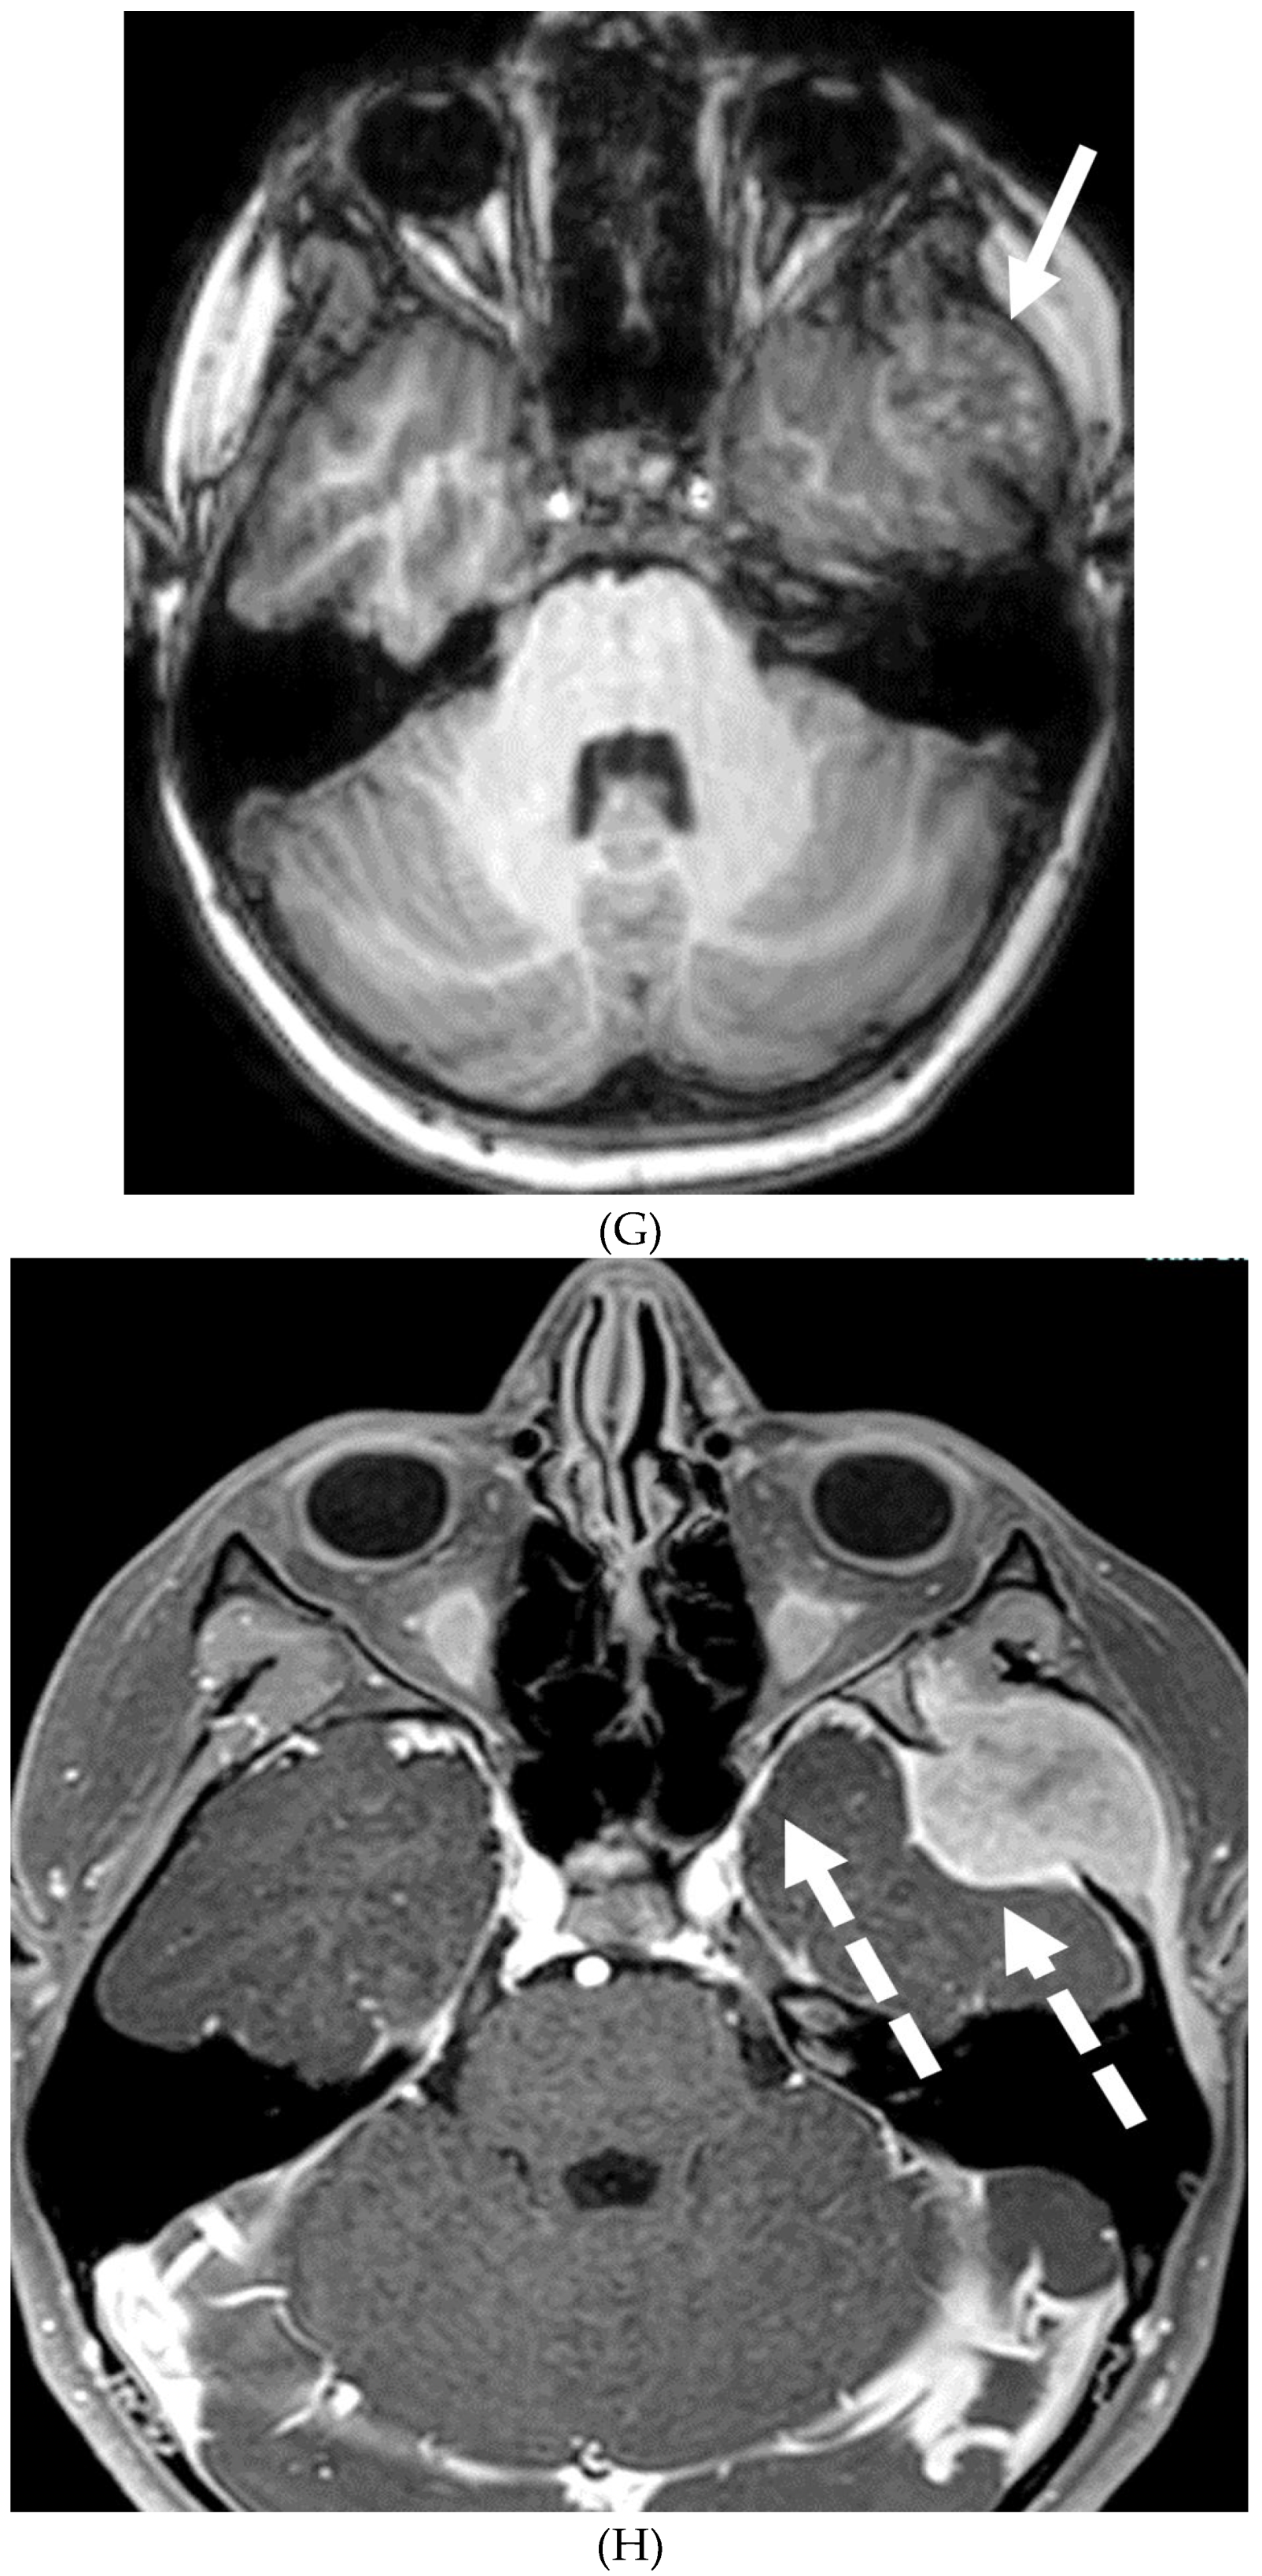
LANGERHANS CELL HISTIOCYTOSIS (LCH)
Author Contributions
Funding
Data Availability Statement
Acknowledgments
Conflicts of Interest
References
- Bou, G., Goldman-Yassen, A., Morris, M., Dutt, M., Philbrook, P., & Gombolay, G. (2024). Differential diagnosis of leptomeningeal enhancement in the pediatric population (P4-4.010). Neurology, 102(17_supplement_1). [CrossRef]
- Mohan, S., Jain, K. K., Arabi, M., & Shah, G. V. (2012). Imaging of Meningitis and Ventriculitis. Neuroimaging Clinics of North America, 22(4), 557–583. [CrossRef]
- Kralik SF, Vallejo JG, Kukreja MK, Salman R, Orman G, Huisman TAGM, Desai NK. Diagnostic Accuracy of MRI for Detection of Meningitis in Infants. AJNR Am J Neuroradiol. 2022 Sep;43(9):1350-1355. PMID: 36574323; PMCID: PMC9451630. [CrossRef]
- Lass-Flörl C, Mayr A. Human protothecosis. Clin Microbiol Rev. 2007 Apr;20(2):230-42. PMID: 17428884; PMCID: PMC1865593. [CrossRef]
- Thiele D, Bergmann A. Protothecosis in human medicine. Int J Hyg Environ Health. 2002 Feb;204(5-6):297-302. PMID: 11885351. [CrossRef]
- Lu Y, Zhang X, Ni F, Xia W. Cutaneous Protothecosis with Meningitis Due to Prototheca wickerhamii in an Immunocompetent Teenager: Case Report and Literature Review. Infect Drug Resist. 2021 Jul 20;14:2787-2794. PMID: 34321895; PMCID: PMC8312625. [CrossRef]
- Joerger T, Sulieman S, Carson VJ, Fox MD. Chronic Meningitis Due to Prototheca zopfii in an Adolescent Girl. J Pediatric Infect Dis Soc. 2021 Apr 3;10(3):370-372. PMID: 32415770; PMCID: PMC8240659. [CrossRef]
- Bathla G, Singh AK, Policeni B, Agarwal A, Case B. Imaging of neurosarcoidosis: common, uncommon, and rare. Clin Radiol. 2016 Jan;71(1):96-106. Epub 2015 Oct 23. PMID: 26506463. [CrossRef]
- Bathla G, Watal P, Gupta S, Nagpal P, Mohan S, Moritani T. Cerebrovascular Manifestations of Neurosarcoidosis: An Underrecognized Aspect of the Imaging Spectrum. AJNR Am J Neuroradiol. 2018 Jul;39(7):1194-1200. Epub 2017 Dec 28. PMID: 29284603; PMCID: PMC7655458. [CrossRef]
- Fritz D, van de Beek D, Brouwer MC. Clinical features, treatment and outcome in neurosarcoidosis: systematic review and meta-analysis. BMC Neurol. 2016 Nov 15;16(1):220. PMID: 27846819; PMCID: PMC5109654. [CrossRef]
- Jachiet V, Lhote R, Rufat P, Pha M, Haroche J, Crozier S, Dupel-Potier C, Psimaras D, Amoura Z, Cohen Aubart F. Clinical, imaging, and histological presentations and outcomes of stroke related to sarcoidosis. J Neurol. 2018 Oct;265(10):2333-2341. Epub 2018 Aug 14. PMID: 30109479. [CrossRef]
- Herring AB, Urich H. Sarcoidosis of the central nervous system. J Neurol Sci. 1969 Nov-Dec;9(3):405-22. PMID: 5367038. [CrossRef]
- Conklin J, Silver FL, Mikulis DJ, Mandell DM. Are acute infarcts the cause of leukoaraiosis? Brain mapping for 16 consecutive weeks. Ann Neurol. 2014 Dec;76(6):899-904. Epub 2014 Oct 30. PMID: 25283088. [CrossRef]
- Stern BJ, Royal 3rd W, Gelfand JM, et al. Definition and consensus diagnostic criteria for neurosarcoidosis: from the neurosarcoidosis consortium consensus group. JAMA Neurol 2018;75(12):1546e53. PMID: 30167654. [CrossRef]
- Hebel R, Dubaniewicz-Wybieralska M, Dubaniewicz A. Overview of neurosarcoidosis: recent advances. J Neurol. 2015 Feb;262(2):258-67. Epub 2014 Sep 7. PMID: 25194844; PMCID: PMC4330460. [CrossRef]
- Shah R, Roberson GH, Curé JK. Correlation of MR imaging findings and clinical manifestations in neurosarcoidosis. AJNR Am J Neuroradiol. 2009 May;30(5):953-61. Epub 2009 Feb 4. PMID: 19193748; PMCID: PMC7051647. [CrossRef]
- Lexa FJ, Grossman RI. MR of sarcoidosis in the head and spine: spectrum of manifestations and radiographic response to steroid therapy. AJNR Am J Neuroradiol. 1994 May;15(5):973-82. PMID: 8059671; PMCID: PMC8332168.
- Bagnato F, Stern BJ. Neurosarcoidosis: diagnosis, therapy and biomarkers. Expert Rev Neurother. 2015 May;15(5):533-48. PMID: 25936846. [CrossRef]
- Christoforidis GA, Spickler EM, Recio MV, Mehta BM. MR of CNS sarcoidosis: correlation of imaging features to clinical symptoms and response to treatment. AJNR Am J Neuroradiol. 1999 Apr;20(4):655-69. PMID: 10319978; PMCID: PMC7056021.
- Dumas JL, Valeyre D, Chapelon-Abric C, Belin C, Piette JC, Tandjaoui-Lambiotte H, Brauner M, Goldlust D. Central nervous system sarcoidosis: follow-up at MR imaging during steroid therapy. Radiology. 2000 Feb;214(2):411-20. PMID: 10671588. [CrossRef]
- Bathla G, Freeman CW, Moritani T, Song JW, Srivastava S, Soni N, Derdeyn C, Mohan S. Retrospective, dual-centre review of imaging findings in neurosarcoidosis at presentation: prevalence and imaging sub-types. Clin Radiol. 2020 Oct;75(10):796.e1-796.e9. Epub 2020 Jul 20. PMID: 32703543. [CrossRef]
- Chiò A, Cocito D, Leone M, Giordana MT, Mora G, Mutani R; Piemonte and Valle d'Aosta Register for Guillain-Barré Syndrome. Guillain-Barré syndrome: a prospective, population-based incidence and outcome survey. Neurology. 2003 Apr 8;60(7):1146-50. PMID: 12682322. [CrossRef]
- Hughes RA, Rees JH. Clinical and epidemiologic features of Guillain-Barré syndrome. J Infect Dis. 1997 Dec;176 Suppl 2:S92-8. PMID: 9396689. [CrossRef]
- Alter M. The epidemiology of Guillain-Barré syndrome. Ann Neurol. 1990;27 Suppl:S7-12. PMID: 2194431. [CrossRef]
- Alkan O, Yildirim T, Tokmak N, Tan M. Spinal MRI findings of guillain-barré syndrome. J Radiol Case Rep. 2009;3(3):25-8. Epub 2009 Mar 1. PMID: 22470650; PMCID: PMC3303301. [CrossRef]
- Winer JB, Hughes RA, Anderson MJ, Jones DM, Kangro H, Watkins RP. A prospective study of acute idiopathic neuropathy. II. Antecedent events. J Neurol Neurosurg Psychiatry. 1988 May;51(5):613-8. PMID: 3404161; PMCID: PMC1033063. [CrossRef]
- Zuccoli G, Panigrahy A, Bailey A, Fitz C. Redefining the Guillain-Barré spectrum in children: neuroimaging findings of cranial nerve involvement. AJNR Am J Neuroradiol. 2011 Apr;32(4):639-42. Epub 2011 Feb 3. PMID: 21292802; PMCID: PMC7965877. [CrossRef]
- van Doorn PA, Ruts L, Jacobs BC. Clinical features, pathogenesis, and treatment of Guillain-Barré syndrome. Lancet Neurol. 2008 Oct;7(10):939-50. PMID: 18848313. [CrossRef]
- Fulbright RK, Erdum E, Sze G, Byrne T. Cranial nerve enhancement in the Guillain-Barré syndrome. AJNR Am J Neuroradiol. 1995 Apr;16(4 Suppl):923-5. PMID: 7611075; PMCID: PMC8332311.
- Yikilmaz A, Doganay S, Gumus H, Per H, Kumandas S, Coskun A. Magnetic resonance imaging of childhood Guillain-Barre syndrome. Childs Nerv Syst. 2010 Aug;26(8):1103-8. Epub 2010 Jun 17. PMID: 20556395. [CrossRef]
- Byun WM, Park WK, Park BH, Ahn SH, Hwang MS, Chang JC. Guillain-Barré syndrome: MR imaging findings of the spine in eight patients. Radiology. 1998 Jul;208(1):137-41. PMID: 9646804. [CrossRef]
- Zuccoli G, Panigrahy A, Bailey A, Fitz C. Redefining the Guillain-Barré spectrum in children: neuroimaging findings of cranial nerve involvement. AJNR Am J Neuroradiol. 2011 Apr;32(4):639-42. Epub 2011 Feb 3. PMID: 21292802; PMCID: PMC7965877. [CrossRef]
- Malhotra A, Zhang M, Wu X, Jindal S, Durand D, Makhani N. MRI findings of optic pathway involvement in Miller Fisher syndrome in 3 pediatric patients and a review of the literature. J Clin Neurosci. 2017 May;39:63-67. Epub 2017 Feb 10. PMID: 28209311. [CrossRef]
- Gallardo E, Sedano MJ, Orizaola P, Sánchez-Juan P, González-Suárez A, García A, Terán-Villagrá N, Ruiz-Soto M, Álvaro RL, Berciano MT, Lafarga M, Berciano J. Spinal nerve involvement in early Guillain-Barré syndrome: a clinico-electrophysiological, ultrasonographic and pathological study. Clin Neurophysiol. 2015 Apr;126(4):810-9. Epub 2014 Aug 21. PMID: 25213352. [CrossRef]
- Razali SNO, Arumugam T, Yuki N, Rozalli FI, Goh KJ, Shahrizaila N. Serial peripheral nerve ultrasound in Guillain-Barré syndrome. Clin Neurophysiol. 2016 Feb;127(2):1652-1656. Epub 2015 Jul 17. PMID: 26228791. [CrossRef]
- Bosman T, Simonin C, Launay D, Caron S, Destée A, Defebvre L. Idiopathic hypertrophic cranial pachymeningitis treated by oral methotrexate: a case report and review of literature. Rheumatol Int. 2008 May;28(7):713-8. Epub 2007 Dec 19. PMID: 18094971; PMCID: PMC2292418. [CrossRef]
- Takahashi H, Wada A, Yokoyama Y, Ishii M, Shibuya K, Suguro T. Idiopathic hypertrophic spinal pachymeningitis: a case report. J Orthop Surg (Hong Kong). 2010 Apr;18(1):113-7. PMID: 20427849. [CrossRef]
- De virgilio A, de vincentiis M, inghilleri M, fabrini G, conte M, gallo A, rizzo MI, greco A. Idiopathic hypertrophic pachymeningitis: an autoimmune igg4-related disease. Immunol res. 2017 feb;65(1):386-394. Pmid: 27592235. [CrossRef]
- Chan SK, Cheuk W, Chan KT, Chan JK. IgG4-related sclerosing pachymeningitis: a previously unrecognized form of central nervous system involvement in IgG4-related sclerosing disease. Am J Surg Pathol. 2009 Aug;33(8):1249-52. PMID: 19561447. [CrossRef]
- Shapiro KA, Bové RM, Volpicelli ER, Mallery RM, Stone JH. Relapsing course of immunoglobulin G4-related pachymeningitis. Neurology. 2012 Aug 7;79(6):604-6. Epub 2012 Jul 25. PMID: 22843267. [CrossRef]
- Kupersmith MJ, Martin V, Heller G, Shah A, Mitnick HJ. Idiopathic hypertrophic pachymeningitis. Neurology. 2004 Mar 9;62(5):686-94. PMID: 15007115. [CrossRef]
- Karthik SN, Bhanu K, Velayutham S, Jawahar M. Hypertrophic pachymeningitis. Ann Indian Acad Neurol. 2011 Jul;14(3):203-4. PMID: 22028536; PMCID: PMC3200046. [CrossRef]
- Friedman DP, Flanders AE. Enhanced MR imaging of hypertrophic pachymeningitis. AJR Am J Roentgenol. 1997 Nov;169(5):1425-8. PMID: 9353473. [CrossRef]
- Goyal M, Malik A, Mishra NK, Gaikwad SB. Idiopathic hypertrophic pachymeningitis: spectrum of the disease. Neuroradiology. 1997 Sep;39(9):619-23. PMID: 9335058. [CrossRef]
- Menon, G., Nair, S., Sudhir, J. et al. Childhood and adolescent meningiomas: a report of 38 cases and review of literature. Acta Neurochir (Wien) 151, 239–244 (2009). [CrossRef]
- Greene S, Nair N, Ojemann JG, Ellenbogen RG, Avellino AM. Meningiomas in children. Pediatr Neurosurg. 2008;44(1):9-13. Epub 2007 Dec 14. PMID: 18097185. [CrossRef]
- Pinto PS, Huisman TA, Ahn E, Jordan LC, Burger P, Cohen KJ, Patay Z, Tekes A. Magnetic resonance imaging features of meningiomas in children and young adults: a retrospective analysis. J Neuroradiol. 2012 Oct;39(4):218-26. Epub 2011 Aug 12. PMID: 21840060. [CrossRef]
- Rochat P, Johannesen HH, Gjerris F. Long-term follow up of children with meningiomas in Denmark: 1935 to 1984. J Neurosurg. 2004 Feb;100(2 Suppl Pediatrics):179-82. PMID: 14758946. [CrossRef]
- Tenenbaum M. Extraparenchymal Lesions in Pediatric Patients. Neuroimaging Clin N Am. 2017 Feb;27(1):123-134. PMID: 27889019. [CrossRef]
- Louis DN, Perry A, Reifenberger G, von Deimling A, Figarella-Branger D, Cavenee WK, Ohgaki H, Wiestler OD, Kleihues P, Ellison DW. The 2016 World Health Organization Classification of Tumors of the Central Nervous System: a summary. Acta Neuropathol. 2016 Jun;131(6):803-20. Epub 2016 May 9. PMID: 27157931. [CrossRef]
- Karlowee, V., Kolakshyapati, M., Amatya, V.J. et al. Diffuse leptomeningeal glioneuronal tumor (DLGNT) mimicking Whipple’s disease: a case report and literature review. Childs Nerv Syst 33, 1411–1414 (2017). [CrossRef]
- Rodriguez FJ, Perry A, Rosenblum MK, Krawitz S, Cohen KJ, Lin D, Mosier S, Lin MT, Eberhart CG, Burger PC. Disseminated oligodendroglial-like leptomeningeal tumor of childhood: a distinctive clinicopathologic entity. Acta Neuropathol. 2012 Nov;124(5):627-41. Epub 2012 Sep 1. PMID: 22941225. [CrossRef]
- Lakhani DA, Mankad K, Chhabda S, Feizi P, Patel R, Sarma A, Pruthi S. Diffuse Leptomeningeal Glioneuronal Tumor of Childhood. AJNR Am J Neuroradiol. 2020 Nov;41(11):2155-2159. Epub 2020 Sep 10. PMID: 32912870; PMCID: PMC7658820. [CrossRef]
- Gardiman MP, Fassan M, Orvieto E, D'Avella D, Denaro L, Calderone M, Severino M, Scarsello G, Viscardi E, Perilongo G. Diffuse leptomeningeal glioneuronal tumors: a new entity? Brain Pathol. 2010 Mar;20(2):361-6. Epub 2009 May 22. PMID: 19486008; PMCID: PMC8094733. [CrossRef]
- Jiang H, Qiu L, Song J, Xu D, Sun L, Feng Y, Zhao J, Qian J, Yu Z, Peng J. Clinical progression, pathological characteristics, and radiological findings in children with diffuse leptomeningeal glioneuronal tumors: A systematic review. Front Oncol. 2022 Sep 16;12:970076. PMID: 36185310; PMCID: PMC9525023. [CrossRef]
- Wolden SL, Alektiar KM. Sarcomas across the age spectrum. Semin Radiat Oncol. 2010 Jan;20(1):45-51. PMID: 19959030. [CrossRef]
- McCarville MB, Spunt SL, Pappo AS. Rhabdomyosarcoma in pediatric patients: the good, the bad, and the unusual. AJR Am J Roentgenol. 2001;176(6):1563-1569. PMID: 11373233. [CrossRef]
- Korinthenberg R, Edel G, Palm D, Müller KM, Brandt M, Müller RP. Primary rhabdomyosarcoma of the leptomeninx. Clinical, neuroradiological and pathological aspects. Clin Neurol Neurosurg. 1984;86(4):301-5. PMID: 6096065. [CrossRef]
- Xu F, De Las Casas LE, Dobbs LJ Jr. Primary meningeal rhabdomyosarcoma in a child with hypomelanosis of Ito. Arch Pathol Lab Med. 2000 May;124(5):762-5. PMID: 10782165. [CrossRef]
- Primary Meningeal Rhabdomyosarcoma - Rahul Nikam MD, Ashrith Kandula, Tushar Chandra, MD Affiliations: Nemours/Alfred I. duPont Hospital for Children, Wilmington, DE (Dr Nikam, Mr. Kandula);Nemours Children’s Hospital, Orlando, FL (Dr Chandra).
- Palta M, Riedel RF, Vredenburgh JJ, Cummings TJ, Green S, Chang Z, Kirkpatrick JP. Primary meningeal rhabdomyosarcoma. Sarcoma. 2011;2011:312802. Epub 2011 Jun 23. PMID: 21772793; PMCID: PMC3137955. [CrossRef]
- Peterson EE, Riley BL, Windsor RB. Pediatric Intracranial Hypotension and Post-Dural Puncture Headache. Semin Pediatr Neurol. 2021 Dec;40:100927. Epub 2021 Sep 3. PMID: 34749914. [CrossRef]
- Schievink WI, Maya MM, Louy C, Moser FG, Sloninsky L. Spontaneous intracranial hypotension in childhood and adolescence. J Pediatr. 2013 Aug;163(2):504-10. Epub 2013 Feb 28. PMID: 23453548. [CrossRef]
- Shah LM, McLean LA, Heilbrun ME, Salzman KL. Intracranial hypotension: improved MRI detection with diagnostic intracranial angles. AJR Am J Roentgenol. 2013 Feb;200(2):400-7. PMID: 23345364. [CrossRef]
- Yuh EL, Dillon WP. Intracranial hypotension and intracranial hypertension. Neuroimaging Clin N Am. 2010 Nov;20(4):597-617. PMID: 20974378. [CrossRef]
- Medina JH, Abrams K, Falcone S, Bhatia RG. Spinal imaging findings in spontaneous intracranial hypotension. AJR Am J Roentgenol. 2010 Aug;195(2):459-64. PMID: 20651205. [CrossRef]
- Kemps PG, Picarsic J, Durham BH, et al. ALK-positive histiocytosis: a new clinicopathologic spectrum highlighting neurologic involvement and responses to ALK inhibition. Blood. 2022 Jan 13;139(2):256-280. Erratum in: Blood. 2023 Jun 01;141(22):2785-2786. doi: 10.1182/blood.2022017205. PMID: 34727172; PMCID: PMC8759533. [CrossRef]
- Aoki Y, Maeda M, Kishi S, Kogue R, Tanaka F, Umino M, Takeoka M, Hanaki R, Hirayama J, Yuasa H, Imai H, Hirayama M, Sakuma H. Central nervous system involvement of systemic ALK-positive histiocytosis with KIF5B-ALK fusion. Radiol Case Rep. 2022 Aug 10;17(10):3867-3870. PMID: 35982724; PMCID: PMC9379947. [CrossRef]
- Wang J, Zheng Y, Xiong Y. Imaging features of ALK-positive histiocytosis with neurological involvement: a case report and literature review. Front Oncol. 2024 Feb 22;14:1333519. PMID: 38463230; PMCID: PMC10921790. [CrossRef]
- Liu W, Liu HJ, Wang WY, Tang Y, Zhao S, Zhang WY, Yan JQ, Liu WP. Multisystem ALK-positive histiocytosis: a multi-case study and literature review. Orphanet J Rare Dis. 2023 Mar 13;18(1):53. PMID: 36915094; PMCID: PMC10010018. [CrossRef]
- Vaswani AK, Nizamani WM, Ali M, Aneel G, Shahani BK, Hussain S. Diagnostic Accuracy of Contrast-Enhanced FLAIR Magnetic Resonance Imaging in Diagnosis of Meningitis Correlated with CSF Analysis. ISRN Radiol. 2014 Mar 20;2014:578986. PMID: 24977138; PMCID: PMC4062848. [CrossRef]
- Jaremko JL, Moon AS, Kumbla S. Patterns of complications of neonatal and infant meningitis on MRI by organism: a 10 year review. Eur J Radiol. 2011 Dec;80(3):821-7. Epub 2010 Nov 10. PMID: 21067879. [CrossRef]
- Chiang SS, Khan FA, Milstein MB, Tolman AW, Benedetti A, Starke JR, et al. Treatment outcomes of childhood tuberculous meningitis: a systematic review and meta-analysis. Lancet Infect Dis. (2014) 14:947–57. [CrossRef]
- Dian S, Hermawan R, van Laarhoven A, Immaculata S, Achmad TH, Ruslami R, Anwary F, Soetikno RD, Ganiem AR, van Crevel R. Brain MRI findings in relation to clinical characteristics and outcome of tuberculous meningitis. PLoS One. 2020 Nov 13;15(11):e0241974. PMID: 33186351; PMCID: PMC7665695. [CrossRef]
- Krishnan N, Renganathan L. Tuberculous meningitis sequelae as basal cisternal calcifications. J Pediatr Neurosci. 2016 Jan-Mar;11(1):86-7. PMID: 27195045; PMCID: PMC4862301. [CrossRef]
- Khatri GD, Krishnan V, Antil N, Saigal G. Magnetic resonance imaging spectrum of intracranial tubercular lesions: one disease, many faces. Pol J Radiol. 2018 Dec 29;83:e524-e535. PMID: 30800191; PMCID: PMC6384409. [CrossRef]
- Bomanji JB, Gupta N, Gulati P, Das CJ. Imaging in tuberculosis. Cold Spring Harb Perspect Med. 2015 Jan 20;5(6):a017814. PMID: 25605754; PMCID: PMC4448708. [CrossRef]
- Kralik SF, O'Neill DP, Kamer AP, Rodriguez E, Ho CY. Radiological diagnosis of drop metastases from paediatric brain tumours using combination of 2D and 3D MRI sequences. Clin Radiol. 2017 Oct;72(10):902.e13-902.e19. Epub 2017 May 22. PMID: 28545686. [CrossRef]
- Silva, F.A.B., Senerchia, A.A., Cappellano, A. et al. Medulloblastoma and Drop Metastasis: MRI Evaluation and Optimized Protocol. Curr Radiol Rep 3, 26 (2015). [CrossRef]
- Harrison SK, Ditchfield MR, Waters K. Correlation of MRI and CSF cytology in the diagnosis of medulloblastoma spinal metastases. Pediatr Radiol. 1998 Aug;28(8):571-4. PMID: 9716623. [CrossRef]
- Lisanti C, Carlin C, Banks KP, Wang D. Normal MRI appearance and motion-related phenomena of CSF. AJR Am J Roentgenol. 2007 Mar;188(3):716-25. PMID: 17312059. [CrossRef]
- Singh SK, Leeds NE, Ginsberg LE. MR imaging of leptomeningeal metastases: comparison of three sequences. AJNR Am J Neuroradiol. 2002 May;23(5):817-21. PMID: 12006284; PMCID: PMC7974747.
- Porto L, Kieslich M, Bartels M, Schwabe D, Zanella FE, Du Mesnil R. Leptomeningeal metastases in pediatrics: magnetic resonance image manifestations and correlation with cerebral spinal fluid cytology. Pediatr Int. 2010 Aug;52(4):541-6. PMID: 20534022. [CrossRef]
- Chamberlain MC. A review of leptomeningeal metastases in pediatrics. J Child Neurol. 1995 May;10(3):191-9. PMID: 7642887. [CrossRef]
- Hatzoglou V, Karimi S, Diamond EL, Lis E, Krol G, Holodny AI, Young RJ. Nonenhancing Leptomeningeal Metastases: Imaging Characteristics and Potential Causative Factors. Neurohospitalist. 2016 Jan;6(1):24-8. PMID: 26753054; PMCID: PMC4680901. [CrossRef]
- Nguyen A, Nguyen A, Dada OT, Desai PD, Ricci JC, Godbole NB, Pierre K, Lucke-Wold B. Leptomeningeal Metastasis: A Review of the Pathophysiology, Diagnostic Methodology, and Therapeutic Landscape. Curr Oncol. 2023 Jun 19;30(6):5906-5931. PMID: 37366925; PMCID: PMC10297027. [CrossRef]
- Freilich RJ, Krol G, DeAngelis LM. Neuroimaging and cerebrospinal fluid cytology in the diagnosis of leptomeningeal metastasis. Ann Neurol. 1995 Jul;38(1):51-7. PMID: 7611725. [CrossRef]
- Liu ZW, Han C, Zhao F, Qiao PG, Wang H, Bao XY, Zhang ZS, Yang WZ, Li DS, Duan L. Collateral Circulation in Moyamoya Disease: A New Grading System. Stroke. 2019 Oct;50(10):2708-2715. Epub 2019 Aug 14. PMID: 31409266. [CrossRef]
- Tajmalzai A, Shirzai A, Najah DM. Early manifestation of Moyamoya syndrome in a 2-year-old child with Down syndrome. Radiol Case Rep. 2021 May 1;16(7):1740-1744. PMID: 34007395; PMCID: PMC8111440. [CrossRef]
- Horie N, Morikawa M, Nozaki A, Hayashi K, Suyama K, Nagata I. "Brush Sign" on susceptibility-weighted MR imaging indicates the severity of moyamoya disease. AJNR Am J Neuroradiol. 2011 Oct;32(9):1697-702. Epub 2011 Jul 28. PMID: 21799039; PMCID: PMC7965393. [CrossRef]
- Ohta T, Tanaka H, Kuroiwa T. Diffuse leptomeningeal enhancement, "ivy sign," in magnetic resonance images of moyamoya disease in childhood: case report. Neurosurgery. 1995 Nov;37(5):1009-12. PMID: 8559324. [CrossRef]
- Maeda M, Tsuchida C. "Ivy sign" on fluid-attenuated inversion-recovery images in childhood moyamoya disease. AJNR Am J Neuroradiol. 1999 Nov-Dec;20(10):1836-8. PMID: 10588105; PMCID: PMC7657767.
- Liu ZW, Han C, Wang H, Zhang Q, Li SJ, Bao XY, Zhang ZS, Duan L. Clinical characteristics and leptomeningeal collateral status in pediatric and adult patients with ischemic moyamoya disease. CNS Neurosci Ther. 2020 Jan;26(1):14-20. Epub 2019 Apr 13. PMID: 31875482; PMCID: PMC6930821. [CrossRef]
- Komiyama M, Nakajima H, Nishikawa M, Yasui T, Kitano S, Sakamoto H. Leptomeningeal contrast enhancement in moyamoya: its potential role in postoperative assessment of circulation through the bypass. Neuroradiology. 2001 Jan;43(1):17-23. PMID: 11214642. [CrossRef]
- Alonso A, Eisele P, Ebert AD, Griebe M, Engelhardt B, Szabo K, Hennerici MG, Gass A. Leptomeningeal contrast enhancement and blood-CSF barrier dysfunction in aseptic meningitis. Neurol Neuroimmunol Neuroinflamm. 2015 Oct 15;2(6):e164. PMID: 26516629; PMCID: PMC4608759. [CrossRef]
- Vossough A, Zimmerman RA, Bilaniuk LT, Schwartz EM. Imaging findings of neonatal herpes simplex virus type 2 encephalitis. Neuroradiology. 2008 Apr;50(4):355-66. Epub 2008 Feb 2. PMID: 18246335. [CrossRef]
- Mathur M, Johnson CE, Sze G. Fungal infections of the central nervous system. Neuroimaging Clin N Am. 2012 Nov;22(4):609-32. Epub 2012 Aug 17. PMID: 23122259. [CrossRef]
- McCarthy MW, Kalasauskas D, Petraitis V, Petraitiene R, Walsh TJ. Fungal Infections of the Central Nervous System in Children. J Pediatric Infect Dis Soc. 2017 Sep 1;6(3):e123-e133. PMID: 28903523. [CrossRef]
- Mohan S, Jain KK, Arabi M, Shah GV. Imaging of meningitis and ventriculitis. Neuroimaging Clin N Am. 2012 Nov;22(4):557-83. Epub 2012 Sep 4. PMID: 23122257. [CrossRef]
- Gavito-Higuera J, Mullins CB, Ramos-Duran L, Olivas Chacon CI, Hakim N, Palacios E. Fungal Infections of the Central Nervous System: A Pictorial Review. J Clin Imaging Sci. 2016 Jun 17;6:24. PMID: 27403402; PMCID: PMC4926551. [CrossRef]
- Aiken AH. Central nervous system infection. Neuroimaging Clin N Am. 2010 Nov;20(4):557-80. PMID: 20974376. [CrossRef]
- Jain KK, Mittal SK, Kumar S, Gupta RK. Imaging features of central nervous system fungal infections. Neurol India. 2007 Jul-Sep;55(3):241-50. PMID: 17921653. [CrossRef]
- Li L, Liu W, Cai Q, Liu Y, Hu W, Zuo Z, Ma Q, He S, Jin K. Leptomeningeal enhancement of myelin oligodendrocyte glycoprotein antibody-associated encephalitis: uncovering novel markers on contrast-enhanced fluid-attenuated inversion recovery images. Front Immunol. 2023 Jun 20;14:1152235. PMID: 37409120; PMCID: PMC10318903. [CrossRef]
- Shahriari M, Sotirchos ES, Newsome SD, Yousem DM. MOGAD: How It Differs From and Resembles Other Neuroinflammatory Disorders. AJR Am J Roentgenol. 2021 Apr;216(4):1031-1039. Epub 2021 Feb 17. PMID: 32755221. [CrossRef]
- Gadde JA, Wolf DS, Keller S, Gombolay GY. Rate of Leptomeningeal Enhancement in Pediatric Myelin Oligodendrocyte Glycoprotein Antibody-Associated Encephalomyelitis. J Child Neurol. 2021 Oct;36(11):1042-1046. PMID: 34547933; PMCID: PMC9054459. [CrossRef]
- Valencia-Sanchez C, Guo Y, Krecke KN et al. Cerebral Cortical Encephalitis in Myelin Oligodendrocyte Glycoprotein Antibody-Associated Disease. Ann Neurol. 2023 Feb;93(2):297-302. Epub 2022 Dec 2. PMID: 36372941; PMCID: PMC10107670. [CrossRef]
- Guzman-Soto MI, Kimura Y, Romero-Sanchez G et al. From Head to Toe: Granulomatosis with Polyangiitis. Radiographics. 2021 Nov-Dec;41(7):1973-1991. Epub 2021 Oct 15. PMID: 34652975. [CrossRef]
- Fragoulis GE, Lionaki S, Venetsanopoulou A et al. Central nervous system involvement in patients with granulomatosis with polyangiitis: a single-center retrospective study. Clin Rheumatol. 2018 Mar;37(3):737-747. Epub 2017 Sep 15. PMID: 28914375. [CrossRef]
- Zhang W, Zhou G, Shi Q et al. Clinical analysis of nervous system involvement in ANCA-associated systemic vasculitides. Clin Exp Rheumatol. 2009 Jan-Feb;27(1 Suppl 52):S65-9. PMID: 19646349.
- Zheng Y, Zhang Y, Cai M, Lai N, Chen Z, Ding M. Central Nervous System Involvement in ANCA-Associated Vasculitis: What Neurologists Need to Know. Front Neurol. 2019 Jan 10;9:1166. PMID: 30687221; PMCID: PMC6335277. [CrossRef]
- Murphy JM, Gomez-Anson B, Gillard JH, Antoun NM, Cross J, Elliott JD, Lockwood M. Wegener granulomatosis: MR imaging findings in brain and meninges. Radiology. 1999 Dec;213(3):794-9. PMID: 10580955. [CrossRef]
- Guzman-Soto MI, Kimura Y, Romero-Sanchez G et al. From Head to Toe: Granulomatosis with Polyangiitis. Radiographics. 2021 Nov-Dec;41(7):1973-1991. Epub 2021 Oct 15. PMID: 34652975. [CrossRef]
- Eran A, Hodes A, Izbudak I. Bilateral temporal lobe disease: looking beyond herpes encephalitis. Insights Imaging. 2016 Apr;7(2):265-74. Epub 2016 Feb 24. PMID: 26911968; PMCID: PMC4805615. [CrossRef]
- Titulaer MJ, McCracken L, Gabilondo I et al. Treatment and prognostic factors for long-term outcome in patients with anti-NMDA receptor encephalitis: an observational cohort study. Lancet Neurol. 2013 Feb;12(2):157-65. Epub 2013 Jan 3. PMID: 23290630; PMCID: PMC3563251. [CrossRef]
- Zhang L, Wu MQ, Hao ZL et al. Clinical characteristics, treatments, and outcomes of patients with anti-N-methyl-d-aspartate receptor encephalitis: A systematic review of reported cases. Epilepsy Behav. 2017 Mar;68:57-65. Epub 2017 Jan 19. PMID: 28109991. [CrossRef]
- Gabilondo I, Saiz A, Galán L et al. Analysis of relapses in anti-NMDAR encephalitis. Neurology. 2011 Sep 6;77(10):996-9. Epub 2011 Aug 24. PMID: 21865579. [CrossRef]
- Irani SR, Bera K, Waters P et al. N-methyl-D-aspartate antibody encephalitis: temporal progression of clinical and paraclinical observations in a predominantly non-paraneoplastic disorder of both sexes. Brain. 2010 Jun;133(Pt 6):1655-67. PMID: 20511282; PMCID: PMC2877907. [CrossRef]
- Kelley BP, Patel SC, Marin HL, Corrigan JJ, Mitsias PD, Griffith B. Autoimmune Encephalitis: Pathophysiology and Imaging Review of an Overlooked Diagnosis. AJNR Am J Neuroradiol. 2017 Jun;38(6):1070-1078. Epub 2017 Feb 9. PMID: 28183838; PMCID: PMC7960083. [CrossRef]
- Park JK, Lee EJ, Kim KK. Isolated Leptomeningeal Enhancement in Anti-N-Methyl D-Aspartate Receptor Encephalitis: The Diagnostic Value of Contrast-Enhanced Fluid-Attenuated Inversion Recovery Imaging. J Korean Soc Radiol. 2022 Jul;83(4):945-950. Epub 2021 Dec 11. PMID: 36238909; PMCID: PMC9550631. [CrossRef]
- Agarwal A, Kapur G, Altinok D. Childhood posterior reversible encephalopathy syndrome: Magnetic resonance imaging findings with emphasis on increased leptomeningeal FLAIR signal. Neuroradiol J. 2015 Dec;28(6):638-43. Epub 2015 Oct 29. PMID: 26515749; PMCID: PMC4757130. [CrossRef]
- Ishikura K, Ikeda M, Hamasaki Y, Hataya H, Shishido S, Asanuma H, Nishimura G, Hiramoto R, Honda M. Posterior reversible encephalopathy syndrome in children: its high prevalence and more extensive imaging findings. Am J Kidney Dis. 2006 Aug;48(2):231-8. PMID: 16860188. [CrossRef]
- Bartynski WS. Posterior reversible encephalopathy syndrome, part 1: fundamental imaging and clinical features. AJNR Am J Neuroradiol. 2008 Jun;29(6):1036-42. Epub 2008 Mar 20. PMID: 18356474; PMCID: PMC8118828. [CrossRef]
- Hamilton BE, Nesbit GM. Delayed CSF enhancement in posterior reversible encephalopathy syndrome. AJNR Am J Neuroradiol. 2008 Mar;29(3):456-7. Epub 2008 Jan 9. PMID: 18184835; PMCID: PMC8118892. [CrossRef]
- Aylett, Sarah. Sturge-Weber syndrome. Annals of Indian Academy of Neurology 10(Suppl 1):p S55-S58, Apr–Jun 2007.
- Bar C, Pedespan JM, Boccara O, Garcelon N, Levy R, Grévent D, Boddaert N, Nabbout R. Early magnetic resonance imaging to detect presymptomatic leptomeningeal angioma in children with suspected Sturge-Weber syndrome. Dev Med Child Neurol. 2020 Feb;62(2):227-233. Epub 2019 May 3. PMID: 31050360. [CrossRef]
- Adams ME, Aylett SE, Squier W, Chong W. A spectrum of unusual neuroimaging findings in patients with suspected Sturge-Weber syndrome. AJNR Am J Neuroradiol. 2009 Feb;30(2):276-81. Epub 2008 Dec 2. PMID: 19050205; PMCID: PMC7051391. [CrossRef]
- Gabbay LB, Leite Cda C, Andriola RS, Pinho Pda C, Lucato LT. Histiocytosis: a review focusing on neuroimaging findings. Arq Neuropsiquiatr. 2014 Jul;72(7):548-58. PMID: 25054989. [CrossRef]
- Ribeiro BNF, Muniz BC, Marchiori E. Langerhans cell histiocytosis with isolated meningeal involvement: findings on magnetic resonance imaging. Radiol Bras. 2018 Sep-Oct;51(5):343-344. PMID: 30369670; PMCID: PMC6198827. [CrossRef]
- Pyun JM, Park H, Moon KC, Jeon B. Late-Onset Langerhans Cell Histiocytosis with Cerebellar Ataxia as an Initial Symptom. Case Rep Neurol. 2016 Oct 31;8(3):218-223. PMID: 27920713; PMCID: PMC5121570. [CrossRef]
- Haroche J, Cohen-Aubart F, Rollins BJ et al. Histiocytoses: emerging neoplasia behind inflammation. Lancet Oncol. 2017 Feb;18(2):e113-e125. PMID: 28214412. [CrossRef]
- Grois N, Fahrner B, Arceci RJ, Henter JI, McClain K, Lassmann H, Nanduri V, Prosch H, Prayer D; Histiocyte Society CNS LCH Study Group. Central nervous system disease in Langerhans cell histiocytosis. J Pediatr. 2010 Jun;156(6):873-881.e1. PMID: 20434166. [CrossRef]
- Grois N, Pötschger U, Prosch H, Minkov M, Arico M, Braier J, Henter JI, Janka-Schaub G, Ladisch S, Ritter J, Steiner M, Unger E, Gadner H; DALHX- and LCH I and II Study Committee. Risk factors for diabetes insipidus in langerhans cell histiocytosis. Pediatr Blood Cancer. 2006 Feb;46(2):228-33. PMID: 16047354. [CrossRef]
- Gabbay LB, Leite Cda C, Andriola RS, Pinho Pda C, Lucato LT. Histiocytosis: a review focusing on neuroimaging findings. Arq Neuropsiquiatr. 2014 Jul;72(7):548-58. PMID: 25054989. [CrossRef]
- Prayer D, Grois N, Prosch H, Gadner H, Barkovich AJ. MR imaging presentation of intracranial disease associated with Langerhans cell histiocytosis. AJNR Am J Neuroradiol. 2004 May;25(5):880-91. PMID: 15140741; PMCID: PMC7974468.
- Grois N, Prosch H, Waldhauser F, Minkov M, Strasser G, Steiner M, Unger E, Prayer D. Pineal gland abnormalities in Langerhans cell histiocytosis. Pediatr Blood Cancer. 2004 Sep;43(3):261-6. PMID: 15266411. [CrossRef]
- Gabbay, L. B., Leite, C. da C., Andriola, R. S., Pinho, P. da C., & Lucato, L. T. (2014). Histiocytosis: a review focusing on neuroimaging findings. Arquivos de Neuro-Psiquiatria, 72(7), 548–558. [CrossRef]
- Martin-Duverneuil N, Idbaih A, Hoang-Xuan K, Donadieu J, Genereau T, Guillevin R, Chiras J; French Langerhans Cell Histiocytosis Study Group. MRI features of neurodegenerative Langerhans cell histiocytosis. Eur Radiol. 2006 Sep;16(9):2074-82. Epub 2006 Apr 20. PMID: 16625352. [CrossRef]


Disclaimer/Publisher’s Note: The statements, opinions and data contained in all publications are solely those of the individual author(s) and contributor(s) and not of MDPI and/or the editor(s). MDPI and/or the editor(s) disclaim responsibility for any injury to people or property resulting from any ideas, methods, instructions or products referred to in the content. |
© 2024 by the authors. Licensee MDPI, Basel, Switzerland. This article is an open access article distributed under the terms and conditions of the Creative Commons Attribution (CC BY) license (http://creativecommons.org/licenses/by/4.0/).


