Preprint
Article

Exploring the Relationship Between Electrical Characteristics and Changes in Chemical Composition and Structure of OSG Low-k Films under Thermal Annealing

Altmetrics

Downloads

48

Views

53

Comments

0

A peer-reviewed article of this preprint also exists.

Submitted:

25 September 2024

Posted:

26 September 2024

You are already at the latest version

Alerts
Abstract
The paper is dedicated to studying the influence of annealing temperature on the chemical, structural and electrophysical properties of low-k films made from porous organosilicate glasses containing terminal methyl groups. The films were deposited using centrifugation, followed by drying at 200 °C and annealing at temperatures ranging from 350 °C to 900 °C. Changes in refractive index, porosity, pore size, chemical composition, and electrical properties as a function of annealing temperature are evaluated. The results of JV measurements indicate that the methyl-modified film, which was annealed at 450 °С, demonstrates minimal leakage currents. This phenomenon can be explained by the almost complete removal of surfactant residues and non-condensed silanols, as well as the minimal thermal degradation of methyl groups. The results of the study on leakage current models in methyl-modified films, obtained at various annealing temperatures, lead us to conclude that the predominant mechanism of charge carrier transfer is Poole–Frenkel emission.
Keywords: 
Subject: Chemistry and Materials Science  -   Surfaces, Coatings and Films

1. Introduction

One of the primary applications of thin films with low dielectric constant (low-k) is their integration into the interconnect structures of advanced ultra-large-scale integration (ULSI) devices. The low-k films integrated together with low resistivity metals (Cu, Co, Ru, etc.) allow for compensation of the capacitance increase associated with the continuing device shrinkage [1,2,3]. Extensive exploratory studies on low-k dielectrics have been conducted during the last two decades, and the most important results are systematized, for instance, in the refs. [3,4,5,6]. Materials based on organosilica glasses (OSG), which are characterized by a silica-like matrix structure, have been identified as the most suitable for current microelectronics technologies. By incorporating various organic groups into the silica matrix and employing different deposition methods, it is possible to fine-tune the properties of these materials. In these materials, some of the bridging oxygen atoms in the silica-like matrix are substituted with terminal methyl (or other alkyl) groups, which contribute to a low dielectric constant due to the formation of free volume (micropores) and enhance hydrophobicity (Figure 1). Recently, OSG materials containing organic bridges between Si atoms and exhibiting ordered porosity, known as periodic mesoporous organosilica (PMO), have also been extensively studied. Their structural, chemical, and electrical properties are discussed in the review paper [7].
It is crucial to note that hydrophobicity is a significant property, as water molecules have a high dielectric constant (~80), and even a small amount of moisture can substantially elevate the dielectric constant of a material. This issue is further exacerbated in porous materials, where the high surface area can adsorb considerable amounts of moisture. Consequently, precursors used for the deposition of organosilicon films typically contain at least one methyl group directly bonded to silicon.
However, the reduction of dielectric constant by introducing low-polarizability groups and a slight increase in free volume is insufficient to achieve dielectric permittivity values of k < 3.0. It is essential to incorporate additional artificial porosity by using structure-forming agents, such as sacrificial porogens or surfactants. Thermal decomposition of these organic compounds results in the formation of a porous structure, which lowers the k value of the films. However, residual amounts of porogens or surfactants (CHx) remaining after heat treatment can increase leakage currents and reduce breakdown voltage.
Thermal annealing (thermal curing, often assisted with UV light [8]) is a crucial step in the fabrication of low-k films [4,5] as it facilitates the removal of the structure-forming agents and the formation of a cross-linked matrix structure. However, if the heat and UV treatment process is too aggressive, it may lead to the undesirable degradation (depletion) of the –CH3 terminal groups, which are responsible for the material’s hydrophobic properties. This is the reason why the microelectronics industry use a curing temperature not exceeding 450 °C and UV light with λ > 200 nm. The methyl terminal groups are primarily localized on the pore wall surface, imparting hydrophobicity to the film, which is essential for preventing moisture adsorption. The modification of chemical composition during the thermal curing (particularly, the removal of porogen or surfactant as well as degradation of the CH3 terminal groups) can be primarily analyzed using Fourier-transform infrared spectroscopy (FTIR), particularly by examining the valence asymmetric and symmetric C–H vibrations of the methylene (–CH2–) group, which absorb at ~2925 and ~2895 cm–1 respectively [9]. A more detailed study must include more comprehensive analytical techniques and evaluation of electrical characteristics [6,7,8].
Therefore, careful optimization of thermal curing and understanding the impact of chemical composition (such as carbon residue, methyl terminal groups, and adsorbed moisture) and structural changes (including porosity, density, and pore size) during thermal curing on electrical properties are crucial for further optimizing low-k films. This is the reason why these challenges have been addressed in numerous studies.
Porogen and surfactant residues (sp2, sp3 carbon) formed after non-optimized thermal curing have a strong impact on electrical characteristics and reliability [7,8]. The existence of sp2 and sp3 hybridized carbon-like porogen residues is well studied using UV spectroscopic ellipsometry. The increased amount of porogen residues enhances the leakage current level since these graphitic-like structures are conductive. In the same study, the self-assembled low-k material prepared without porogen and UV curing shows lower leakage currents compared to low-k dielectrics prepared with porogen and curing [7,8]. The presence of porogen residues in low-k dielectrics is also reported by other authors. The results obtained using electron-spin resonance (ESR) spectroscopy [10,11] show the presence of signals associated with carbon dangling bonds in low-k dielectrics. King et al. [12] pointed out that the defect band between 2–6 eV in the bandgap of the low-k dielectric is attributed to these carbon dangling bonds from porogen residues. Lauer et al. [13] showed that the defect centers originating from porogen residues are able to capture and exchange electrons. These studies indicate that porogen residue can play a dominant role in electrical transport at low fields.
An increased thermal budget can effectively reduce the amount of porogen residues but may also degrade a certain amount of methyl terminal groups, making the films hydrophilic and leading to moisture adsorption in subsequent processing steps. The adsorbed moisture degrades the electrical properties and reliability performance of low-k films [14]. Attempts have been made done to characterize the conduction mechanism of moisturized low-k dielectrics, but the exact mechanism remains unknown. Lloyd et al. [15] shows that capacitors could have Schottky and Poole–Frenkel emission types of conductions, but Michelon et al. suggested a non-linear ln(J)–E0.5 [16]. An annealing step is supposed to remove moisture and improve the film characteristics. Li et al. [17] suggested that the removal of physisorbed water by baking at 190 °C could only slightly improve dielectric reliability, and the significant improvement can be achieved after annealing at 400 °C due to the removal of chemisorbed moisture. However, recent results from Cheng et al. [18] point out that annealing at 400 °C is still not sufficient. The most likely cause of uncertainties is the formation of various adsorbed groups (ranging from physically adsorbed molecular water to isolated hydroxyl groups) during water adsorption. Their removal and modification are highly dependent on experimental conditions, which can introduce uncertainties when studying their effects on electrical characteristics and reliability.
All these studies indicate that a comprehensive investigation into the impact of porogen residue and accumulated moisture remains crucial. One challenge when analyzing previously reported results is that they were obtained from films cured under various systems and conditions. Additionally, the transition from a porogen residue-containing state to a hydrophilic one is gradual, so it is essential to study this process using a single film while systematically altering curing conditions. Additional challenges may arise from simultaneous structural changes, which can also affect the properties of OSG materials. A recent example of such research is the paper by Krishtab et al. [19], which used photoelectron spectroscopy and electron spin-resonance spectroscopy to identify that the degradation of electrical characteristics is linked to defect states ~5 eV below the conduction band, caused by surfactant residues in the form of oxidized sp3 carbon chains. Through careful tuning of the curing conditions, the study was able to determine optimal curing regimes. Furthermore, it is also important to simultaneously examine the evolution of the film’s structure, as this type of information is still lacking.
In this work, the effects of thermal modification on porous methyl-terminated organosilicate films were investigated across a wide range of annealing temperatures, from 350 to 900 °C. Using a single initial OSG material as a reference, changes in chemical composition—including the removal of porogen residues, degradation of terminal groups, and accumulation of adsorbed water—were carefully analyzed using FTIR spectroscopy. Simultaneously, structural modifications to the porous structure were examined using ellipsometric porosimetry (EP). The leakage current and dielectric constant of the organosilicate films were measured using current–voltage (JV) and capacitance–voltage (CV) measurements.
An extensive evaluation of both chemical composition and porous structure across the full range of annealing temperatures allowed us to correlate these findings with the films’ electrical characteristics. Leakage current data were analyzed using three theoretical models of charge transfer: Schottky emission (SE), Poole–Frenkel (PF) emission [20,21], and the Nasyrov–Gritsenko (NG) model of phonon-assisted tunneling between the traps [22]. Both dielectric constant and leakage current measurements facilitated correlations with the chemical composition and structure of the modified films.

2. Materials and Methods

2.1. Materials

In the present study, porous low-k organosilicate glass (OSG) dielectric films were deposited on silicon wafers using the sol–gel method combined with centrifugation [4,23]. Methyltriethoxysilane (MTEOS, >99.9%, Sigma-Aldrich) and tetraethoxysilane (TEOS, >99.9%, ECOS) were utilized as silicon precursors, while hydrochloric acid (HCl, 37%, Sigma-Aldrich) was used as a catalyst. TEOS was mixed with MTEOS in a molar ratio of 40/60. The structure-forming agent employed to create the porous structure of the films was 20 wt.% Brij® L4 (C12H25(OCH2CH2)4OH) surfactant from Sigma-Aldrich, which has a molar mass of 362 g/mol. Standard p-type boron-doped silicon wafers with a resistivity of 9–14 Ohm∙cm, a diameter of 100 mm, and an orientation of (100) were used as the substrate. After deposition, the films were dried (soft bake) on a hot plate at a temperature of Ta = 200 °C for 10 minutes, followed by annealing at various temperatures ranging from 350 to 900 °С for 30 minutes in air.

2.2. Analysis

Fourier-transform infrared spectroscopy (FTIR) was employed to analyze the chemical composition and structure of the synthesized films. The infrared absorption spectra were recorded using a Nicolet 6700 (Thermo) FTIR spectrometer in transmission mode, with a resolution of 4 cm–1 over the extended range of 7400–400 cm–1.
After annealing, the thickness and refractive index of the samples were measured using spectral ellipsometry (SE) with a SE850 (Sentech) ellipsometer. Measurements were conducted over a wavelength range of 300–800 nm at an incidence angle of 70°, employing the Cauchy model for a three-layer structure consisting of air, film, and silicon. Relative (full) porosity was calculated using the Lorentz–Lorenz equation:
V L L = 1 n p 2 1 n p 2 + 2 / n s 2 1 n s 2 + 2 ,
where np is refractive index of porous film, ns is refractive index of dense film.
The open porosity, which refers to the accessible volume for adsorbate molecules, and the pore size distribution were measured using ellipsometric porometry (EP) [24]. For these measurements, a custom-built setup featuring atmospheric pressure EP (RTU MIREA) was connected to an SE850 (Sentech) ellipsometer. The open porosity (Vopen) was determined using a modified Lorentz–Lorenz equation:
V o p e n = 100 % · n e f f 2 1 n e f f 2 + 2 n p 2 1 n p 2 + 2 n a d s 2 1 n a d s 2 + 2 ,
where n e f f is the refractive index of the porous film partially or completely filled with adsorbate molecules, n p is the refractive index of the film before adsorption (empty pores), n p is the refractive index of the liquid adsorbate (1.377 for isopropyl alcohol).
The current–voltage characteristics (JV) of thin dielectric films were measured like metal–dielectric–semiconductor (MDS) structures using a picoammeter equipped with a built-in programmable constant voltage source, the Agilent 4140B. JV measurements were conducted at several locations on the film surface of each sample. Prior to each measurement, the film was dried at 300 °С for 10 minutes to eliminate the influence of moisture. The voltage change exhibited a stepwise (staircase) pattern, meaning that the voltage periodically increased by a fixed value, ΔU, of the same polarity as the applied voltage, U, after a delay time, tdelay. JV characteristics are typically measured in silicon MDS structures in enrichment mode. In this study, films were deposited on p-type silicon substrates. To enable the enrichment mode, a negative voltage is applied to the top electrode.
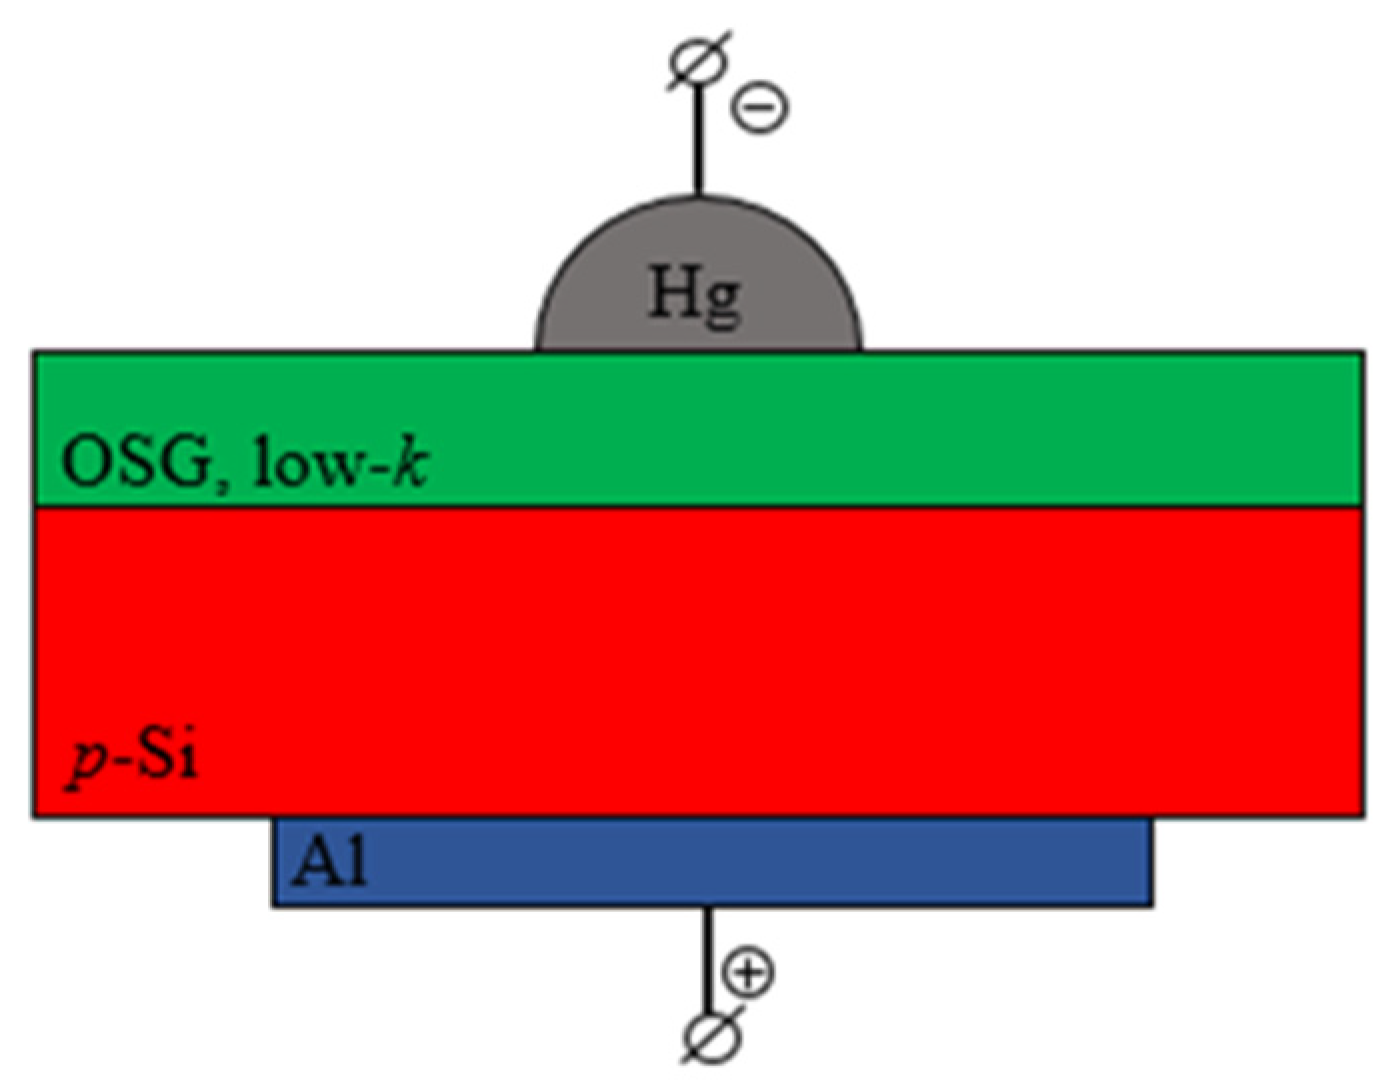
Instead of using metal point electrodes, a mercury probe was employed to form the MDS structures. Compared to sputter-formed metal electrodes, this technique prevents the penetration of metal impurities into the pores. Consequently, the top electrode is created using a mercury (Hg) drop that comes into contact with a low-k film (Figure 2). The contact area of the Hg probe was 0.515 mm2. Hg probes are frequently utilized to eliminate the need for time-consuming metallization and to protect the films under investigation from potential damage caused by sputtering or metal vaporization. As a result, the currents or current densities along the measured JVs may fluctuate depending on environmental conditions. This variability can lead to low measurement accuracy due to poor reproducibility of results. However, the use of measured structures facilitates rapid characterization and safeguards low-k films from process-induced modifications.
To ensure high performance and reliability of microcircuits that utilize copper (Cu) and low-frequency dielectrics, it is essential to thoroughly understand the nature of leakage current in these dielectric films. This understanding necessitates an examination of the charge transfer mechanisms and the identification of defects that induce leakage. Recognizing these defects is crucial for meeting the demands of modern electronic devices and for optimizing the synthesis of low-frequency dielectrics. Therefore, the charge transfer mechanisms and the characteristics of traps in low-frequency films warrant careful investigation.

3. Results and Discussions

3.1. Chemical Composition

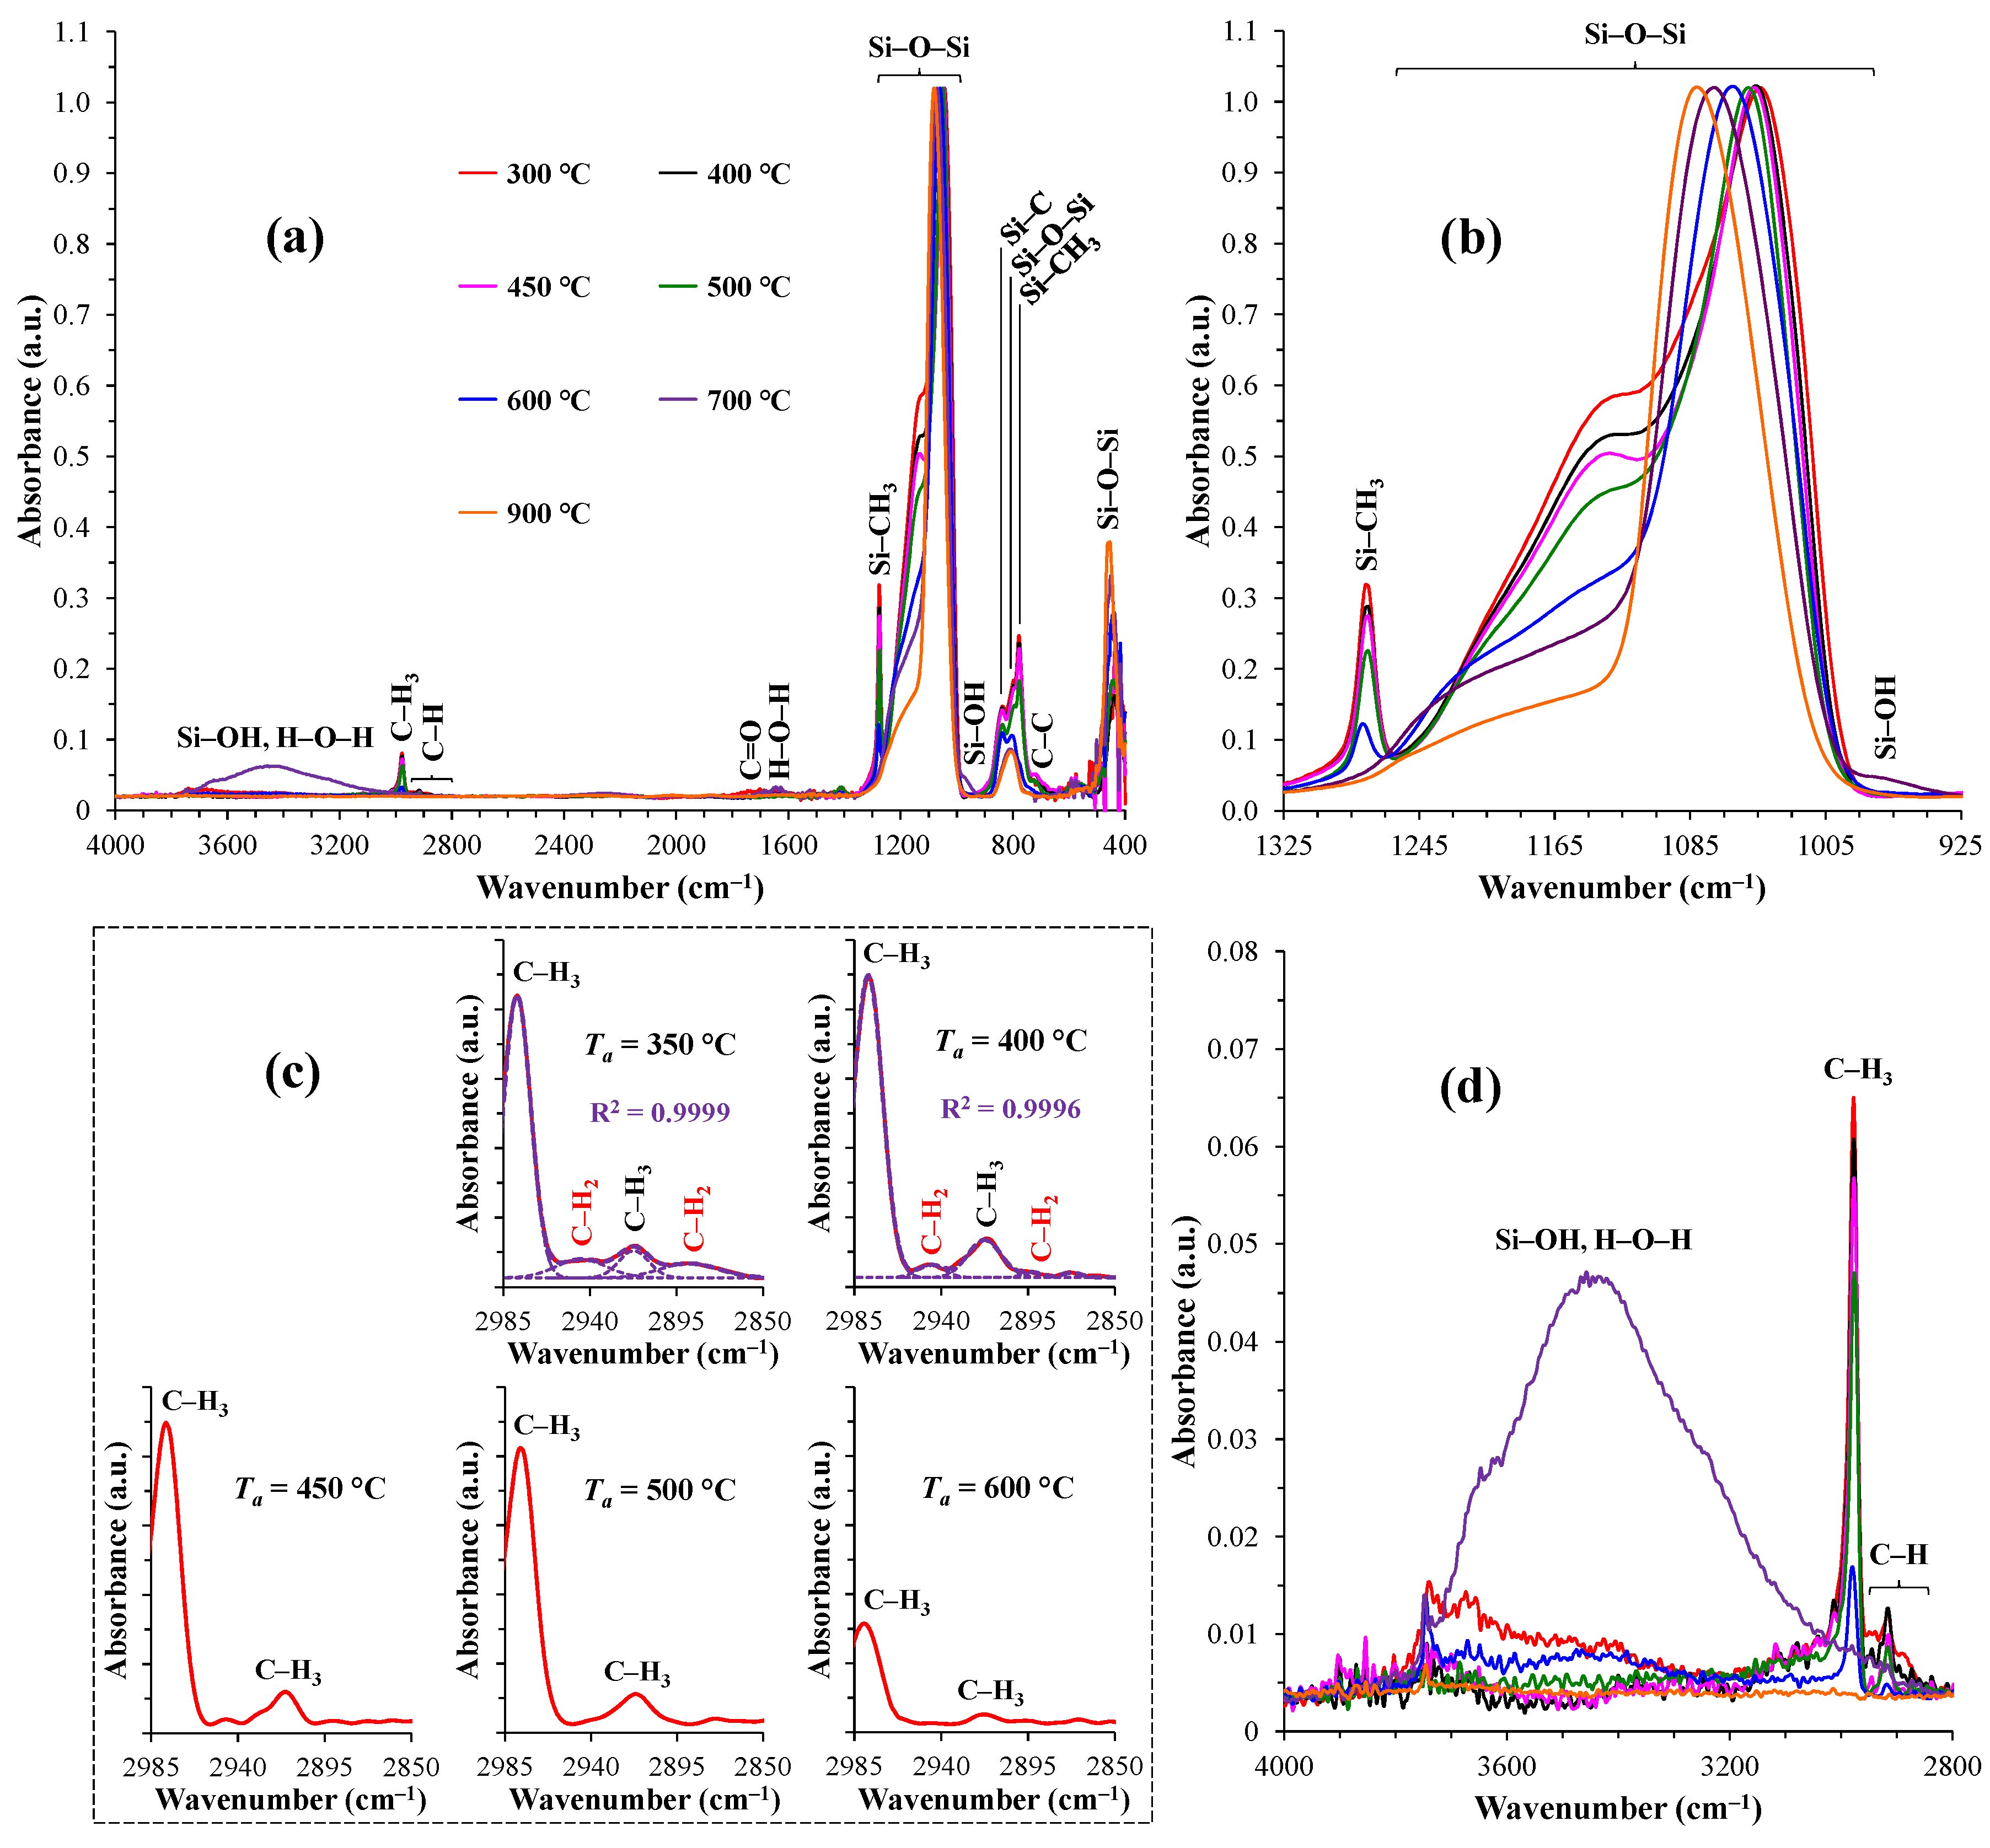
FTIR spectra of the samples annealed at temperatures ranging from 350–900 °С are presented in Figure 3. Most of the absorbance peaks have been assigned based on Refnces [9,23]. In all IR spectra of the studied films, the strongest band is observed in the range of 1300–1000 cm–1, corresponding to the asymmetric stretching vibration of Si–O–Si bond. For annealing temperatures below 500 °C, this peak is located at wavenumbers below 1050 cm–1, indicating the presence of Si suboxide with a Si–O–Si bond angle smaller than 144° At the annealing temperature exceeds 450 °C, the peak shifts to higher wavenumbers, gradually approaching those corresponding to SiO2 networks after anneal at 900 °C with a Si–O–Si angle close to 144° (Figure 3b). This red shift is clearly correlated with a reduction in the concentration of SiCH3 groups, as indicated by peak at 1275 cm–1, corresponding to the bending vibration of C–H3 bonds) [9].
Figure 3c shows evolution of CHx peaks located in the range 3000–2800 cm–1. The samples annealed at 350 °C shows the presence of 4 peaks located at 2980, 2950, 2910, and 2880 cm–1. Annealing at higher temperature leads to the reduction of intensity of the peaks located at 2950 and 2880 cm–1 and they are not observed anymore when Ta > 450 °C. The peaks located at 2980 and 2910 cm–1 show obvious reduction at Ta > 500 °C simultaneously with the SiCH3 peak located at 1275 cm–1. Therefore, the last 2 peaks can be assigned to Si–CH3 bonds, while the peaks located at 2950 and 2880 cm–1 are related to presence of carbon residues that are removed starting from Ta ≈ 450 °C [9,10].
Silanol groups and adsorbed water are indicated by a broad multicomponent absorption in the range of 3800–3200 cm–1 (Figure 3d). The amount of adsorbed water remains significant in films annealed at 350 °C but decreases sharply after annealing at 400–500 °C. However, it starts to increase again at temperatures above 600 °C, which is clearly linked to the reduction in the concentration of SiCH3 groups. The highest amount of adsorbed water is observed in the sample annealed at 700 °C when concentration of SiCH3 groups is becoming less than ~20% on initial value. The results of more precise quantitative analysis are presented in Table 1, and they clearly demonstrate a discernible increase in Si–OH, H–O–H concentration with rising annealing temperatures within the range of Ta = 450–700 °С. At 600 °С, the minimum detectable amount of Si–CH3, observed at around ~1275 сm–1, coincides with a more pronounced Si–OH, H–O–H bands.
The Inetwork/Icage ratios and the relative areas of characteristic peaks/bands are presented in Table 1. Notably, there is an increase in the Inetwork/Icage ratio with rising annealing temperatures, which is related to removal of CH3 terminal group and following increase of the degree of matrix cross-linkage which enhances mechanical properties of the films.

3.2. Spectroscopic Ellipsometry (SE) and Ellipsometric Porometry (EP) Data
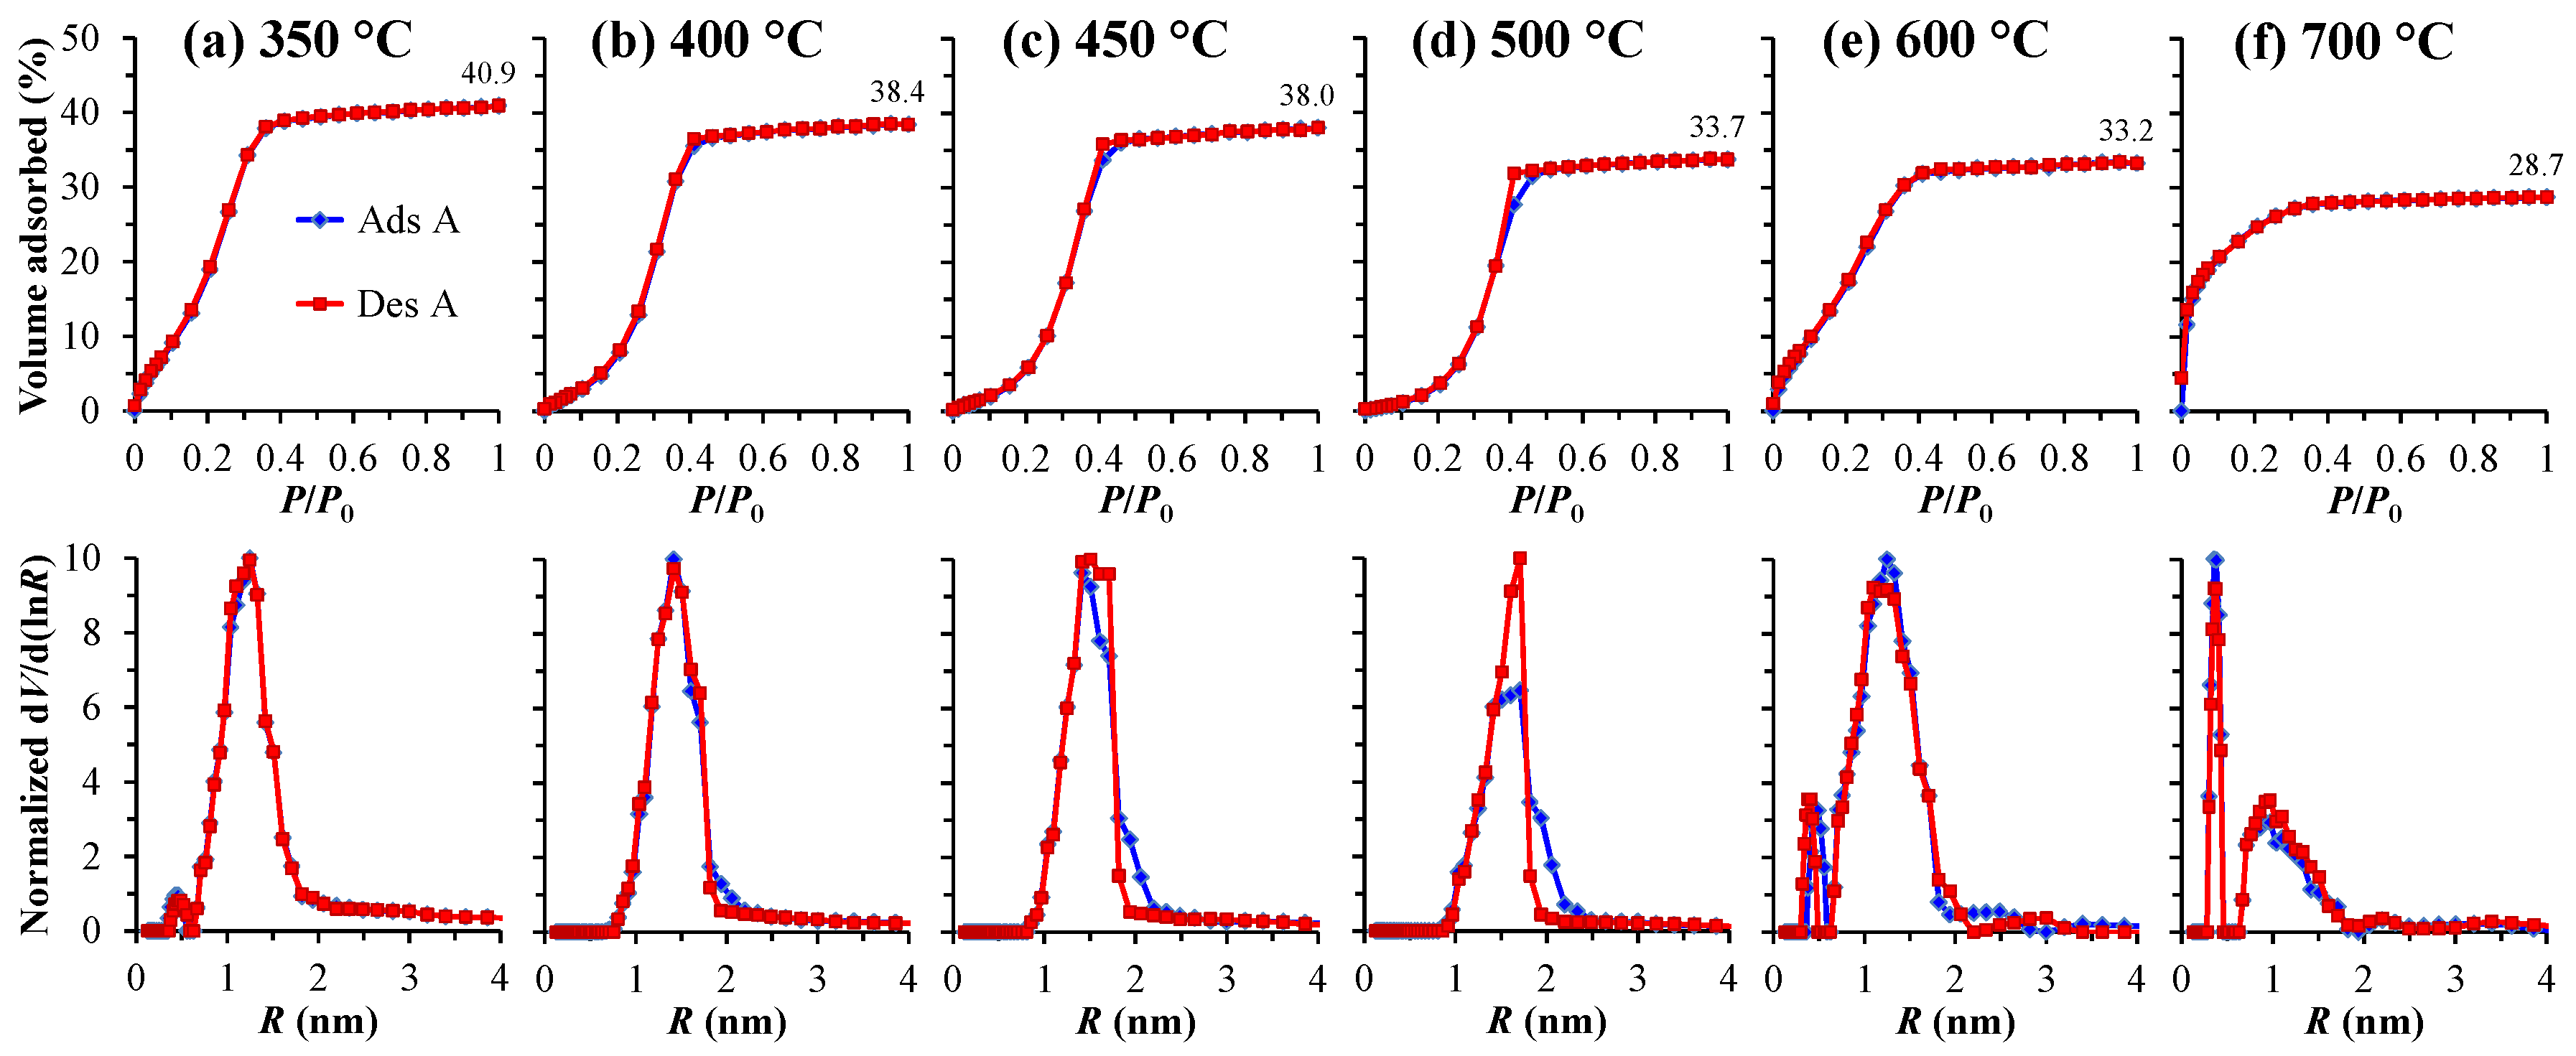
Table 2 presents the properties of the studied OSG low-k films, as measured by SE and EP. The film thickness decreases from 324 nm to 170 nm after annealing, due to the shrinkage, while the refractive index increases simultaneously. The highest refractive index, n = 1.392, corresponds to the film annealed at 900 °C.
Figures 4 illustrate the adsorption/desorption isotherms and pore radius distribution in the films. Within the temperature range of 350–500 °С, the median pore size increases from 1.15 to 1.51 nm. The isotherm obtained in the films annealed at 350 °C shows the presence of micropores (slope at P/P0 < 0.05) with a small relative volume of about 5–10%. Then, the micropores volume decreases after annealing at 400 °C and becomes undetectable after 500 °C. Therefore, the increase of median size of pores and the small reduction of measured porosity are related to the collapse of micropores and the short-ranged structural rearrangement of the OSG matrix [25]. Further annealing at Ta = 600 °C shows an opposite effect of reduction of the median pore size to 1.09 nm and appearance of the micropores. This effect can be correlated with reduction of CH3 groups’ concentration and collapse of some part of large pores. At 600 and 700 °С, the bimodal nature of the pore distribution is clearly evident, with appearance of the left peak corresponding to the presence of micropores. The micropores are becoming dominant in the films annealed at 700 °C.
Figure 4. Adsorption/desorption isotherms (top) and pore radius distribution (bottom) for the organosilicate films studied, which were heat-treated at different temperatures: 350 °С (a), 400 °С (b), 450 °С (c), 500 °С (d), 600 °С (e), and 700 °С (f).
Preprints 119333 g004
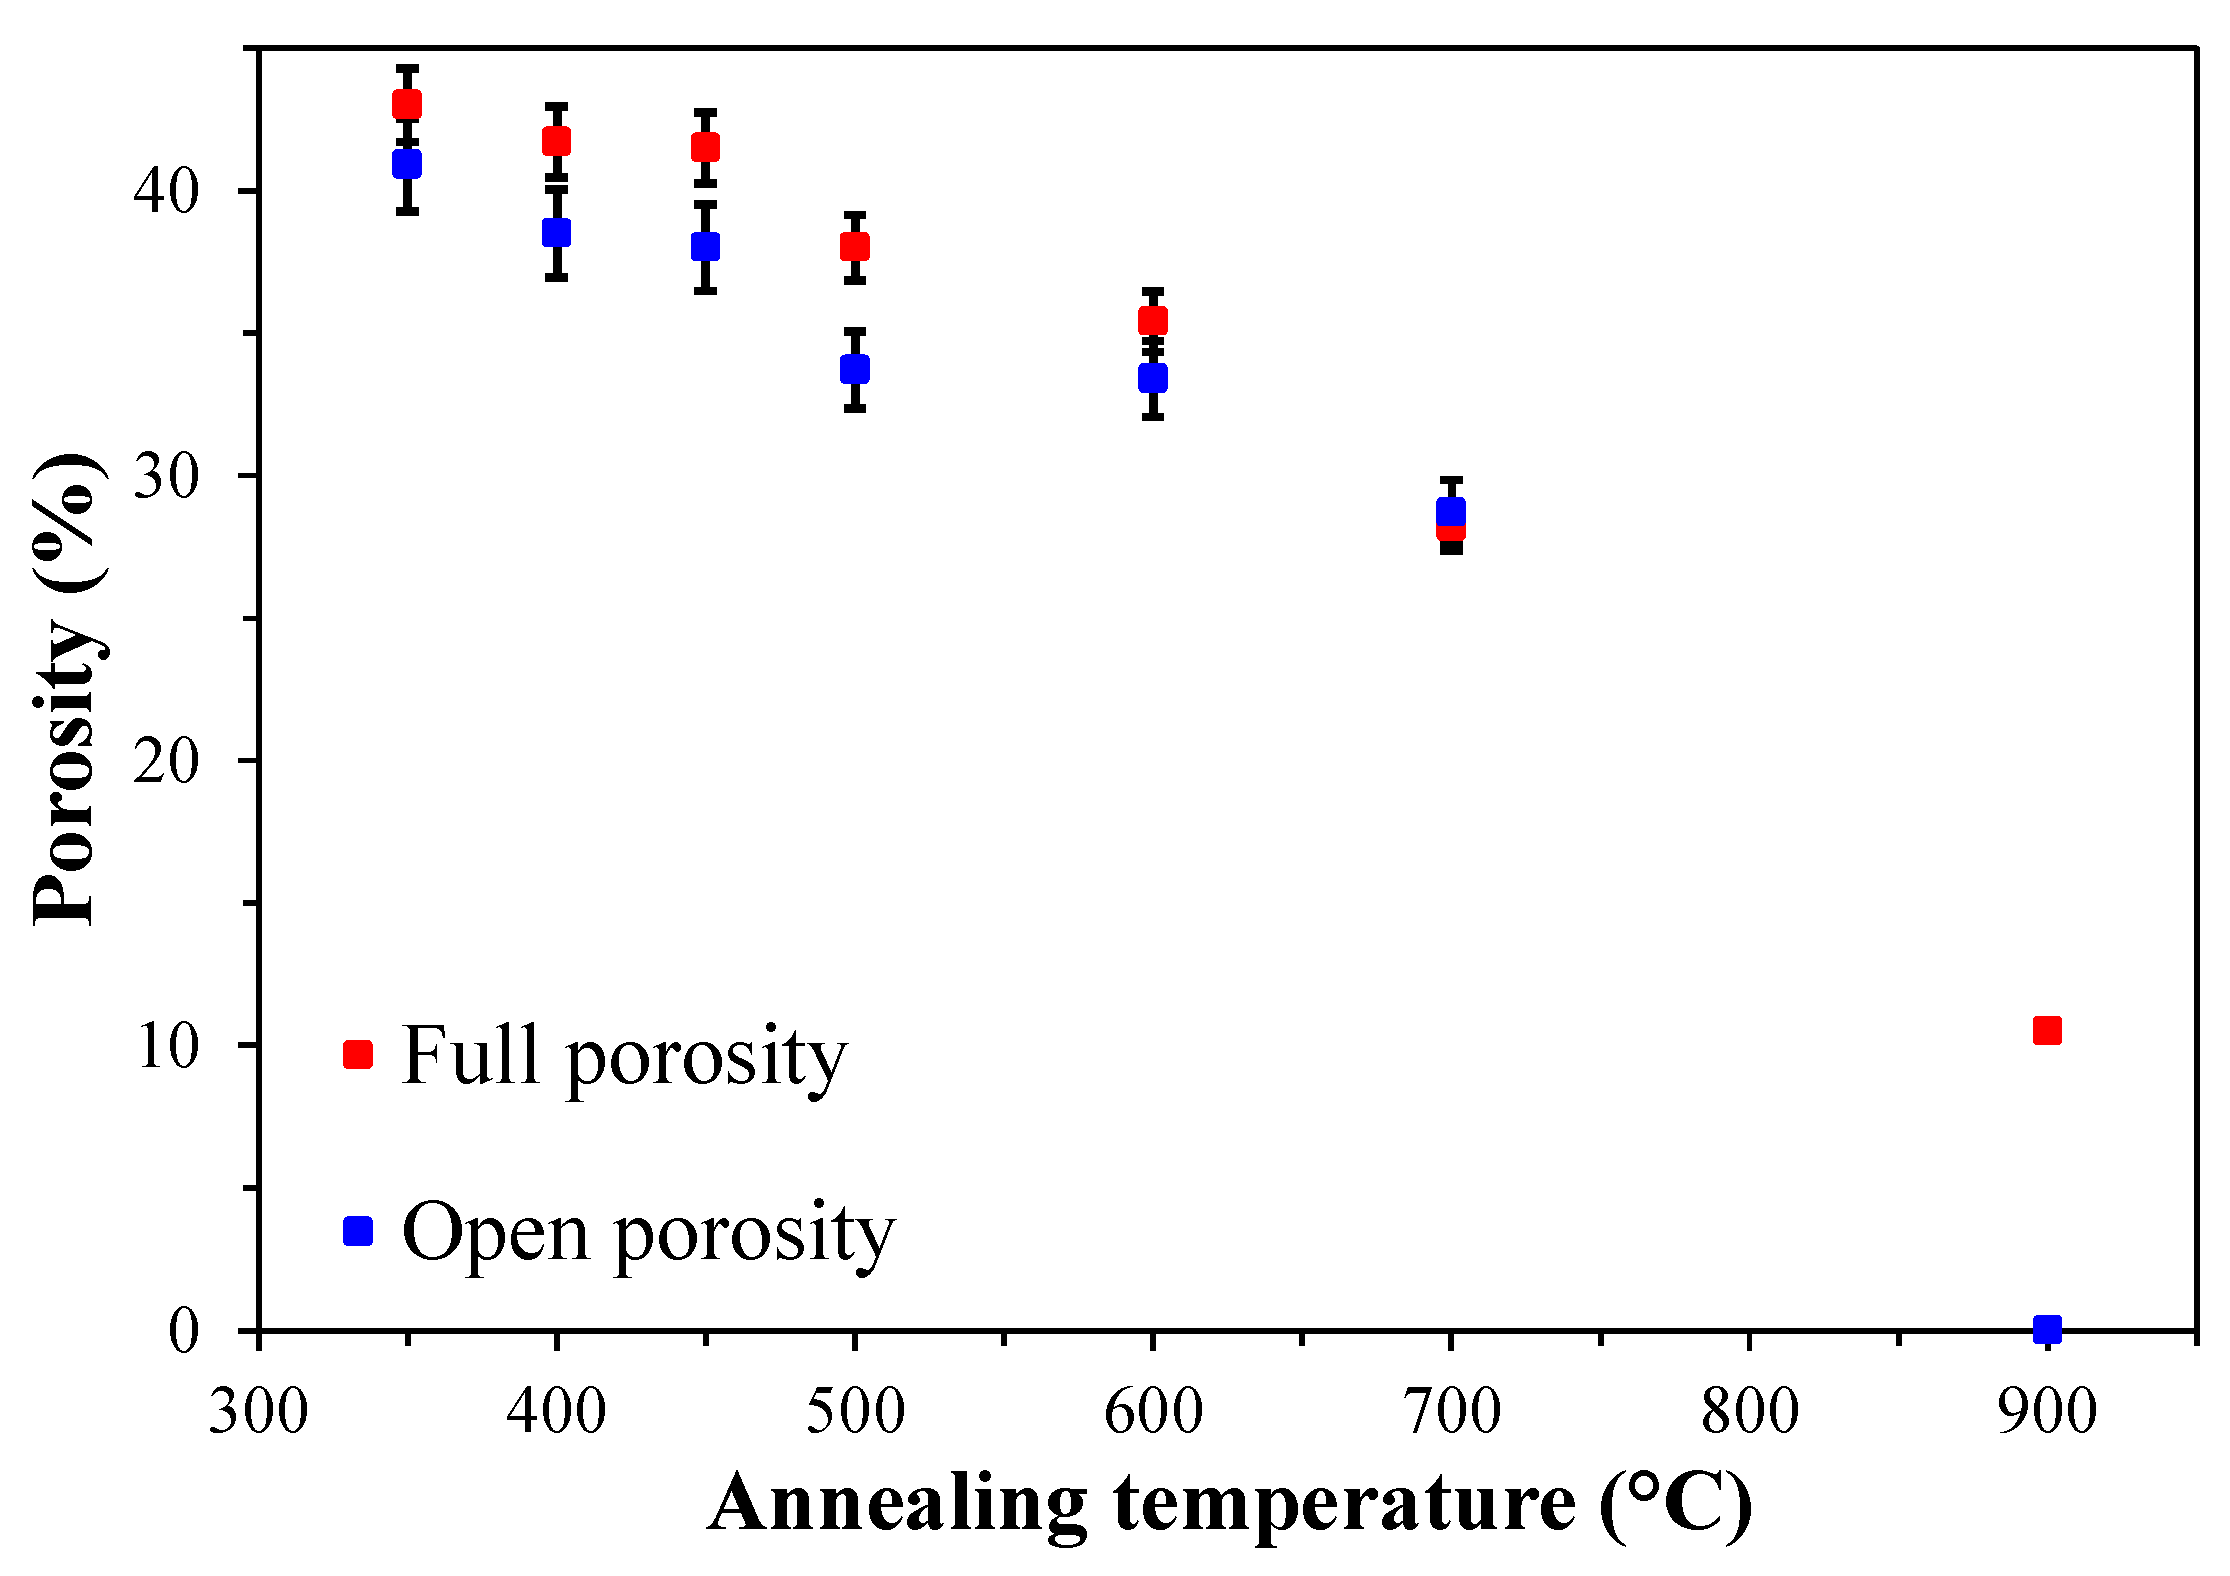
The films annealed at 900 °C no longer show the presence of open pores, suggesting a complete collapse of all pores because of sintering silica matrix [26]. According to FTIR data, this film no longer contains CH3 groups, and the position of the Si–O–Si peak corresponds to pure SiO2. However, the refractive index of the film is 1.392, which is lower than the typical value measured in SiO2 films (1.46). This indicates a difference between full and open porosity and suggests that some micropores (free volume) still remain in the films (Figure 5). The fact that they are not detectable by EP suggests that their size is smaller than the probe used in our EP measurements (the kinetic diameter of IPA molecules is 0.47 nm [27].

3.3. Electrical Properties

The leakage current in porous organosilicate glass (OSG) low-k dielectrics normally presents a greater level of complexity in comparison to dense dielectrics. This complexity primarily arises from their porous structure. The electrical conductivity of these materials is significantly influenced by their porosity, as various conductive impurities might accumulate on the surfaces of the pore walls, thereby impacting the observed electrical phenomena. Consequently, meticulous fabrication of these films, aimed at preventing or controlling the accumulation of impurities on the pore walls, is essential for conducting an accurate analysis of the leakage current mechanisms within the low-k matrix.
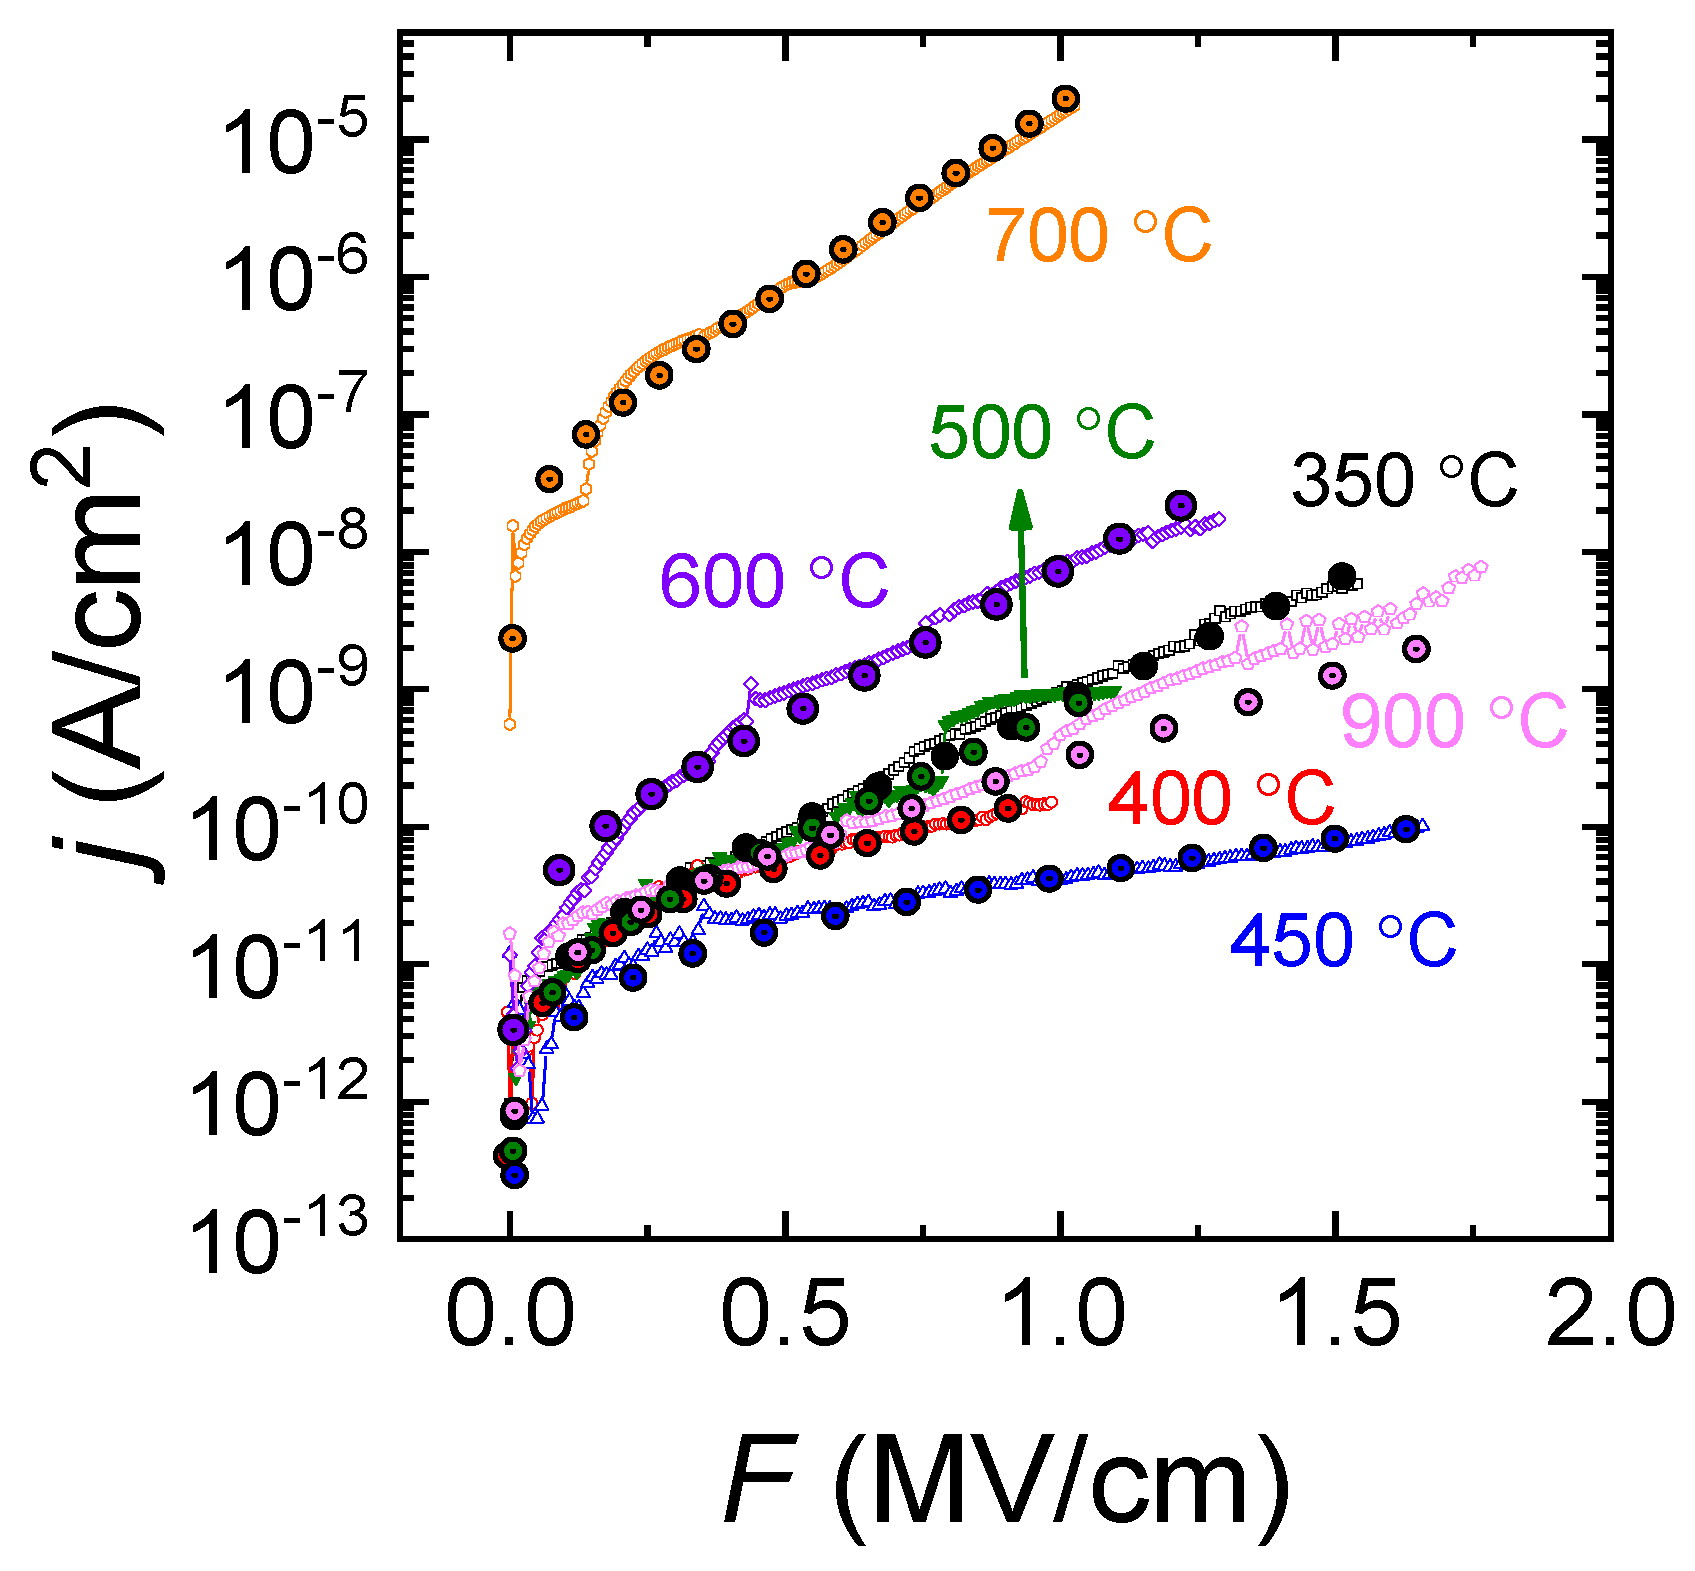
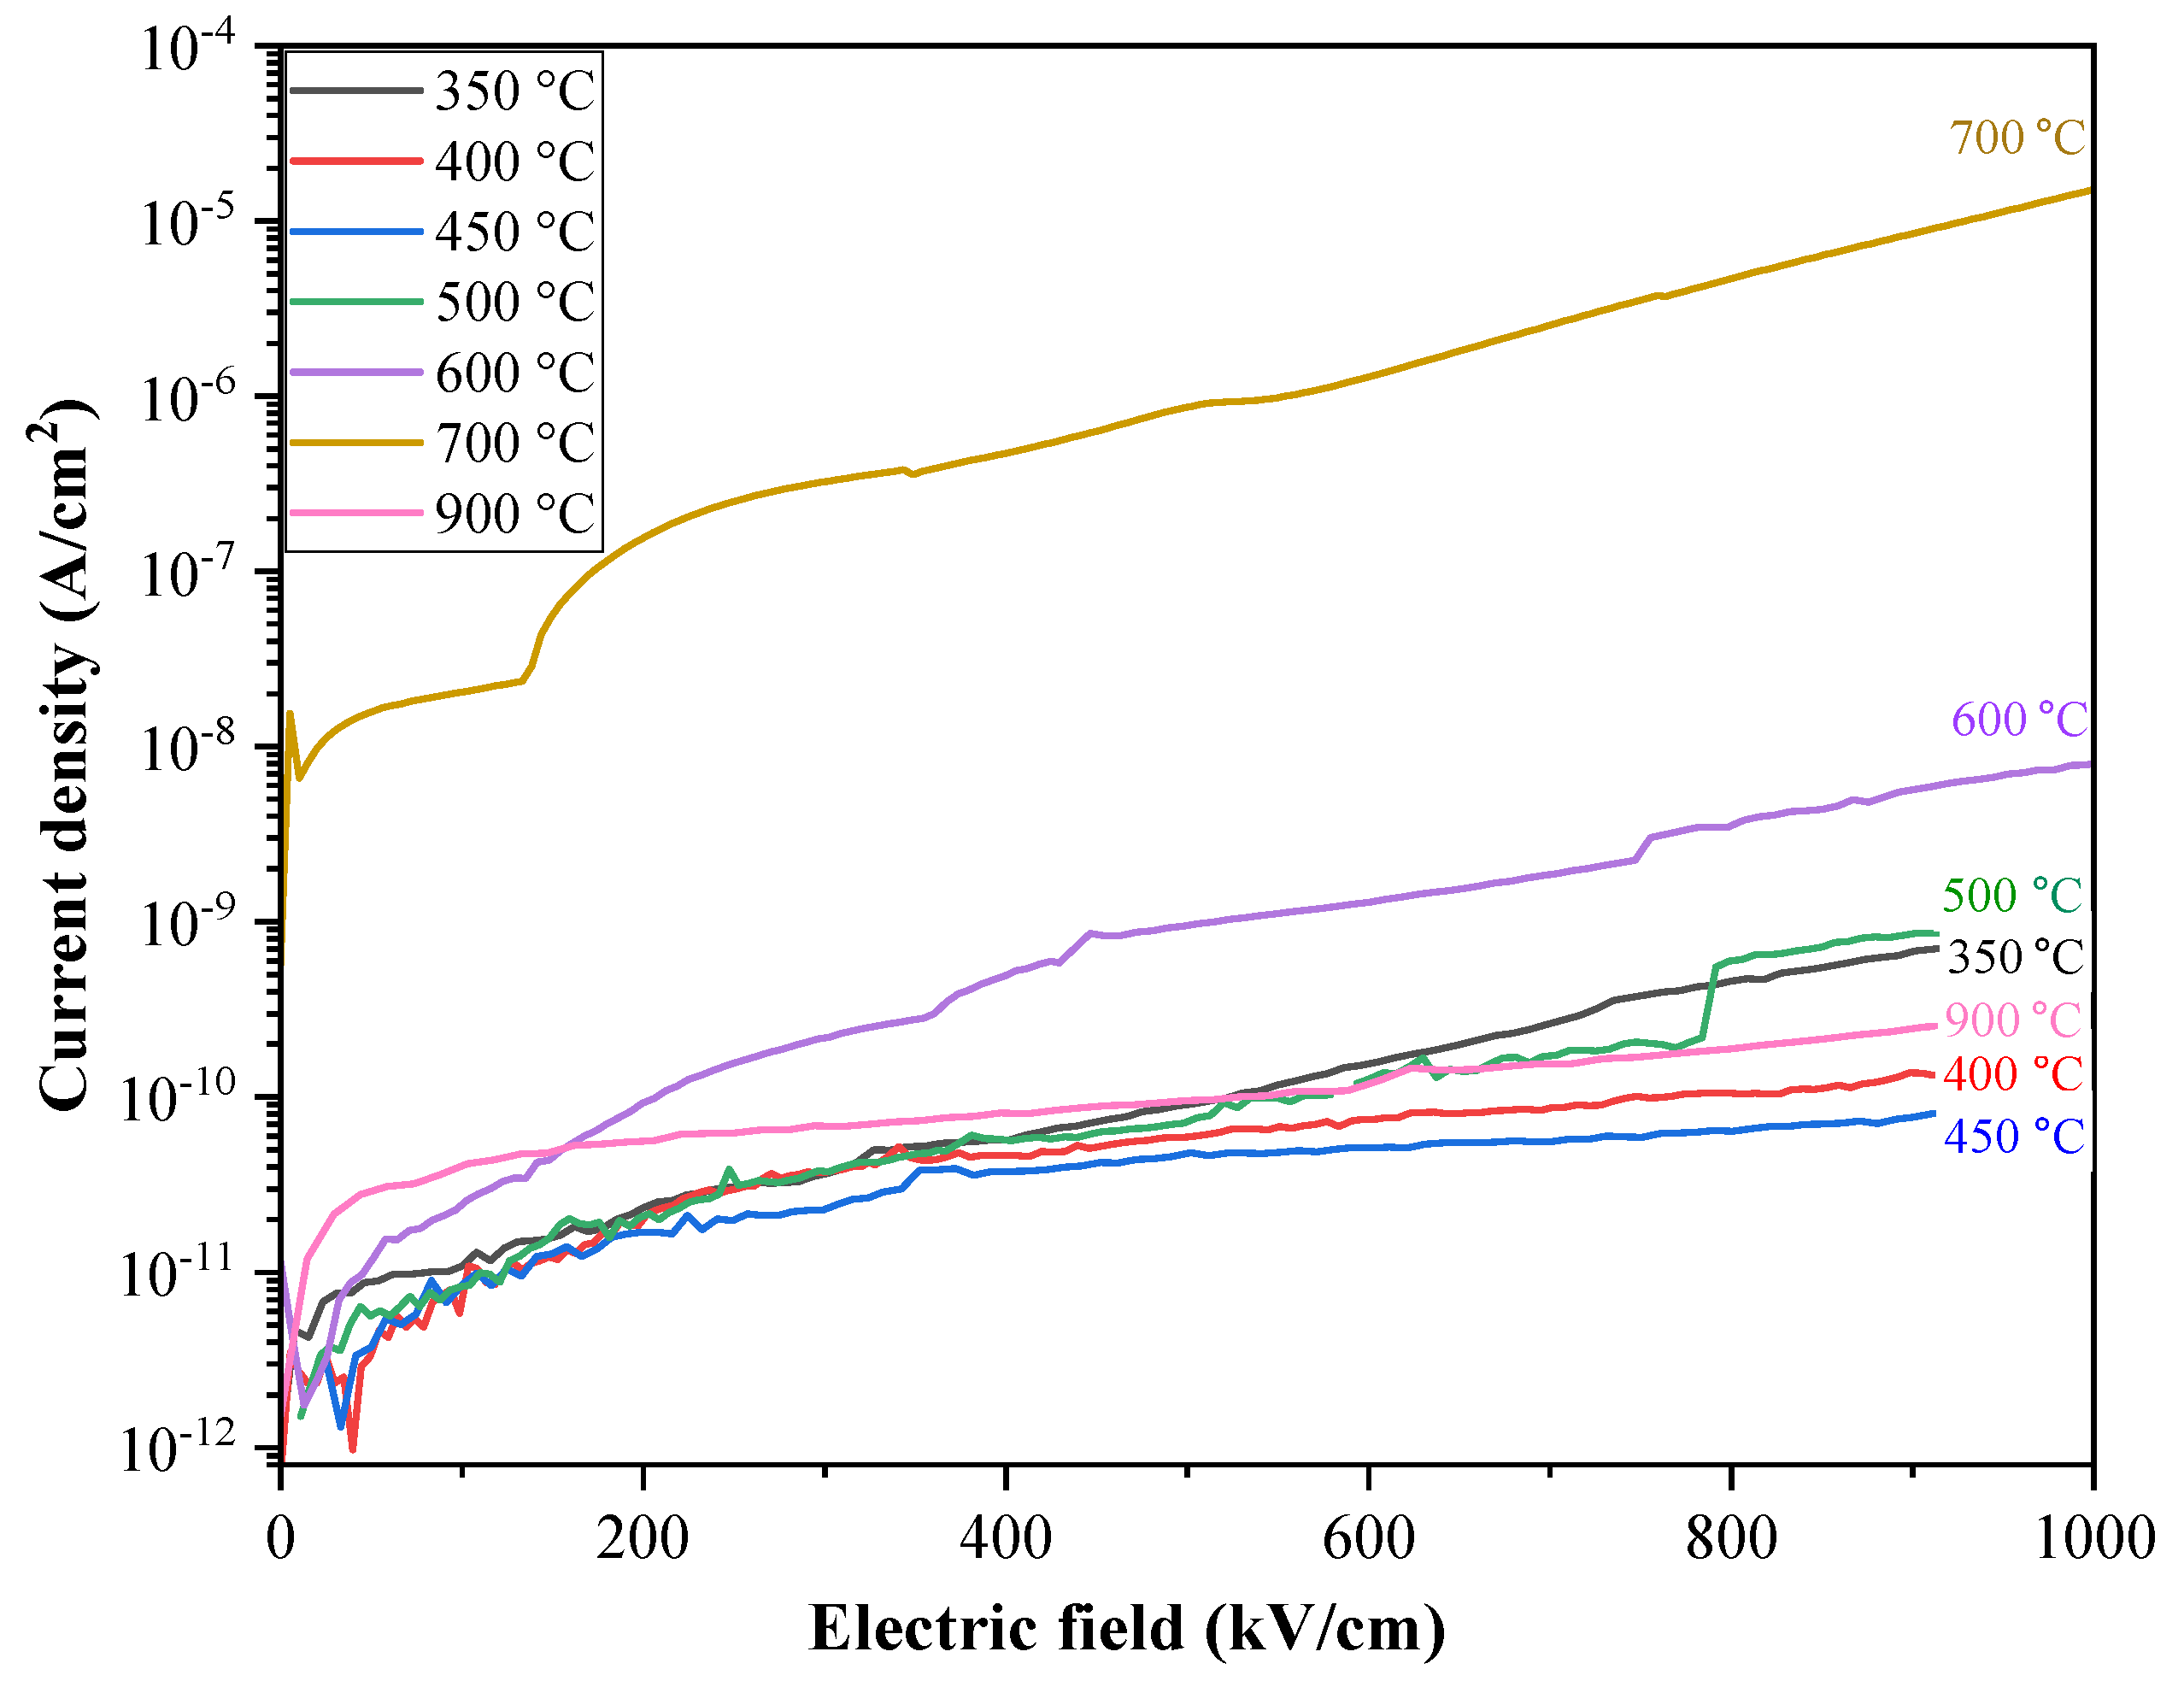
Figure 6 shows the typical dependences of current density on electric field of the methyl-modified silicate films under investigation. The JV plots presented in Figure 6 do not account for the polarity of the applied electric field strength, which is represented along the abscissa.
The leakage current in these films exhibits a remarkable increase in the region of the lowest applied electric field (<100 kV/cm). As illustrated in Figure 6, the annealing temperatures ranging from 350 to 500 °C result in relatively minor variations in the leakage currents of organosilicate films within the electric field strength range of 0–400 kV/cm. However, when transitioning to higher electric field strengths (400–1000 kV/cm), after a noticeable increase in leakage current, a clear difference between the films annealed at different temperatures becomes evident. The leakage current decreases with temperature in the range between 350 and 450 °C. A very strong increase of leakage current is observed when the temperature increases up to 700 °C, then slightly decreases again at 900 °C. (Figure 6). Further annealing up to 700 °C increases the leakage current, which is reduced at 900 °C.
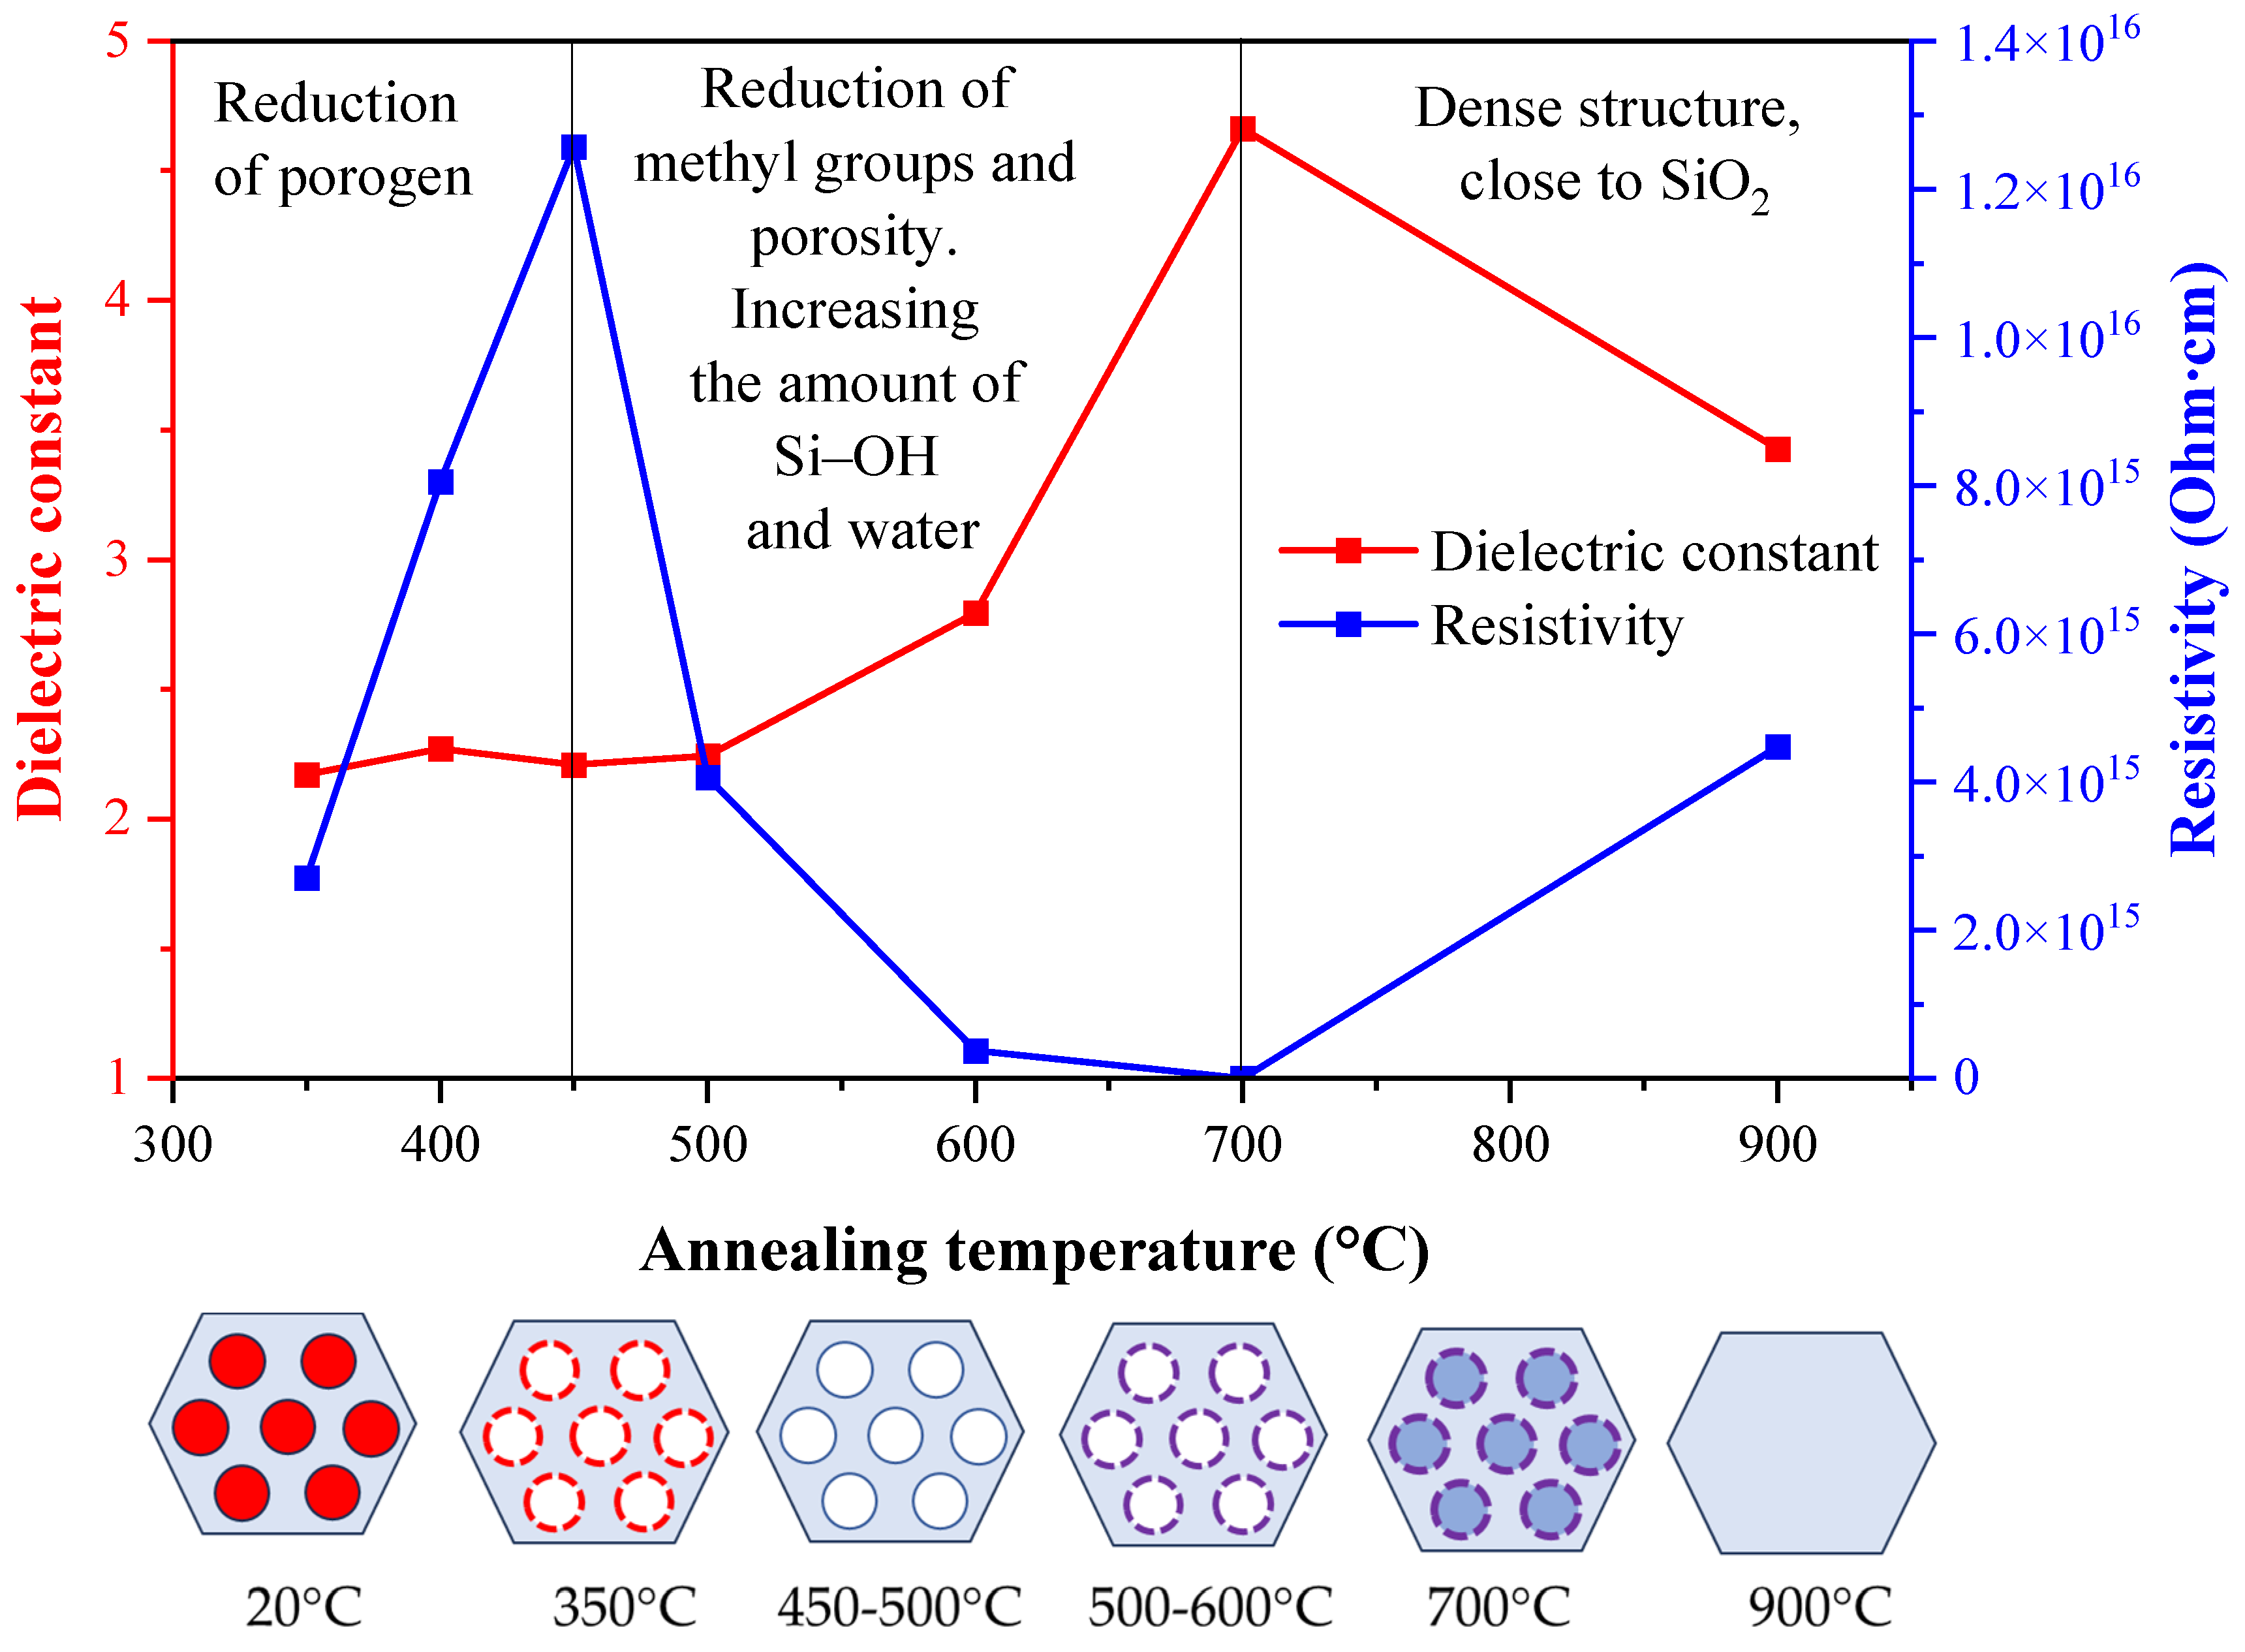
The difference in electrical characteristics is more clearly presented in Figure 7, which shows the measured change of dielectric constant (k value) and resistivity of the films at the electric field strength of 700 kV/cm. The resistivity of the low-k thin films was determined using the data obtained from CV characteristic measurements.
The k-values were estimated by measuring the CV dependencies at a frequency of 100 kHz. The measurements were performed using an MDC CSM/Win Semiconductor Measurement System (Materials Development Corporation), which was equipped with a 4284A LCR meter (Agilent).
In this figure, the behavior of the electrical characteristics is clearly divided into three regions. The first region (350–450 °C) is marked by the removal of carbon-containing residues formed during the surfactant’s decomposition. The formation of such residue that formed as a result of porogen destruction has been extensively studied in the past. It was first detected using UV ellipsometry, and it was concluded that the residue is sp² carbon, formed during the thermal degradation of the (–CH₂–) chain in the porogen or surfactant [28]. The amount of this residue depends on the amount of used sacrificial porogen, and its impact on low-k leakage current was first reported in refs. [29,30]. The connection between the carbon dangling bonds and trap-assisted leakage current was demonstrated through tunneling current measurements in both dense and porous PECVD low-k materials [12]. The increase in annealing temperature from 350 °C to 450 °C effectively removes this residue, resulting in a notable decrease in leakage current, which aligns with this trend. This conclusion was further supported by the findings of Pomorski et al., [11], who demonstrated the general link between C-dangling bond defects and low-field leakage current in various types of organosilica low-k dielectrics. A distinct characteristic of these residues is their relatively low dielectric constant, similar to other saturated hydrocarbons, though they may exhibit conductivity similar to amorphous carbon. This explains the observation in Figure 8, where the k value remains relatively unchanged in this region despite the significant reduction in leakage current. The collapse of micropores, visible in films annealed at 350 °C and disappearing after further annealing up to 500 °C, does not appear to have a significant impact on the electrical characteristics in this temperature range.
The second region, between 450 °C and 700 °C, is characterized by the near-complete removal of CH₃ groups from the low-k matrix, leading to increased hydrophilicity (Figure 3). The effect of adsorbed water is typically complex and contradictory. This complexity arises because water adsorbed on SiO₂-type materials can exist in several different forms, depending on the strength of chemical bonds and the degree of dissociation [31]. These various types of adsorbed water have a complex influence on the reliability of integrated organosilicate glass (OSG) materials [13]. If physically adsorbed water (α-water) is mainly removed at Ta ≤ 190 °C, removal of chemisorbed water (β-water) and especially water formed from isolated hydroxyl groups (γ1 and γ2) requires a higher temperature (>400 °C) [12,13,14]. However, in our specific case, the effect is more straightforward and clear. As shown in Figure 8, there is a significant increase in the dielectric constant and a reduction in electrical resistance, which is expected due to the high dielectric constant of water molecules and their contribution to increased conductivity.
The sample annealed at 900 °C is nearly dense, with no open pores, making it difficult for moisture to be adsorbed after complete outgassing at this temperature. This conclusion is supported by FTIR data, which shows significantly less adsorbed water compared to the sample annealed at 700 °C (Figure 4d). This is why the sample annealed at 900 °C exhibits lower leakage current than the one annealed at 700 °C. However, its dielectric constant is higher due to the denser structure. The fact that this sample still has a refractive index lower than that of dense SiO₂ (1.39 versus 1.46) suggests that while some pores did not fully collapse, some internal pores remain but are sealed after thermal treatment.

3.4. Discussion of the Leakage Mechanism

The physical mechanism of electrical conduction in OSG low-k dielectrics has been the focus of extensive research and discussion for many years. The most extensively studied models are based on field-enhanced thermal excitation of electrons entering the conduction band from the low-k interface and the trap states (SE and PF emission). Tunneling of electrons from the metal Fermi energy or trapping sites into the low-k dielectric conduction band is termed the Fowler–Nordheim (FN) mechanism. It has been concluded [21] that PF emission is more likely the dominant conduction mechanism in low-k dielectrics especially at low fields [16,32,33]. FN tunneling conduction can occur at high field ranges [34,35]. The effectiveness of these conduction mechanisms often depends on the presence of porogen (surfactant) residues. These residues are primarily formed due to suboptimal UV-assisted thermal curing and moisture trapped in internal defects caused by the integration process, such as plasma damage, which tends to remove carbon-containing groups.
An alternative mechanism based on phonon-assisted tunneling was proposed by Gritsenko and his colleagues for several low-k dielectrics, primarily those based on carbon-bridged PMO (see ref. [5] and the references cited therein). From a materials science perspective, the Gritsenko models primarily rely on the concept of the formation and active role of oxygen-deficient centers (ODC). The ODC’s are diamagnetic and therefore invisible to electron paramagnetic resonance (EPR) techniques, making the reliable identification of these defects quite difficult. The role of oxygen-deficient centers (ODCs) in influencing the electrical properties of silica-based materials has been widely studied using UV-induced luminescence [36,37,38,39]. However, similar luminescence studies of OSG low-k dielectrics remain limited [40,41], and the conclusions are somewhat controversial [7]. Pustovarov et al. [40] reported the presence of oxygen-deficient centers (ODC) in ethylene-bridged PMO films. However, they used an excitation wavelength of 10.6 eV, which significantly exceeds the energy required to break Si–CH3 bonds. As a result, ODC precursors (Si dangling bonds, E’ centers [8]) can be generated during the measurements. In contrast, Rasadujjaman et al. [41] investigated the luminescence of several OSG films with varying compositions, using an excitation wavelength near 200 nm. They concluded that ODC centers do not form in OSG low-k films within the temperature range used for interconnect technology (<500 °C).
Typically, phonon-assisted tunneling and Poole–Frenkel emission are two competing mechanisms that enhance carrier emission, with their relative contributions determined by the type and charge state of the defect. In the case of OSG low-k dielectrics, the presence and active role of carbon residue and adsorbed water have been more extensively studied, and their correlation with electrical properties is well documented. A more difficult situation is with oxygen deficient centers although conclusions about their formation in OSG films were reported by Pomorski et al. [11] and in the ref. [40]. Although the luminescence is the most efficient technique some signs can also be obtained by different techniques. In stoichiometrically clean and dense dielectrics, FTIR and XPS data can be used to show the formation of oxygen-deficient suboxide-like structures. However, OSG films initially exhibit similar shifts due to the replacement of some oxygen atoms with methyl terminal groups. Another reported doubt about the possibility of formation of oxygen-deficient centers is that the low thermal budget of these films does not allow for the formation of oxygen-deficient centers. The annealing temperatures are much lower than those typically required for matrix relaxation (≥1000 °C), which is essential for ODC formation [8].

3.4.1. Verification of NG Model

The current density through the dielectric materials containing electronic traps is described by Equation (3):
j = e N 2 3 P ,
where N = a–3 is the traps concentration, a is a mean distance between the traps. P is probability of the traps ionization. In NG model of phonon assisted tunneling
P = 2 π ħ W T m * a 2 2 k T ( W o p t W T ) e x p W o p t W T k T exp 2 a 2 m * W T ħ sinh e F a 2 k T ,
where ħ is Planck constant, WT is thermal energy of ionization, m* is effective mass, k is Boltzmann constant, Wopt is optical energy of ionization, F is electric field.
Figure 8 shows JV curves obtained with studied samples (experimental data are replotted from the data presented in Figure 6).
Figure 8. Current–voltage curves for low-k films annealed at different temperatures. The large dots represent the results obtained from simulations using the Nasyrov–Gritsenko (NG) model.
Preprints 119333 g008
JV characteristics are satisfactorily described by the model of phonon-assisted tunneling between the traps (NG model). The simulation was based on the assumption of two different trap models: the trap based on the oxygen vacancy center with thermal energy WT = 1.6 eV (≡Si–Si≡) and the trap based on oxygen divacancy with WT = 1.2 eV (≡Si–Si–Si≡). The agreement between modeling and experimental data was achieved in assumption that the traps are oxygen vacancies with optical energy of ionization 3.2 eV and oxygen di-vacancies with optical energy 2.4 eV (Table 3).
The results presented in Table 3 indicate that, according to the ODC-based model, single oxygen vacancies can be considered traps at temperatures of 350, 400, 450, 500, and 900 °C, while divacancies are present at 600 and 700 °C. These conclusions seem unusual, as the formation of oxygen vacancies at these temperatures is generally considered improbable. If, for some unknown reason, oxygen vacancies and even divacancies are forming at 600 and 700 °C, their formation at 900 °C should be even more favorable. Additionally, the calculated trap concentrations are unusual. According to the traditional view, the presence of a suboxide-like band in FTIR spectra suggests the formation of ODCs, but the data presented in Figure 3 show an opposite trend: increasing temperature gradually shifts the Si–O–Si band to its matrix position. Therefore, if ODCs were formed as defects originating from precursors, their concentration should decrease with increasing annealing temperature. Consequently, we can conclude that the model based on phonon-assisted tunneling between ODC centers does not apply in this case.

3.4.2. Verification of SE and PF Models

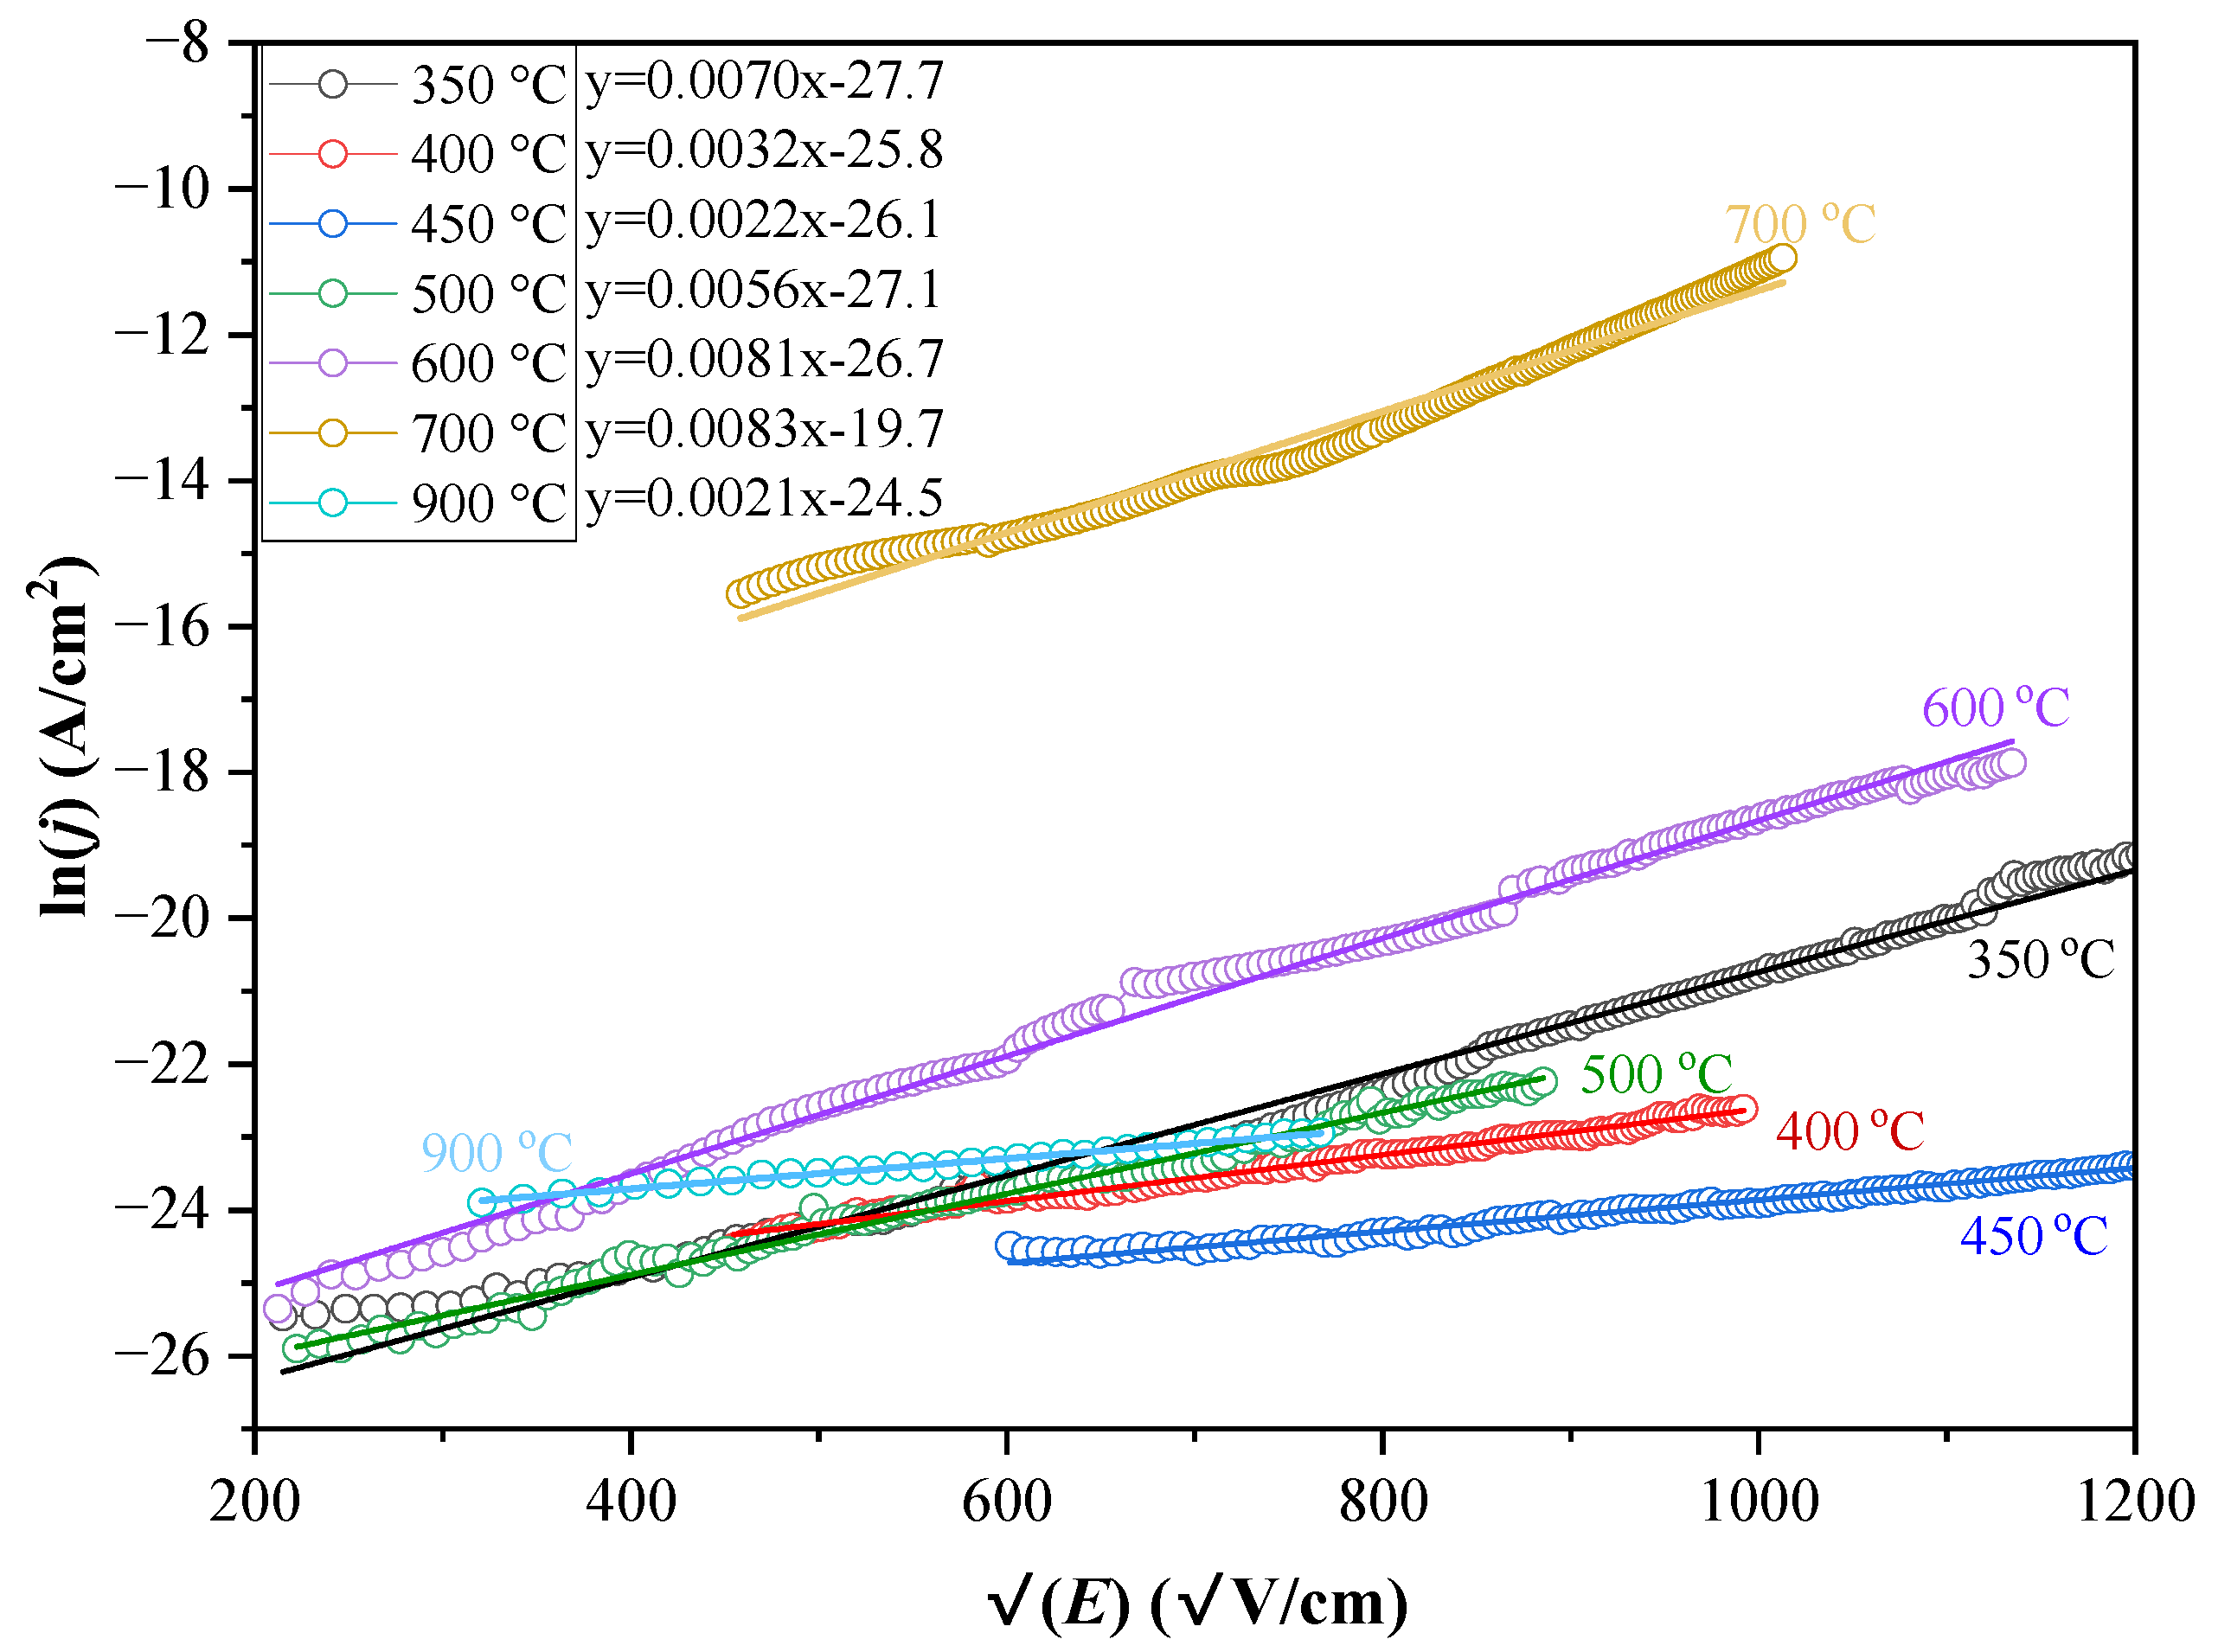
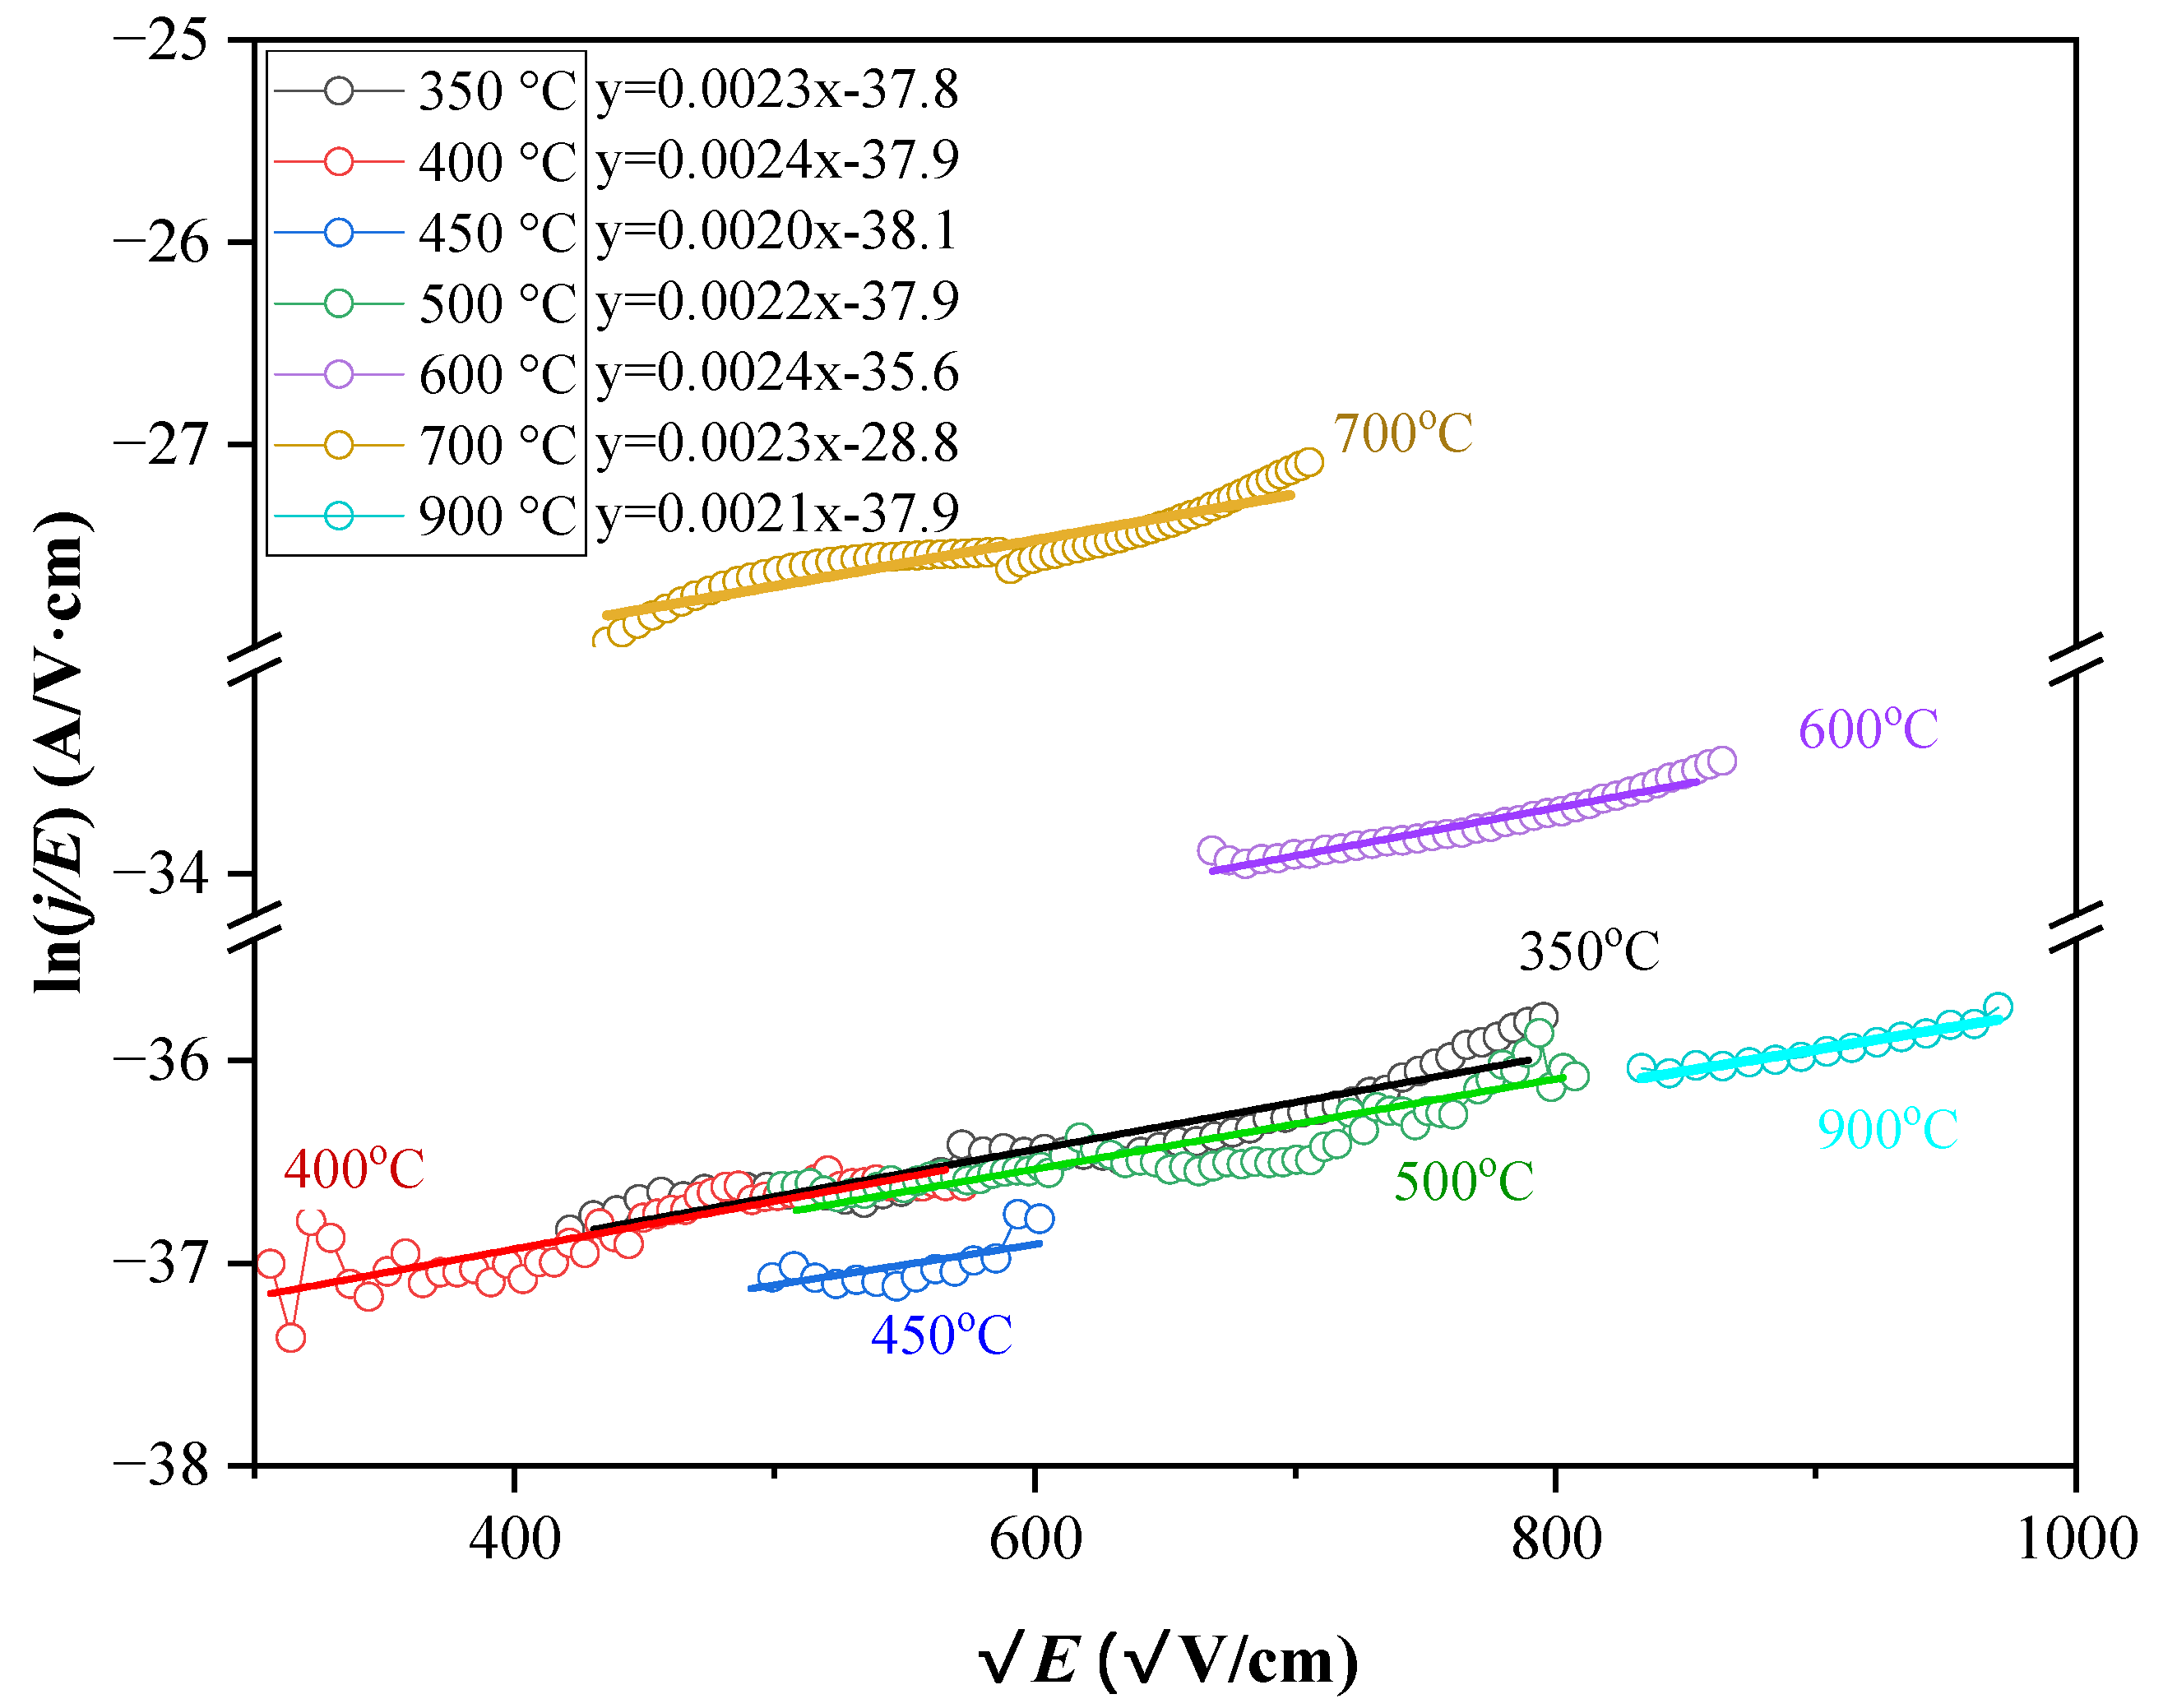
The experimental current–voltage characteristics obtained through two models (Schottky Emission (SE) and Poole–Frenkel (PF)) of charge transfer are illustrated in Figure 9 and Figure 10. Utilizing a regression method, we determined the coefficients of the equations corresponding to the linear sections of the data [42]. The slope of these approximating lines allows us to identify the predominant mechanism of charge carrier transport. To achieve this, we calculated the values of the high-frequency (optical) dielectric permittivity of the film based on the slope angle coefficients for the lines plotted in Schottky and Poole–Frenkel coordinates, employing the formulas derived from Equations (5) and (6).
ε i = 1 k B · T 2 · q 3 4 · π · ε 0 · 1 K S h 2
ε i = 1 k B · T 2 · q 3 π · ε 0 · 1 K P F 2
where KSh and KP-F – the slope angle coefficients of the approximating straight lines in Schottky and Poole–Frenkel coordinates, respectively.
To elucidate the mechanisms underlying current flow attributed to Schottky (Figure 9) and Poole–Frenkel (Figure 10) emissions, graphical representations were constructed. These representations depict the relationship of ( l n ( I ) versus E ) for Schottky emissions and ( l n ( I / E ) versus E ) for Poole–Frenkel emissions, utilizing experimental data as the foundation for analysis.
The values of εi for organosilicate films at various annealing temperatures, as determined through linear approximation in Poole–Frenkel and Schottky coordinates, are presented in Table 4. The mechanism yielding a calculated εi value closest to n2. As indicated by the calculated εi values in Table 3, it is evident that the predominant mechanism of charge carrier transfer is Poole–Frenkel emission in all instances.
At annealing temperatures of 350, 400, and 900 °C, the calculated values of εi as determined by the Poole–Frenkel model, align most closely with the experimental data. At an annealing temperature of Ta = 450 °C it is evident that both Poole–Frenkel and Schottky mechanisms are active. Between Ta = 500–700 °C the films demonstrate complex mechanisms, predominantly characterized by Poole–Frenkel emission, which warrants further investigation. Nonetheless, the findings from the study of leakage current models in OSG films subjected to various annealing temperatures lead to the conclusion that, in the presence of high electric field strengths (>120 kV/cm) the most likely mechanism for charge carrier transfer is Poole–Frenkel emission.

4. Conclusion

The influence of annealing temperature (Ta = 350–900 °С) on the chemical, structural, and electrophysical properties of porous methyl-modified OSG films has been systematically investigated. The properties examined include film thickness d, open porosity Vopen, relative porosity VLL, refractive index n, pore size 〈R〉, chemical composition, and JV. Results obtained from ellipsometric porosimetry indicate that as the annealing temperature increases, both the thickness and porosity of the films decrease, while the refractive index exhibits an increase.
In the temperature range Ta = 350–450 °С, the thermal degradation of surfactants occurs alongside the formation of a silicon-oxygen framework. This process is accompanied by an increase in pore radius from 1.2 nm to 1.5 nm. Concurrently, condensation processes result in a reduction of open porosity from 41% to 34%. During the curing process, residual porogen, specifically sp2–hybridized carbon, is generated and deposited on the surfaces of the pore walls. The quantity of porogen residue is observed to increase with the porosity of the OSG low-k attributable to the larger internal surface area and the corresponding increase in porogen accumulation. The removal of surfactants, the collapse of micropores, and the reduction in the number of Si–OH groups contribute to a decrease in leakage current values, which correlates with an increase in resistivity, as illustrated in Figure 9.
In the temperature range of Ta = 600–700 °С, the complete degradation of methyl end groups transpires, which is accompanied by the development of micropores. This process is characterized by the collapse of certain pores, as evidenced by a notable reduction in porosity and a significant decrease in pore size, approximately by a factor of one and a half. Furthermore, Fourier Transform Infrared (FTIR) spectroscopy indicates that after annealing at Ta = 700 °С, the concentration of polar silanol groups and water reaches its peak, resulting in a marked increase in leakage currents.
At an annealing temperature of 900 °C, open porosity is virtually nonexistent; however, total porosity reaches 11%, and the refractive index is lower than the typical value for dense SiO2, which is 1.46. This temperature is sufficient to completely remove all forms of chemisorbed water, along with the condensation of silanol groups on the pore walls. Together with the sealing of remaining free volume in the matrix, this contributes to a reduction in leakage current.
The results of JV measurements indicate that the methyl-modified film, which was annealed at 450 °С, demonstrates minimal leakage currents. This phenomenon can be attributed to the nearly complete elimination of surfactant residues and the thermal degradation of a limited number of methyl groups.
The results of the study on leakage current in methyl-terminated OSG films, modified at various annealing temperatures, show good agreement with changes in chemical composition and structure. This allows us to conclude that the predominant mechanism of charge carrier transfer is Poole–Frenkel emission. At Ta = 500–700 °C, the films display complex mechanisms, primarily dominated by Poole–Frenkel emission, which necessitates further investigation.

Author Contributions

Conceptualization, M.R.B. and K.A.V; data curation, G.M. and A.S.V.; methodology, V.A.G, T.G.K and A.A.G.; validation, G.M, M.R.B. and A.S.V.; formal analysis, M.G. and P.A.M; investigation, G.M., T.G.K. and P.A.M; resources, V.A.G. and P.A.M.; writing—original draft preparation, G.M.; writing—review and editing, M.R.B and G.M.; visualization, G.M. and A.A.G.; supervision, M.R.B. and K.A.V.; project administration, M.R.B. and K.A.V.; funding acquisition, K.A.V.

Funding

This work was supported by the Russian Science Foundation [grant number 23-79-30016] for the methodology of investigation and characterization of OSG low-k film properties using ellipsometry, porosimetry, FTIR, and JV techniques (G.M., A.S.V., K.A.V., and M.R.B.). T.G.K. and P.A.M. express their gratitude to the Ministry of Science and Higher Education of the Russian Federation [project number FSFZ-2023-0005] for financial support in the preparation of OSG low-k films.

Acknowledgements

We would like to express our gratitude to D. Seregin (RTU MIREA) for the deposition of OSG low-k films, and to D. Vorotyntsev (RTU MIREA) and D. Vinogradov (RTU MIREA) for their assistance in the experimental work.

Conflicts of Interest

The authors declare that they have no known competing financial interests or personal relationships that could have appeared to influence the work reported in this paper.

References

  1. Bohr, M.T. Interconnect scaling—the real limiter to high performance ULSI. Solid State Technol. 1996, 39, 105–111. [Google Scholar] [CrossRef]
  2. Havemann, R.H.; Hutchby, J.A. High-performance interconnects: An integration overview. Proc. IEEE 2001, 89, 586–601. [Google Scholar] [CrossRef]
  3. Moon, J.H.; Jeong, E.; Kim, S.; Kim, T.; Oh, E.; Lee, K.; Han, H.; Kim, Y.K. Materials quest for advanced interconnect metallization in integrated circuits. Adv. Sci. 2023, 10, 2207321. [Google Scholar] [CrossRef]
  4. Volksen, W.; Miller, R.D.; Dubois, G. Low dielectric constant materials. Chem. Rev. 2010, 110, 56–110. [Google Scholar] [CrossRef] [PubMed]
  5. Grill, A.; Gates, S.M.; Ryan, T.E.; Nguyen, S.V.; Priyadarshini, D. Progress in the development and understanding of advanced low k and ultralow k dielectrics for very large-scale integrated interconnects—State of the art. Appl. Phys. Rev. 2014, 1, 011306. [Google Scholar] [CrossRef]
  6. Michalak, D.J.; Blackwell, J.M.; Torres, J.M.; Sengupta, A.; Kreno, L.E.; Clarke, J.S.; Pantuso, D. Porosity scaling strategies for low-k films. J. Mater. Res. 2015, 30, 3363–3385. [Google Scholar] [CrossRef]
  7. Baklanov, M.R.; Gismatulin, A.A.; Naumov, S.; Perevalov, T.V.; Gritsenko, V.A.; Vishnevskiy, A.S.; Rakhimova, T.V.; Vorotilov, K.A. Comprehensive Review on the Impact of Chemical Composition, Plasma Treatment, and Vacuum Ultraviolet (VUV) Irradiation on the Electrical Properties of Organosilicate Films. Polymers 2024, 16, 2230. [Google Scholar] [CrossRef]
  8. Baklanov, M.R.; Jousseaume, V.; Rakhimova, T.V.; Lopaev, D.V.; Mankelevich, Y.A.; Afanas’ev, V.V.; Shohet, J.L.; King, S.W.; Ryan, E.T. Impact of VUV photons on SiO2 and organosilicate low-k dielectrics: General behavior, practical applications, and atomic models. Appl. Phys. Rev. 2019, 6, 011301. [Google Scholar] [CrossRef]
  9. Grill, A.; Neumayer, D.A. Structure of low dielectric constant to extreme low dielectric constant SiCOH films: Fourier transform infrared spectroscopy characterization. J. Appl. Phys. 2003, 94, 6697–6707. [Google Scholar] [CrossRef]
  10. Afanas’ev, V.V.; Keunen, K.; Stesmans, A.; Jivanescu, M.; Tőkei, Z.; Baklanov, M.R.; Beyer, G.P. Electron spin resonance study of defects in low-κ oxide insulators = 2.5–2.0). Microelectron. Eng. 2011, 88, 1503–1506. [Google Scholar] [CrossRef]
  11. Pomorski, T.A.; Bittel, B.C.; Lenahan, P.M.; Mays, E.; Ege, C.; Bielefeld, J.; Michalak, D.; King, S.W. Defect structure and electronic properties of SiOC: H films used for back end of line dielectrics. J. Appl. Phys. 2014, 115, 234508. [Google Scholar] [CrossRef]
  12. King, S.W.; French, B.; Mays, E. Detection of defect states in low-k dielectrics using reflection electron energy loss spectroscopy. J. Appl. Phys. 2013, 113, 044109. [Google Scholar] [CrossRef]
  13. Lauer, J.L.; Sinha, H.; Nichols, M.T.; Antonelli, G.A.; Nishi, Y.; Shohet, J.L. Charge trapping within UV and vacuum UV irradiated low-k porous organosilicate dielectrics. JES 2010, 157, G177. [Google Scholar] [CrossRef]
  14. Liniger, E.G.; Shaw, T.M.; Cohen, S.A.; Leung, P.K.; Gates, S.M.; Bonilla, G.; Canaperi, D.F.; Rao, S.P. Processing and moisture effects on TDDB for Cu/ULK BEOL structures. Microelectron. Eng. 2012, 92, 130–133. [Google Scholar] [CrossRef]
  15. Lloyd, J.R.; Shaw, T.M.; Liniger, E.G. Effect of moisture on the time dependent dielectric breakdown (TDDB) behavior in an ultra-low-k (ULK) dielectric. In 2005 IEEE International Integrated Reliability Workshop, South Lake Tahoe, CA, USA, 17–20 October 2005. [Google Scholar] [CrossRef]
  16. Michelon, J.; Hoofman, R.J. Moisture influence on porous low-k reliability. IEEE Trans. Device Mater. Reliab. 2006, 6, 169–174. [Google Scholar] [CrossRef]
  17. Li, Y.; Ciofi, I.; Carbonell, L.; Heylen, N.; Van Aelst, J.; Baklanov, M.R.; Groeseneken, G.; Maex, K.; Tőkei, Z. Influence of absorbed water components on SiOCH low-k reliability. J. Appl. Phys. 2008, 104, 034113. [Google Scholar] [CrossRef]
  18. Cheng, Y.L.; Leon, K.W.; Huang, J.F.; Chang, W.Y.; Chang, Y.M.; Leu, J. Effect of moisture on electrical properties and reliability of low dielectric constant materials. Microelectron. Eng. 2014, 114, 12–16. [Google Scholar] [CrossRef]
  19. Krishtab, M.; Afanas’ev, V.; Stesmans, A.; De Gendt, S. Leakage current induced by surfactant residues in self-assembly based ultralow-k dielectric materials. Appl. Phys. Lett. 2017, 111, 032908. [Google Scholar] [CrossRef]
  20. Sze, S.M.; Li, Y.; Ng, K.K. Physics of Semiconductor Devices, 2nd ed.; Wiley: New York, 1981; pp. 44–60. [Google Scholar]
  21. Wu, C.; Li, Y.; Baklanov, M.R.; Croes, K. Electrical reliability challenges of advanced low-k dielectrics. ECS J. Solid State Sci. Technol. 2014, 4, N3065–N3070. [Google Scholar] [CrossRef]
  22. Nasyrov, K.A.; Gritsenko, V.A. Charge transport in dielectrics via tunneling between traps. J. Appl. Phys. 2011, 109, 097705. [Google Scholar] [CrossRef]
  23. Vishnevskiy, A.S.; Naumov, S.; Seregin, D.S.; Wu, Y.H.; Chuang, W.T.; Rasadujjaman, M.; Zhang, J.; Leu, J.; Vorotilov, K.A.; Baklanov, M.R. Effects of Methyl Terminal and Carbon Bridging Groups Ratio on Critical Properties of Porous Organosilicate Glass Films. Materials 2020, 13, 4484. [Google Scholar] [CrossRef] [PubMed]
  24. Baklanov, B.M.; Mogilnikov, K.P.; Polovinkin, V.G.; Dultsev, F.N. Determination of pore size distribution in thin films by ellipsometric porosimetry. J. Vac. Sci. Technol. 2000, 18, 1385–1391. [Google Scholar] [CrossRef]
  25. Iacopi, F.; Travaly, Y.; Eyckens, B.; Waldfried, C.; Abell, T.; Guyer, E.P.; Gage, D.M.; Dauskardt, R.H.; Sajavaara, T.; Houthoofd, K.; et al. Short-ranged structural rearrangement and enhancement of mechanical properties of organosilicate glasses induced by ultraviolet radiation. J. Appl. Phys. 2006, 99, 053511. [Google Scholar] [CrossRef]
  26. Woignier, T.; Prassas, M.; Duffours, L. Sintering of aerogels for glass synthesis, J. Sol. Gel Sci. Technol 2019, 90, 76–86. [Google Scholar] [CrossRef]
  27. Sawamura, K.I.; Furuhata, T.; Sekine, Y.; Kikuchi, E.; Subramanian, B.; Matsukata, M. Zeolite Membrane for Dehydration of Isopropylalcohol−Water Mixture by Vapor Permeation. ACS Appl. Mater. Interfaces 2015, 7, 13728–13730. [Google Scholar] [CrossRef] [PubMed]
  28. Marsik, P.; Verdonck, P.; De Roest, D.; Baklanov, M.R. Porogen residues detection in optical properties of low-k dielectrics cured by ultraviolet radiation. Thin Solid Films 2010, 518, 4266–4272. [Google Scholar] [CrossRef]
  29. Baklanov, M.R.; Zhao, L.; Van Besien, E.; Pantouvaki, M. Effect of porogen residue on electrical characteristics of ultra low-k materials. Microelectron. Eng. 2011, 88, 990–993. [Google Scholar] [CrossRef]
  30. Van Besien, E.; Pantouvaki, M.; Zhao, L.; De Roest, D.; Baklanov, M.R.; Tőkei, Z.; Beyer, G. Influence of porosity on electrical properties of low-k dielectrics. Microelectron. Eng. 2012, 92, 59–61. [Google Scholar] [CrossRef]
  31. Proost, J.; Baklanov, M.; Maex, K.; Delaey, L. Compensation effect during water desorption from siloxane-based spin-on dielectric thin films. J. Vac. Sci. Technol. 2000, 18, 303–306. [Google Scholar] [CrossRef]
  32. Lloyd, J.R.; Liniger, E.; Shaw, T.M. Simple model for time-dependent dielectric breakdown in inter-and intralevel low-k dielectrics. J. Appl. Phys. 2005, 98, 084109. [Google Scholar] [CrossRef]
  33. Wu, C.; Li, Y.; Barbarin, Y.; Ciofi, I.; Tang, B.; Kauerauf, T.; Croes, K.; Bommels, J.; De Wolf, I.; Tőkei, Z. Towards the understanding of intrinsic degradation and breakdown mechanisms of a SiOCH low-k dielectric. 2014 IEEE International Reliability Physics Symposium, Waikoloa, HI, USA, 01–05 June 2014; pp. 3A.2.1–3A.2.6. [Google Scholar] [CrossRef]
  34. Gischia, G.; Croes, K.; Groeseneken, G.; Tőkei, Zs.; Afanas’ev, V.; Zhao, L. Study of leakage mechanism and trap density in porous low-k materials. IEEE International Reliability Physics Symposium (IRPS), Anaheim, CA, USA, 02–06 May 2010; pp. 549–555. [Google Scholar] [CrossRef]
  35. Wu, C.; Li, Y.; Barbarin, Y.; Ciofi, I.; Croes, K.; Bömmels, J.; De Wolf, I.; Tőkei, Z. Correlation between field dependent electrical conduction and dielectric breakdown in a SiCOH based low-k (k = 2.0). Appl. Phys. Lett. 2013, 103, 032904. [Google Scholar] [CrossRef]
  36. Skuja, L. Optically active oxygen-deficiency-related centers in amorphous silicon dioxide. J. Non-Cryst. Solids 1998, 239, 16–48. [Google Scholar] [CrossRef]
  37. Salh, R. Defect Related Luminescence in Silicon Dioxide Network: A Review. In Crystalline Silicon - Properties and Uses; InTech, 2011; pp. 135–172. [Google Scholar] [CrossRef]
  38. Trukhin, A.; Smits, K.; Chikvaidze, G.; Dyuzheva, T.; Lityagina, L. Luminescence of silicon Dioxide—silica glass, α-quartz and stishovite. Open Phys. 2011, 9, 1106–1113. [Google Scholar] [CrossRef]
  39. Trukhin, A.N.; Goldberg, M.; Jansons, J.; Fitting, H.J.; Tale, I.A. Silicon dioxide thin film luminescence in comparison with bulk silica. J. Non-Cryst. Solids 1998, 223, 114–122. [Google Scholar] [CrossRef]
  40. Pustovarov, V.A.; Zatsepin, A.F.; Biryukov, D.Y.; Aliev, V.S.; Iskhakzay, R.K.; Gritsenko, V.A. Synchrotron-Excited Luminescence and Converting of Defects and Quantum Dots in Modified Silica Films. J. Non-Cryst. Solids 2023, 602, 122077. [Google Scholar] [CrossRef]
  41. Rasadujjaman, M.; Zhang, J.; Spassky, D.A.; Naumov, S.; Vishnevskiy, A.S.; Vorotilov, K.A.; Yan, J.; Zhang, J.; Baklanov, M.R. UV-Excited Luminescence in Porous Organosilica Films with Various Organic Components. Nanomaterials 2023, 13, 1419. [Google Scholar] [CrossRef]
  42. Sze, S.M. Current Transport and Maximum Dielectric Strength of Silicon Nitride Films. J. Appl. Phys 1965, 38, 2951–2956. [Google Scholar] [CrossRef]
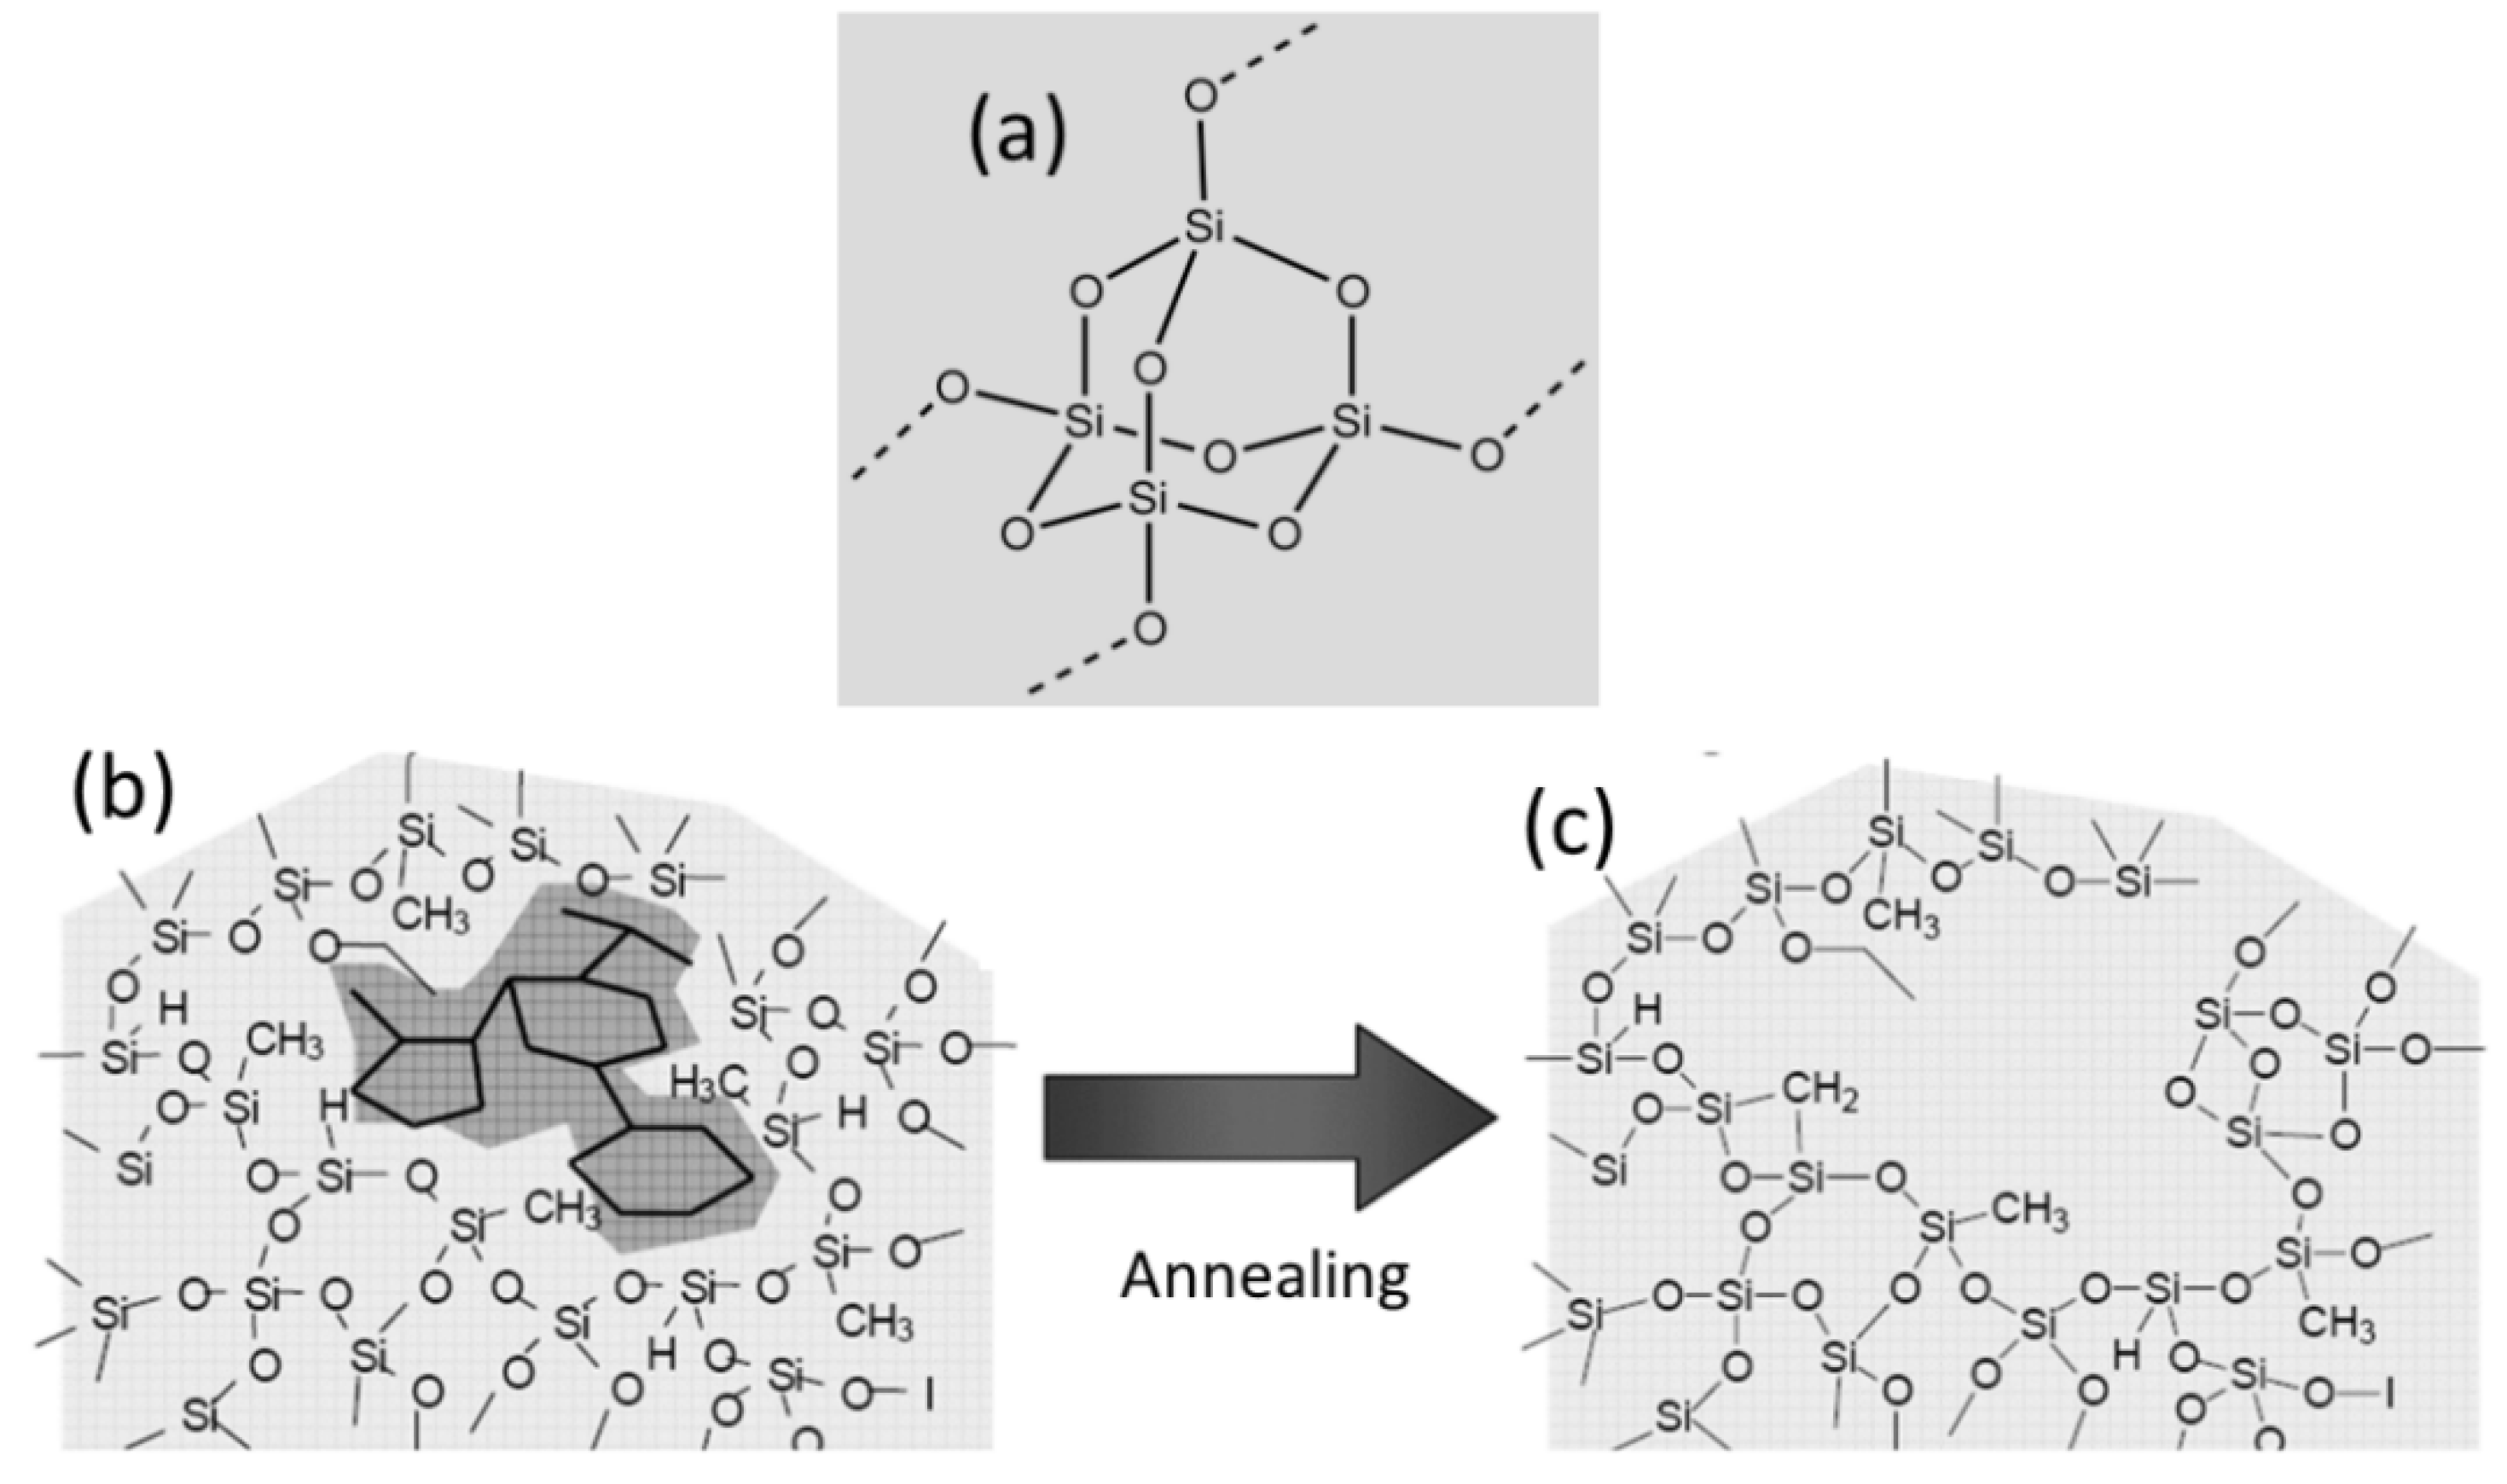
Figure 1. Structure of amorphous SiO2 (a), as deposited organosilica glass (OSG) film with embedded porogen (b) and porous OSG after porogen removal by thermal annealing (c).
Preprints 119333 g001
Figure 2. Wiring diagram of the metal–dielectric–semiconductor (MDS) structure realized using mercury (Hg) probes.
Preprints 119333 g002
Figure 3. FTIR spectra of porous organosilicate films annealed at 350–900 °С for 30 minutes in air (a) with detailed fragments showing Si–O–Si bonds (b), CHx bonds (c) and adsorbed water (d).
Preprints 119333 g003
Figure 5. Open and full porosity versus annealing temperature as measured by EP. The full porosity was calculated using the Lorentz–Lorenz equation (1), assuming that the refractive index (RI) of the matrix (ns) is equal to 1.46 (RI of dense SiO2). The difference between open and full porosity values reflects the volume of pores not accessible for adsorptive. They are less than 5% in the films annealed at 350–500 °C and 10% in the film annealed at 900 °C.
Preprints 119333 g005
Figure 6. The leakage current of different types of organosilicate glass (OSG) low-k films at annealing temperatures 350–900 °С.
Preprints 119333 g006
Figure 7. Effect of annealing temperature on changes in dielectric permittivity, resistivity at an electric field strength of 700 kV/cm and chemical composition.
Preprints 119333 g007
Figure 9. Linear regression approximation of the JV sections following annealing at temperatures ranging from 350 to 900 °C, depicted in Schottky coordinates.
Preprints 119333 g009
Figure 10. Linear regression approximation of JV sections after annealing at temperatures of 350–900 °C in Poole–Frenkel coordinates.
Preprints 119333 g010
Table 1. Inetwork/Icage ratios and relative areas of characteristic peaks/bands of samples at different annealing temperatures 350–900 °С.
Annealing temperature
Та (°С)
Inetwork/Icage Relative areas of characteristic peaks/bands Si–O–Si (×1000)
Si–OH,
H–O–H
C–H C–H3 Si–CH3 Si–OH
350 1.76 31.0 14.3 7.0 26.2 0.4
400 1.96 4.3 15.7 7.2 23.8 0.1
450 2.10 6.8 12.8 7.1 23.6
500 2.29 15.9 8.5 7.1 18.4
600 4.61 19.2 2.6 1.9 5.9
700 5.16 180.2
900 7.22 1.5
Table 2. Results of measurement done by ellipsometry and ellipsometric porosimetry measurements of porous organosilica glass films annealed at temperatures of 350–900 °С.
Annealing
temperature
Ta (°С)
Thickness
d (nm)
Shrinkage
d (%)
Refractive
index
n
Average radius pores
R〉 (nm)
Open
porosity
Vopen (%)
Relative
(full)
porosity
VLL (%)
Young’s modulus
(GPa)
350 324 0 1.248 1.15 40.9 43.0 1.9
400 305 5.9 1.253 1.37 38.5 41.7 2.4
450 301 7.1 1.257 1.44 38.0 41.5 2.6
500 273 15.7 1.272 1.51 33.7 38.0 3.7
600 233 28.1 1.280 1.09 33.4 35.4 4.6
700 195 39.8 1.310 0.40 28.7 28.2 11.6
900 170 47.6 1.392 ~0 10.5
Table 3. Results from theoretical calculations approximating the Nasyrov–Gritsenko (NG) model of experimental data for porous organosilica glass (OSG) films annealed at temperatures ranging from 350 to 900 °C.
Annealing
temperature
Ta (°С)
Thermal energy of ionization,
WT (eV)
Optical energy of ionization,
Wopt (eV)
The traps concentration
N (cm–3)
350 1.6 3.2 1.0×10²⁰
400 1.6 3.2 8.0×10²¹
450 1.6 3.2 5.0×10²²
500 1.6 3.2 9.0×10¹⁹
600 1.2 2.4 6.0×10¹⁹
700 1.2 2.4 3.0×10¹⁹
900 1.6 3.2 3.0×10²⁰
Table 4. Values of the high-frequency (optical) component of dielectric permittivity (εi) at various annealing temperatures, determined through linear approximation in the coordinates of Poole–Frenkel and Schottky.
Annealing
temperature
Ta (°С)
εi n2
Poole–Frenkel Schottky
350 1.5841 0.2556 1.557
400 1.5441 0.2153 1.571
450 1.4096 1.6837 1.581
500 1.7293 0.0711 1.617
600 1.5311 0.0973 1.639
700 1.6689 0.1745 1.717
900 1.9316 0.5017 1.937
Disclaimer/Publisher’s Note: The statements, opinions and data contained in all publications are solely those of the individual author(s) and contributor(s) and not of MDPI and/or the editor(s). MDPI and/or the editor(s) disclaim responsibility for any injury to people or property resulting from any ideas, methods, instructions or products referred to in the content.
Copyright: This open access article is published under a Creative Commons CC BY 4.0 license, which permit the free download, distribution, and reuse, provided that the author and preprint are cited in any reuse.
Prerpints.org logo

Preprints.org is a free preprint server supported by MDPI in Basel, Switzerland.

Subscribe

© 2024 MDPI (Basel, Switzerland) unless otherwise stated