Submitted:
25 September 2024
Posted:
26 September 2024
You are already at the latest version
Abstract
Keywords:
1. Introduction
2. Materials and Methods
2.1. Study Area and Data Sources
2.2. Methods
2.2.1. Bearing Capacity Index System and Comprehensive Evaluation Model
2.2.2. Analysis of the Influencing Factors
3. Analysis
3.1. The Temporal Evolution of Educational Ecological Carrying Capacity in Various Regions
| year | 2022 | 2021 | 2020 | 2019 | 2018 | 2017 | 2016 | 2015 | 2014 | 2013 | Standard Deviation Coefficient | Range Coefficient |
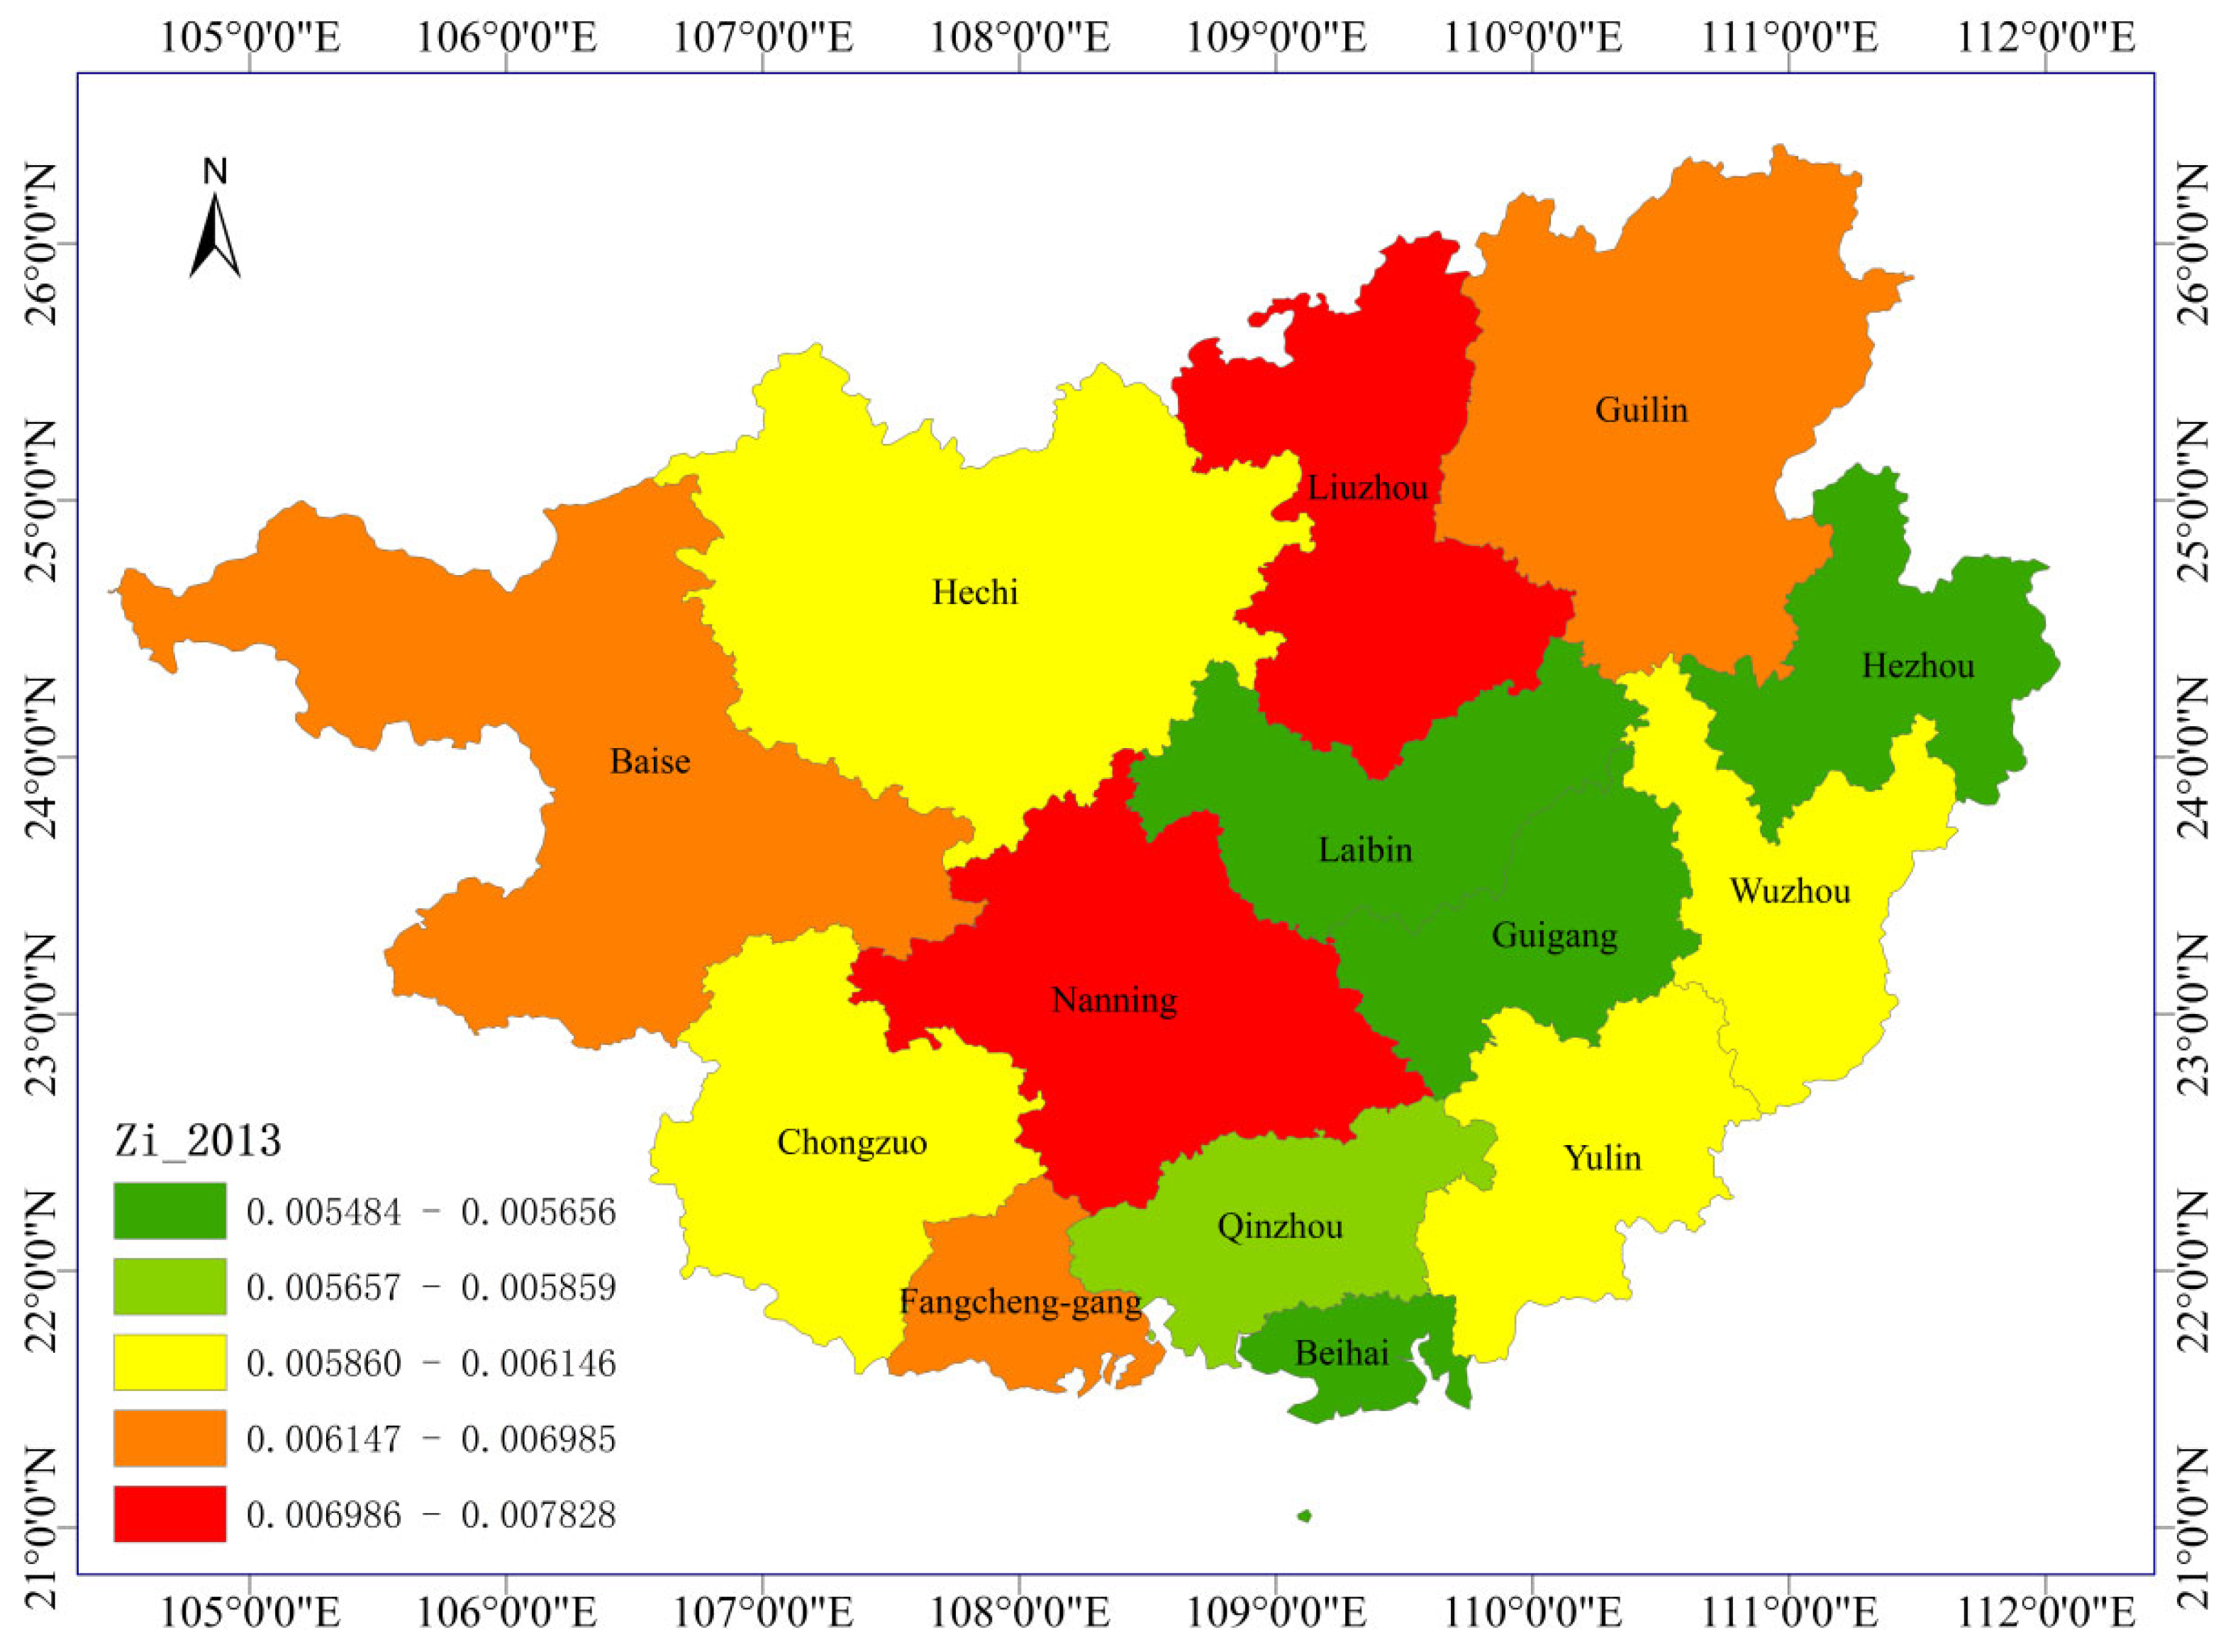
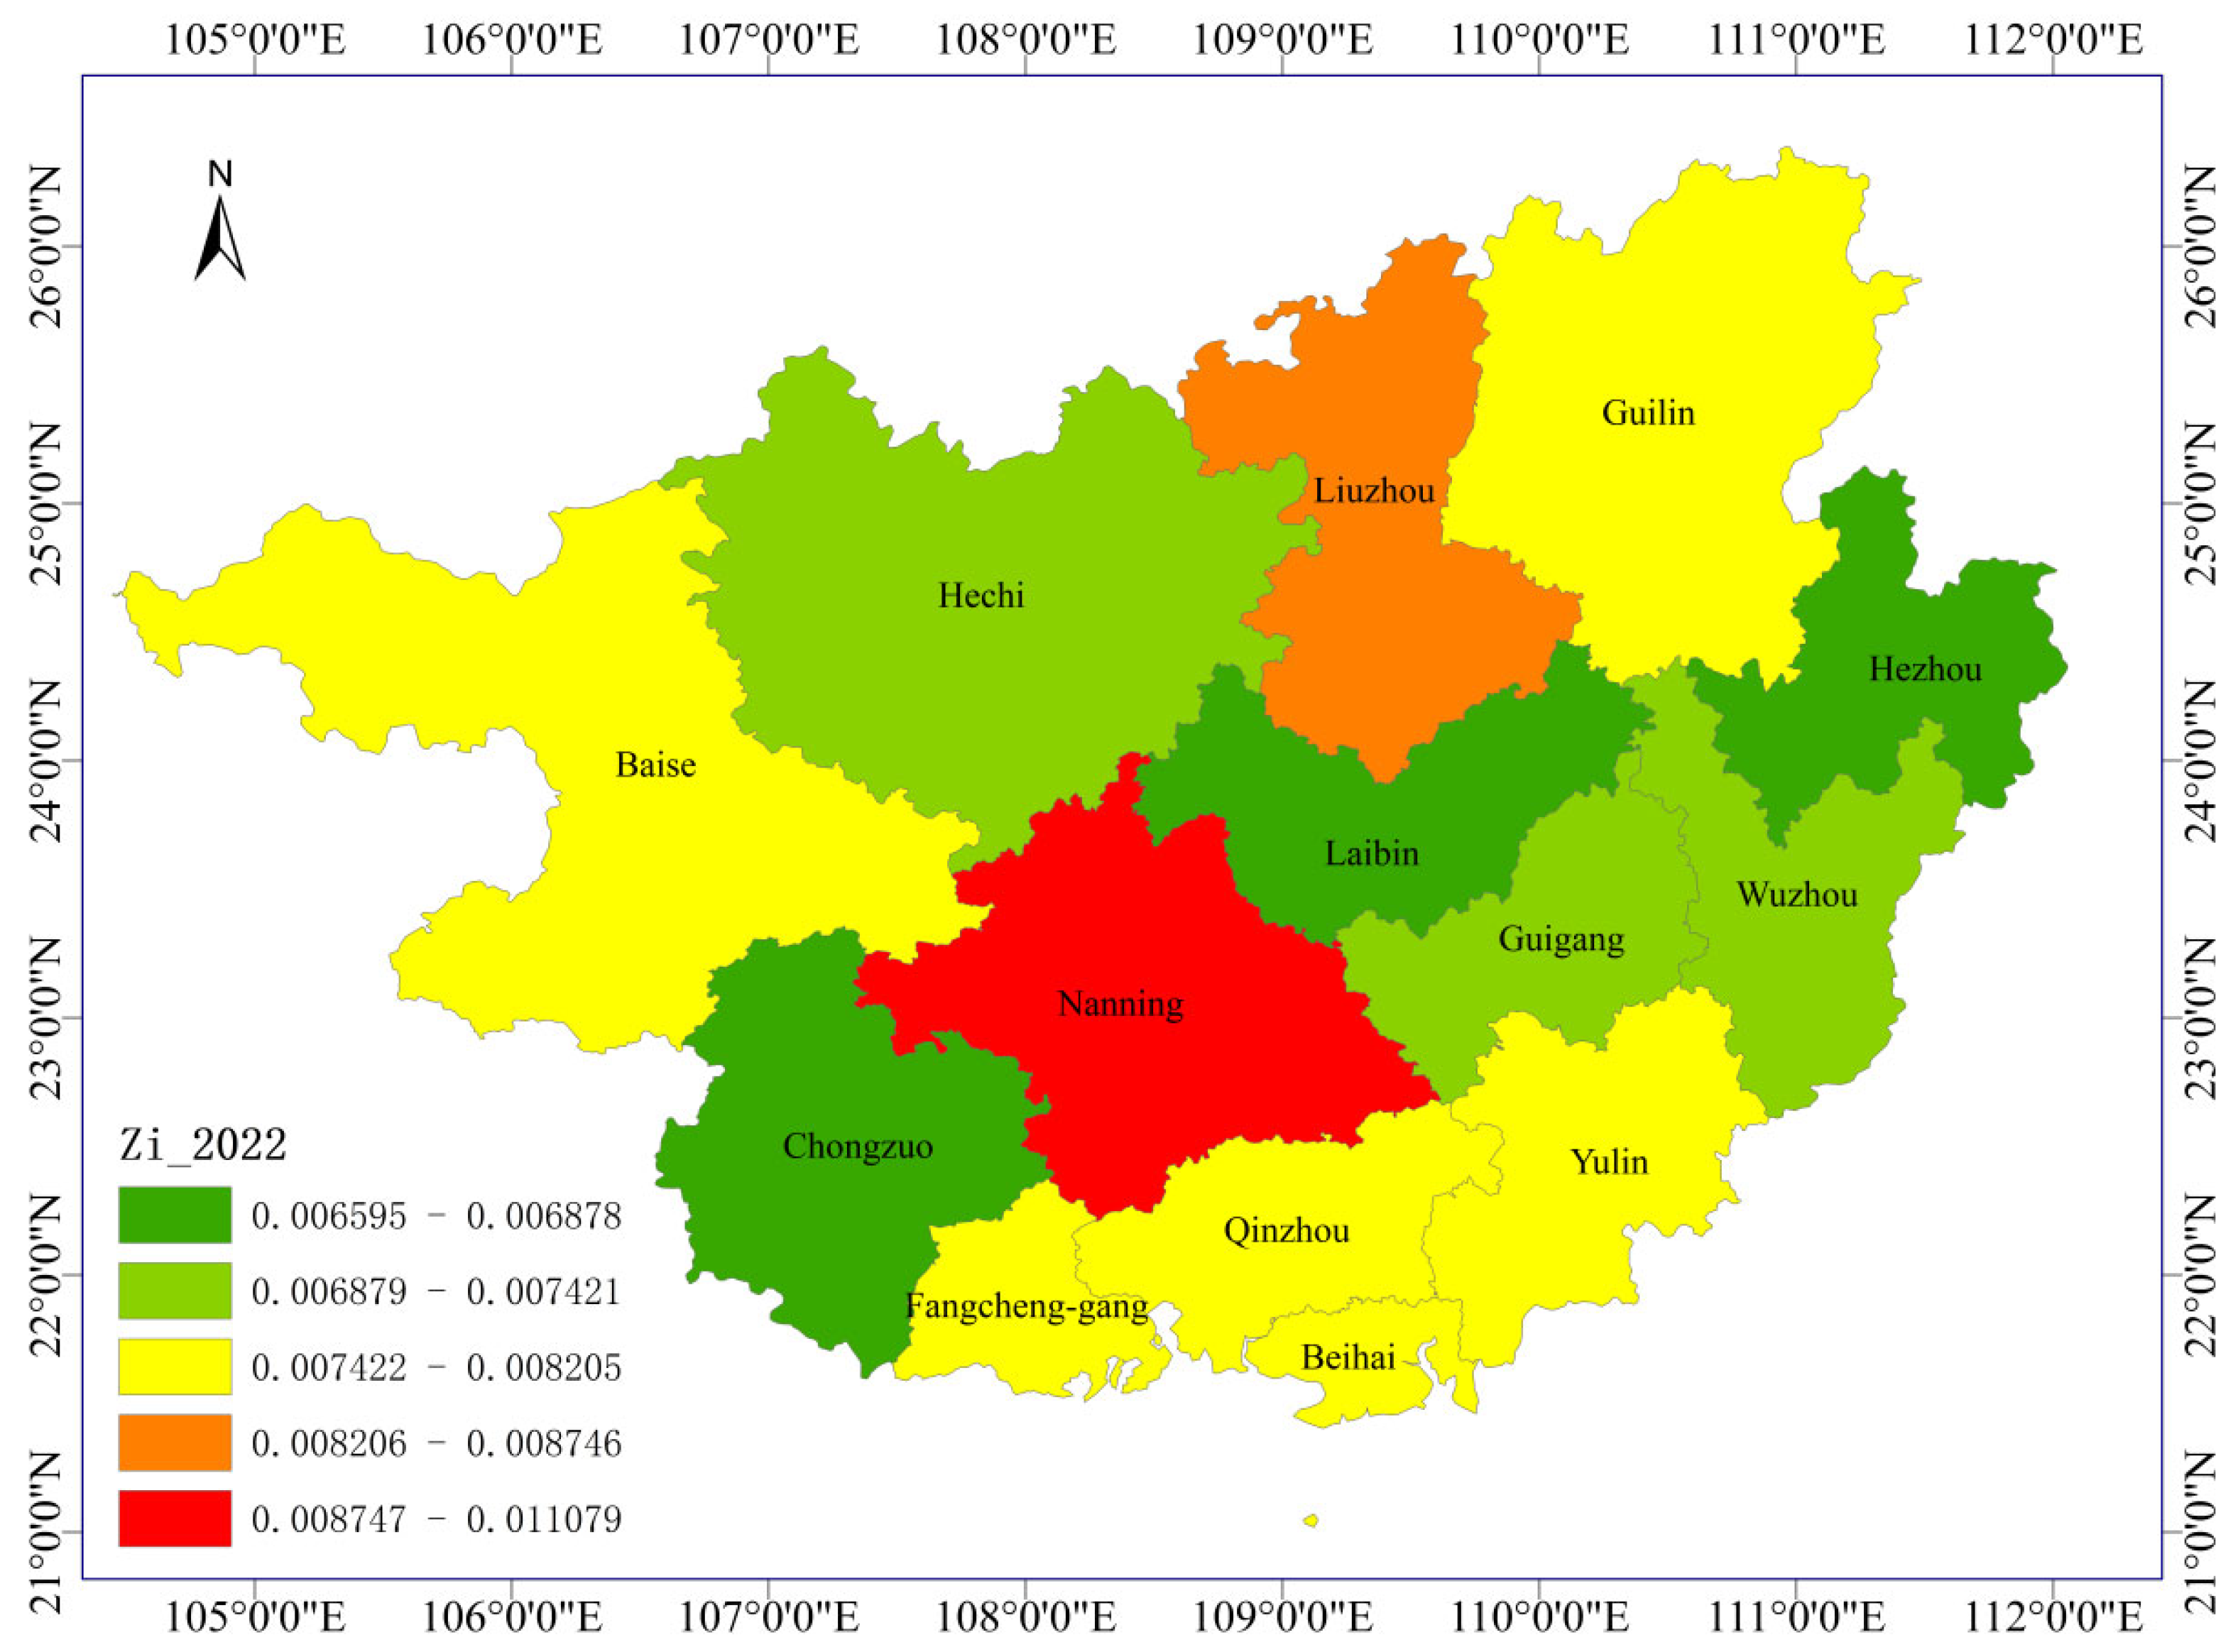
| Nanning | 0.011079 | 0.011058 | 0.010703 | 0.010496 | 0.01005 | 0.009764 | 0.008911 | 0.008716 | 0.008127 | 0.007828 | 0.12 | 0.34 |
| Liuzhou | 0.008746 | 0.008971 | 0.008928 | 0.008881 | 0.00855 | 0.008243 | 0.007809 | 0.008051 | 0.007197 | 0.007481 | 0.08 | 0.21 |
| Guilin | 0.008205 | 0.008232 | 0.007785 | 0.007948 | 0.007579 | 0.00764 | 0.007327 | 0.007374 | 0.006996 | 0.006985 | 0.06 | 0.16 |
| Wuzhou | 0.007204 | 0.007337 | 0.007031 | 0.006972 | 0.006355 | 0.006591 | 0.006489 | 0.00643 | 0.006059 | 0.006078 | 0.07 | 0.19 |
| Beihai | 0.007871 | 0.007932 | 0.007261 | 0.007136 | 0.007361 | 0.006891 | 0.006779 | 0.006889 | 0.00705 | 0.005484 | 0.1 | 0.35 |
| Fangcheng-gang | 0.007803 | 0.007835 | 0.00814 | 0.008137 | 0.007606 | 0.00761 | 0.007262 | 0.007308 | 0.007088 | 0.006637 | 0.06 | 0.2 |
| Qinzhou | 0.007793 | 0.007489 | 0.00703 | 0.006835 | 0.006818 | 0.0072 | 0.006471 | 0.006398 | 0.006573 | 0.005859 | 0.08 | 0.28 |
| Guigang | 0.007247 | 0.007144 | 0.007137 | 0.006853 | 0.006752 | 0.00623 | 0.005888 | 0.006023 | 0.005595 | 0.005583 | 0.1 | 0.26 |
| Yulin | 0.00775 | 0.007869 | 0.007489 | 0.007523 | 0.007173 | 0.00685 | 0.006888 | 0.006838 | 0.006262 | 0.006045 | 0.09 | 0.26 |
| Baise | 0.007867 | 0.007874 | 0.007886 | 0.007609 | 0.007002 | 0.007496 | 0.006831 | 0.006908 | 0.006391 | 0.006478 | 0.08 | 0.21 |
| Hezhou | 0.006773 | 0.007081 | 0.006564 | 0.00671 | 0.006209 | 0.005856 | 0.006052 | 0.006089 | 0.005704 | 0.005656 | 0.08 | 0.23 |
| Hechi | 0.007421 | 0.0073 | 0.00632 | 0.006838 | 0.006514 | 0.006484 | 0.006326 | 0.006289 | 0.006219 | 0.006146 | 0.07 | 0.19 |
| Laibin | 0.006595 | 0.006867 | 0.006357 | 0.005812 | 0.005914 | 0.005746 | 0.005692 | 0.005607 | 0.005467 | 0.005555 | 0.08 | 0.23 |
| Chongzuo | 0.006878 | 0.006912 | 0.006523 | 0.006556 | 0.006221 | 0.006122 | 0.010362 | 0.005791 | 0.006105 | 0.006131 | 0.19 | 0.68 |
| StandardDeviation Coefficient | 0.14 | 0.14 | 0.16 | 0.16 | 0.15 | 0.15 | 0.18 | 0.13 | 0.11 | 0.12 | ||
| Range Coefficient | 0.58 | 0.53 | 0.58 | 0.63 | 0.58 | 0.57 | 0.66 | 0.46 | 0.41 | 0.37 | ||
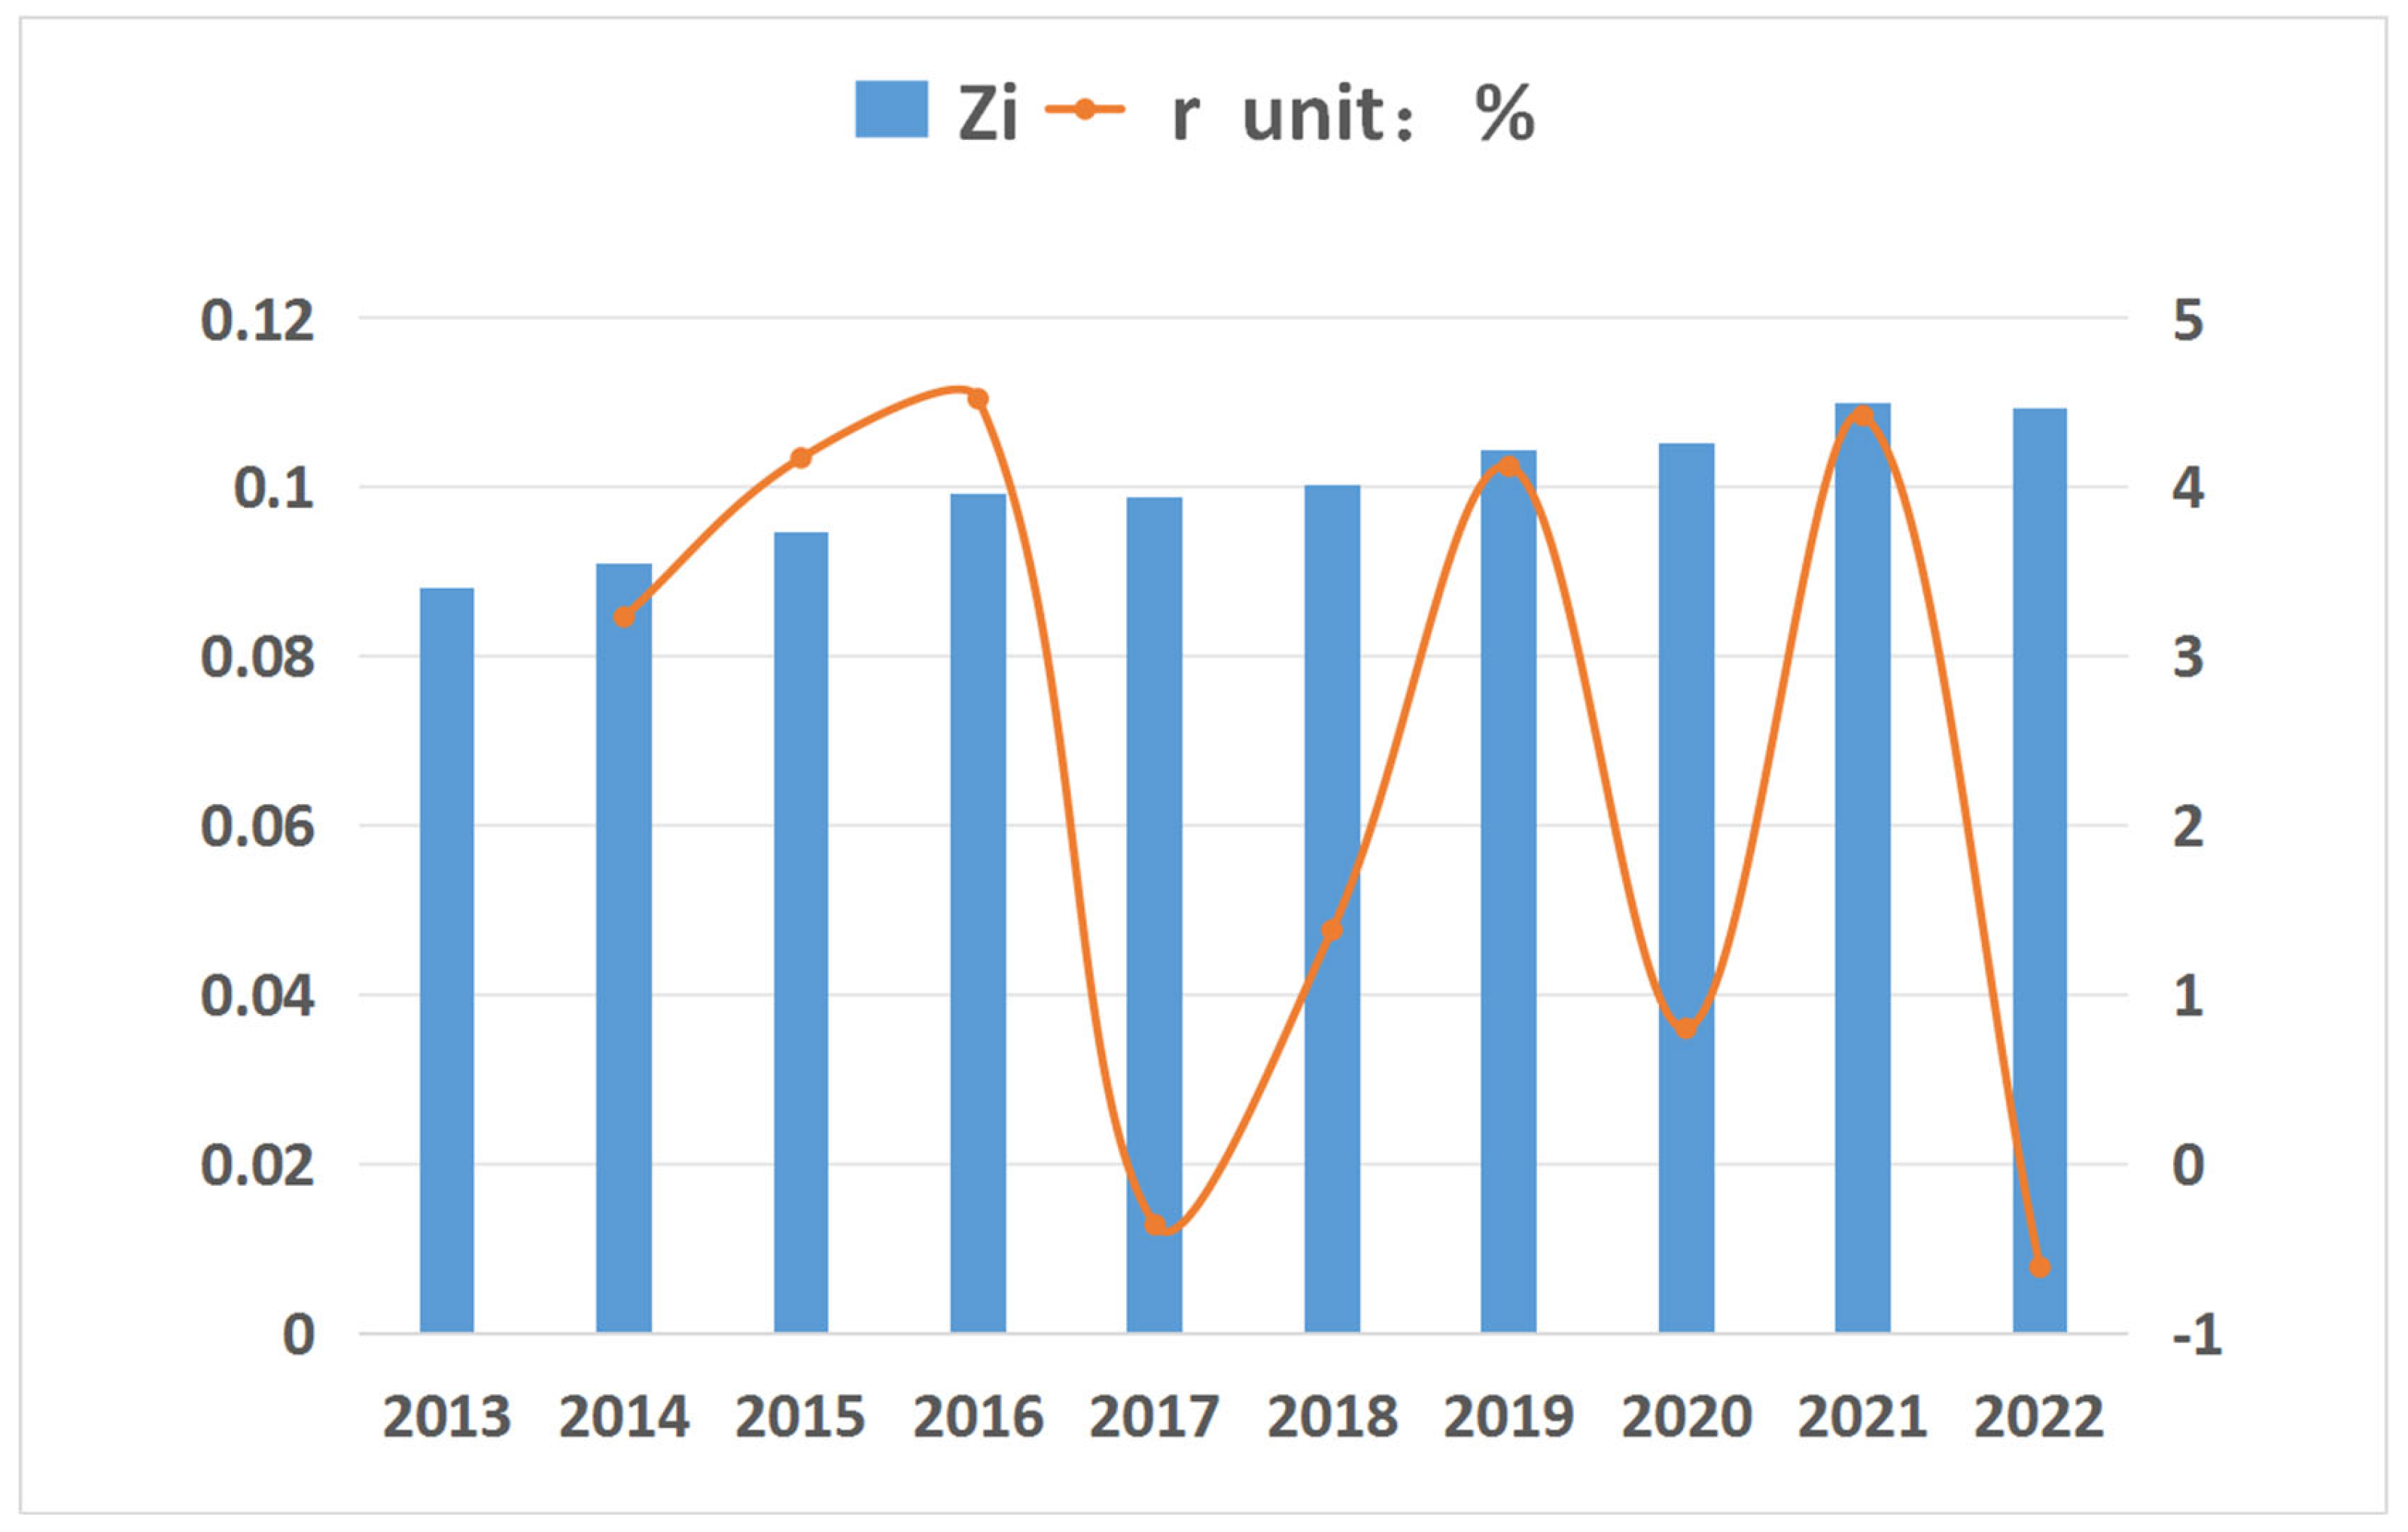
| Guangxi | 0.109231 | 0.109901 | 0.105153 | 0.104306 | 0.100104 | 0.098725 | 0.099087 | 0.094711 | 0.090835 | 0.087946 | 0.07 | 0.22 |
3.2. Spatial Analysis Method of Ecological Carrying Capacity in Basic Education in Guangxi
3.3. Trend of Spatial Expansion of Ecological Carrying Capacity in Basic Education in Guangxi
3.4. Impact of Economic Reform on the Ecological Carrying Capacity of Basic Education in Guangxi
| Year | B | Std. | β | t | Sig. | |
| 2013 | Constant | 28.636 | 26.927 | 1.063 | 0.313 | |
| see | 0.186 | 0.541 | 0.097 | 0.344 | 0.738 | |
| stf | 0.398 | 0.345 | 0.381 | 1.152 | 0.276 | |
| pur | 0.757 | 0.283 | 1.106 | 2.671 | 0.023 | |
| 2022 | Constant | 54.796 | 7.386 | 7.419 | 0.000 | |
| see | 0.001 | 0.121 | 0.002 | 0.011 | 0.992 | |
| stf | 0.064 | 0.197 | 0.080 | 0.323 | 0.753 | |
| pur | 0.317 | 0.086 | 0.865 | 3.681 | 0.004 |
| Year | B | Std. | β | t | Sig. | ||
| 2013-2022 | Constant | -69.386 | 32.939 | -2.106 | 0.080 | ||
| scs | 0.684 | 0.447 | 0.120 | 1.529 | 0.177 | ||
| see | 1.638 | 0.658 | 0.193 | 2.489 | 0.047 | ||
| pur | 2.239 | 0.154 | 1.110 | 14.550 | 0.000 |
| Year | B | Std. | β | t | Sig. | ||
| 2013-2022 | Constant | 72.071 | 83.870 | 0.859 | 0.423 | ||
| fi | -0.152 | 0.231 | -0.091 | -0.659 | 0.534 | ||
| csr | -1.445 | 1.678 | -0.374 | -0.861 | 0.422 | ||
| pur | 1.397 | 0.776 | 0.693 | 1.799 | 0.122 |
4. Discussion
4.1. The Complexity and Variability of Factors Influencing Educational Ecological Carrying Capacity
4.2. The Pathways to Co-Construction and Shared Development in Enhancing Educational Ecological Carrying Capacity and Addressing Potential Issues in Resource Development
5. Conclusion and Future Prospects
5.1. Research Conclusion
5.2. Research Prospects
Author Contributions
Funding
Institutional Review Board Statement
Informed Consent Statement
Data Availability Statement
Acknowledgments
Conflicts of Interest
References
- Lin,S.; Sun,J.; Marinova,D.; Zhao,D. Effects of Population and Land Urbanization on China’s Environmental Impact: Empirical Analysis Based on the Extended STIRPAT Model. Sustainability 2017,9,825. [CrossRef]
- Lv,T.; Wang,L.; Zhang,X.; Xie,H.; Lu,H.; Li,H.; Liu,W.; Zhang,Y. Coupling Coordinated Development and Exploring Its Influencing Factors in Nanchang,China: From the Perspectives of Land Urbanization and Population Urbanization. Land 2019, 8, 178. [CrossRef]
- Zhang,S.L.; Zheng,H.Q.; Zhou,H.Y.; Shao,Q.; Wu,Q. Sustainable land urbanization,urban amenities,and population urbanization: Evidence from city-level data in China. Soc. Sci. Q. 2021, 102, 1686–1698. [CrossRef]
- Liu,J.; Shen,Y.F. Population Mobility and Re allocation of Educational Resources—Based on the Perspective of Educational Carrying Capacity. J. Educ. Dev. 2017, 2, 18–23. [CrossRef]
- Ding,X.S.; Qin,Y.Y.; Xue,C.Y. Coordinating and Promoting the Improvement of the Carrying Capacity of Compulsory Ed-ucation Resources in Big Cities: Problem Analysis and Policy Suggestions. Mod. Educ. Manag. 2020, 1, 78–84. [CrossRef]
- Lu,W.; Li,Y.C.; Zhao,R.K.; Wang,Y. Using Remote Sensing to Identify Urban Fringe Areas and Their Spatial Pattern of Ed-ucational Resources: A Case Study of the Chengdu-Chongqing Economic Circle. Remote Sens. 2022, 14, 3148. [CrossRef]
- Guo,Y.-Z.; Zhou,Y.; Liu,Y.-S. The inequality of educational resources and its countermeasures for rural revitalization in southwest China. J. Mt. Sci. 2020, 17, 304–315. [CrossRef]
- Liu,H.M.;Xu,Z.M. Educational Ecological Carrying Capacity: A Necessary Support for High-Quality Regional Education Development. Modern Educational Management 2020, 12, 1–6. [CrossRef]
- Liu,H.M.;Xu,Z.M. Educational Ecological Carrying Capacity: A Necessary Support for High-Quality Regional Education Development. Modern Educational Management 2020, 12, 1–6. [CrossRef]
- Pei,R. The Issues and Countermeasures of the Scale Expansion of Higher Education Popularization in China from the Perspective of Ecological Carrying Capacity. Heilongjiang Researches on Higher Education 2023, 41, 14–21. [CrossRef]
- Li,X. ; Liu,L.Y.; Li,Y. Optimization and Improvement of Ecological Factors in Higher Vocational Education under the Background of Mixed Ownership. Vocational and Technical Education 2020, 11, 46–50. [CrossRef]
- Zhang,T.X.; Wen,H.M. Theoretical Exploration of the Ecological Carrying Capacity of College Physical Education. Bulletin of Sports Science and Technology 2016, 02, 172–175. [CrossRef]
- Frances,D.C.; Jessica,D.K. Furthering critical institutionalism. Int. J. Commons 2015, 9, 1–18. [CrossRef]
- Di Baldassarre,G.; Sivapalan,M.; Rusca,M.; Cudennec,C.; Garcia,M.; Kreibich,H.; Konar,M.; Mondino,E.; Mård,J.; Pande,S.; et al. Sociohydrology: Scientific Challenges in Addressing the Sustainable Development Goals. Water Resour. Res. 2019, 55, 6327–6355. [CrossRef]
- Ji,M.; Zhi,J.D.; Liu,W. ResearchE on the Balance of University Education Reform from the Perspective of Supply-Side Reform. Rev. De Cercet. Si Interv. Sociala. 2021, 72, 72–92. [CrossRef]
- Stukalina,Y. The Management of Integrated Educational Environment Resources: The factors to be considered. Eur. J. Educ. 2010, 45, 345–361. [CrossRef]
- Tel,A.; Maria,R.D.; Celso,J.D. Building Open Policy through Open Educational Resources: An analysis of the Open University of Brazil System. Rev. Latinoam. De Tecnol. Educ.-Relatec. 2017, 16, 161–176. [CrossRef]
- Gong,X.;Qu,H.Y. High-Quality Preschool Education System: Basic Structure,Main Characteristics,and Construction Path. Modern Educational Management. 2021, 11, 34–42. [CrossRef]
- NAIDU, S. Building resilience in education systems post-COVID-19[J]. Distance Education 2021, 01, 1–4. [Google Scholar] [CrossRef]
- Zhu,Z.T;Peng,H.C. Resilient Education Systems Empowered by Technology: New Directions for Post-Pandemic Educational Digital Transformation. Modern Educational Management 2020, 05, 40–50. [CrossRef]
- Ma,P.Y;Mi,H. Quantitative Analysis of Higher Education Resources Carrying Capacity at Provincial Level. China Higher Education Research 2015, 09, 48–52. [CrossRef]
- SHI,L; CHEN,W.M. Research on Maturity of Higher Education Resources Carrying Capacity in China. Journal of Higher Education 2017, 09, 21–29. [CrossRef]
- Peng,N.Y. An Empirical Study on the Comprehensive Carrying Capacity and the Matching Degree of China's Higher Education. Research in Educational Development 2017, 09, 37–44. [CrossRef]
- Ke,W.J.;Wang,J. Evaluation of Urban Higher Education Resources Carrying Capacity Based on Entropy Weight TOPSIS Model. Statistics & Decision 2020, 18, 50–53. [CrossRef]
- Xu,Z.C. Study on preschool education resources carrying capacity. PhD Dissertation of Northeast Normal University 2020, 105–147. [CrossRef]
- Wang, Z.; Zhao, L. Spatio-temporal Pattern and Influencing Factors of the Carrying Capacity of Basic Education Resources in China. Resour. Dev. Mark. 2021, 37, 5–11. [Google Scholar] [CrossRef]
- He, Y.Y.; Guo, J.X.; Zheng, Q.; Zhang, Y.Z.; Ji, C.J.; Liu, T.; Xie, H.J. Analysis on the service carrying capacity of preschool education resources Based on GIS: taking the main urbanarea of Hangzhou as an example. Journal of Hangzhou Normal University (Natural Science Edition) 2024, 04, 369–377. [Google Scholar] [CrossRef]
- He,Z.B.; Lin,M.C. On the Controlling Model for the Ecological Bearing Capacity for Higher Education System. J. Guangxi Teach. Educ. Univ. 2012, 33, 60–65. [CrossRef]
- Peng,N.Y. An Empirical Study on the Comprehensive Carrying Capacity and the Matching Degree of China’s Higher Edu-cation. Res. Educ. Dev. 2017, 37, 37–44. [CrossRef]
- Hrynevych,L.M.; Morze,N.V.; Vember,V.P.; Boiko,M.A. The Role of Digital Technologies in the Development of the STEM Education Ecosystem. Inf. Technol. Learn. Tools 2021, 83, 1–25. [CrossRef]
- Liu,H.M.;Xu,Z.C. Educational Ecological Carrying Capacity: A Necessary Support for High-Quality Regional Education Development. Modern Educational Management 2020, 12, 1–6. [CrossRef]
- Zhao, D.S.; Zhang, X.M.; Deng, S.Q.; Yu, G.R. Discussion on Evaluation Theory and Method of Regional Resource and Environmental Carrying Capacity. China Population, Resources and Environment 2022, 32(3), 203-212. [CrossRef]
- Lei, X.P.; Qiu, G.H. An Empirical Study on Regional Resource and Environmental Carrying Capacity Evaluation Based on the Entropy-Weighted TOPSIS Model. Environmental Science 2015, 36(12), 4674–4681. [Google Scholar] [CrossRef]
- HE, Z.B.; LIN, M.C. On the Controlling Model for the Ecological Bearing Capacity for Higher Education System. Journal of Guangxi Teachers Education University(Social Science Edition) 2012, 33(4), 60-65. [CrossRef]
- SUN, X.R.; SHAO, C.F. Study on the Variation Trends of Regional Environmental Risk for Tianjin Binhai New Area Based on DPSIR Model. Research of Environmental Sciences 2010, 23(1), 68–73. [Google Scholar] [CrossRef]
- LI, T.X.; FU, Q.; PENG, S.M. Evaluation of water and soil resources carrying capacity based on DPSIR frame work. Journal of Northeast Agricultural University 2012, 43(8), 128–134. [Google Scholar] [CrossRef]
- WANG, X.W.; SHAO, J.L.; CUI, Y.L.; ZHAO, H.; GUO, X.H.; SUN, Q. Evaluation of water resources carrying capacity of Fukang based on DPSIR and principal component analysis. South-to-North Water Transfers and Water Science & Technology 2017, 15(3), 37-42, 48. [CrossRef]
- GAO, C.; MEI, Y.D.; LV, S.Y.; WANG,Y.; YUAN, J.B. Assessment and Prediction of Water Resources Carrying Capacity Based on AHP-Fuzzy Method: A Case Study on Hanjiang River Basin. Journal of Yangtze River Scientific Research Institute 2010, 23(1), 68-73. [CrossRef]
- Hu, C.L.; Huang, W.L. On the development strategy of university disciplines from the perspective of ecological carrying ca-pacity. Acad. Forum 2013, 36, 228–230. [Google Scholar] [CrossRef]
- Zhou, R.; Lee, N. The Reception of Education for Sustainable Development (ESD) in China: A Historical Review. Sustainability 2022, 14, 4333. [Google Scholar] [CrossRef]
- Xue, E.; Li, J. Exploring the education power in China: The basic connotation, key index, and strategic pathway. Educ. Philos. Theory 2022, 20, 11–18. [Google Scholar] [CrossRef]
- Li, G.; Xi, Y.; Zhu, Z. The way to sustainability: Education for sustainable development in China. Asia Pac. Educ. Rev. 2022, 23, 611–624. [Google Scholar] [CrossRef]
- Wang, W.X.; Yang, Q.Y.; Su, K.C.; Bi, G.H.; Zhang, Z.X. Evolution of Yangtze River Economic Belt Development Zone and Its Industrial Spatial Pattern. Resour. Environ. Yangtze Basin 2021, 30, 519–533. [Google Scholar] [CrossRef]
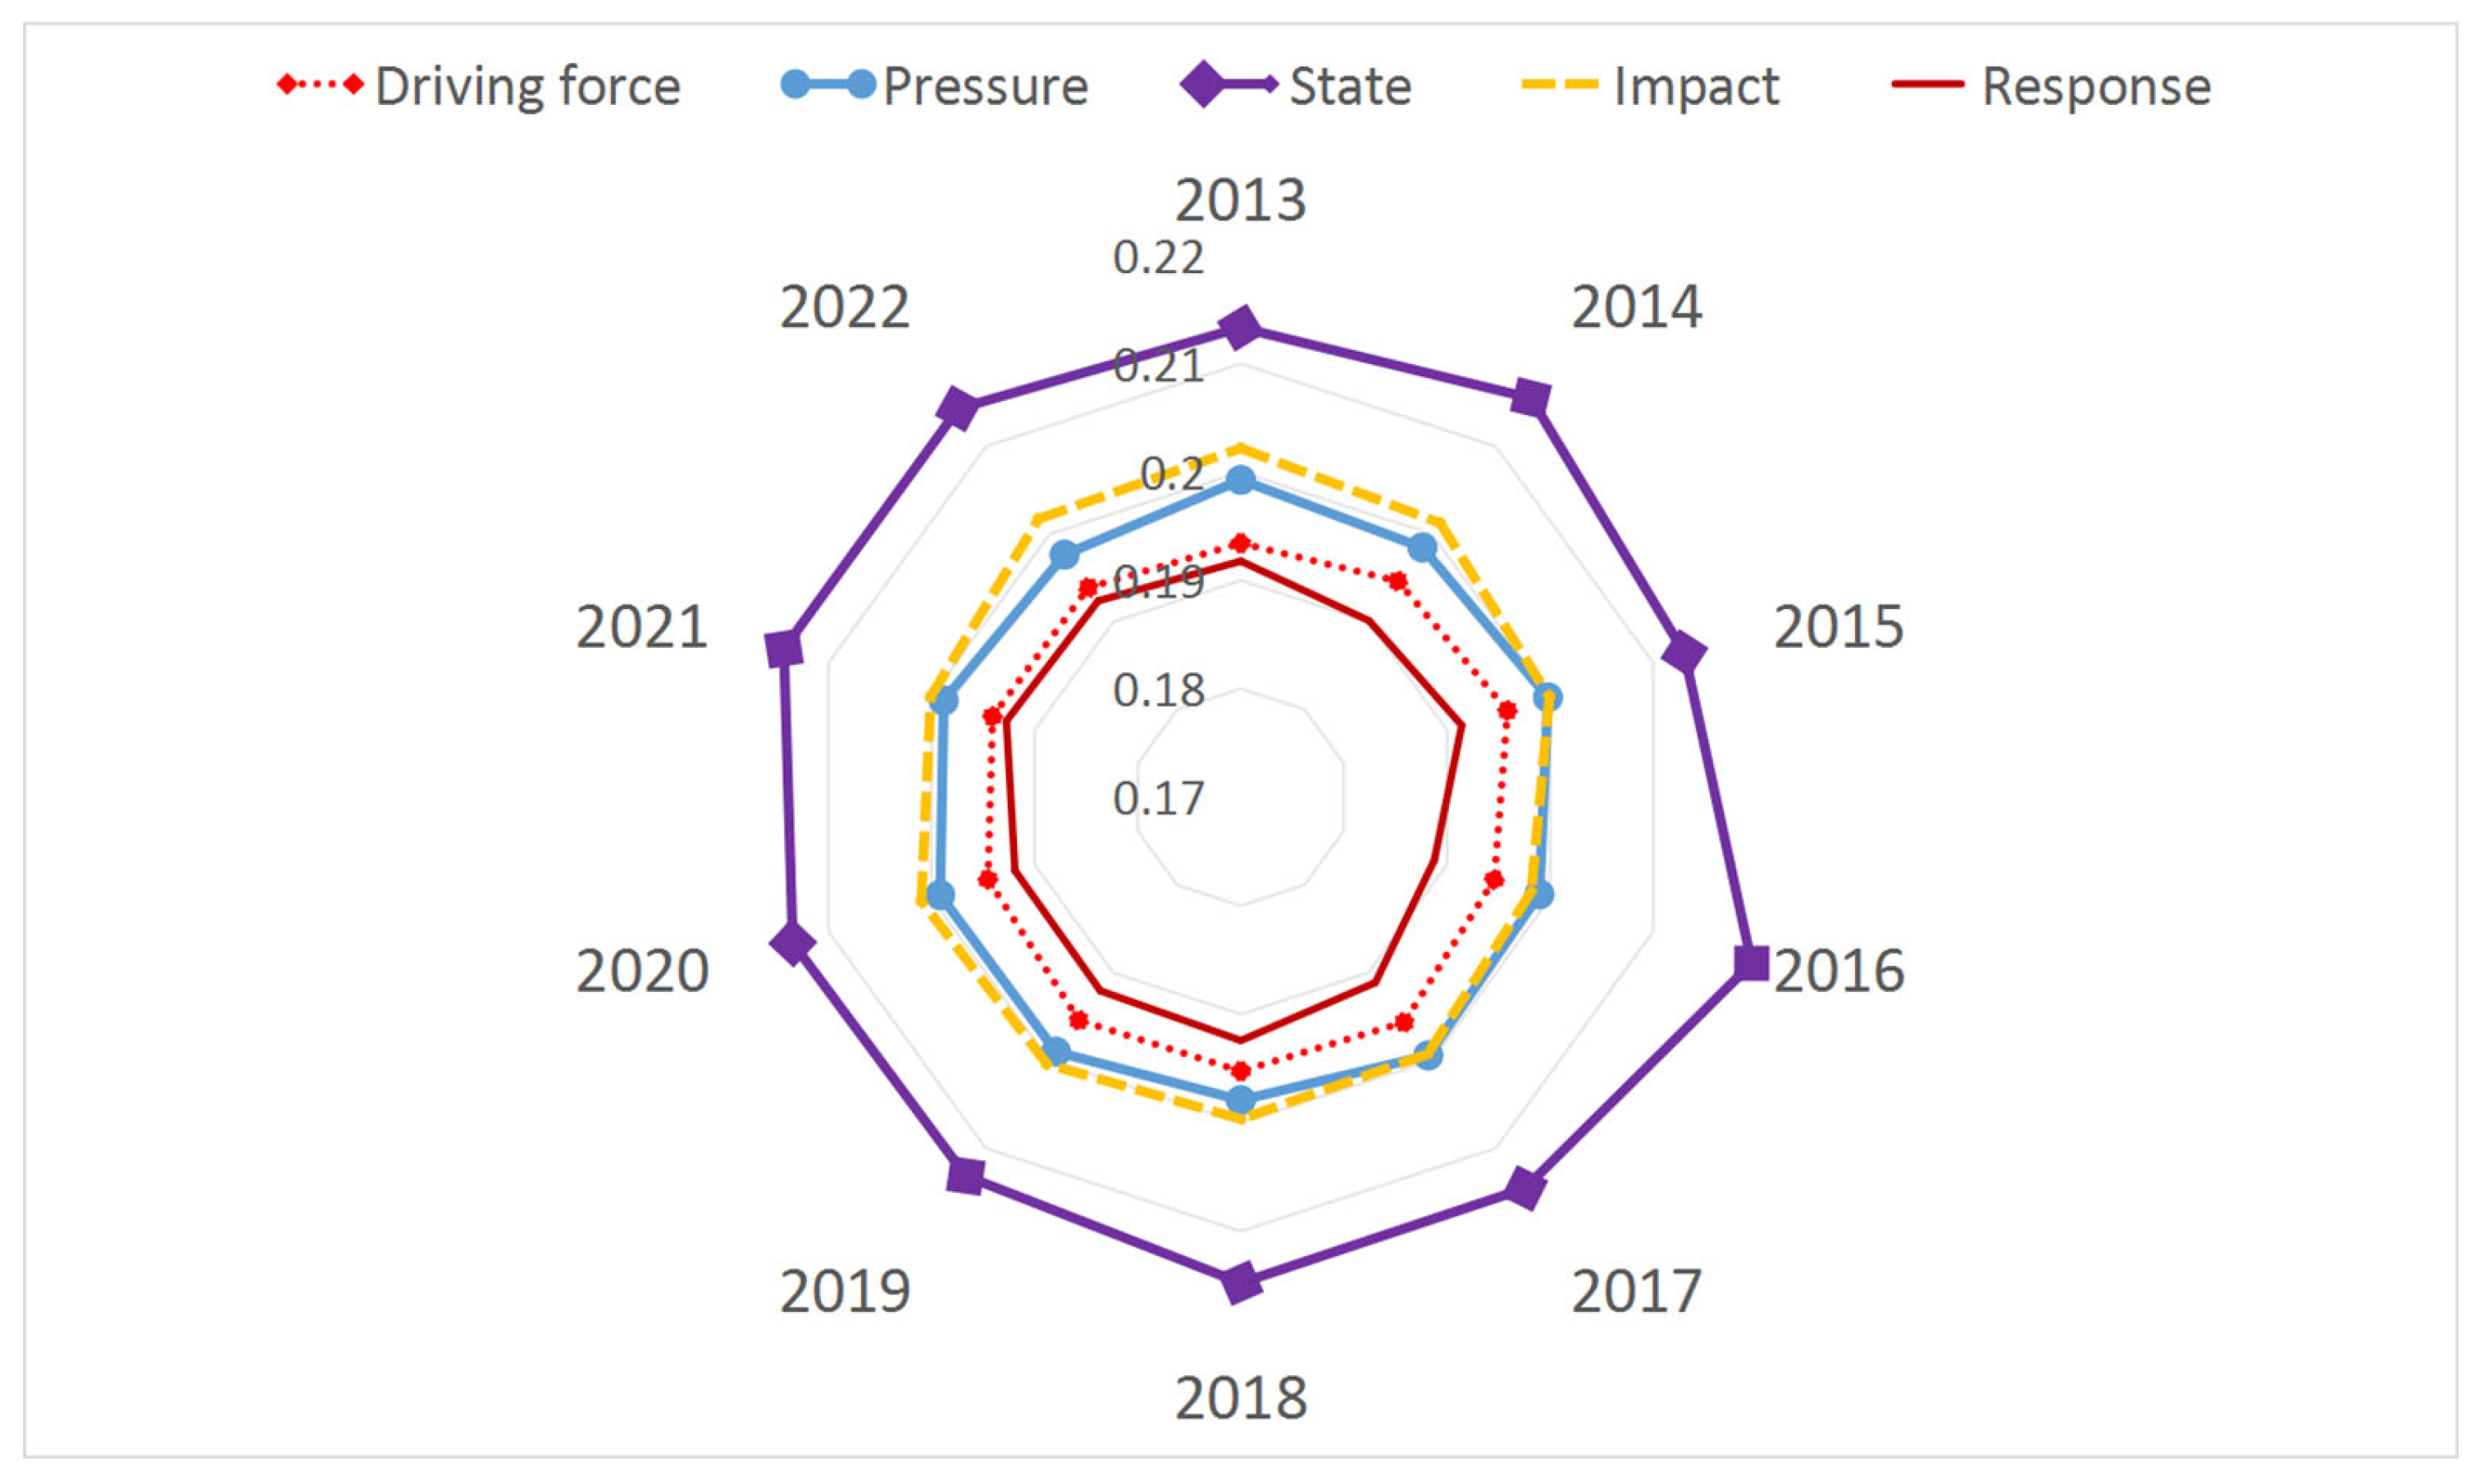
| Factor | Indicator | Implication | Positive/Negative |
| Driving-force | Educational Fiscal Expenditure X1 | Represents the driving force of special fiscal investment on educational ecological carrying capacity | + |
| Gross Regional Product X2 | Represents the driving force of economic total on educational ecological carrying capacity | + | |
| Per Capita Gross Regional Product X3 | Represents the driving force of economic development on educational ecological carrying capacity | + | |
| Per Capita Disposable Income of Urban Residents X4 | Represents the driving force of economic development on educational ecological carrying capacity | + | |
| Per Capita Living Consumption Expenditure of Urban Residents X5 | Represents the driving force of economic development on educational ecological carrying capacity | + | |
| Public Fiscal Budget Revenue X6 | Represents the driving force of overall fiscal revenue on educational ecological carrying capacity | + | |
| Public Fiscal Budget Expenditure X7 | Represents the driving force of overall fiscal investment on educational ecological carrying capacity | + | |
| Pressure | Population Size X8 | Represents the overall demand of social population on the pressure of basic education ecological carrying capacity | - |
| Natural Population Change X9 | Represents the overall changes in social population on the pressure of basic education ecological carrying capacity | - | |
| Total Number of Households X10 | Represents the household demand on the pressure of basic education ecological carrying capacity | - | |
| Number of Enrolled Students X11 | Represents the demand for education from the school-age population on the pressure of basic education ecological carrying capacity | - | |
| State | Number of Students per Million Population X12 | Represents the enrollment situation of the school-age population | + |
| Number of Schools per Hundred Thousand Population X13 | Represents the development level of primary and secondary schools | + | |
| Per Capita Fiscal Expenditure X14 | Represents the current level of fiscal investment in basic education | + | |
| Teacher-Student Ratio X15 | Represents the degree of alignment between the current number of teachers and basic education needs | + | |
| Impact | GDP Growth Rate X16 | Represents the impact of basic education on overall economic development | + |
| Population Urbanization Rate X17 | Represents the impact of basic education on social development | + | |
| Total Retail Sales of Consumer Goods X18 | Represents the impact of basic education on social consumption and domestic trade | + | |
| Average Annual Wage of Urban Employees X19 | Represents the influence of educational attainment on income | + | |
| Response | Growth Rate of Fiscal Expenditure Compared to Previous Year X20 | Represents the response of fiscal investment to the carrying capacity of basic education | + |
| Growth Rate of Per Capita Fiscal Expenditure Compared to Previous Year X21 | Represents the response of per capita fiscal investment to the carrying capacity of basic education | + | |
| Average Public Library Collection per Ten Thousand People X22 | Represents the response of social cultural services to the carrying capacity of basic education | + | |
| Per Capita Regional Road Area X23 | Represents the response of social public transportation services to the carrying capacity of basic education | + | |
| Average Number of Health Technicians per Ten Thousand People X24 | Represents the response of social medical services to the carrying capacity of basic education | + |
| Variables | Symbols | Definitions |
| Carrying capacity index | Zi | Educational ecological carrying capacity |
| Financial structure | fi | Year-end balance of savings deposits of urban and rural residents/GDP |
| Urban and rural income distribution structure | urs | Urban per capita annual income/Rural per capita annual income |
| Consumption structure of urban and rural residents | csr | Urban per capita consumption expenditure/Rural per capita consumption expenditure |
| Social consumption structure | scs | Total retail sales of consumer goods/GDP |
| Employment structure | es | Number of non-private sector workers/total population |
| Share of education expenditure | see | Education expenditure/total local financial expenditure |
| Share of science and technology expenditure | sst | Science and technology expenditure/total local financial expenditure |
| Share of expenditure on culture, sports and media | sec | Expenditure on culture, sports and media/Total local financial expenditure |
| Population urbanization rate | pur | Urban population/total population |
| Share of total local financial expenditure | stf | total local financial expenditure/GDP |
Disclaimer/Publisher’s Note: The statements, opinions and data contained in all publications are solely those of the individual author(s) and contributor(s) and not of MDPI and/or the editor(s). MDPI and/or the editor(s) disclaim responsibility for any injury to people or property resulting from any ideas, methods, instructions or products referred to in the content. |
© 2024 by the authors. Licensee MDPI, Basel, Switzerland. This article is an open access article distributed under the terms and conditions of the Creative Commons Attribution (CC BY) license (https://creativecommons.org/licenses/by/4.0/).


