
Submitted:
25 September 2024
Posted:
26 September 2024
You are already at the latest version
Abstract
There is a global demand for alternative energy sources away from unsustainable fossil fuels. COP26 agreed that fossil fuels should be phased down; at COP27, anxiety about the cost and availability of energy was raised, and COP28 reiterated the phasedown of coal power. Solar technology in the form of Perovskite solar cells is one such alternative energy source. This article considers the fabrication of the Perovskite layer in a solar cell and postulates the extent to which Material Flow Cost Accounting (MFCA) could be used as a feasible costing method, among other things, to address byproduct and waste generation. Through MFCA, the monetary and physical flows of materials are identified and can be applied throughout the supply chain to facilitate affordability, from the extraction of the ore, transportation, fabrication of the chemicals, manufacturing and distribution of the solar cell and panels, and finally, the recycling of the panel. Informed by these observations, a conceptual framework for applying MFCA in fabricating the Perovskite layer in the supply chain is developed based on sets of qualitative propositions. Future work will be researching the processes of manufacturing solar cells, costing raw materials, energy flows, and solar cell manufacturing emissions.
Keywords:
Alternative energy sources
; costing
; frameworks
; greenhouse gas (GHG) emissions
; material flow cost accounting (MFCA)
; Perovskite solar cells
; propositions
; solar technology
1. Introduction
More than 55% of greenhouse gas (GHG) emissions and 40% of health-related impacts are caused by the extraction and processing of natural resources such as fossil fuels and minerals. One of the main applications of fossil fuels is the production of energy, and in this process, the demand for fossil fuels equals 65% of the total material demand, with the highest material footprint (72%) in high-income countries[1]. Furthermore, the United Nations (UN) indicated that the GHGs that act as a blanket that covers the Earth and traps the sun’s heat are the result of energy and heat generation from fossil fuels [2]. To keep track of emissions from all countries, the Conference of Parties (COP) was formed in 1995 [3]. This was followed by the development of the UN Sustainable Development Goals (SDGs) in 2015 to reduce poverty and hunger, and most of the effects of climate change. Two (2) of these SDGs form the basis for this research, namely 'Affordable and clean energy' (SDG #7) and ‘Climate action’ (SDG #13) [4] and is the basis of this article. [5] confirmed the importance of using renewable energy to achieve the SDGs when they established how significantly climate change promotes using renewable energy. A link between poverty, the SDGs, and renewable energy is made by [6] indicating that only a third of the people from Sub-Saharan Africa have electricity, and they argue that solar home systems might assist with supplying electricity to rural areas.
Reference [2] identified five (5) reasons why the transition to clean energy should be accelerated. Renewable sources that surround us are less expensive, healthier, create jobs and make economic sense. Furthermore, renewable energy is becoming more and more important in the global economy [7]. One of these renewable energy sources is solar, which includes photovoltaics (PV). However, to be able to serve the energy needs worldwide [8] predicted that a solar farm of 160,000 km2 in the Sahara Desert is needed, which, with present technologies, may not be economically feasible.
It stands to reason that the search for affordable and clean energy (SDG #7) initiatives would involve investigating feasible costing methods. One of these costing methods is using material flow cost accounting (MFCA) to analyse the flow of materials in manufacturing a product [9]. MFCA is one of the practices of environmental management accounting (EMA), which includes energy accounting (EA), water-management accounting (WMA), the sustainable balanced scorecard (SBSC), and carbon management accounting (CMA) [10]. These EMA divisions are not mutually exclusive; for example, MFCA is used with material and waste accounting, WMA, and CMA. Owing to its widespread application, this article focuses on using MFCA for perovskite costing.
The layout of the rest of the article is as follows: Following the research questions and objective in Section 1.1, the research methods for the article are discussed in Section 2. A literature review on perovskite solar cells and material flow cost accounting is presented in Section 3 being a precursor of our findings in Section 4, which considers the fabrication of the perovskite layer in the PSC, mining of the ore, transporting the chemicals and products, the recycling of a solar panel and material flow cost accounting as a plausible costing method in the fabrication of a Perovskite solar cell. This is followed by Section 5 with a discussion and conclusion in Section 6.
1.1. Research Questions and Objective
This article aims to identify the processes needed to manufacture and suggest a possible costing method for the Perovskite layer in a solar cell by developing a conceptual framework using qualitative propositions. The motivation for this article hinges on the need for affordable and clean energy and climate action per sustainable development goals, SDG#7 and #13. Consequently, the following research questions (RQ) are stated:
RQ1: Which chemicals are needed to fabricate a Perovskite layer in a solar cell?
RQ2: To what extent is material flow cost accounting (MFCA) a suitable costing method for fabricating the Perovskite solar cell layer throughout the supply chain?
Our objective is to:
RO: Develop a conceptual framework for perovskite solar cell costing through MFCA.
2. Materials and Methods
In the first part of this research, we provide a critical account of the processes and materials involved in fabricating the Perovskite layer in a solar cell. In the second part, we postulate that material flow cost accounting (MFCA) may be a relevant costing method. A costing framework is developed through three (3) sets of qualitative propositions to facilitate affordable and clean energy through perovskite solar technology in line with achieving SDG#7 and #13.
The researchers analysed the fabrication of a specific layer in a Perovskite solar cell to show the complete process and the cost of a solar panel. Naturally, the cost of any product plays an important role in the final capital layout of the buyer. The research analysed scholarly literature from chemistry and management accounting.
The propositions utilised in this work are of three (3) kinds [11]:
- Content propositions, denoted by Cpi, for i ∈ {1, 2, 3, …}. Content propositions identify elements (content) of entities, which are the building blocks in the framework.
- Association propositions, denoted by Apj, for j ∈ {1, 2, 3, …}. Association propositions define associations among the building blocks of the framework.
- Consequential propositions indicated by Cons_pk, for k ∈ {1, 2, 3, …}. Consequential propositions capture information of the form: if p then q.
Occasionally, intermediate forms of our propositions are suffixed with an alphabetic character after the proposition number to indicate that a proposition is enhanced through deeper analyses of the literature. Once a final version of a proposition is obtained, the alphabetic character is dropped. The formulation of propositions in the rest of this article illustrates this technique.
3. Literature Review
The global demand for fossil fuels for energy is unsustainable; hence, at COP26, [12] nations agreed that the use of fossil fuels should be phased down. COP27 followed this [13] where the cost and availability of energy were raised as concerns, and COP28 [14] reiterated that coal power should phase down. Between 1970 and 2020, the use of fossil fuels increased from 6.1 to 15.4 billion tonnes, while their global extraction decreased from 20% to 16%. While coal’s growth rate grew by 2.1%, natural gas grew by 2.8%, and petroleum by 1.3% due to the expansion of coal and gas power plants to generate electricity. Lower gas prices increased renewable energy sources, and improved energy efficacy contributed to the decrease in global coal consumption [15]. However, in 2022, the demand for coal again reached a record high by rising by 4% [16]. Hence, energy alternatives need to be identified to sustain the world's increasing energy demands, and one such alternative is solar cell technology.
The above discussions lead to our first content proposition:
-
Proposition Cp1: Worldwide dependence on fossil fuels should be reduced in favour of renewable energy sources, for example, solar cell technology, since.
- ➢
- The consumption of coal simulates a Gartner-Hype CycleTM since its global demand appears to have increased over the decades, decreased for a while, and then increased again.
There are three (3) generations of solar cell technology [17]. Reference [8] indicates that the first generation is the crystalline silicon (c-Si) or multi-crystalline silicon solar cells. Despite their high efficiency, low toxicity, and ruggedness, resulting in commercially being the most used commercially, their drawbacks are their expensiveness and a long energy payback time (EPBT). According to [18] Second-generation solar technology uses cells containing cadmium-telluride (CdTe), copper-indium-gallium-selenide (CIGS), or amorphous silicon (a-Si:H). These cells are less efficient than first-generation cells, but they are less costly to produce. Reference [8] argues that solar technology focuses on newly developed or experimental technologies (dye-sensitised solar cells (DSSC)) and perovskite solar cells (PSCs)) and is called the third generation. Reference [7] argues that Perovskites might transform PV while [19] indicated the fourth generation as inorganic nanostructures (metal oxides and metal nanoparticles) or organic-based nanomaterials (graphene, carbon nanotubes and graphene derivatives) with low flexibility or cost. In this article, we focus on the third generation, specifically the Perovskite layer.
During 2006 and 2009, research was done at laboratory level to develop a PSC device using perovskites in solar cell technology [20,21]. PSCs attracted much research owing to their ability to compete with the efficiency of first-generation solar technology. These PSCs have benefits, such as lower manufacturing costs and the ability to function in the shade; therefore, they are more flexible [8]. Also, [22] argued that PSCs perform better than dye-sensitized and quantum dot solar cells.
The above PSC discussion leads to a preliminary version of our next content proposition:
- Proposition Cp2a: Perovskite solar cells (PSCs) may be the technology of choice in embarking on solar cell technology.
According to [23] the materials to fabricate Perovskite solar cells are relatively inexpensive, and the processes are simple. They furthermore reported that the efficiencies of these devices increased over the years from 3.8% to 20.1%, and hence this technology can be the fastest-growing solar cell. This is supported by Figure 1, presenting that perovskite solar technology has grown in a shorter time to nearly the same efficiencies as silicon-based solar technology, first-generation solar cells [24]. This observation supports our proposition Cp2.
With an EPBT of a few months [25] distinguishes Perovskite materials from crystalline silicon solar panels with an EPBT of 1.5 to 4.4 years [26]. Due to Perovskite material's simple manufacturing processes at lower temperatures than the standard in the first and second generation of solar technology, they are paving the way for the fourth industrial revolution (4IR) [27] and the 6IR in the context of nanotechnology [28]. However, several other processes must be considered while manufacturing perovskite solar cells. These include the mining of ores, the production of reagent species, and finally, the manufacturing of the device, which may need to be systematically explored and considered in identifying a suitable costing practice.
The above aspects of the manufacturing of PVCs enhance an earlier proposition into its final formulation:
-
Proposition Cp2: In embarking on solar cell technology, perovskite solar cells (PSCs) may be the technology of choice based on the following advantages and disadvantages:
- ➢
- PSCs inhibit relatively simple manufacturing processes at lower temperatures.
- ➢
- Their manufacturing resides with Industry 4.0 technologies and exhibits aspects of the 6IR regarding renewable energy [28] and nanotechnology.
- ➢
- Their manufacturing supply chain involves mining raw materials, reagent species production, and device manufacturing.
The costing aspect of PSCs mentioned earlier in serving a worldwide demand leads to:
- Proposition Cp3: Should a worldwide demand for PSCs emerge, suitable costing methods should be devised and employed to make their manufacturing economically feasible.
In this article, we suggest using MFCA in response to proposition Cp3.
Figure 2 shows several layers of a typical Perovskite solar cell (a device). These layers include two (2) layers of fluorine-doped tin oxide (FTO), an electron transporting layer (ETL), a Perovskite layer, a hole transporting layer (HTL), and carbon, which acts as an electrode contact. These layers are deposited on top of each other to build the device.
During the manufacturing process, the layers are deposited individually. This research focused on the production of the perovskite layer, specifically that of a methyl ammonium lead tri-iodide perovskite (MAPbI3 or CH3NH3PbI3). Therefore, the findings considered the production of all the chemicals used in the synthesis and deposition of this perovskite, and cost considerations in manufacturing a PSC cell in response to proposition Cp3 above.
4. Findings
In the following sub-sections, the fabrication of the Perovskite layer in the PSC is detailed, followed by a discussion of MFCA as a possible costing method.
4.1. Fabrication of the Perovskite Layer in the PSC
Several fabrication techniques may be employed in the manufacturing of PSCs. However, because of how easily the complexity the study scales, only the so-called one-step [21] and two-step [29] spin coating methods will be considered for a typical perovskite material, methylammonium lead iodide (CH3NH3PbI3(s), MAPbI3). These methods require the same instrumentation, a spray coater, and a heat source.
In the one-step method, the precursor mixture of lead iodide (PbI2) and Methylammonium halides (CH3NH3I) is dissolved in dimethylformamide (DMF, C2H7ON) and deposited onto the film to form the perovskite layer. PbI2 is first dissolved in DMF in the two-step method and deposited solely. Subsequently, CH3NH3I is dissolved in isopropyl alcohol (IPA, C3H8O) and deposited [21,29,30]. After the deposition(s) are complete, the film is annealed at 80○C for 15 minutes. Naturally, the one-step and two-step processes may incur different costs. A summary of the main materials involved in the fabrication of the Perovskite layer is presented in Figure 3.
The processes in Figure 3 are indicated from the bottom up, resulting in the top material the perovskite, MAPbI3. To enhance clarity, not all chemicals and waste products are included. We note some branches of the chemical process which can be conducted in parallel. This observation leads to our first association proposition:
-
Proposition Ap1: The fabrication of a PSC involves two or more groups of processes that may be executed in parallel:
- ➢
- Parallel execution may incur cost savings in placing a product on the market but may necessitate two or more sets of personnel to oversee each process.
Proposition Ap1 informs two sets of parallel processes, as indicated in Figure 3—from the bottom up, we have two parallel processes indicated by proposition Ap1 as a green double arrow and another set of parallel processes higher up between the green group and the yellow group, also indicated by Ap1.
Next, we analyse the individual processes in Figure 3 to produce MAPbI3. As shown in Equation (1) (Refer to Annexure A), acidification of the neutral amine is required.
CH3NH2 (aq) + HI (aq) → CH3NH3I (s)
As indicated in Figure 3, water (H2O) is used as a solvent because the reaction is completed in aqueous conditions. The chemicals required for the one-step method include CH3NH2, HI, H2O, PbI2, and C2H7ON, and for the two-step method, all those included for the one-step method, with the addition of C3H8O, leading to a proposition on cost saving:
- Proposition Cp4: The one-step method for fabricating PSCs may be preferred since the compound C3H8O is not needed, leading to reduced costs.
Based on proposition Cp4, the specific chemicals and processes must be further investigated for their origins, individual costing, and waste management.
4.1.1. Production of the Chemicals
This section explores the production of each of the seven (7) chemicals used in the one- or two-step method described earlier. The production of each chemical is to be traced back to the origin of the naturally obtainable components. For each chemical reaction below an observation is made about possible costing considerations.
Distilled water (H2O): Steam distillation or filtration of any water source is necessary [31] for purification before being ready for use.
Hydrogen Iodide (HI): the reaction between iodine (I2) and hydrazine (N2H4) as per Equation (2) (Annexure A) [32] occurs in industrial production, i.e., manufacturing.
2 I2 (aq) + N2H4 (aq) → 4 HI (aq) + N2 (g)
Nitrogen gas is produced as a by-product.
-
Iodine (I2) is sourced from natural brines or caliche ore deposits [33,34]. Iodine from brines can be purified immediately; however, iodine from an ore deposit is first leached through water and further purified.We make the following observation:
- ❖
- Observation #1: Reaction (2) involves several activities, stakeholders, and associated costs, namely, mining of ore, e.g., Iodine, transport of raw materials to the factory or laboratory, and fabrication of the relevant materials. Typical waste, e.g., acid mine drainage (AMD), occurs during the mining operations [35,36]. Naturally, the wages and salaries of the mine personnel add to the cost of the reaction.
-
Hydrazine (N2H4): In the industrial production of hydrazine, the peroxide process uses a combination of ammonia (NH3) with hydrogen peroxide (H2O2) in the presence of a ketone catalyst (butane-2-one) to form hydrazine [37]. Equation (3) (Annexure A) shows that water is produced as a by-product and that ammonia, hydrogen peroxide, and butane-2-one should be produced for this synthesis to be viable.
- ❖
- Observation #2: Augmenting observation #1, the formation of N2H4 occurs in a factory, leading to industrial waste and greenhouse gasses [10]. The transport costs involve moving the product from the factory to the laboratory, and the remuneration of the personnel involved adds to the cost of the product.
As per Figure 3, reaction (3) occurs next:
- Ammonia: the Haber-Bosch process [38] is almost exclusively used in the industrial production of ammonia. Equation (4) (Annexure A) gives the Haber-Bosch process.
Nitrogen gas, hydrogen gas, and iron are required in the production of ammonia.
-
Nitrogen gas (N2): By purifying air, which contains 78% nitrogen [32], nitrogen is obtained on an industrial scale. We observe the following:
- ❖
- Observation #3: The cost of reaction (4) regarding forming nitrogen gas stems from manufacturing or fabrication costs.
- Hydrogen gas (H2): is produced from the steam reforming of natural gas, coal gasification, or the partial oxidation of other hydrocarbons [39]. A similar observation as in observation #3 may be made for nitrogen gas formation.
- An Iron catalyst is used in the form of magnetite (Fe3O4) from iron ores [40]. Observations #1, #2, and #3 also hold here due to the underlying mining and manufacturing processes.
- Hydrogen peroxide: Produced by the anthraquinone process using an anthraquinone derivative and palladium (a catalyst) through a hydrogenation reaction in the presence of oxygen. This process is shown in Equation (5) (Annexure A).
- Oxygen gas is distilled from the air in oxygen plants [41]. Consequently, this process is relatively inexpensive.
- Anthraquinone derivative: Anthraquinone is synthesised by acid catalysis of styrene [42]. Styrene can be obtained from the dehydrogenation of ethylbenzene over an iron oxide catalyst, which is obtained from the refining of crude oil [43]. This process may be costly; hence, observations #1, #2, and #3 hold.
- Palladium (Pd) is obtained from cooperite and polarite minerals. The usual mining and related processes apply here, leading to observations #1, #2, and #3.
- Butan-2-one (a catalyst): Synthesis starts with the oxidation of butan-2-ol using potassium permanganate (KMnO4). KMnO4 is produced through the process in Equation (6) (Annexure A) [44].
Reaction (6) involves several elements and compounds and embodies mining and specialised manufacturing processes, leading to observations #1, #2, and #3 as before.
Up to now, all the reagents except the potassium hydroxide (KOH) have been discussed.
- Potassium hydroxide: is produced from potassium chloride and electrolysis as per equation (7) (Annexure A) [45].
2 KCl (aq) + 2 H2O (l) → 2 KOH (aq) + Cl2 (g) + H2 (g)
- Potassium chloride (KCl): is obtained from underground mines. Underground deposits of sylvinite, carnallite, or potash are mined, and KCl is extracted [45]. Butan-2-ol is produced from the acid-catalysed (Sulfuric Acid, H2SO4) hydration (use of water) of but-1-ene or but-2-ene (both of which are obtained from the cracking of crude oil) [46]. In turn, H2SO4 is obtained from the contact process, which requires sulphur (S (s)) and oxygen (O2 (g)) [47]. Reaction (7) likewise involves several processes, including mining and manufacturing, leading to observations #1, #2, and #3.
Lead Iodide (PbI2): Lead iodide is formed from the ion exchange reaction between lead nitrate and potassium iodide [48] (Equation (8) – Annexure A).
Pb(NO3)2 (aq) + 2 KI (aq) → PbI2 (s) + 2 KNO3 (aq)
- Potassium iodide: Produced by the reaction of KOH with HI, discussed earlier [45].
- Lead nitrate: Formed by the reaction of lead oxide (PbO) and nitric acid (HNO3) according to equation (9) (Annexure A) [32].
PbO (aq) + 2 HNO3 (aq) → Pb(NO3)2 (aq) + H2O (l)
Regarding equation (9), the origins of PbO and HNO3 need further investigation.
- Nitric acid: Produced through the Ostwald process in Equation (10) (Annexure A), where all the reagent production has already been discussed.
2 NH3 (g) + 4 O2 (g) + H2O (l) → 3 H2O (g) + 2 HNO3 (aq)
Equation (10) involves mostly manufacturing; hence, observation #3 is applicable.
- Methyl Amine (CH3NH2) is synthesised through the reaction of ammonia with methanol in the presence of an aluminium silicate catalyst, as shown in Equation (11) (Annexure A) [50].
- Ammonia has been discussed before.
- Kaolinite (a clay mineral, Al2Si2O5(OH)4, the catalyst): Obtained from mining minerals such as feldspar [32]. Owing to manufacturing processes, observation 3 applies.
- Methanol: Produced from the combination of syngas (H2 and O2 gas combined) and CO or CO2 via a hydrogenation reaction as per Equation (12) (Annexure A) [51].
3 H2 (g) + CO (g) → CH3OH (l)
3 H2 (g) + CO2 (g) → CH3OH (l) + H2O (l)
Equations (12) and (13) describe similar processes, but since equation (12) does not produce water as a byproduct, it would usually be preferred over equation (13). That said, water as a byproduct may reduce overall cost as per proposition Cp5 (refer below).
- CO and CO2: Obtained from burning natural gas or hydrocarbons [52].
Dimethylformamide (C2H7ON): Requires the reaction of dimethylamine ((CH3)2NH) with carbon dioxide (CO2) in the presence of a zinc chloride catalyst [53].
- Dimethylamine: Produced by the reaction between methanol and ammonia (Equation (14) – Annexure A), all of which have been described earlier.
NH3 (aq) + CH3OH (l) → (CH3)2NH (aq) + 2H2O (l)
Equation (14) involves manufacturing; hence, observation #3 applies.
Additionally, we have, as per Figure 3:
- Zinc chloride catalyst (ZnCl2): Reacting the zinc metal (Zn (s)) with hydrochloric acid (HCl (aq), producing the catalyst and water as a by-product.
- HCl: Reaction between hydrogen and chlorine gas [47].
- Chlorine gas is obtained from the electrolysis of brine (NaCl and KCl solution) to release Cl2 gas [54].
- Isopropyl Alcohol (C3H8O): The hydration of propene, using sulphuric acid as a catalyst, is the main industrial method of synthesis for isopropyl alcohol [55].
- Propene: Obtained by steam cracking and fractional distillation of saturated hydrocarbons obtained from natural gas and crude oil [55].
In each of the processes above, a selection of mining, manufacturing, and laboratory sectors are involved. Either byproducts or waste occurs, and transporting the raw product and chemical compounds to the fabrication site is involved.
From the above discussions, the following propositions emerge.
-
Proposition Cp5: The chemical processes towards the fabrication of PSCs lead to the generation of additional compounds:
- ➢
- Byproducts, such as water or nitrogen, result, and these may be sold or used in other processes, reducing the cost of the process.
- ➢
- Waste, e.g., acid mine drainage (AMD), may be recycled and reused.
Linking with the waste aspect in proposition Cp5, we note that mining operations have other severe environmental effects, e.g., water and soil pollution, which should be addressed [36].
-
Proposition Cp6: The supply chain of chemical processes involves materials from mining, fabrication in a factory, and laboratory processes.
- ➢
- A costing method is needed for each process to follow the material flow of each product and chemical substance and quantify it in physical and monetary units.
The discussion in Section 3.1 answers our RQ1: Which chemicals are needed to fabricate a Perovskite layer in a solar cell?
Next, we consider aspects of mining the ore, transportation, recycling and MFCA.
4.2. Mining of Ore
To fabricate a Perovskite layer, some of the raw materials need to be mined, such as Iodine from caliche ore deposits [33,34], Magnetite from iron ores [40], and lead from Galena [49]. During the mining of ore, operating costs are incurred, such as mining and milling (technical operating costs of a given mining project, characterised by equipment operation and maintenance, electricity and fuel use, chemicals, and technical personnel) and general and administrative (management of personnel, legal and accounting costs, and logistics in addition to other miscellaneous non-technical expenses) [56]. According to [56], the type of mining, milling, and mineral influence the costing.
The above discussion leads to our next content proposition:
- Proposition Cp7: The cost of mining ore can, amongst others, be divided into mining and milling; resources, e.g., electricity and fuel; administrative, e.g., wages and salaries of personnel; logistics; general; and miscellaneous expenses.
And an association proposition:
- Proposition Ap2: The types of mining, milling and mineral recovery affect the cost of the rest of the supply chain.
4.3. Transporting the Raw Materials, Products, and Chemicals
Once the raw materials are mined, they are transported to the factory, where compounds are chemically fabricated. The chemical is subsequently transported to the manufacturing plant or laboratory where the solar cell and later the solar panel are manufactured, and lastly the solar panel is transported to the distributor and customer. In this supply chain, costs are involved in transportation and CO2 emissions also become a challenge. Hence, [57] recommended shorter routes between mines and manufacturers. This might not always be suitable and achievable. According to [58] transport costs of goods can make up 10% of the cost of a product, leading to:
- Proposition Cp8: The shortest route in transporting chemicals and products should be established to reduce CO2 emissions and costs.
4.4. Recycling of Perovskite Modules
Part of a solar cell's environmental footprint that needs to be considered is when it needs to be deconstructed at the end of its life [59]. Reusable parts of the module are identified and removed, whereas parts that are not reusable will be introduced into the environment [60]. The economic, environmental, social, and technological sectors must keep electronic waste from entering landfills through recycling [59], leading to:
- Proposition Cp9: Costing all end-of-life processes is important since the business that sold the solar panel and the customer might not be the only responsible parties.
4.5. Material Flow Cost Accounting, a Match for Perovskite Solar Cell Fabrication
Stakeholders pressure companies to reduce their negative environmental footprints, such as the use and availability of scarce natural resources and energy and emitting emissions. Although renewable energy sources could avert the global energy crisis, the challenge for managers and accounting professionals lies within their recognition and measurement [61]. Specialised accounting systems were developed to assist management in addressing emissions, waste, and the use of limited natural resources. Hence, environmental management accounting (EMA) was developed with materials and energy accounting and reporting as a subset of accounting to identify environmental costs during manufacturing.
EMA consists of various environmental management accounting practices (EMAPs) and two (2) branches, monitoring the monetary (MEMA) and physical flows (PEMA) [62] during production, have been developed. Managing the physical and the monetary flows in production results in costing a product being interdisciplinary [63] since management accountants (monetary) and engineers and technicians (physical) monitor the flow of material, water, and electricity. Despite numerous cost accounting practices, a practice that monitors the flow of materials, energy, and waste in a physical and monetary form might be the answer. Material flow cost accounting (MFCA) is one such practice also tracing waste, emissions, and nonproducts while simultaneously increasing the company’s economic and environmental performance [9].
MFCA is based on four (4) principles: understand material flow and energy use; link physical and monetary data; ensure accuracy, completeness, and comparability of physical data; and estimate and assign costs to material losses [9]. The four (4) fundamentals of MFCA are: quantity centres where material balances are calculated in physical and monetary units; material balances of inputs and outputs in physical units are measured to identify inefficiencies (raw materials (input) become the end product and waste (output)); cost calculations (material, energy, system, and waste management costs); and a material loss flow model should be developed to represent the process visually. It shows all the quantity centres where the materials are transformed, stored, or used and the flow of these materials within the system's boundary.
Reference [9] argues that waste generation should be reduced, thereby increasing resource use and cost efficiency. MFCA, an ISO [64] standard, is identified as a possibility to reduce waste in the Perovskite level fabrication process of a solar cell, as MFCA focuses on reducing waste at the source [65]. One of the processes in the fabrication of the Perovskite level of the solar cell results in up to 90% of the material used being wasted in the spin coating [59]. Furthermore, hidden waste recovery costs could also be identified through MFCA [65]. MFCA can also be employed within the entire supply chain according to [9].
Consequently, we arrive at two (2) content propositions (one in preliminary form) and a consequential proposition:
- Proposition Cp10a: MFCA traces and quantifies the flow of materials and attempts to reduce waste at the source.
- Proposition Cons_p1: An MFCA waste recovery strategy to reduce an industry's environmental impact and improve its economic performance facilitates waste reduction during fabrication.
- Proposition Cp11: MFCA can be employed to cost the perovskite fabrication supply chain.
According to [59], each photovoltaic (PV) module has environmental, ecological, and economic costs during fabrication, use, and disposal. Therefore, during the fabrication of the Perovskite layer the following should be measured: raw materials, solvents, gases, and electrical and heat energies. A utilisation rate is established and can assist in identifying waste [59]; hence, an EMAP such as MFCA may be most suitable. However, [66] rejected the opinion that one EMAP is the answer to complex manufacturing processes. Therefore, it is plausible that more than one EMAP may need to be identified and utilised.
The above discussion on MFCA finalises an earlier proposition as follows:
-
Proposition Cp10: MFCA traces and quantifies the flow of materials. It:
- ➢
- aims to reduce waste at the source;
- ➢
- assists in measuring materials, solvents, gases, and electrical and heat energies in fabricating the Perovskite layer.
Reference [67] analysed 73 case studies and identified the following three (3) top reasons why companies employed MFCA for economic (such as reduction of costs or identification of hidden costs), environmental (such as reduction of waste or reduction of environmental impact) and organisational reasons (such as using MFCA as a tool to enhance quality or improving processes). These reasons lead to:
-
Proposition Cp11: MFCA can:
- ➢
- reduce costs (more economical solar panels),
- ➢
- reduce waste and environmental impacts (sustainable alternative energy), and
- ➢
- enhance quality and improvement of processes (leading to improved solar panels).
According to the ISO14051 standard [64], all industries that use materials and energy of any type and scale, with or without environmental management systems, can use MFCA (Clause 1, ISO 14051:2011). MFCA measures inventory levels and material flows, and materials include all raw materials, parts, and components. Material losses can be viewed as waste, air emissions, and wastewater [9]. Resource use and cost efficiency can increase, and waste production decreases using MFCA as waste and resource losses occur at any step in a process [9]. Waste and resource losses include material loss during the process, defective products, and impurities. For instance, materials can remain in laboratory equipment during spin coating following set-ups. Auxiliary materials such as solvents, detergents for washing equipment, and water can also be identified. Lastly, raw material that becomes unusable during the process is also viewed as a material loss.
The above discussions lead to:
- Proposition Cp12: MFCA can measure material loss and residue in laboratory equipment during a process and identify auxiliary materials.
The implementation of MFCA involves five (5) steps: engaging management and determining roles and responsibilities; setting the scope and boundary of the process and establishing a material flow model; allocating costs; interpreting and communicating the MFCA results; and improving production practices and reducing material loss using MFCA [9]. Therefore, it is important to secure management's buy-in from the start.
The discussions in Section 4.3, Section 4.4 and Section 4.5 answer our RQ2: To what extent is material flow cost accounting (MFCA) a suitable costing method for fabricating the Perovskite solar cell layer in the supply chain?
5. Discussion
The article's main aim is to establish the suitability of MFCA in the production of Perovskite Solar cells and, ultimately, the solar panel, considering the entire supply chain, and develop a costing framework for these. It was proposed that byproducts be sold or used in other processes to recover costs and save on material use. Furthermore, waste that originates from the fabrication can be recycled and reused. It was established that for each process, from mining the ore up to the recycling of the Perovskite module, a costing method is needed to follow the material flow of each chemical and product and quantify it in physical and monetary units.
The cost of ore mining can be divided into mining and milling, general, and administrative. However, the type of mining, milling, and mineral influence the cost. To lessen the transport costs, the shortest route for transporting chemicals and products might need to be established to minimise CO2 emissions and costs. The costing of all end-of-life processes is important since the business that sold the solar panel and the customer who bought those might not be the only responsible parties.
Since MFCA traces and quantifies the flow of materials, waste reduction may be achieved during fabrication if a waste recovery strategy to reduce the environmental impact and improve the economic performance of any industry is in place. It was also deduced that MFCA can be employed within the entire supply chain to fabricate the Perovskite layer. Furthermore, MFCA can assist in measuring materials, solvents, gases, and electrical and heat energies in fabricating the Perovskite layer. MFCA can reduce costs (more economical solar panels) and waste and environmental impacts (sustainable alternative energy); and enhance quality and improvement of processes (leading to an improved solar panel). Lastly, MFCA can measure residue in laboratory equipment and identify auxiliary materials.
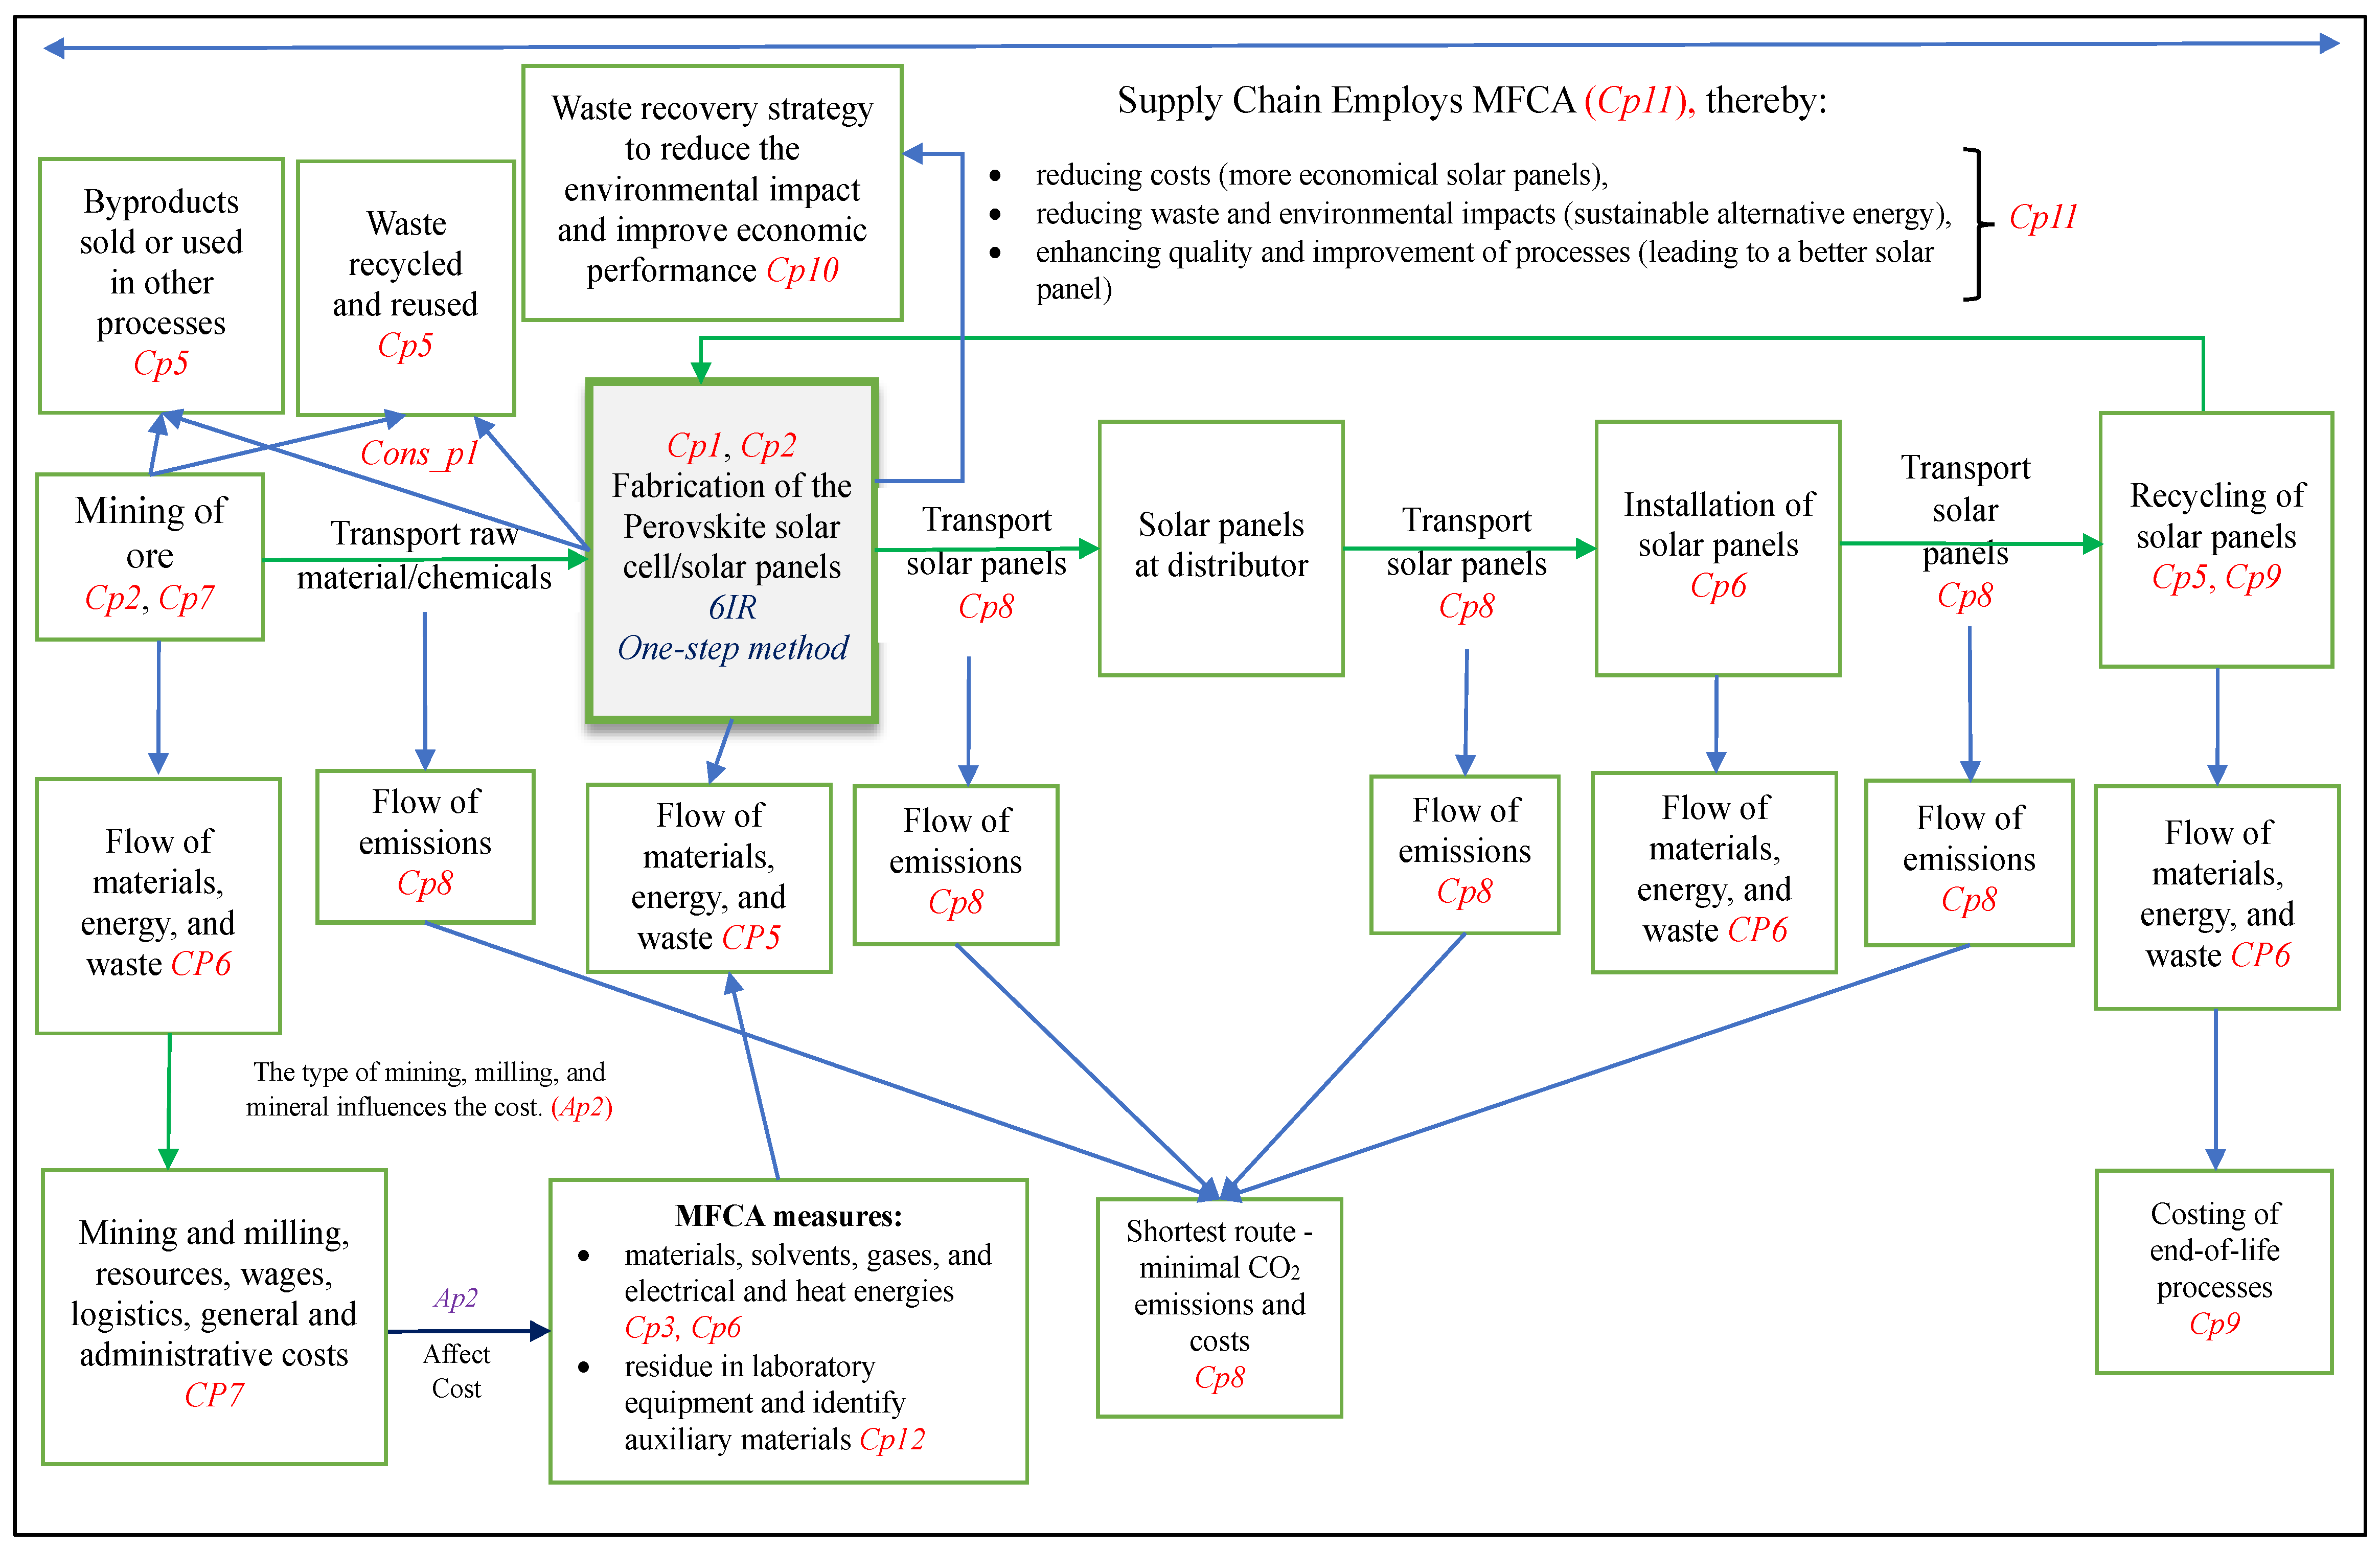
Based on the three (3) sets of propositions, the framework presented in Figure 4 was developed to apply MFCA in the supply chain fabrication of the Perovskite layer.
6. Discussion
The framework in Figure 4 depicts several entities linked through associations. Association Ap2 depicts a link between mining and milling aspects, on the one hand, and MFCA measures, as discussed above. Several other associations are depicted in the framework but not labelled. These have been identified through inspection of interactions among the entities in the framework. The content propositions have been included in the respective entities, and the consequential proposition has been indicated as a consequence, where applicable.
The framework in Figure 3, gone before, is embedded in the entity “Fabrication of the Perovskite solar cell/solar panels,” as informed by propositions Cp1 and Cp2. The content of the framework displays the supply chain character of the processes described in this article. Aspects embedded in the framework are mining, milling, flow of materials and emissions, waste and byproduct generation, transport, fabrication of the perovskite, and MFCA costing.
7. Conclusions
The mining of the ore is the starting point to produce reagent species, the fabrication of Perovskite solar cells, and finally, the device itself. Therefore, raw materials (input) costs influence the final cost of the solar cell and the solar panel. The manufacturer may not be able to influence the cost of the raw materials; however, these costs influence the cost of the final product. Therefore, the whole supply chain, from mining the ore, developing the chemicals, transporting the raw materials, chemicals, and the final product, should be viewed as part of the fabrication of the solar cell to facilitate the affordability of the solar cell. Therefore, we recommend that MFCA be applied throughout the supply chain to make the product affordable. The recommendation is based on reducing waste, recycling, and reuse within the different processes by identifying monetary and physical flows of material, energy, emissions, and waste. A further recommendation is that when a solar panel reaches the end of its life, the manufacturer should recycle the product, yet it is a complex process. Future research will need in-depth research on costing relevant raw materials, energy flow, and emissions from solar cell manufacturing and each process for each solar cell level.
Author Contributions
HJvdP and HMvdP conceptualised the article and did the formal analysis of the sections. Investigation: HJvdP and HMvdP. The chemistry sections were written by HJvdP and the environmental management accounting sections by HMvdP. Methodology: HMvdP and JAvdP. Project administration: HMvdP and JAvdP. Resources: HJvdP, HMvdP and JAvdP. Validation: HJvdP, HMvdP and JAvdP. Visualisation: Figure 1 and Figure 2 were sourced and prepared by HJvdP and figures 3 and 4 were prepared by HJvdP, HMvdP, and JAvdP. HJvdP and HMvdP wrote the original draft; Revision and analysis: HJ vdP, HMvdP and JAvdP. All three (3) authors reviewed and edited the final manuscript.
Funding
This research was funded by the University of South Africa (Unisa), the University of Pretoria (UP), and the third author's Unisa Research Professor fund.
Data Availability Statement
Data are contained within the article.
Acknowledgments
In this section, you can acknowledge any support given which is not covered by the author contribution or funding sections. This may include administrative and technical support, or donations in kind (e.g., materials used for experiments).
Conflicts of Interest
The authors declare no conflicts of interest.
Appendix A. Production of Chemicals
This table provides the equations for producing each of the seven (7) chemicals used in the one—or two-step method described earlier.
| Chemical | Equation | By-products |
| CH3NH3I | CH3NH2 (aq) + HI (aq) → CH3NH3I (s) (1) | |
| Hydrogen Iodide (HI) | 2 I2 (aq) + N2H4 (aq) 4 HI (aq) + N2 (g) (2) | Nitrogen gas (N2) |
| Iodine (Eq2) | 2 NH3 (g) + H2O2 (aq) N2H4 (aq) + 2 H2O (l) (3) | Water |
| 2 NH3 (g) (4) | ||
| Nitrogen gas, hydrogen gas and iron (Eq4) | H2O2 (aq) (5) | |
| 2 MnO2 (aq)+ 4 KOH (aq) + O2 (g) 2 KMnO4 (aq) + 2 KOH (aq) + H2 (g) (6) | ||
| 2 KCl (aq) + 2 H2O (l) 2 KOH (aq) + Cl2 (g) + H2 (g) (7) | ||
| Lead Iodide (PbI2) | Pb(NO3)2 (aq) + 2 KI (aq) PbI2 (s) + 2 KNO3 (aq) (8) | |
| PbO (aq) + 2 HNO3 (aq) Pb(NO3)2 (aq) + H2O (l) (9) | ||
| 2 NH3 (g) + 4 O2 (g) + H2O (l) 3 H2O (g) + 2 HNO3 (aq) (10) | ||
| Methyl Amine (CH3NH2) | NH3 (aq) + CH3OH (l) H2O (l) + CH3NH2 (aq) (11) | |
| 3 H2 (g) + CO (g) CH3OH (l) (12) 3 H2 (g) + CO2 (g) CH3OH (l) + H2O (l) (13) |
||
| Dimethylformamide (C2H7ON) | NH3 (aq) + CH3OH (l) → 2H2O (l) + (CH3)2NH (aq) (14) |
References
- United Nations Environment Programme International Resource Panel Global Resources Outlook 2024 - Bend the trend Pathways to a liveable planet as resource use spikes. United Nations Environment Programme 2024.
- Renewable energy – powering a safer future. Available online: https://www.un.org/en/climatechange/raising-ambition/renewable-energy (Accessed on 13 May 2024).
- Conference of Parties (COP). Available online: https://unfccc.int/process/bodies/supreme-bodies/conference-of-the-parties-cop (Accessed on 5 April 2024).
- United Nations Development Programme Sustainable Development Goals Booklet. Sustainable Development Goals 2015.
- Yi, R.; Chen, A. Blessing or curse energy sustainability: how does climate change affect renewable energy consumption in China? Environment, Development and Sustainability 2024, 24. [CrossRef]
- Adwek, G.; Boxiong, S.; Ndolo, O.O.; Siagi, Z.O.; Chepsaigutt, C.; Kenmunto, C.M.; Arowo, M.; Shimmon, J.; Simiyu, P.; Yabo, A.C. The solar energy access in Kenya: a review focusing on Pay-As-You-Go solar home system. Environment, Development and Sustainability 2020, 22, 3897–3938. [CrossRef]
- Igliński, B.; Skrzatek, M.; Kujawski, W.; Cichosz, M.; Buczkowski, R. SWOT analysis of renewable energy sector in Mazowieckie Voivodeship (Poland): current progress, prospects and policy implications. Environment, Development and Sustainability 2022, 24, 77–111. [CrossRef]
- Fakharuddin, A.; Jose, R.; Brown, T.M.; Fabregat-Santiago, F.; Bisquert, J. A perspective on the production of dye-sensitized solar modules. Energy Environ Sci 2014, 7, 3952. [CrossRef]
- Bhardwaj, K.D. Manual on Material Flow Cost Accounting: ISO14051-2014. Asian Productivity Organization (APO) 2014, 37.
- Lee, K.; Gunarathne, N. An exploration of the implementation and usefulness of environmental management accounting: A comparative study between Australia and Sri Lanka. CIMA Research Executive Summary 2019, 15, 1–26 Available online: https://www.aicpa-cima.com/resources/download/an-exploration-of-the-implementation-and-usefulness-of-environmental.
- van der Poll, J.A.; van der Poll, H.M. Assisting postgraduate students to synthesise qualitative propositions to develop a conceptual framework. J New Gener Sci 2023, 21, 146–158. Available online: https://hdl.handle.net/10520/ejc-newgen-v21-n1-a13.
- COP26: Together for our planet. Available online: https://www.un.org/en/climatechange/cop26 (Accessed on 16 April 2024).
- Green, F.; van Asselt, H. Opinion: COP27 flinched on phasing out ‘all fossil fuels’. What’s next? 2022.
- COP 28: What Was Achieved and What Happens Next? Available online: https://unfccc.int/cop28/5-key-takeaways#end-of-fossil-fuels (Accessed on 16 April 2024).
- International Energy Agency World Energy Outlook 2017. International Energy Agency 2017, 1–782.
- International Energy Agency Coal 2023: Analysis and forecast to 2026. International Energy Agency 2023, 1–130.
- Ng, C.H.; Lim, H.N.; Hayase, S.; Zainal, Z.; Huang, N.M. Photovoltaic performances of mono- and mixed-halide structures for perovskite solar cell: A review. Renewable and Sustainable Energy Reviews 2018, 90, 248–274. Available online: https://www.sciencedirect.com/science/article/pii/S1364032118301102. [CrossRef]
- Meillaud, F.; Boccard, M.; Bugnon, G.; Despeisse, M.; Ha, S.; Haug, F.-.; Persoz, J.; Schu, J.-.; Ttauf, ¨.; Stuckelberger, M.; Ballif, C. Recent advances and remaining challenges in thin-film silicon photovoltaic technology. Materials Today 2015, 18, 378–384. [CrossRef]
- Hegedus, S.; Luque, A. Achievements and Challenges of Solar Electricity from Photovoltaics. In Handbook of Photovoltaic Science and Engineering2010; pp. 1–38.
- Ikeda, N.; Teshima, K.; Miyasaka, T. Conductive polymer–carbon–imidazolium composite: a simple means for constructing solid-state dye-sensitized solar cells. Chem Commun 2006, 16, 1733–1735. [CrossRef]
- Kojima, A.; Teshima, K.; Shirai, Y.; Miyasaka, T. Organometal Halide Perovskites as Visible-Light Sensitizers for Photovoltaic Cells. J Am Chem Soc 2009, 131, 6050–6051. [CrossRef]
- Adams, G.R.; Okoli, O.I. A review of perovskite solar cells with a focus on wire-shaped devices. Renewable Energy Focus 2018, 25, 17–23. Available online: https://www.sciencedirect.com/science/article/pii/S1755008417300169. [CrossRef]
- Onwubiko, I.; Khan, W.S.; Subeshan, B.; Asmatulu, R. Investigating the effects of carbon-based counter electrode layers on the efficiency of hole-transporter-free perovskite solar cells. Energy Ecol Environ 2020, 5, 141–152. [CrossRef]
- National Renewable Energy Laboratory Best Research-Cell Efficiency Chart. 2024.
- Kim, B.J.; Kim, D.H.; Kwon, S.L.; Park, S.Y.; Li, Z.; Zhu, K.; Jung, H.S. Selective dissolution of halide perovskites as a step towards recycling solar cells. Nat Commun 2016, 7, 11735. [CrossRef]
- Zuser, A.; Rechberger, H. Considerations of resource availability in technology development strategies: The case study of photovoltaics. Resources, Conservation and Recycling 2011, 56, 56–65. [CrossRef]
- Jena, A.K.; Kulkarni, A.; Miyasaka, T. Halide Perovskite Photovoltaics: Background, Status, and FutureProspects. Chem Rev 2019, 119, 3036–3103. [CrossRef]
- Duggal, A.S.; Malik, P.K.; Gehlot, A.; Singh, R.; Gaba, G.S.; Masud, M.; Al-Amri, J. A sequential roadmap to Industry 6.0: Exploring future manufacturing trends. IET Commun 2022, 16, 521–531. [CrossRef]
- Laalioui, S.; Alaoui, K.B.; Dads, H.A.; Assali, K.E.; Ikken, B.; Outzourhit, A. Progress in perovskite based solar cells: scientific and engineering state of the art. Rev Adv Mater Sci 2020, 59. [CrossRef]
- Patwardhan, S.; Cao, D.H.; Hatch, S.; Farha, O.K.; Hupp, J.T.; Kanatzidis, M.G.; Schatz, G.C. Introducing Perovskite Solar Cells to Undergraduates. J Phys Chem Lett 2015, 6, 251–255. [CrossRef]
- Taylor, F.S. The evolution of the still. Ann Sci 1945, 5, 185–202. [CrossRef]
- Greenwood, N.N.; Earnshaw, A. Chemistry of the Elements, 2nd ed.; Butterworth-Heinemann: Oxford, 1997; pp. 1–1384.
- Krukowski, S.T.; Johnson, K.S. Iodine. In Industrial Minerals & Rocks: Commodities, Markets, and Uses; Kogel, J.E.; Trivedi, N.C.; Barker, J.M.; Krukowski, S.T., Eds.; Society for Mining, Metallurgy and Exploration: Englewood, Colorado, 2006; pp. 1–1548.
- Maekawa, T.; Igari, S.; Kaneko, N. Chemical and isotopic compositions of brines from dissolved-in-water type natural gas fields in Chiba, Japan. Geochem J 2006, 40, 475–484. [CrossRef]
- Mbedzi, M.D.; Van Der Poll, H.M.; Van Der Poll, J.A. Enhancing a Decision-Making Framework to Address Environmental Impacts of the South African Coalmining Industry. Energies 2020, 13, 1–23. [CrossRef]
- Nyakuwanika, M.; Van Der Poll, H.M.; Van Der Poll, J.A. A Conceptual Framework for Greener Goldmining through Environmental Management Accounting Practices (EMAPs): The Case of Zimbabwe. Sustainability 2021, 13, 1026. [CrossRef]
- Schirmann, J.; Bourdauducq, P. Hydrazine. Ullmann's Encycl Ind Chem 2001, 18, 79–96. [CrossRef]
- Appl, M. Ammonia. Ullmann's Encycl Ind Chem 2011, 3, 107–137. [CrossRef]
- Subramani, V.; Sharma, P.; Zhang, L.; Liu, K. Catalytic Steam Reforming Technology for the Production of Hydrogen and Syngas. In Hydrogen and Syngas Production and Purification Technologies; Liu, K.; Song, C.; Subramani, V., Eds.; Wiley: Hoboken, New Jersey, 2009; pp. 14–126.
- Magnetite. Available online: http://webmineral.com/data/Magnetite.shtml (Accessed on 20 March 2023).
- Drnevich, R.F.; Ecelbarger, E.J.; Portzer, J.W. Industrial Oxygen Plants: A TechnologyOverview for Users of Coal Gasification-Combined-Cycle Systems. U.S. Department of Energy Office of Scientific and Technical Information 1981, 6632782, 1–96.
- Vogel, A. Anthraquinone. Ullmann's Encycl Ind Chem 2000, 3, 503–511. [CrossRef]
- Lee, E.H. Iron Oxide Catalysts for Dehydrogenation of Ethylbenzene in the Presence of Steam. Catalysis Reviews 1974, 8, 285–305. [CrossRef]
- Reidies, A.H. Manganese Compounds. Ullmann's Encycl Ind Chem 2000, 22, 223–244. [CrossRef]
- Schultz, H.; Bauer, G.; Schachl, E.; Hagedorn, F.; Schmittinger, P. Potassium Compounds. Ullmann's Encycl Ind Chem 2000, 29, 639–704. [CrossRef]
- Mazoyer, E.; Szeto, K.C.; Basset, J.; Nicholas, C.P.; Taoufik, M. High selectivity production of propylene from 2-butene: non-degenerate pathways to convert symmetric olefins via olefin metathesis. Chem Commun 2012, 48, 3611–3613. [CrossRef]
- Green, D.W.; Southard, M.Z. Perry’s Chemical Engineers’ Handbook, 9th ed.; McGraw Hill: New York, 2018;.
- Saikumar, I.; Ahmad, S.; Baumberg, J.J.; Vijaya Prakash, G. Fabrication of excitonic luminescent inorganic–organic hybrid nano- and microcrystals. Scripta Materialia 2012, 67, 834–837. [CrossRef]
- Ghazi, A.M.; Millette, J.R. Lead. In Environmental Forensics: Contaminant Specific Guide; Morrison, R.D.; Murphy, B.L., Eds.; Academic Press: Cambridge, Massachusetts, 1964; pp. 55–79.
- Corbin, D.R.; Schwarz, S.; Sonnichsen, G.C. Methylamines synthesis: A review. Catal Today 1997, 37, 71–102. [CrossRef]
- Marlin, D.S.; Sarron, E.; Sigurbjörnsson, Ó Process Advantages of Direct CO2 to Methanol Synthesis. Front Chem 2018, 6. [CrossRef]
- Keeling, C.D. Industrial production of carbon dioxide from fossil fuels and limestone. Tellus 1973, 25, 174–198. [CrossRef]
- Weissermel, K.; Arpe, H. Industrial Organic Chemistry, 4th ed.; Wiley-VCH: Hoboken, New Jersey, 2003; pp. 1–491.
- Landolt, D.; Ibl, N. Anodic chlorate formation on platinized titanium. J Appl Electrocehm 1972, 2, 201–210. Available online: https://link.springer.com/article/10.1007/BF02354977. [CrossRef]
- Klabunde, J.; Bischoff, C.; Papa, A.J. Propanols. Ullmann's Encycl Ind Chem 2018, 1–14. [CrossRef]
- Curry, J.A.; Ismay, M.J.L.; Jameson, G.J. Mine operating costs and the potential impacts of energy and grinding. Minerals Eng 2014, 56, 70–80. Available online: https://www.sciencedirect.com/science/article/pii/S0892687513003440. [CrossRef]
- Attari, M.Y.N.; Torkayesh, A.E. Developing benders decomposition algorithm for a green supply chain network of mine industry: Case of Iranian mine industry. Oper Res Pers 2018, 5, 371–382. Available online: https://www.sciencedirect.com/science/article/pii/S2214716018302094. [CrossRef]
- Rodrigue, J.-. The Geography of Transport Systems, Sixth ed.; Routledge: London, 2024; pp. 402.
- Goetz, K.P.; Taylor, A.D.; Hofstetter, Y.J.; Vaynzof, Y. Sustainability in Perovskite Solar Cells. ACS Appl Mater Interfaces 2020, 13, 1–17. [CrossRef]
- Kadro, J.M.; Hagfeldt, A. The End-of-Life of Perovskite PV. Joule 2017, 1, 29–46. [CrossRef]
- Dragomir, V.D.; Gorgan, C.; Calu, D.; Dumitru, M. The relevance and comparability of corporate financial reporting regarding renewable energy production in Europe. Renewable Energy Focus 2022, 41, 206–215. Available online: https://www.sciencedirect.com/science/article/pii/S1755008422000205. [CrossRef]
- Herzig, C.; Viere, T.; Schaltegger, S.; Burritt, R.L.; Lee, K. Environmental Management Accounting: Case studies of South-East Asian Companies. Accounting Forum 2012, 36, 310–312. [CrossRef]
- Burritt, R.; Christ, K.; Schaltegger, S. Materials and energy accounting. In Routledge Handbook of Environmental Accounting; Bebbington, J.; Larrinaga, C.; O'Dwyer, B.; Thomson. Ian, Eds.; Routledge: Abingdon, 2021; pp. 17.
- International Organization for Standardization ISO14051: Environmental management - Material flow cost accounting - General framework . 2011 Available online: https:www.iso.org/standard/50986.htm.
- Wan, Y.K.; Ng, R.T.L.; Ng, D.K.S.; Tan, R.R. Material flow cost accounting (MFCA)–based approach for prioritisation of waste recovery. J Clean Prod 2015, 107, 602–614. Available online: https://www.sciencedirect.com/science/article/pii/S0959652615005703. [CrossRef]
- Burritt, R.L.; Herzig, C.; Schaltegger, S.; Viere, T. Diffusion of environmental management accounting for cleaner production: Evidence from some case studies. Journal of Cleaner Production 2019, 224, 479–491. [CrossRef]
- Walz, M.; Guenther, E. What effects does material flow cost accounting have for companies?: Evidence from a case studies analysis. J Ind Ecology 2021, 25, 593–613. [CrossRef]
Figure 1.
The Official chart of the maximum power conversion efficiencies of all reported solar cell technologies from 1976 to 2023 by the National Renewable Energy Laboratory focuses on emerging third-generation solar technology. Reproduced with permission [24]. Copyright 2024, National Renewable Energy Laboratory, Golden, CO, USA.
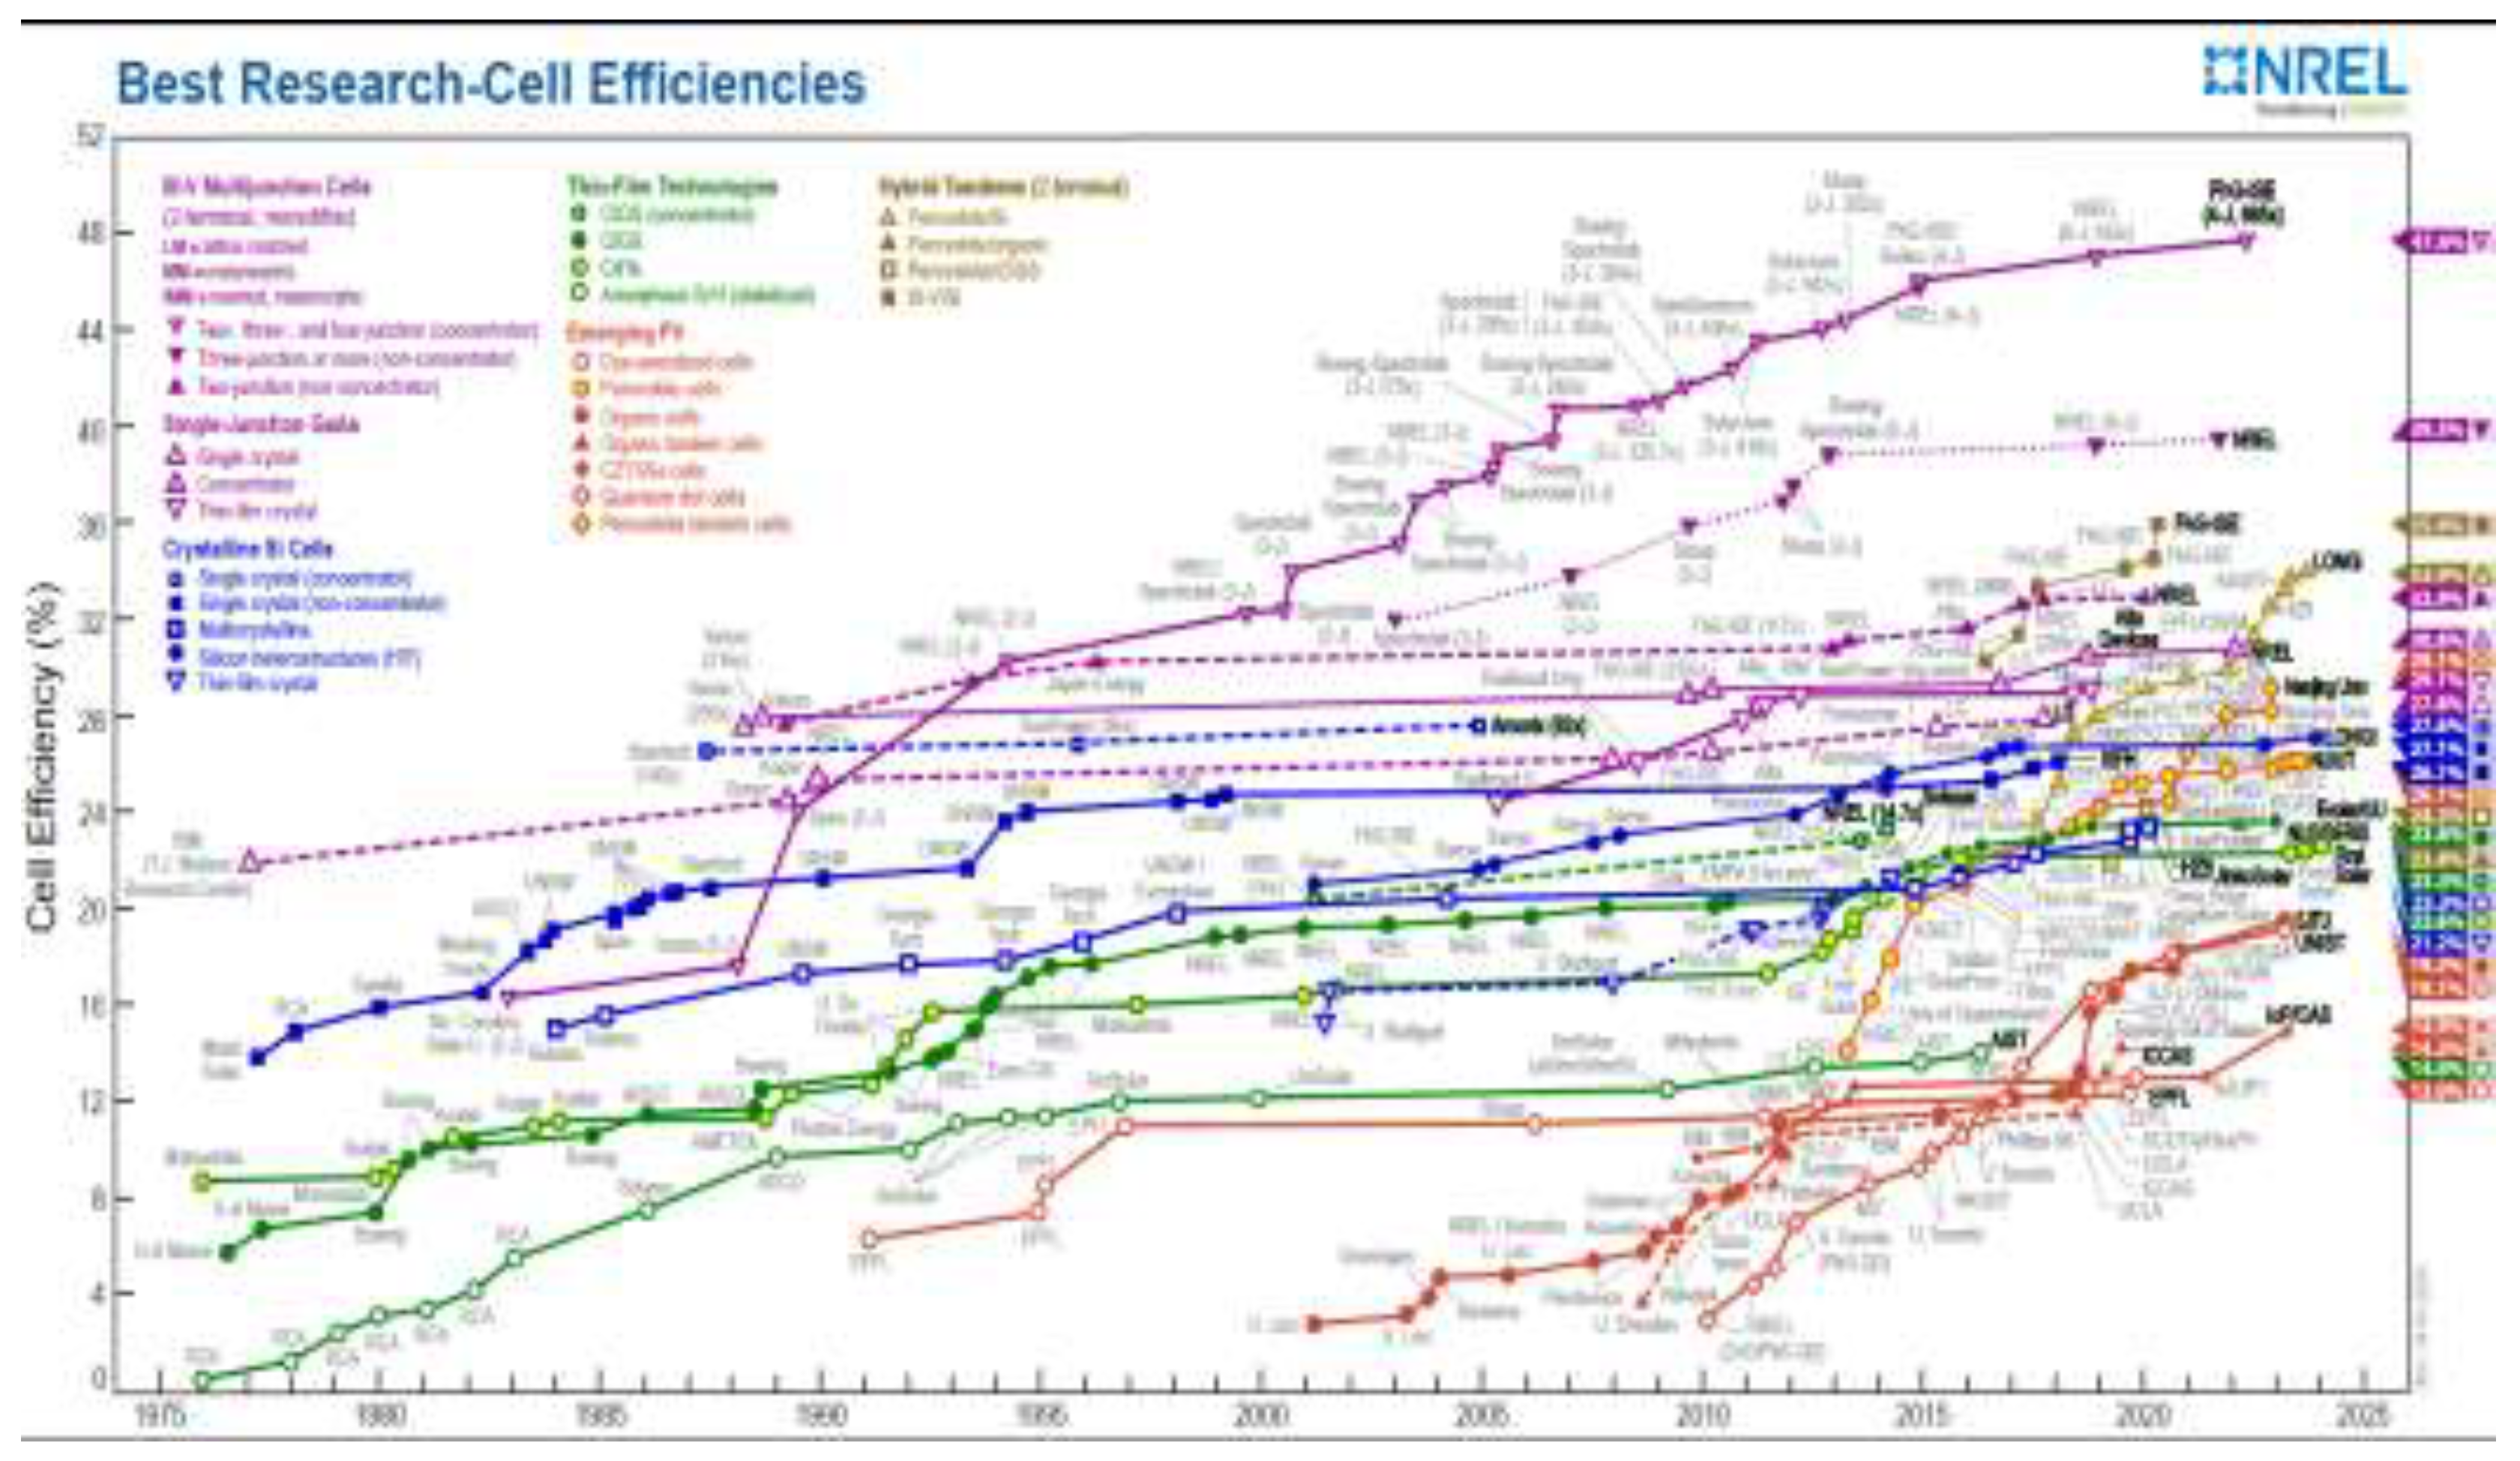
Figure 2.
The typical architecture of a Perovskite solar cell.
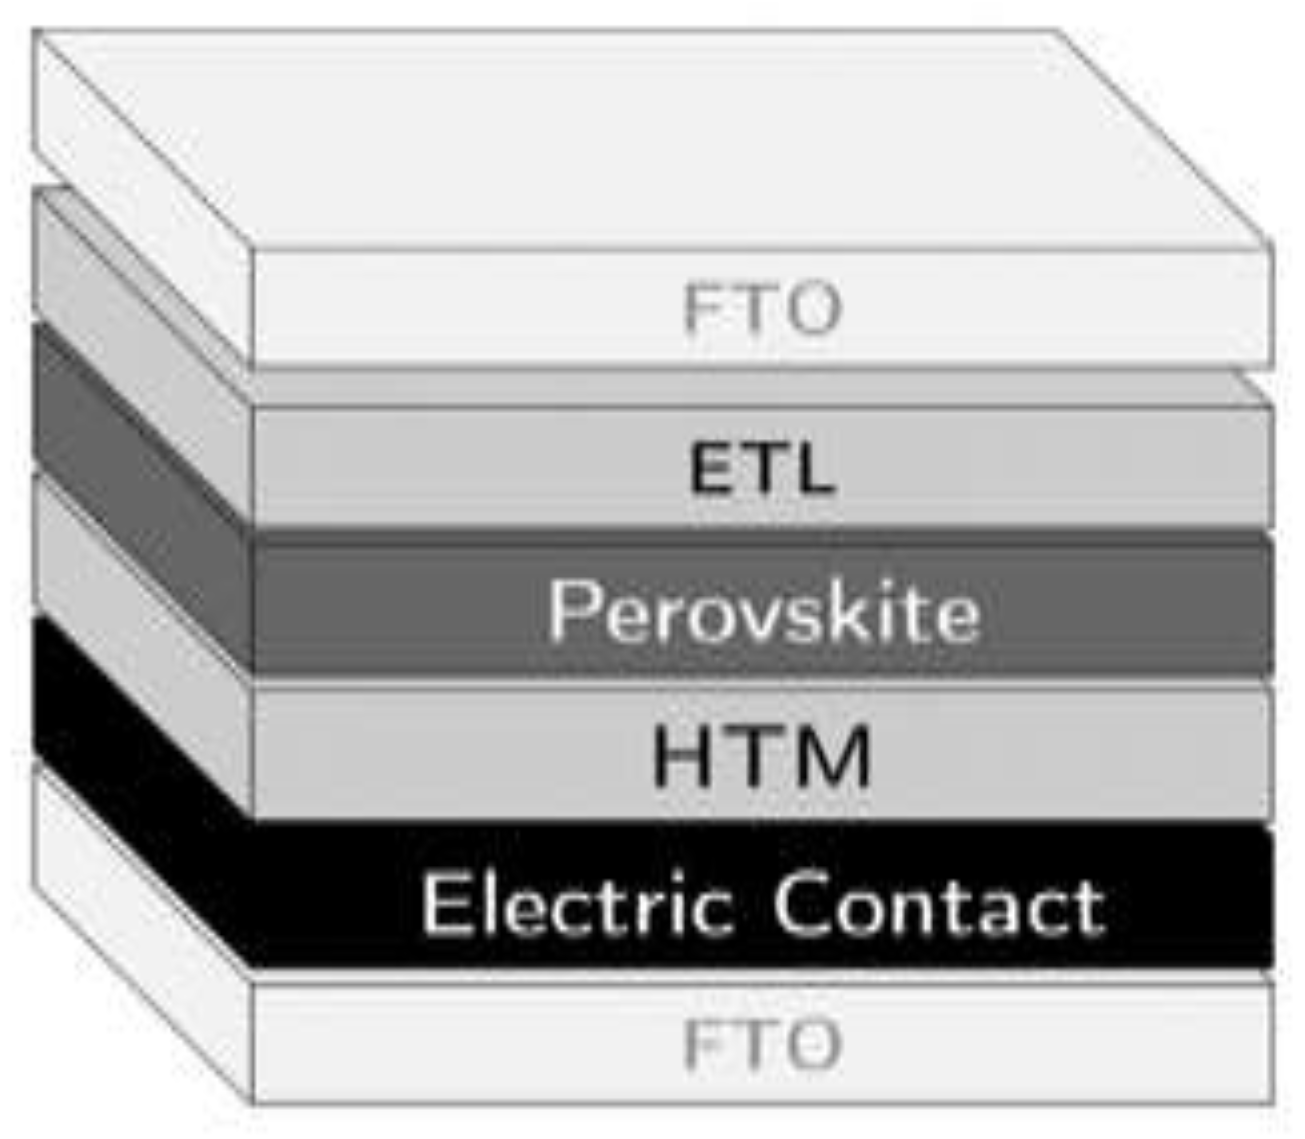
Figure 3.
Summary of Chemicals Involved in the Fabrication of the Perovskite Layer.
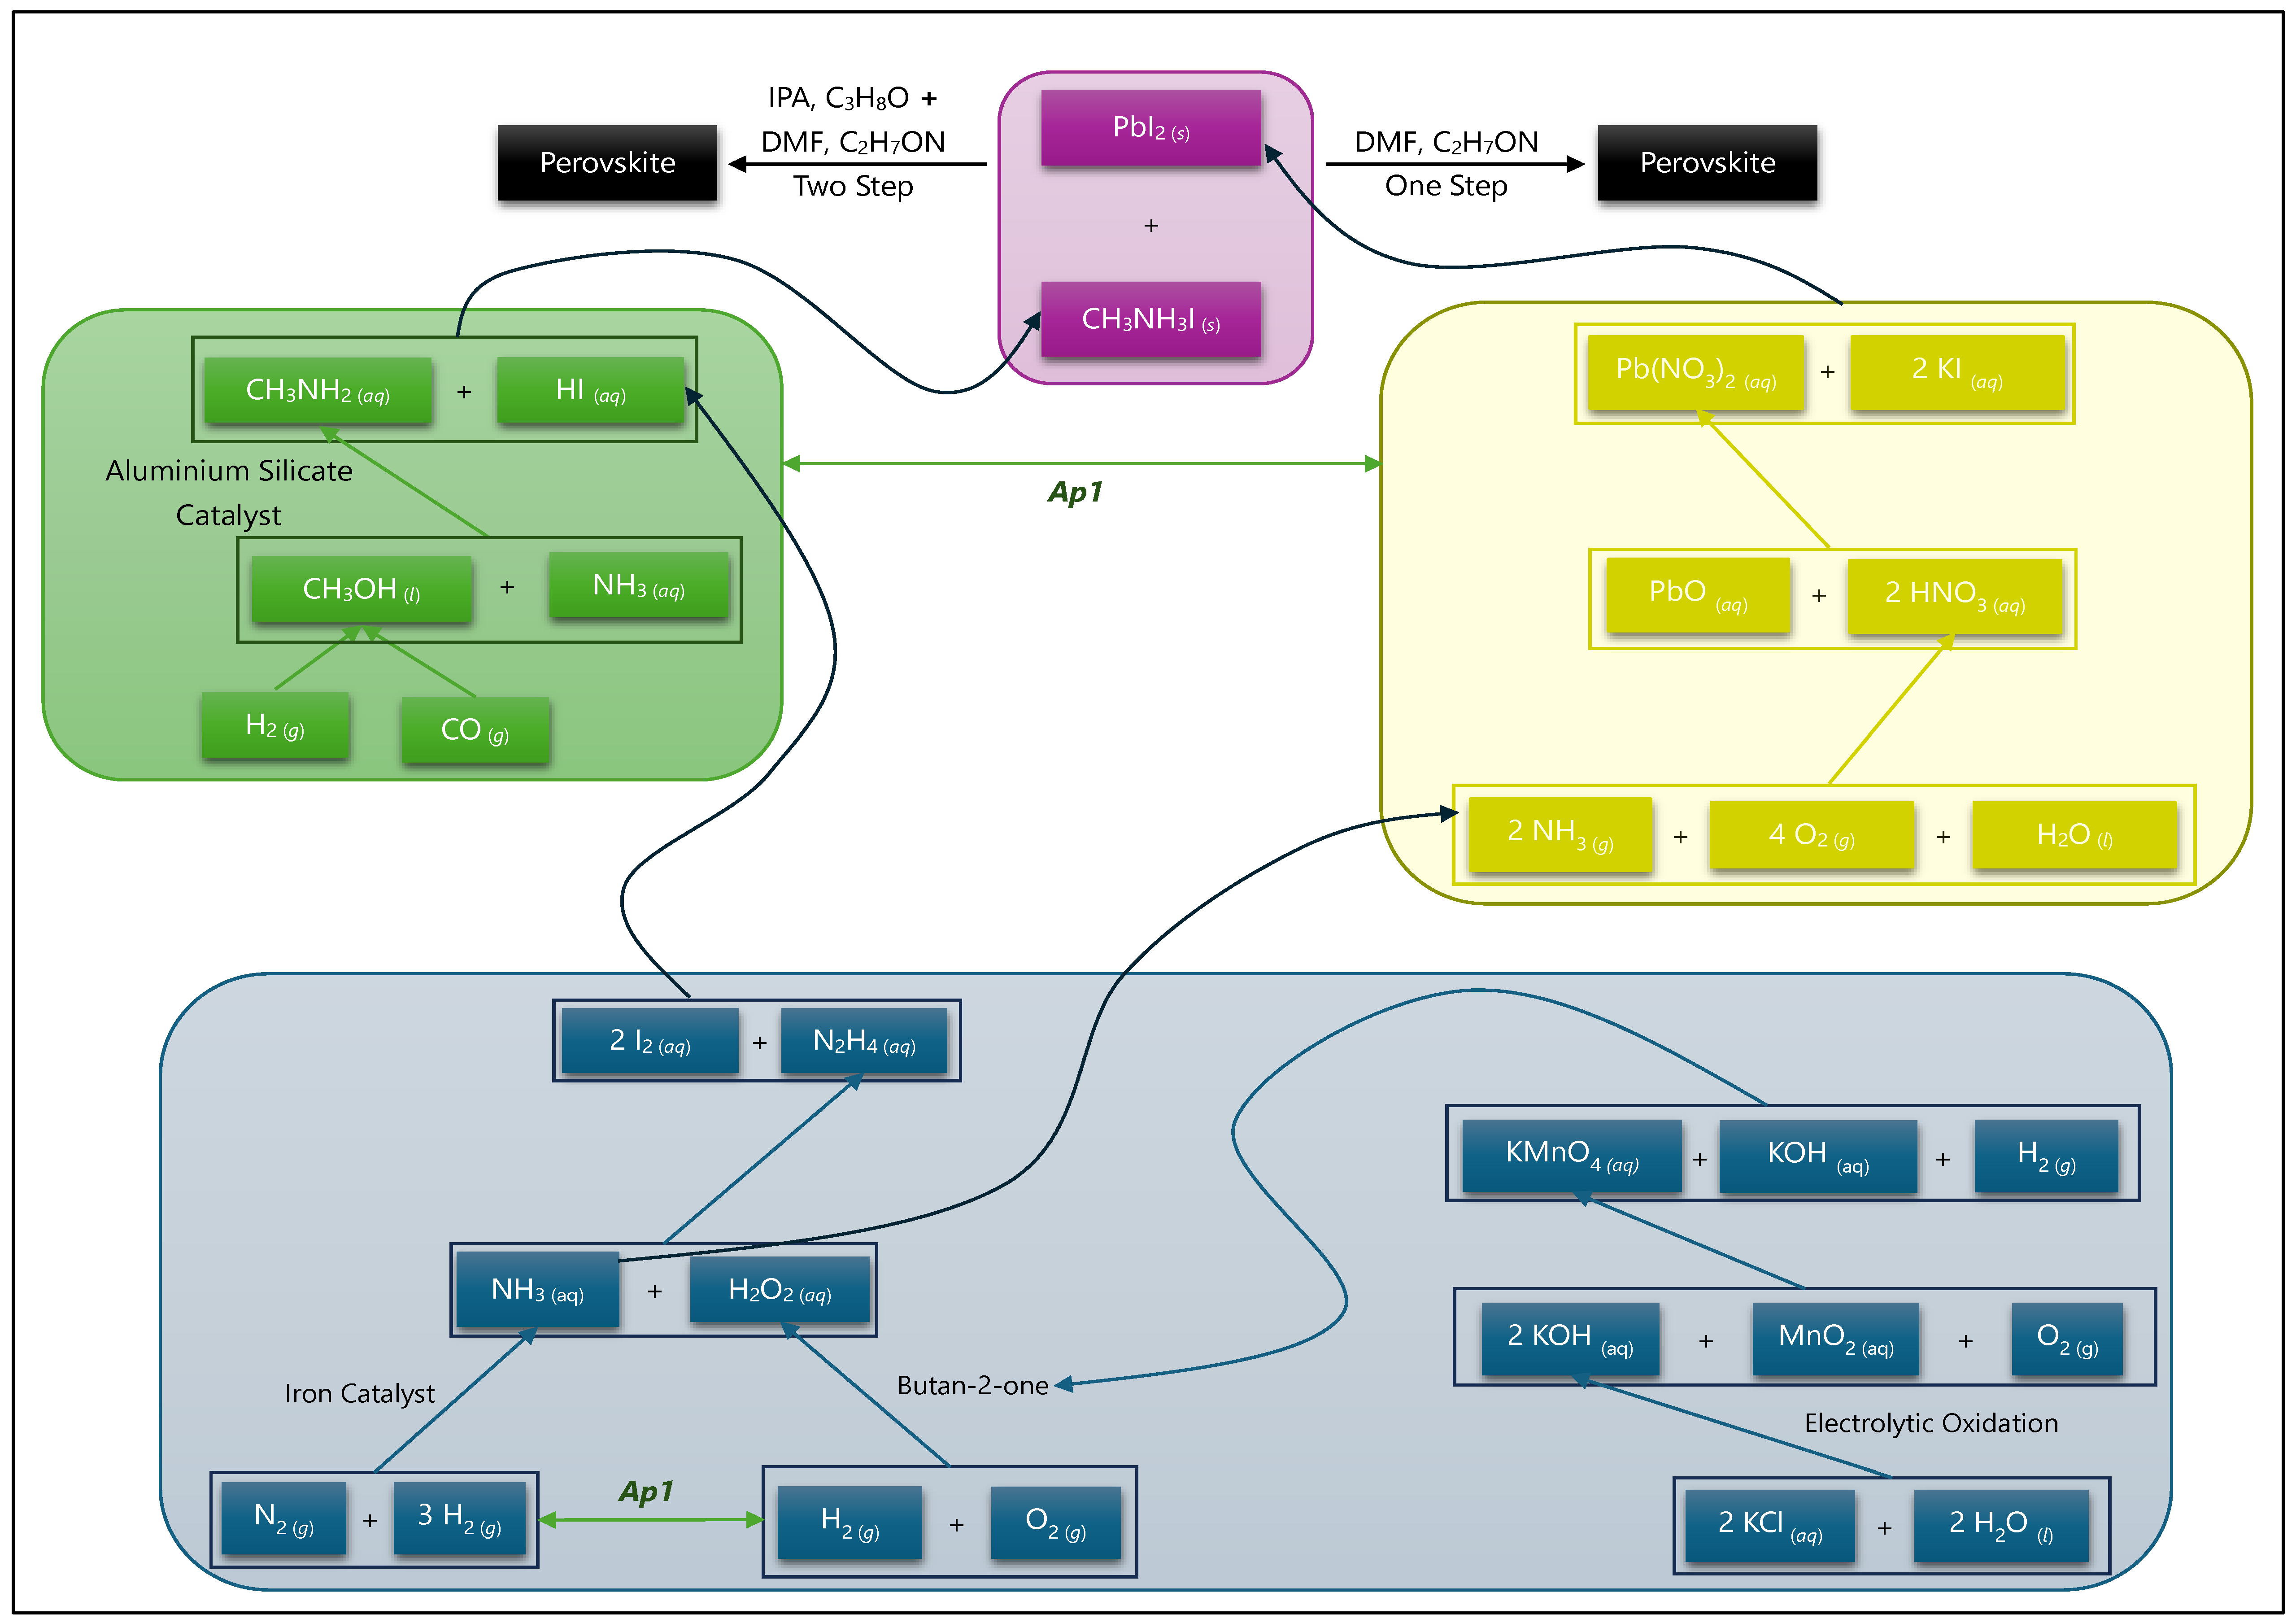
Figure 4.
Conceptual framework for applying MFCA in fabricating the Perovskite layer and the supply chain.
Figure 4.
Conceptual framework for applying MFCA in fabricating the Perovskite layer and the supply chain.
Disclaimer/Publisher’s Note: The statements, opinions and data contained in all publications are solely those of the individual author(s) and contributor(s) and not of MDPI and/or the editor(s). MDPI and/or the editor(s) disclaim responsibility for any injury to people or property resulting from any ideas, methods, instructions or products referred to in the content. |
© 2024 by the authors. Licensee MDPI, Basel, Switzerland. This article is an open access article distributed under the terms and conditions of the Creative Commons Attribution (CC BY) license (http://creativecommons.org/licenses/by/4.0/).
Copyright: This open access article is published under a Creative Commons CC BY 4.0 license, which permit the free download, distribution, and reuse, provided that the author and preprint are cited in any reuse.


