Preprint
Article

Walkable Distances to School in Urban, Semi-Urban and Rural Areas: The PACO Y PACA Study

Altmetrics

Downloads

63

Views

43

Comments

0

Submitted:

25 September 2024

Posted:

26 September 2024

You are already at the latest version

Alerts
Abstract
Background/Objectives: Distance or urbanisation settings may affect active commuting to school (ACS). This study aimed to (i) detect home-school threshold distances of walking to school and (ii) predict walkable distances among adolescents in different urbanisation settings and both sexes, and (iii) to identify variables predicting adolescents’ ACS, in a central Spain region. Methods: The PACOyPACA (Spanish acronym for Pedal-and-Walk to School, Pedal-and-Walk Home) study evaluated adolescents attending urban, semi-urban and rural schools from Castilla-La Mancha region. The sample included 448 adolescents [48.9% females, mean age 14.80 (SD=0.60)] living closer than 5,100m from school. Distance was divided into deciles to detect which adolescents walked more. Most walkable distances within the whole sample, by sex and by urbanisation settings were predicted using Receiver Operating Characteristic (ROC) curves. Variables affecting ACS were found with binary logistic regression. Significance was set at p≤0.05. Results: Most adolescents walked to school (73.1%). Commuting modes differed significantly by urbanisation settings (p=0.001), but not by sex. Most walked when living around 1,400m from school or closer within the whole sample, in both sexes and in urban and semi-urban settings, and adolescents within rural settings did it until 750-900m. Walkable distances were 1,350m for the whole sample and both sexes, and 1,450, 1,350 and 800 within urban, semi-urban and rural settings, respectively. Distance was the only predictor of ACS (p<0.001). Conclusions: Walkable home-school distances differed based on urbanisation settings, which may be due to the classification of urbanisation settings. This study addresses schools within scarcely populated areas.
Keywords: 
Subject: Social Sciences  -   Transportation

1. Introduction

Active commuting to school (ACS) has been proven to increase physical activity levels among adolescents [1]. Some sociodemographic variables such as age or sex have been associated with ACS. As per sex, it has been proven that children report higher levels of ACS as they grow into adolescence [2], while ACS has been associated to those of a younger age [3,4]. As per sex, existing research shows that it tends to be an important predictor of ACS among children and adolescents [5,6,7] and, more specifically, among adolescents [3,8]. Higher levels of ACS have been reported and among boys in childhood and adolescence [3,5,7,8].
Additionally, existing evidence present the relation of the built environment with ACS among children and adolescents [9,10]. In particular, higher levels of adolescents ACS have been associated with shorter distances between adolescents’ home and their school [11,12,13,14,15]. Existing literature assessing adolescents’ ACS have focused on either a straight line from adolescent’s home to school (Euclidean distance) [16,17,18,19,20] or the distance from adolescents’ home to school on the street network [21,22,23,24,25,26,27,28].
Additionally, there is evidence on the relevance of both urbanisation settings and distance on the commuting patterns of adolescents [29]. As it comes to the relation between adolescents’ ACS and urbanisation settings, children and adolescents have reported higher levels of ACS in urban settings [30,31,32], but also in rural settings [33]. Other research focusing on adolescents exclusively have shown that adolescents within urban or more populated areas actively commuted to school more than those in the smaller or less populated ones [8,18,19], while others found adolescents to commute to school actively more within rural settings than within urban areas [27,34]. Despite of this, distance seems to play an important role on adolescents’ ACS in different urbanisation settings.
Some studies have found different threshold distances on the street network until which students reported higher ACS levels, such as 2,000m [25] or 3,046m [26]. Moreover, in order to evaluate adolescents’ ACS, other studies have also used home-school distances on the street network such as 1,350m [11,22], 2,250m [34] or 3,219m [24], as they were considered as walkable distance. Considering how distance interacts with diverse urbanisation settings, some studies have assessed how far adolescents are more prone to walk to school taking into account urbanisation settings, age or sex [23,26]. Street network distances such as 1,350m and 1,550m have been considered as walkable for urban and rural settings respectively [23]. Based on sex, threshold distances were found at 1,250m for females, and 1,350 for males. Moreover, some studies have established distances as more feasible to actively commute to school, such as 4,000 [8,34], 4,500 [14,22], or 5,100 [35,36]. The little existence of evidence aiming to understand and predict distances based on sex, age or urbanisation settings suggest the need for further work on these topics to better understand which distances adolescents are more prone to actively commute to school, within a feasible distance for ACS.
Adolescents’ perception towards ACS and, more specifically, towards walking, differ based on distance [37]. Hence, those adolescents living within walking distance have reported less barriers to this behaviour, included perceiving that they “live too far from school”. Moreover, Mandic et al., (2024) [37] found that this perception of distance has significantly increased after the COVID-19 pandemic among adolescents, while it has not significantly changed within a walkable distance of 2250m. The scarce existing evidence on objectively measured threshold distances to walk to school in adolescence, based on sex and urbanisation settings, suggests that more work is needed in those regards. Within a feasible distance to actively commute to school, the current study aimed (i) to detect the home-school threshold distance of adolescents who walked to school in different urbanisation settings, and by sex in the region of in Castilla-La Mancha (CLM), (ii) to predict the most walkable distances for adolescents, based on sex and urbanisation settings, in this region, and (iii) to identify the variables predicting ACS among adolescents in CLM.

2. Materials and Methods

2.1. Study Design

This is a multi-centre cross-sectional study. It was conducted in a central region of Spain, (CLM)between 2021-2022, as part of the PACO y PACA (Spanish acronym for Pedal and Walk to School, Pedal and Walk Home) project study (reference: SBPLY/19/180501/000089) [38]. This study was approved by Ethics Committee for Research with Drugs-SESCAM (ID: C-392), according to the Helsinki Declaration (1961) revised in Fortaleza in 2013 [39].
The 320 existing schools in the central region of Castilla-La Mancha were classified by diversity of urbanisation settings according tor according their municipality’s population. Thus, ‘urban’ environments were considered to be those with 10,000 inhabitants or more, ‘semi-urban’ environments had between 2,000 and 10,000 inhabitants, and ‘rural’ environments were those with less than 2,000 inhabitants [40]. After this classification was made, 40 (10 from urban settings, 10 from semi-urban settings and 20 from rural settings) schools were randomly selected. These selected schools were contacted via email to provide them with information on the project and invite them to take part. One week later, they were followed-up by telephone to give further information and answer any possible questions. Finally, should they want to take part in the project, they were to sign and send an informed consent form. Of the 40 schools initially approached, 26 were selected to participate in the study.
This study followed the guidelines and checklist for cross-sectional studies of Strengthening the Reporting of Observational studies in Epidemiology [41].

2.2. Sample

Both, participants recruitment and data collections, were conducted during the 2021-22 course (from September 2021 to June 2022). Students from the 3rd course of secondary education (14-15 years old) were visited twice by researchers: first, to let them know about the project and, second, for data collection. To be invited for data collection, students were to bring in the informed consent that they were given, filled and signed by their parents/legal guardians. For the current study, filling the study questionnaire and living no further than 5,100m from school was established as an inclusion criterion. This made it possible to assess adolescents’ ACS and the variables for this study within a feasible distance to actively commute to school [35] that has already been used by researchers on ACS among adolescents [36]. From a total number of 547 adolescents filling the questionnaire, a final sample 446 took part in the study after excluding those living further than 5,100m from school.

2.3. Materials and Measures

Students completed an online questionnaire [38]. The included questions focused on demographic information, modes to commute to school, and home-school distance, following previous models used by other studies [42,43,44].

Sociodemographic data

Participants were asked about their date of birth, address and sex. Dates of participation and birth were used to obtain their age. Students’ address was used for the obtention of distance.

Commuting to school

Adolescents were to report the way they commuted to school by answering a question that has already been validated [42]. It was formulated as follows: “Think about the last 5 days you have attended school (not including today). Answer the following question: ¿How did you go to school?” The possible answers were: I didn’t go to school, walk, pedal bike, electric bike, cycle, electric cycle, skateboard, kicking scooter, electric scooter, car, motorcycle, school bus, public bus, metro/train/tram/taxi/, and others. Walking, cycling, skateboarding and by kicking scooter were considered as active commuting.

Distance to school

To ensure the correct home-to-school distances, students’ homes and schools’ addresses were geolocated and checked on Google Maps™. Finally, distances between school and students’ homes were obtained on Google Maps™ by selecting the shortest route in the walking option. The concordance between Google Maps™ and Geographic Information System has been proven for distance measurement [45], and Google Maps™ has already been used to assess home-school distance [14,22,23]. Distance was expressed in metres.

2.4. Statistical Analysis

IBM SPSS 28.0 software was used in data analysis. Modes to commute to school were classified as walking to school or commuting to school by motorised transport. Also, descriptive analysis was conducted for demographic data. Absolute and relative frequencies were applied for categorical variables and using means and standard deviation (SD) for quantitative variables. Quantitative variables presented a normal distribution. Then, a bivariate analysis was conducted between sex and urbanisation settings and the variables of age, modes of commute to school (including a categorical variable of active vs. motorised commutes to school), and distance. Differences were considered as significant wherever the p-value was lower than 0.05. When dependent variables were categorical, chi-square was applied; when the dependent variables were continuous, either independent samples t-test (sex as independent variable) or one-way ANOVA (urbanisation settings as independent variable) were conducted. Distances were grouped in deciles to find out at what distance adolescents started using a motorised transport more than walking to commute to school [23,26,35]. Threshold distances for walking to school were assessed by Receiver Operating Characteristic (ROC) curve analysis [46], for the whole sample, for females, for males, and for the different urbanisation settings (urban, semi-urban and rural). In each case, the maximum distance between the ROC curve and the diagonal line was found by applying the Youden index [47].
After the bivariate analysis, a multivariate analysis was conducted, where ACS was included as the dependent variable, and sex, urbanisation settings, distance and age were used as independent variables. For this, a binary logistic regression was used. with p ≤0.05 were considered as significant. This model was built by using backward elimination (RV in SPSS).

3. Results

Table 1 shows the descriptive data for the whole sample, by sex, and for the different urbanisation settings. Adolescents from the whole sample presented a mean age of 14.80 years (SD=0.60), and roughly a half were females (48.9%). Most of the adolescents took part in the study within urban and semi-urban settings (51.9% and 183 40.8%, respectively), and just a 7.3% belonged to rural settings. As to the home-school distance, it was 1,167m (SD=963.00) in average within the whole sample. Adolescents from semi-urban settings were the ones living further from school, with a mean distance of 1469.56m (SD=1158.728), while the one from rural settings was particularly short, presenting 478.82m (SD=365.93). Active commuting (walking and cycling) was the most extended mode of commute (73.3%), from whom most walked to school (73.1% from the whole sample), and just 1 cycled to school (0.2% from the whole sample).
As for the differences from the bivariate analysis, no significant differences were found by sex in neither participants’ age, home-school distance or modes to commute to school. Home school distances were significantly different by urbanisation settings (p<0.001). When the modes used to commute to school were assessed, significant differences were also found by urbanisation settings (p<0.05 for the modes to commute separately and when classified by active and motorised modes). Thus, adolescents within rural settings were the ones who walked to school the most, and those from semi-urban settings went to school by car or by school bus more than their peers. When the mode to commute to school was categorized by active vs. motorised modes to commute to school, adolescents from semi-urban settings still were those who used motorised modes of transport more to commute to school compared with their counterparts from urban and rural settings.
Figure 1 presents the distance from home to school during which walking was the main way to commute to school, rather than motorised transport (as adolescents reported in their questionnaire), and the point where walking and motorised transport converged to change that tendency. Adolescents mainly walked to school until approximately 1,400m within the whole sample, while distances varied depending on sex. In the case of males, the found threshold distance was similar than in the whole sample, whilst some oscillations were found between walking and motorised transport as a predominant mode to commute to school between 750m and 1,400m among females. As for the different urbanisation settings, a clear threshold distance in urban settings was found slightly over 1,400m. The semi-urban settings presented an uneven tendency between 901m and 1,400m, and walking to school was the main mode until 750-900m in rural settings. From those points on, the use of motorised means of transport presented a big increase. Given the little number participants using motorised transport in the rural settings, its figure shows peaks for this mode of commuting.
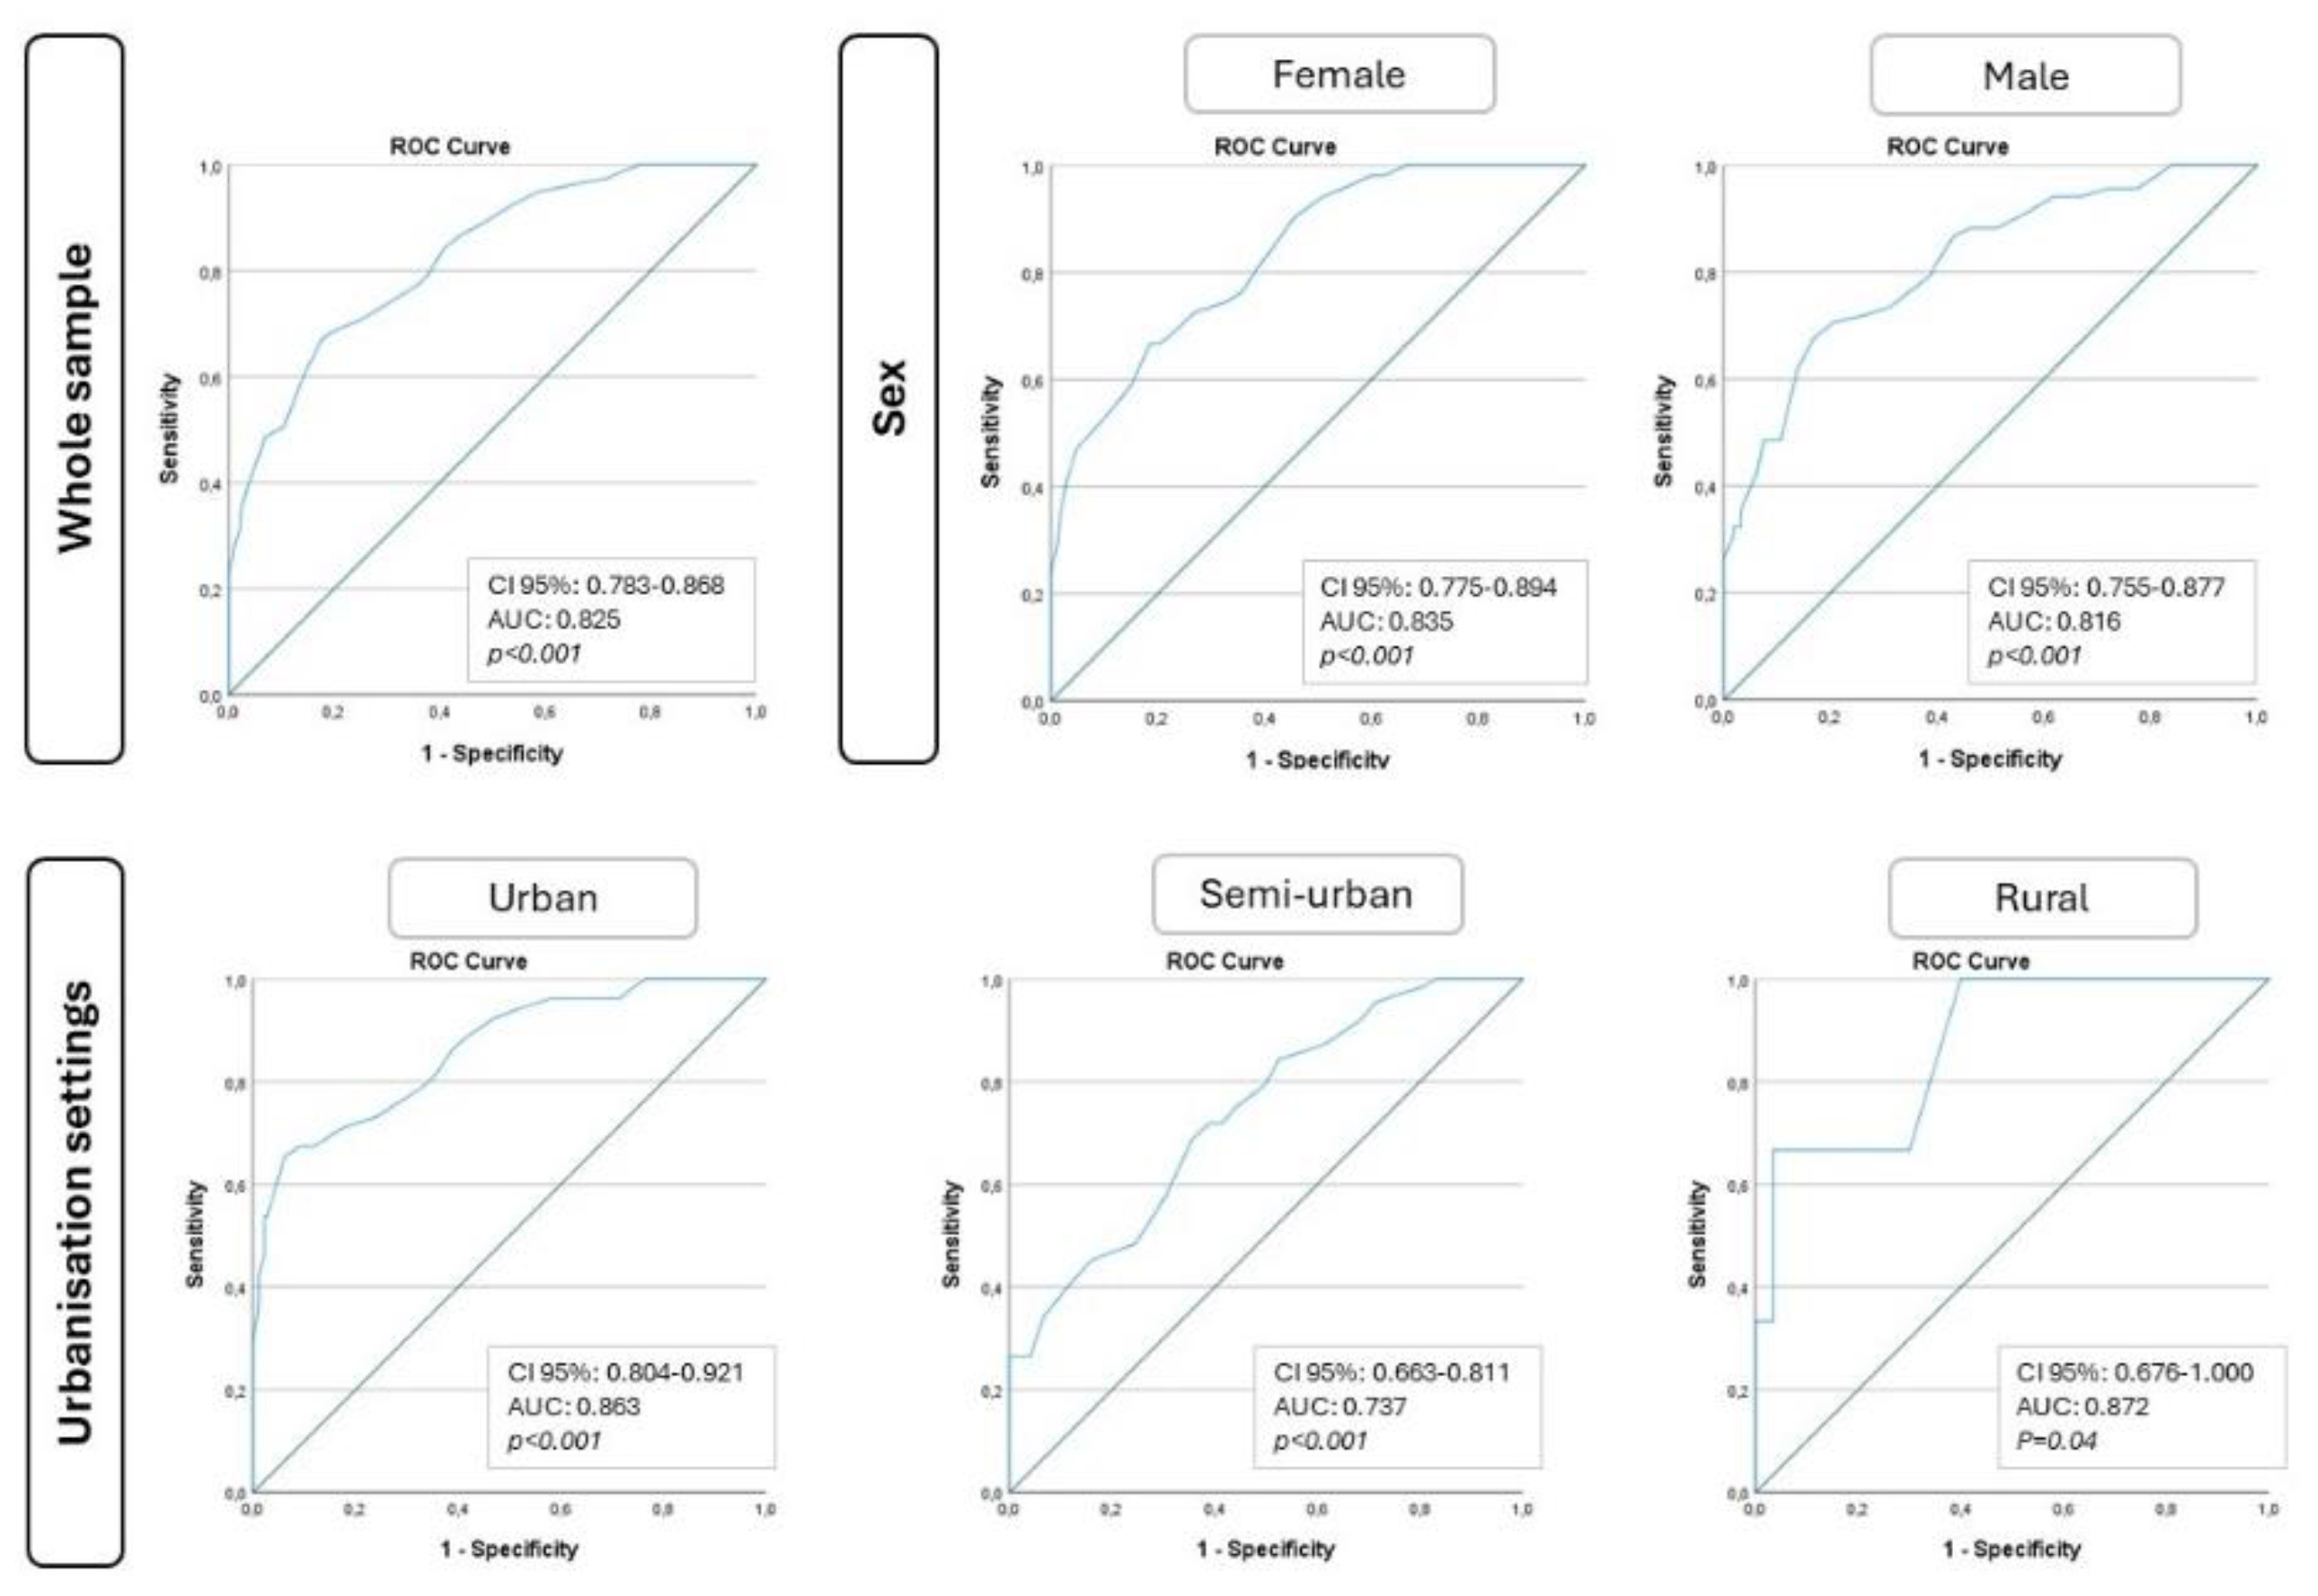
After obtaining the ROC curves (Figure 2), the areas under the curve (95% CI) found were 0.825 (0.783-0.868) for the whole sample, 0.835 (0.775-0.894) for females, 0.816 (0.755-0.877) for males, 0.863 (0.804-0.921) for schools in urban settings, 0.737 (0.663-0.811) for schools in semi-urban settings (all p<0.001) and 0.872 (0.676-1.000) for schools in rural settings (p<0.05). As per the different urbanisation settings, the urban and semi-urban ones presented significantly different areas under the curve (p< 0.05), while the rural settings did not show a significantly different area than the urban (p=0.927) or the semi-urban ones (p=0.207). The Youden indices (sensitivity, 1-specifity) were 0.495 (0.672,0.177) in the whole sample, 0.481 (0.667,0.186) for females, 0.508 (0.676, 0.169) for males, 0.592 (0.654, 0.061) in urban settings, 0.332 (0.688, 0.356) in semi-urban settings, and 0.633 (0.667, 0.033) in rural settings. The threshold distance to walk to school for the whole sample, and both females and males within the whole sample, was 1,350m. As it comes to urbanisation settings, within the 5,100m feasible distance for ACS, threshold distance was found between 1,450m from school in urban settings, while it was at 1,350m to walk to school in semi-urban settings, and 800m in rural settings.
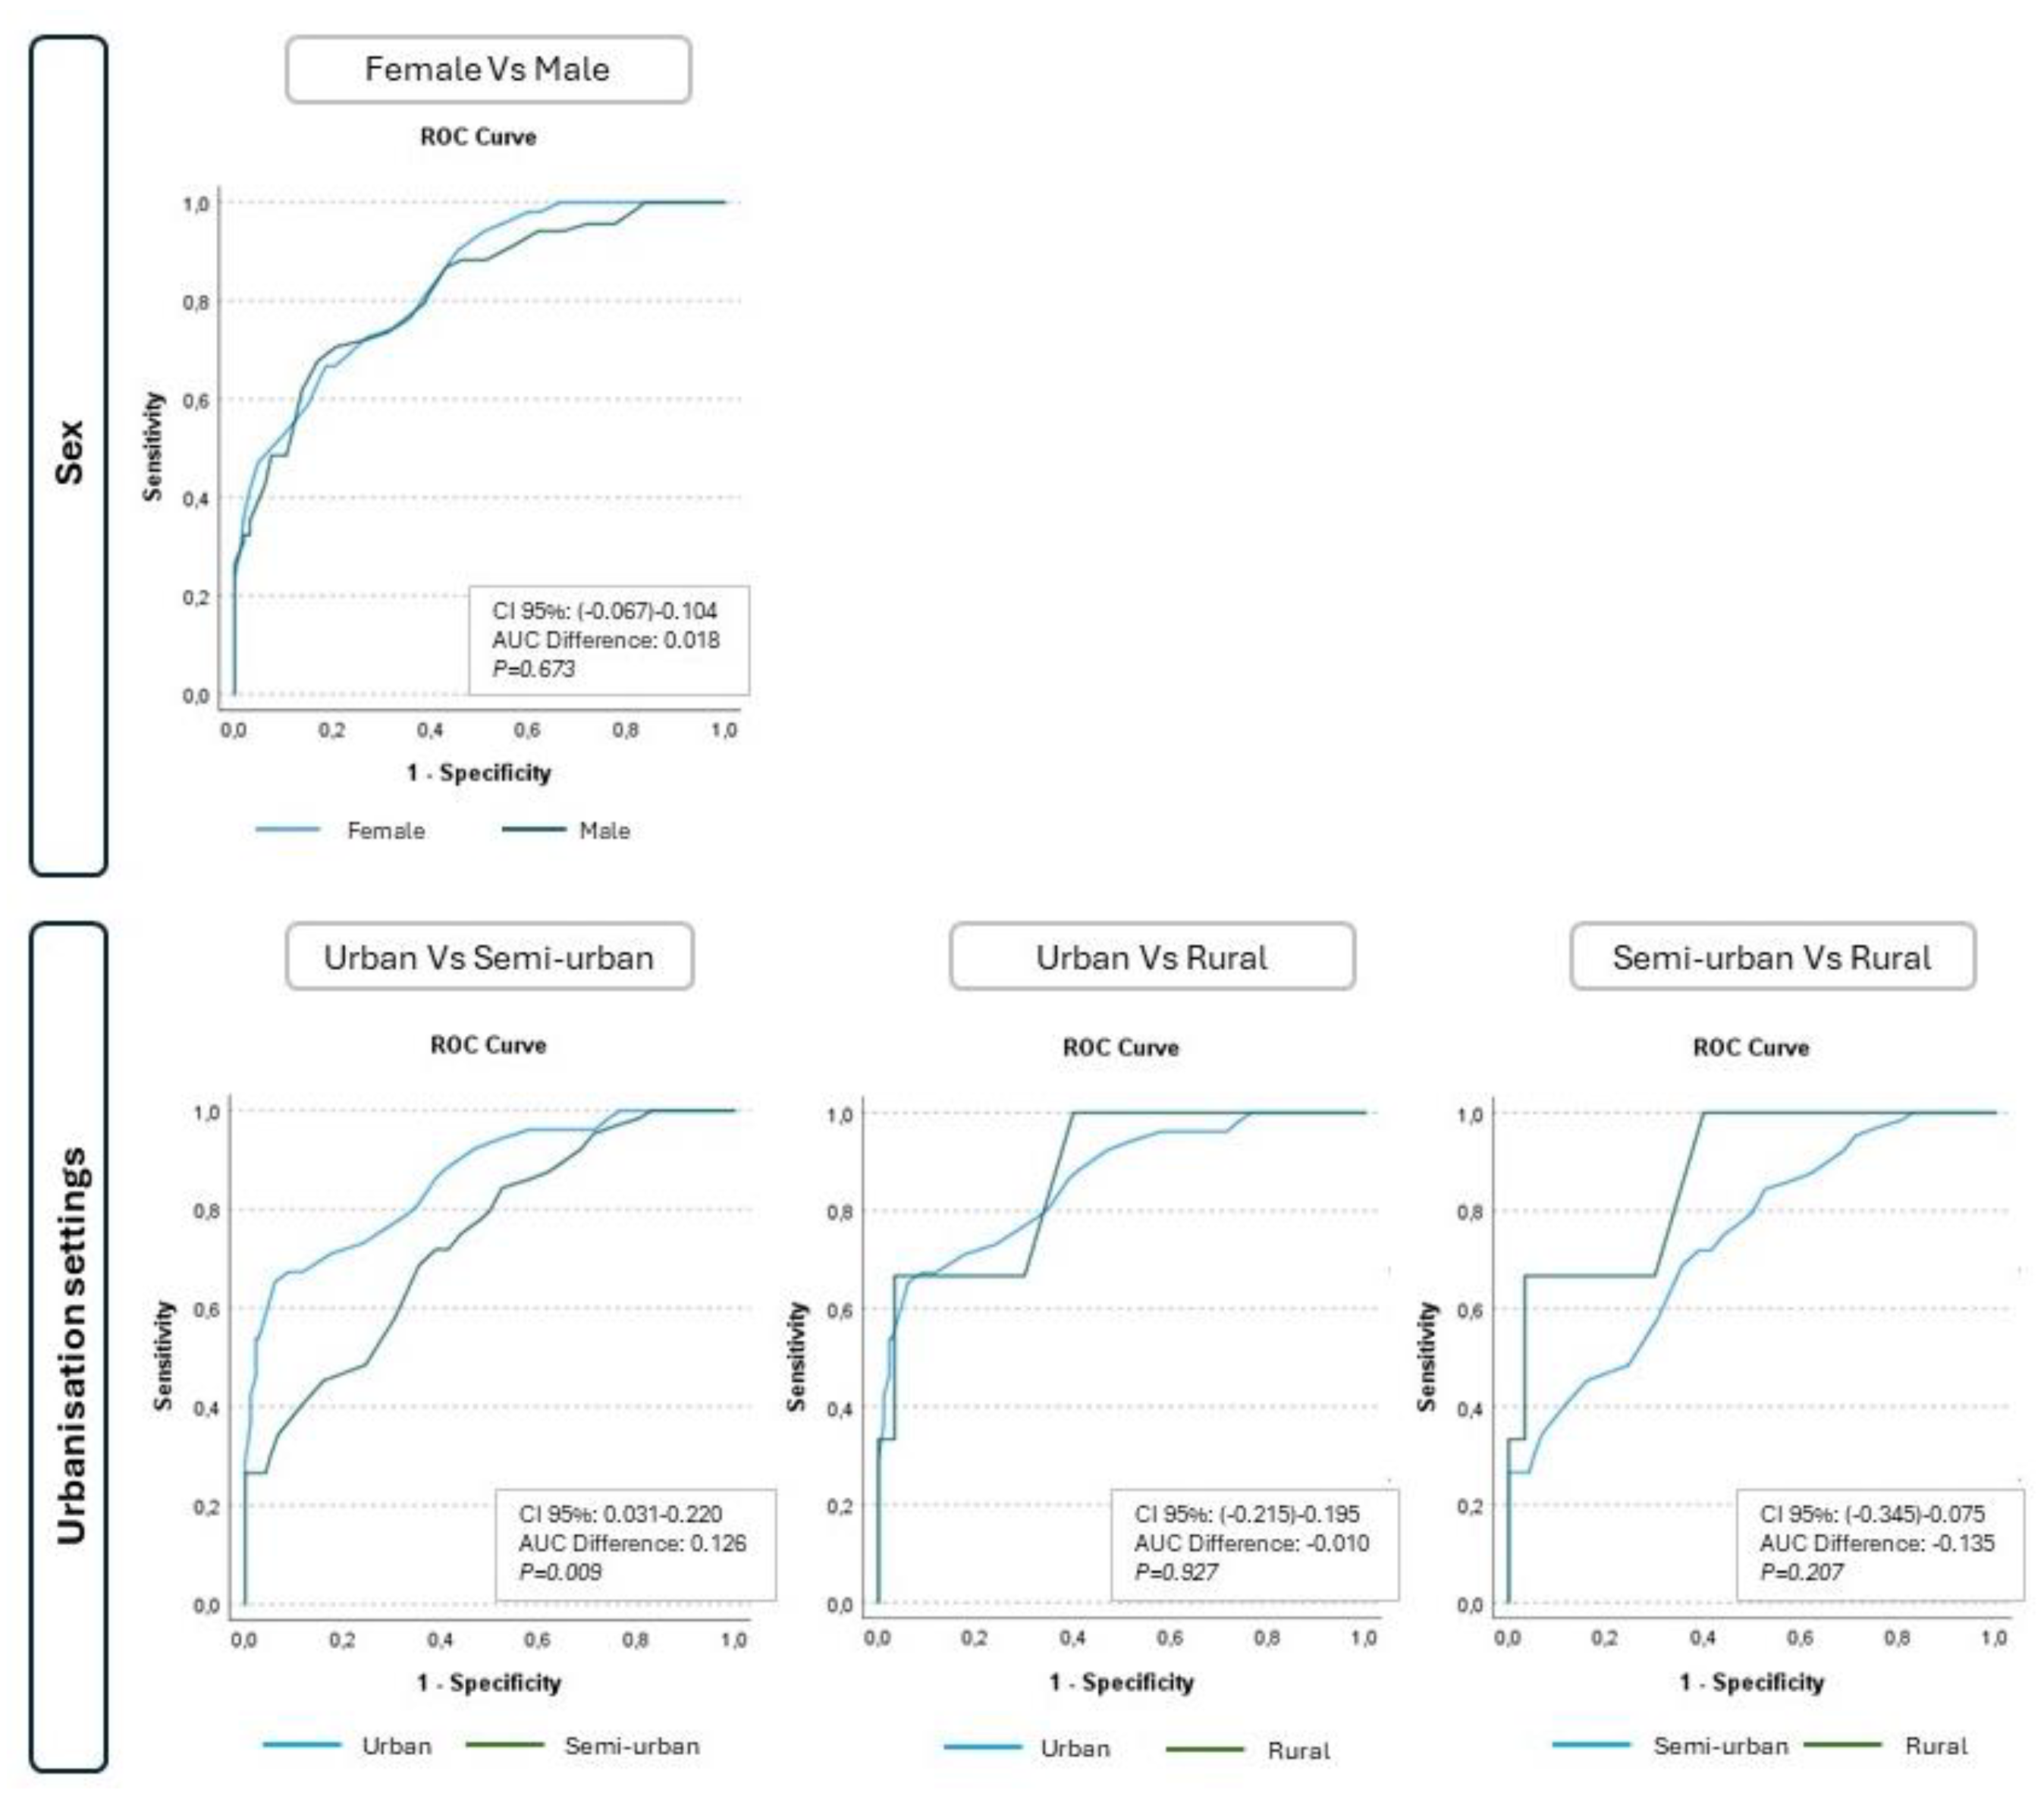
Figure 3 shows the comparative relationship between the areas under the curve of the ROC curves by urbanisation settings (urban, semi-urban and rural) and sex. Significant differences were found between urban and semi-urban settings (p<0.05), but no significant differences were found in the rest of the combinations of urbanicity settings, and by sex within the whole sample.
Finally, after the bivariate analysis, a multivariate analysis was performed using binary logistic regression (Table 2). From all these factors, the final model was composed of four potential predictors: sex, urbanisation settings, distance and age. According to the determinants factor of ACS, only the distance was considered as predictor of this behaviour (p<0.001).

4. Discussion

This study included those students who lived at 5,100m from school, as a feasible home-school distance for ACS already identified in the literature [35,36]. Results showed that a 72.6% of the sample walked to school, and there were no significant differences in the proportion of girls and boys that actively commuted to school. Instead, based on urbanisation settings, ACS was significantly higher than motorised transport, and walking was significantly predominant. The highest proportion of active commuters, and walking in particular, was found in rural settings, in accordance with previous research [27,34]. However, other studies presented higher levels of ACS in urban or more populated areas [8,18,19,23]. This may be due to how urbanisation settings have been classified so far. Thus, Rahman et al., (2020) [34] differentiated between major urban settings, large urban, medium urban and small urban areas and rural settings, and Mandic et al., (2015) [27] compared between urban and rural centres (less than 1,000 inhabitants). Additionally, Babey et al., (2009) [18] divided areas by urban, sub-urban and rural setting, Nelson et al., (2008) [8] followed a classification comprising large cities, outskirts or suburbs of large cities and villages (from those having more than 500,000 inhabitants to those with less than 5,000), and Dalton et al., (2011) [19] also applied multiple categories differentiating highly and scarcely populated areas, ranging from more than 20,000 inhabitants to less than 1,000. Rodríguez-López et al., (2017) [23], instead, used those 20,000 inhabitants as a cut-off point to differentiate between urban and rural settings. Also, while most studies have focused on the population size of the different areas for the classification of urbanisation settings, Babey et al., (2009) [18] based on population density (inhabitants per mile). That poses an alternative manner to assess this classification.
In addition to this, some studies assessing possible associations between urbanisation settings and ACS established their classifications of urbanisation settings being based in those around the adolescents’ homes [18,23,26,27]. Conversely, others have based on school areas urbanisation settings [8,19,34]. This suggests that, not only can ACS use be affected by the urbanisation setting, but by whether these make reference to the adolescents’ home or to their school area. It proves, then, the diversity of both, the home and school urbanisation settings classifications, and the results obtained by existing research. Additionally, while the present work set a street-network distance of 5,100m from school as an inclusion criterion, others have established it at 4,000m [34] and 4,829 [19], or just have not included any [8,18,27]. Concerning to both, home-school distance and urbanisation settings, a recent study found walking to school as a commuting pattern that gradually decreased as distance increased in all urbanisation settings [29]. This was higher at a walkable distance of 2,250m, and experienced a steeper reduction beyond the cyclable distance of 4,000m. Others have found different cut-off distances to compare the proportion of active commuters, such as 3219m [24] or 5,100 [36]. This reflets on the importance of considering those feasible distances to actively commute to school for the assessment of ACS.
When home-school distance was divided in deciles, the results obtained showed that adolescents walked gradually less as home-school distance increased, while the use of motorised modes of commute gradually enlarged. This applied to the whole sample, both sexes, and all urbanisation settings. Walking was found as the main self-reported mode to commute to school until 1,400m from school approximately within the whole sample, for both sexes and for urban and semi-urban settings, while this change of tendency happened between 750m and 900m within rural settings. The threshold distance for the whole sample differs from the ones found by Nelson et al., (2008) [8] and Chillón et al., (2015) [26], who obtained it at 2,414m and over 3,901m and from school respectively. Another study [23] found a shorter threshold distance within their whole sample (1,001m to 1,300m). As these classified their sample based on urbanisation settings, the different threshold distances for the whole sample might be due to the different distributions between settings. In addition, Nelson et al., (2008) [8] obtained home-school distance from the response of adolescents taking part in that study. This might have affected the resulting threshold distance, as home-school distances were not objectively measured. Concerning to urbanisation settings, for Rodríguez-López et al., (2017) [23] threshold distance within urban settings was similar or longer than the one found in the present study (1,301m to 1,900m), while it was longer within rural settings, (1,001m to 1,300m) being this larger than the range found in the current study. This might be due to their different definition of urban settings (>20,000 inhabitants) and rural settings. Furthermore, the current study distinguishes between urban, semi-urban and rural environments, adding an intermediate category just over those villages with less than 2,000 inhabitants, but still 10,000 inhabitants smaller than the cut-off value established by Rodríguez-López et al., (2017) [23]. In addition, results found in some of this evidence might have been affected by the location around which the area of study was based for urbanisation settings classification. While the current research has focused in schools’ urbanisation settings, these [23,26] undertook their classification focusing on adolescents’ homes urbanisation settings. This implies a different context, as adolescents attending schools within rural settings may be further from urban or semi-urban areas. Also, with regards to all these studies obtaining the current threshold distance between walking and motorised transport, none of them used a feasible distance for ACS as an inclusion criterion. Additionally, threshold distances have also been investigated by age within urban and rural settings in one study [23], whereas the current study does not take this variable into consideration when assessing threshold or walkable distances.
Similarly to those obtained from home-school distance deciles, the distances to walk to school predicted by ROC analysis for the whole sample, both sexes and urban and semi-urban settings were obtained around those 1,400m. In rural settings, instead, the predicted threshold distance was found at 800m. When it comes to sex, previous research [23] found different walkable distances for females and for males, in contrast with the current study. As for the whole sample, some evidence has reported the same threshold distance as feasible for adolescents’ walking to school [23], while other research has provided a different threshold distance [26]. Thus, Chillón et al., (2015) [26] showed a 3,046m home-school distance. Concerning to the urbanisation settings, while the obtained threshold distance within urban settings was similar than the one found in previous research [11,22], others present in the literature [23,48] showed different values. Thus, Rodríguez-López et al., (2017) [23] presented a 1,350m threshold distance, and Pocock et al., (2019) [48] reported a threshold distance of 2250 for adolescents walking to school within urban settings. Rodríguez-López et al., (2017) [23] also reported a walkable distance of 1,550 for adolescents living in rural settings, which was longer than the one presented in this study. As previously described in this section these differences may be due to their classification of urbanisation settings, and whether these classifications have been made based on schools or adolescents’ homes. Furthermore, there is a lack of research on the assessment of feasible home-school distances for walking to school among adolescents, especially within different urbanisation settings. Most of the literature focused on adolescents’ ACS research that establishing urbanisation settings classifications, do not report specific results for each of the urbanisation settings, or rather focus on one of them. Regarding to the importance of application of a home-school distance as inclusion criterion, this study has included a maximum home-school distance of 5,100m, while another study has used 4,500m instead [22]. A previous work, however, did not include any distance as inclusion criterion [23]. Nonetheless, in both cases, a 1,350m threshold was found, which is close to the 1,450m found in this article. This suggests that the application of a feasible distance for ACS as an inclusion criterion may not influence the assessment of walkable distances to school for adolescents within urban settings. As already stated, both the current study and the one conducted by Rodríguez-López et al., (2017) [23] found a 1,350m distance for the whole sample. However, despite of including different urbanisation settings in both, the location of schools should be kept in mind. The schools included in the current study were spread around the central Spain region of Castilla-La Mancha. On the contrary, in the study of Rodríguez-López et al., (2017) [23], although adolescents’ homes might live in urban or rural areas, schools exclusively belonged to cities. Therefore, other characteristics of the built environment such as residential density, land use mix, intersection density or micro-scale environmental features within the school neighbourhood might affect adolescents’ commuting patterns [15].
Farther than the walkable home-to-school distances assessment, other studies addressing built environment and its relation with ACS have used diverse classifications for the urbanisation settings. For instance, Hunter et al., (2023) [12] accounted for large urban centre, medium population centre, small population centre and rural; Ozbil et al., (2021) [20] distinguished inner city, outer city and suburban; Campos-Sánchez et al., (2020) [11] and Molina-García et al., (2020) [15] split urban and rural settings taking 20,000 inhabitants as their cut-off point, and Chillón et al., (2015) [26] compared urban settings (more than 10,000 inhabitants) with rural settings (less than 10,000 inhabitants). The current study, however, set a different classification given the abundance of sparsely populated villages in the region of CLM. This makes it more complex to contrast the results obtained in the present study with the ones reflected in previous evidence. Nonetheless, it also brings a different perspective on addressing the characteristics of the built environment and their possible association with ACS in adolescents. Moreover, this study reflects on ACS reality in scarcely populated rural areas (less than 2,000 inhabitants).
After applying binary logistic regression, neither age nor distance reported any significance. In terms of age, previous evidence has found a positive association between ACS and age in favour of older children and youth [2], while others have found a higher likelihood of younger adolescents to actively commute to school [3,4,18], and walking to school specifically [3,4]. The reason for the results found in the current study, in terms of age, may be little age range, as well as the small number of students aged more than 16 years old (the normal age for Spanish 3rd secondary education is 14-15 years). As per sex, some studies have found males to be more likely for ACS [3,8,14,18], while others have not reported any association [48]. Another study [4], meanwhile, reported higher levels of walking to school in females, but lower in cycling to school. Therefore, while boys having higher odds for ACS is supported by part of the existing evidence, sex or gender is not always a predicting factor. Despite of this, threshold distances to walk to school among adolescents may be different form females and for males [23]. Home-school distance was found to be the main factor influencing whether students commuted to school on foot or by motorised transport. Regardless of the classification of urbanisation settings, previous research has found the same negative association of home-school distance with ACS, being those adolescents who live closer to school the ones who actively commute to school the most [11,14,23,26,34,36]. Also, despite of finding that adolescents walked to school more within rural settings, no significant differences were found in the binary logistic regression. Another study [23] did not find significance either, although they found a tendency favourable to those within urban settings. Others [8,18,19], however, did find significant differences, as adolescents in more populated areas were more likely to ACS. Others, meanwhile [27] have found that adolescents from rural settings are more likely to ACS. According to this, when assessing adolescents’ likelihood to ACS, it seems that the bigger the size of the population or the population density, the more likely adolescents are for ACS. However, given the adolescents’ actual behaviour from the current work and other studies [27,34], it is difficult to confirm whether there is a common pattern in the relation between urbanisation settings and ACS among adolescents. Therefore, the current study provides more evidence about the possible associations between ACS and sex, age and urbanisation settings, and reinforces the role of home-school distance as a strong associate of ACS.

Strengths

This study represents an innovative classification of urbanisation settings for the obtention of walkable distances to school. This intends to bring more accurate and well differentiated results, as the diversity of urbanisation settings is addressed more specifically. In addition, the current research contributes to the need for further work in this field, given the paucity of evidence nowadays, particularly in rural settings

Limitations

Results on the walkable distances may be different than in other studies due to its particular classification of the urbanisation settings where schools were located, which has not been addressed in the same manner in other studies. Currently, there is a lack of consensus as it comes to the classification of urbanisation settings in this field of knowledge, which would allow comparability with future studies. Regarding to the number of participants, a bigger sample size might help for more clarity in the results. However, this classification is context specific to this geographic area from centre of Spain, where rural areas are sparsely populated. Also, threshold distances have not been assessed by age due to the little size (specially within rural settings), and the small age range of the sample. Future research should be focused on the analysis of ACS and distance in diverse urbanisation settings to confirm their importance in adolescents’ commuting choices, as well as on how relevant adolescents’ age can be for the obtention of walkable home-school distances.

5. Conclusions

The present study aimed to analyse how distance and urbanisation settings affects ACS in adolescence, and to find those distances adolescents walked more and predict the most walkable distances among adolescents, both based on sex and in urban, semi-urban and rural settings. Findings showed that, within a 5,100m street-network distance, adolescents from rural settings walked to school in a higher proportion that their peers from urban and semi-urban settings, while no significant differences were found in the modes of commute by sex. Also, adolescents reported to walk to school in a higher proportion until around 1,400m within the whole sample, by sex and in urban and semi-urban settings, showing a similar distance than the one predicted as walkable in the same sample groups. In rural settings, however, shorter distances were shown as both, the threshold until which walking was predominant and the one predicted as walkable for adolescents. Findings from this study will be of use for a better understanding of how distance affects ACS among adolescents according to sex and in schools from different urbanisation settings. Nonetheless, more research addressing this topic is needed, considering different age ranges within adolescence wherever possible. Also, more work should be done in studying how urbanisation settings affect ACS, as this varies within the literature, and which could be their best classification in this field of research.

Author Contributions

For research articles with several authors, a short paragraph specifying their individual contributions must be provided. The following statements should be used “Conceptualization, I.P.-Q, A.H.-M. and S.A.; methodology, I.PQ., E.M.-M., C.M., N.G., M.V.G.-C., E.C., A.D.-S., M.P.-S., D.M.C., C.R.-B., J.M.-G., S.M., F.J.-Z. and S.A.; software, I.P.-Q., A.H.-M. and S.A.; validation, I.PQ., E.M.-M., C.M., M.V.G.-C., E.C., A.D.-S., C.R.-B., F.J.-Z. and S.A.; formal analysis, I.P.-Q., A.H.-M., F.J.-Z. and S.A.; investigation, I.PQ., E.M.-M., C.M., M.T.M.-R., N.G., M.V.G.-C., E.C., C.R.-B., F.J.-Z. and S.A.; resources, I.P.-Q. and S.A.; data curation, I.P.-Q. and S.A.; writing—original draft preparation, I.P.-Q., F.J.-Z. and S.A.; writing—review and editing, I.P.-Q., E.M.-M., A.H.-M., C.M., M.T.M.-R., N.G., M.V.G.-C., E.C., A.D.-S., M.P.S., D.M.C., C.R.-B., J.M.-G., S.M., F.J.-Z. and S.A.; visualization, I.P.-Q., F.J.-Z. and S.A.; supervision, F.J.-Z. and S.A.; project administration, S.A.; funding acquisition, S.A. All authors have read and agreed to the published version of the manuscript.” Please turn to the CRediT taxonomy for the term explanation. Authorship must be limited to those who have contributed substantially to the work reported.

Funding

This study was co-funded by the Regional Government of Castilla-La Mancha and the European Regional Development Fund (Reference: SBPLY/19/180501/000089).

Institutional Review Board Statement

This study was conducted according to the Helsinki Declaration (1961) revised in Fortaleza (2013), and received approval by the Ethics Committee for Research with Drugs-SESCAM (ID: C-392).

Informed Consent Statement

Informed consent was obtained from all subjects involved in the study.

Data Availability Statement

Not applicable.

Acknowledgments

The involvement from the schools taking part in this study, as well as the participation of students and their families, is much appreciated.

Conflicts of Interest

The authors declare no conflicts of interest.

References

  1. White, B.; Bengoechea, E.G.; Spence, J.C.; Coppell, K.J.; Mandic, S. Comparison of physical activity patterns across large, medium and small urban areas and rural settings in the Otago Region, New Zealand. New Zealand Medical Journal 2021, 134, 51–65. [Google Scholar] [PubMed]
  2. Timperio, A.; Ball, K.; Salmon, J.; Roberts, R.; Giles-Corti, B.; Simmons, D.; Baur, L.A.; Crawford, D. Personal, family, social, and environmental correlates of active commuting to school. Am J Prev Med 2006, 30, 45–51. [Google Scholar] [CrossRef] [PubMed]
  3. Kwon, S.; Mason, M.; Wang-Schweig, M.; Morrissey, J.; Bartell, T.; Kandula, N.R. The Association Between Adolescent Active Commuting to School and Parent Walking Behavior: The FLASHE Study. Am J Health Promot 2022, 36, 1265–1274. [Google Scholar] [CrossRef] [PubMed]
  4. Költő, A.; Gavin, A.; Kelly, C.; Nic Gabhainn, S. Transport to School and Mental Well-Being of Schoolchildren in Ireland. Int J Public Health 2021, 66. [Google Scholar] [CrossRef]
  5. Larsen, K.; Gilliland, J.; Hess, P.; Tucker, P.; Irwin, J.; He, M. The Influence of the Physical Environment and Sociodemographic Characteristics on Children's Mode of Travel to and From School. American Journal of Public Health 2009, 99, 520–526. [Google Scholar] [CrossRef]
  6. Marzi, I.; Demetriou, Y.; Reimers, A. Social and physical environmental correlates of independent mobility in children: a systematic review taking sex/gender differences into account. INTERNATIONAL JOURNAL OF HEALTH GEOGRAPHICS 2018, 17. [Google Scholar] [CrossRef]
  7. Panter, J.R.; Jones, A.P.; van Sluijs, E.M.F.; Griffin, S.J. Attitudes, social support and environmental perceptions as predictors of active commuting behaviour in school children. Journal of Epidemiology & Community Health 2010, 64, 41–48. [Google Scholar] [CrossRef]
  8. Nelson, N.M.; Foley, E.; O'Gorman, D.J.; Moyna, N.M.; Woods, C.B. Active commuting to school: how far is too far? Int J Behav Nutr Phys Act 2008, 5, 1. [Google Scholar] [CrossRef]
  9. Rothman, L.; Macpherson, A.K.; Ross, T.; Buliung, R.N. The decline in active school transportation (AST): A systematic review of the factors related to AST and changes in school transport over time in North America. Preventive Medicine 2018, 111, 314–322. [Google Scholar] [CrossRef]
  10. Wong, B.Y.-M.; Faulkner, G.; Buliung, R. GIS measured environmental correlates of active school transport: A systematic review of 14 studies. International Journal of Behavioral Nutrition and Physical Activity 2011, 8. [Google Scholar] [CrossRef] [PubMed]
  11. Campos-Sánchez, F.S.; Abarca-Álvarez, F.J.; Molina-García, J.; Chillón, P. A GIS-Based Method for Analysing the Association Between School-Built Environment and Home-School Route Measures with Active Commuting to School in Urban Children and Adolescents. Int J Environ Res Public Health 2020, 17. [Google Scholar] [CrossRef] [PubMed]
  12. Hunter, S.; Battista, K.; Leatherdale, S.T.; Spence, J.C.; Carson, V. Longitudinal associations between the school built environment and adolescents’ physical activity: Evidence from the COMPASS study. Journal of Transport and Health 2023, 29. [Google Scholar] [CrossRef]
  13. Mandic, S.; García-Bengoechea, E.; Hopkins, D.; Coppell, K.; Spence, J.C. Adolescents’ perceptions of walking and cycling to school differ based on how far they live from school. Journal of Transport and Health 2022, 24. [Google Scholar] [CrossRef]
  14. Martín-Moraleda, E.; Pinilla-Quintana, I.; Romero-Blanco, C.; Hernández-Martínez, A.; Jiménez-Zazo, F.; Dorado-Suárez, A.; García-Coll, V.; Cabanillas-Cruz, E.; Martínez-Romero, M.T.; Herrador-Colmenero, M.; et al. Lifestyle Behaviours Profile of Spanish Adolescents Who Actively Commute to School. Children (Basel) 2023, 10. [Google Scholar] [CrossRef] [PubMed]
  15. Molina-García, J.; Campos, S.; García-Massó, X.; Herrador-Colmenero, M.; Gálvez-Fernández, P.; Molina-Soberanes, D.; Queralt, A.; Chillón, P. Different neighborhood walkability indexes for active commuting to school are necessary for urban and rural children and adolescents. International Journal of Behavioral Nutrition & Physical Activity 2020, 17, N. [Google Scholar] [CrossRef]
  16. Falb, M.D.; Kanny, D.; Powell, K.E.; Giarrusso, A.J. Estimating the proportion of children who can walk to school. American Journal of Preventive Medicine 2007, 33, 269–275. [Google Scholar] [CrossRef]
  17. Bungum, T.J.; Lounsbery, M.; Moonie, S.; Gast, J. Prevalence and Correlates of Walking and Biking to School Among Adolescents. Journal of Community Health 2009, 34, 129–134. [Google Scholar] [CrossRef] [PubMed]
  18. Babey, S.H.; Hastert, T.A.; Huang, W.; Brown, E.R. Sociodemographic, family, and environmental factors associated with active commuting to school among US adolescents. J Public Health Policy 2009, 30 Suppl 1, S203–220. [Google Scholar] [CrossRef]
  19. Dalton, M.A.; Longacre, M.R.; Drake, K.M.; Gibson, L.; Adachi-Mejia, A.M.; Swain, K.; Xie, H.; Owens, P.M. Built environment predictors of active travel to school among rural adolescents. Am J Prev Med 2011, 40, 312–319. [Google Scholar] [CrossRef]
  20. Ozbil, A.; Yesiltepe, D.; Argin, G.; Rybarczyk, G. Children’s active school travel: Examining the combined perceived and objective built-environment factors from space syntax. International Journal of Environmental Research and Public Health 2021, 18, 1–22. [Google Scholar] [CrossRef]
  21. Silva, A.A.d.P.; Lopes, A.A.D.S.; Silva, J.S.B.; Prado, C.V.; Reis, R.S. Characteristics of the schools' surrounding environment, distance from home and active commuting in adolescents from Curitiba, Brazil. Revista brasileira de epidemiologia = Brazilian journal of epidemiology 2020, 23, e200065–e200065. [Google Scholar] [CrossRef] [PubMed]
  22. Zaragoza, J.; Corral, A.; Estrada, S.; Abós, Á.; Aibar, A. Active or Passive Commuter? Discrepancies in Cut-off Criteria among Adolescents. Int J Environ Res Public Health 2019, 16. [Google Scholar] [CrossRef]
  23. Rodríguez-López, C.; Salas-Fariña, Z.M.; Villa-González, E.; Borges-Cosic, M.; Herrador-Colmenero, M.; Medina-Casaubón, J.; Ortega, F.B.; Chillón, P. The Threshold Distance Associated With Walking From Home to School. Health Educ Behav 2017, 44, 857–866. [Google Scholar] [CrossRef]
  24. Martins, J.; Sallis, J.F.; Marques, A.; Diniz, J.; Da Costa, F.C. Potential correlates and outcomes of active commuting to school among adolescents. Motricidade 2016, 12, 62–72. [Google Scholar] [CrossRef]
  25. Pizarro, A.N.; Schipperijn, J.; Andersen, H.B.; Ribeiro, J.C.; Mota, J.; Santos, M.P. Active commuting to school in Portuguese adolescents: Using PALMS to detect trips. Journal of Transport & Health 2016, 3, 297–304. [Google Scholar]
  26. Chillón, P.; Panter, J.; Corder, K.; Jones, A.P.; Van Sluijs, E.M. A longitudinal study of the distance that young people walk to school. Health Place 2015, 31, 133–137. [Google Scholar] [CrossRef]
  27. Mandic, S.; Leon de la Barra, S.; García Bengoechea, E.; Stevens, E.; Flaherty, C.; Moore, A.; Middlemiss, M.; Williams, J.; Skidmore, P. Personal, social and environmental correlates of active transport to school among adolescents in Otago, New Zealand. Journal of Science & Medicine in Sport 2015, 18, 432–437. [Google Scholar] [CrossRef]
  28. Carlson, J.A.; Sallis, J.F.; Kerr, J.; Conway, T.L.; Cain, K.; Frank, L.D.; Saelens, B.E. Built environment characteristics and parent active transportation are associated with active travel to school in youth age 12-15. Br J Sports Med 2014, 48, 1634–1639. [Google Scholar] [CrossRef] [PubMed]
  29. Mandic, S.; García-Bengoechea, E.; Hopkins, D.; Coppell, K.; Smith, M.; Moore, A.; Keall, M.; Ergler, C.; Sandretto, S.; Wilson, G.; et al. Examining the transport to school patterns of New Zealand adolescents by home-to-school distance and settlement types. Journal of Transport & Health 2023, 30, 12. [Google Scholar] [CrossRef]
  30. Martin, S.L.; Lee, S.M.; Lowry, R. National prevalence and correlates of walking and bicycling to school. Am J Prev Med 2007, 33, 98–105. [Google Scholar] [CrossRef]
  31. McDonald, N.C. Active transportation to school: trends among U.S. schoolchildren, 1969-2001. Am J Prev Med 2007, 32, 509–516. [Google Scholar] [CrossRef] [PubMed]
  32. Pabayo, R.; Gauvin, L.; Barnett, T. Longitudinal Changes in Active Transportation to School in Canadian Youth Aged 6 Through 16 Years. PEDIATRICS 2011, 128, E404–E413. [Google Scholar] [CrossRef] [PubMed]
  33. Booth, M.L.; Okely, A.D.; Denney-Wilson, E.; Hardy, L.L.; Dobbins, T.; Wen, L.M.; Rissel, C. Characteristics of travel to and from school among adolescents in NSW, Australia. Journal of Paediatrics and Child Health 2007, 43, 755–761. [Google Scholar] [CrossRef] [PubMed]
  34. Rahman, M.L.; Pocock, T.; Moore, A.; Mandic, S. Active Transport to School and School Neighbourhood Built Environment across Urbanisation Settings in Otago, New Zealand. International Journal of Environmental Research and Public Health 2020, 17. [Google Scholar] [CrossRef]
  35. Chillón, P.; Molina-García, J.; Castillo, I.; Queralt, A. What distance do university students walk and bike daily to class in Spain. Journal of Transport & Health 2016, 3, 315–320. [Google Scholar] [CrossRef]
  36. Estevan, I.; Queralt, A.; Molina-Garcia, J. Biking to School: The Role of Bicycle-Sharing Programs in Adolescents. Journal of School Health 2018, 88, 871–876. [Google Scholar] [CrossRef]
  37. Mandic, S.; García Bengoechea, E.; Coppell, K.J.; Keall, M.; Smith, M.; Hopkins, D.; Sandretto, S.; Wilson, G.; Kidd, G.; Flaherty, C.; et al. Travel to school patterns and perceptions of walking to school in New Zealand adolescents before versus during the COVID-19 pandemic. Journal of Transport & Health 2024, 36, 101803. [Google Scholar] [CrossRef]
  38. Martín-Moraleda, E.; Pinilla-Quintana, I.; Jiménez-Zazo, F.; Martínez-Romero, M.; Dorado-Suárez, A.; Romero-Blanco, C.; García-Coll, V.; Cabanillas, E.; Mota-Utanda, C.; Gómez, N.; et al. THE PACO&PACA CLM (CYCLE AND WALK TO SCHOOL AND CYCLE AND WALK HOME IN CASTILLA-LA MANCHA) PROJECT PROTOCOL. Revista Iberoamericana De Ciencias De La Actividad Fisica Y El Deporte 2023, 12, 1–22. [Google Scholar] [CrossRef]
  39. World Medical Association. World Medical Association Declaration of Helsinki: ethical principles for medical research involving human subjects. Jama 2013, 310, 2191–2194. [Google Scholar] [CrossRef]
  40. MARM. Población y Sociedad Rural. Análisis y Prospectiva - Serie AgrInfo nº12. 2009.
  41. von Elm, E.; Altman, D.G.; Egger, M.; Pocock, S.J.; Gøtzsche, P.C.; Vandenbroucke, J.P. The Strengthening the Reporting of Observational Studies in Epidemiology (STROBE) Statement: guidelines for reporting observational studies. Int J Surg 2014, 12, 1495–1499. [Google Scholar] [CrossRef]
  42. Chillón, P.; Herrador-Colmenero, M.; Migueles, J.H.; Cabanas-Sánchez, V.; Fernández-Santos, J.R.; Veiga Ó, L.; Castro-Piñero, J. Convergent validation of a questionnaire to assess the mode and frequency of commuting to and from school. Scand J Public Health 2017, 45, 612–620. [Google Scholar] [CrossRef] [PubMed]
  43. Gálvez-Fernández, P.; Saucedo-Araujo, R.G.; Campos-Garzón, P.; Aranda-Balboa, M.J.; Molina-Soberanes, D.; Segura-Díaz, J.M.; Herrador-Colmenero, M.; Huertas-Delgado, F.J.; Villa-González, E.; Barranco-Ruiz, Y.; et al. Active commuting to school and associated health indicators: Evaluation protocol of the PACO study «Cycle and Walk to School» and its implementation in secondary school. Retos 2021, 649–657. [Google Scholar] [CrossRef]
  44. Mandic, S.; Williams, J.; Moore, A.; Hopkins, D.; Flaherty, C.; Wilson, G.; Bengoechea, E.G.; Spence, J.C. Built Environment and Active Transport to School (BEATS) Study: Protocol for a cross-sectional study. BMJ Open 2016, 6. [Google Scholar] [CrossRef]
  45. Villa-González, E.; Rodríguez-López, C.; Barranco-Ruiz, Y.; Cabezas-Arévalo, L.F.; Chillón, P. Evaluating of the agreement between two methods to determine the distance of the active commuting to school in schoolchildren. Nutricion Hospitalaria 2016, 33, 713–718. [Google Scholar] [CrossRef]
  46. Komori, O.; Eguchi, S. A boosting method for maximizing the partial area under the ROC curve. BMC Bioinformatics 2010, 11, 314. [Google Scholar] [CrossRef]
  47. Schisterman, E.F.; Perkins, N.J.; Liu, A.; Bondell, H. Optimal cut-point and its corresponding youden index to discriminate individuals using pooled blood samples. Epidemiology 2005, 16, 73–81. [Google Scholar] [CrossRef] [PubMed]
  48. Pocock, T.; Moore, A.; Keall, M.; Mandic, S. Physical and spatial assessment of school neighbourhood built environments for active transport to school in adolescents from Dunedin (New Zealand). Health & Place 2019, 55, 1–8. [Google Scholar] [CrossRef]
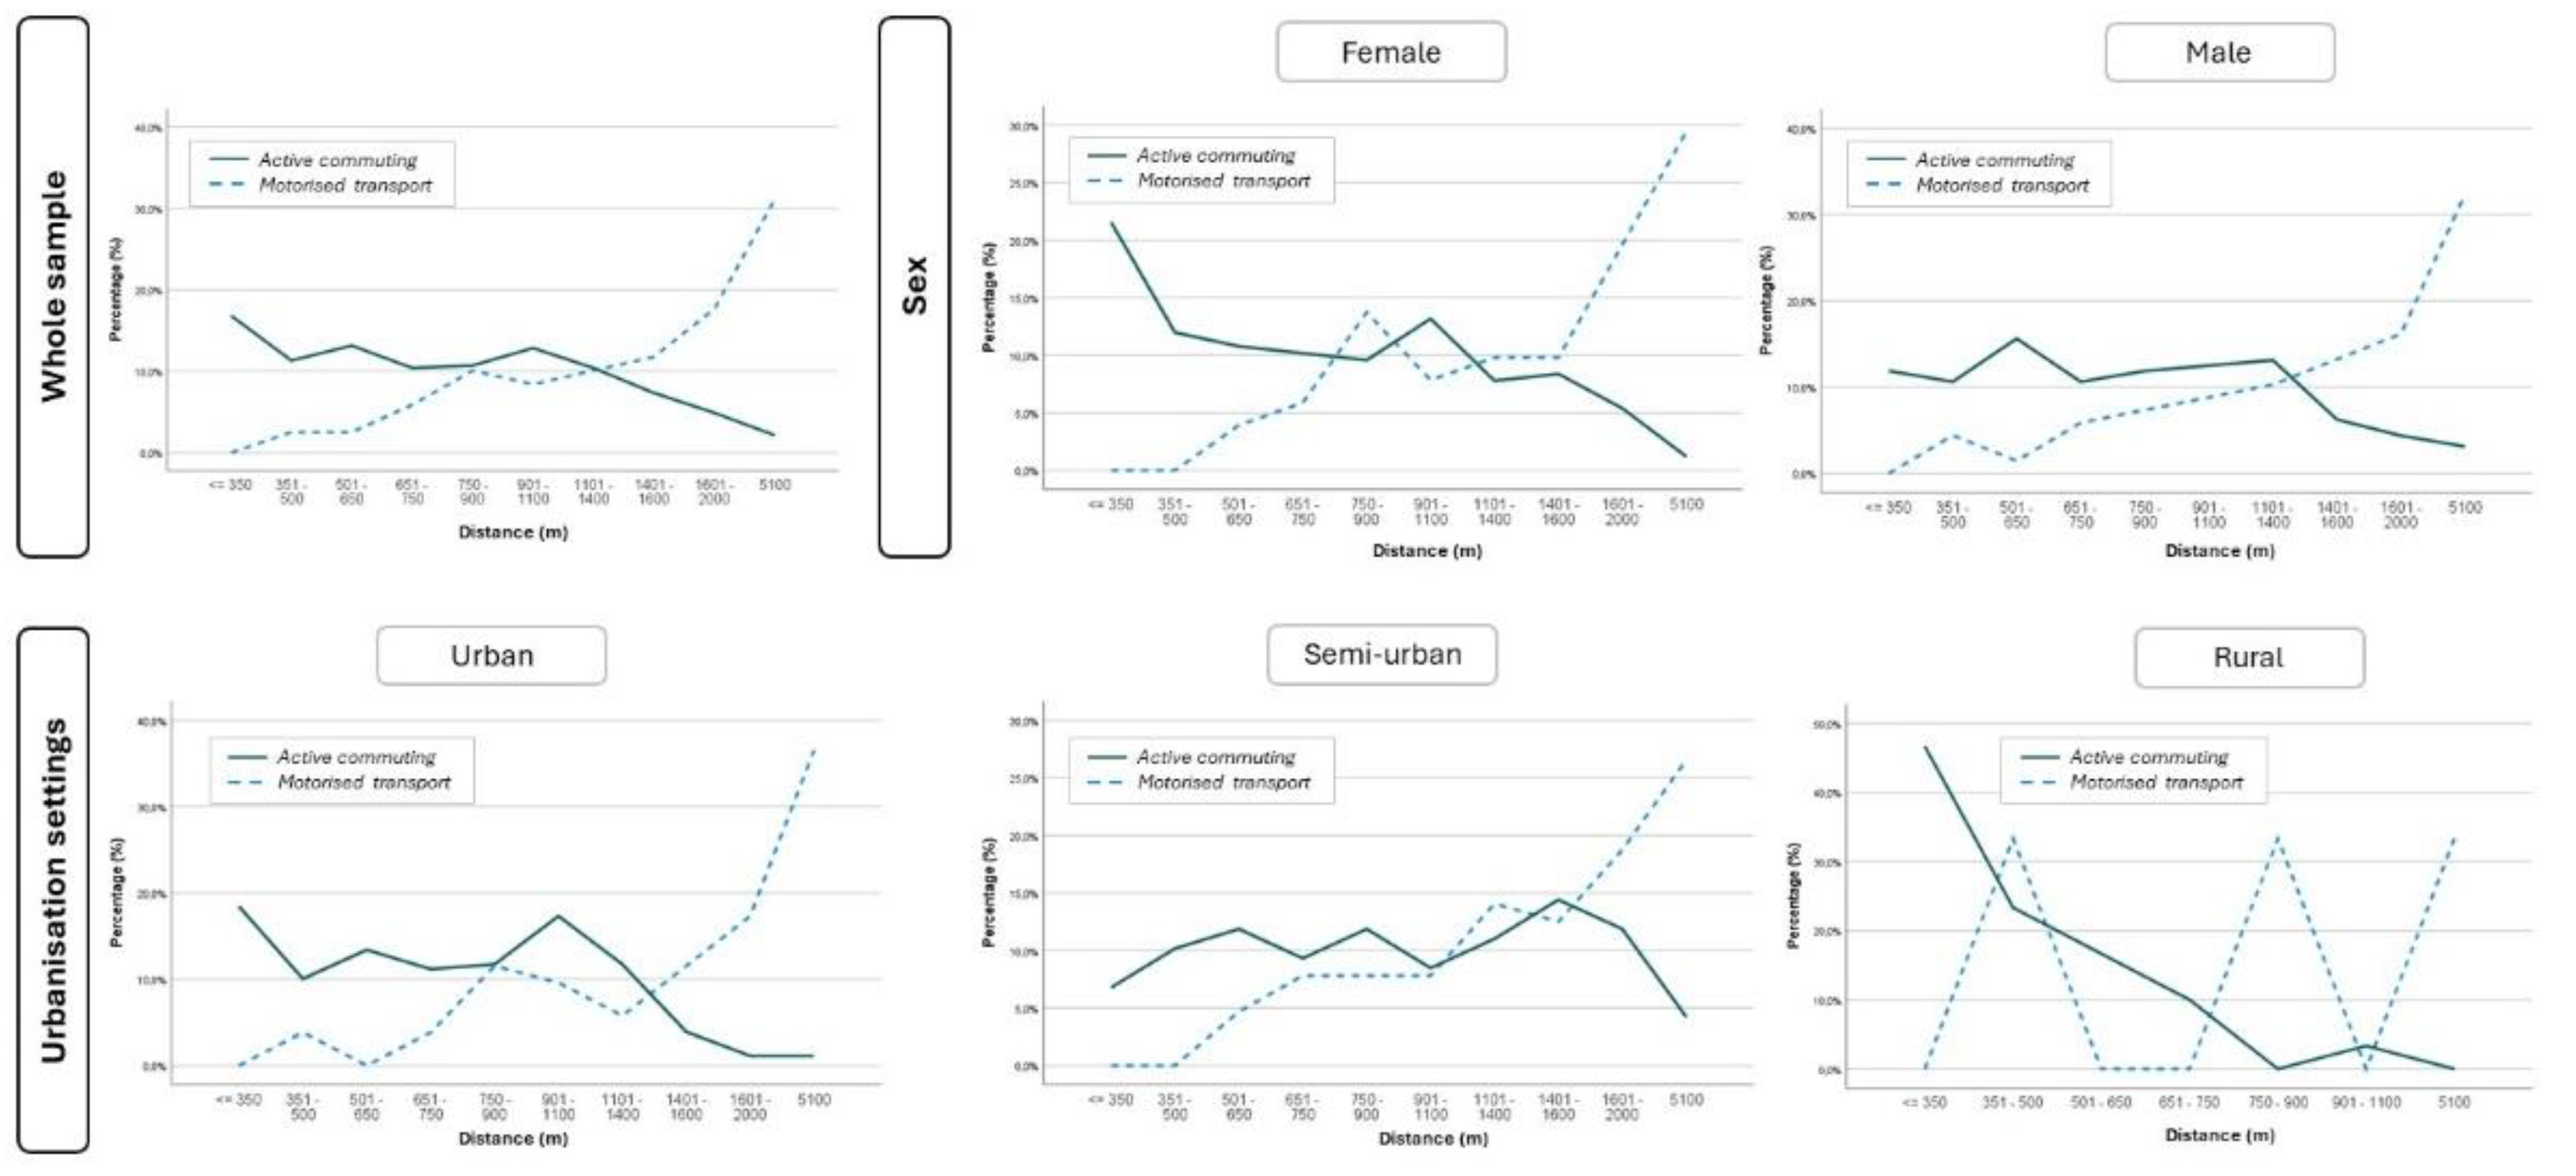
Figure 1. Threshold distance by adolescents’ modes of school commute (walking vs. motorised) within the whole sample, among females and males, and within urban, semi-urban and rural settings.
Preprints 119363 g001
Figure 2. ROC curves for predicting walkable distances to school within the whole sample, among females and males, and within the different urban, semi-urban and rural settings.
Preprints 119363 g002
Figure 3. Comparison of ROC curves between females and males within the whole sample, and between urbanisation settings.
Preprints 119363 g003
Table 1. Descriptive data for the whole sample, and split by sex and urbanisation settings.
Whole Sample Sex Urbanisation settings
Females Males p-value Urban Semi-urban Rural p-value
N (%) 448 219 (48.9) 229 (51.1) - 233 (51.9) 183 (40.8) 33 (7.3) -
Age Mean (SD) 14.80 (0.60) 14.76 (0.62) 14.83 (0.562) 0.127 14.74 (0.55) 14.86 (0.634) 14.84 (0.60) 0.113
Modes to commute to school
n (%) Walk 326 (73.1) 166 (76.1) 160 (70.2) 0.432 178 (77.1) 118 (64.8) 30 (90.9) 0.001
Cycle 1 (0.2) 1 (0.5) 0 (0.0) 1 (0.4) 0 (0.0) 0 (0.0)
Car 94 (21.1) 39 (17.9) 55 (24.1) 43 (18.6) 48 (26.4) 3 (9.1)
School bus 20 (4.5) 10 (4.6) 10 (4.4) 4 (1.7) 16 (8.8) 0 (0.0)
Public bus 5 (1.1) 2 (0.9) 3 (1.3) 5 (2.2) 0 (0.0) 0 (0.0)
Active vs. motorised
n (%) Active 327 (73.3) 167 (76.6) 160 (70.2) 0.125 179 (77.5) 118 (64.8) 30 (90.9) 0.001
Motorised 119 (26.7) 51 (23.4) 68 (29.8) 52 (22.5) 64 (35.2) 3 (9.1)
Distance Mean (SD) 1167.77 (963.00) 1085.80 (912.17) 1245.79 (1004.80) 0.073 1027.01 (746.17) 1469.56 (1158.73) 478.82 (365.93) <0.001
N: sample size; n: number of participants; SD: standard deviation; %: percentage.Significance set at p-value<0.05.
Table 2. Potential predictors of active commuting to school among adolescents.
Variables Determinant factors of active commuting
Coef. B p-value OR (95% CI)
Sex (female) -0.186 0.479 0.830 (0.496-1.389)
Urbanisation settings: urban, semi-urban or rural (1) -0.182 0.797 ---
Urbanisation settings: urban, semi-urban or rural (2) -0.082 0.500 0.934 (0.492-1.414)
Urbanisation settings: urban, semi-urban or rural (3) -0.002 0.905 0.921 (0.239-3.557)
Distance (meters) -0.002 <0.001 0.998 (0.998-0.999)
Age (years) 0.326 0.168 1.386 (0.872-2.203)
Const. -1.266 0.717 0.282 (---)
Coef.: coefficient; Const: constant; OR: Odds Ration; CI: confidence interval. Significance set at p-value≤0.05.
Disclaimer/Publisher’s Note: The statements, opinions and data contained in all publications are solely those of the individual author(s) and contributor(s) and not of MDPI and/or the editor(s). MDPI and/or the editor(s) disclaim responsibility for any injury to people or property resulting from any ideas, methods, instructions or products referred to in the content.
Copyright: This open access article is published under a Creative Commons CC BY 4.0 license, which permit the free download, distribution, and reuse, provided that the author and preprint are cited in any reuse.
Prerpints.org logo

Preprints.org is a free preprint server supported by MDPI in Basel, Switzerland.

Subscribe

© 2024 MDPI (Basel, Switzerland) unless otherwise stated