1. Introduction
The development of new technologies such as mobile devices, the internet and social media, as well as the recent COVID-19 pandemic, have opened up new areas of human perception. Instead of photoreceptors in the retina, people have expanded their vision with infrared (IR) and ultraviolet (UV) hyperspectral cameras. Instead of listening to the sounds of nature, people have created electronic music and new combinations of vibrations. In recent years, the number of sources of electromagnetic fields in urban areas has greatly increased, mainly due to the proliferation of cellular towers [
1]. This influence of abnormal doses of electromagnetic (EM) radiation affects the human body beyond the level of natural sensory perception. Due to constant interaction with machines and robots such as smartphones, some people have started to 'feel' wifi. Certain individuals even consider this wireless network signal strength to be a necessity and a basic resource, on par with access to air, water and food at the bottom of Maslow's Hierarchy of Needs.
Electromagnetic architecture has become the environment in which people live and work. These electromagnetic fields are a powerful noise that interferes with the brain's delicate electro-activity, which can cause health problems if overexposed. In particular, it often affects brain activity by resynchronising it, leading to temporary or permanent changes in behavior [
2]. Excessive screen time affects sleep quality. Sleep deprivation has both physical and psychological effects. Physical effects include high blood pressure, obesity, low HDL cholesterol, poor stress regulation and insulin resistance, impaired vision and reduced bone density. Psychological effects include internalising and externalising behaviours, depressive symptoms and suicidal behaviours associated with ADHD. Other psychoneurological effects: addictive use of screen time, decrease in social interactions and craving behavior. All of which resemble substance dependence behavior [
3]. Instead of interacting directly with other people, today's population uses new hermetic languages, avatars, emoticons, rankings and gamification. People no longer need to be closely connected to Facebook, Instagram and other social media connections - aka 'friends'. Covid times have distanced people even further, bringing them closer to mobile devices that successfully replace analog presence. Smartwatches measuring physiological parameters such as heart rate, steps, calories burned, sleep duration, activity levels and stress began to be worn 24 hours a day, 7 days a week.
The surveillance of human life and its expression is based on new ways of absorbing and processing information. The flow of data is so overwhelming that people have learned to filter it. The field of perception changed so that instead of sharpening their senses, people deliberately deprive themselves of stimuli, e.g. by using headphones on public transport to avoid social interactions. In this sense, people have become more self-creative, transforming their levels of perception and quality of life in an entirely new way. There are also some symptoms of a reduction in human cognitive abilities related to the use of technology. Night vision, polarized light vision, time perception, memory for long numbers and terrain maps began to become obsolete in everyday life and were replaced by technology. Instead of storing information, people have learned to search for information in the digital cloud. Human brains have begun to operate at meta levels of recognition. The recent emergence of ChatGPT has optimized language models for dialogue and opened new avenues for human behavioral responsiveness. New ethical dilemmas have emerged, such as questions of copyright on machine-generated artwork, and responsibility for AI-generated advice and responses. Due to the nature of the large language model, the algorithm generates the most likely sequence of words, so ChatGPT sometimes writes plausible-sounding but incorrect or nonsensical answers. Questioning seems to be just one feature that cannot be replaced by machines. So is exploration for exploration's sake.
In this paper, the authors focus on the remote monitoring of people living in the new technologized reality mentioned above. In order to collect relevant data, volunteers aged 18-45 years were isolated for one week in a specially adapted habitat simulating selected conditions of the spaceship described in Chapter 3. Limiting the observation area to a very confined space allowed a detailed and controlled observation of human behavior, in particular adaptation mechanisms and survival strategies [
4]. The knowledge gained can be used to optimize the design of highly tolerant life support systems in extreme environments, such as isolated human bases in polar regions, underwater and in developing technologies for space tourism. The life support systems considered in this work are the critical factors for survival in isolation, i.e.: healthy air, access to food and water, electricity, communication and waste management.
2. Space Analog
Technology is currently capable of sustaining human life in orbit. As of February 2023, 644 astronauts/cosmonauts/taikonauts have crossed the Karman line of space (100 km above mean sea level). 597 have been in Earth orbit and orbited it [
5,
6]. More people can be in space at the same time, with the current record of 19 aboard the ISS [
7], opening up the possibility of creating a commercial infrastructure for space tourism and expanding human presence in extreme environments. The growing interest of the private sector in space tourism brings with it new needs for the development of technologies that will provide a safe and sustainable existence for people who are culturally and educationally diverse and who, on average, are in much poorer health than the people who actually go into space. The development of life support technologies for space tourism could be a more general solution for applications on Earth, for example in refugee camps, polar regions, deserts and underwater environments. Several methods and tools are used to accelerate this development. One is the simulation of the space environment in a facility called a habitat, in the form of an analog mission.
3. AATC Habitat
The Analog Astronaut Training Centre (AATC) is a 57m2 human research laboratory (habitat) specialized in conducting analogue space missions in complete isolation from the external environment. It is located in Poland in Rzepiennik Strzyżewski, 120 km southeast of Kraków. The habitat was established in 2016 as a chronobiology chamber (laboratory of time) to accommodate six-person crews during a seven-day analog mission. By September 2024, AATC had organized 89 analogue missions, collecting data from more than 400 people, women and men aged 6-57, from six continents, different cultural and educational backgrounds, religions, and with various health problems such as depression, PTSD, people with physical and mental disabilities. All participants contributed to the collection of high-quality biometric and environmental data, which are stored in the AATC database [
8]. The design of the analog mission was based on the reconstruction of physical and psychological stimuli for the space environment. The main aspects of the reconstructed analog conditions in the AATC habitat are:
3.1. Chronobiology Chamber
Based on the assumption that time is perceived differently in space, a time architecture project was developed in 2015 in the Advanced Concepts Team with the European Space Agency [
9,
10]. Time illusions were induced in test subjects by complete isolation from external sunlight and the use of altered time references, such as lunar time [
11,
12], with frequent time zone changes and multiple time references. All mobile devices and on-board computers in the habitat were set to specific time zones controlled by the Mission Control Center, e.g. first two days of isolation for Houston, Texas time (UTC - 06:00), then Lhasa, Tibet time zone (UTC + 08:00), then Bantam, Cocos (Keeling) Islands time zone (UTC + 06:30). In most cases, three days was enough for analog astronauts to be completely confused about time. The Subjective Time Perception web application, available at
www.stpa.astronaut.center, was used to monitor this parameter in volunteers twice daily: in the morning and before bed;
3.2. Fully Controlled, Isolated Environment
Full control and monitoring of the habitat environment is a critical aspect of achieving safety, repeatable conditions for human subject studies and efficient operation of the Mission Control Center. Monitoring of the habitat conditions not only allowed continuous data collection, but also allowed modification and alteration of specific parameters of the base, such as temperature, light intensity, power consumption, internet band capacity, etc. The implementation of multiple sensor arrays in each module at different heights in the habitat provided full coverage and monitoring in 3D, allowing higher resolution of the collected data;
3.3. Emergency Simulations
The AATC Habitat differs from other similar facilities in the world in that it allows the simulation of high-fidelity emergency scenarios in accordance with emergency procedures provided to the crew in advance during the pre-training phase. Such simulations include: micrometeor shower and impact, loss of communications, power failure, coolant leak, uncontrolled chemical reaction (fire) and rapid uncontrolled chemical reaction (explosion). The above contingencies are usually simulated at the end of the mission (Day 6). Some contingencies are unplanned and related to real events, e.g. coronal mass ejection simulations are synchronized with real-time space weather and solar activity, e.g. when an X-type solar flare is detected [
13]. Micrometeorite showers are correlated with hail or rain outside the habitat, recorded by an external weather station. Despite the simulated emergencies, several real emergencies occur inside the habitat, such as loss of communication with Starlink constellations, malfunction of critical equipment, power outages and depletion of limited resources such as technical water;
3.4. Human-Robot Interactions
The symbiotic interdependence between man and machine is one of the aims of the analog simulations at the AATC. The habitat contains more than 200 electronic devices that accompany life in isolation, including fans, bioreactors, air conditioners, heaters, hydroponic systems, energy bike, treadmill, mobile instrumentation, medical instruments, vacuum chamber, 3D printers, microscopes, incubators, sterilizers, microwave, induction kitchen, oven, random positioning machines, computers, small rovers and multiple sensors. Daily interaction with a wide range of electronic devices improves familiarity with the equipment and an intelligent ecological power saving strategy to reduce the risk of short circuits. Some equipment must operate throughout the mission, while others can be used for limited periods. The Mission Control Center (MCC) supports the use of electronic devices by suggesting charging times for multiple sensors and smartwatches during the mission;
3.5. Limited Resources
Living space, mobility, privacy, communication, power, clothing, food and water are limited in the habitat. The crew communicates in writing with the MCC using a Signal communicator. Other forms of contact with the outside world are kept to an absolute minimum. Any outside communication must be reported. Electricity restrictions are based on data from solar power plants in the Egyptian desert [
14] and correspond to 8 kWh per day per crew member. Analog astronauts are limited to 3 kg of personal effects, including clothing. Crews choose one of three diets: coeliac, vegetarian and control (with meat). The menu is very strict. Water is limited to 3 liters of drinking water per person per day (in 1.5 liter PET bottles) and 5 liters of technical water per person per day (in 5 liter PET bottles). The water is stored in the same habitable space as the crew, which further restricts living space;
3.6. Altered Atmosphere
Although the habitat is not pressurized, the atmosphere inside is very different from the natural environment. The main driving parameters are CO2 levels, which normally range from 500-1000 ppm, reaching 2000 ppm during isolation. During contingency simulations, these levels can briefly rise to 5000 ppm.;
3.7. Mission Schedule
Mission plans are prepared in advance of the mission so that each activity is planned in advance. This keeps participants motivated, productive, focused and task oriented.
4. Sensors and Data Visualization
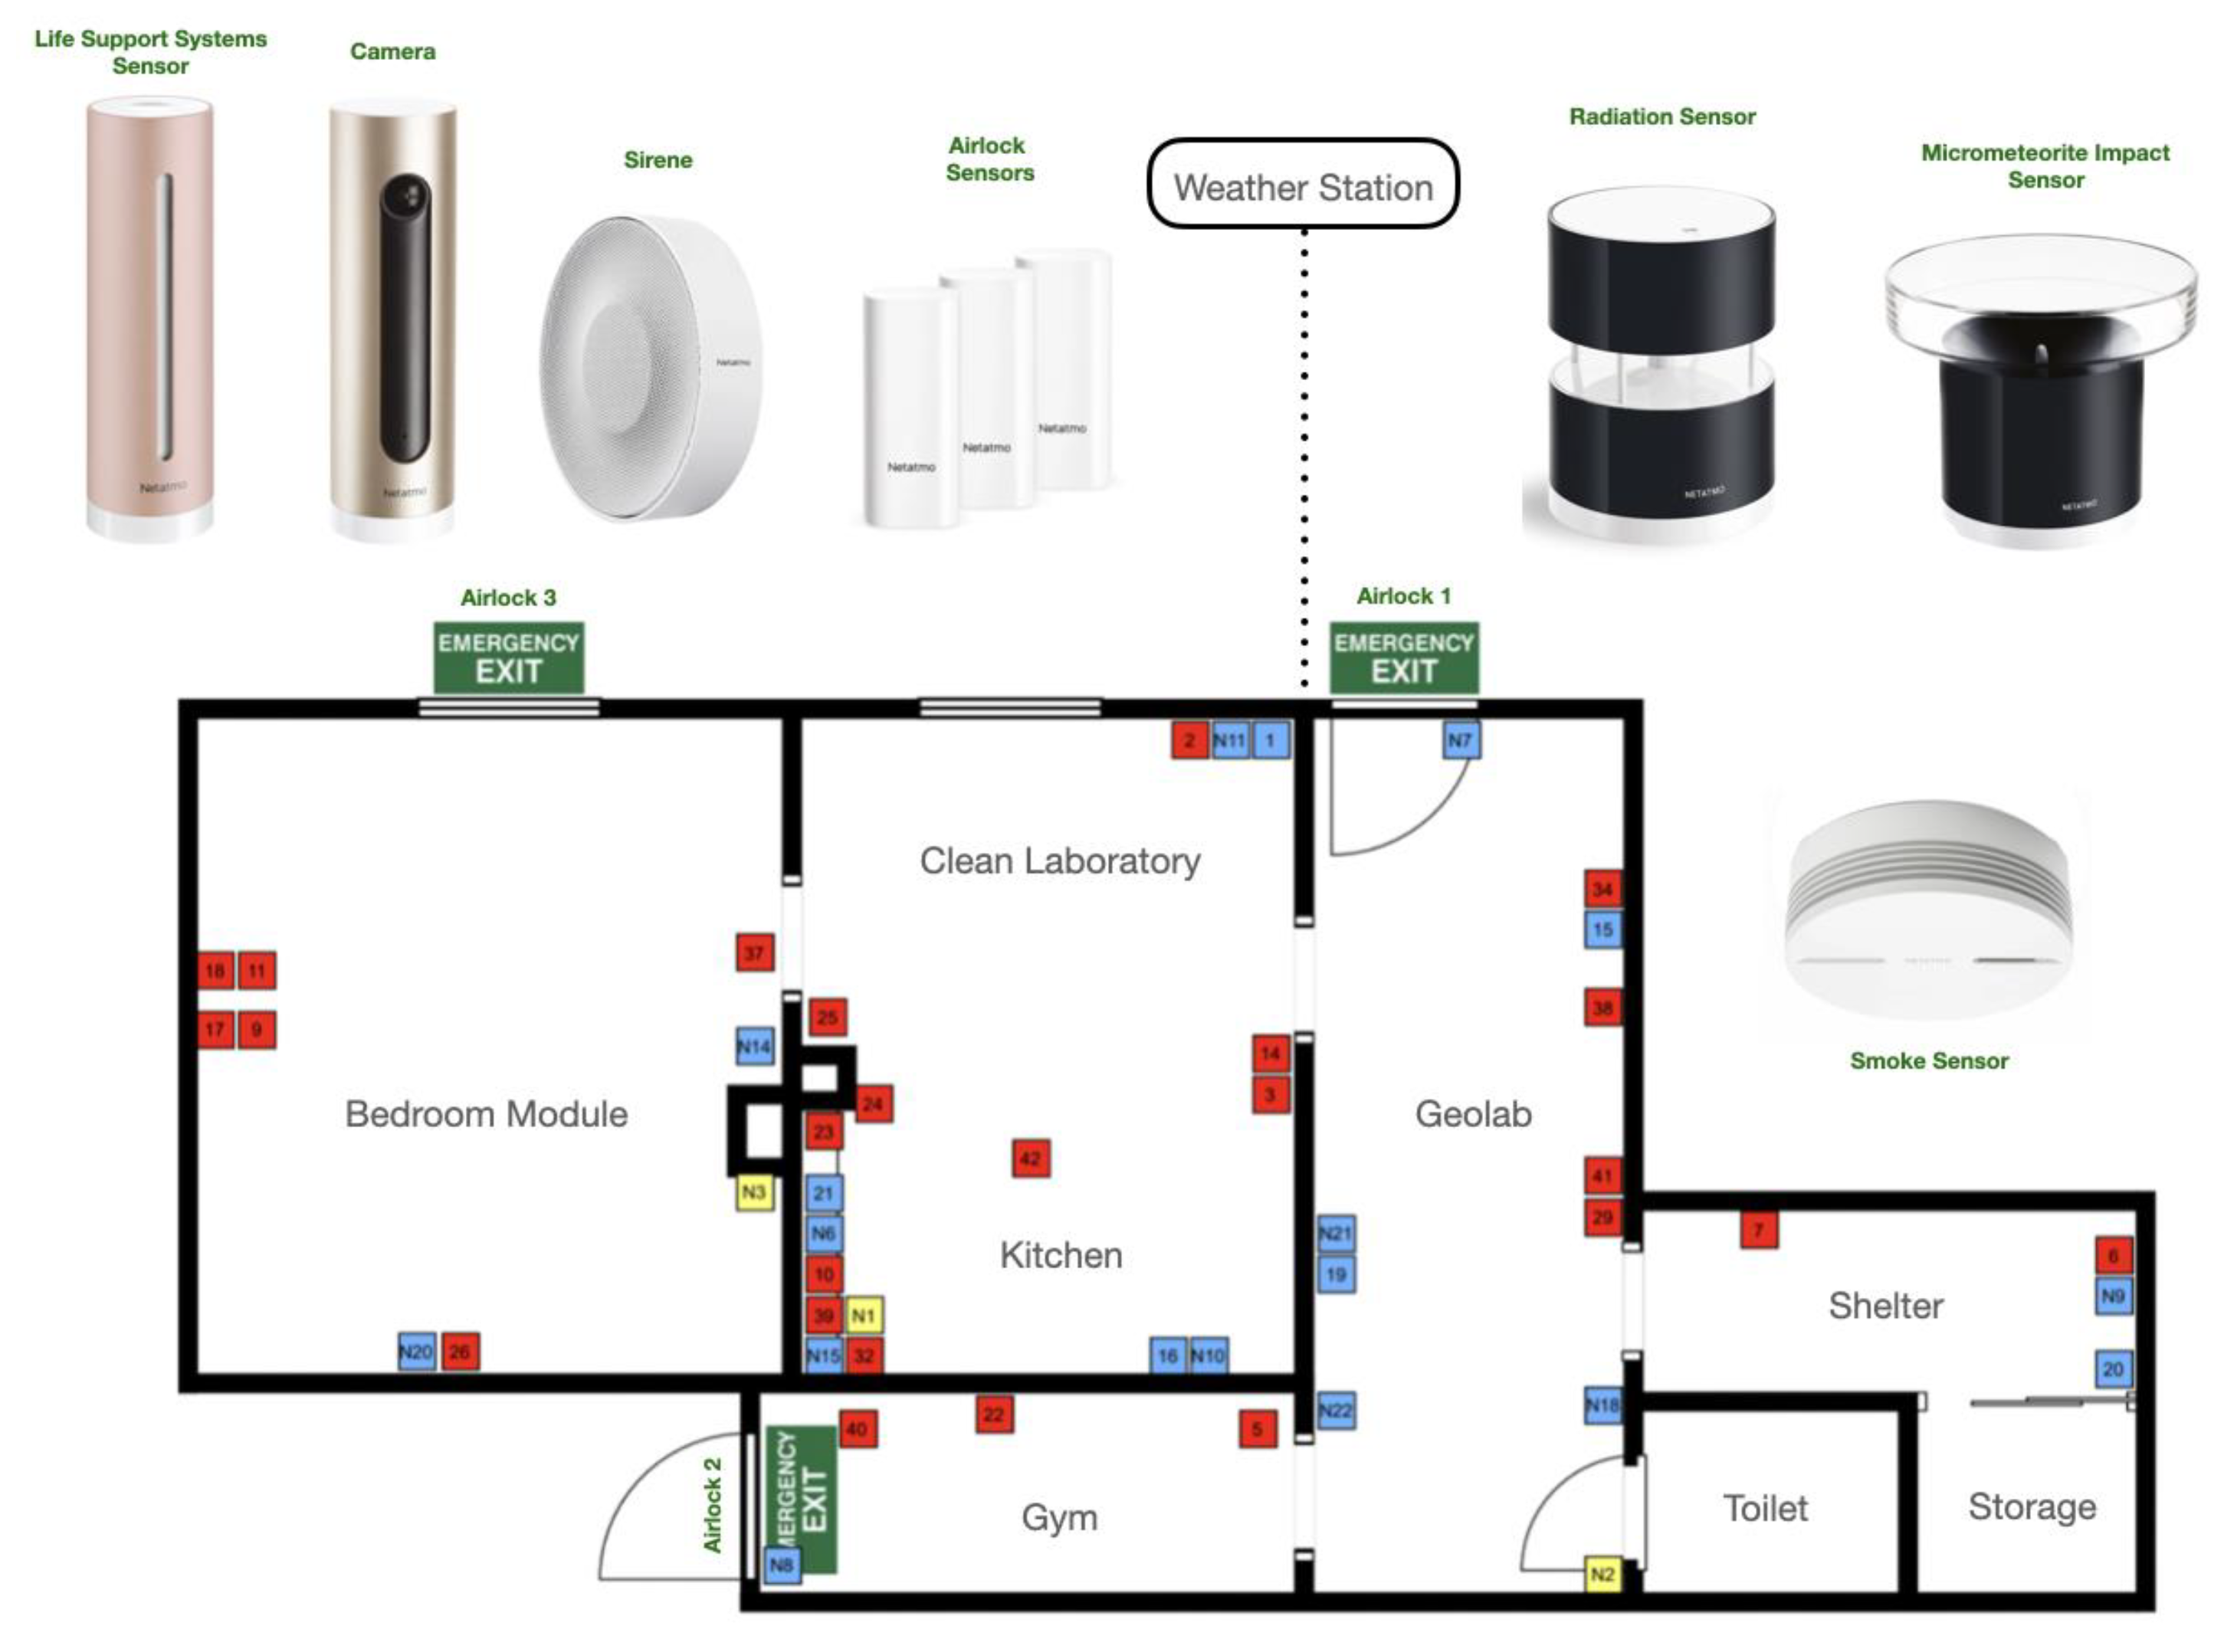
The controllable light in the habitat contains different spectral ranges including UVA, UVB, visual 5000K and IR. The lighting environment in each module can be changed by the crew as required. Ambient noise levels in the research station fluctuate around 50-60 dB, similar to the International Space Station. The main sources of noise are the convection fans. The location and distribution of both fans and ventilation ducts have been determined based on CO
2 levels and diffusion monitored by a suite of atmospheric sensors (
Figure 1).
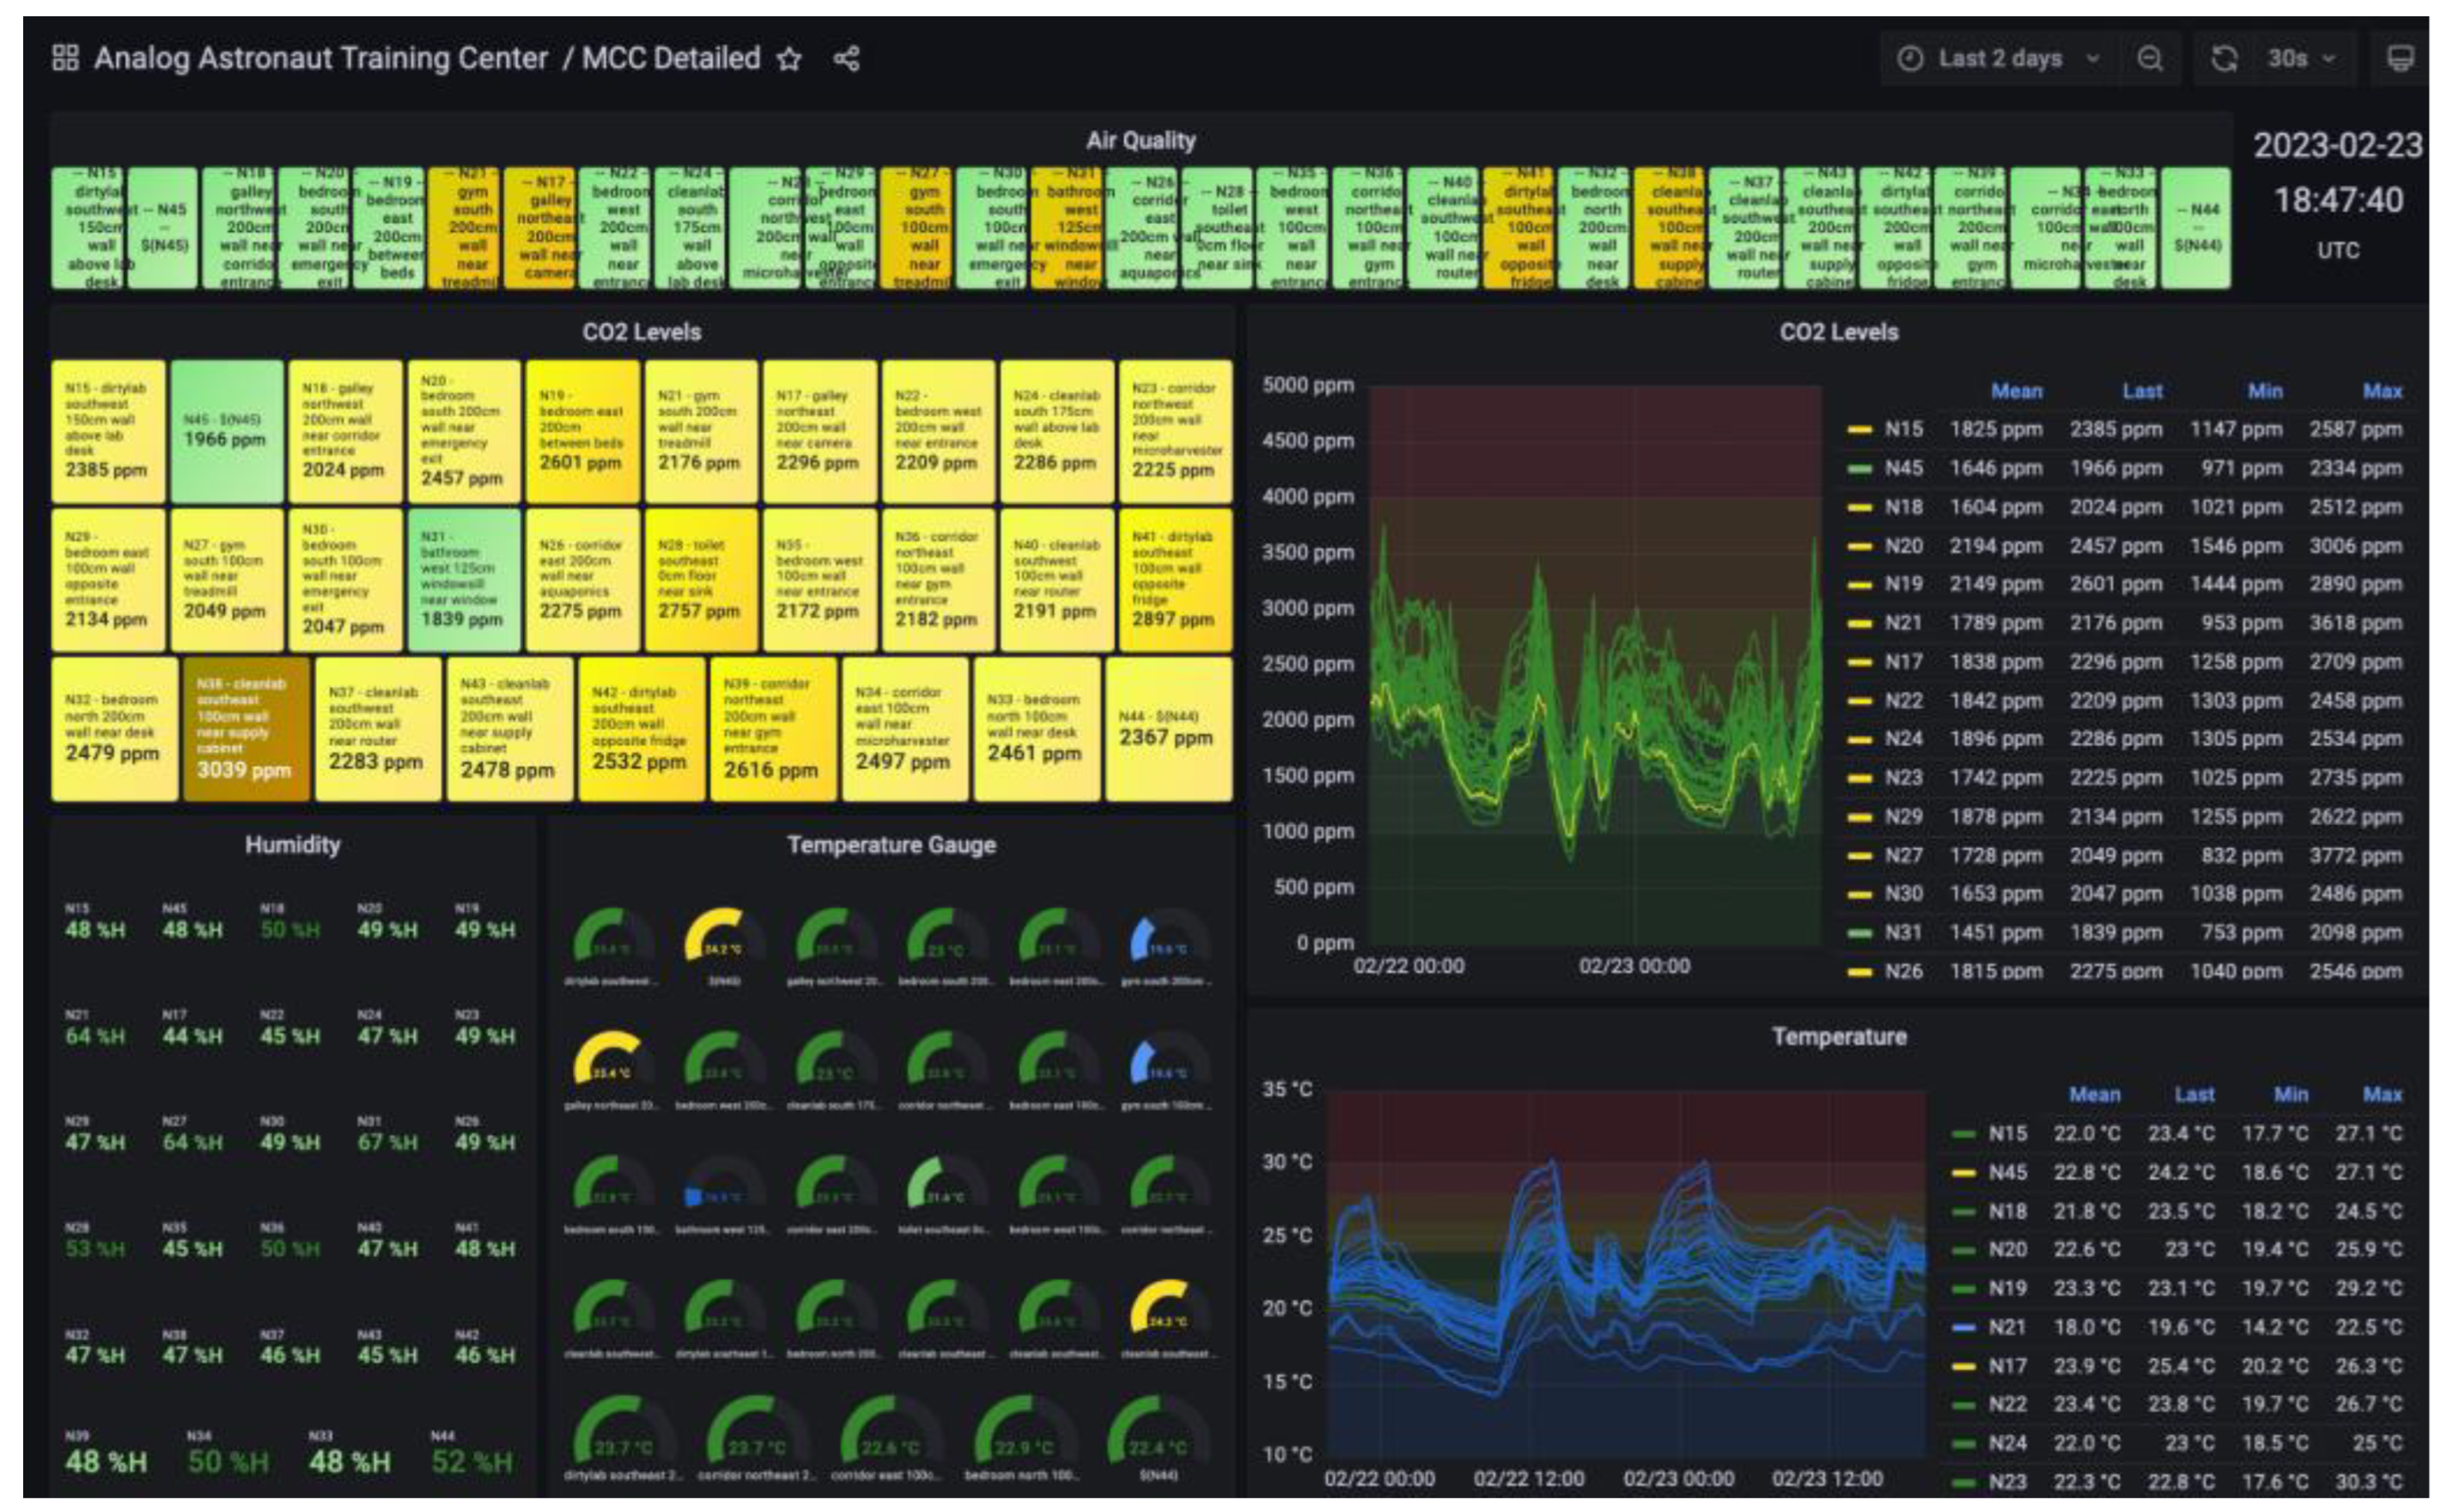
As of February 2023, the AATC habitat is equipped with 143 sensors for real-time monitoring and control of environmental conditions within the lab. All sensor data is fed directly into the InfluxDB time series database and later synchronized with a private cloud infrastructure. Sensor data is integrated with an internal reporting and monitoring system and visualized for MCC and analogue astronauts using an open source version of Grafana software (
Figure 2). The Habitat sensors use two primary network types: Z-Wave protocol (Aeotec sensors [
15]) and regular Wi-Fi (Netatmo devices [
16]).
Currently habitat environmental control system consist of:
- −
42 Aeotec MultiSensor 6
- −
32 Aeotec Smart Switch 7 sensor
- −
6 Aeotec Cam 360 cameras
- −
1 Aeotec Multi-color LED Stripe
- −
1 Aeotec Multi-color LED Bulb
- −
1 Aeotec Multi-white LED Bulb
- −
1 Aeotec Home Energy Meter Gen5
- −
1 Aeotec WallMote Quad
- −
1 Aeotec Water Flood sensor
- −
1 Aeotec Z-Wave repeater
- −
1 Raspberry PI with Raspberry PI shield (Z-Wave gateway)
- −
46 Netatmo Smart Indoor Air Quality Monitor
- −
3 Netatmo Smart Door and Window Open/Close sensor
- −
3 Netatmo Smart Indoor Camera (with AI powered face recognition)
- −
2 Netatmo Smart Outdoor Cameras (with AI powered face recognition)
- −
1 Netatmo Smart Indoor Siren
- −
1 Netatmo Smart Home Weather Station with additional smart indoor module
- −
1 Netatmo Smart Anemometer (wind gust direction and strength sensor)
- −
1 Netatmo Smart Rain Gauge
- −
1 Netatmo Smart Smoke Detector
- −
1 Netatmo Smart Carbon Monoxide Alarm
In addition, certain sensors can also act as actuators, allowing the environment to be controlled and operated remotely by turning lights on and off, switching appliances, etc.
5. Monitoring of Environment
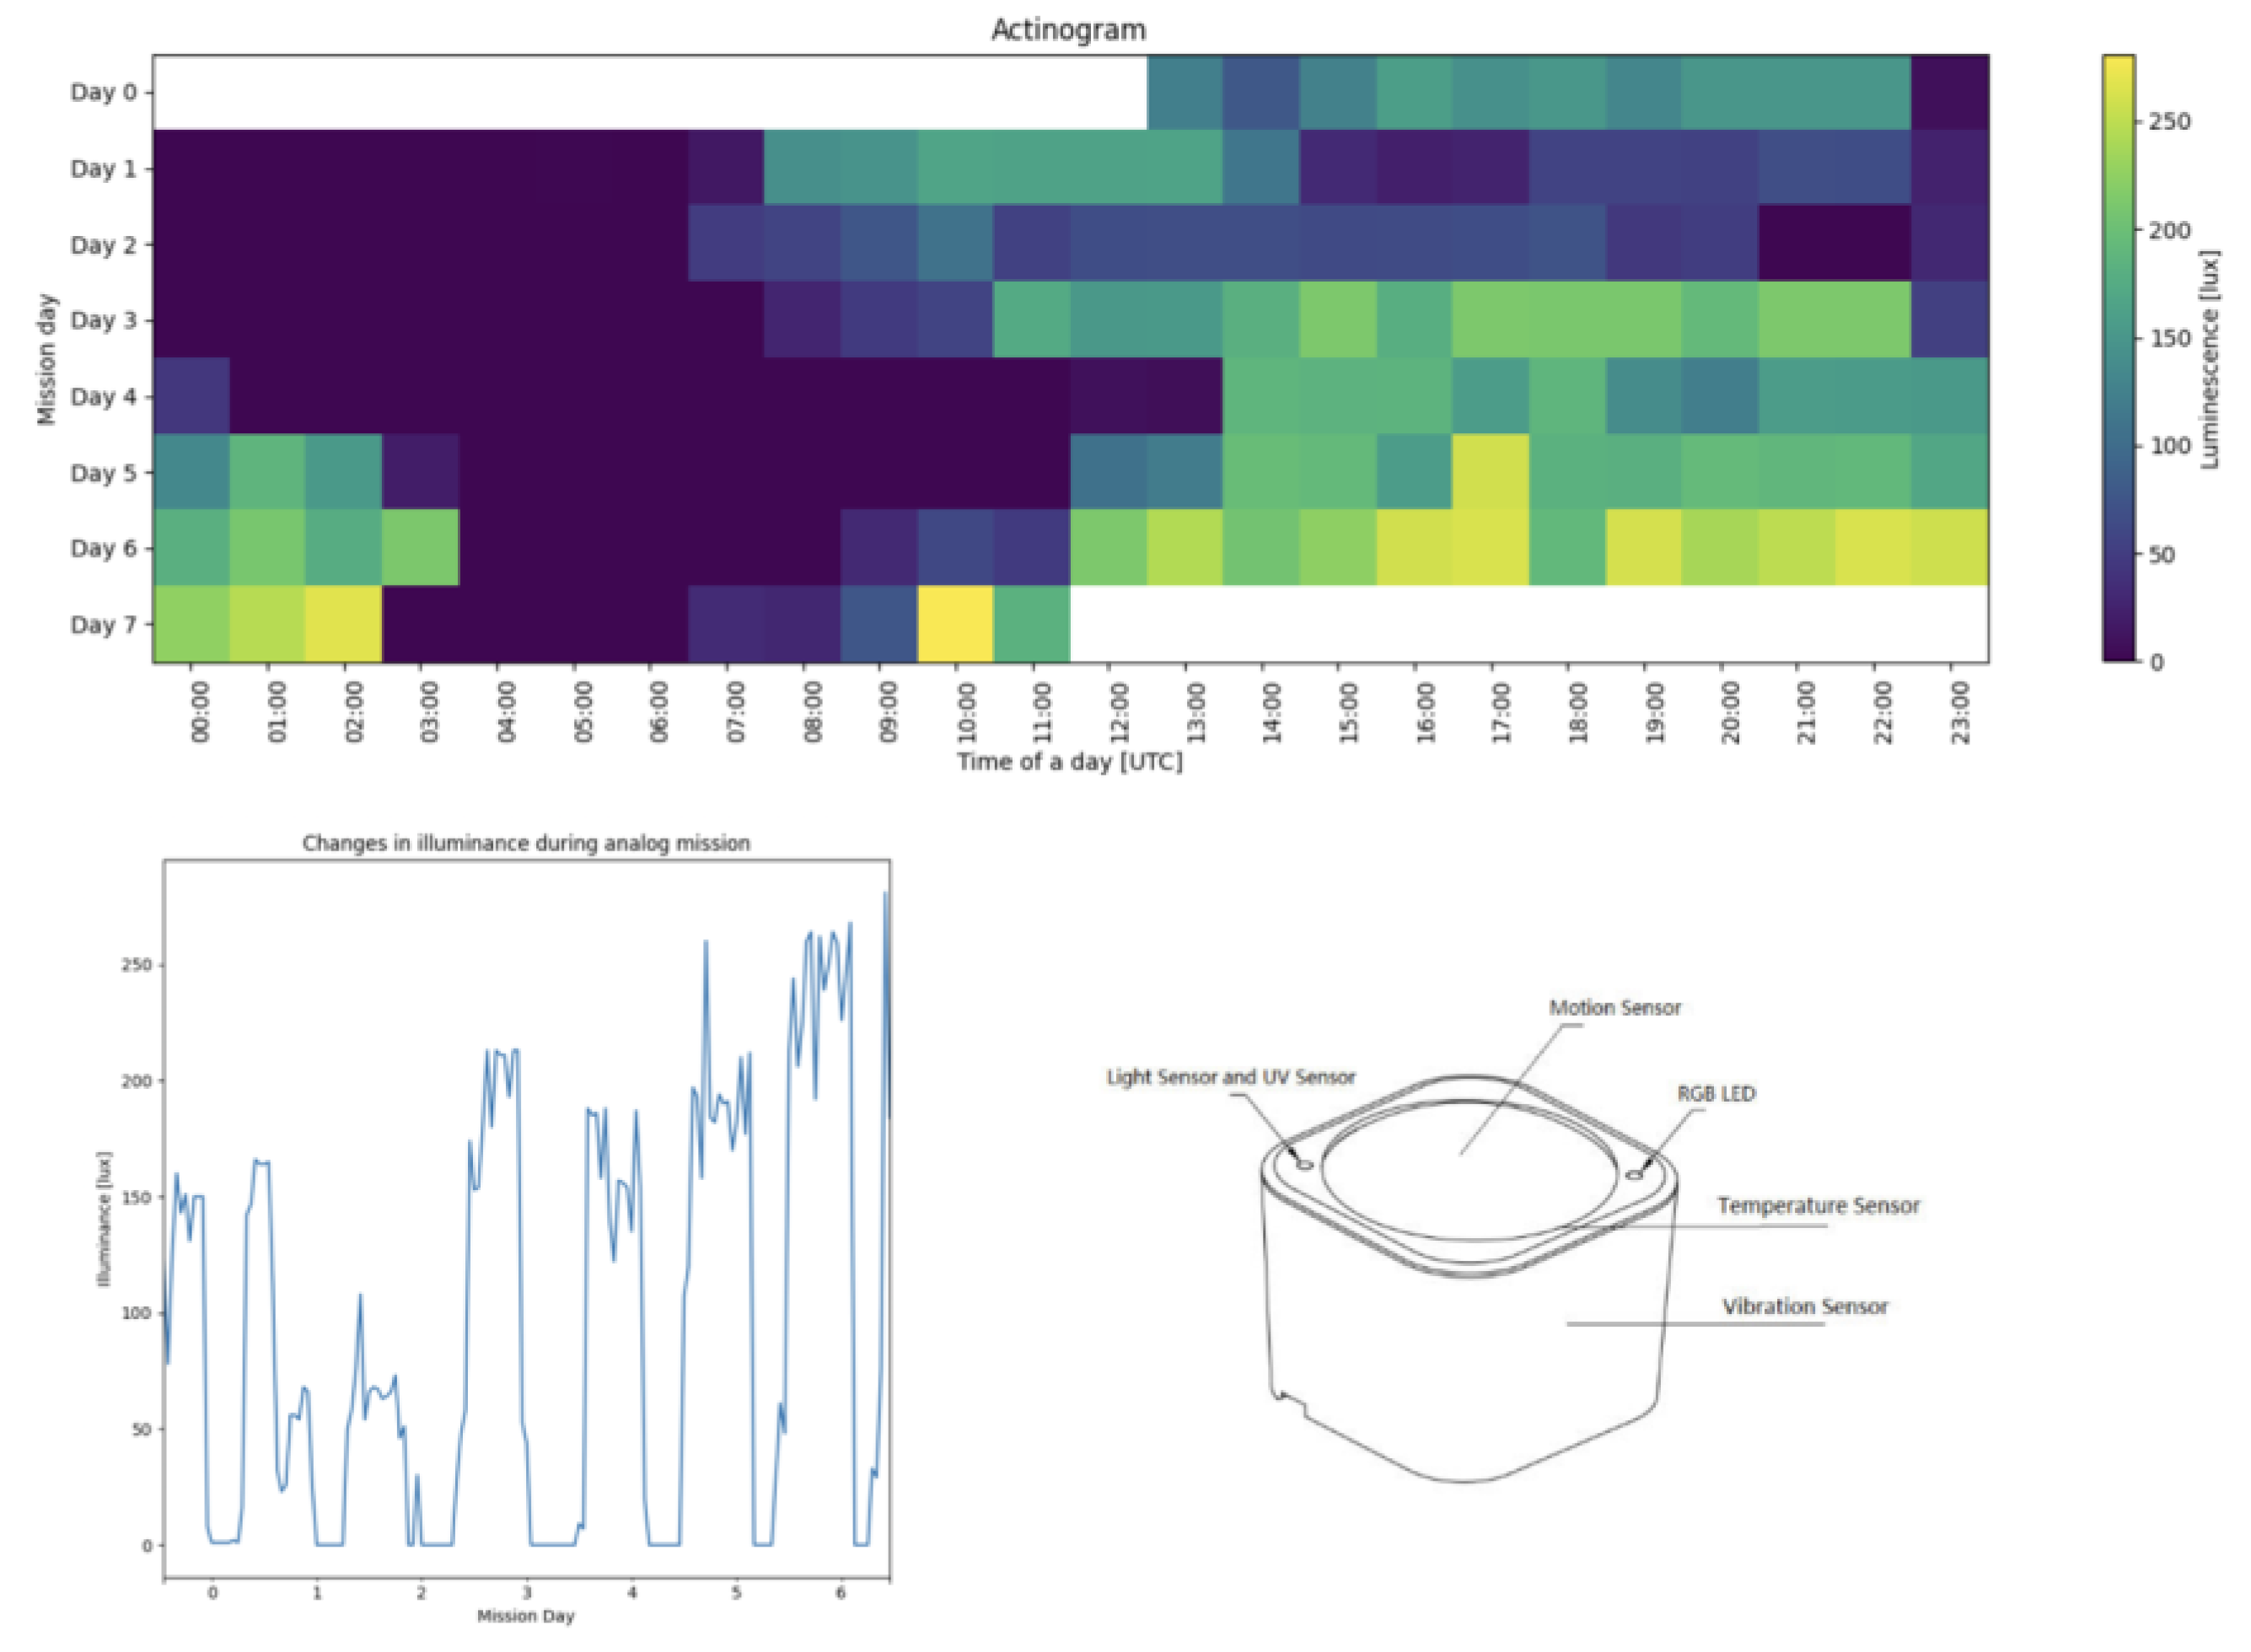
Aeotec sensors were used to measure technical characteristics such as power consumption and luminosity, while Netatmo sensors were used to measure environmental factors such as temperature, relative humidity, CO and CO
2 levels, noise, weather and barometric pressure. To create a three-dimensional distribution and visualization, all sensors monitoring environmental parameters were placed at two heights (100 cm and 200 cm above the floor). The third additional level (0 cm = ground, 50 cm and 150 cm) is currently being installed to create a dense network with a resolution of 50 cm (0, 50, 100, 150, 200 cm). Each sensor is capable of monitoring several different parameters per minute, generating a significant amount of data about the habitat environment (
Figure 3).
Parameters currently monitored in real-time:
- −
Air Quality Index (5-grade scale AQI)
- −
Temperature (Celsius)
- −
Relative humidity (%)
- −
Carbon Dioxide level (ppm)
- −
UV Light intensity (11-grade scale)
- −
Carbon Monoxide level (ppm)
- −
Noise (dB)
- −
Atmospheric pressure (hPa)
- −
Motion detection
- −
Face recognition
- −
Light intensity - illuminance levels (Lux) - illumination inside habitat modules
- −
Door and window state (open/close)
- −
Eclectic energy current (Amper)
- −
Electric energy power consumption (Watt)
- −
Electric energy state (on/off)
- −
Electric energy usage (kW/h)
- −
Electric energy voltage (Volt)
- −
Light color (RGB)
- −
Wind gust direction and strength (degrees, meters per second) - outside the habitat
- −
Temperature, pressure, relative humidity (Celsius, hPa, %) - outside the habitat
- −
Precipitation type and intensity (type, mm) - outside the habitat
- −
Network speed and latency (bytes per second, seconds)
- −
Battery levels (V, %)
- −
Water level / flood / leakage detecting (mm)
- −
Main computer I/O load, CPU load, memory usage, network parameter (various metrics)
Both the crew and the MCC have access to visualizations of environmental parameters in the habitat. In addition, the MCC has access to manipulate these visualizations to simulate emergency situations in the habitat, such as decompression (loss of air) or power failure resulting in a blackout. The crew's activities are documented in their daily reports as well as in activity reports from both the Aeotec/Netatmo sensors mounted in the habitat and the telemedical devices worn by the crew.
6. Monitoring of Crew
The activity and sleep cycles of analog astronauts are recorded by several devices and applications: blood pressure monitors, pulse oximeters, bioimpedance devices (Tanita scale), thermometers, mobile applications for cognitive analysis (e.g. Brainess Human Benchmark [
17]), Subjective Time Perception Test [
18], MiFit bands, Estimote proximity sensors [
19] and Movisens sensors [
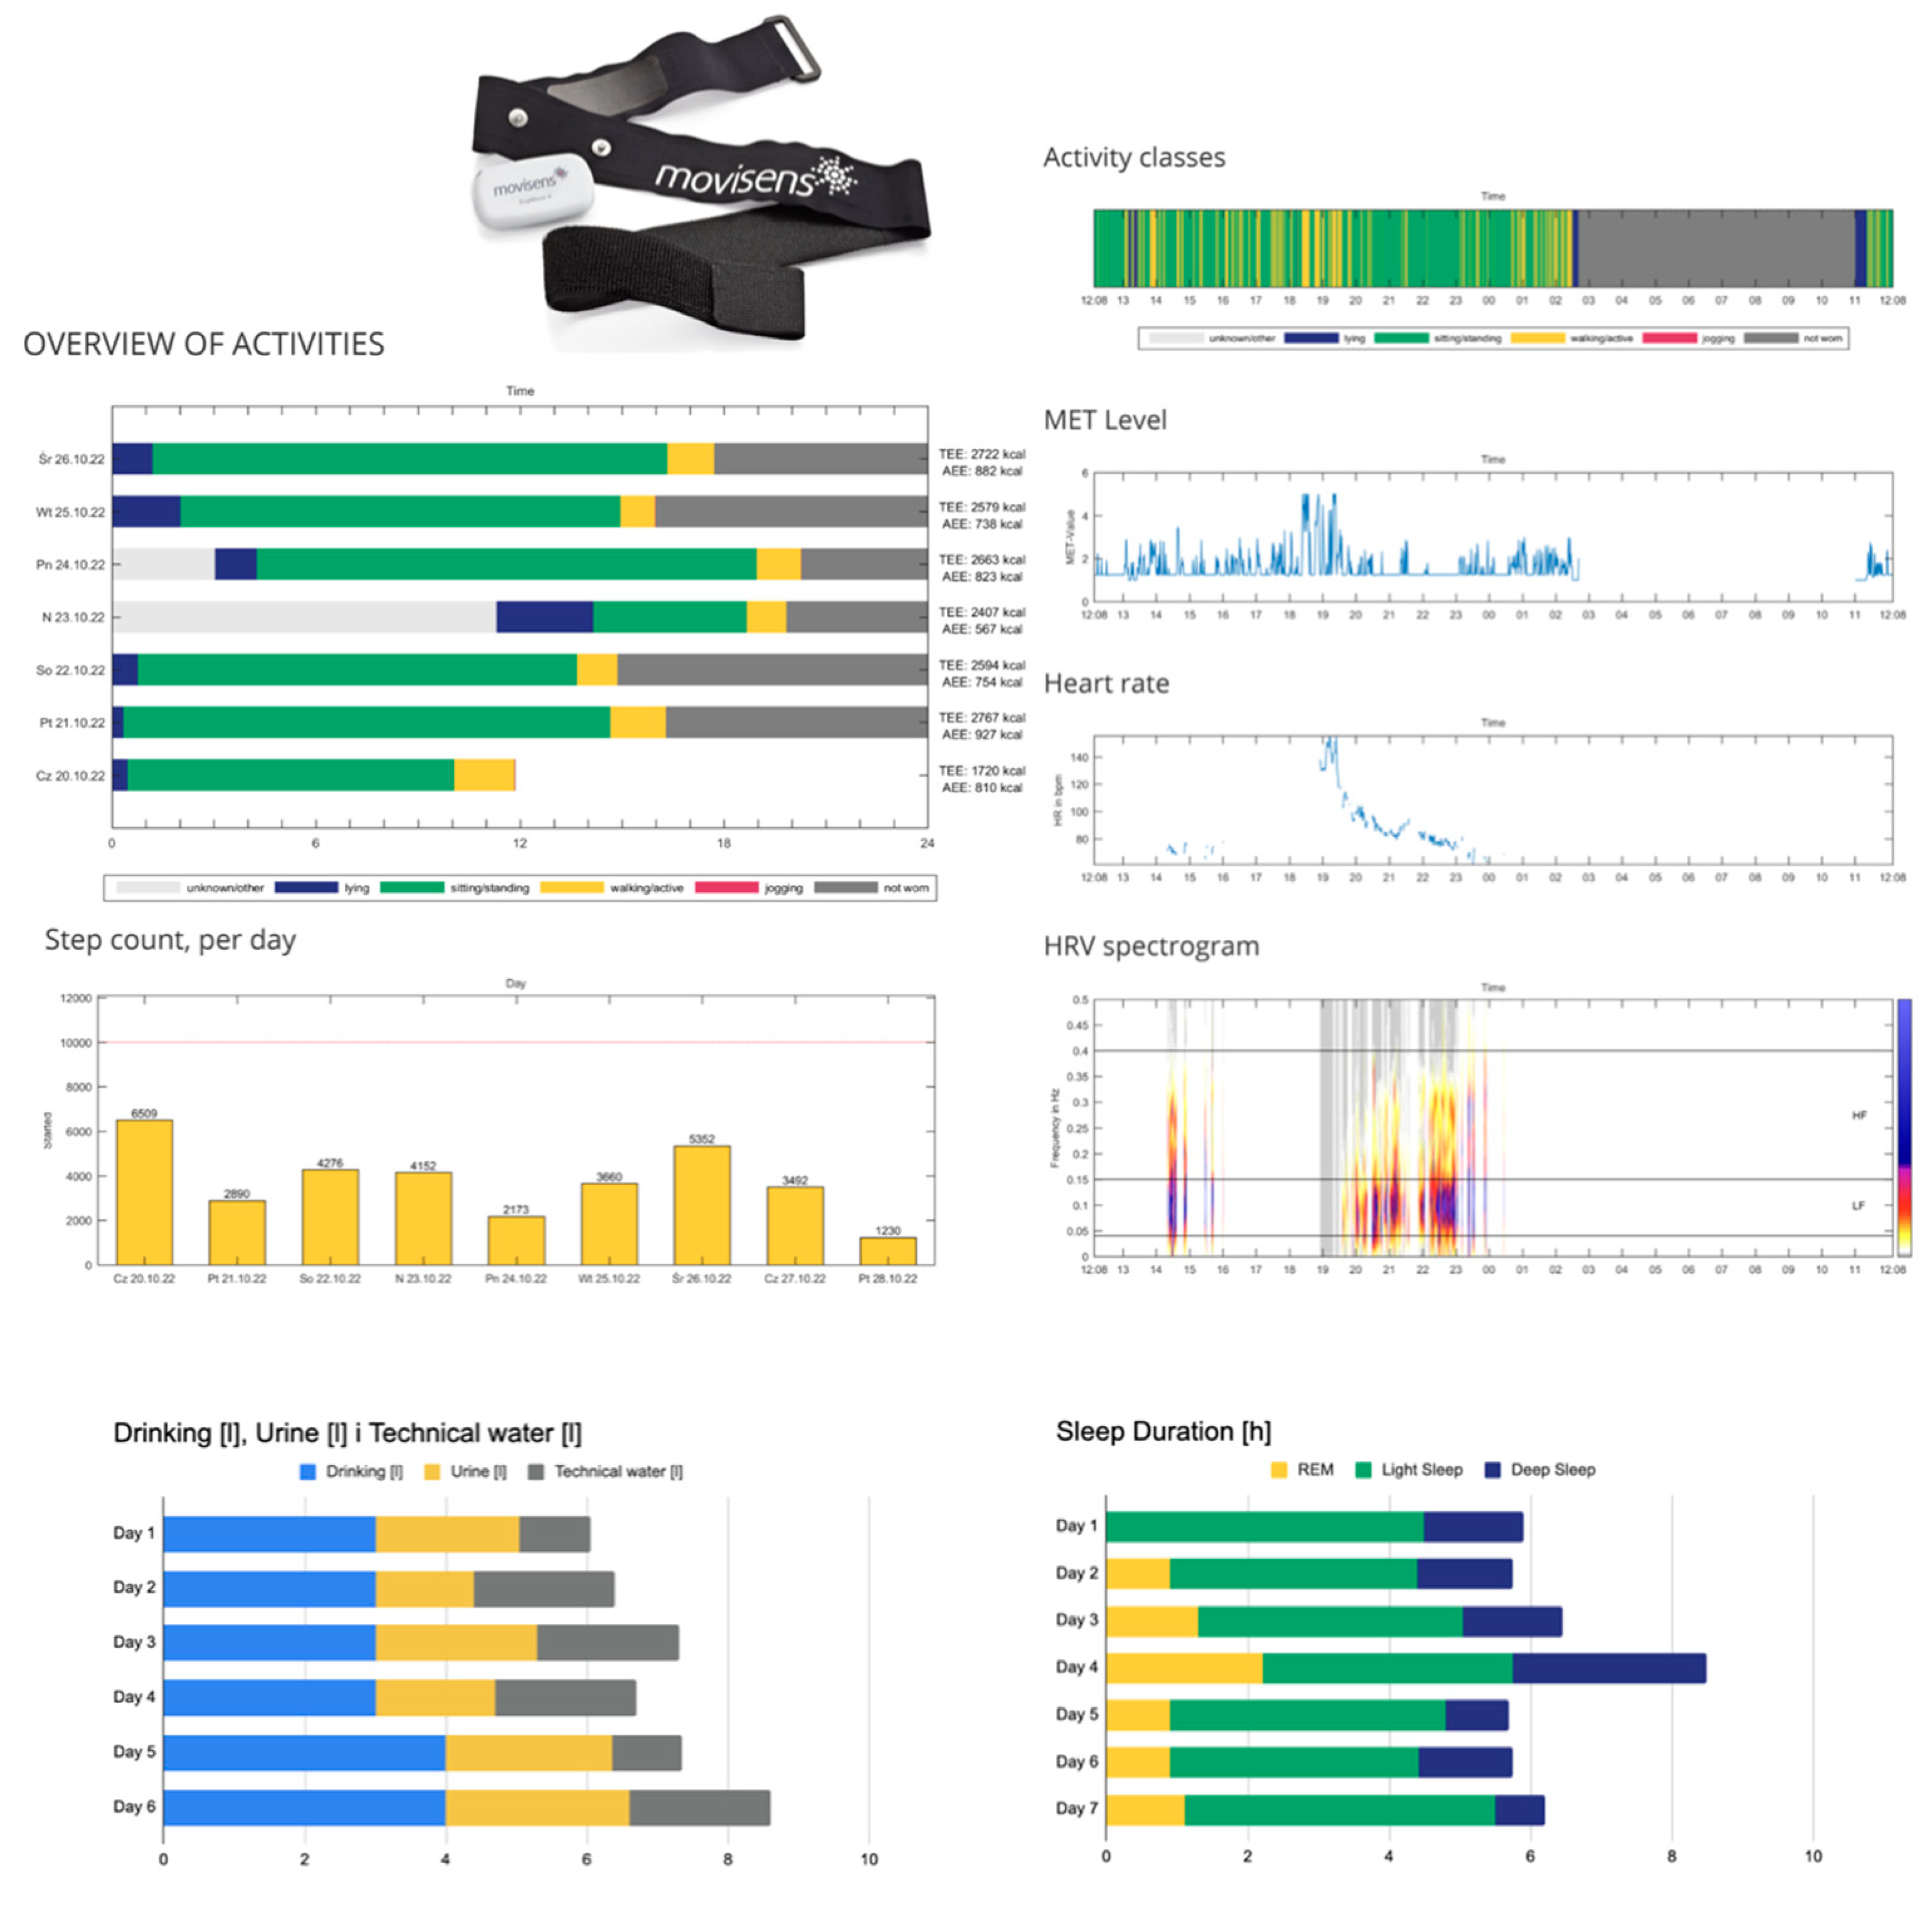
20]. All of the above measurements provide regular daily screening of physiological parameters for each crew member. This provides a unique insight into the individual health status and its dynamics during the 7 days of adaptation to the extreme conditions.
Figure 4 shows a typical report obtained for each participant of the analog mission.
7. Results with the Discussion
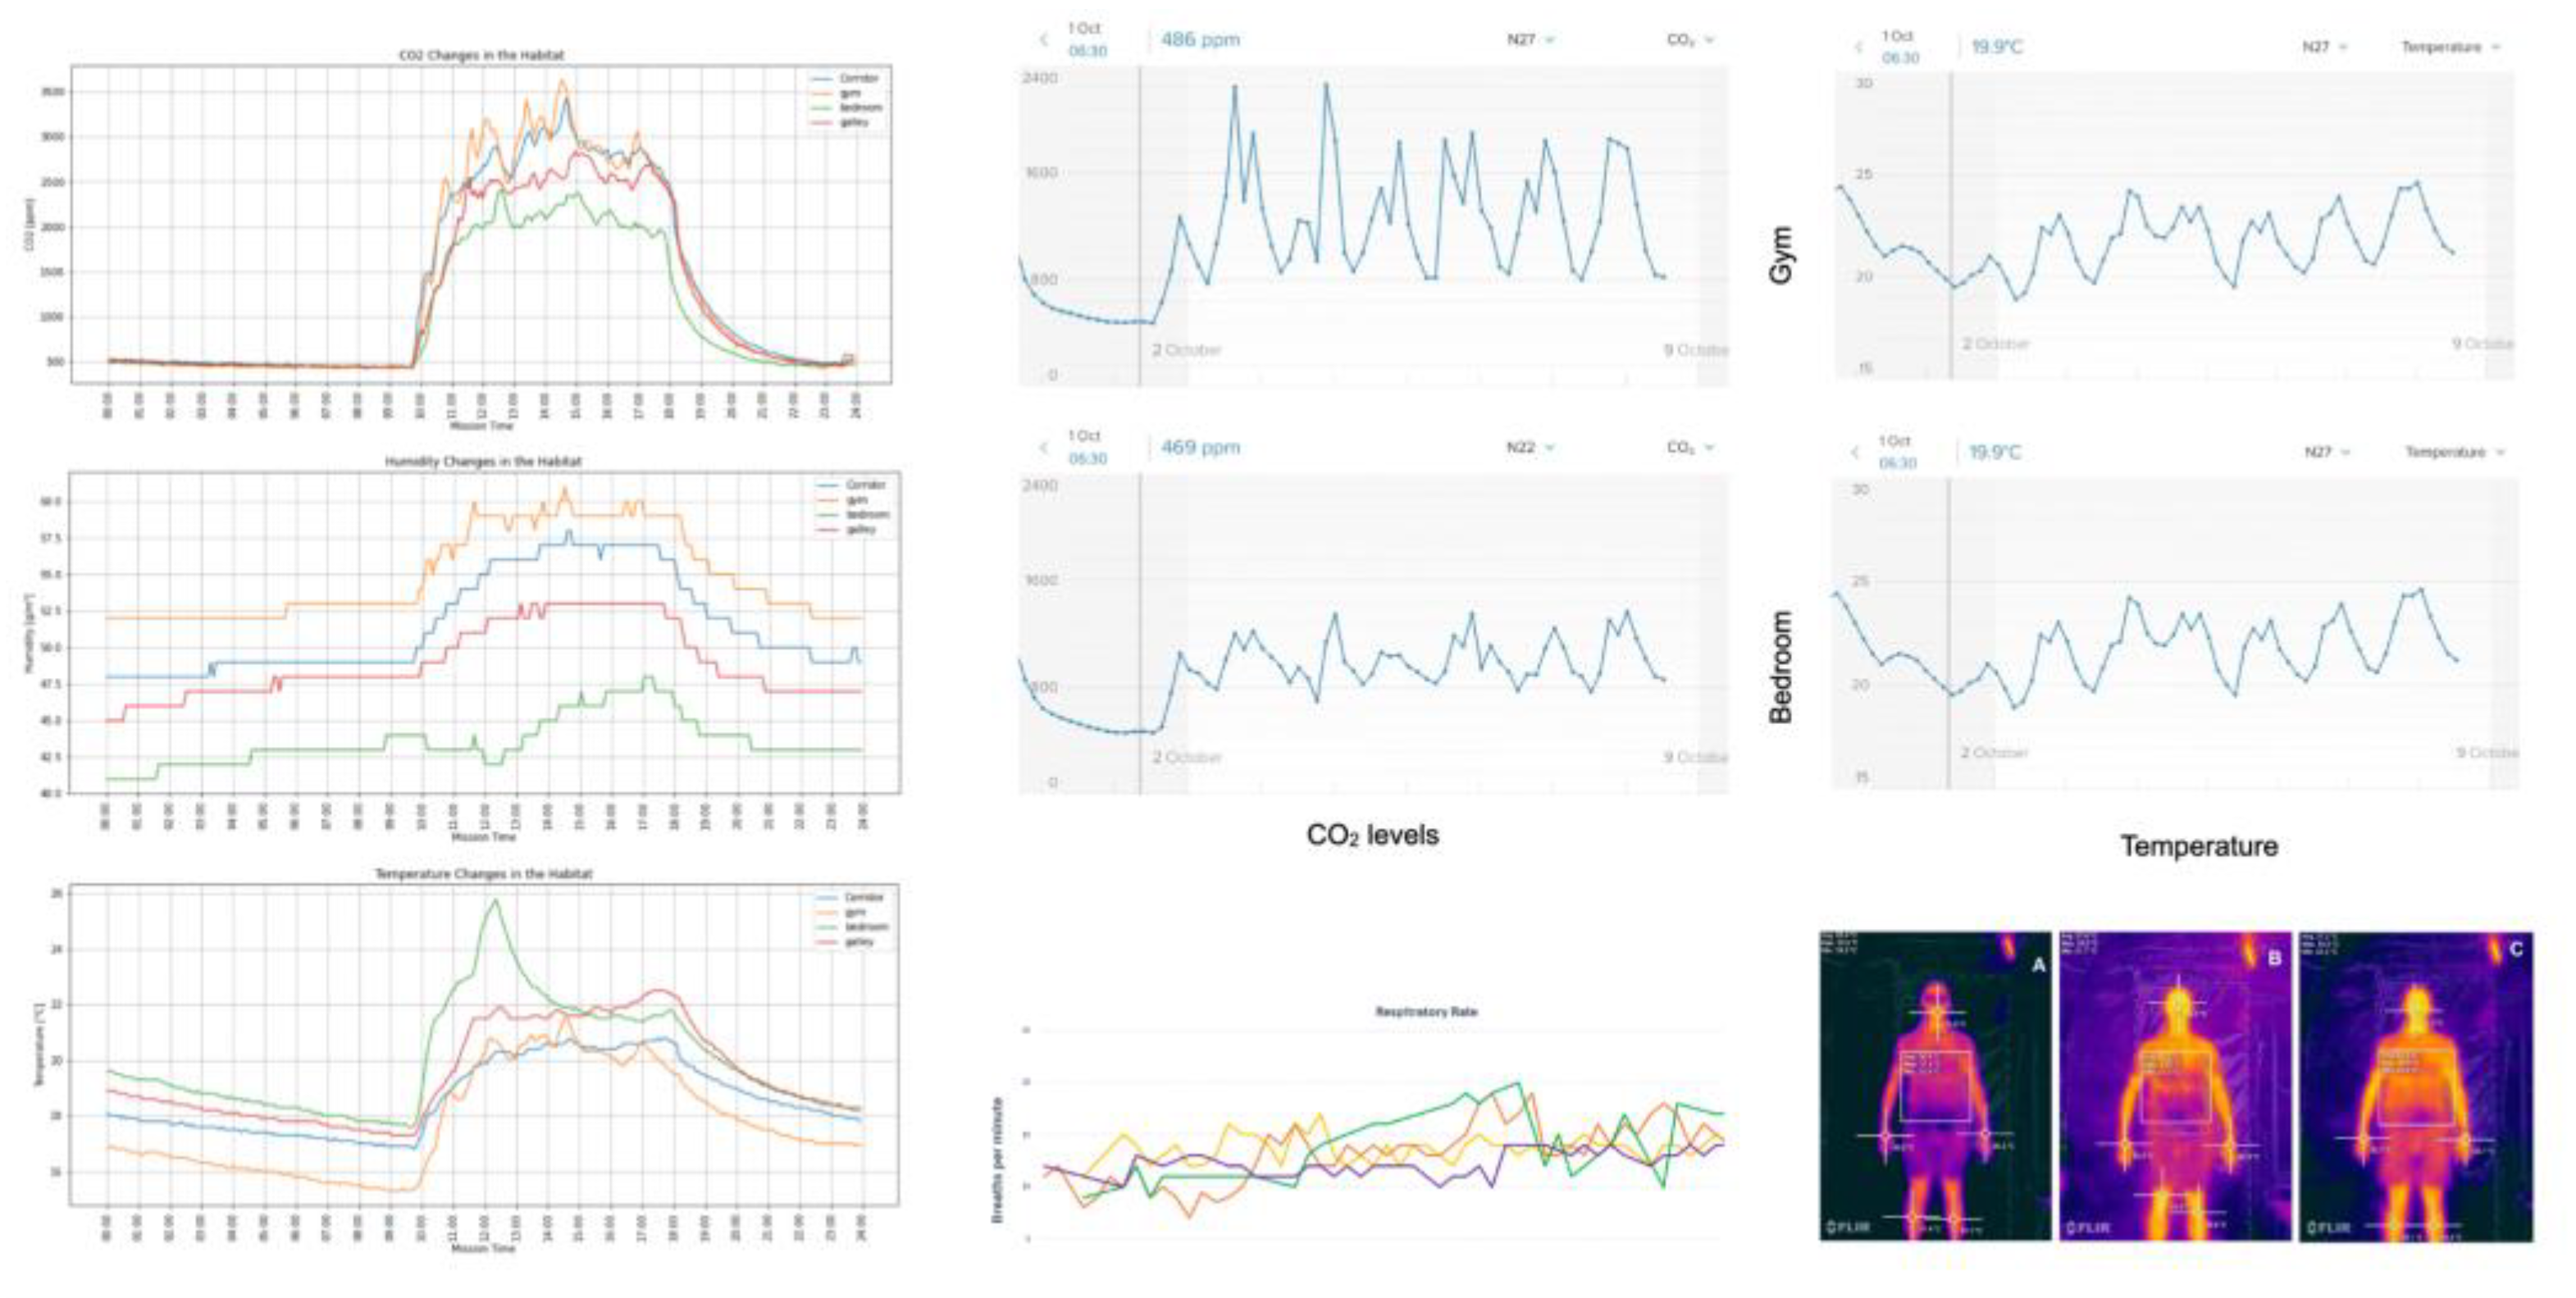
Each day of the mission brings new data, which is transferred directly to the server. As early as the second day of the analog mission, the crew begins to adapt to the environmental conditions. Some environmental parameters are stable, such as electromagnetic fields and noise, while others oscillate, such as temperature, humidity and CO
2 levels. These oscillations make it possible to observe the range of variation of the environmental parameters and, based on this, to determine the marginal requirements for future life support systems.
Figure 5 shows the oscillating parameters during isolated analog missions.
Temperatures above 32°C, CO
2 levels above 2000 ppm and humidity levels above 70% cause a significant drop in mission morale and crew efficiency. Low temperatures, such as below 20°C, have no adverse effects on humans in isolation. When comparing crews kept in exactly the same conditions (environment, food, schedule), several parameters relating to the human factor and crew dynamics fluctuate. These are related to the motivation to exercise and, based on this, to water consumption and electricity generation on the energy bike. A comparison of the data collected during six such missions is presented in
Table 1.
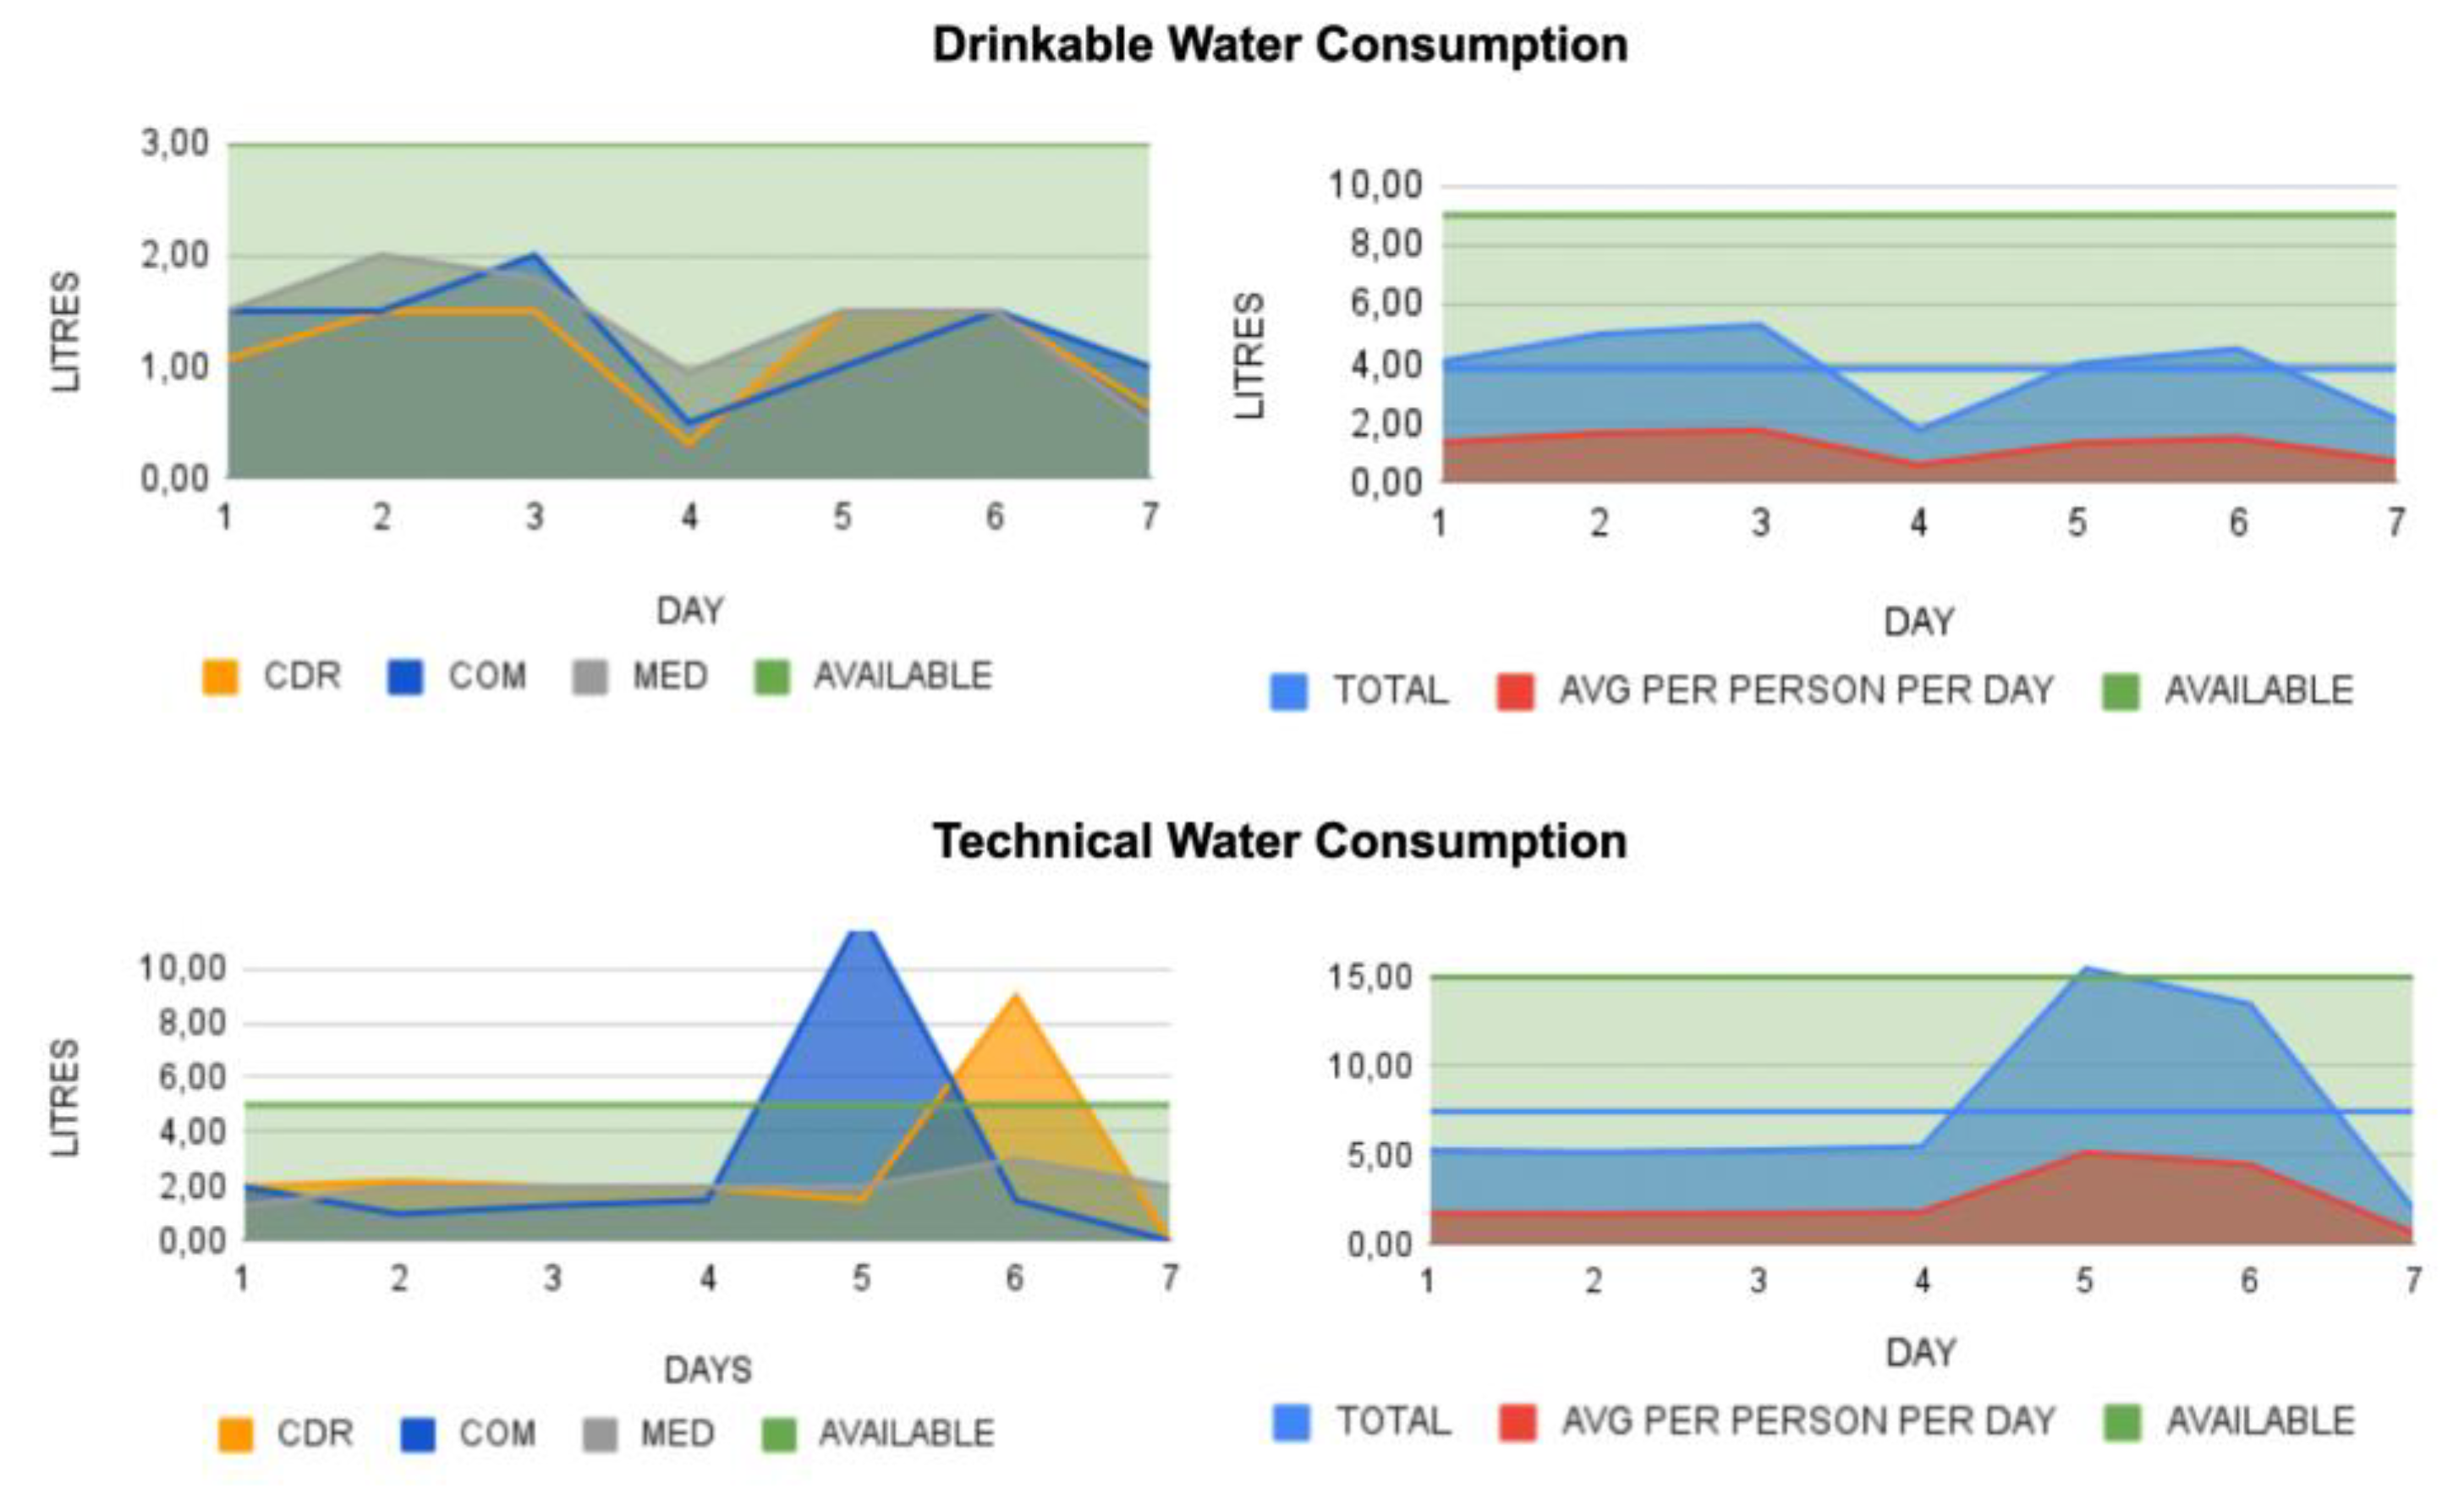
Limited resources such as water, electricity and internet bandwidth change the behavior of the crew. At the beginning of the mission there is a tendency to earn resources, while at the end of the mission there is a more relaxed attitude, as shown in
Figure 6. Proximity tests with Estimote sensors visualize crew dynamics and the distribution of analog astronauts within the base. Estimote sensors can be programmed to measure various parameters and even incorporate gamification into the process. The data obtained can be useful for non-invasive monitoring of crew mood and motivation. Both of these parameters affect the environment inside the habitat, so it is important to consider them in monitoring systems. An example is visualized in
Figure 7. There are still many factors that need to be monitored in order to get a detailed picture of life in isolation that can provide a safe and sustainable environment [
21,
22]. The authors clearly state that one person can have a significant impact on the success of the mission, both positively and negatively. What is missing in the current remote sensing of isolated environments such as habitats are physiological parameters such as body temperature, blood pressure, glucose, cortisol, serotonin, digestion, cognitive performance and mood. The use of smart sensors, smart watches and smart clothing would significantly improve this part of the gap [
23]. The problem is also accuracy and redundancy.
The best solution would be to have several devices monitoring the same parameter and to reduce the number of measured parameters to the most critical and characteristic ones [
24]. In addition to the remote monitoring system, procedures and compliance with safety rules should be at the core of life in extreme environments. People living in isolation should have full access to their ongoing data, allowing automatic monitoring and feedback for quick response to emergency situations.
Author Contributions
A.M.K. and M.H. designed the habitat and organized analog missions. A.M.K. wrote the main part of the manuscript including the presented ideas, figures and tables. M.H. analyzed the data presented in this paper, verified the text and the correctness of the described methods.
Funding
This research received no external funding.
Informed Consent Statement
Informed consent was obtained from all subjects involved in the study.
Acknowledgments
The authors would like to thank the analog astronauts who participated in the analog missions organized in the AATC habitat. We would like to thank Karolina Rojek-Sito for familiarizing us with the Estimote proximity sensors, providing visualizations of Estimote data and for conducting Ph.D. research in our habitat. We would also like to thank student Joanna Stępień for analyzing data from the habitat during the Space Exploration Workshop in November 2023, and participants of the Asteria crew for assisting with data analysis.
Conflicts of Interest
The authors declare no conflicts of interest.
References
- Giliberti, C.; Boella, F;, Bedini, A.; Palomba, R.; and Giuliani, L. Electromagnetic Mapping of Urban Areas: The Example of Monselice (Italy). Institute for Prevention and Work Safety (ISPESL), Rome, Italy. 2009. PIERS ONLINE, VOL. 5, NO. 1, 56.
- Sedlak, W. Życie jest światłem. 1985. ISBN 83-211-0616-1.
- Lissak, G. Adverse physiological and psychological effects of screen time on children and adolescents: Literature review and case study. Environ Res. 2018 Jul;164:149-157. [CrossRef]
- Bohil, C.J.; Alicea, B.; Biocca, F.A. Virtual reality in neuroscience research and therapy. Nat Rev Neurosci 2011;12:752–62.
- MacTaggart, K. Astronaut 1961 onwards (all roles and nationalities). 2017. ISBN: 978-1785210617.URL:https://www.amazon.com/Astronaut-onwards-nationalities-Owners-Workshop/dp/1785210610.
- World Space Flight. Astronaut/Cosmonaut Statistics. (2023). Accessed: 2023-02-27. URL: https://www.worldspaceflight.com/bios/stats.php.
- https://www.space.com/new-record-19-people-orbiting-earth-soyuz-iss.
- AATC. Available online: www.astronaut.center.
- Kolodziejczyk, A.M.; Orzechowski, L. Time Architecture. Acta Futura 10 (2016), 37-44. 10.5281/zenodo.202172.
- Kolodziejczyk, A.M.; Harasymczuk, M. et al., Circadian Clock and Subjective Time Perception: A Simple Open Source Application for the Analysis of Induced Time Perception in Humans. International Journal of Medical, Health, Biomedical, Bioengineering and Pharmaceutical Engineering. International Journal of Cognitive and Language Sciences 2017 Vol:11, No:3, . [CrossRef]
- www.lunarclock.org.
- Gibney, E. What time is it on the Moon? Nature 2023. 614, 13-14. [CrossRef]
- www.spaceweather.com.
- Abdalla, H.; and Mostafa, A. Technical Requirements for Connecting Solar Power Plants to Electricity Networks. Innovation in Energy Systems - New Technologies for Changing Paradigms. IntechOpen. 2019. [CrossRef]
- www.aotec.com.
- www.netatmo.com.
- Bonnechère, B.; Klass, M.; Langley, C. et al. Brain training using cognitive apps can improve cognitive performance and processing speed in older adults. Sci Rep 2021. 11, 12313. [CrossRef]
- http://stp.astrotech.io.
- www.estimote.com.
- Tropschuh, B.; Windecker, S. & Reinhart G. Study-based evaluation of accuracy and usability of wearable devices in manual assembly, Production & Manufacturing Research, 2022. 10:1, 569-582. [CrossRef]
- Cromwell RL, Huff JL, Simonsen LC, Patel ZS. Earth-Based Research Analogs to Investigate Space-Based Health Risks. New Space. 2021 Dec 1;9(4):204-216. [CrossRef]
- Posselt, B.N.; Velho, R.M.; O'Griofa, M.; Shepanek, M.A.; Golemis, A.; & Gifford, S. Safety and healthcare provision in space analogs. Acta Astronautica, 2021. 186, 164-170.
- Jha, R; Mishra, P; Kumar, S. Advancements in optical fiber-based wearable sensors for smart health monitoring. 2024. Biosens Bioelectron. 15;254:116232. [CrossRef]
- Mao, P.; Li, H.; Yu, Z. A Review of Skin-Wearable Sensors for Non-Invasive Health Monitoring Applications. Sensors (Basel). 2023 Mar 31;23(7):3673. [CrossRef]
|
Disclaimer/Publisher’s Note: The statements, opinions and data contained in all publications are solely those of the individual author(s) and contributor(s) and not of MDPI and/or the editor(s). MDPI and/or the editor(s) disclaim responsibility for any injury to people or property resulting from any ideas, methods, instructions or products referred to in the content. |
© 2024 by the authors. Licensee MDPI, Basel, Switzerland. This article is an open access article distributed under the terms and conditions of the Creative Commons Attribution (CC BY) license (http://creativecommons.org/licenses/by/4.0/).
