Preprint
Article

Evaluation of Energetic Potential of Slaughterhouse Waste via Anaerobic Digestion by Pressure Induced Separation in West-Africa

Submitted:

27 September 2024

Posted:

27 September 2024

You are already at the latest version

A peer-reviewed article of this preprint also exists.

Abstract
Anaerobic digestion has the potential to convert organic waste materials into valuable energy. At the same time, using press water from biomass materials for energy generation, while taking advantage of the resulting cake for other purposes is an emerging approach. Therefore, this study aimed to investigate the residual potential expected from a typical biogas feedstock in the West African context after it has been mechanically separated into liquid and solid phases. Hence, in this study, the rumen contents of ruminants (cow, goat and sheep) and their proportionate ratios were obtained from an abattoir in Ghana. Resource characterisation of the waste samples were carried out in the Central laboratory of the HFR, Germany. Anaerobic batch tests for biogas (biomethane) yield determination were set-up using the Hohenheim Biogas Yield Test (HBT). Inoculum used was obtained from an inoculum production unit at the Hohenheim University biogas laboratory. The trial involved two different forms of the sample: mixture of rumen contents, press water, and inoculum, each in four (4) replicates. The trial was carried out at a mesophilic temperature of 37°C. Results obtained over a seventy (70) day period were transformed into biogas yields. Overall, the results show that the current contents are suitable for biogas generation as an option, as opposed to the current form of disposal at a refuse dump. However, using these mixtures in their original forms is more technically viable than using press water without further treatment.
Keywords: 
Subject: 
Engineering  -   Energy and Fuel Technology

1. Introduction

Africa’s economic and social development depends largely on clean energy transition, thus, influencing the drive for energy development goals. Essentially, there is the need for affordable and clean energy for all Africans [1]. The continent potentially holds the gate for the world to achieve net zero energy transition. In 2021, biofuel and waste accounted for 45.4% of the total energy supply in Africa. It is projected that by 2025, the world will generate 6 million tons of waste∙[2].Presently,∙64% of Africans use agricultural and animal waste and wood for cooking, with possibilities of resulting in deforestation [1]. Biogas generation is one option to ensure a sustainable energy supply and to offer an alternative for clean energy transition; especially through simple cooking applications; deriving energy from animal and agricultural waste [2,3,4,5]. Biogas, a renewable energy resource is produced from the microbial breakdown of organic materials (biomass: manure, food waste, agricultural waste, waste water, green waste, sewage, municipal waste etc.) under anaerobic conditions [3,6,7,8]. Bejor (2020) defines anaerobic as the absence of free oxygen [9]. This process involves relevant microorganisms of four separate generation processes: hydrolytic bacteria for hydrolysis, acidogenic bacteria for acidogenesis, acetogenic bacteria for acetogenesis and methanogens for methanogenesis [10]. At the hydrolysis and acidogenic stages of biogas production, lipids, proteins and carbohydrates are broken into complex long-chain fatty acids, glycerol, amino acids and sugars. These are eventually converted into short-chain fatty acids, alcohols, hydrogen, carbon dioxide and acetate. Through methanogenic actions, biogas is then produced from the acetates, carbon dioxide and hydrogen [11,12], thus, producing methane (CH4:55-65%), Carbon dioxide (CO2: 35-40%), Hydrogen sulphide (H2S), moisture and siloxanes in small amounts [13]. Biogas composition can generally summarised as 50-75% of CH4, 25-45% of CO2, 2-7% of H2 according to Wukovits and Schnitzhofer (2009) [14]. A generation equation for biogas generation is cited by Bejor (2020) as organic matter + Combined Oxygen +∙Anaerobic microbes' → CH4 + CO2+Other end-products [9].The energy content of biogas primarily depends on the fraction of methane [15].The semi-solid or solid effluent produced is a source or useful raw material for biofertilizer applications [16]. While biogas, technically, the CH4 component is useful for cooking, electricity generation, vehicle fuelling and bio-methanation, its production and use cycle is continuous, with no net carbon dioxide emissions being produced. That is, carbon absorbed during biomass growth offsets the carbon associated with its energy conversion, if transport and processing emission are not taken into account [17]. Despite the positives of anaerobic digestion for biogas generation, there are still technological and microbiological considerations necessary to ensure economic feasibility [11].
Náthia-Neves (2018) classifies biogas production processes as wet digestion, dry digestion and semi-dry digestion, based on the dry matter or total solid content of the initial substrate. A typical wet digestion should have an initial dry matter content that is below 10% and more than 20% for a dry digestion. Wet digestion has been used and suited for sewage sludge treatment and liquid waste with high moisture contents. Dry digestion on the other hand is suited for substrates with high dry matter contents [16]. A wet digestion, semi-dry or dry digestion process could be transformed to another by transforming the substrate in order to affect the hydrolysis process. Hydrolysis in biogas production has two challenges: the most-time intensive of all four generation stages and the limitation of speed in the use of substrates which are in the forms of particles [18,19,20,21,22,23,24,25,26]. Intensifying the hydrolysis process therefore results in an increased performance [18]. Mechanical pre-treatment is one way of doing this (with biological, chemical or a combination of any of the three as the others) [19]. Pressing out fluid from biomass which is difficult to process by anaerobic digestion, e.g. due to its texture and high fibre content, is an emerging mechanical pre-treatment approach [20,21,22,23,24,25] and one-way by which the hydrolysis stage can be modified.
Mechanical pre-treatment by pressing has been driven by several forces [26,30,31,32,33,34,35]. For instance, Corton et al. (2014) cites the use of∙mechanical pressing to obtain press water for biogas while densifying the resulting solid cake,∙which is fibrous in nature for the purposes of solid fuelling [20]. The approach was seen as an innovation to maximise the conversion of energy from low input high diversity biomass. Other researches related to this integrated approach have been conducted by other authors [27,28]. Nayono et al. (2010) co-digested food waste with press water from organic municipal solid waste with the view to improve production of biogas [23]. The authors observed that adding more of either food waste or press water to biowaste co-digestion resulted in a stronger buffer medium. The Biomethane potential obtained over a 11 day period was 500 ml/goTS [23]. Nayono et al. (2010) concludes that using press water from the organic part of municipal solid waste is a good resource for biogas generation [22]. In a mesophilic digestion at 37°C, a BMP of 540 ml/goTS was obtained in a batch test for press water from organic fraction of municipal solid waste. This feedstock was obtained from a composting plant, thus allowing the remaining cake to continue in the composting chain. This positive result is the basis for their conclusion. The focus of the study was to characterise and assess press water’s suitability for anaerobic digestion: to evaluate the potential of its energy recovery and as a mitigation for problems with its handling [22].
Hensgen et al. (2014) used a screw press to obtain press waters from twelve (12) material types sourced from semi-natural habitat in Germany, Estonia and Wales [27]. Biogas production determinations were done for press waters from the silages using VDI standards, at a mesophilic temperature of 37°C. A fermentation time of 14 days was used in this trial. In Hensgen et al. (2014), the different sources of the materials used and their different compositions did not influence the Biomethane potentials of their press waters significantly. Biomethane potential ranged from 312.1 to 405 ml/goTS. In the long run, the press cake ended up with a high fibre content [27].
Richter et al. (2011) studied biomass materials with the aim of using press water from the material (herbage from a low land hay meadow) to generate biogas while using the resulting cake for combustion [28]. The authors work is underscored by the challenges associated with the combustion of low-input-high diversity materials. Hydrothermal carbonisation treatments were conducted for three (3) out of six (6) herbage biomass materials obtained on six different dates. Levels of elements that are detrimental to combustion were reduced in the press cake but higher in the press waters [28]. The Biomethane potential for the press waters without hydrothermal treatment ranged from 6.35 to 13.15 %TS. Between 0.09 and 0.23 % of total solids (TS) contained in the silage were transferred into the press waters.
Sailer et al. (2022) highlights dewatering biogenic wood fuels in the form of wood chips through mechanical pressing to reduce moisture content: press waters are generated as by-products. As its oxygen demand is very high, biogas generation was examined as an option to utilise these waters [24]. They researched into the anaerobic digestion potential of spruce-based and poplar-based press waters. Obtaining a Biomethane potential (BMP) of 160±12 ml/g oTS for both inoculum and press water, as against 95±26 ml/goTS for only inoculum, the authors recommend that a further research could explore the potential of press water as a co-substrate [24]. However, the challenge with press waters is that its characteristics and utilisation potentials are not significantly known [24].
Like most biological wastes, managing slaughter waste presents a challenge in Africa, especially due to increasing urbanisation and population growth. It is critical to transition the waste management landscape to a sustainable circular economy. There is a potential in generating valuable energy from slaughter waste, and additionally remedy huge costs and associated environmental challenges with disposal systems [29,30,31,32,33]. Wang et al. (2018) stress, that AD has been used as a viable technology for slaughter house waste: to generate biogas (energy) and reduce negative environmental impacts [34]. This is evident in several studies highlighting biogas’ potential from slaughter waste: basic research, performance improvement, optimisation, application, process techniques advancement and a blend of any or all of these [34,35,36,37,38,39,40,41,42] [32,43,44,45,46,47,48,49,50,51]. With a focus on anaerobic digestion, energy potential of a cattle-slaughter house was done in Ireland. The study found that there is a methane potential of 49.5 to 650.9 ml∙CH4/goTS [52]. Omoni et al. (2023) co-digested water hyacinth with ruminant waste from a slaughterhouse. They observed that the slaughter house waste enhanced the production, and yield of biogas from water hyacinth by 113% [53].
Salehin et al. (2021) studied the potential of biogas generation from slaughter wastes in Dhaka. It finds that 7,915 tons of slaughter waste is generated per year in the city, with a biogas potential of 2.15 million m3 [35]. Samadi et al. (2021) studied the potential of biogas generation from slaughter waste of poultry, co-digested with vegetables and fruits, in order to produce optimal conditions for a biogas generation. In this study, the highest biogas yield occurred for a C/N ratio of 30. The study stresses that generating biogas from slaughter waste (with co-digestion) is more advantageous than the use of depositing or burning as a disposal method [36]. Ware et al. (2016) obtained a BMP of 465-650 ml/goTS for offal of cattle, pig and poultry from slaughter houses, presenting an empirical pointer to a good biogas potential from slaughter house waste [54]. Aklaku et al. (2006) assessed the performance of a small-scale biogas digester for a slaughterhouse in Ghana [55]. This slaughterhouse produces waste from cattle, sheep and goat. The study found that the digester is able to deliver energy in a form of biogas to replace wood as fuels, while delivering by-products useful for fertilising land [55].
These studies establish that slaughter waste has a huge biogas potential for the energy landscape in Africa, with different studies targeting improvement in yield. The high moisture content of such feedstock (slaughterhouse waste) could therefore be subjected to mechanical pressing as a pre-treatment method that aims at an overall performance improvement of a biogas digestion system, including protecting digester-pumping piping and systems.
This study aimed at assessing the potential of generating biogas from waste deposits generated at a typical abattoir (slaughterhouse) in Africa and evaluating the technical comparative performance of using absolute waste mixtures at slaughterhouses and pressing out liquid (water with solved and dissolved organics). The main objective of the study was to assess the technical potential (biogas yield) of rumen waste mixtures from cow, sheep and goat produced at the Sunyani Abattoir in Ghana. Additionally, the research sought to find out if it is technically prudent to press out water from these mixtures and use digester in the biogas generation process, in mind that the remnant (cake) will be considered in practical scenarios for other conversion processes or uses, such as composting.

2. Materials and Methods

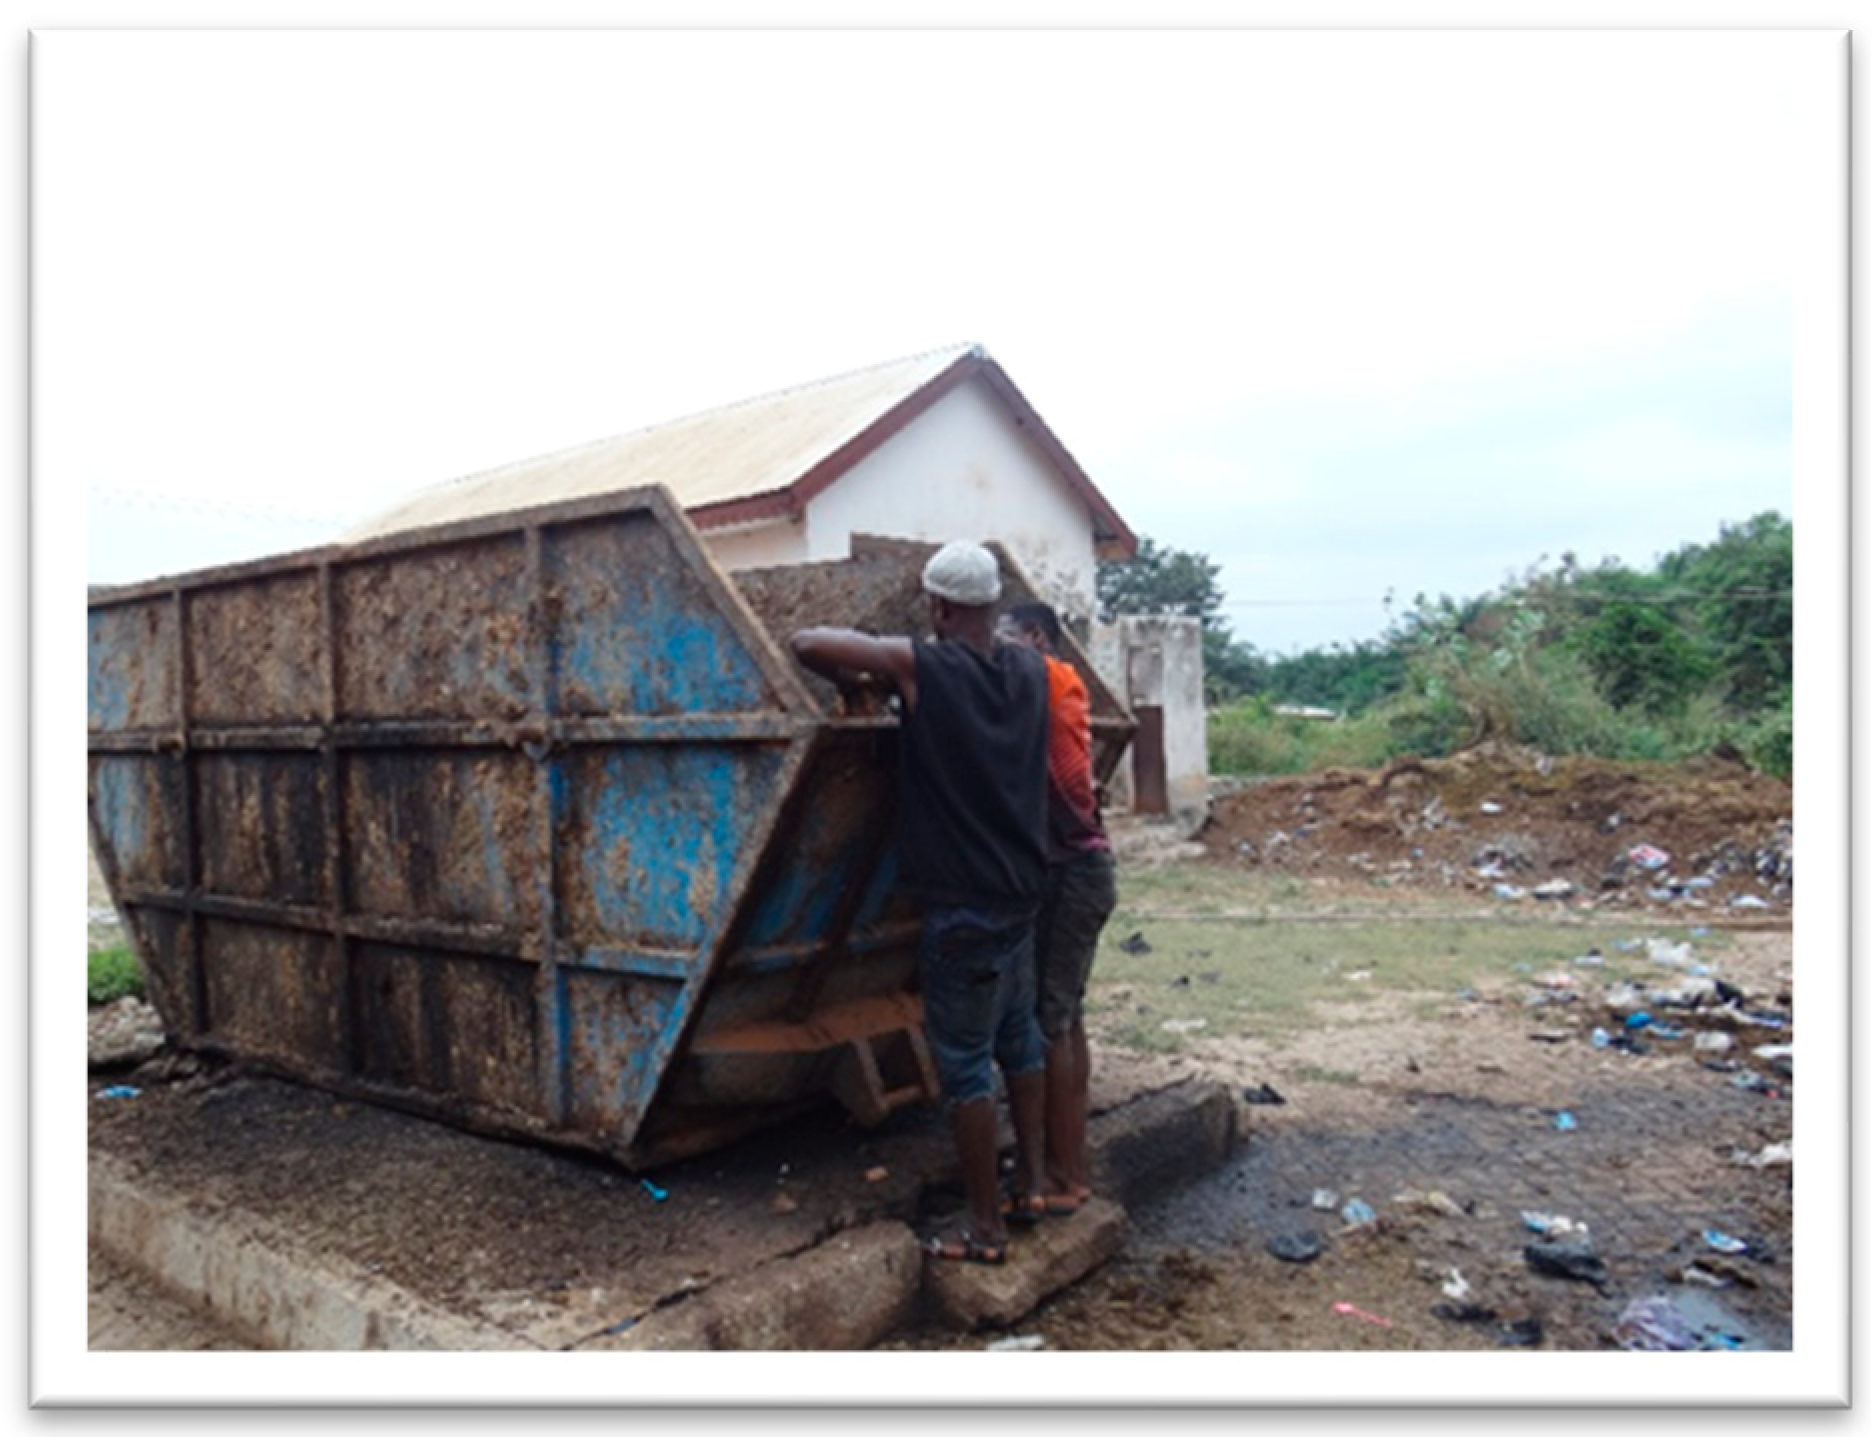
The substrate for anaerobic digestion (AD) trials was collected from the Sunyani Abattoir (Asuakwaa slaughterhouse) in Ghana, located on latitude 7.34376° and longitude -2.29457° [56]. The substrate was obtained as the key waste generated at the facility, as all types of offal are utilised, except partially digested rumen contents. They were obtained as cow rumen content in “pasty” form and a mixture of goat and sheep rumen in medium-liquid form. The current form of disposal is an irregular, but mostly weekly collection cycle with storage in a waste dump. This not only entails the challenge of prolonged and exposed storage in a trough container, along with associated costs and irregular pickups by the waste disposal company but also involves the release of emissions from methanogenic bacteria present in the waste.
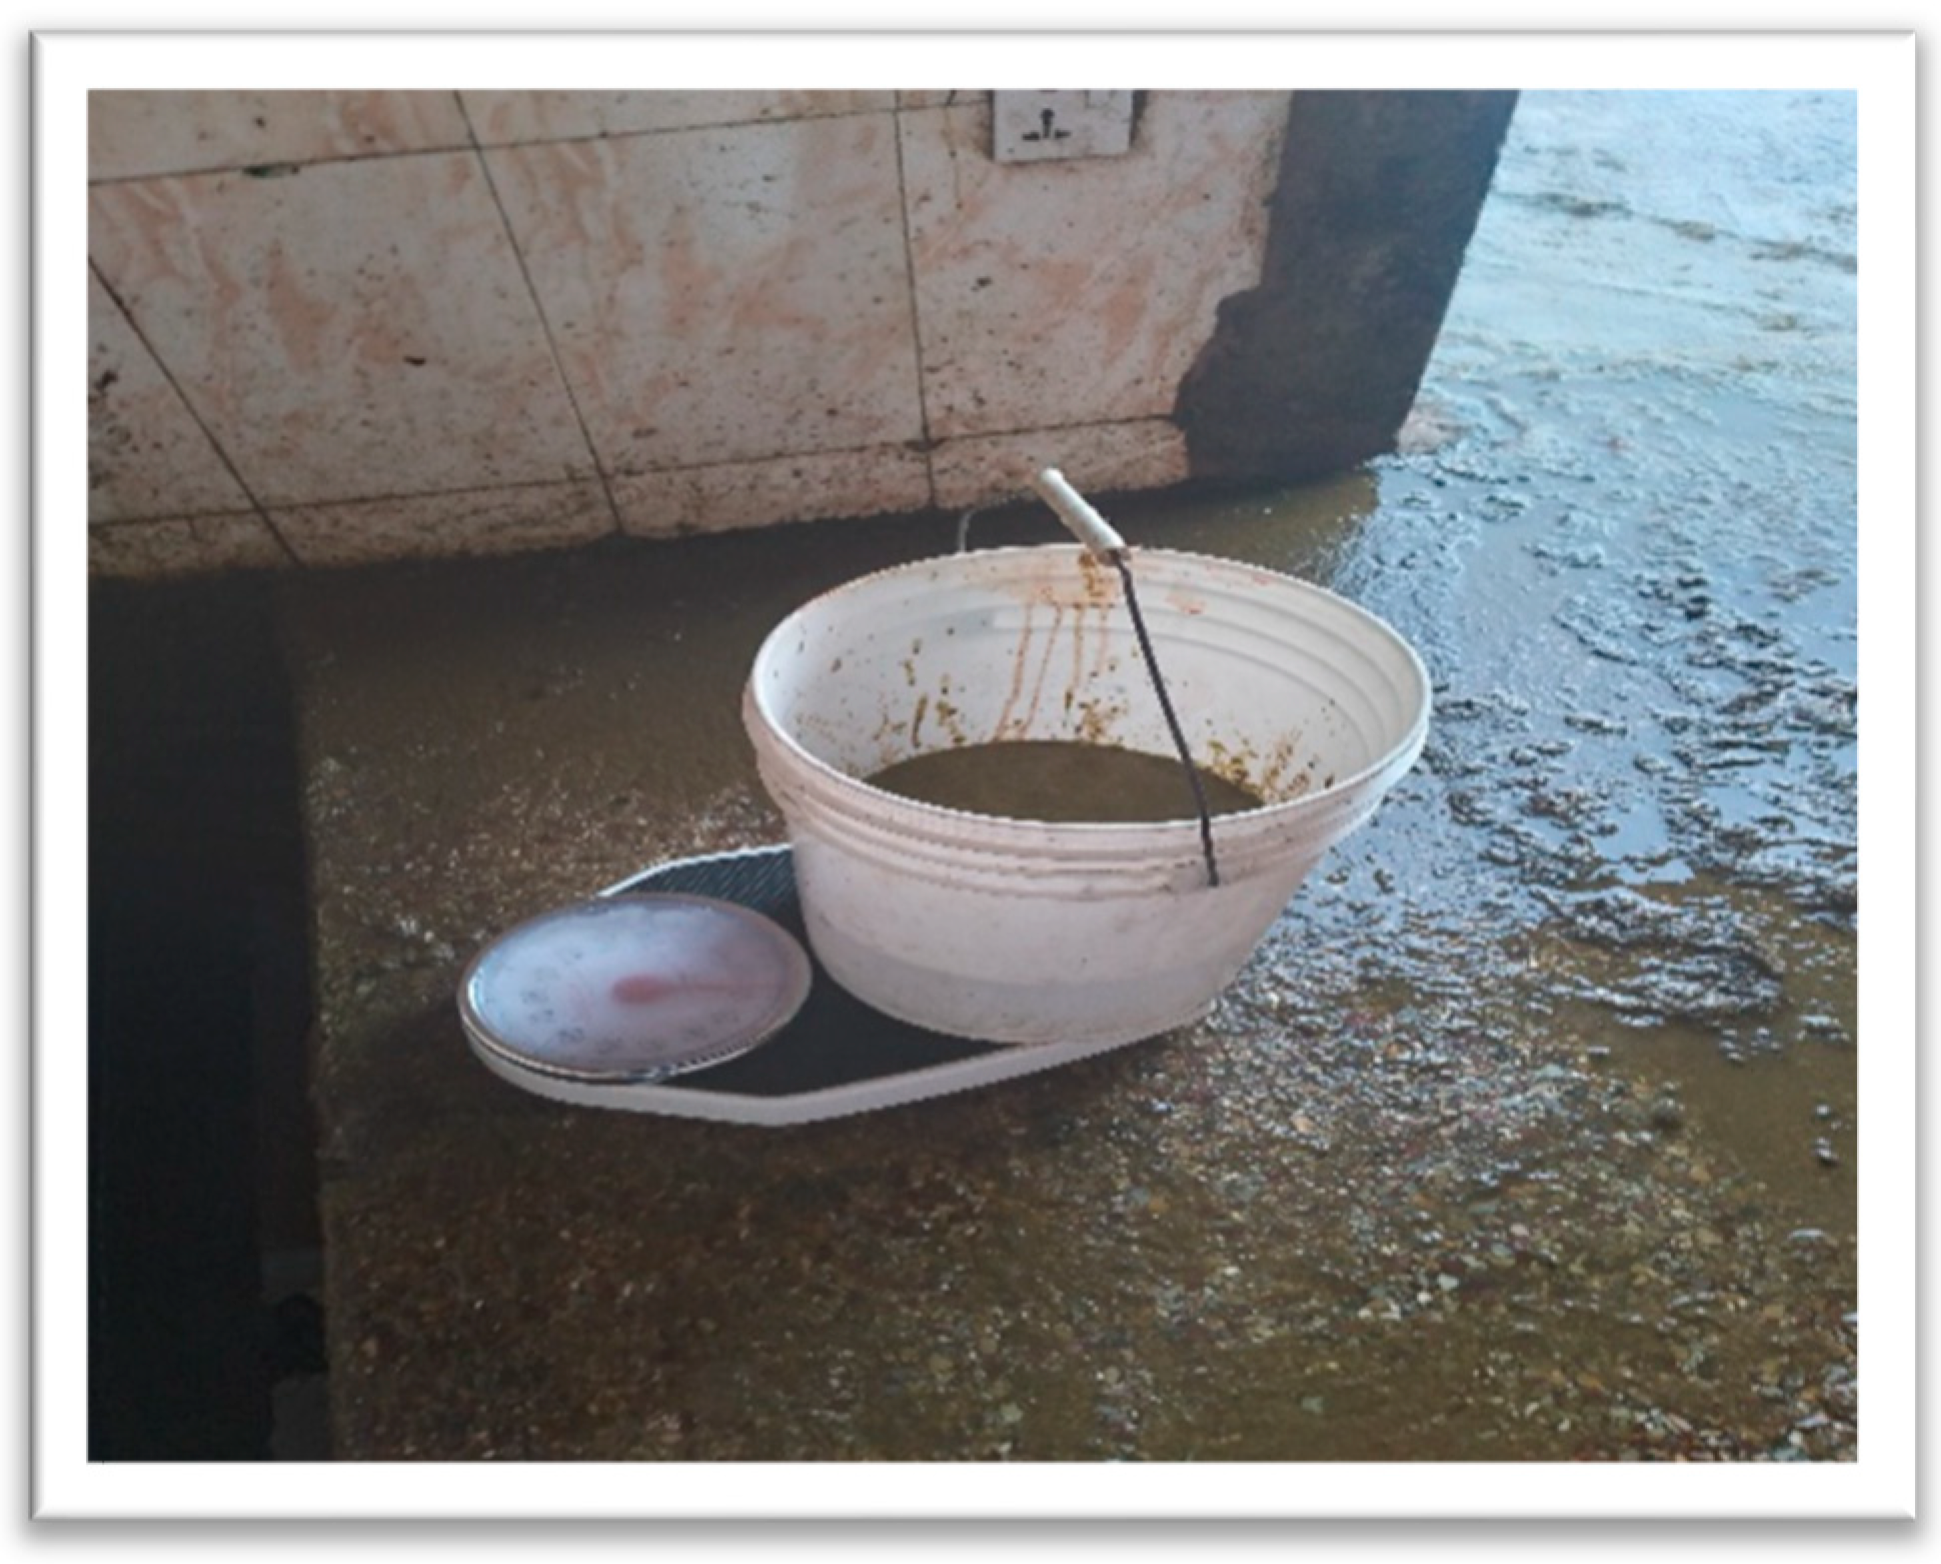
After collection in Sunyani, the samples were weighed and dried at 105°C until constant weight. They were further sealed and kept airtight for further transportation to Germany for analysis. The samples were kept in an oven at 105°C for a day before the experimental trial started in Germany. Figure 1 shows the current form of disposal in an open container, while in the background heaps of dried rumen content can be seen, that are dumped there, when the container limits are reached. Figure 2 shows the weighing of rumen content at the Sunyani abattoir.
A subsequent resource assessment was carried out to evaluate the specific waste generation and composition at the facility. This involved counting each cow, goat and sheep slaughtered per day. This was repeated for three (3) days. For all three days, the masses of rumen content per cow, goat and sheep slaughtered were measured, each in duplicate. This was used for estimating cow, goat and sheep’s average rumen content production. The quantities of each animal slaughtered and the resulting rumen masses were used to obtain a relationship between the mixtures produced by the slaughterhouse. The obtained ratios were subsequently used to mix the received samples. Table 2 summarises the masses obtained for the rumen contents, the quantities of cow, goat and sheep slaughtered at the facility and the expected annual outputs.
The Hohenheim University Biogas Laboratory has a 400 L laboratory reactor, designed and designated for standardised inoculum production. This facility cultivates bacteria continuously, under controlled and favourable conditions. This reactor is supplied with rapeseed oil, soybean meal, shredded wheat, maize sludge, and digestate from different biogas plants in Baden-Württemberg, southwest Germany. The inoculum production plant had an organic loading rate (OLR) of 0.3 kgoTS/m3d on dry organic matter basis and a temperature of 37°C. It had a hydraulic retention time (HRT) of 200 + 25 d. The inoculum was collected and transported in sealed and airtight containers, over a period of one (1) hour. There was constant degassing of the inoculum while transporting it. Its use was preceded with sieving using a mesh with a size of 0.5 mm, same as in the case of Hülsemann et al. (2020) [57]. Characteristics of the inoculum are described by previous authors [24,57,58,59].
Analytical methods in this research were undertaken at the Central Laboratory of the Rottenburg University of Applied Forest Sciences. These methods followed the VDI 4630 [59] and associated standards.
In determining the total solids, approximately 50 g of each sample was fetched into evaporating dishes and oven-dried at 105°C for >12 hours. The masses were checked after the drying period and further dried until consistent masses were achieved. The determination was carried out in four (4) replicates to ensure accuracy.
After transportation to Germany and repeated drying to ensure an anhydrous state, the oTS was determined according to ISO 21656 and VDI guidelines [59]. The samples were milled with a sieve size of 1 mm, uniform particle size was achieved according to ISO 3310-1 [59]. Empty crucibles were weighed and 1g of each sample was measured into the empty crucibles. The masses of the empty and filled crucibles were determined and recorded. They were kept in a muffle furnace and set to operate with defined heating ramps (defined by standard DIN EN ISO 18122:2016-03) [60] up to a temperature of 550°C for about 24 hours. For each sample, measurements were done in four (4) replicates. The crucibles were weighed after cooling to room temperature in a desiccator. The ash contents were determined and the oTS calculated as the difference in masses between pre-ashing and post-ashing. The ash contents were expressed as a percentage of the total mass of dried samples used. These processes were repeated for inoculum obtained from HHU biogas laboratory, see Table 3.
5 g of TS of each sample (cow solid, cow liquid, goat-sheep mixture and press cake) was measured and milled using a 0.25 mm mesh. Approximately 80 mg of each sample was measured for elemental determination in an elemental analyser (LECO CHN 828). The CHN proportions of these samples were determined according to VDI 4630. The oxygen fractions were determined as the difference between the total composition of all elements (100%) and the sum of the measured CHN organic fractions, as well as the ash content, neglecting the fraction of sulphur. Table 3 shows the different fractions of C, H, N and O present in each type of substrate.
Inductively coupled plasma-optical emission spectroscopy (ICP-OES) was used to evaluate the study samples’ concentration of trace and minor elements. The Aqua Regia treatment in accordance with ISO 11885 and DIN 22022-2 were followed in this procedure [24,61]. Each sample was analysed with n=4 or n=3 repetitions; except for press cake, which was done with n=2 due to limitation of sample quantity. In the case of press water, the sample was diluted in a ratio of 1:10 using double distilled water. 1 mL of nitric acid (HNO3) was added to acidify each sample. A SPECTROBLUE system (SPECTRO Analytical Instruments GmbH) was used to measure the trace element concentration of these samples.
Sample preparation for calorimetry was done in accordance with ISO 14780 [62]. About 1 g of each dry sample was pressed to a tablet size (ISO 1834:03) [62]. Those tablets were burned in a bomb calorimeter (IKA C6000 ISOPERIBOL) to measure the higher heating values (HHVs) of the samples: in accordance with DIN EN14918 [60]. The set-up had a bath, ensuring a fixed heat transfer between the bomb and the water. Double distilled water was used to collect the liquid resulting from the calorimetry and rinsing the bomb. Chloride and sulphate anions were determined using ion chromatography (with Metrohm 883 Basic IC plus).
The Hohenheim Biogas Yield Test (D-HBT) was used for the Biomethane potential trials. This set-∙up consisted of sixteen (16) 100 mL syringes. In the D-HBT set-up, gas volume measurements were done manually. Due to the absence of a rotating drum, the substrates were regularly stirred by turning syringes in clockwise and anti-clockwise directions. The tests were performed as according guidelines and procedures specified by VDI 4630 [59].
The inoculum obtained from Hohenheim University Biogas Laboratory was used together with two different forms of waste portions prepared from effluent/feedstock obtained from the Sunyani Abattoir. These resulting forms are a dried mixture of cow rumen content, goat rumen content and sheep rumen content (CGS). This mixture was based on a scientifically determined ratio, see chapter 2.1.1.1 and Press Water (PW) obtained from a solution of the aforementioned mixture.
RC-CGS-M (mixture of rumen contents of cow, goat and sheep from the Sunyani Abattoir) on a dry basis was formed using the deduced production ratio. on dry basis to two different dried samples: Rumen Content of Cow-Liquid form (RCCL) and Rumen Content of Goat, Sheep-Mixture-Liquid form
Variant Sample ID Description
1 RCCL Rumen Content of Cow – Liquid form
2 RC-GSL Rumen Content of Goat, Sheep – Mixture-Liquid form
3 RCGL Rumen content of goat – Liquid form
4 RCSL Rumen content of sheep – Liquid form
Variant I RC-CGS-M A dried mixture of cow rumen content, goat-sheep rumen content
Variant II PC-CGS-M The solid residue obtained from Variant I after mechanical pressing
Variant III PW-CGS-M The liquid extract obtained from Variant I after mechanical pressing
Variant description 1: Description of different samples and their identities.
(RC-GSL). The wet equivalences of dry masses of RCCL and RC-GSL (RCGL + RCSL) available for the experimental trial were measured and mixed in the established ratio. The mixing was effectively done with the use of a magnetic stirrer.
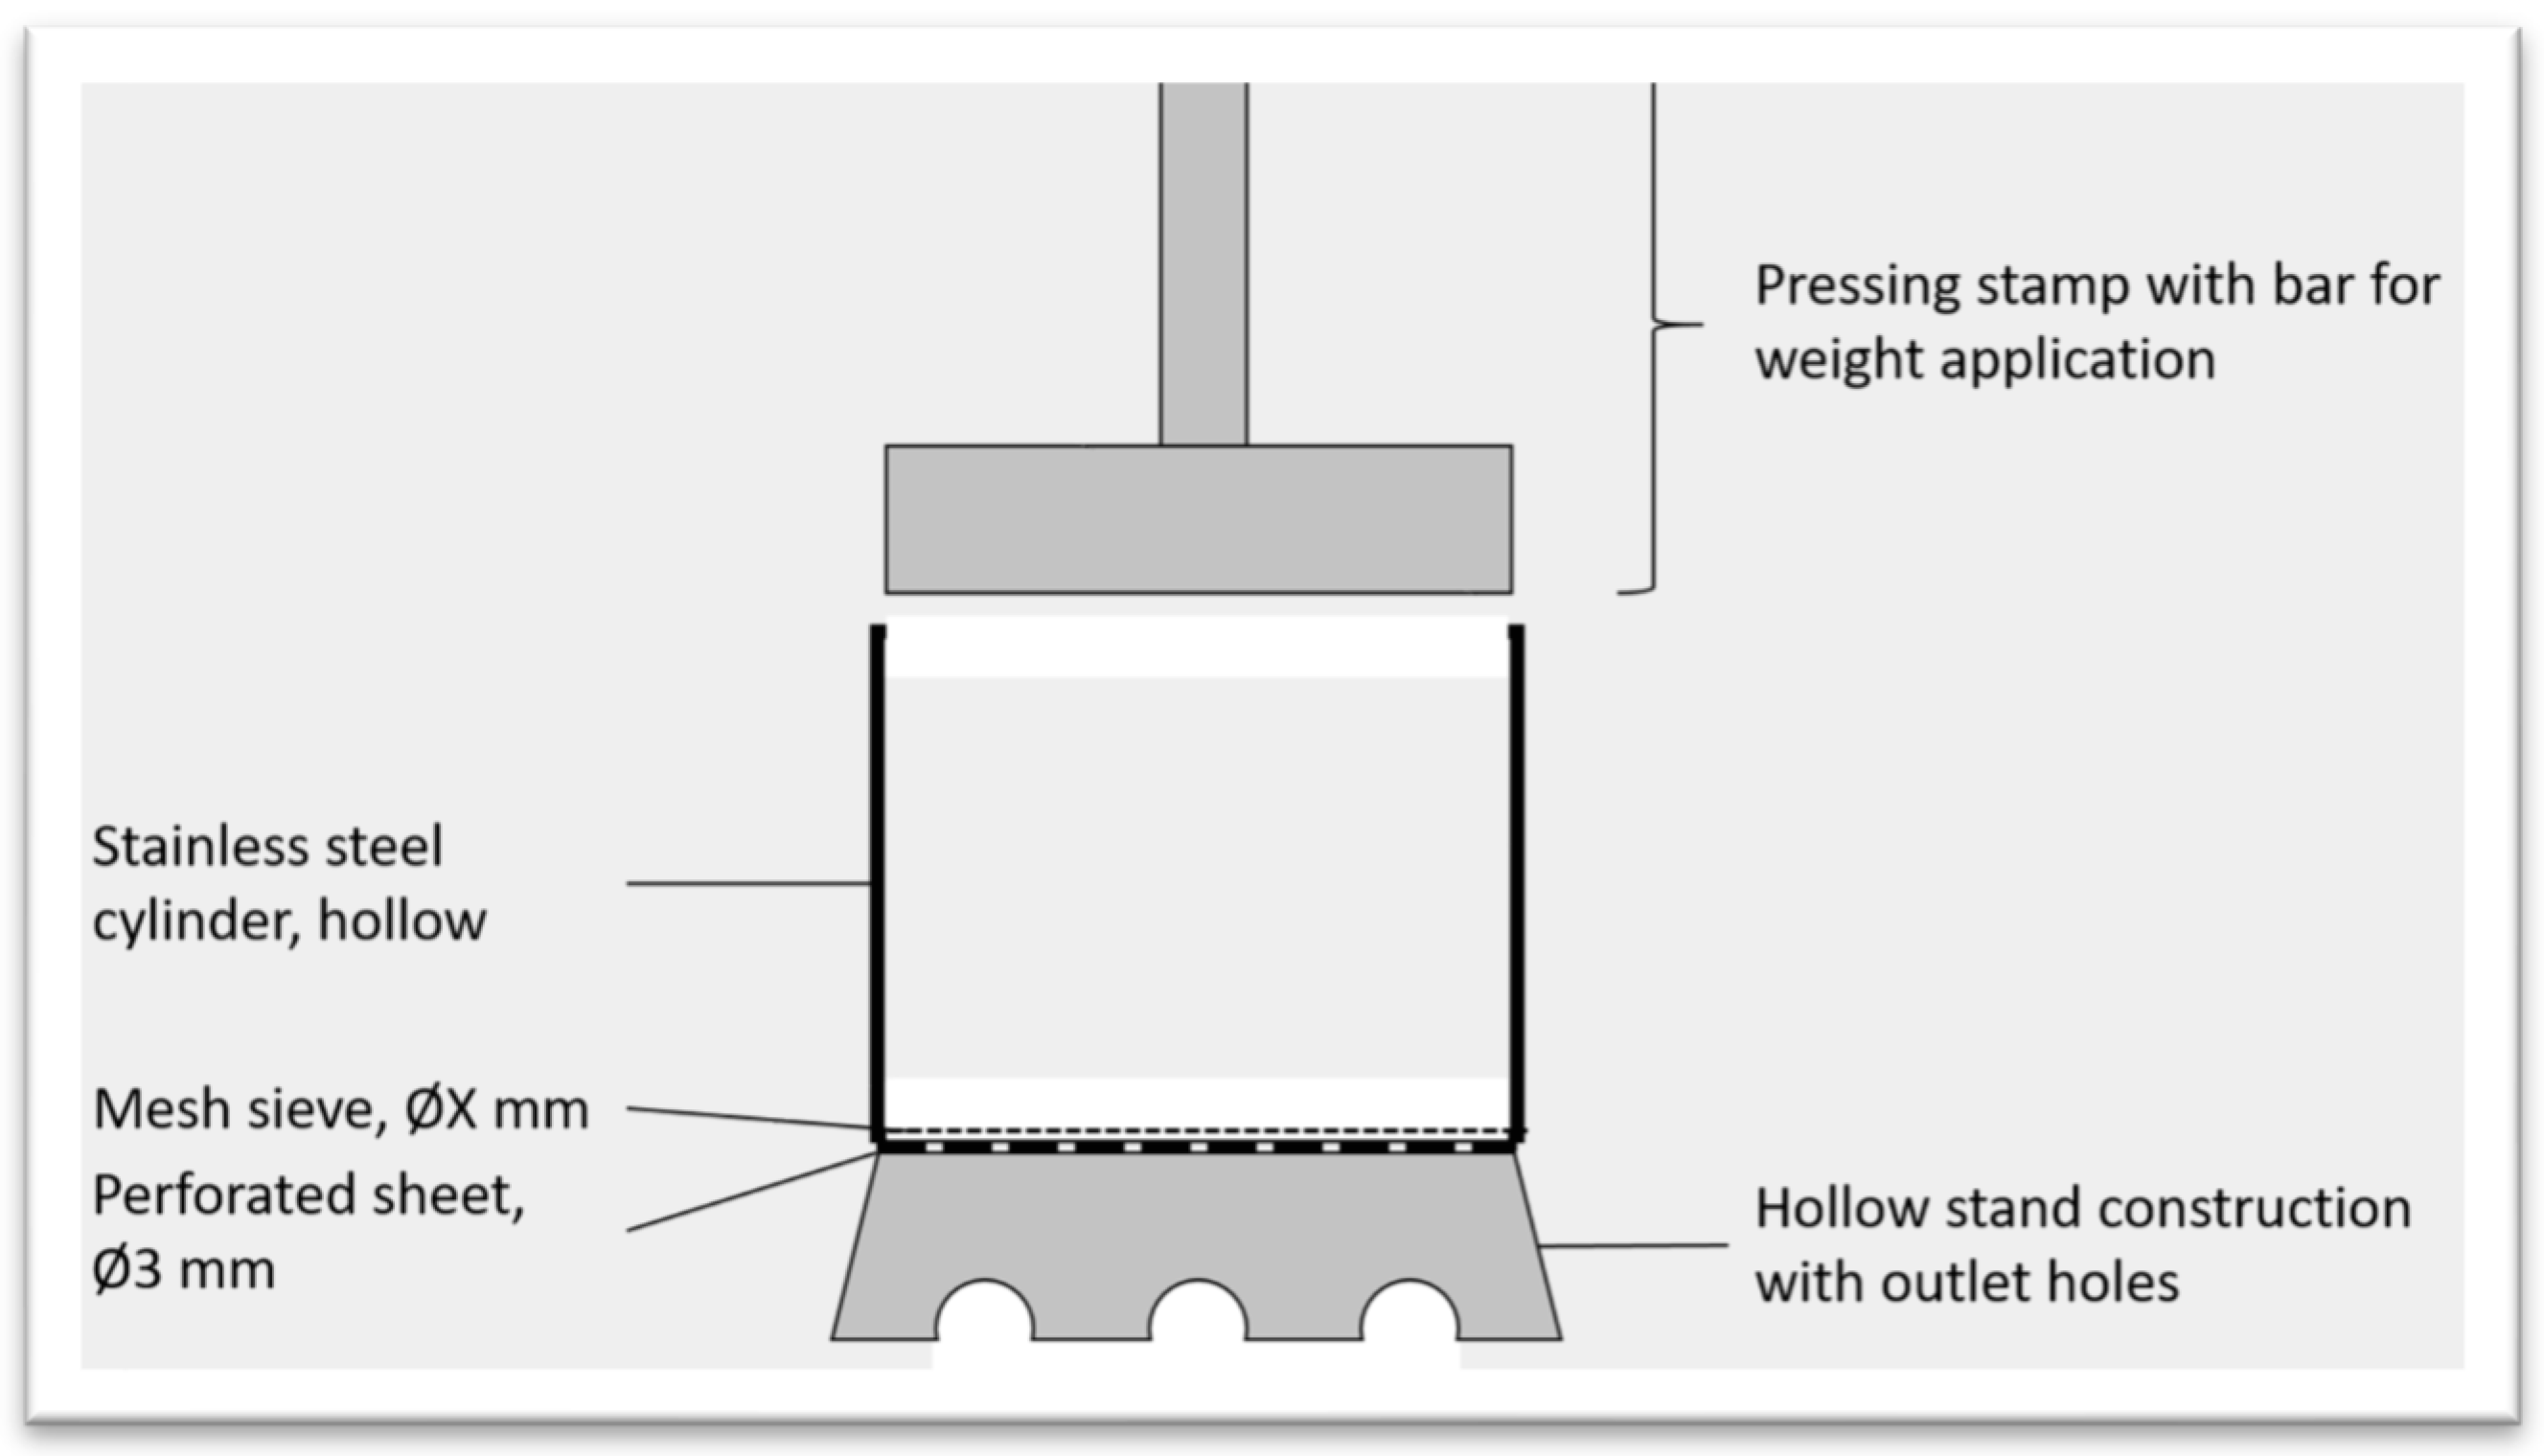
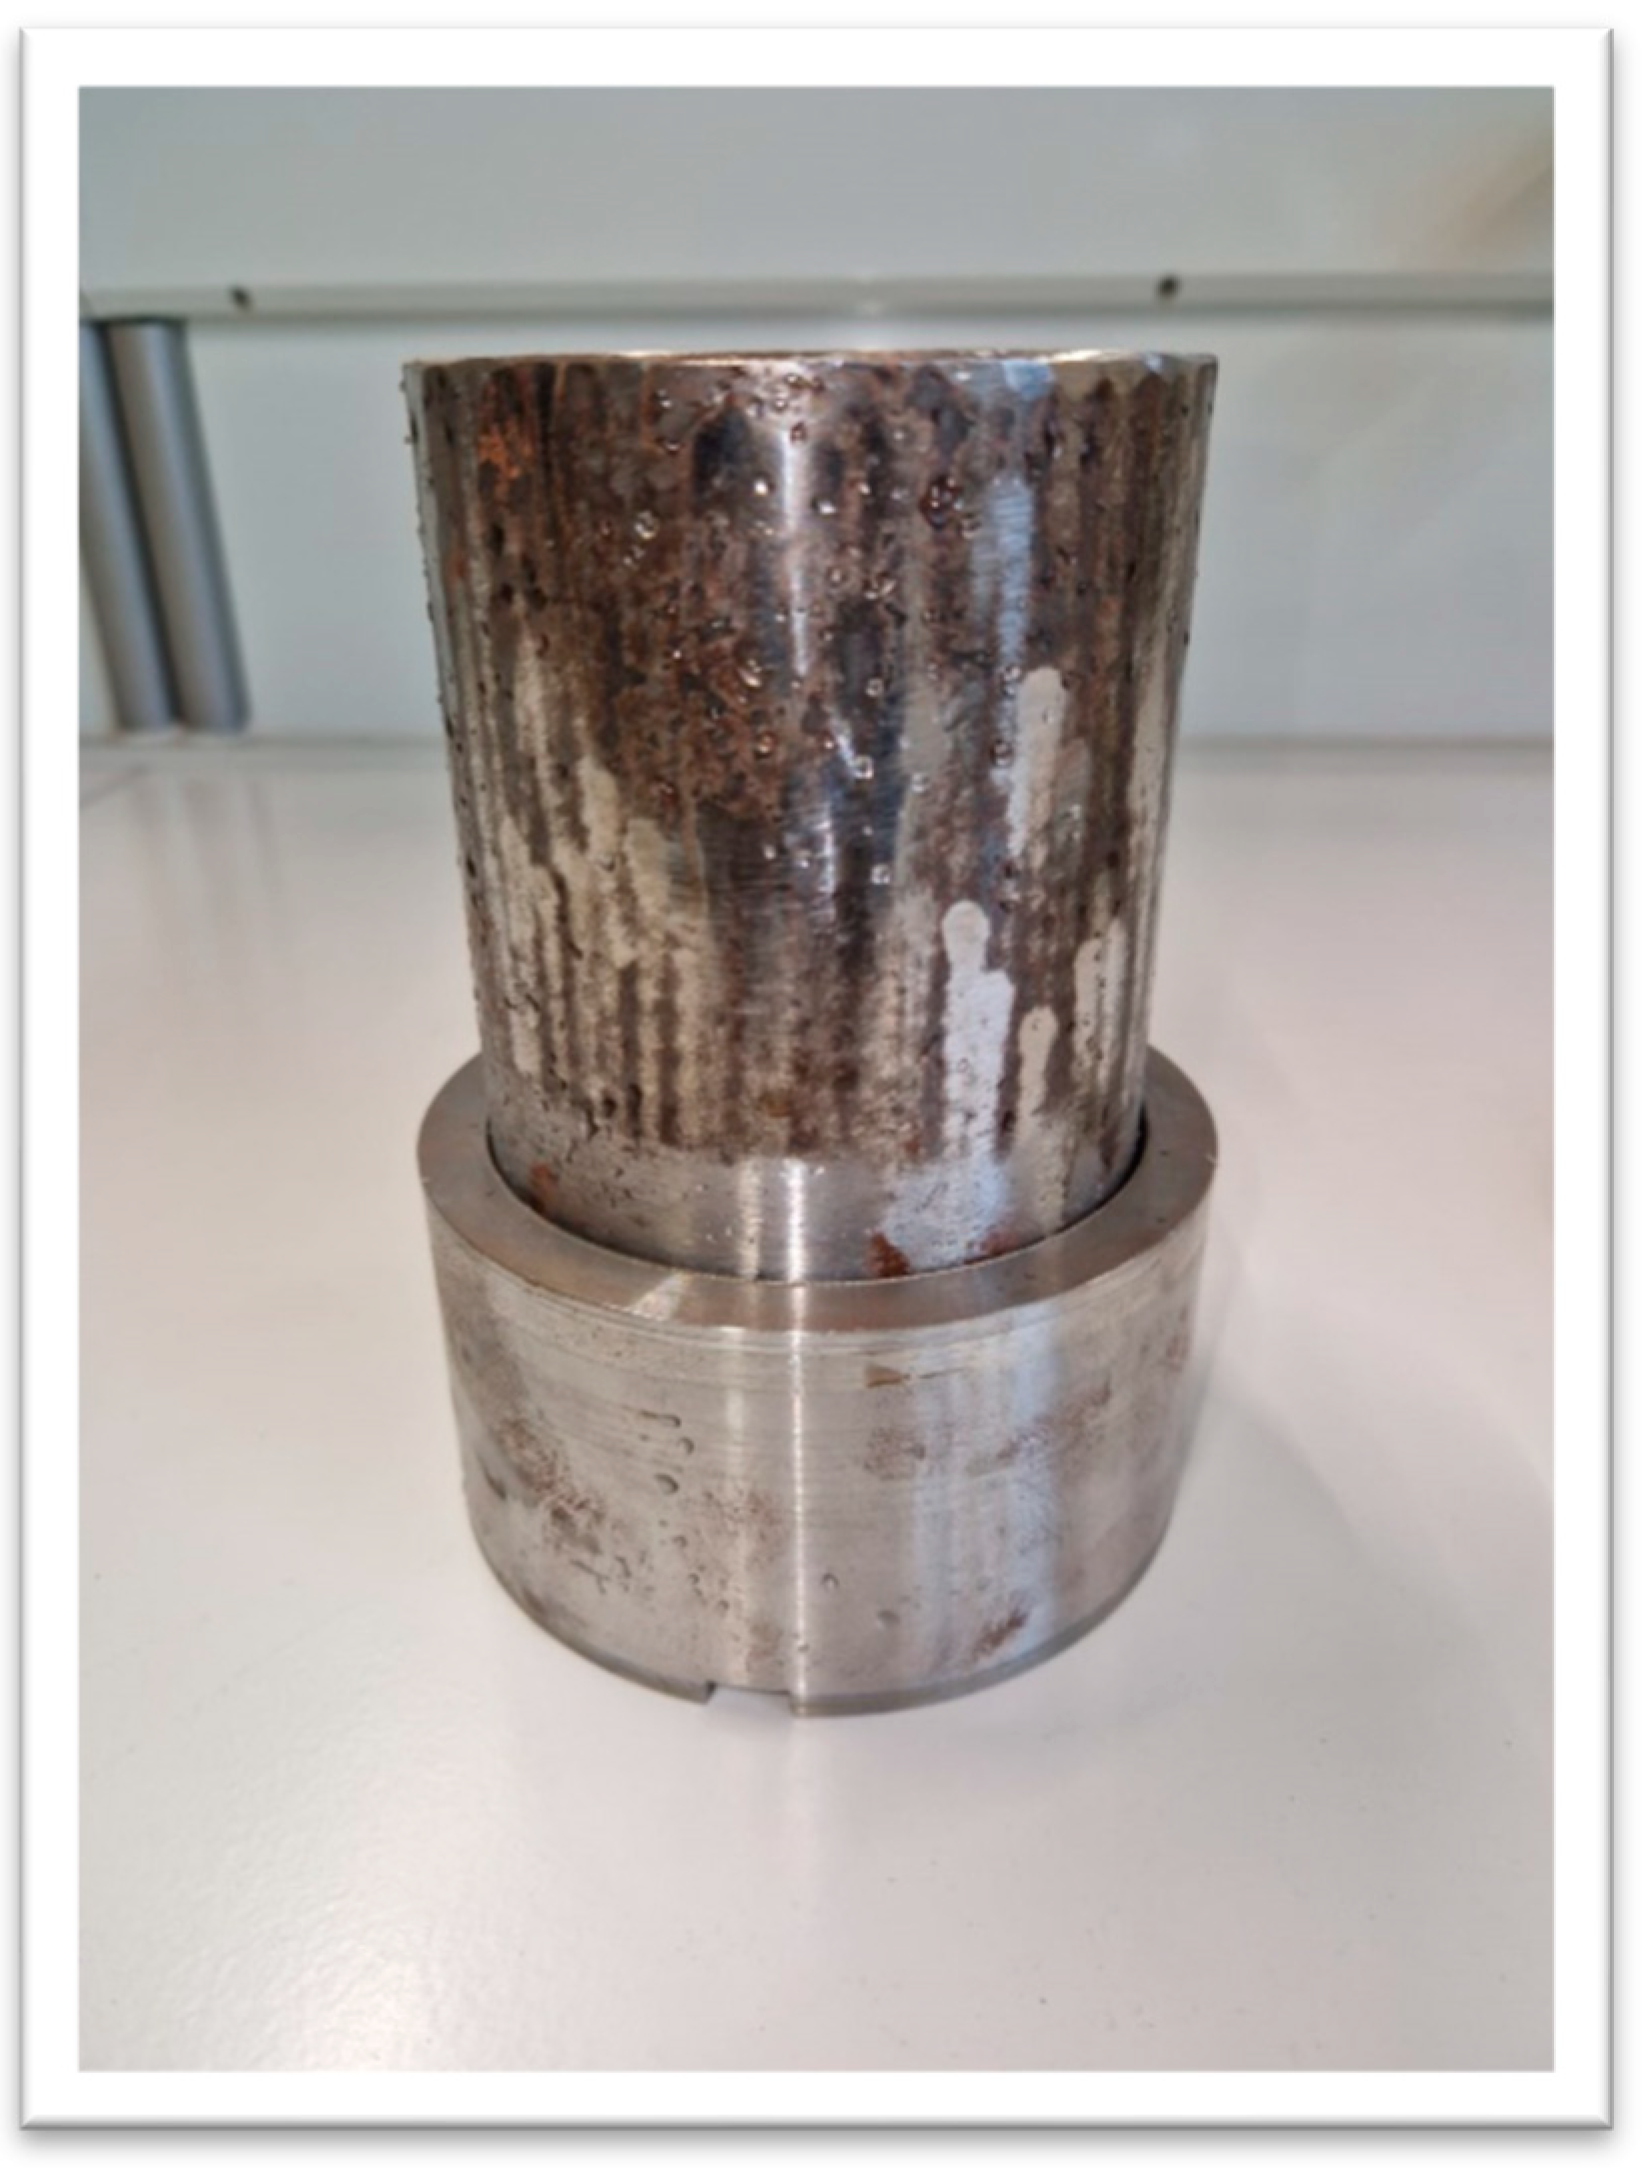
The preparation of PW-CGS involved two key intermediate steps: Step I and Step II. The activities of Step I were repeated; except for relevant masses, which were used on dry matter basis. The equivalent relevant water was calculated and added to the mixture. With the help of a magnetic stirrer, it was stirred to mimic the initial forms. The rehumidified samples were then stored overnight. The Step II involved the design of a mechanical press to squeeze out the liquid available in the substrate. An appropriate mechanical press was designed and fabricated at the HFR’s mechanical laboratory. An appropriate weight was derived from an easily commercially available press. Thus, a pressure of 24.1 kg/cm2 should act on the press surface, reinforced with a fine sieve, of 52.81 cm², induced by a pressing weight of 200 kg. Figure 3 is the design of the mechanical press while. Figure 4 is a picture of the fabricated mechanical press.
After preparing the wet mixture; sample RC-CGS-M was pressed. The pressed out water (liquid) was collected, weighed and labelled as press water (PW-CGS-M).
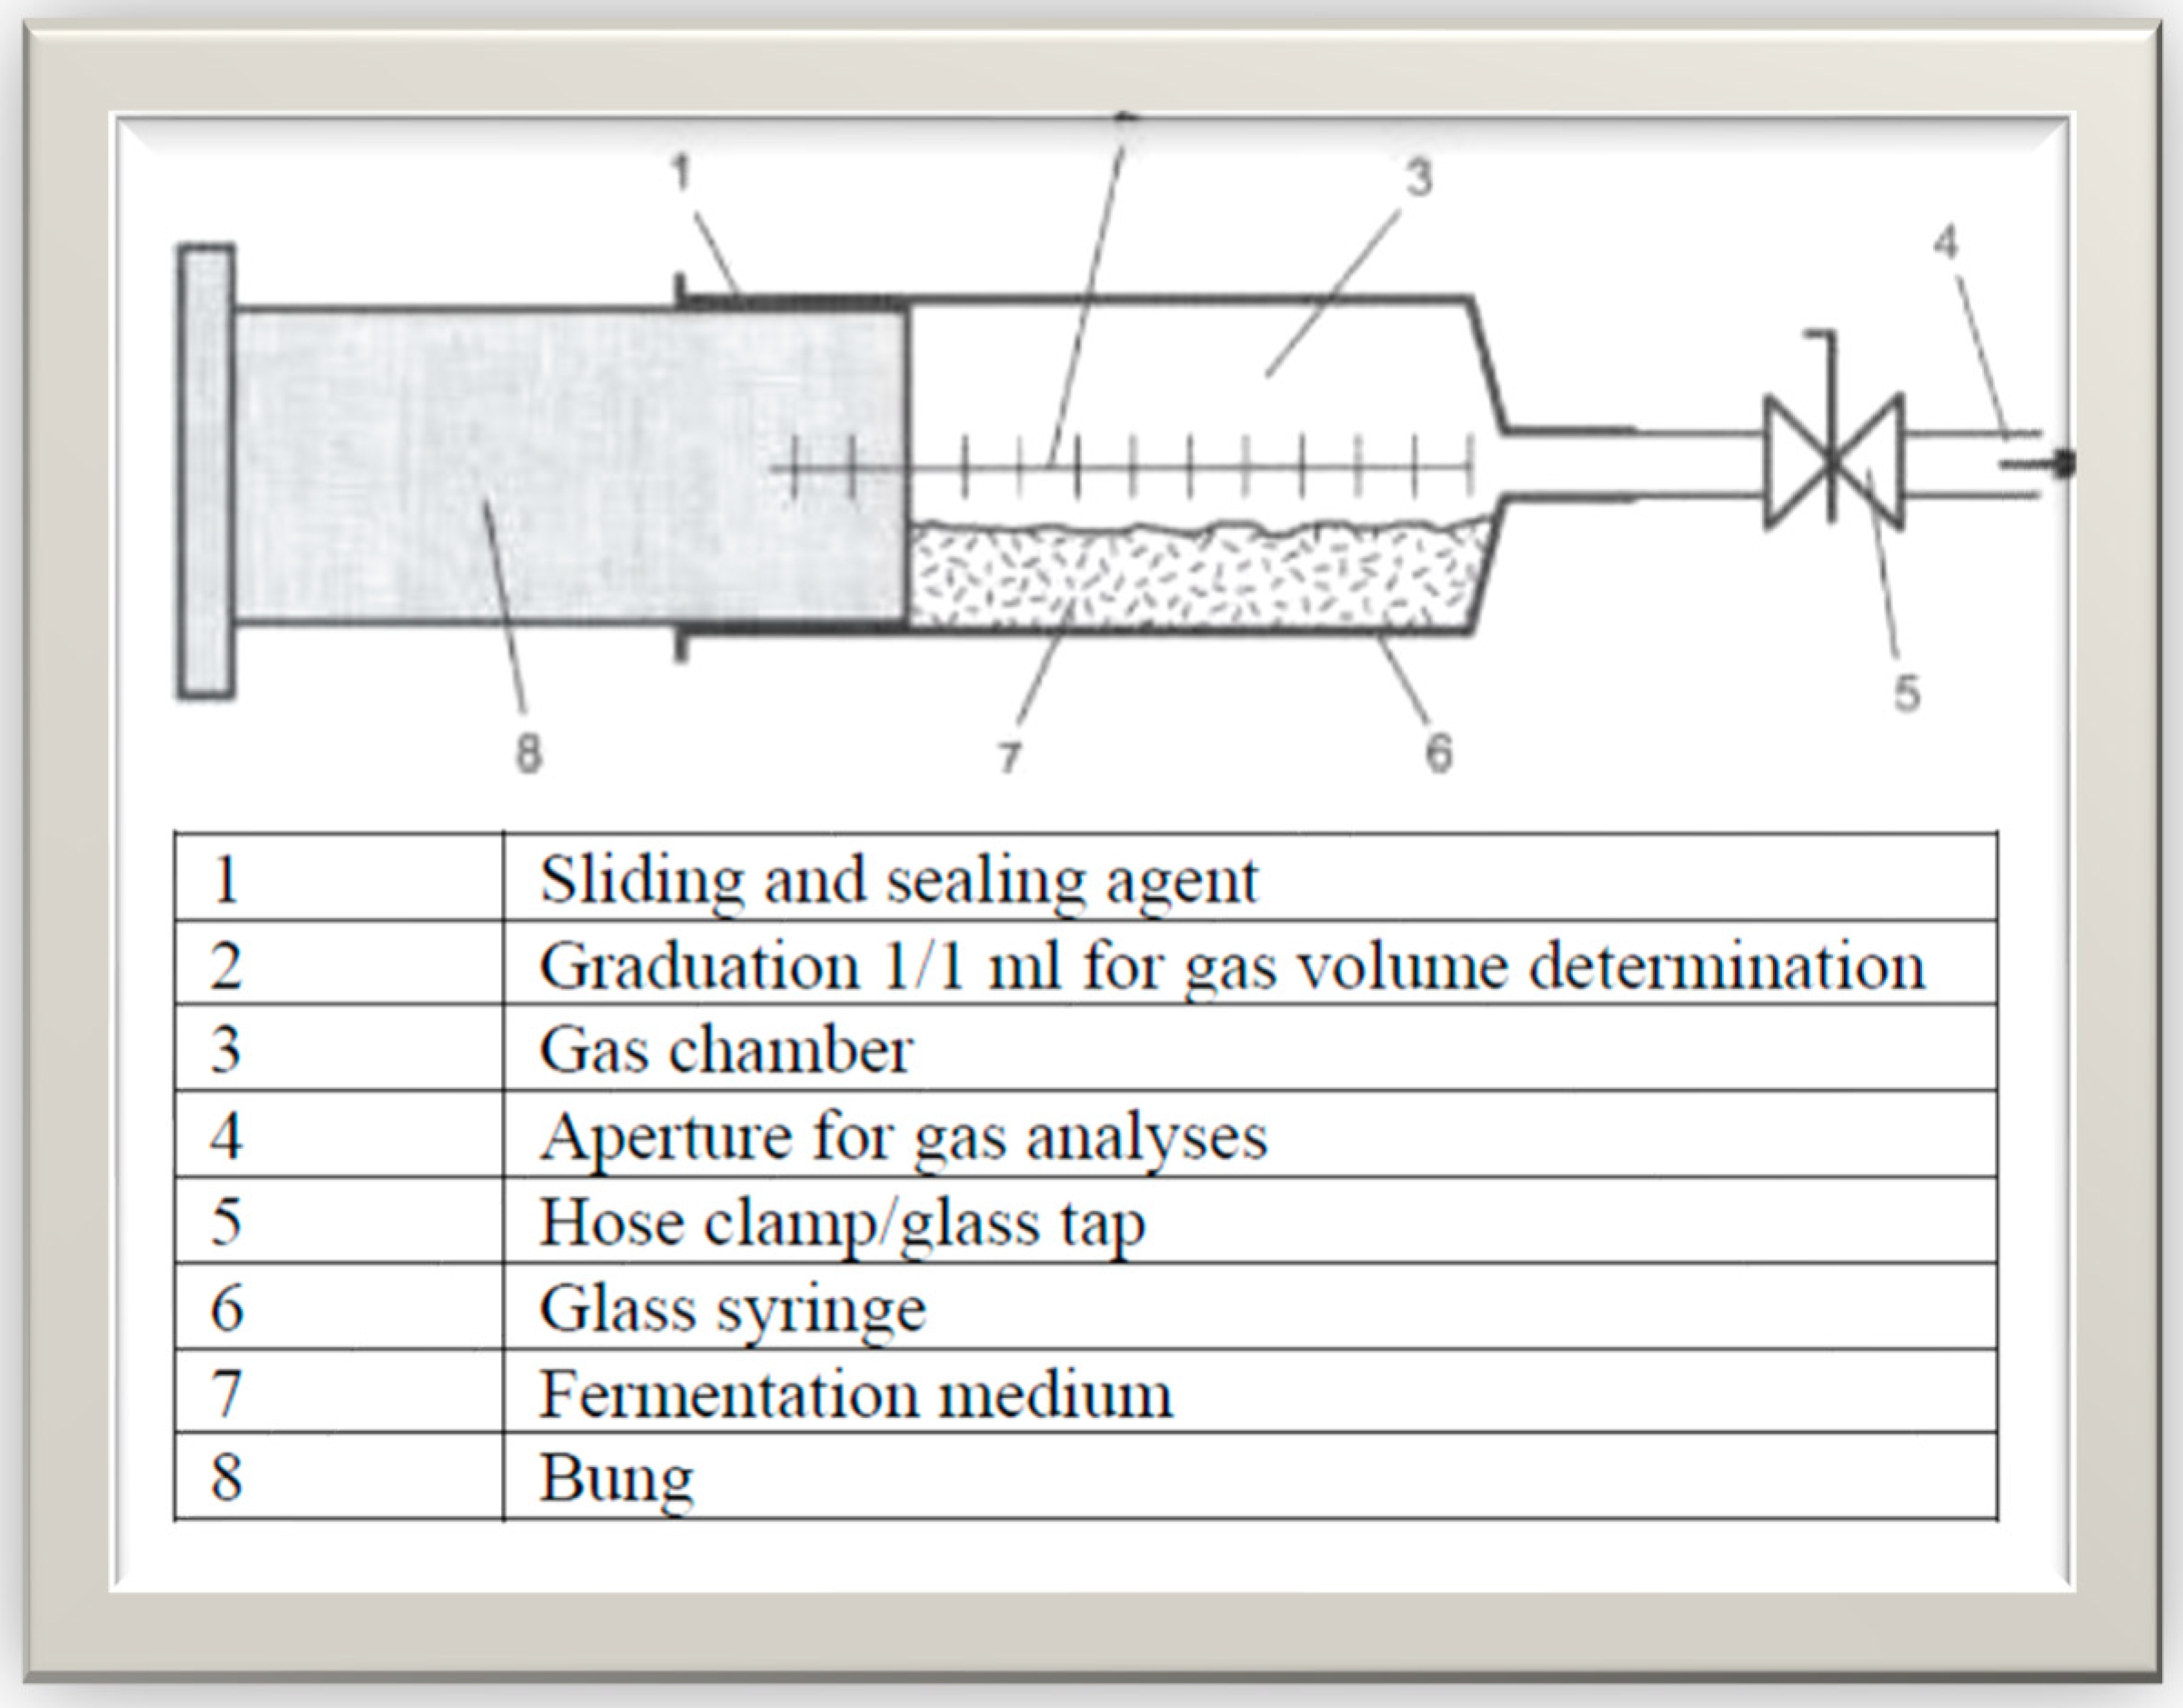
After pressing in step II, the remnant cake was weighed and labelled as press cake (PC-CGS-M). The structure and set-up of the HBT is available in literature [24,57,59]. The experimental procedure was carried out according to standards in VDI 4630 [2,3]. Figure 5 is a schematic of the HBT digester design used. All determinations were done in four replicates. The four (4) replications for each substrate was in accordance with VDI 4630 [2], ensuring measuring accuracy. Each digester contained 30 mL of inoculum and X g of TS of sample, in a manner that it will achieve an oTS ratio of less than 0.5. For PW-CGS-M, X g of 2.21 g FM was used and for RC-CGS-M, X g of 0.49 g TS was used. One set-up, however, contained only inoculum to serve as control. For all three set-ups (Inoculum, RC-CGS-M and PW-CGS-M), their starting volumes were manually read and recorded. The set-up was left for a 70-day period at a mesophilic temperature of 37±0.5℃. Volume levels of each substrate and/or inoculum was read over the period. The differences in volume between two measurements was estimated as the gas generation in ml over that period (under the specified operating conditions). The experimental systems were degassed in turns at appropriate times (when volumes of content of syringes were reasonably high, to prevent uncontrolled leakage). In the initial stages of the trial (about 8 days), readings were taken averagely for three (3) to four (4) times a day. Measurements were restricted to once a day in the last weeks of the trial. Considering the 0.5% criteria (with an increase in gas production of less than 0.5% per day for three days), the digestion process was terminated.
The biogas and specific methane yields were evaluated for both biogas yield and the estimated methane fractions (determined according to VDI 4630). Using first principle, the biogas (methane) potentials of the different variants were determined from the mass of waste generation and the biomethane potentials determined in this study[64] [65]. The total waste generation per week was first transformed to the effective mass usable in biogas generation for each variant. That is, the mass of PW-CGS-M obtained after pressing and that obtained without pressing for RC-CGS-M variant. Table 1 presents the factors used to transform the waste generation for each variant. The potentials in terms of cubic meters of methane were converted to kWh of energy using equations 1 and 2.
Theoretical models were adopted to determine the theoretical maximum biomethane potentials (TMBMP) of the studied samples, in quest to validate the obtained results. The Boyle’s model, dependent on elemental composition was used in the case of RC-CGS-M and dependent on chemical oxygen demand (COD) measurement in the case of PW-CGS-M [66]. The equations used in the estimation is available in Rodrigues et al. (2016) [66].
A dilute solution of the press water was obtained by applying a ratio of 1:30 using distilled water. 2 mL of the dilute solution was fetched into a test tube containing Test 0-29 Nanocolor CSB 1500 (COD/DCO/DQ0) (ISO 15705). The mixture was shaken thoroughly and placed in a Nanocolor Vario C2 device to heat. for two (2) hours. Afterwards, the COD was measured in a photometrically. The measured COD is presented in Table 3.
Table 1. Fraction of waste generation extractible for biogas generation using different variants.
Variant Fraction of waste extractible for biogas generation (%)
RC-CGS-M 100
PW-CGS-M 53
Equation 1: Conversion factor for cubic meters to MJ
X 1 m3 of methane = 34 MJ of energy [67]
Equation 2: Conversion factor for MJ to kWh
Y 1 MJ = 0.2778 kWh [68]

3. Results

3.1. Sample Characterisation

3.1.1. Waste Resource Assessment

The quantities (numbers and masses) of each of cow, goat, sheep slaughtered at the Sunyani Abattoir are presented in Table 2. The table captures the quantities and their averages per ruminant type; per day and per week. Cow slaughtering has is the higher for both per day and per week, while goat slaughtering has the second, followed by sheep. The figures for sheep is about a third of cow, while that of sheep is about a second of goat.
Table 2 summarises the average mass of rumen content per each type of ruminant and the average masses of rumen contents per day corresponding to the different types of ruminants. The assessment indicates that an aggregate ruminant waste generated at the Sunyani abattoir will overwhelmingly be characterised by rumen content of cow waste. Table 2 projects this ratio of waste generation by type of ruminant. The Sunyani Abattoir however has a waste generation potential of 2,615 kg per week. This presents a weekly potential of 2,615 kg for biogas generation from rumen waste.
Table 2. Summary of masses in kg of rumen content for different animals produced at Sunyani abattoir.
Animal type Cow Sheep Goat
Average quantity of each type of ruminant slaughtered
Per day 16 6 10
Per week 96 36 60
Average mass of rumen content per animal slaughtered (kg)
Per day 25 2.5 2.1
Total mass of rumen content disposed per animal
Per day 400 15 21
Per Week 2,400 90 125
Total 2,615
Ratio of weekly waste 92% 3% 5%

3.1.2. AC, TS, oTS, CHNO Fractions; S, Cl, HHV of Raw and Experimental Samples

The mean values ± standard deviations of TS and oTS of the test samples and their originally existing forms are presented in Table 3. The TS of RCCL is a half of what Wijaya et al. (2020) obtained for Cattle Manure, Chicken Manure, Rice Straw, and Hornwort in Mesophilic Mono-digestion; that of RCCS’L is about a quarter of that obtained by Wijaya et al. (2020) [69]. The TS of PC-CGS-M is higher than that obtained by Wijaya et al. (2020) [69] . It confirms the general expectation that the TS or in return, the liquid, will be drawn out by the pressing process. TS of PW-CGS-M was very low, compared to that of the already sieved inoculum used, indicating that the net generation of biogas from PW-CGS-M will be lower than that of the inoculum. It is in the range (0.39±0,01 – 3.17±0,01%) obtained by Sailer et al. (2022) [24] for three different press waters (spruce based and poplar based). The TSs for RCCL, RCGS’L and RC-CGS-G are comparable to 13.1±0.2% obtained for diary manure by Achi et al. (2022) [70]. The TS of inoculum is higher than 2.95 ± 0.01%, obtained for inoculum used by Achi et al. (2022) [70]. Additionally, the sources are geographically different and farm practices may differ from one area to the other. This will be a comparatively negative inference for the test samples if fermentation results are similar to that obtained by Achi et al. (2022) [70]. Hülsemann et al. (2020) reports similar TS and oTS of inoculum that was obtained from the same inoculum production source [57].
The oTS contents of RCCL, RCCGS’L, PC-CGS-M and RC-CGS-M are similar to that obtained for cow dung by Marañón et al. (2011) [71] and comparable to 87.3 ± 0.6 % TS obtained for dairy manure by Achi et al. (2022) [70], although a little lower. This is positive because the different fractions of the cow waste do not affect the organic fractions of the test materials. Another positive observation is to have the press cake (PC-CGS-M) showing similar oTS as that of the raw mixtures and the composite non-treated test material (RC-CGS-M). As expected, the oTS of the PW-CGS-M is lower than the literature values for rumen contents, which is confirmed by this study. The oTS measured, unlike the TS, deviates from 86% to 89% obtained by Sailer et al. (2022) for three different press waters (spruce-based and poplar-based) [24]. As only the mass of oTS is convertible to biogas in anaerobic digestion, biogas generation per unit from the PW-CGS-G is estimated to be significantly lower than the per unit generation of biogas in the case obtained by Sailer et al. (2022) [24]. The oTS of PW-CGS-M is similar to that of the inoculum. Under similar conditions, a similar generation pattern should be expected. The oTS of inoculum used is equally lower than 73.6 ± 7.0% obtained by Achi et al. (2022) for dairy manure [70]. Different preparation methods, components and conditions can explain this. With a lower oTS of inoculum, a good fermentation test results will indicate a higher practical potential of the test materials in biogas generation. Generally, the TS and oTS characteristics of the inoculum conform to standard [24,59,63,72,73].
The C/N ratio is an important factor that affects the production of biogas [70,74]. A C/N ratio of 25 to 30 is cited as the optimal for biogas generation [70,74]. Table 5 summarises the C/N∙ratios studied in this study. For RCCL (16.45), RCGS’L (17.01) and PC-CGS (17.44), the C/N ratios do not fall within these categories but comparable to 15.2 obtained by for dairy manure for dairy manure [70]. A lower C/N ratio signifies that there is a possibility of excess nitrogen in forms such as NH3, thereby inhibiting the biogas production bacteria. Co-digesting these feedstock with more fibrous materials such as cassava waste could enhance the C/N ratio by increasing the carbon content [15,53,70,74].
Table 3. AC, TS, oTS, CHNO fractions; S, Cl, HHV of raw and experimental samples.
Sample TS [%] oTS[%TS] C [% TS] COD(mg/l) H [% TS] N [% TS] Cl [%] S [%] O [% TS] AC [% TS] C:N Ratio HHV [kJ/kg]
Inoculum 4.06±0.00 62.24±0.00 n.d n.d n.d n.d n.d n.d n.d n.d n.d n.d
PW-CGS-M 1.58±0.05 63.23±0.02 n.d n.d n.d n.d n.d n.d n.d n.d n.d n.d
RCCL 10.85±0.28 79±0.01 41.88±0.40 n.d 5.25±0.16 2.55±0.05 0.21±003 0.13±0.01 29.40 20.79±0.01 19.16 17.48
RCGS'L 16.7±0.09 82±0.01 41.30±0.59 n.d 5.46±0.07 2.43±0.05 0.22±0.01 0.15±0.02 32.94 17.72 ±0.00 19.83 17.14
RC-CGS-M 11.34±0.19 81%± 0.00 40.65±0.93 n.d 5.37±0.18 2.45±0.11 0.52±0.02 0.18±0.02 32.13 19.23±0.00 19.40 17.46
PC-CGS-M 26.88±0.34 82.25±0.00 41.43± 0.20 26380 5.49± 0.01 2.38± 0.02 0.19±0.01 0.16±0.02 32.79 17.75±00 20.31 17.40
n.d: not determined.

3.1.3. Elemental Analysis, IC & AC

Elemental composition (EA) of RCCL, RCGS’L and PC-CGS-M is presented in Table 3. The EA of PW-CGS-M and RC-CGS-M were not experimentally determined in this study due to limited quantity of these materials. However, referring to the ratio in which the raw material is composed (refer to Table 2), the values for RCCL could be used as a reference for the RC-CGS-M since it should not significantly deviate from its figure. Biomass materials suitability for energy generation and as a substitute for fossil fuel largely depends on CHNOS [75]. Obtained carbon values (41.43-∙41.88%) are comparable to (39.98-43.08%) reported by Fajobi et al. (2022) for cow dung and selected lignocellulosic materials [75]. For hydrogen, 5.52-5.49 % measured in this steady is lower than 6.74-9.86% reported by Fajobi et al. (2022) [75]. Nitrogen and sulfur are known to release harmful and toxic gases. However, they are not relevant to biogas production itself. High levels of sulfur produce high levels of H2S, which reduces the overall energy content of the biogas as well as being harmful to piping and subsequent consumers [76]. Table 3 presents results obtained for sulfur and nitrogen contents. The values obtained (0.13-0.18%) for sulfur for studied samples are lower than that obtained (0.46 %) by Fajobi et al. (2022) and are within acceptable levels [75]. The values obtained for nitrogen for studied samples (2.38-2.55%) are higher than what (1.145-1.858%) Singh et al. (2017) obtained [77]. It signals that biogas production from studied feedstock (rumen content of cow goat and sheep mixture, press cake of this feedstock) will be associated with non-negligible levels of toxic substances (NH4-N) release from nitrogen [77]. The measured oxygen contents: 50.30-50.71% are comparable to 46.69-51.82% reported by Fajobi et al. (2022). For carbon, hydrogen, nitrogen, sulfur, oxygen, measured values for all studied samples are similar and validate them for use as energy materials; except for PW-CGS-M which could not be ascertained and cannot be directly related to any of those studied [75,77].
The cake has a relatively high ash content, as should be expected, due to having the highest total solid while oTS is not significantly higher than those of the other samples. This figure (4.77% ) is about twice that obtained for raw cow dung by Fajobi et al. (2022) [75]. Due to fouling, this ash content primarily reduces the fuel quality of the cake, which is not the main purpose of the cake. The ash content of RC-CGS-M (assumed from the determined values of RCCL) is about half that of PC-CGS-M. Fouling effect will be lower and produce a better fuel quality, in comparison with that of PC-CGS-M. This figure is not very different as well, from that obtained by Fajobi et al. (2022) [75].

3.1.4. HHV

The calorific values presented in this work are high heating values (HHV) experimentally determined. Table 3 contains these values. The figures measured (17.1-17.5 MJ/kg) are higher than 14.7 MJ/kg obtained for cow dung by Fajobi et al. (2022) [75]. This may be because rumen contents might have lost methane (energy carrier) in the event of digestion before being released as faecal waste (cow dung), which is the case in the latter. It also implies that the use of rumen content for biogas generation will be more valuable per TS amount that for animal faeces. The calorific values for all the studied samples are within reasonable ranges.
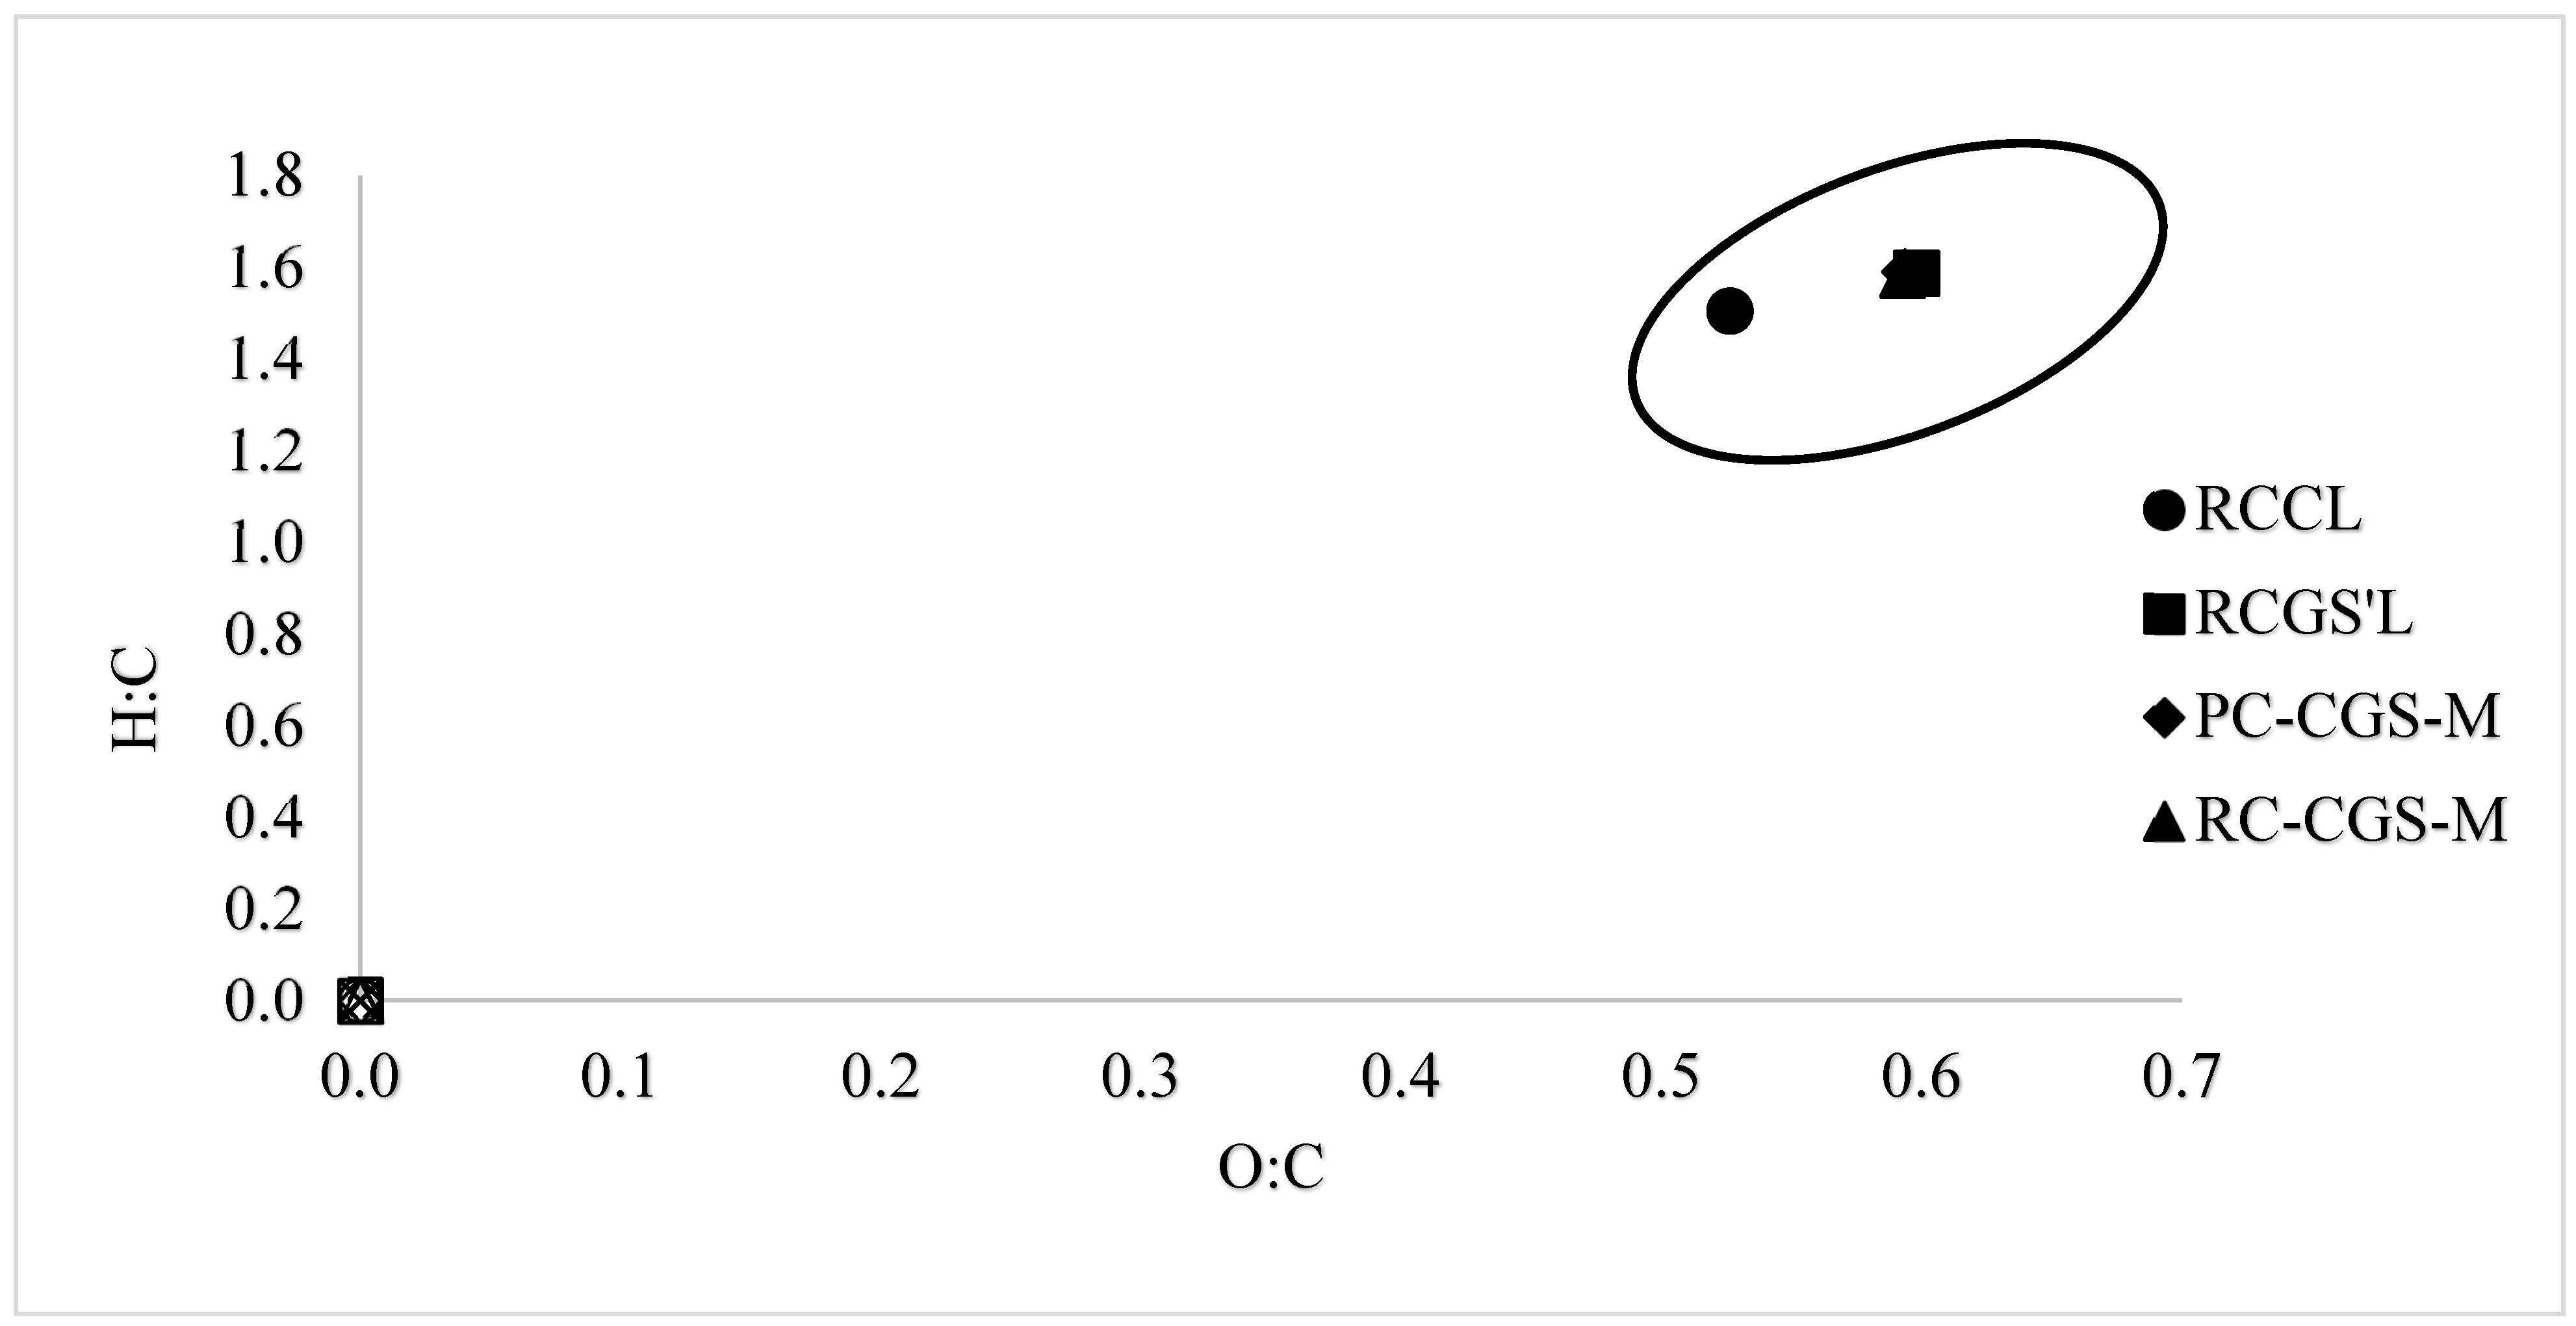
Figure 6 is a Van Krevelen diagram that shows atomic ratios of O/C plotted against H/C for studied samples. The diagram shows similar ratios of O/C plots against H/C as evident in all data points nucleated around the same point. It confirms that all study samples have similar calorific values. Heating value (fuel efficacy) is a factor of atomic ratios of H/C and O/C. A low H:C ratio will correspond to a high-energy content and vice versa. With a high O/C ratio, there is a high energy content due to a high energy density [77]. Singh et al. (2017) explains it as resulting from the possession of more chemical energy in C-C bonds as opposed to C-O bonds [77].

3.1.5. TE Concentrations

Table 4 presents trace element concentrations of test samples and the optimum ranges and inhibitory levels defined by literature [78]. Trace elements are significant to the potential of anaerobic digestion [24,63]. On one hand, they have the potential to improve the anaerobic digestion, while on another hand; they have the possibility to offer toxicity. The former is possible by the ability to increase energy yields. The latter depends on their concentrations in the digestion system [24,63]. Fe, Co, Mn, Mo, W, Ni, Zn are very important trace elements for anaerobic digestion [24,63]. Demirel and Scherer (2010) defines optimum ranges for the concentrations of trace elements that increase energy yields and inhibition levels for trace element concentrations that could offer toxicity [78]. A direct comparison is made between the measured values and the defined values for optimum ranges. For inhibitory values, literature reference Lima and Victor (2022) was first used to make an assumption, (if a TS of 20 to 27% has a density of 1,009 to 1,030 kg/m3, then an average TS of 11% in the case of the studied samples has a density ≈ 1,000 kg/m3) that the studied materials have a density of 1,000 kg/m3 [79]. Therefore, the concentrations of mg/kg determined the defined levels of mg/l are equivalent.
For the studied samples, only Fe, Mn, Zn, in the list of studied trace elements have optimum ranges defined by Demirel and Scherer (2010) whereas Zn, Na, K, Ca, Mg, S have inhibitory levels also defined [78]. Fe is listed as a key element relevant for methane formation [80,81]. Relevant levels found in the RCCL and RC-CGS-M is an indication that the ordinary rumen mixture should be preferred primarily for anaerobic digestion if non-biogas output significances are ignored. For both RCCL and RC-CGS-M, the measured levels conform to the optimum ranges defined in literature while that of PW-CGS-M and PC-CGS-M are below the defined lower limit. PW-CGS-M has a marginal value amongst all the materials. This certainly amounts to a lower (very low) biogas levels found in the PC-CGS-M and (PW-CGS-M). In the case of Mn, RCCL, PC-CGS-M and RC-CGS-M had concentrations within the optimum levels. While the PW-CGS-M had the least and outside-of-range value, RC-CGS-M had the highest. This is in line with the observation of a comparatively high biogas potential. For all studied samples, only PW-CGS-M had Zn concentrations that is outside the optimum range. Again, RC-CGS-M had the highest concentration, affirming a highest biogas output in comparison with all other variants.
RCCL had a very high S content compared to the acceptable inhibition level. Although PW-CGS-M had a higher concentration in reference to the defined inhibition values, the concentration is more reasonable than that of RCCL. As the trend has been for PW-CGS-M, the measured values for Zn, Na, K, Ca, Mg are all outside the defined inhibitory levels. That is a positive confirmation for the use of press waters in AD, with limited process challenges, particularly, inhibition in this case. In the same line, PC-CGS-M is a better-placed variant in terms of inhibition potential. Zn,∙Na, K, Ca, Mg are all outside the inhibitory, although, less attractive than the figures of the PW-CGS-∙M. For both RCCL and RC-CGS-M; which have been established to not differ from each other due to composition and physicochemical properties, Zn and Mg had concentrations which are outside the inhibition ranges, despite being less attractive that the PW-CGS-M and the RC-CGS-∙M. Much the same vein, both RC-CGS-M and RCCL had concentrations of Na, K and Ca within the inhibitory levels. Thus, inhibition resulting from these TEs will be of concern in their raw use for AD. Sequel to that, all studied variants had S concentrations higher than the minimum for inhibition to occur. RC-CGS-M and PC-CGS-M however had very high concentrations of S, with RC-CGS-M recording the highest for all studied substrates. The S levels also will have implications of H2S generation, whose impact has already been discussed in this paper (chapter 3.1.3).
The levels of Ni, Cu, Cr, Co, Pb, Cd, as relevant and concerning to anaerobic digestion were within ranges not defined by the method used in the trace elements evaluations in this study. A future study with other estimation experimental methods may be necessary, for instance, for metals like Ni which has been defined by literature as very critical to methane forming bacteria [78,82,83,84,85,86,87,88]. Other authors have cited as relevant, Mo and Se, which were not studied under the Aqua Regia treatment [24,89].
Table 4. Concentration of trace elements.
TE RCCL PW-CGS-M PC-CGS-M RC-CGS-M Inhibitory levels (mg/L) Optimum ranges (mg/kg TS)
Fe 1879.82±245.20 38.07±5.74 884.48±88.57 3188.03±943.11 - 1500-3000
Mn 543.37±13.78 5.50±0.90 226.45±20.51 449.94±8.55 - 100-1500
Zn 66.204±1.52 3.474±2.44 42.775±2.05 64.995±1.62 150 30-150
Na 6223.86±14.10 1235.02±41.56 3077.15±379.84 6218.10±31.41 5000-15000 -
K 6620.51±491.65 916.06±109.43 2347.70±246.53 8259.85±598.75 4800 (I (50)) -
Ca 8978.04±291.32 125.18±14.19 4054.04±350.41 8952.164±405.40 4800 (I (50)) -
Mg 1233.53±5.82 52.46±7.67 779.83±82.64 1237.37±5.28 1900 (I (50)) -
S 2020.49±101.23 84.59±9.98 851.01±94.85 1993.68±42.08 30 (H2S) -

3.2. Biomethane Potential

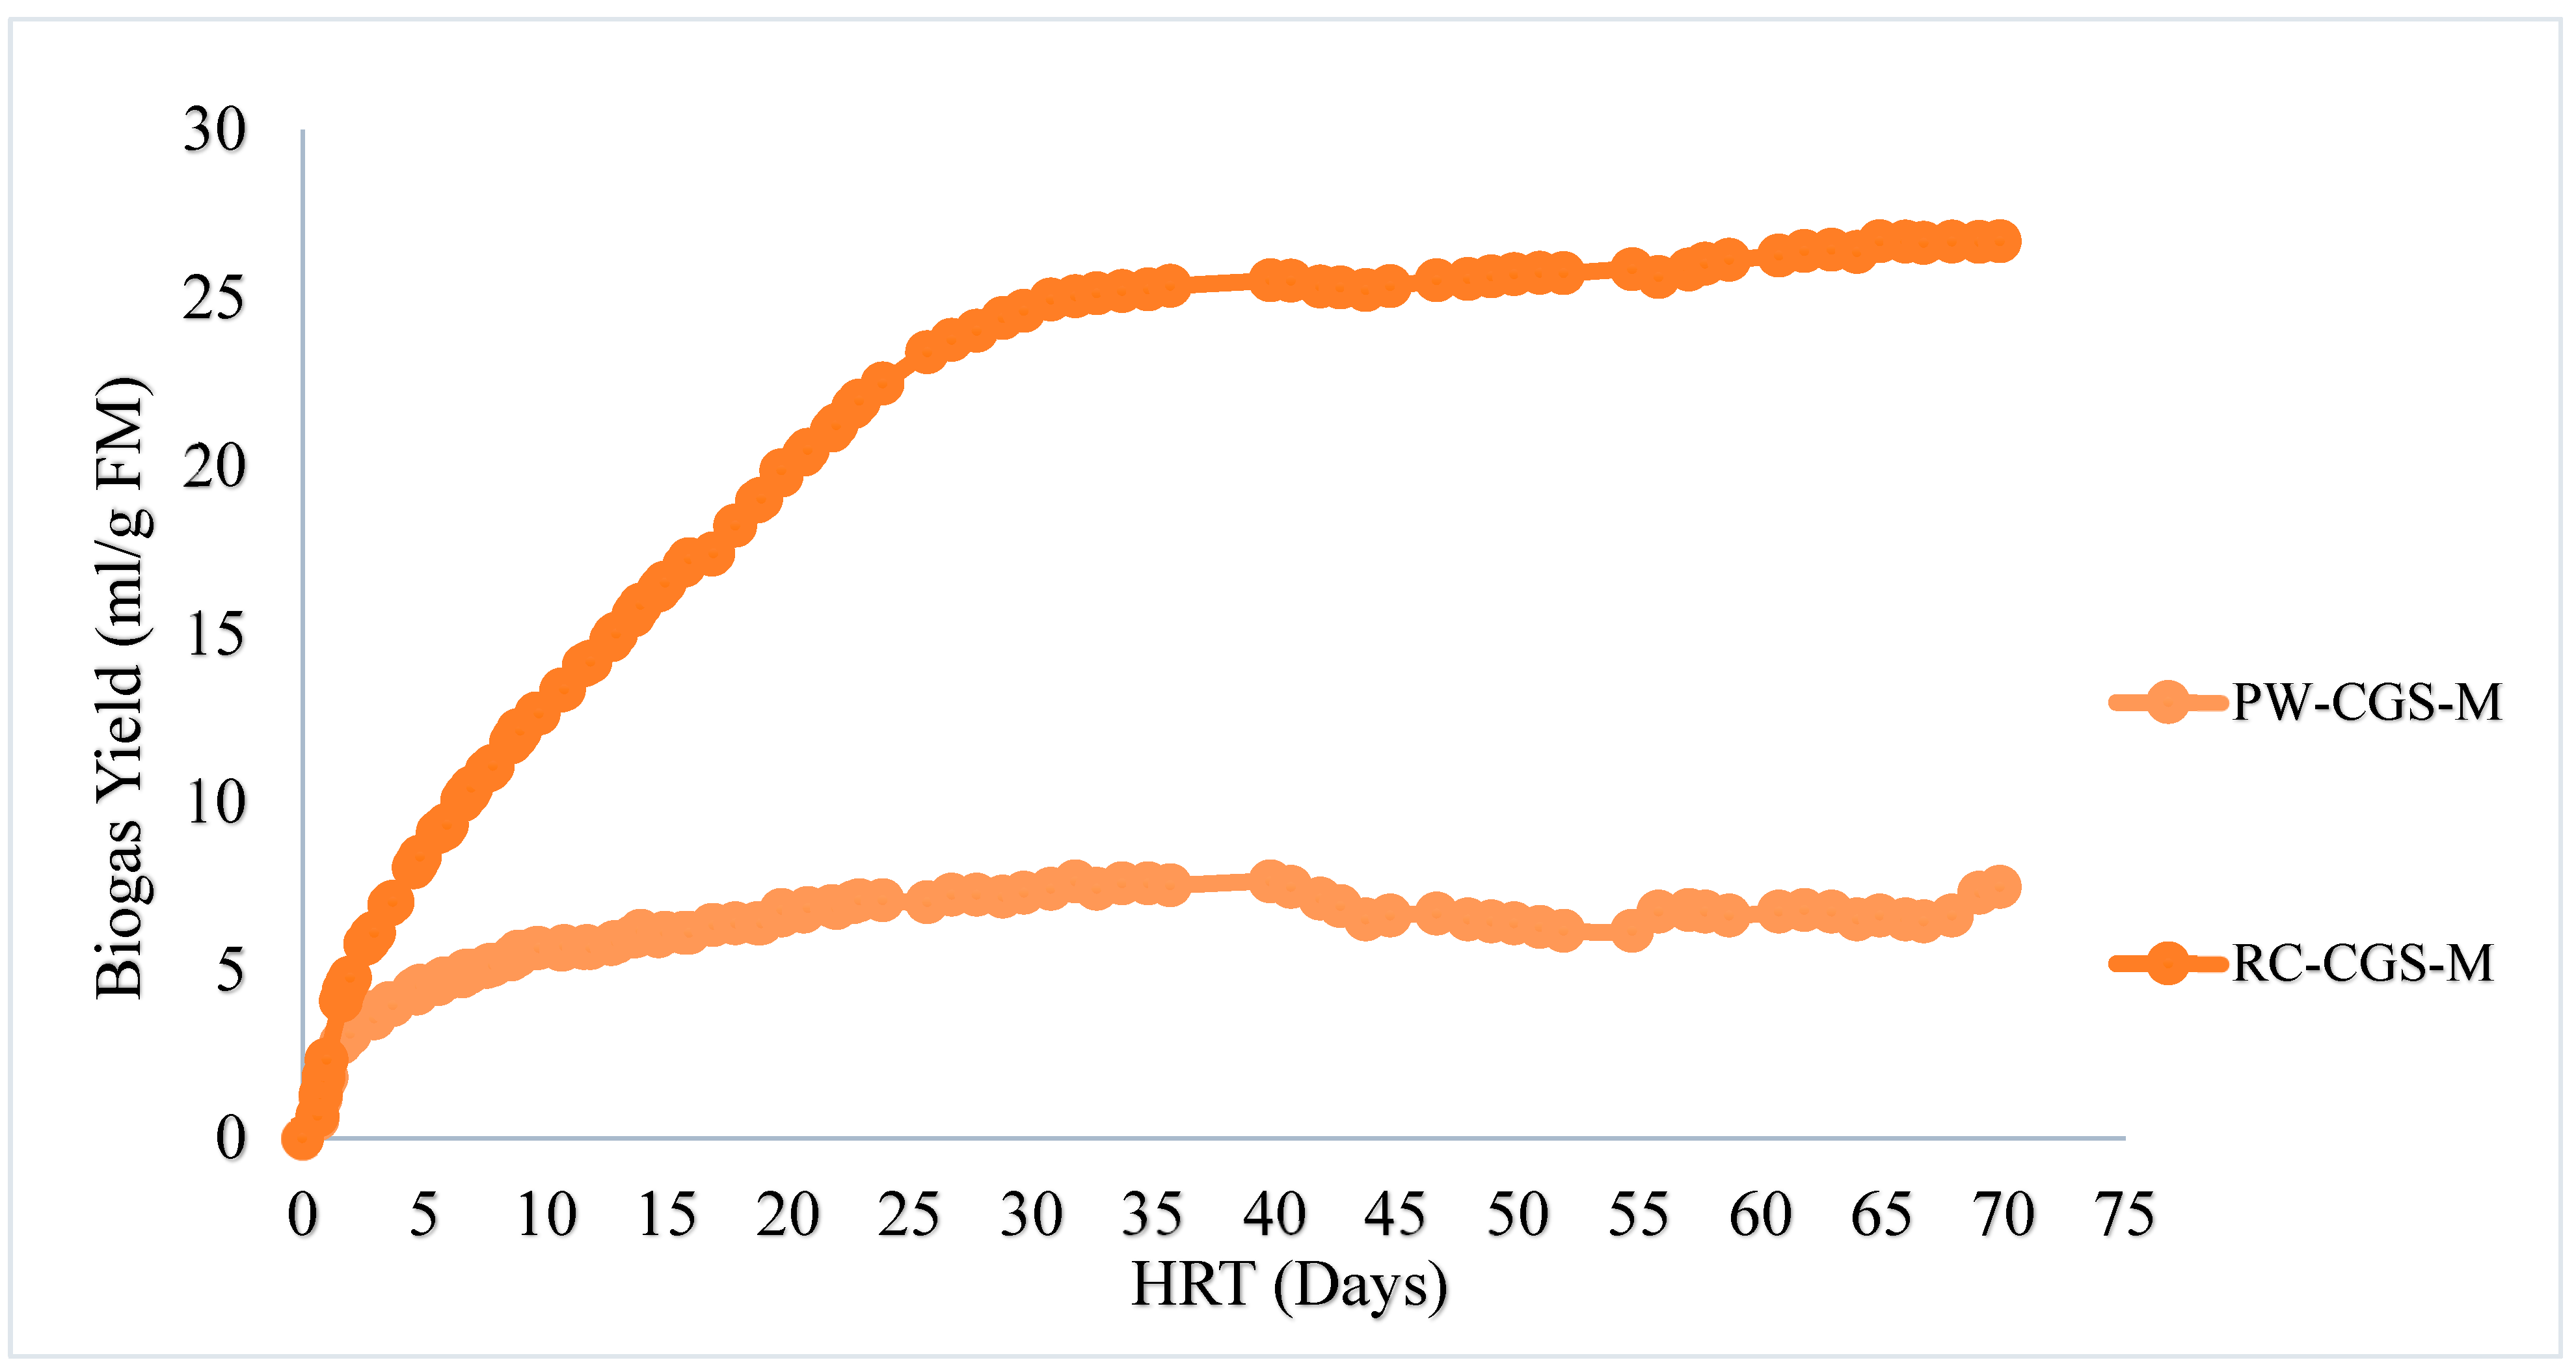
Figure 8 presents the biogas yields in ml/g FM of both RC-CGS-M (Rumen Content of Cow, Goat and Sheep Mixture) and PW-CGS-M (Press Water of Cow, Goat and Sheep Mixture. In both cases, the net production over the production from inoculum are reported. RC-CGS-M showed a higher potential than PW-CGS-M, with about 70% more yield. This translates into yields of 26.70±28.78 ml/g FM and 7.47±1.12∙ml/g FM for RC-CGM_ and PW-CGS-M respectively. RC-CGS-M turned out as the more efficient variant, as was generally expected. As cited by Sailer et al. (2022) [24], the PW-CGS-M only contains a very small amount of fibres, thus reducing surface area.
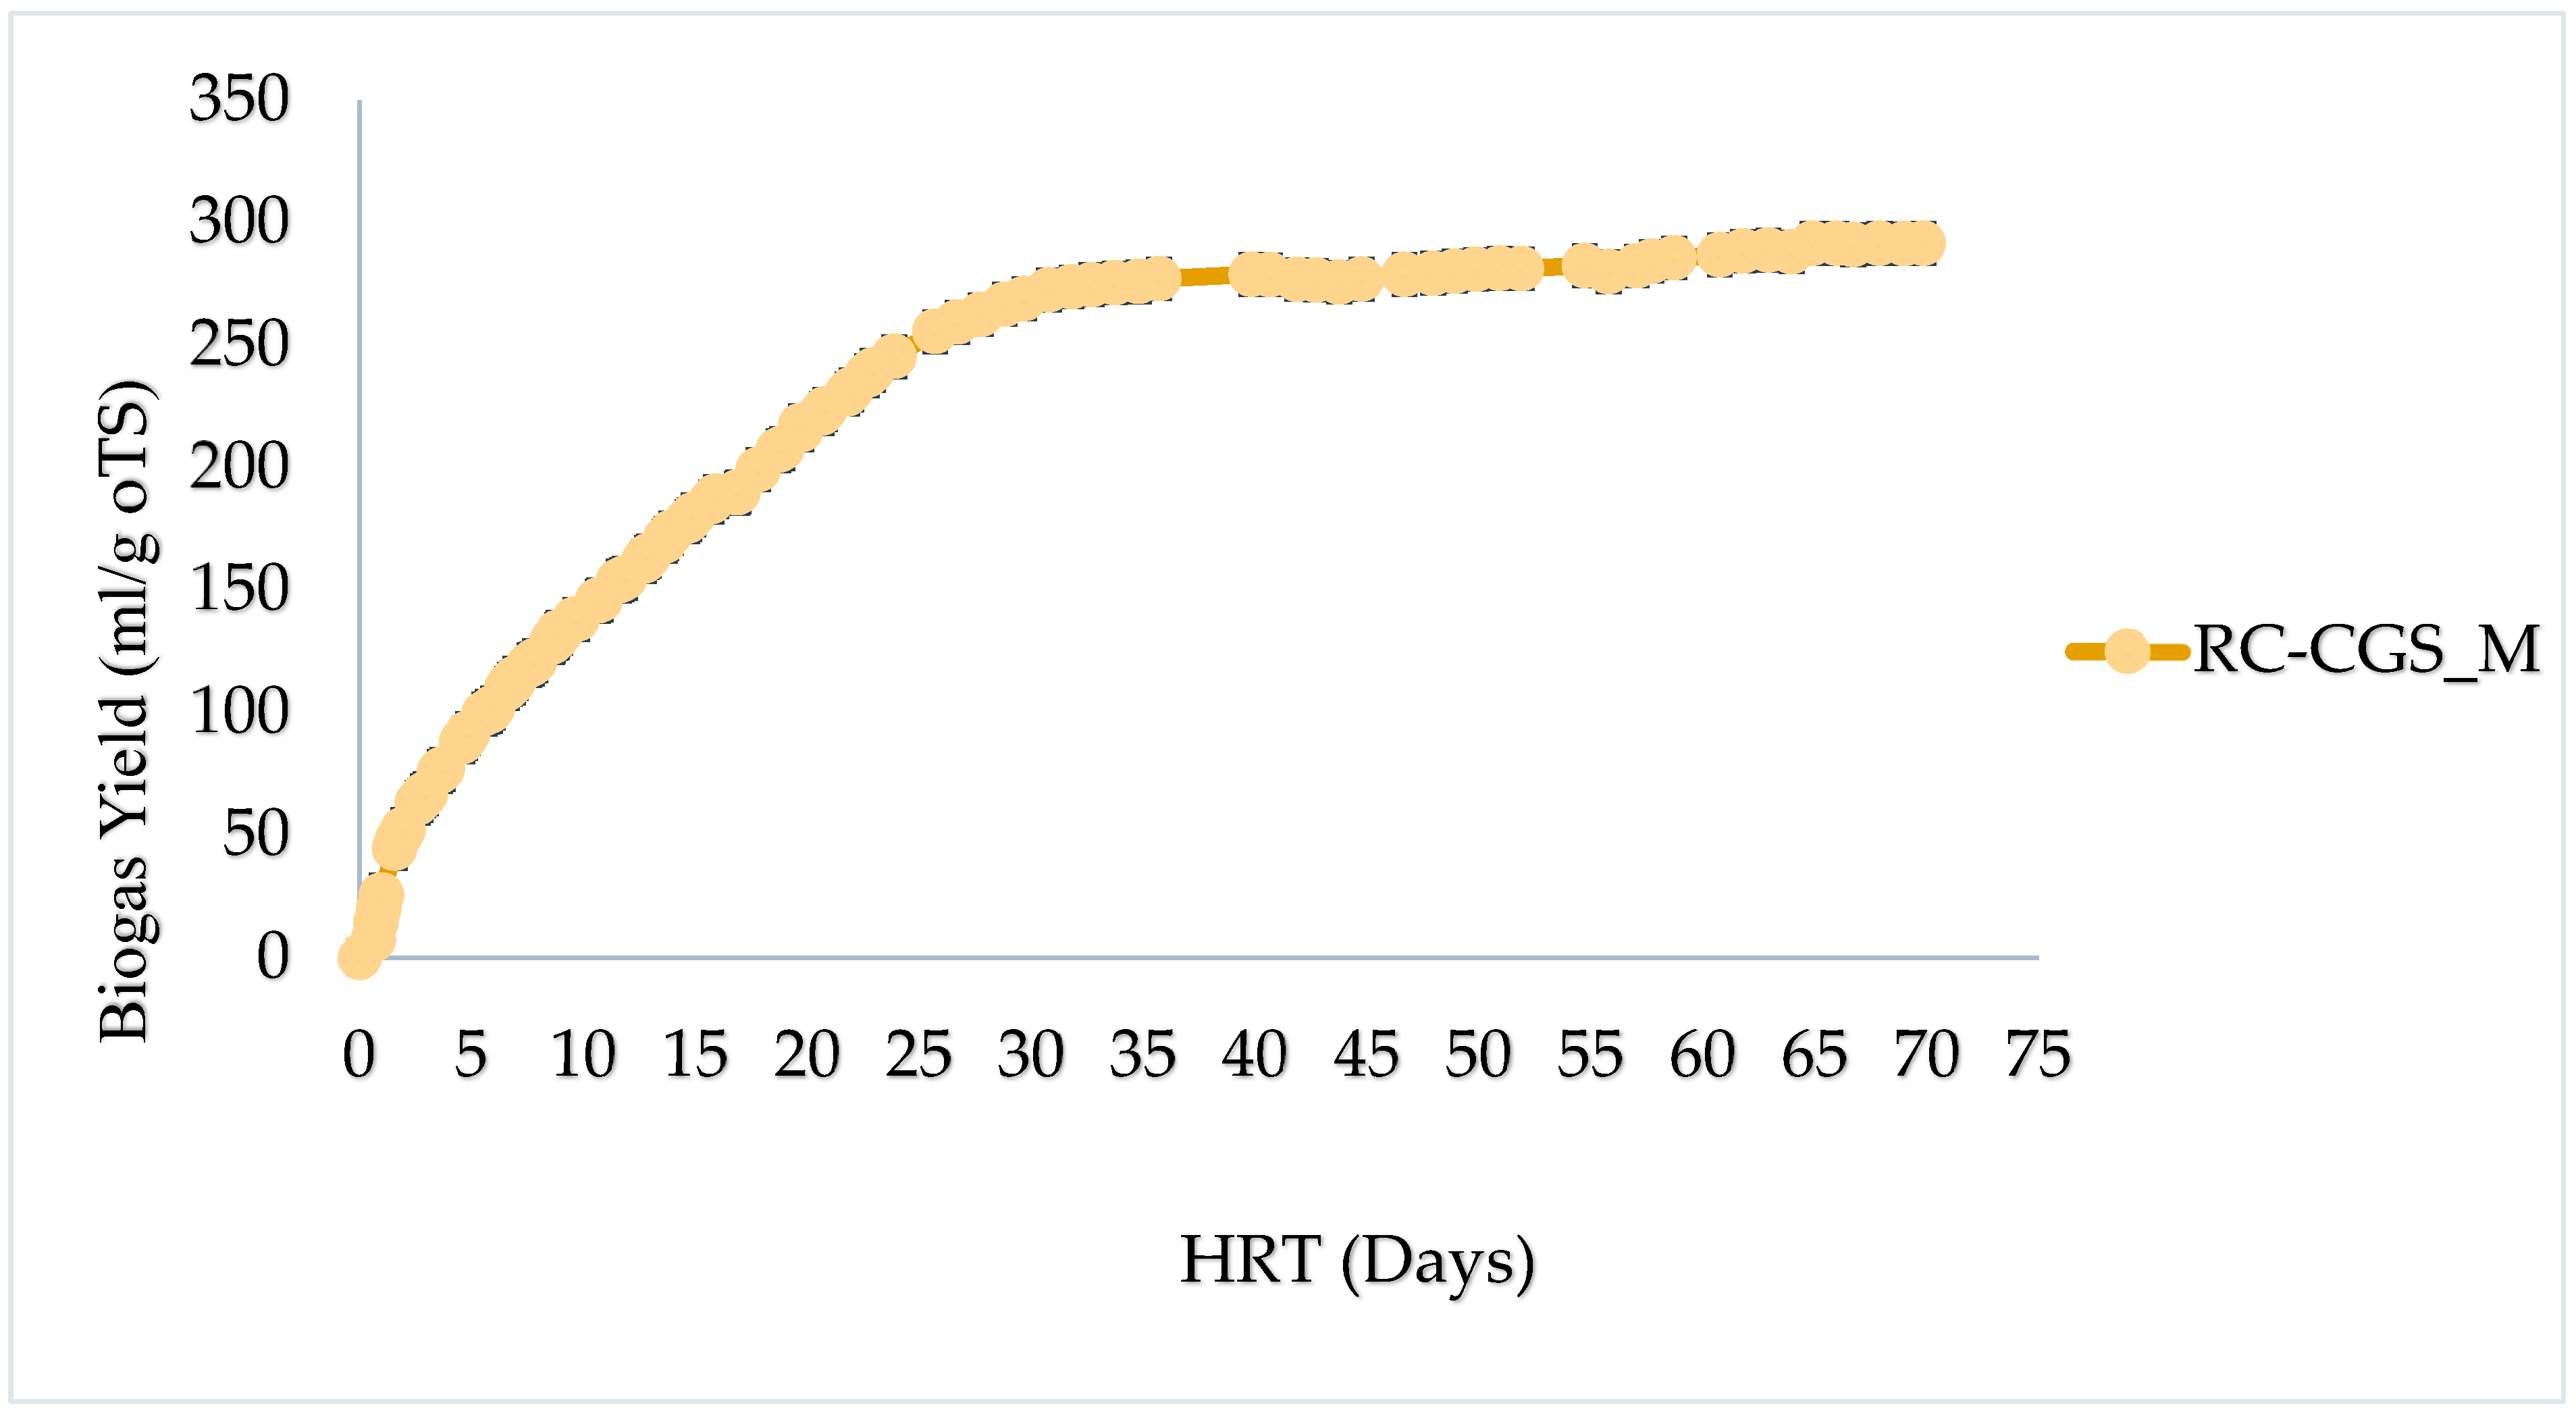
Figure 7 presents the biogas yield of RC-CGS-M in ml/g oTS. RC-CGS-M proved to be a potential biogas and renewable energy resource with a biogas potential of 292± 28.78 ml/goTS. This is lower than 291 ml of CH4/goTS obtained for cattle slurry by Thomas et al. 2018) [90] and higher than 281 ml of biogas/goTS obtained by Wijaya et al. (2020) for mono-digestion of cattle manure, also for mesophilic conditions [69]. In the case of Thomas et al. 2018) [90], the higher results can be explained by the enhanced digestion resulting from continuous stirring, the use of feeding pump and monitoring and control systems. The generation, as shown in Figure 7 shows a very fast generation from Day 1 up to Day 30 of anaerobic digestion; comparable to Wijaya et al. (2020) [69] whose results showed consistent generation until day 35 of anaerobic digestion. For the RC-CGS-M, the corresponding biogas potential is about 93% of the entire generation for the 30 days for the digestion time. This is in line with prescribed values (Cow manure: 90 -310 ml/goTS, Sheep manure: 90 - 310 ml/goTS) according to Kossman et∙al. (1999) [91]. There is no evidence from the trial that the practical co-digestion of rumen contents of cow, goat and sheep mixture has an advantage over the single use digestion, as available in literature [92,93,94]. As it presents a need to implement a comparison between anaerobic co-digestion in this study and anaerobic digestion of the individual samples, the key take home is that the resource available for use at the Sunyani abattoir occurs ordinarily in the mixture form as was used in this trial. At a mesophilic temperature of 37℃, a planned anaerobic system to implement this result for the climate in Ghana, which is fundamentally at 27℃ daily (22℃ - 32℃) [95], is likely to produce smaller biogas output or achieve same biogas yield with a longer digestion time. This presents another need for research that will seek to evaluate the practicality of such a system with the climate in Ghana, without the use of temperature enhancers. At present, a cue can be taken from Chae et al. (2008) that obtained a 17.4% reverse Biomethane potential difference for an operating temperature of 30oC and 25℃ [96].#
The biogas potential obtained for PW-CGS-M is about 28% of the total potential obtained for RC-CGS- M on FM basis. The rate of generation in this case was steady until about Day 35, where it was relatively not significant. This is more closely similar to the observation for RC-CGS-M. This could be explained as having resulted from higher TS; about 1.5 more than that of RC-CGS-M. This corroborates Sailer et al. (2022) highlight that press waters have low biogas potential and as such, low potential renewable energy resource [24]. Suggesting low TS as one likely factor and pressing efficiency issues. It will therefore be prudent to look at possibilities of improving both pressing efficiencies and TS as suggested by Sailer et al. (2022) [24]. Additionally, Sailer et al. (2022) suggests that press waters provide a good alternative for co-digestion or as a supplement to AD [24]. In the event where press waters result as a by-product, then the potential biogas production may be worth it without any modifications. Nuchtang and Phalakornkule (2012), Morsink-Georgali (2022) and Smith et al. (2014) suggest the use of resulting cakes for composting purposes, in implementing circular economy systems [97,98,99]. Nonetheless, the oTS value obtained for the press water signals a valuable quantity of organic materials that are available for biogas generation, while offering inorganic materials which aid in anaerobic digestion [24].
Abubakr and Ismail (2012) and Nielsen and Angelidaki (2008) suggest that animal materials such as cow dung (in this case, the rumen contents) are highly lignocellulosic, thereby; do not present optimal anaerobic processes [100,101]. With this limitation in mind, the biogas potentials evident from this research is significantly positive. Notwithstanding, pre-treatment methods such as hydrolysis may offer better potentials for lignocellulosic materials [102,103,104,105,106]. Table 5 summarises the oTS ratios used in the various fermentation set ups. All of the ratios in the instance of the digestion trial are within reasonable limits (below 0.5) suggested by Sailer et al. (2022) and VDI 4630 [24,59]. This indicates that there was a stable and efficient anaerobic digestion [24,59].
This study did not practically assess or evaluate the methane fractions of the biogas generated. However, BMP of the two samples were determined by adopting Kasinath et al. (2021) which summarised average methane fraction of biogas obtained by different studies as 55-75 % for cattle manure [106]. The lower limit, 55% was adapted for evaluating our study sample for safe approximation and conservativeness [100]. Table 6 summarises the obtained BMPs in ml/goTS; ml/gTS; ml/gFM of the studied samples. The BMP determined for RC-CGS-M is extremely low, as compared to the TMBMP of 495.93 ml/g oTS. This presents a very promising potential of about 68% more yield, which could be explored using optimisation of generation conditions and pre-treatment methods. While the TMBMP of PW-CGS-M, comparable with reported values in literature [107] is not practically achievable, it presents an opportunity for a more reliable biogas yield estimations, when used together with the experimental biogas yield in ml/g FM. In addition, it provides a fair performance of the PW-CGS-M against the RC-CGS-M in terms of ml/g oTS of BMP that is achievable. From this study, it can be deduced that the highest BMP extractible from PW-CGS-M is lower than 13% of the minimum BMP extractible from RC-CGS-M. It is therefore recommended that for loss of organic acids and dissolved oTS which negatively impacts biogas potentials, the evaluation of biogas yields of waters is preferable on COD removal basis as paramount in literature [108,109,110].
Table 5. oTS ratios used in the AD.
Trial sample oTS ratio
RC-CGS-M 0.02
PW-CGS-M 0.07
Table 6. BMP of studied samples.
Substrate BMP(ml/g oTS) BMP (ml/g TS) BMP(ml/g FM) SD TMBMP(ml/ g oTS)
RC-CGS-M 160.4 129.9 14.7 28.78 495.93
PW-CGS-M - - 4.11 23 20.39
BMP: Biomethane potential determined experimentally, SD: Standard deviation; TBMMP: Theoretical maximum Biomethane potential.
Figure 7. Biogas yield in ml/g oTS.
Preprints 119562 g007
Figure 8. Biogas Potential in ml/g FM.
Preprints 119562 g008
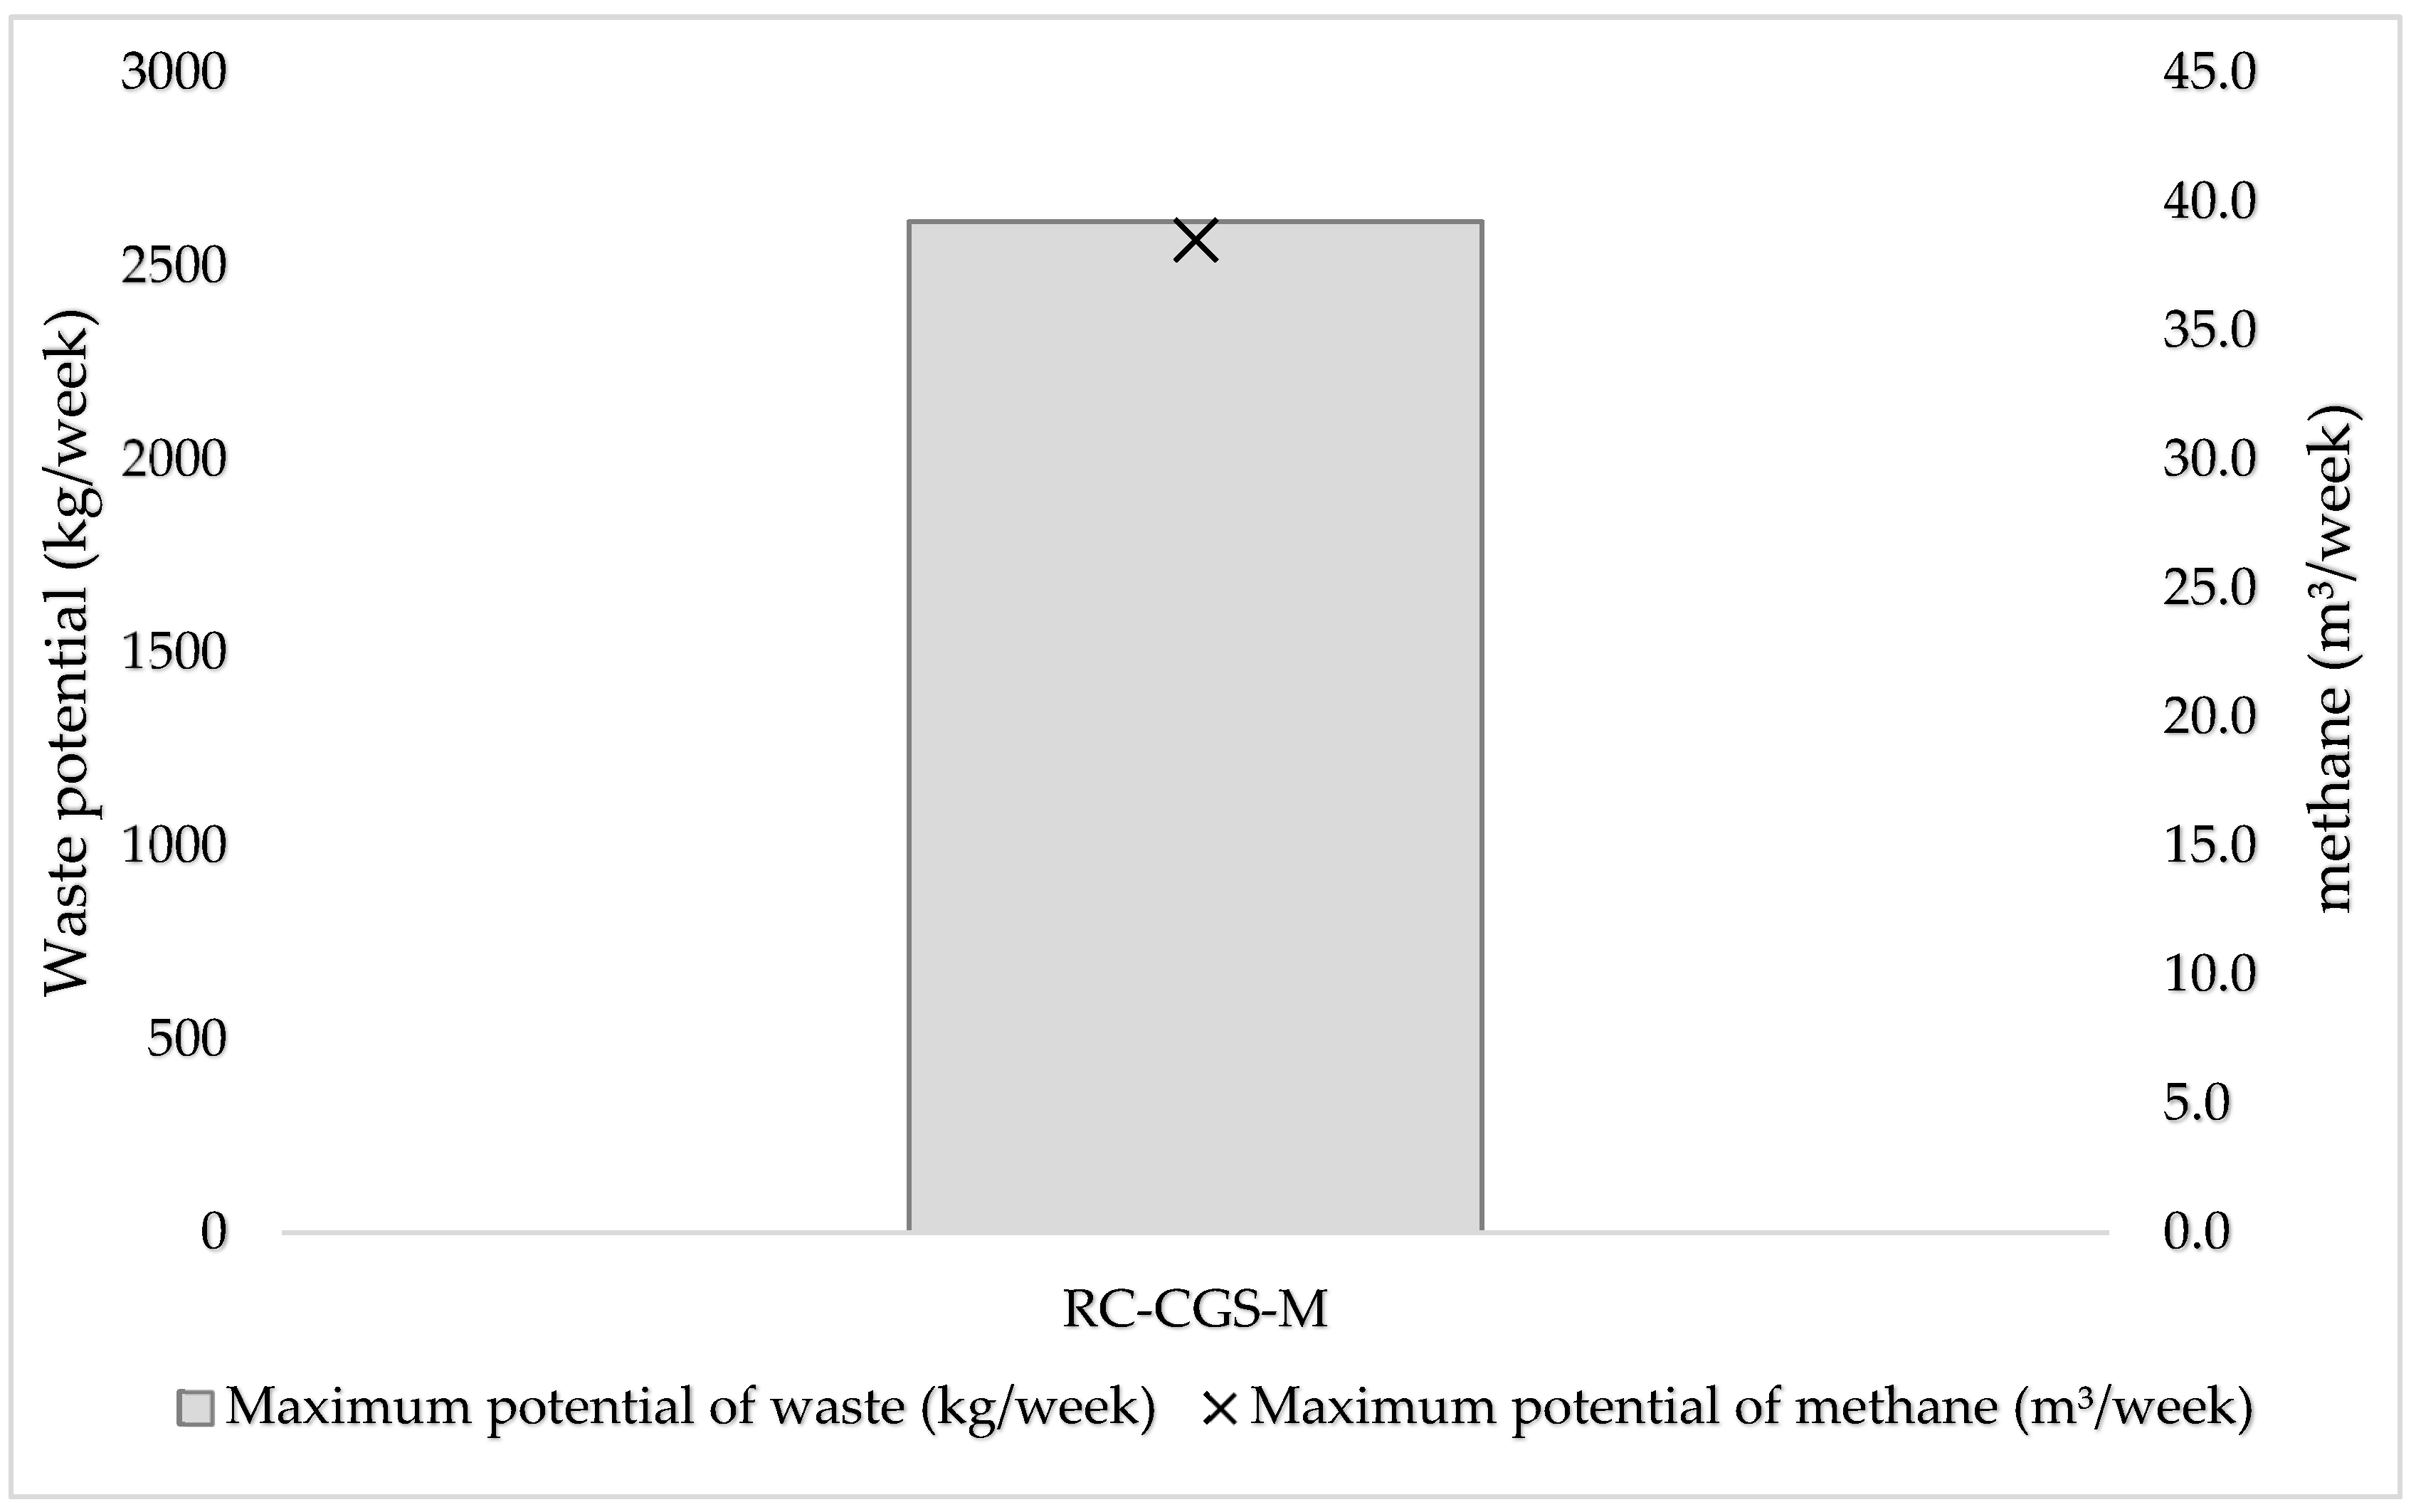
The Biomethane potential based on the total rumen content generation per week at the Sunyani abattoir and on assumption that the ordinary mixture is used in its occurring form is 38, 675 litres (38.7 m3/ week). This corresponds to 364 kWh of energy. Figure 9 compares the different methane potential extractible from the waste generated based on each variant and the extractible waste based on mechanical pressing. Figure 9 summarises the maximum extractible potential of energy in kWh from the RC-CGS-M. Clearly, almost all the waste generated per week can be used in biogas generation, making more total solids available for methane generation in relation to variant RC-CGS-M.

4. Conclusions

The study evaluates the comparative performance of biogas generation from the raw mixture of slaughter waste and the use of its mechanically separated press water that could potentially enable additional use cases in the sense of a bioeconomy. It finds that the facility has a waste generation potential of 2,615 kg per week, which is sourced from rumen contents of cattle, goats and sheep, slaughtered at the facility for 6 out of 7 days in a week. The biogas yield from this slaughter waste in ordinarily existing mixture is 291.60± 28.78 ml/g oTS or 26.70± 28.78 ml/g FM. The Biomethane potential (BMP) of this material is: 160.4±28.78 ml/goTS for its ordinary mixture. For the press water, the biogas yield is 7.47±1.12∙ml/g FM. It has a TMBMP of 20.39 ml/g oTS. In terms of nominal biogas volumes, the potential of the waste generated per week is 38.7 m3 , which is equivalent to 364 kWh: in the event of using the resource in its semi-solid form without pressing. The study concludes that although the use of pressing is technically viable, it is comparatively not as resourceful as the use of its ordinary mixture.
In any case, it is necessary to assess for each process chain why only press water is available for biogas generation. The high oxygen demand necessitates post-treatment of the PW, wherein anaerobic conversion can play a significant role. Furthermore, co-digestion with other materials, which are richer in surface area and carbon, can deliver substantially better results and thus energy output. However, the general energy output loss due to the separation of the two phases should always be compared with the desired additional benefits of this additional process chain. For instance, alternative use of the fibres in the context of bioeconomy or facilitated pumpability of the biogas substrate through addition of liquid/press water, as it is considerable in the presented setting without co-digestion.
Notwithstanding, with additional benefits such a reduced deterioration of pump and hydraulic systems, the approach is technically viable. It is recommended that the feedstock (slaughterhouse waste) is co-digested with more fibrous materials (in West-African context e.g. cassava, yam, or plantain waste) as that could enhance the C/N ratio and effectively increase the biogas generation output. HHVs of 17.1-17.5 MJ/kg were obtained for the studied samples. These are higher than 14.7 MJ/kg reported in literature for cow dung, probably since rumen contents might have lost methane (energy carrier) in the event of digestion before being released as faecal waste (cow dung). It can be inferred that the use of rumen content for biogas generation will be more valuable per TS amount that for animal faeces.

Author Contributions

“Conceptualization, J.Y., R.M and F.E.; methodology, J.Y., F.E. R.K, S.E., and R.M..; software, J.Y.; validation, S.P. and J.P.; formal analysis, J.Y. and F.E.; investigation, J.Y.; resources, S.P.,R.M., F.E. J.P., R.K. and J.Y.; data curation, J.Y.; writing—original draft preparation, J.Y.; writing—review and editing, J.Y., F.E.; R.M., S.P., N.A. and F.A.; visualization, J.Y.; supervision, S.P., N.A. and F.A.; project administration, S.P..; funding acquisition, S.P., J.Y. All authors have read and agreed to the published version of the manuscript.”

Funding

“This research was carried out under the ‘Level-Up CLIENT II joint project Climate Protection: "Upgrading local markets through the use of biogenic residues" and support from the Regional Centre for energy and Environmental Sustainability (RCEES) as well as the DAAD contributions to the author’s stay in Rottenburg.

Data Availability Statement

Not applicable.

Acknowledgments

The authors would like to thank the laboratory team at the University of Applied Forest Sciences, Rottenburg-Germany for their support.

Conflicts of Interest

“The authors declare no conflicts of interest.”

References

  1. IEA. Africa Energy Outlook 2022; 2023.
  2. Archana K, Visckram AS, Senthil Kumar P, Manikandan S, Saravanan A, Natrayan L. A review on recent technological breakthroughs in anaerobic digestion of organic biowaste for biogas generation: Challenges towards sustainable development goals. Fuel 2024, 358, 130298. [CrossRef]
  3. Shiv Prasad, Dheeraj Rathore, Anoop Singh. Recent Advances in Biogas Production 2017;3.
  4. Ibrahim ID, Hamam Y, Alayli Y, Jamiru T, Sadiku ER, Kupolati WK, et al. A review on Africa energy supply through renewable energy production: Nigeria, Cameroon, Ghana and South Africa as a case study. Energy Strategy Reviews 2021, 38, 100740. [CrossRef]
  5. Aduroja Francis Akintade. Biogas a viable source of energy: case study, Nigeria: Central University of Applied Sciences; 2021.
  6. Sárvári Horváth I, Tabatabaei M, Karimi K, Kumar R. Recent updates on biogas production - a review. BRJ 2016, 3, 394–402. [CrossRef]
  7. Thokchom Subhaschandra Singh, P. Sankarlal, editor. A Review on Advancements in Biogas Technologies; 2015.
  8. Ghosh P, Shah G, Sahota S, Singh L, Vijay VK. Biogas production from waste: technical overview, progress, and challenges 17.04. 2020, 89–104: Elsevier. [CrossRef]
  9. Ebaye Scholastica Bejor. Effect of particle size distribution on kinetics and overall degradation in anaerobic digestion of waste biomass [Doctoral thesis]: University of Sheffield; March 29, 2020.
  10. Kwietniewska E, Tys J. Process characteristics, inhibition factors and methane yields of anaerobic digestion process, with particular focus on microalgal biomass fermentation. Renewable and Sustainable Energy Reviews 2014, 34, 491–500. [CrossRef]
  11. Schnürer, A. Biogas Production: Microbiology and Technology. Adv Biochem Eng Biotechnol 2016, 156, 195–234. [Google Scholar] [CrossRef]
  12. Owhondah RO, Walker M, Ma L, Nimmo B, Ingham DB, Poggio D, Pourkashanian M. Assessment and parameter identification of simplified models to describe the kinetics of semi-continuous biomethane production from anaerobic digestion of green and food waste. Bioprocess Biosyst Eng. 2016, 39, 977–92.
  13. Náthia-Neves, G, Berni, M, Dragone, Mussatto, et al. Anaerobic digestion process: technological aspects and recent developments - International Journal of Environmental Science and Technology. 15.05.2018. https://link.springer.com/article/10.1007/s13762-018-1682-2. Accessed 3 Apr 2024.
  14. W Wukovits, WS. Biomass: Fermentation 2009:268–75.
  15. Moses Jeremiah Barasa Kabeyi, Oludolapo Akanni Olanrewaju. Optimization of Biogas Production for Optimal Abattoir Waste Treatment with Bio-Methanation as Solution to Nairobi Slaughterhouses Waste Disposal 2020.
  16. Náthia-Neves G, Berni M, Dragone G, Mussatto SI, Forster-Carneiro T. Anaerobic digestion process: technological aspects and recent developments. Int. J. Environ. Sci. Technol 2018, 15, 2033–46. [CrossRef]
  17. Deepanraj, B. , Sivasubramanian V. and Jayaraj S. Biogas Generation throughAnaerobic Digetsion Process: An Overview 2014;18.
  18. Yu H, Wang Z, Wu Z, Zhu C. Enhanced waste activated sludge digestion using a submerged anaerobic dynamic membrane bioreactor: performance, sludge characteristics and microbial community. Sci Rep 2016, 6, 20111. [CrossRef]
  19. Ferrer I, Ponsá S, Vázquez F, Font X. Increasing biogas production by thermal (70°C) sludge pre-treatment prior to thermophilic anaerobic digestion. Biochemical Engineering Journal 2008, 42, 186–92. [CrossRef]
  20. Corton J, Toop T, Walker J, Donnison IS, Fraser MD. Press fluid pre-treatment optimisation of the integrated generation of solid fuel and biogas from biomass (IFBB) process approach. Bioresource Technology 2014, 169, 537–42. [CrossRef]
  21. Anyango BN, Wandera SM, Raude JM. Abattoir Wastewater Treatment in Anaerobic Co-Digestion with Sugar Press Mud in Batch Reactor for Improved Biogas Yield. Water 2022, 14, 2571. [CrossRef]
  22. Nayono SE, Winter J, Gallert C. Anaerobic digestion of pressed off leachate from the organic fraction of municipal solid waste. Waste Manag 2010, 30, 1828–33. [CrossRef]
  23. Nayono SE, Gallert C, Winter J. Co-digestion of press water and food waste in a biowaste digester for improvement of biogas production. Bioresource Technology 2010, 101, 6998–7004. [CrossRef]
  24. Sailer G, Empl F, Kuptz D, Silberhorn M, Ludewig D, Lesche S, et al. Characteristics and Anaerobic Co-Digestion of Press Water from Wood Fuel Preparation and Digested Sewage Sludge. Fermentation 2022, 8, 37. [CrossRef]
  25. J. Reulein, R. Stülpnagel, K. Scheffer and . Wachendorf. Improving the fuel properties of agricultural biomass through mechanical dewatering of silage. 2007.
  26. COP28, IRENA, GRA. Tripling renewable power and doubling energy efficiency by 2030 crucial steps towards 1.5°C. [Abu Dhabi]: International Renewable Energy Agency; 2023.
  27. Hensgen F, Bühle L, Donnison I, Heinsoo K, Wachendorf M. Energetic conversion of European semi-natural grassland silages through the integrated generation of solid fuel and biogas from biomass: energy yields and the fate of organic compounds. Bioresource Technology 2014, 154, 192–200. [CrossRef]
  28. Richter F, Fricke T, Wachendorf M. Influence of sward maturity and pre-conditioning temperature on the energy production from grass silage through the integrated generation of solid fuel and biogas from biomass (IFBB): 1. The fate of mineral compounds. Bioresource Technology 2011, 102, 4855–65. [CrossRef]
  29. Asare D, Abubakari M, Mahama M, Mensah DAO, Amponsah IA, Kwakye AD, Duho KCT. How Can Ghana Transition from a Linear to a Circular Economy of Waste Management? A Conceptual Analysis of Policy Approaches 2523-3092. 2023, 125–54. [CrossRef]
  30. Tasantab, C. Solid waste management in Ghanaian towns; A case of Saboba, Northern region: Kwamen Nkrumah University of Science and Technology; May 2012.
  31. Bhave PP, Palekar AL. Quantification and environmental impact of slaughter waste during its life cycle. Environ Monit Assess 2024, 196, 225. [CrossRef]
  32. Granada CE, Hasan C, Marder M, Konrad O, Vargas LK, Passaglia LM, et al. Biogas from slaughterhouse wastewater anaerobic digestion is driven by the archaeal family Methanobacteriaceae and bacterial families Porphyromonadaceae and Tissierellaceae. Renewable Energy 2018, 118, 840–6. [CrossRef]
  33. Kabeyi MJB, Olanrewaju OA. Sustainable Energy Transition for Renewable and Low Carbon Grid Electricity Generation and Supply. Front. Energy Res 2022. [CrossRef]
  34. Wang S, Jena U, Das KC. Biomethane production potential of slaughterhouse waste in the United States. Energy Conversion and Management 2018, 173, 143–57. [CrossRef]
  35. Salehin S, Ahmed SSU, Hoque ME, Mrigdad MS, Hussain SMA, Intisar SMT. Assessment of biogas generation potential from slaughterhouse wastes in Dhaka city, Bangladesh. Waste Dispos. Sustain. Energy 2021, 3, 41–8. [CrossRef]
  36. Samadi MT, Leili M, Rahmani A, Moradi S, Godini K. Anaerobic co-digestion using poultry slaughterhouse and vegetable wastes to enhance biogas yield: effect of different C/N ratios. Biomass Conv. Bioref 2022:1–9. [CrossRef]
  37. Selormey GK, Barnes B, Kemausuor F, Darkwah L. A review of anaerobic digestion of slaughterhouse waste: effect of selected operational and environmental parameters on anaerobic biodegradability. Rev Environ Sci Biotechnol 2021, 20, 1073–86. [CrossRef]
  38. Shende AD, Khan MS, Dhenkula S, Rao NN, Pophali GR. Waste to wealth in a slaughterhouse through effective biomass management. Biomass Conv. Bioref 2024, 14, 269–81. [CrossRef]
  39. Shende AD, Pophali GR. Anaerobic treatment of slaughterhouse wastewater: a review. Environ Sci Pollut Res Int 2021, 28, 35–55. [CrossRef]
  40. Sinsuw AAE, Wuisang CE, Chu C-Y. Assessment of environmental and social impacts on rural community by two-stage biogas production pilot plant from slaughterhouse wastewater. Journal of Water Process Engineering 2021, 40, 101796. [CrossRef]
  41. Ware A, Power N. Biogas from cattle slaughterhouse waste: Energy recovery towards an energy self-sufficient industry in Ireland. Renewable Energy 2016.
  42. Widiasa BIN, Sunarso SJ. Study on Slaughterhouse Wastes Potency and Characteristic for Biogas Production. International Journal of Waste Resources 2015;01.
  43. Moses Kabeyi and Oludolapo Olanrewaju. Slaughterhouse waste to energy in the energy transition with performance analysis and design of slaughterhouse biodigestor 2021;´6:188–208.
  44. Jhosané Pagés Díaz. Biogas from slaughterhouse waste: Mixture interactions in co-digestion. Sweden: University of Boras; December 2015.
  45. Moses Jeremiah Barasa Kabeyi, Oludolapo Akanni Olanrewaju, editor. Optimum Biogas Production from Slaughterhouse for Increased Biogas and Electricity Generation: IEOM Society International; 2020.
  46. afazeli h, Jafari A, Rafiee S, Nosrati M. An investigation of biogas production potential from livestock and slaughterhouse wastes. Renewable & Sustainable Energy Reviews 2014, 34, 380–6.
  47. Ahmad J, Ansari TA. Biogas from slaughterhouse waste: towards an energy self-sufficient industry with economical analysis in India. Journal of Microbial & Biochemical Technology 2013.
  48. Akash Kunal, B. Prashanth,*, Anwesha Ghosh, G. Hemanth1. A Review on production of Biogas from Slaughter house waste and poultry litter 2017;4.
  49. Kabeyi MJB, Olanrewaju O. Performance analysis and modification of a slaughterhouse waste niogas plant for biogas and electricity generation. Proceedings of the International Conference on Industrial Engineering and Operations Management 2021.
  50. Kavuma C, Ekwar I, Nabaterega R, Lwanyaga JD, Sserumaga P. Biogas Potential From Slaughterhouse Wastes at Ambient Temperatures in Lira Municipality of Northern Uganda; 2020.
  51. Oktavitri NI, Pratiwi WB, Purnamasari I, Hayati M, Fitrianingtyas MR, Hadinnata S. Anaerobic Digestion of Slaughterhouse Wastewater: CO2 Capture of Biogas Using Chlorella vulgaris. Indones. J. Chem 2019, 19, 1. [CrossRef]
  52. Ware A, Power N. Biogas from cattle slaughterhouse waste: Energy recovery towards an energy self-sufficient industry in Ireland. Renewable Energy 2016, 97, 541–9. [CrossRef]
  53. Omondi EA, Ndiba PK, Chepkoech GK, Kegode AA. Modeling anaerobic co-digestion of water hyacinth with ruminal slaughterhouse waste for first order, modified gompertz and logistic kinetic models. Int. J. Renew. Energy Dev 2023, 12, 627–34. [CrossRef]
  54. Ware A, Power N. What is the effect of mandatory pasteurisation on the biogas transformation of solid slaughterhouse wastes? Waste Manag 2016, 48, 503–12. [CrossRef]
  55. E. D. Aklaku, K. Jones and K. Obiri-Danso. Integrated Biological Treatment and Biogas Production in a Small-Scale Slaughterhouse in Rural Ghana 2006, 78, 2335–9.
  56. Mapcarta. Asuakwa Map - Town - Sunyani Municipal District, Ghana 04/04/2024.
  57. Hülsemann B, Zhou L, Merkle W, Hassa J, Müller J, Oechsner H. Biomethane Potential Test: Influence of Inoculum and the Digestion System. Applied Sciences 2020, 10, 2589. [CrossRef]
  58. BPC Instruments. Anaerobic batch fermentation assay for the evaluation of biogas and biomethane yield 2023:1–5. Sweden.
  59. VDI 4630. Fermentation of Organic Materials—Characterisation of the Substrate, Sampling, Collection of Material Data, Fermentation Tests. Available online: https://www.scirp.org/(S(351jmbntv- nsjt1aadkposzje))/reference/referencespapers.aspx?referenceid=2950958 (accessed on 28 March 2023). 2016.
  60. Paczkowski S, Sarquah K, Yankyera J, Sarfo Agyemang Derkyi N, Empl F, Jaeger D, Pelz S. Hydrothermal treatment (HTT) improves the combustion properties of regional biomass waste to face the increasing sustainable energy demand in Africa. Fuel 2023, 351, 128928. [CrossRef]
  61. 2008.
  62. Shehab M, Stratulat C, Ozcan K, Boztepe A, Isleyen A, Zondervan E, Moshammer K. A Comprehensive Analysis of the Risks Associated with the Determination of Biofuels’ Calorific Value by Bomb Calorimetry. Energies 2022, 15, 2771. [CrossRef]
  63. Sailer G, Eichermüller J, Poetsch J, Paczkowski S, Pelz S, Oechsner H, Müller J. Optimizing anaerobic digestion of organic fraction of municipal solid waste (OFMSW) by using biomass ashes as additives. Waste Manag 2020, 109, 136–48. [CrossRef]
  64. Herfeld C, Ivanova M. Introduction: first principles in science—their status and justification. Synthese 2021, 198, 3297–308. [CrossRef]
  65. Jingura RM, Kamusoko R. Methods for determination of biomethane potential of feedstocks: a review. Biofuel Res. J 2017, 4, 573–86. [CrossRef]
  66. Rodrigues RP, Rodrigues DP, Klepacz-Smolka A, Martins RC, Quina MJ. Comparative analysis of methods and models for predicting biochemical methane potential of various organic substrates. Sci Total Environ 2019, 649, 1599–608. [CrossRef]
  67. International Renewable Energy Agency. Measuring Small-scale Biogas Capacity and Production.
  68. Carbon Trust. Energy and Carbon Conversions: Greenhouse gas conversions 2023.
  69. Alam Surya Wijaya, Rattana Jariyaboon, Alissara Reungsang, Prawit Kongjan. Biochemical Methane Potential (BMP) of Cattle Manure, Chicken Manure, Rice Straw, and Hornwort in Mesophilic Mono-digestion 2020;VOL. 12:1–8.
  70. Achi CG, Hassanein A, Lansing S. Enhanced Biogas Production of Cassava Wastewater Using Zeolite and Biochar Additives and Manure Co-Digestion. Energies 2020, 13, 491. [CrossRef]
  71. Marañón E, Salter AM, Castrillón L, Heaven S, Fernández-Nava Y. Reducing the environmental impact of methane emissions from dairy farms by anaerobic digestion of cattle waste. Waste Manag 2011, 31, 1745–51. [CrossRef]
  72. Szaja A, Montusiewicz A, Lebiocka M, Bis M. A combined anaerobic digestion system for energetic brewery spent grain application in co-digestion with a sewage sludge. Waste Manag 2021, 135, 448–56. [CrossRef]
  73. Sailer G, Eichermüller J, Poetsch J, Paczkowski S, Pelz S, Oechsner H, Müller J. Datasets on chemical composition and anaerobic digestion of organic fraction of municipal solid waste (OFMSW), digested sewage sludge (inoculum) and ashes from incineration or gasification. Data Brief 2020, 31, 105797. [CrossRef]
  74. Lin R, Cheng J, Murphy JD. Unexpectedly low biohydrogen yields in co-fermentation of acid pretreated cassava residue and swine manure. Energy Conversion and Management 2017, 151, 553–61. [CrossRef]
  75. Fajobi MO, Lasode OA, Adeleke AA, Ikubanni PP, Balogun AO. Investigation of physicochemical characteristics of selected lignocellulose biomass. Sci Rep. 2022, 12, 2918. [CrossRef]
  76. Becker CM, Marder M, Junges E, Konrad O. Technologies for biogas desulfurization - An overview of recent studies. Renewable and Sustainable Energy Reviews 2022, 159, 112205. [CrossRef]
  77. Singh YD, Mahanta P, Bora U. Comprehensive characterization of lignocellulosic biomass through proximate, ultimate and compositional analysis for bioenergy production. Renewable Energy 2017, 103, 490–500. [CrossRef]
  78. Demirel B, Scherer P. Trace element requirements of agricultural biogas digesters during biological conversion of renewable biomass to methane. Biomass and Bioenergy 2011, 35, 992–8. [CrossRef]
  79. Akash Lima and, Dr. VM Victor. Physical properties of cattle dung 2022, 11, 399–402. [Google Scholar]
  80. HOBAN DJ, van den Berg L. Effect of iron on conversion of acetic acid to methane during methanogenic fermentations. J Appl Bacteriol 1979, 47, 153–9. [CrossRef]
  81. Lin D, Kakizono T, Nishio N, Nagai S. Enhanced cytochrome formation and stimulate methanogenesis rate by the increased ferrous concentrations in Methanosarcina barkeri culture. FEMS Microbiol Lett 1990, 68, 89–92. [CrossRef]
  82. Diekert G, Weber B, Thauer RK. Nickel dependence of factor F430 content in Methanobacterium thermoautotrophicum. Arch. Microbiol 1980, 127, 273–7. [CrossRef]
  83. Diekert G, Konheiser U, Piechulla K, Thauer RK. Nickel requirement and factor F430 content of methanogenic bacteria. J Bacteriol 1981, 148, 459–64. [CrossRef]
  84. Speece RE, Parkin GF, Gallagher D. Nickel stimulation of anaerobic digestion. Water Research 1983, 17, 677–83. [CrossRef]
  85. Hu Q-H, Li X-F, Liu H, Du G-C, Chen J. Enhancement of methane fermentation in the presence of Ni2+ chelators. Biochemical Engineering Journal 2008, 38, 98–104. [CrossRef]
  86. Williams CM, Shih JC, Spears JW. Effect of nickel on biological methane generation from a laboratory poultry waste digester. Biotechnology and Bioengineering 1986, 28, 1608–10. [CrossRef]
  87. Hassan Dar G, Tandon SM. Response of a cattle dung methane fermentation to nickel. Biological Wastes 1987, 22, 261–8. [CrossRef]
  88. Ashley NV, Davies M, Hurst TJ. The effect of increased nickel ion concentrations on microbial populations in the anaerobic digestion of sewage sludge. Water Research 1982, 16, 963–71. [CrossRef]
  89. Wilkie A, Goto M, Bordeaux FM, Smith PH. Enhancement of anaerobic methanogenesis from napiergrass by addition of micronutrients. Biomass 1986, 11, 135–46. [CrossRef]
  90. Thomas HL, Seira J, Escudié R, Carrère H. Lime Pretreatment of Miscanthus: Impact on BMP and Batch Dry Co-Digestion with Cattle Manure. Molecules 2018. [CrossRef]
  91. W. Kossmann, Uta Pönitz, S. Habermehl. Biogas Digest Volume II: Biogas - Application and Product Development. Engineering, Environmental Science 1999.
  92. Khatun ML, Nime J, Nandi R, Alam MM, Saha CK. Co-digestion of poultry droppings and banana waste for maximizing biogas production in Bangladesh. Fuel 2023, 346, 128346. [CrossRef]
  93. Bułkowska K, Mikucka W, Pokój T. Enhancement of biogas production from cattle manure using glycerine phase as a co-substrate in anaerobic digestion. Fuel 2022, 317, 123456. [CrossRef]
  94. Elif Gulsen Akbay, H. Anaerobic mono and co-digestion of agro-industrial waste and municipal sewage sludge: Biogas production potential, kinetic modelling, and digestate characteristics. Fuel 2024, 355, 129468. [Google Scholar] [CrossRef]
  95. Bessah E, Amponsah W, Ansah SO, Afrifa A, Yahaya B, Wemegah CS, et al. Climatic zoning of Ghana using selected meteorological variables for the period 1976–2018. Meteorological Applications 2022. [CrossRef]
  96. Chae KJ, am Jang, Yim SK, Kim IS. The effects of digestion temperature and temperature shock on the biogas yields from the mesophilic anaerobic digestion of swine manure. Bioresource Technology 2008, 99, 1–6. [CrossRef]
  97. Nuchdang S, Phalakornkule C. Anaerobic digestion of glycerol and co-digestion of glycerol and pig manure. J Environ Manage 2012, 101, 164–72. [CrossRef]
  98. Morsink-Georgali P-Z, Kylili A, Fokaides PA, Papadopoulos AM. Compost versus biogas treatment of sewage sludge dilemma assessment using life cycle analysis. Journal of Cleaner Production 2022, 350, 131490. [CrossRef]
  99. Smith J, Abegaz A, Matthews RB, Subedi M, Orskov ER, Tumwesige V, Smith P. What is the potential for biogas digesters to improve soil fertility and crop production in Sub-Saharan Africa? Biomass and Bioenergy 2014, 70, 58–72. [CrossRef]
  100. Baba Shehu Umar Ibn Abubakar and Nasir Ismail. Anaerobic digestion of cow dung for biogas production 2012;7.
  101. Nielsen HB, Angelidaki I. Strategies for optimizing recovery of the biogas process following ammonia inhibition. Bioresource Technology 2008, 99, 7995–8001. [CrossRef]
  102. Effenberger, M., R. Kissel, C. Marín-Pérez, J. Beck und F. Friedrich. Empfehlungen zu Verfahren der Hydrolyse in der Praxis. 2022.
  103. Schieder, D., A. Gronauer, M. Lebuhn, K. Bayer, J. Beck, G. Hiepp und S. Binder. Prozessmodell Biogas 2010;3.
  104. Kissel, R., G. Henkelmann, J. Seidel. Sub- strataufbereitung - Zur Verbesserung des Abbaus faserreicher Biomasse 2019.
  105. Mikrobiologische Grundlagen.
  106. Kasinath A, Fudala-Ksiazek S, Szopinska M, Bylinski H, Artichowicz W, Remiszewska-Skwarek A, Luczkiewicz A. Biomass in biogas production: Pretreatment and codigestion. Renewable and Sustainable Energy Reviews 2021, 150, 111509. [CrossRef]
  107. Schaum C, Lensch D, Bolle P-Y, Cornel P. Sewage sludge treatment: evaluation of the energy potential and methane emissions with COD balancing. Journal of Water Reuse and Desalination 2015, 5, 437–45. [CrossRef]
  108. Costa JC, Sousa DZ, Pereira MA, Stams AJM, Alves MM. Biofuel technologies: Recent developments 2013. Berlin, Heidelberg: Springer. [CrossRef]
  109. Argiz L, Reyes C, Belmonte M, Franchi O, Campo R, Fra-Vázquez A, et al. Assessment of a fast method to predict the biochemical methane potential based on biodegradable COD obtained by fractionation respirometric tests. J Environ Manage 2020, 269, 110695. [CrossRef]
  110. Aragón-Briceño C, Ross AB, Camargo-Valero MA. Evaluation and comparison of product yields and bio-methane potential in sewage digestate following hydrothermal treatment. Applied Energy 2017, 208, 1357–69. [CrossRef]
Figure 1. Disposal of slaughter waste in an open container.
Preprints 119562 g001
Figure 2. Weighing of slaughter waste at the Sunyani abattoir.
Preprints 119562 g002
Figure 3. The Design of Mechanical Press.
Preprints 119562 g003
Figure 4. Mechanical Press.
Preprints 119562 g004
Figure 5. Schematic of HBT digester [63].
Preprints 119562 g005
Figure 6. Van Krevelen diagram of atomic ratio of O: C against H: C.
Preprints 119562 g006
Figure 9. Differential maximum biogas potential of methane based on variant.
Preprints 119562 g009
Disclaimer/Publisher’s Note: The statements, opinions and data contained in all publications are solely those of the individual author(s) and contributor(s) and not of MDPI and/or the editor(s). MDPI and/or the editor(s) disclaim responsibility for any injury to people or property resulting from any ideas, methods, instructions or products referred to in the content.
Copyright: This open access article is published under a Creative Commons CC BY 4.0 license, which permit the free download, distribution, and reuse, provided that the author and preprint are cited in any reuse.
Alerts
Prerpints.org logo

Preprints.org is a free preprint server supported by MDPI in Basel, Switzerland.

Subscribe

© 2025 MDPI (Basel, Switzerland) unless otherwise stated