Preprint
Article

Interactions Between Gut Microbiota, Metabolites, and Longissimus Dorsi Muscle Fatty Acid Composition in Pig Breeds

Altmetrics

Downloads

77

Views

157

Comments

0

Submitted:

26 September 2024

Posted:

29 September 2024

You are already at the latest version

Alerts
Abstract
The gut microbiota plays a pivotal role in host metabolism, influencing the production of small metabolites from non-digestible compounds, which can accumulate in tissues and play important role in fatty acids synthesis for improving the meat quality. We investigate the breed-specific differences in longissimus dorsi (LD) muscle fatty acid profile, gut microbiota, and metabolites across the cecum, ileum, and rectum in Chinese Songliao Black pigs (SBP) and commercial Large White × Landrace crossbred pigs (LWLDP) and interactions. Significant correlations highlighting potential microbiota-metabolite interactions that contribute to muscle fatty acid composition. LWLDP pigs exhibited a higher number of significant fatty acids and maintained higher operational taxonomic units (OTUs) in the cecum and rectum, with no differences observed in the ileum between breeds. Firmicutes, Bacteroidetes, Proteobacteria, and Spirochaetes were the predominant phyla across both breeds. Differentially expressed metabolites (DEMs) were more abundant in the cecum and ileum of LWLDP, while rectum showed higher expression in SBP. Integrative analysis identified significant correlations between fatty acids, metabolites, and microbial taxa. DHA was linked to cecal metabolites and rectal microbial families, while saturated and unsaturated fatty acids were associated with different microbes and metabolites. This study demonstrates distinct breed-specific interactions between gut microbiota, metabolites, and fatty acid composition, offering insights into potential microbial interventions to enhance pork quality through fatty acid modulation.
Keywords: 
Subject: Biology and Life Sciences  -   Life Sciences

1. Introduction

Meat quality is an economically important trait in the pig industry and determining factor in the overall acceptability of eating quality, assessment includes the intramuscular fat content, marbling scores, moisture content, drip loss, color scores, and pH values, which are highly associated with the muscle fatty acid (FA) composition [1,2]. The most notable correlation is observed in the positive relationship between the intramuscular fat content and saturated fatty acids (SFAs) in most pig breeds, while the intramuscular fat content, marbling score, and back fat thickness are negatively correlated with polyunsaturated fatty acids (PUFAs) due to their oxidizable nature [3]. FA composition determines meat quality and is closely related to the nutrition and eating quality of pork [4]. Muscle FA composition is governed by heredity, age, diet, feeding environment, and the gut microbiota. In recent decades, the role of the gut microbiota has been widely confirmed in host metabolism, and germ-free and antibiotic-challenged animals are resistant to diet-induced lipid uptake and deposition [5,6,7].
The gut microbiota, a complex community of trillions of microorganisms [8]. These are playing a crucial role in host metabolism by fermenting non-digestible compounds and producing metabolites that can significantly impact the host's physiology [9,10]. These microorganisms actively engage in interactions with the host, exerting a considerable influence over both disease susceptibility and normal physiological functions [11]. Composition and diversity of these microbial communities are shaped by several factors, including genetics, age, sex, and diet. The gut microbiota also produces various metabolites, such as bile acids, short-chain fatty acids like butyrate, and vitamins including thiamine, folate, biotin, riboflavin, and pantothenic acid [12]. These compounds are produced through the combined metabolism of microorganisms and the host, ultimately affecting the host's overall health and meat quality [13]. Metabolites encompass tangible compounds generated during the metabolic process, serving as both substrates and outcomes of metabolic reactions [14]. These compounds wield the capacity to instigate alterations in cellular functionalities, encompassing signal transduction, energy conversion, and cellular apoptosis [14]. Metabolomics is a powerful analytical technique that can comprehensively analyze and compare the final products of metabolic processes. This approach gives a detailed picture of the metabolic profiles that result from the metabolism of individuals, organs, and cells, helping to connect metabolic pathways with their underlying biological functions. Additionally, metabolomics can assess an organism's overall health by examining its complete metabolic network and thoroughly investigating its metabolic processes [15]. Several studies have also reported on microbial composition in different intestinal regions. These studies have mostly been restricted to specific pig breeds [16,17,18,19]. Host genetics may be closely involved in structuring the gut microbial communities in different species [20]. Recent research using Mix omics approach find out gut microbiota produce metabolites that are helpful in improving the meat quality [21,22]. Another research shown that diet plays a major role in microbial structuring gut environment and helpful in lipid synthesis and deposition in muscles [23,24]. Recent breed-based study reveal that obese pig derived microbiota rewires carnitine metabolism to promote muscle fatty acid deposition in lean pig breed [25].
The functional role of gut microbiota-derived metabolites in modulating fatty acid composition across different intestinal regions remains underexplored, studies often focusing on specific gut sections without comprehensively assessing microbial communities and their metabolites. To address this, we compared the gut microbiota, metabolites, and their influence on longissimus dorsi muscle fatty acids across the cecum, ileum, and rectum in two pig breeds. Our study focused on the high meat quality Songliao Black Pig (SBP) and the commercially low meat quality and fast-growing Large White × Landrace crossbred (LWLDP). Previous research indicates that SBP generally known for superior meat quality northeastern region of China [26].
In conclusion, understanding the breed-specific interactions between gut microbiota, metabolites, and fatty acid profiles is essential for uncovering novel microbiota-driven mechanisms that influence pork quality, potentially leading to targeted strategies for improving meat traits through microbial and metabolic modulation.

2. Materials and Methods

2.1. Ethics Statement and Animal Sample Collection

All animal procedures were conducted in accordance with the guidelines approved by the Institutional Animal Care and Use Committee (IACUC) of the Jilin Agricultural University. The study protocol was approved by the IACUC under approval number (KT2023023).
For this study we reared the one hundred pigs (Fifty Songliao Black Pigs and Fifty Large White × Landrace (LWLDP) at Gongzhuling National Agricultural Science and Technology, Feimas Animal Husbandry Co., Ltd., China. All pigs were male with an average age of 7 months and 15 days. The animals were raised under uniform conditions, including consistent temperature, humidity, and ventilation, and same diet throughout their life, as detailed in (Table S1). Pigs were transported to Gongzhuling Gaojin Food Co., Ltd. Slaughterhouse at late finishing stage, where they were euthanized using electric shock followed by rapid bleeding. Five pigs from each breed were randomly selected for sampling. After slaughtering, longissimus dorsi muscle samples were promptly snap-frozen in liquid nitrogen and stored at −80°C for fatty acid analysis. Intestinal digesta samples from the ileum, cecum, and rectum of the same pigs were also collected. These samples were immediately placed in sterile 7 mL cryo-preservative tubes, frozen using liquid nitrogen and stored at −80°C to preserve them for microbial diversity analysis and metabolite profiling.

2.2. Fatty Acid Content Analysis

The percentage of fatty acids (FAs) in intramuscular fat (IMF) was analyzed using a gas chromatograph (Shimadzu GCMS-TQ8040 NX Triple Quadrupole). Samples were stored at -80 ℃ for 24 hours, then freeze-dried at -40 ℃ to remove moisture. The dried samples were powdered and stored at low temperatures. A 0.50 g sample was mixed with 5.0 mL petroleum ether and sonicated for 20 minutes. After filtration, 2 mL of n-hexane-ethyl ether (2:1) and potassium hydroxide-methanol solution (1.0 mol/L) were added for methylation. The upper organic phase was extracted, diluted with n-hexane, filtered through a 0.45 μm membrane, and transferred for analysis. The GC column was 100m long, with a 0.25 mm inner diameter and 0.20 μm film thickness. Instrument settings: inlet temperature 240 ℃, split ratio 10:1, column flow rate 1.3 mL/min, ion source temperature 230 ℃, interface temperature 250 ℃, injection volume 1 µL, and solvent delay time 10 minutes. FA peaks were identified by comparing retention times with known standards (Sigma) and quantified as mg/100g total FAs.

2.3. Metabolites Extraction of Liquid

100 μL of sample was taken, mixed with 400 μL of extraction solution (MeOH:ACN, 1:1 (v/v)), the extraction solution contain deuterated internal standards, the mixed solution were vortexed for 30 s, sonicated for 10 min in 4 ℃ water bath, and incubated for 1 h at -40 ℃ to precipitate proteins. Then the samples were centrifuged at 12000 rpm (RCF=13800(×g), R= 8.6cm) for 15 min at 4 ℃. The supernatant was transferred to a fresh glass vial for analysis. The quality control (QC) sample was prepared by mixing an equal aliquot of the supernatant of samples.

2.4. LC-MS/MS Metabolites Detection

For polar metabolites, LC-MS/MS analyses were performed using an UHPLC system (Vanquish, Thermo Fisher Scientific) with a Waters ACQUITY UPLC BEH Amide (2.1 mm × 50 mm, 1.7 μm) coupled to Orbitrap Exploris 120 mass spectrometer (Orbitrap MS, Thermo). The mobile phase consisted of 25 mmol/L ammonium acetate and 25 mmol/L ammonia hydroxide in water (pH = 9.75)(A) and acetonitrile (B). The auto-sampler temperature was 4 ℃, and the injection volume was 2 μL. The Orbitrap Exploris 120 mass spectrometer was used for its ability to acquire MS/MS spectra on information-dependent acquisition (IDA) mode in the control of the acquisition software (Xcalibur, Thermo). In this mode, the acquisition software continuously evaluates the full scan MS spectrum. The ESI source conditions were set as following: sheath gas flow rate as 50 Arb, Aux gas flow rate as 15 Arb, capillary temperature 320 ℃, full MS resolution as 60000, MS/MS resolution as 15000, collision energy: SNCE 20/30/40, spray voltage as 3.8 kV (positive) or -3.4 kV (negative), respectively.

2.5. Microbial DNA Extraction and Sequencing Method

Total genomic DNA samples were extracted using the OMEGA Soil DNA Kit (M5635-02) (Omega Bio-Tek, Norcross, GA, USA). The quantity and quality of extracted DNAs were measured using a NanoDrop NC2000 spectrophotometer (Thermo Fisher Scientific, Waltham, MA, USA) and agarose gel electrophoresis, respectively. PCR amplification of the bacterial 16S rRNA genes V3–V4 region was performed using the forward primer 338F (5'-ACTCCTACGGGAGGCAGCA-3') and the reverse primer 806R (5'-GGACTACHVGGGTWTCTAAT-3'). Sample-specific 7-bp barcodes were incorporated into the primers for multiplex sequencing. The PCR components contained 5 μl of buffer (5×), 0.25 μl of Fast pfu DNA Polymerase (5U/μl), 2 μl (2.5 mM) of dNTPs, 1 μl (10 uM) of each Forward and Reverse primer, 1 μl of DNA Template, and 14.75 μl of ddH2O. Thermal cycling consisted of initial denaturation at 98 °C for 5 min, followed by 25 cycles consisting of denaturation at 98 °C for 30 s, annealing at 53 °C for 30 s, and extension at 72 °C for 45 s, with a final extension of 5 min at 72 °C. PCR amplicons were purified with Vazyme VAHTSTM DNA Clean Beads (Vazyme, Nanjing, China) and quantified using the Quant-iT PicoGreen dsDNA Assay Kit (Invitrogen, Carlsbad, CA, USA). After the individual quantification step, amplicons were pooled in equal amounts, and pair-end 2×250 bp sequencing was performed using the Illlumina NovaSeq platform with NovaSeq 6000 SP Reagent Kit (500 cycles) at Shanghai Personal Biotechnology Co., Ltd (Shanghai, China).

2.6. Longissimus Dorsi Muscle Metabolites Analysis

Untargeted metabolites were detected using the Total Ion Chromatogram (TIC). The raw data for positive and negative ion metabolite concentrations were analyzed using XCMS software, which handled peak alignment, retention time correction, and peak area extraction. After XCMS processed the data, metabolite structure identification using (http://www.hmdb.ca/) and data preprocessing were performed. Multivariate statistical analysis methods were implemented using the (R language Ropls package) to compare metabolites between SBP and LWLDP breeds following the Principal Component Analysis (PCA), Partial Least Squares-Discriminant Analysis (PLS-DA) and Orthogonal Partial Least Squares Discriminant Analysis (OPLS-DA). Differential metabolites analysis was performed using R with the threshold of |Log2Fc 1, p.adj value > 0.5|. PCA, volcano plot and a cluster heat map were constructed using SR plot online platform [27]. The KEGG (Kyoto Encyclopedia of Genes and Genomes) database (http://www.genome.jp/kegg/) was used to analyze the differentially expressed pathways.

2.7. Analysis of Intestinal Microorganisms

Sequence data analyses were performed using QIIME2 and R packages (v3.2.0) [28]. Alpha diversity indices (Chao1, observed species, Shannon, Simpson, Faith’s PD, Pielou’s evenness, and Good’s coverage) were calculated from the ASV table in QIIME2 and visualized as box plots. ASV-level ranked abundance curves were used to compare richness and evenness among samples. Beta diversity analysis assessed microbial community structure variation using Jaccard, Bray-Curtis, and UniFrac distance metrics, visualized through principal coordinate analysis (PCoA), nonmetric multidimensional scaling (NMDS) hierarchical clustering. Significance in microbiota structure differentiation was assessed by Permutational multivariate analysis of variance (PERMANOVA) conducted using QIIME2. Taxonomy compositions and abundances were visualized with MEGAN and GraPhlAn. Venn diagram generated using the R package Venn Diagram [29]. Differentially abundant taxa were identified using Linear discriminant analysis effect size (LEfSe) [29]. Orthogonal Partial Least Squares Discriminant Analysis (OPLS-DA) performed with the R package Muma [30]. Microbial functions were predicted by PICRUSt2 using MetaCyc [31], and KEGG databases (http://www.genome.jp/kegg/).

2.8. Integrative Analysis

Integrative analysis was performed using the R MixOmics package [32]. To investigate the relationships between intestinal metabolites, microbial taxa, and fatty acids in different sections of the intestine (cecum, ileum, and rectum) across two pig breeds. Initially, a sparse Partial Least Squares Discriminant Analysis (sPLS-DA) DIABLO model was constructed using operational taxonomic units (OTUs) at the family level for each intestinal section. To refine the dataset, we filtered out samples that have microbial taxa with low occurrences in pig breeds. Further, we selected differential metabolites from each intestinal section and fatty acids that showed significant differences between the breeds. Individual DIABLO sample plots were created to visualize the separation and clustering of samples. After identifying deviations in the sample distribution, we refined each block by selecting four replications from each breed and reconstructed the DIABLO model. This refined model allowed for a clearer visualization of the correlation of each block among the selected features. Subsequently, we generated a correlation circle plot using regression canonical correlations analysis (rCCA) model to analyze the distribution of variable in each block and identify the closest associations between metabolites, microbial taxa, and fatty acids. Further, we created a separate mixomics analysis for each part of intestine microbe, metabolites and fatty acids along with microbial functional KO pathways following the previous same method. This approach enabled us to identify key metabolites, microbial taxa, and fatty acids that are closely associated and potentially play a crucial role in regulating intestinal metabolism and meat quality traits in pigs.

2.9. Statistical Analyses

The ANOVA procedure was performed in SPSS 26 was used to analyze the data collected. Descriptive analysis and one-way anova was use for comparing the mean values, standard deviation and significance analysis (fatty acids profile). Mean values and standard deviation are shown in the tables, with differences considered significant if p < 0.05.

3. Results

3.1. Fatty Acid Profile in Longissimus Dorsi Muscle of SBP and LWLDP

Fatty acid composition of the longissimus dorsi muscle in the SBP and LWLDP pig (Table 1). GC-MS detected a total of thirty-seven different fatty acids longissimus dorsi muscle. 16 fatty acids showed significant differences. SBP exhibiting lower total saturated fatty acids (117.1 ± 29.5) compared to LWLDP (175.32 ± 35.69, p < 0.05) and notable differences in specific saturated fatty acids such as myristic acid (6.26 ± 3.23 in SBP vs. 10.96 ± 3.05 in LWLDP, p < 0.05) and palmitic acid (67.40 ± 15.28 in SBP vs. 101.1 ± 20.20 in LWLDP, p < 0.01). Additionally, SBP had significantly lower monounsaturated fatty acids (116.42 ± 25.4) than LWLDP (168.08 ± 35.95, p < 0.05), with oleic acid being the predominant contributor. In terms of polyunsaturated fatty acids, SBP also showed reduced levels (36.11 ± 10.1) compared to LWLDP (48.69 ± 5.05, p < 0.05), including significant differences in linoleic acid (28.70 ± 8.9 in SBP vs. 39.87 ± 4.38 in LWLDP, p < 0.05). Notably, SBP had higher docosahexaenoic acid (DHA) levels (0.86 ± 0.36) compared to LWLDP (0.42 ± 0.06, p < 0.05). These variations in fatty acid composition may contribute to the distinct meat quality traits observed in these two pig breeds, warranting further exploration of their implications for nutritional value and health benefits in pork products.

3.2. Intestine Metabolome Analysis

3.2.1. Differential Metabolites Analysis of Cecum, Ileum and Rectum between SBP and LWLDP Pigs Breeds

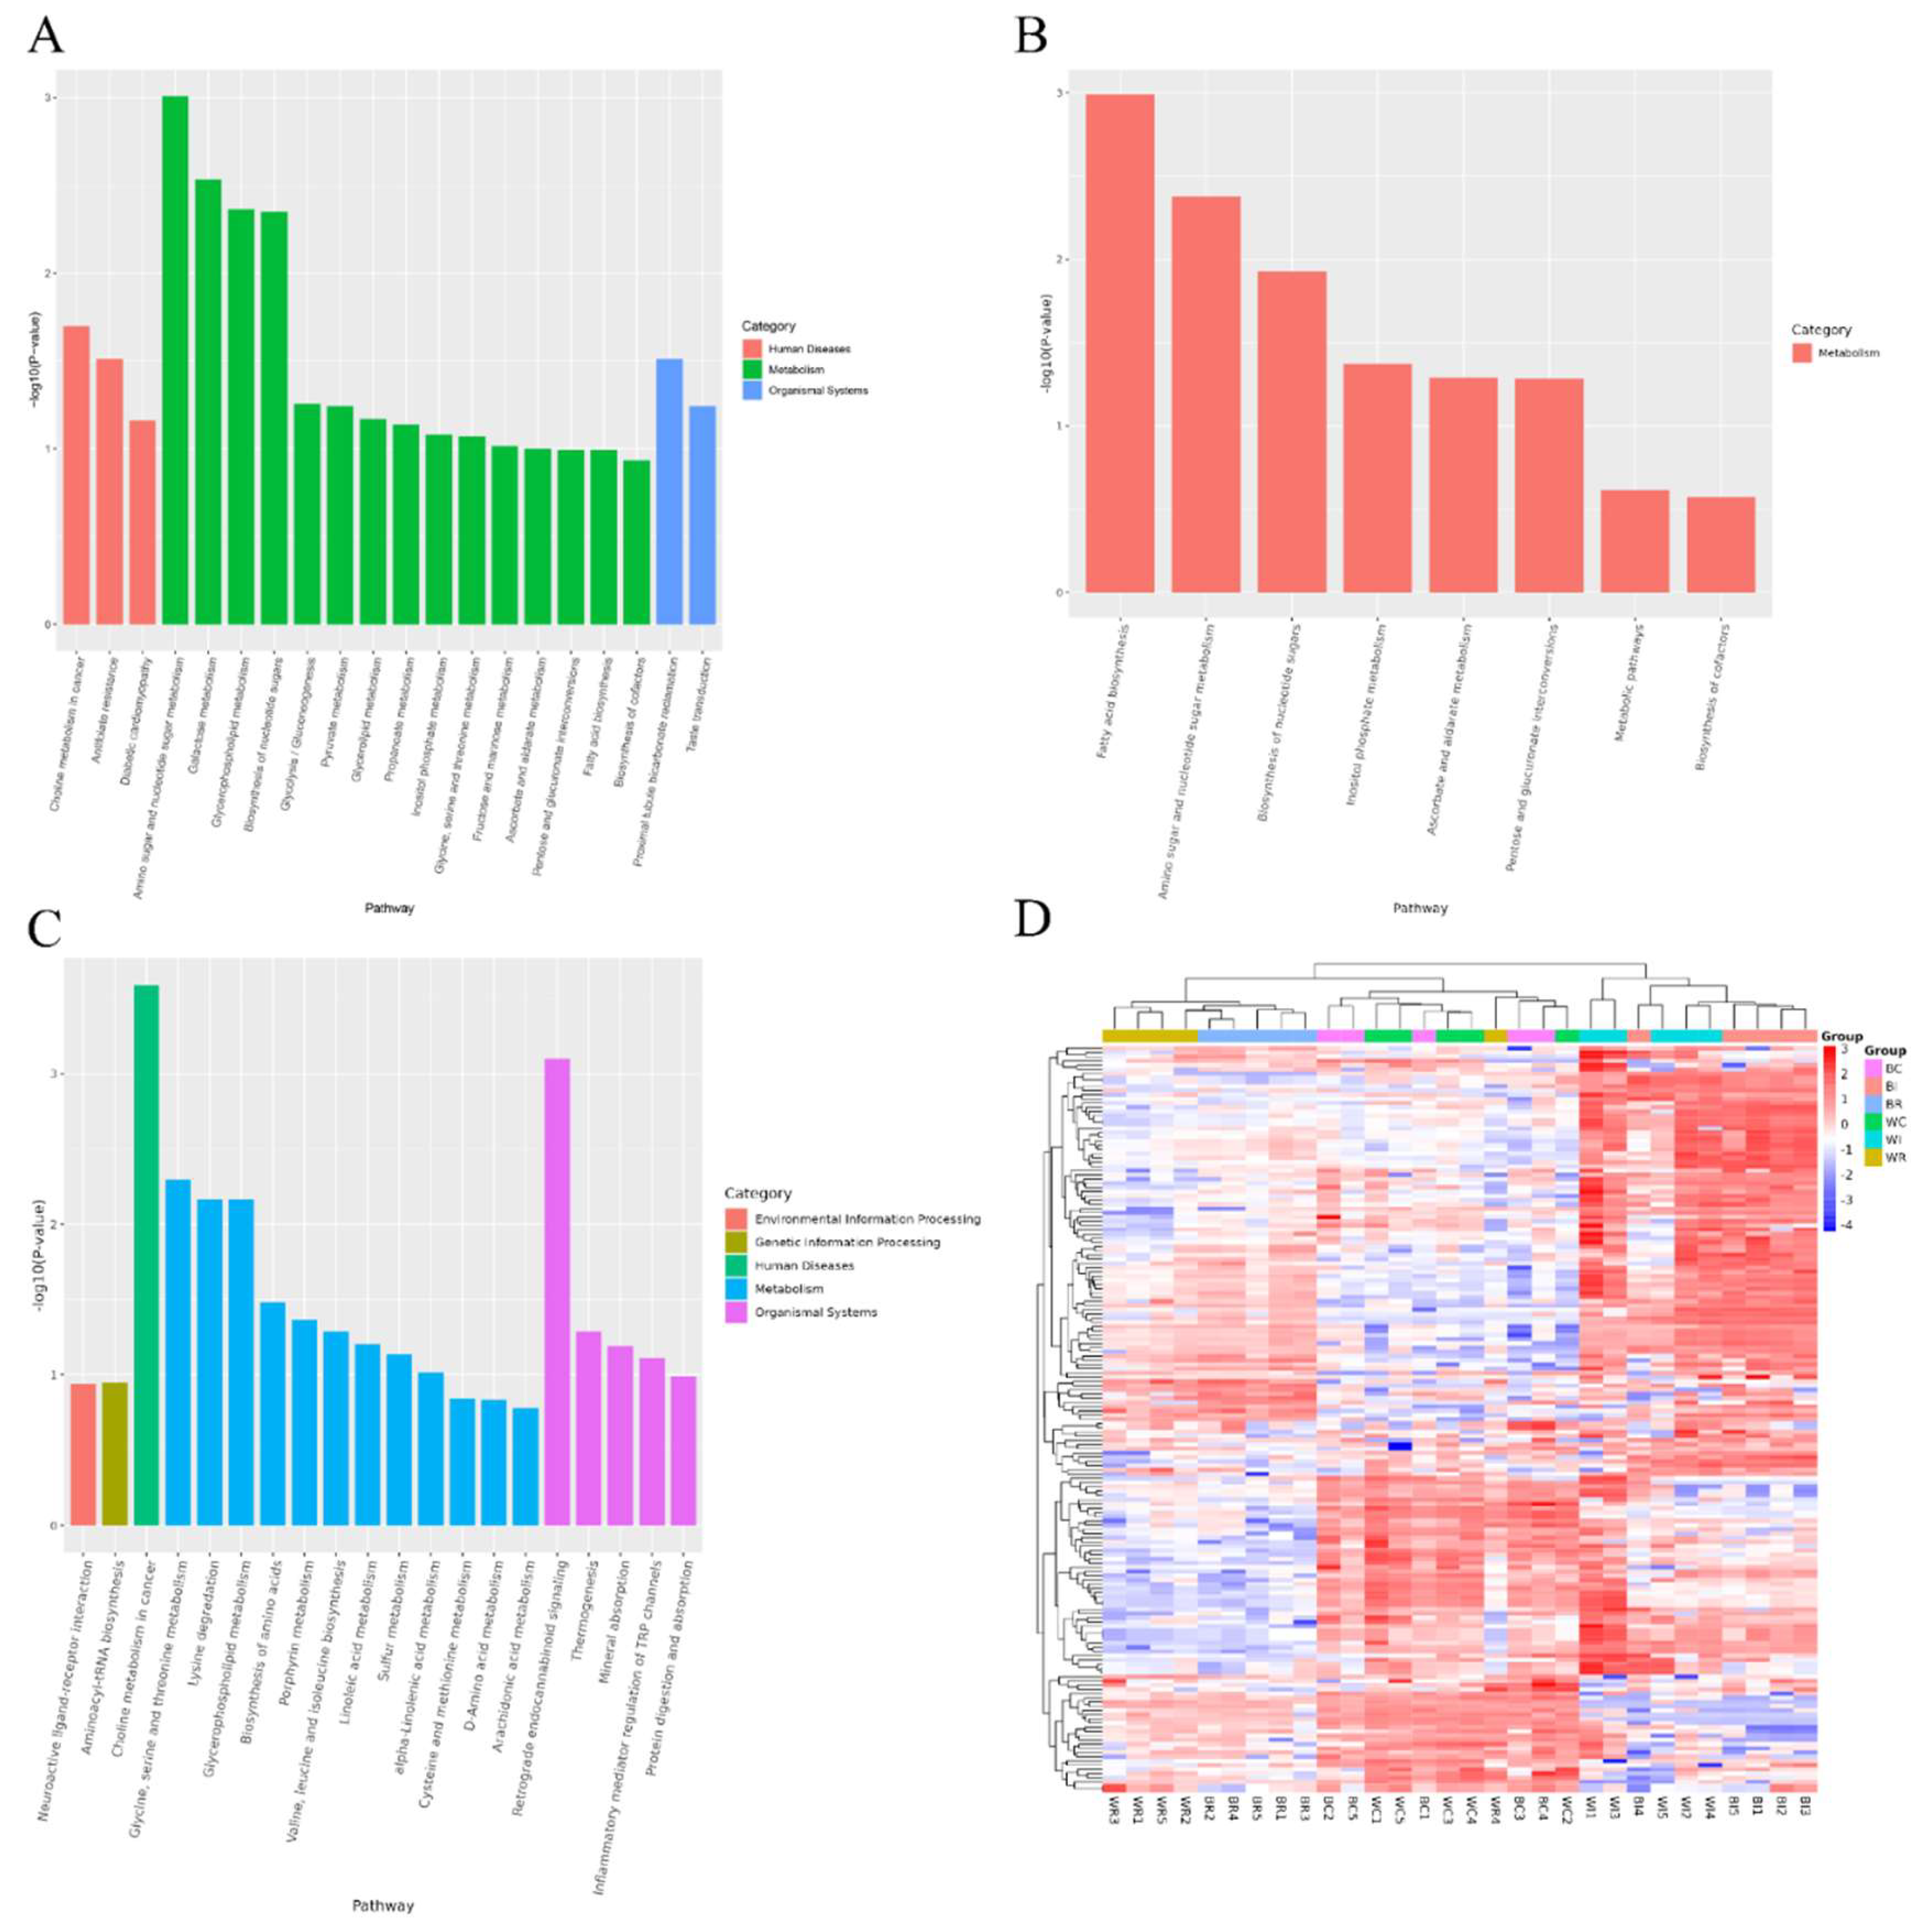
We identified an average of 18,089 metabolites in each intestinal section (cecum, ileum, and rectum). Initially, multivariate analysis was performed, starting with Principal Component Analysis (PCA), which revealed distinct variance in metabolite profiles between the breeds (Figure 1A). Partial Least Squares-Discriminant Analysis (PLS-DA), and Orthogonal PLS-DA (OPLS-DA) identified 2,183 common metabolites expressed across the cecum, ileum, and rectum in both breeds. We then identified 42 differentially expressed metabolites (DEMs) in the cecum (Figure 1B), of which 32 were upregulated and 10 downregulated. The top 20 upregulated and downregulated metabolites are listed in (Table 2). In the ileum, 38 DEMs were found (Figure 1C), with 30 upregulated and 8 downregulated; the top 20 of each are presented in (Table 3). In the rectum, 75 DEMs were identified (Figure 1D), with 15 upregulated and 63 downregulated; the top 20 are detailed in (Table 4). A heatmap of the differentially expressed metabolites (Figure 2D) was generated, providing a visual representation of metabolite expression patterns across the intestinal sections and between breeds.

3.2.2. Functional Analysis of Ileum Cecum and Rectum Metabolites of SBP and LWLDP Pig Breeds

Functional analysis of differential metabolites from ileum, cecum, and rectum revealed distinct metabolic pathways in each intestinal region. In the cecum, 26 metabolic pathways were identified (Table S4), with notable enrichment in Amino sugar and nucleotide sugar metabolism. This pathway included upregulated metabolites such as glucuronic acid, glucose, and galactose, which are crucial for carbohydrate metabolism, impacting energy production and the structural integrity of muscle tissue. Additionally, the Galactose metabolism and Glycerophospholipid metabolism pathways were significantly active, indicating their roles in energy metabolism and lipid biosynthesis, respectively (Figure 2A). In the ileum, 9 significant pathways were identified (Table S5). Particularly Fatty acid biosynthesis pathway, where downregulated metabolites such as capric acid and cis-9-palmitoleic acid suggested alterations in lipid metabolism, potentially influencing pork fat content and quality. Other enriched pathways included Amino sugar and nucleotide sugar metabolism and Biosynthesis of nucleotide sugars, emphasizing their essential roles in maintaining structural integrity and supporting biosynthetic processes important for meat quality (Figure 2B). In the rectum, 23 key metabolic pathways were highlighted (Table S6), with major contributions from Lipid metabolism and Amino acid metabolism, which are critical for determining fatty acid profiles, flavor, and the nutritional value of the meat. Pathways such as Glycerophospholipid metabolism and Arachidonic acid metabolism were also identified, with significant impacts on intramuscular fat content, contributing to the taste and texture of the meat (Figure 2C).

3.3. Intestine Microbiome Analysis

3.3.1. Taxonomy and Diversity of Intestine Microbes in Cecum, Ileum and Rectum of SBP and LWLDP Pig Breeds

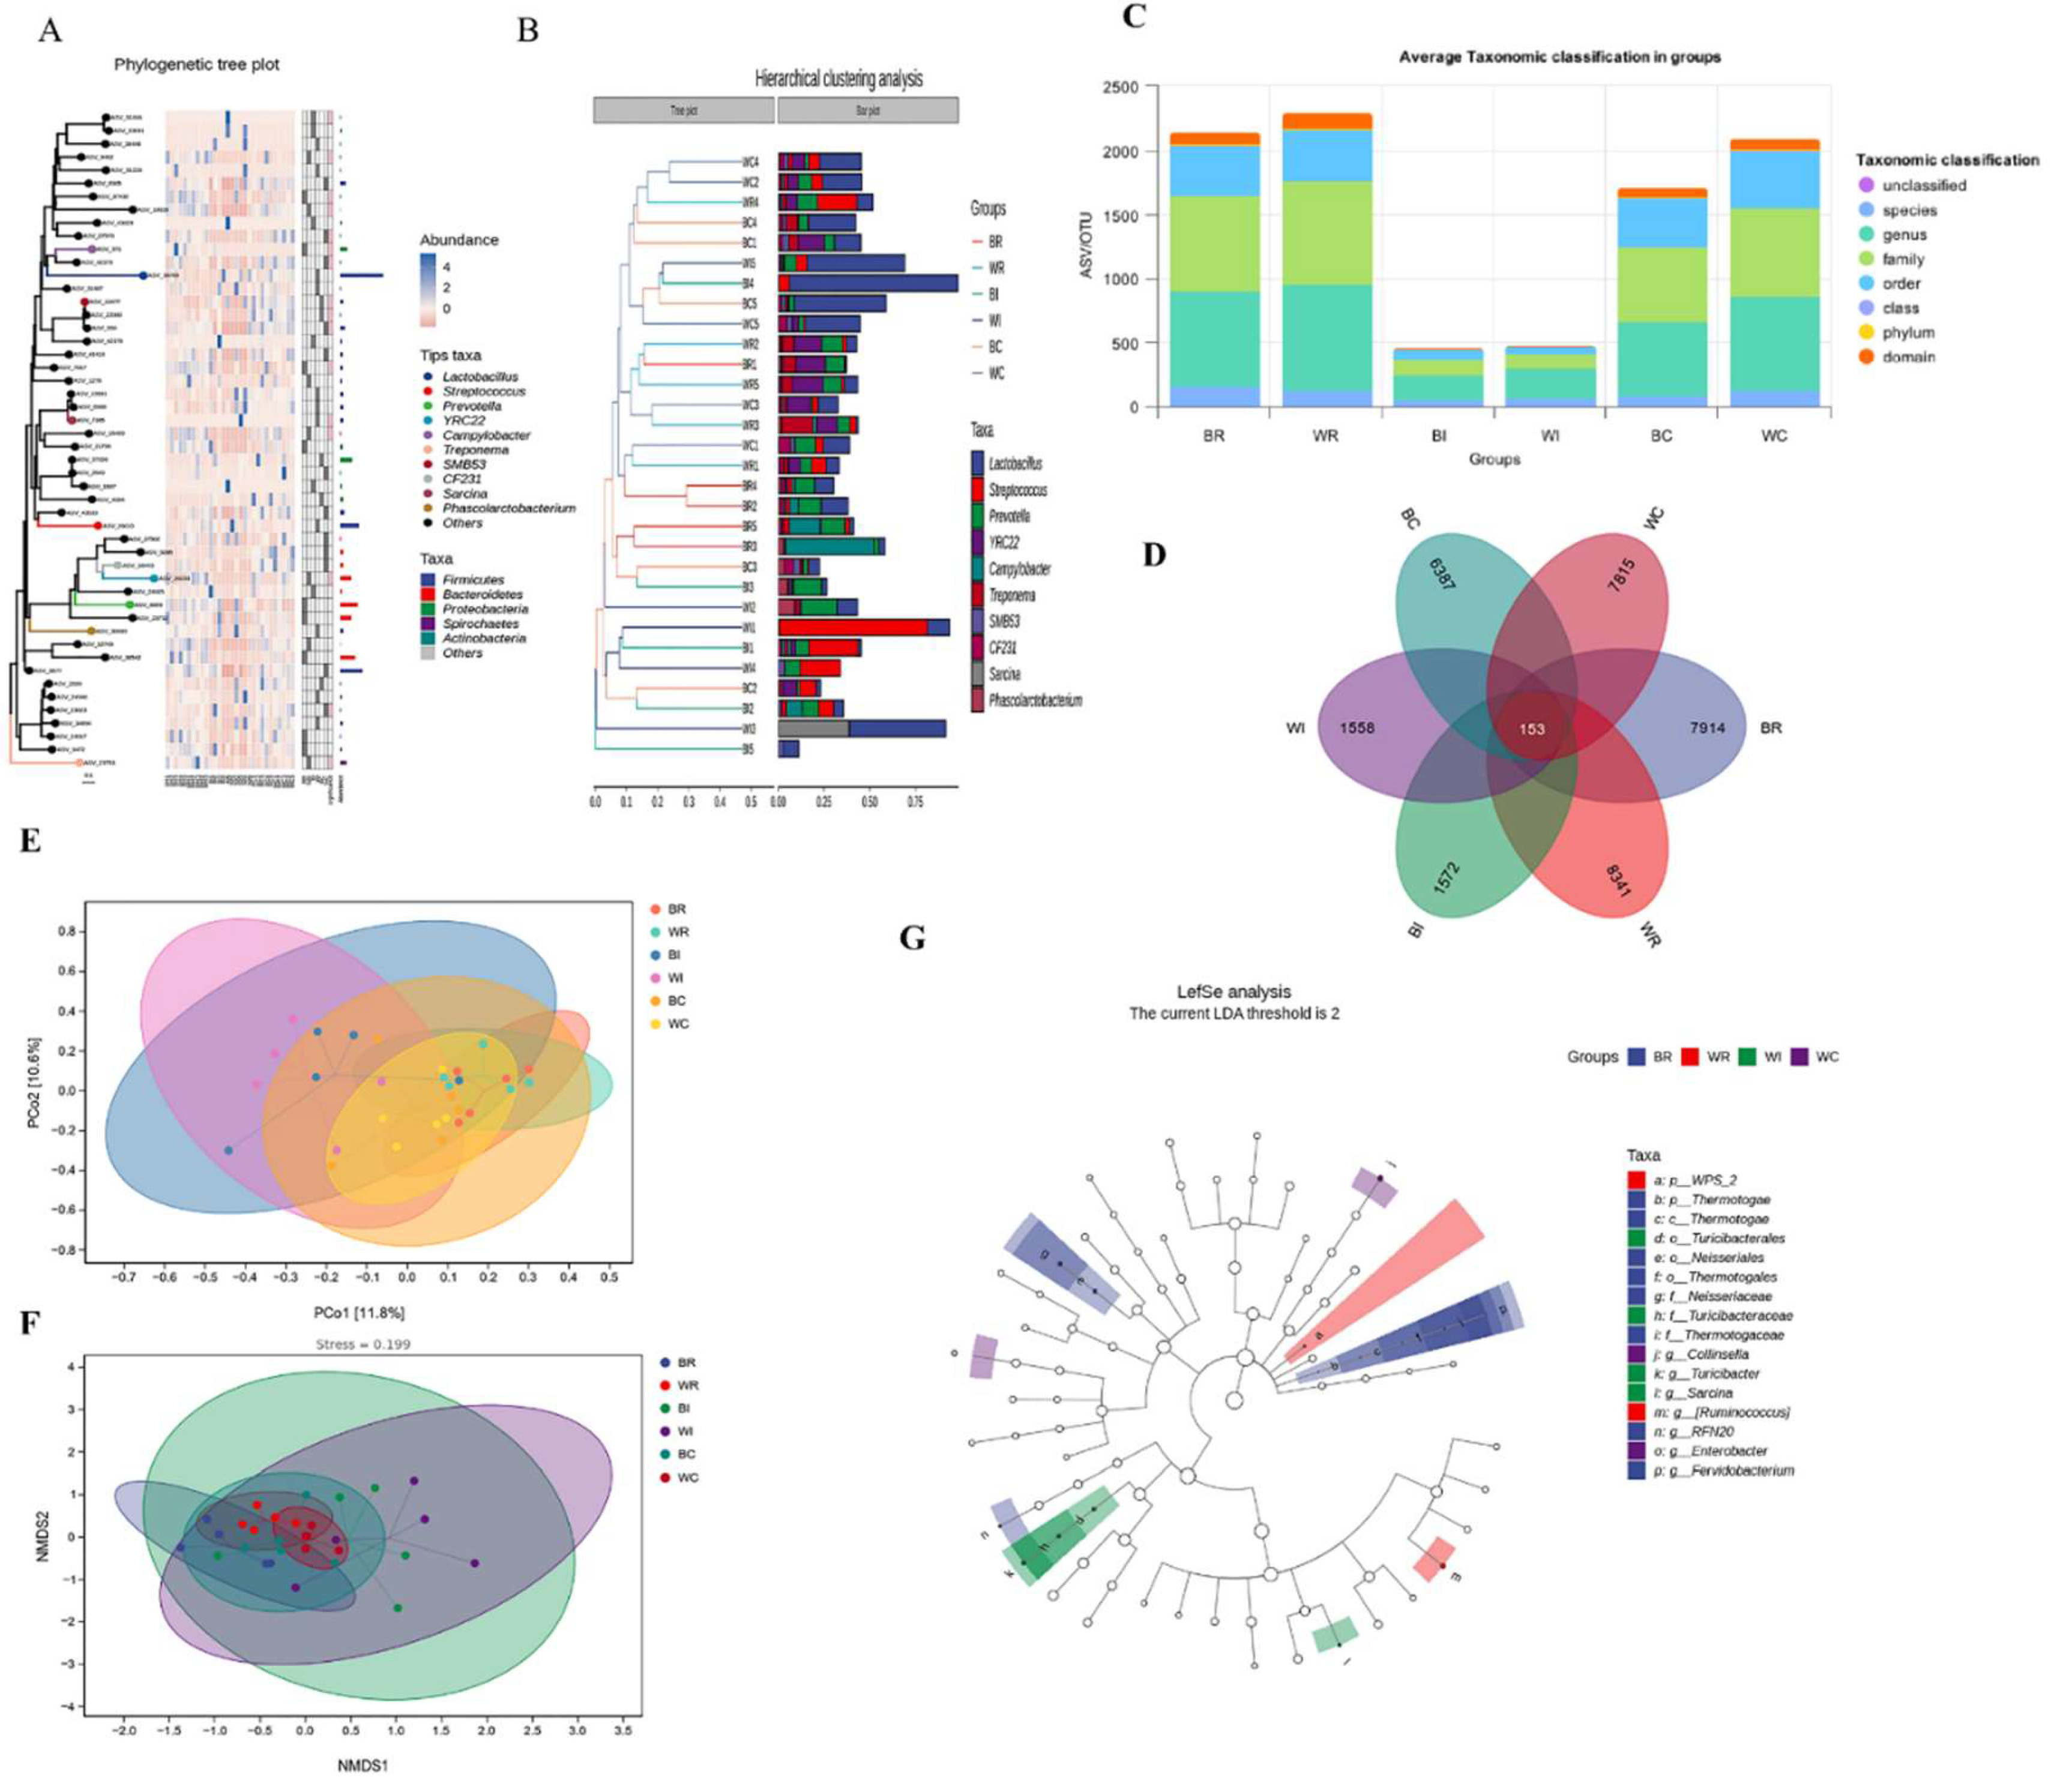
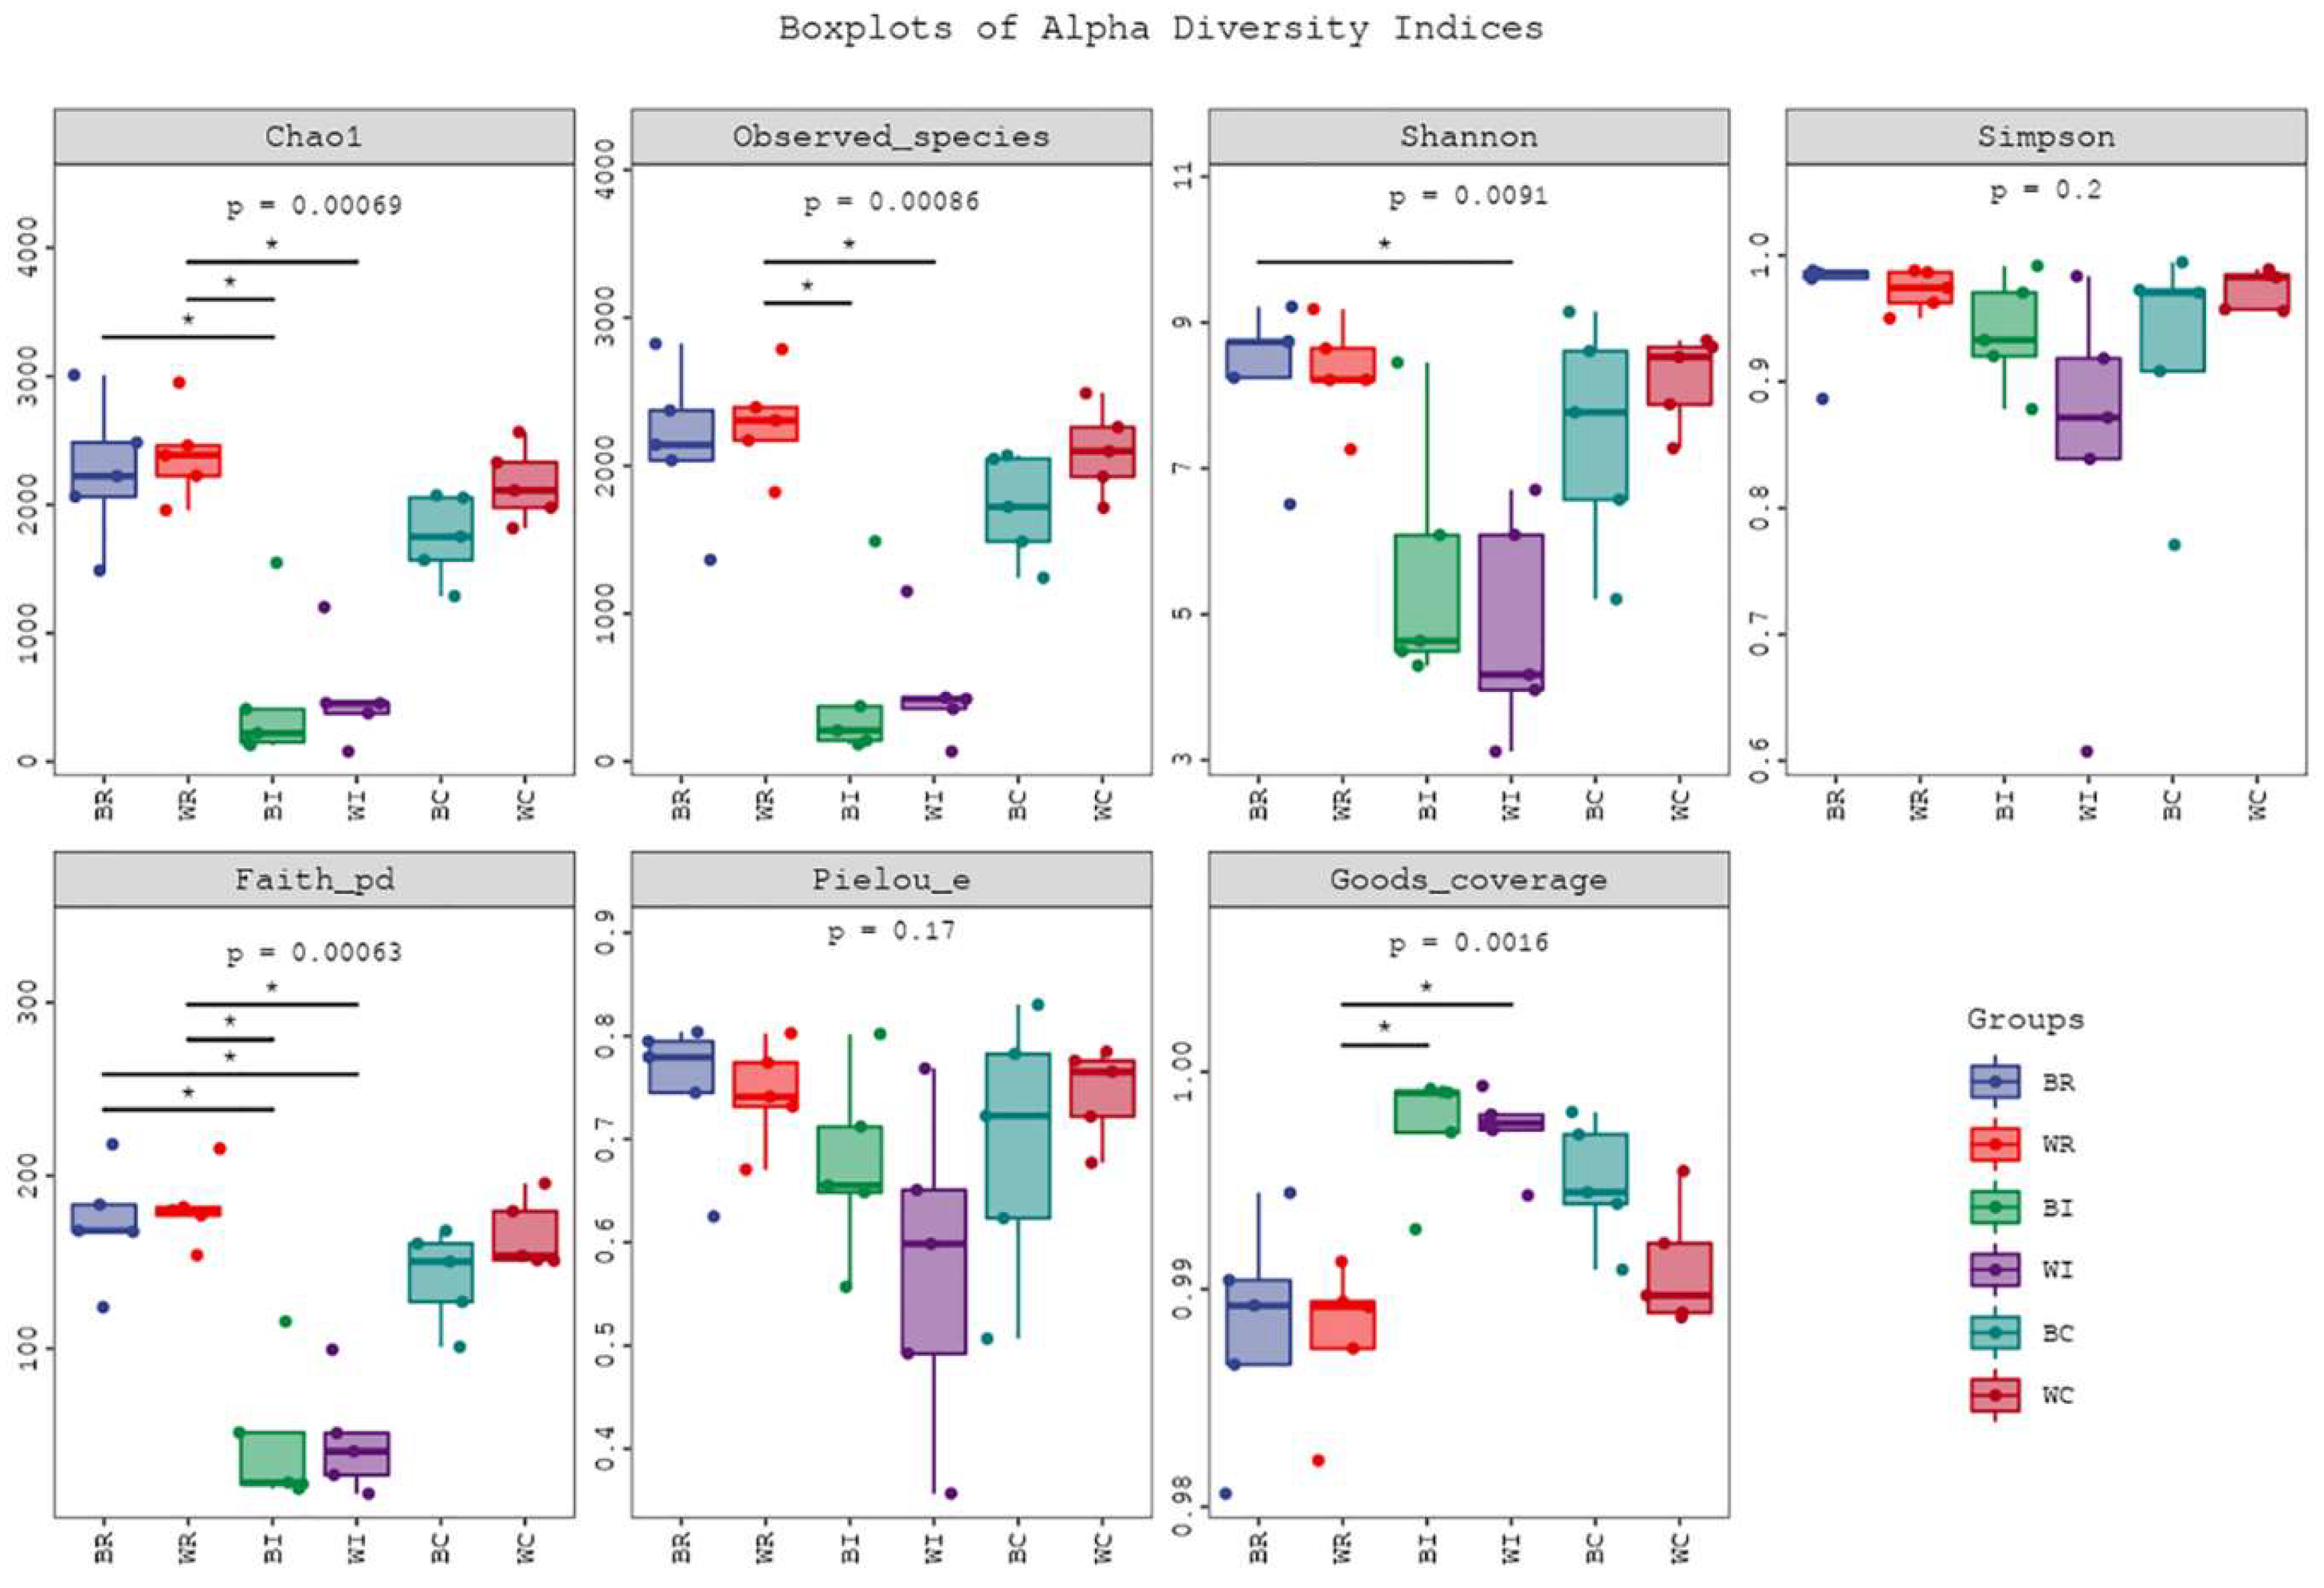
16S rRNA sequencing of the cecum, ileum, and rectum samples underwent filtering, denoising, merging, and removal of chimeric and singleton sequences to ensure high-quality data for comparative analysis between Songliao Black Pig (SBP) and LWLDP breeds (Table S7). Notably, the ileum in both breeds showed the least sequence reduction, with LWLDP maintaining higher sequence counts across all sections. The distribution of operational taxonomic units (OTUs) is shown in (Figure 3C), while a Venn diagram illustrates the amplicon sequence variants (ASVs), identifying 153 common ASVs across all groups (Figure 3H). Alpha diversity metrics revealed that LWLDP exhibited greater microbial diversity in both the cecum and rectum, while the ileum displayed similar diversity between the two breeds (Figure 4). In terms of β-diversity, there was a clear distinction in microbial composition between the intestinal sections of SBP and LWLDP (Figure 3E & F). Hierarchical clustering and phylogenetic tree analyses highlighted the distinct microbial abundance across the different intestinal regions between the two breeds (Figure 3A & B).
Comparative analysis of microbial communities revealed that the predominant phyla were Firmicutes, Bacteroidetes, Proteobacteria, and Spirochaetes, with variable abundance patterns between breeds (Figure 5A). At family level, Lactobacillaceae, Ruminococcaceae, Streptococcaceae, Paraprevotellaceae, and S24-7 were highly abundant (Figure 5B), at genus level, Lactobacillus, Streptococcus, Prevotella, and YRC22 dominated (Figure 5C), and at species level, Lactobacillus reuteri, Prevotella copri, Streptococcus luteciae, and Lactobacillus musosae were identified (Figure 5D). LEfSe analysis, using an LDA threshold of 2, identified significant differences in microbial taxa between the breeds, with SBP showing higher microbial diversity, particularly in the rectum (Figure 3G).

4.4. Integrative Analysis of Intestine Microbes, Metabolites and Fatty Acids

4.4.1. Combine Mix Omics Analysis

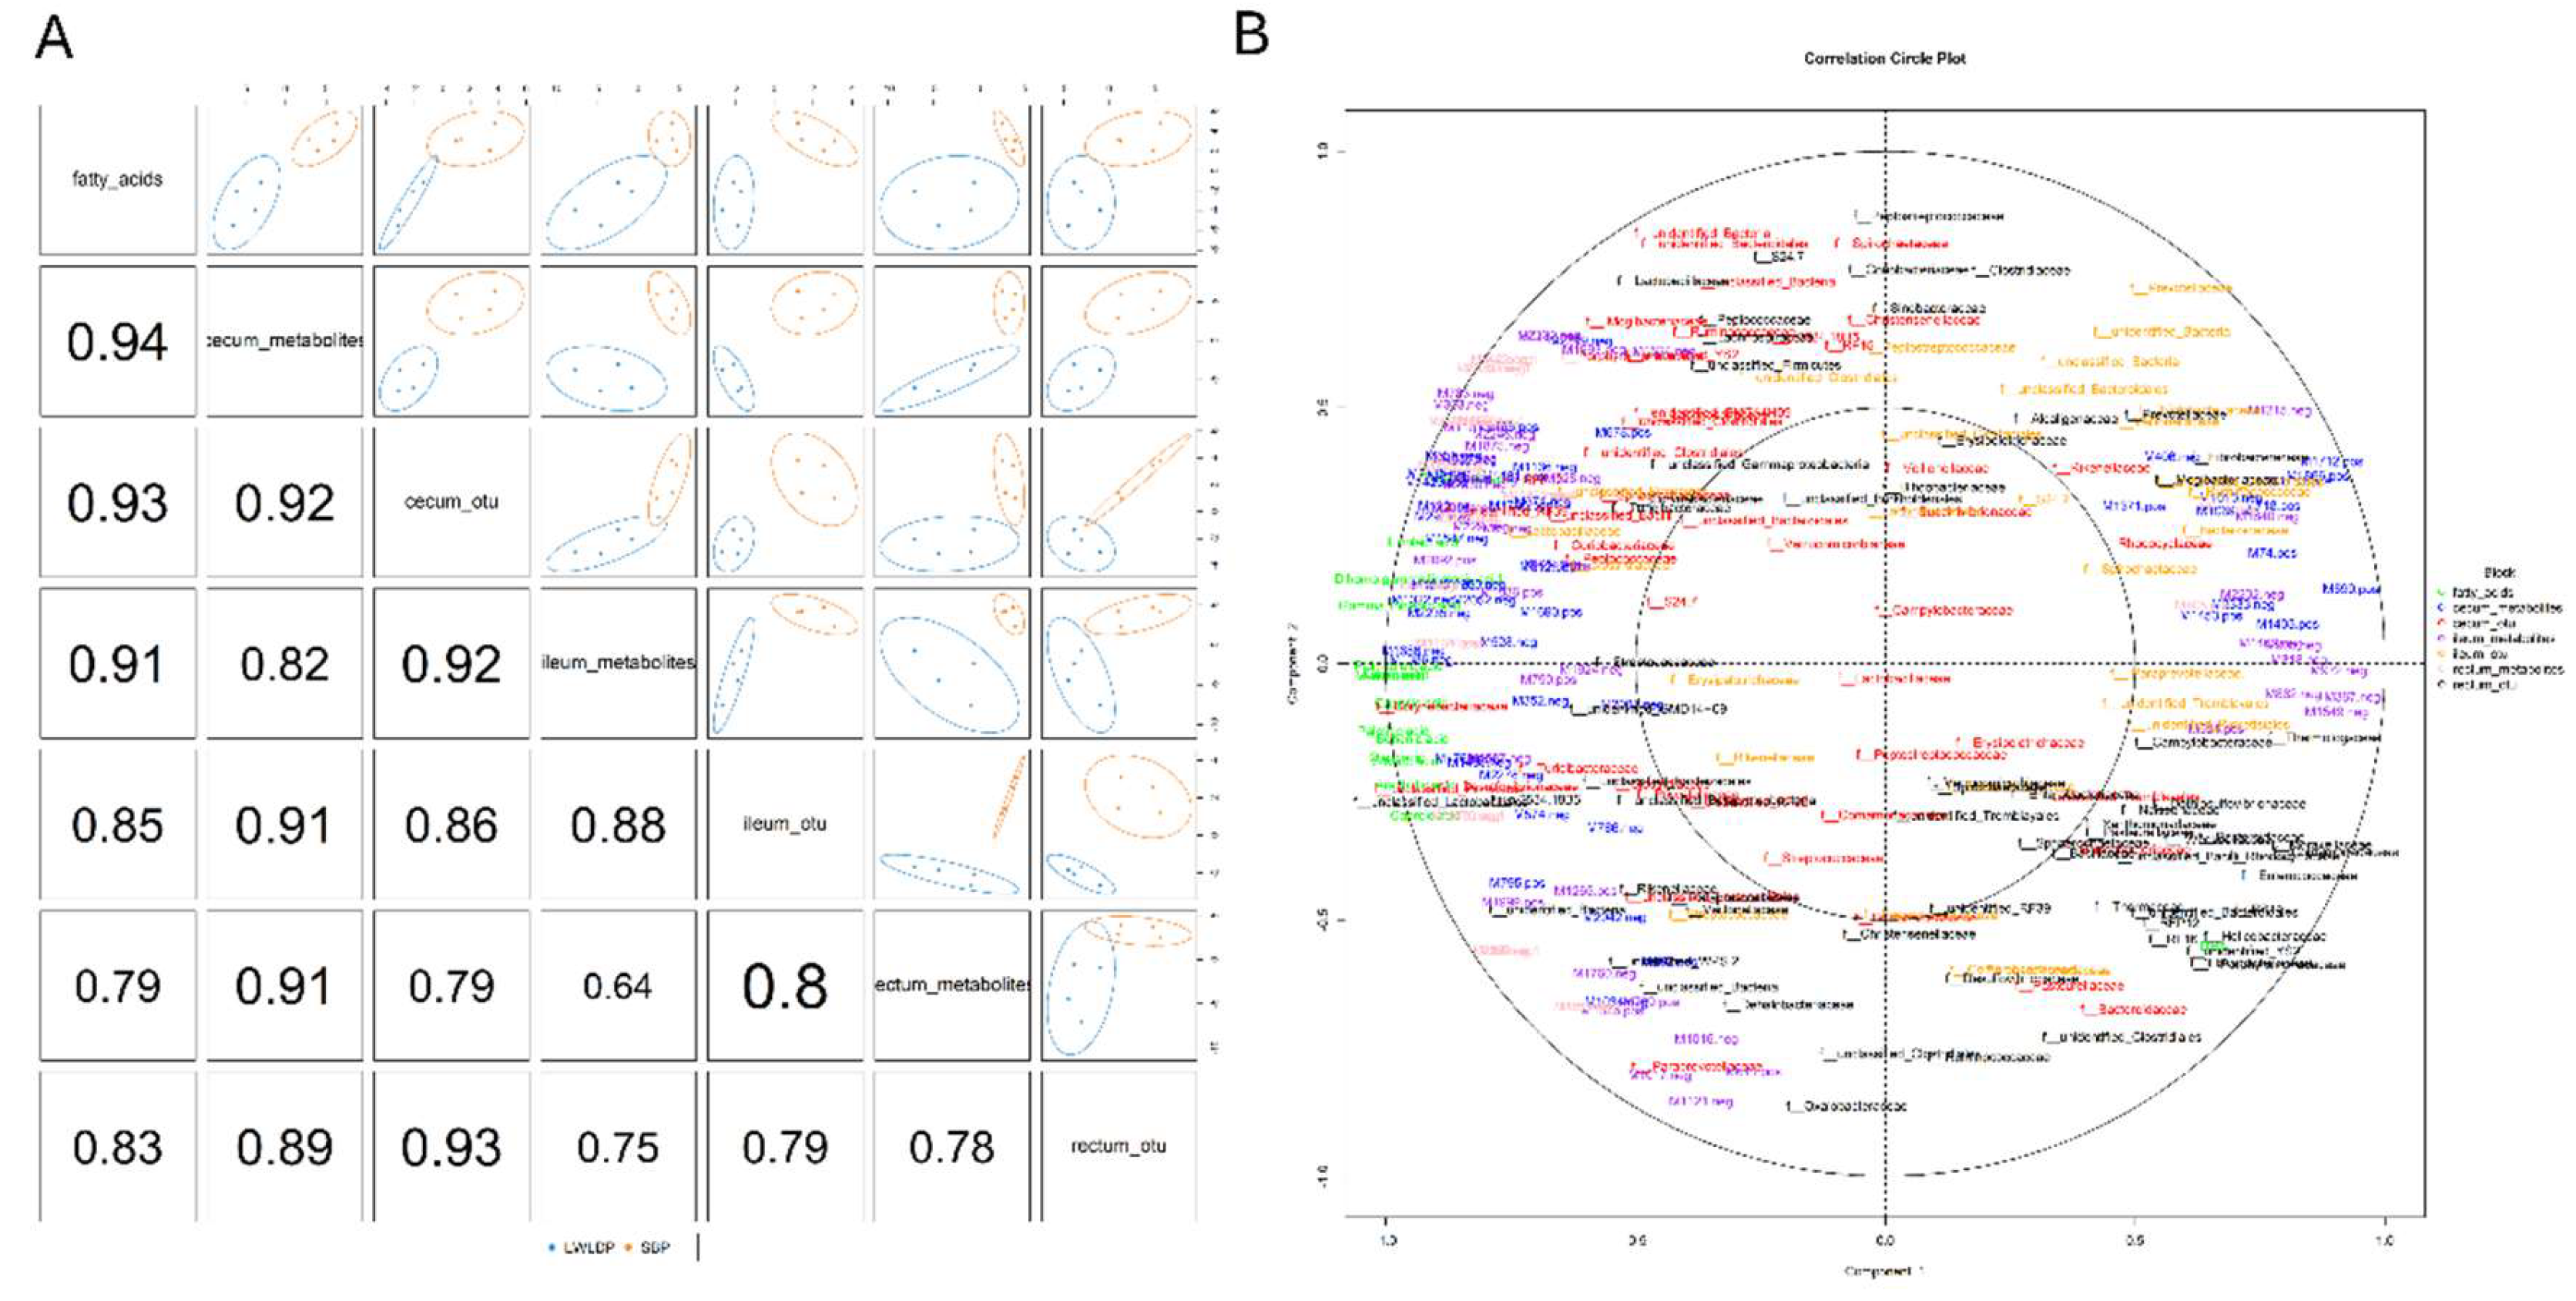
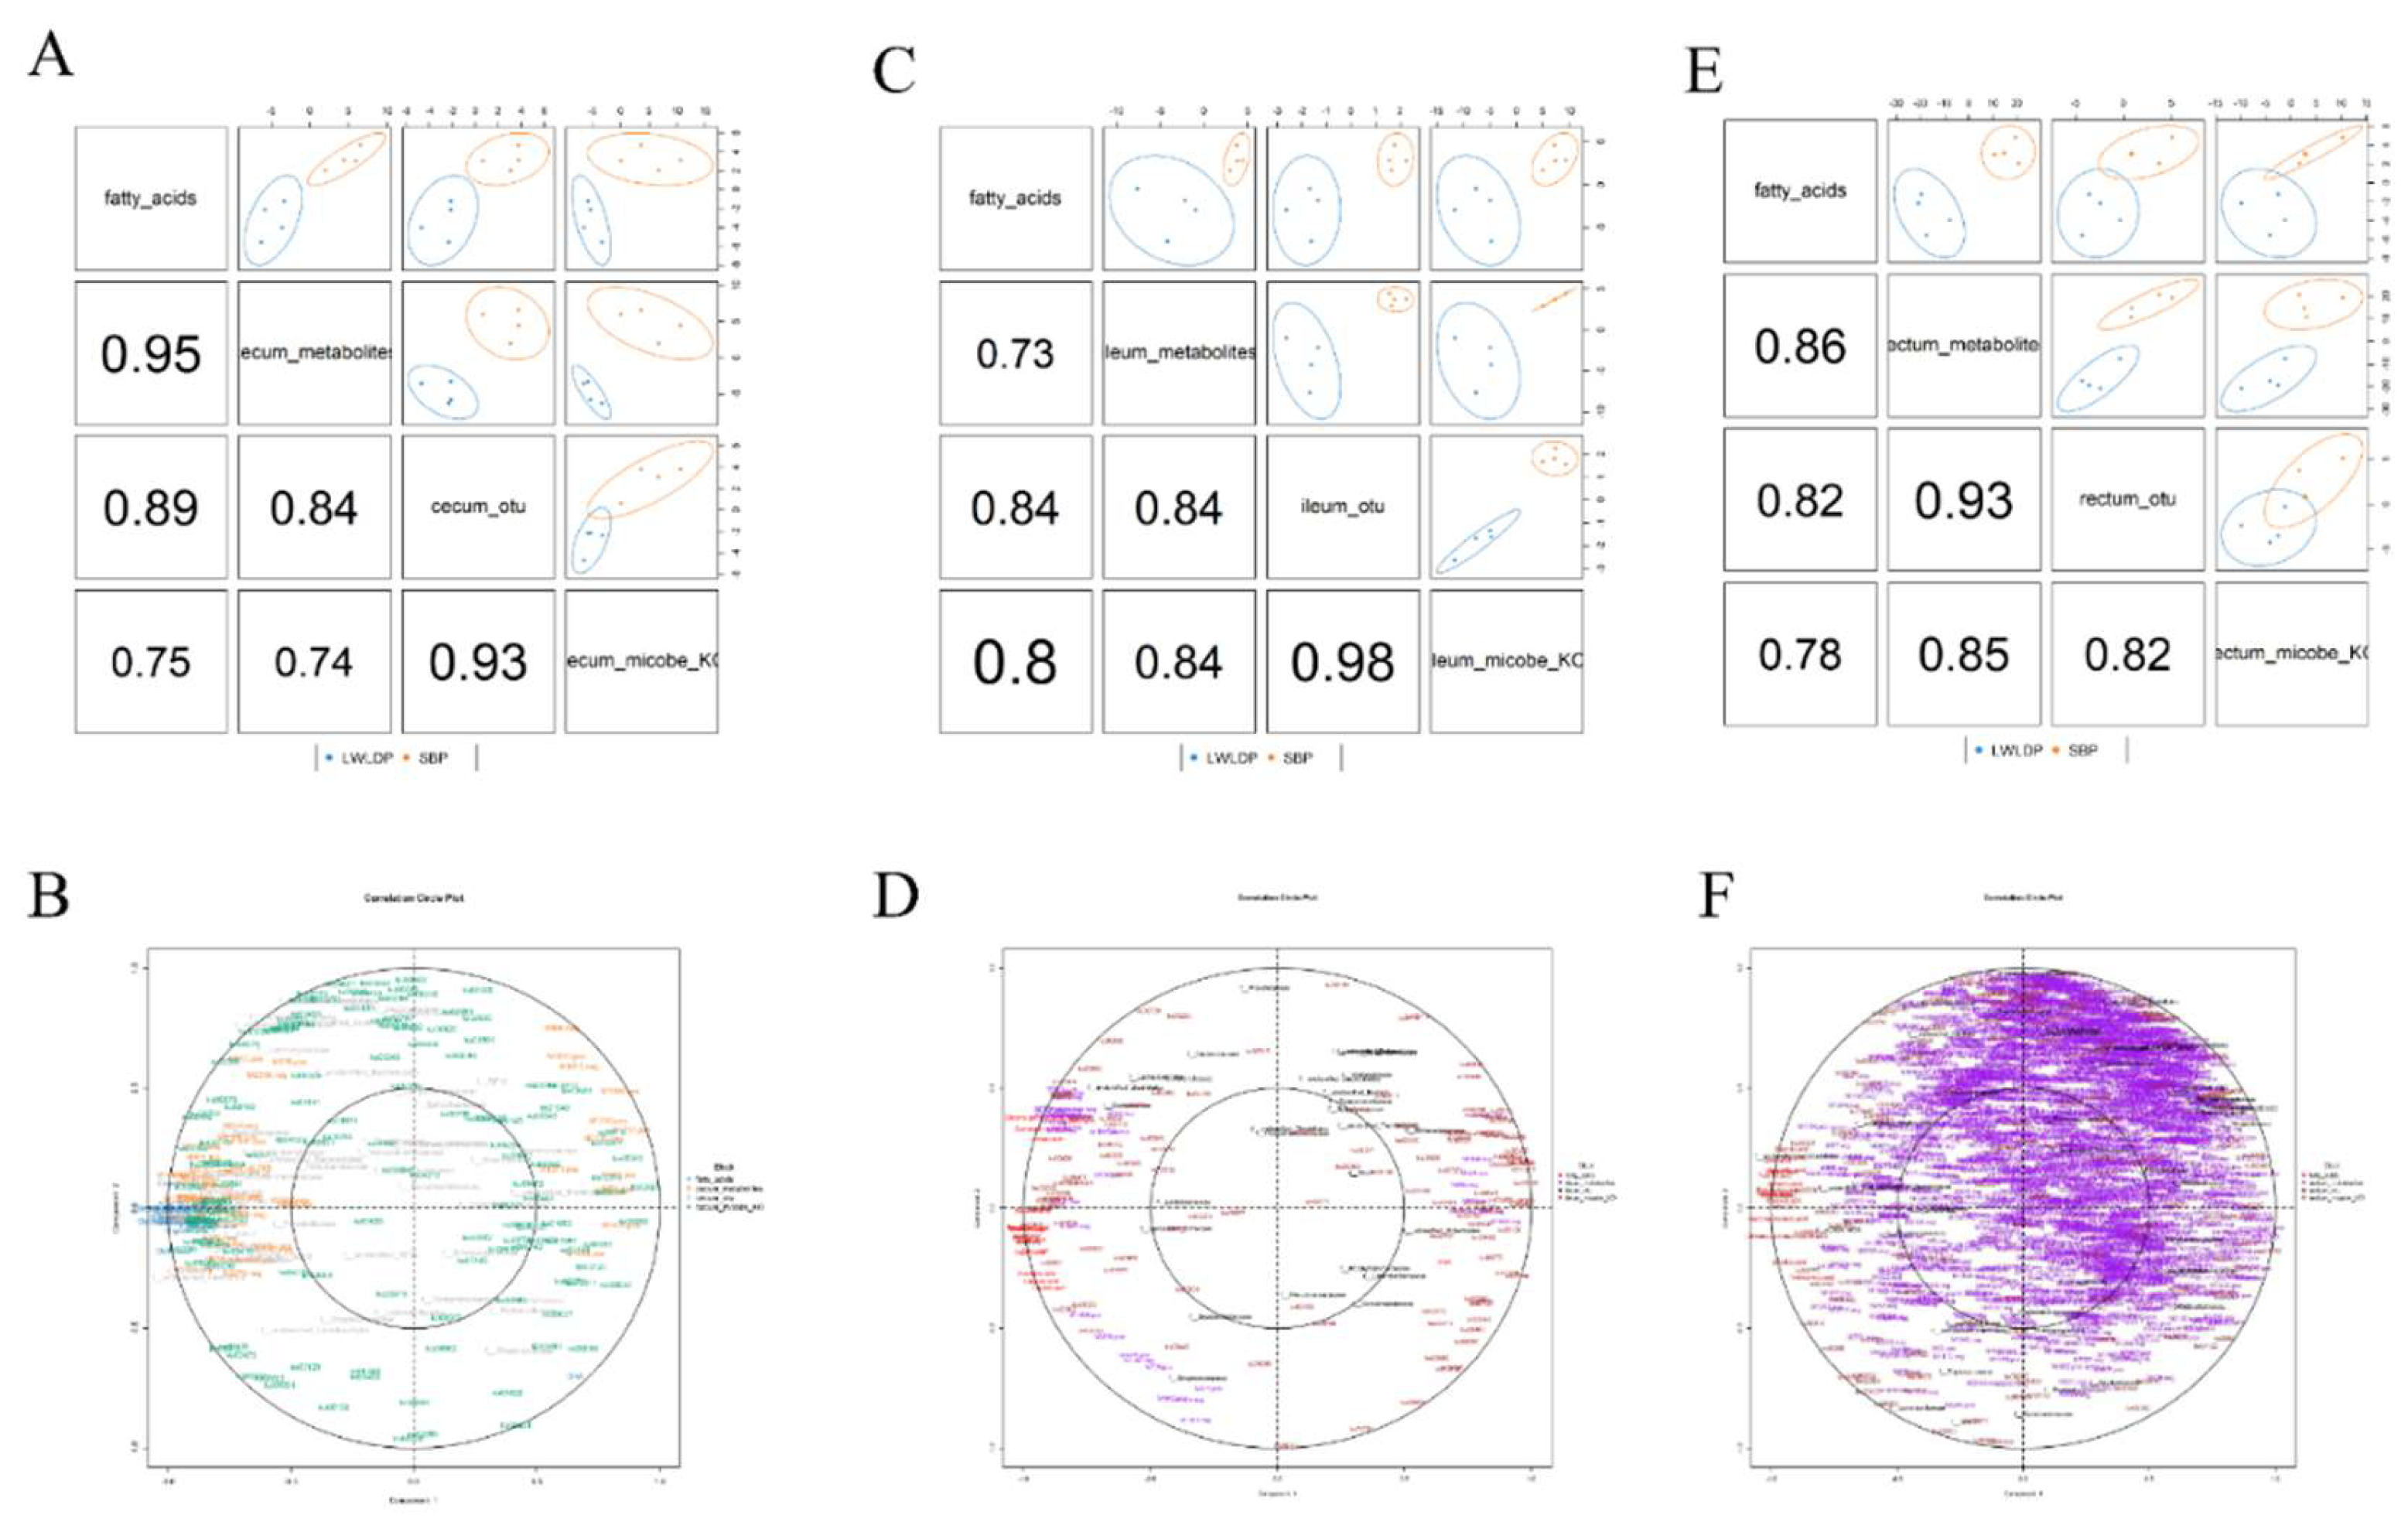
DIABLO model identified several significant correlations between fatty acids, intestinal metabolites, and microbial taxa across different sections of the intestine (cecum, ileum, and rectum) (Figure 5A). rCCA plot reveals that docosahexaenoic acid (DHA) was closely associated with the cecum metabolite 3-Benzylpiperidine, rectum metabolite Salicylic acid beta-D-glucoside and microbial family dethiosulfovibrionaceae in the rectum. Additionally, saturated fatty acids such as stearic acid, behenic acid, caprylic acid, palmitic acid, and oleic acid showed strong positive associations with cecum microbial taxa, specifically unclassified firmicutes and corynebacteriaceae, and cecum metabolites like Halofenozide and Dopamine 4-beta-D-glucuronide. In the ileum, fatty acids such as myristic acid, capric acid, lauric acid, and palmitoleic acid were linked to the metabolite 4-Hydroxy-3-[(E)-7-hydroxy-3,7-dimethyl-4-oxooct-5-enyl]-5-[(E)-4-hydroxy-3-methylbut-2-enyl] benzoic acid and the microbial family clostridiaceae. In the rectum, metabolites such as Val-Asn, 3-(Dodecylsulfonyl) propanoic acid and 2-Methyl-3-hydroxybutyric acid were associated with microbial taxa F_unidentified_WPS-2 and enterobacteriaceae. Additionally, associations of di-homo gamma-linolenic acid, linoleic acid, and gamma-linolenic acid with cecum metabolites like 1-O-(2-Amino-2-deoxy-alpha-D-glucopyranosyl)-1D-myo-inositol and Stearic acid highlight a potential role in modulating carbohydrate metabolism or influencing lipid storage and energy balance, which are crucial factors for growth and meat quality in pigs (Figure 5B).

3.4.2. MixOmics Analysis of Different Regions of Intestine

MixOmics correlation analysis across different sections of the intestine to identify significant relationships between fatty acids, metabolites, microbial taxa, and KO pathways with 0.75 correlation threshold (Figure 6). Cecum (Figure 6A-B) shows several critical interactions. All of significant Fatty acids of LWLDP were strongly associated with glucose, galactose, 1,3-dihydroxy-7,8,9,10-tetrahydro-6H-benzo[c]chromen-6-one, and 4-(β-D-glucopyranosyloxy) phenyl) acetic acid metabolites, Corynebacteriaceae, Mogibacteriaceae, unidentified_YS2, and Coriobacteriaceae microbial family and microbial pathways such as glycerolipid metabolism, starch and sucrose metabolism, sphingolipid metabolism, terpenoid backbone biosynthesis, aminoacyl-tRNA biosynthesis, D-glutamine and D-glutamate metabolism, protein export, and ribosome-related functions. These interactions suggest significant microbial and metabolic contributions to fatty acid composition in the cecum. Ileum (Figure 6C,D) shows a distinct set of correlations. Fatty acids such as di-homo-gamma-linolenic acid, gamma-linolenic acid, linoleic acid, and tridecanoic acid were associated with progabide, mangostine, isoferulic acid, fenoldopam, N-(5-chloro-2-hydroxyphenyl)-2-(phenylthio) acetamide, 1-methyl-1H-pyrazolo[3,4-d] pyrimidin-4-ol, N-(2-methylphenyl) benzenesulfonamide, N-acetylmuramic acid, 2-[(2E,6E,10E)-14,15-dihydroxy 3, 7, 11, 15-tetra methyl hexadeca 2, 6, 1 trienyl]-2,4,6,9-tetra hydroxy-5,7 dimethylphenalene-1,3-dione, 2-(4-benzoyl-3-hydroxyphenoxy)ethyl acrylate, gamma-glutamylglutamic acid, 5-ethyl-N-phenyl-2-pyridinecarbothioamide, isomucronulatol, glucuronic acid, and 16-phenoxytetranorprostaglandin F2α metabolites, such as Clostridiaceae, unidentified_Clostridiales, and Lachnospiraceae microbial families and Key KO pathways associated with these microbes included carbon fixation, cell cycle (Caulobacter), butanoate and propanoate metabolism, taurine and hypotaurine metabolism, and both primary and secondary bile acid biosynthesis, pointing to their involvement in complex lipid and energy metabolism in the ileum. In rectum (Figure 6E,F), several fatty acids, including caproic acid, oleic acid, arachidic acid, stearic acid, palmitic acid, behenic acid, palmitoleic acids, myristic acid, lauric acid, capric acid, and caprylic acid were closely linked to unclassified_Lactobacillales family and KO pathways included purine metabolism, pyrimidine metabolism, starch and sucrose metabolism, and inositol phosphate metabolism affect to fatty acid regulation. Additionally, the metabolite phosphate was strongly correlated with lipid metabolism, suggesting a potential role in energy metabolism and signaling pathways. Other fatty acids such as gamma-linolenic acid, di-homo-gamma-linolenic acid, linoleic acid, and tridecanoic acid were influenced by the microbial family f_p.2534.18B5, which was linked to KO pathways like plant hormone signal transduction, ascorbate and aldarate metabolism, proteasome, and photosynthesis. These pathways are involved in stress response, protein degradation, and secondary metabolite biosynthesis, which may affect fatty acid composition through host-microbe interactions. Metabolites 2.4-dichlorobenzoic acid, allolithocholic acid, saluamine, and 5-benzoyl-4-hydroxy-2-methoxybenzenesulfonic acid were associated with these fatty acids, suggesting their role in modulating lipid metabolism in the rectum. DHA in the rectum was particularly linked to the microbial group unidentified_Bacteroidales and KO pathways such as ubiquinone and other terpenoid-quinone biosynthesis, and riboflavin metabolism, highlighting the involvement of these microbes in redox balance and cofactor biosynthesis, crucial for fatty acid metabolism. Additional metabolites, including His-Phe, N-(4-nitrophenyl)-2-phenoxyacetamide, LTB4, N-(2-phosphate-1R-methylethyl)-5Z,8Z,11Z,14Z-eicosatetraenamide, mesotrione, N-[(ethoxycarbonyl)methyl]-p-menthane-3-carboxamide, serine, betaine aldehyde, 5-chloro-2-furoic acid, and N-carbamylglutamate, were also closely associated with these pathways.

4. Discussion

This study compared the gut microbiota, metabolites, and fatty acids of the longissimus dorsi muscle in Songliao Black Pigs (SBP) and Large White × Landrace pigs (LWLDP), revealing distinct differences. Key microbial taxa and metabolites linked to fatty acid synthesis pathways were identified, suggesting their potential role in driving breed-specific meat quality traits.
The fatty acid profile comparison between SBP and LWLDP revealed notable breed-specific differences. SBP had higher docosahexaenoic acid (DHA), while LWLDP showed significantly higher levels of SFA, UFA, PUFA, MUFA, and TFA. Elevated saturated fatty acids and an imbalanced saturated-to-unsaturated ratio, as seen in LWLDP, may negatively affect meat quality and sensory traits [33,34]. Arachidonic acid (C20:4n-6) enhances meat flavor but, in high concentrations, can produce off-flavors, negatively affecting overall taste. Balancing its levels is crucial for optimal meat quality [35]. A high n-6/n-3 PUFA ratio above 4.0 poses health risks and reduces consumer acceptance due to less favorable flavor profiles in meat. Maintaining a lower ratio is essential for better health and taste quality [34]. While PUFAs like linoleic and alpha-linolenic acids have health benefits, excessive levels, especially of n-3 fatty acids, can cause undesirable, fishy flavors in pork, reducing consumer appeal [33,36]. DHA, an important n-3 PUFA, improves meat quality by enhancing fatty acid stability and offering anti-inflammatory benefits [37]. Higher DHA levels in SBP enhance marbling and tenderness, while the unfavorable saturated-to-unsaturated fatty acid balance in LWLDP, including caproic acid, may result in lower meat quality and undesirable flavors [34,35]. Higher SFA levels leading to paler meat and cooking loss and decreased tenderness [34]. Our previous research indicated that Songliao Black Pigs possess unique gene regulatory mechanisms that optimize fatty acid biosynthesis and catabolism, enhancing fatty acid deposition and meat quality. DHA is crucial for improving meat quality.
This study reveals novel correlations between fatty acids, intestinal metabolites, and microbial taxa across the cecum, ileum, and rectum. DHA was notably linked to the rectal metabolite salicylic acid beta-D-glucoside and the microbial family Dethiosulfovibrionaceae. Salicylic acid beta-D-glucoside stabilizes mitochondrial structures and regulates energy production and can contributing to improved fatty acid profiles and overall meat quality in pigs (https://hmdb.ca/metabolites/HMDB0041271). Salicylic acid beta-D-glucoside, a stored form of the plant signaling molecule salicylic acid, plays a key role in stress responses. It can be converted back to salicylic acid during stress, activating protective mechanisms that may contribute to stabilizing cellular functions and improving fatty acid profiles in pigs [38]. Glycosyltransferases, such as those producing salicylic acid beta-D-glucoside, are also present in gut microbiota and are vital for metabolizing dietary carbohydrates, including plant polysaccharides. These enzymes help break down complex carbohydrates, playing a key role in microbial metabolism and influencing gut health and fatty acid profiles in pigs [39,40]. The degradation of starch in the small intestine generates short linear and branched α-glucans latter poorly digestible, rendering them available to the gut microbiota, e.g., lactobacilli adapted to the small intestine and considered beneficial to health. This study unveils a previously unknown scheme of maltooligosaccharide (MOS) catabolism via the concerted activity of an 1,4-α-glucosyltransferase together with a classical hydrolase and a phosphorylase. The intriguing involvement of a glucosyltransferase likely allows the fine-tuning of the regulation of MOS catabolism for optimal harnessing of this key metabolic resource in the human small intestine. The study extends the suite of specificities that have been identified in GH13_31 and highlights amino acid signatures underpinning the evolution of 1,4-α-glucosyl transferases that have been recruited in the MOS catabolism pathway in lactobacilli [41]. Salicylic acid beta-D-glucoside's anti-inflammatory effects, combined with DHA's benefits, enhance meat quality and offer potential health advantages, improving both consumer acceptance and well-being [38]. DHA has significance impact on consumer health, such as DHA, the most abundant omega-3 in the brain and retina, is essential for neural and visual health [42]. DHA enhances brain cell communication by increasing membrane fluidity, promoting faster nerve impulse transmission [43]. Adequate DHA levels are important for learning, memory, and cognitive performance [44]. It helps maintain normal heart function and blood pressure levels [45]. It also supports healthy blood triglyceride levels [46]. DHA's anti-inflammatory properties benefit cardiovascular health and help prevent microbial contamination in meat, enhancing its long-term storage [37]. DHA enriches the lipid composition of meat, lowers blood lipid levels, and promotes a healthier option for consumers, supporting public health recommendations for increased omega-3 intake [47,48]. We hypothesized that salicylic acid beta-D-glucoside and Dethiosulfovibrionaceae play key roles in boosting omega-3 fatty acid content in pork, enhancing meat quality and promoting consumer health.
Saturated fatty acids like stearic, behenic, and palmitic acids are strongly linked to cecal unclassified Firmicutes, Corynebacteriaceae and metabolites such as dopamine 4-beta-D-glucuronide, highlighting their role in neurotransmitter systems that influence energy balance and fat metabolism [49]. While a direct link between dopamine 4-beta-D-glucuronide and energy balance in muscle deposition was not identified, dopamine's broader role in energy metabolism and peripheral interactions supports understanding these relationships [50]. Our findings indicate that cecal microbial communities influence fatty acid production and modification. Metabolites like dopamine derivatives link microbial activity to lipid metabolism, affecting long-chain saturated fatty acid composition in pork. This underscores the cecal microbiome's role in regulating fatty acid profiles, directly impacting meat quality traits such as marbling and fat content. In the ileum, significant correlations were found between myristic, capric, and lauric acids and the metabolite 4-Hydroxy-3-[(E)-7-hydroxy-3,7-dimethyl-4-oxooct-5-enyl]-5-[(E)-4-hydroxy-3-methylbut-2-enyl] benzoic acid, linked to the microbial family Clostridiaceae. Previous studies show that benzoic acid enhances nutrient digestibility by improving mucosal structure, digesta pH, and digestive enzyme activity, benefiting both humans and animals [51]. The microbial family Clostridiaceae is known to be involved in the metabolism of various fatty acids [52]. This indicates that the ileum is vital for the digestion and absorption of medium-chain fatty acids, impacting fat deposition and energy balance in pigs. Such microbial-metabolite interactions could elucidate the observed variations in fatty acid profiles between pig breeds.
Integrative analysis of cecal microbes and metabolites find out key interactions with fatty acids in LWLDP, linking significant fatty acids to metabolites like glucose and 4-(β-D-glucopyranosyloxy) phenyl acetic acid, as well as microbial families such as Corynebacteriaceae. Important pathways include glycerolipid and starch metabolism, underscoring the microbiota's role in fiber digestion through cecal fermentation [53], which break down various types of carbohydrates [54]. Previous study found that bacterial species intake lactate and succinate and convert them into propionates [55]. Abundance of Bacteroides spp. is associated with production of propionate [56], while butyrate is produced mainly by the Firmicutes phylum [57]. These interactions suggest significant microbial and metabolic contributions to fatty acid composition in the cecum. Ileum shows distinct correlations with fatty acids such as di-homo-gamma-linolenic acid, gamma-linolenic acid, linoleic acid, and tridecanoic acid, linked to metabolites like progabide and isoferulic acid, as well as microbial families including Clostridiaceae and Lachnospiraceae. Key KO pathways associated with these microbes’ involved butanoate and propanoate metabolism and bile acid biosynthesis, highlighting their role in lipid and energy metabolism. Notably, polyunsaturated fatty acids (PUFAs) like gamma-linolenic acid (GLA) and linoleic acid (LA) are crucial for anti-inflammatory processes and cellular signaling, influencing gut microbiota composition and activity, ultimately impacting host metabolism and meat quality [58]. Di-homo-gamma-linolenic acid, a derivative of GLA, has been shown to impact inflammatory responses and may play a role in the regulation of lipid metabolism [59]. The identified microbial families, particularly Clostridiaceae and Lachnospiraceae, are known for their role in fermenting dietary fibers and producing short-chain fatty acids (SCFAs) such as butyrate and propionate [58]. Moreover, key KEGG pathways associated with these microbes, such as butanoate and propanoate metabolism, indicate their involvement in the conversion of dietary components into bioactive metabolites that can influence host metabolism [60,61]. The metabolites identified, such as progabide and isoferulic acid, may modulate metabolic pathways, linking gut microbiota activity to energy balance and appetite regulation. This suggests that dietary interventions targeting specific fatty acids and promoting a healthy gut microbiome could improve both metabolic health and meat quality. Future research should explore these interactions further, considering their implications for obesity, and the nutritional profile of meat. Rectum fatty acids including caproic, oleic, arachidic, stearic, palmitic, behenic, palmitoleic, myristic, lauric, capric, and caprylic acids exhibited strong associations with the unclassified Lactobacillales family. Key KEGG pathways implicated included purine and pyrimidine metabolism, starch and sucrose metabolism, and inositol phosphate metabolism, underscoring their roles in fatty acid regulation. Moreover, the metabolite phosphate demonstrated a significant correlation with lipid metabolism, suggesting its involvement in energy homeostasis and signaling cascades. This association indicates the microbiota's potential influence on fatty acid profiles, as previous studies have highlighted the role of gut bacteria in fermenting non-digestible substrates to produce short-chain fatty acids (SCFAs), thereby modulating host lipid metabolism [21]. Specific microbial genera, such as Prevotella and Akkermansia, are linked to short-chain fatty acid (SCFA) production, which plays a critical role in lipid metabolism. For instance, Prevotella spp. are positively associated with butyric acid, whereas Akkermansia spp. exhibit a negative correlation with it. This interplay suggests that the balance of these microbial populations significantly influences the host's fatty acid composition [21]. Purine and pyrimidine metabolism, alongside starch, sucrose, and inositol phosphate metabolism, are essential for cellular functions and energy production. Their link to fatty acid regulation suggests that gut microbiota can modulate these pathways, impacting lipid metabolism. Additionally, the correlation of phosphate metabolites with lipid metabolism underscores the role of phosphate groups in energy transfer and metabolic regulation [62]. Interplay between gut microbiota and fatty acid profiles in the rectum highlights the microbiota's role in lipid metabolism, which can significantly enhance meat quality traits such as flavor and marbling through targeted dietary interventions.

5. Conclusions

Our findings contribute that gut microbiome plays a crucial role in regulating fatty acid profile and meat quality. Observed correlations between microbial taxa, metabolites, and fatty acids suggest that specific microbial communities, particularly in the cecum and rectum, may serve as biomarkers for selecting pigs with superior fatty acid profiles and meat quality traits. For instance, microbial taxa like Dethiosulfovibrionaceae and unclassified Firmicutes could be targeted for modulation through dietary interventions or breeding strategies to enhance the synthesis of beneficial fatty acids like DHA. Moreover, the identification of novel microbial taxa and metabolites associated with fatty acids offers potential avenues for future research. especially role of Salicylic acid beta-D-glucoside in DHA metabolism is needed to further investigate, particularly in its potential as a modulator of lipid metabolism in pigs. Understanding how these microbial and metabolite interactions influence fatty acid composition could lead to the development of microbiota-based interventions aimed at improving meat quality.

Supplementary Materials

The following supporting information can be downloaded at the website of this paper posted on Preprints.org.

Author Contributions

Conceptualization, TKS.; methodology, TKS., YZ. and SMZ.; software, TKS.; validation, TKS., and YZ.; formal analysis, TKS.; investigation, TKS., YPZ., YLZ., and XJ.; resources, YZ and SMZ.; data curation, YZ and SMZ.; writing—original draft preparation, TKS.; writing—review, TKS, SMZ., YZ and WSS.; editing, WSS, ZQ.; visualization, TKS., ZYZ., and ML.; supervision, SMZ.; project administration, SMZ., and YZ.; funding acquisition, SMZ., and YZ.

Funding

This work was supported by the National Key Research and Development Program of China (2023YFF1001000) and the Key Technology Research and Development Program of Jilin Province of China (20240303066NC).

Institutional Review Board Statement

All animal procedures were applied as per guidelines approved by the Institutional Animal Care and Use Committee (IACUC) of the Jilin Agricultural University. The study protocol was approved by the IACUC under approval number (KT2023023).

Informed Consent Statement

Informed consent was not applicable to this study as it did not involve human participants.

Data Availability Statement

The dataset used and/or analyzed during the current study are available from the corresponding author on reasonable request.

Acknowledgments

We are special thankful of Gongzhuling Gaojin Food Co., Ltd slaughtering company for supporting in sample collection and providing us clean environment.

Conflicts of Interest

The authors declare no competing interests.

References

  1. Barbut, S. Automation and meat quality-global challenges. Meat science 2014, 96, 335–345. [Google Scholar] [CrossRef]
  2. Wu, Y.; Zhao, J.; Xu, C.; Ma, N.; He, T.; Zhao, J.; Ma, X.; Thacker, P.A. Progress towards pig nutrition in the last 27 years. Journal of the Science of Food and Agriculture 2020, 100, 5102–5110. [Google Scholar] [CrossRef]
  3. Zhang, Y.; Zhang, J.; Gong, H.; Cui, L.; Zhang, W.; Ma, J.; Chen, C.; Ai, H.; Xiao, S.; Huang, L. Genetic correlation of fatty acid composition with growth, carcass, fat deposition and meat quality traits based on GWAS data in six pig populations. Meat Science 2019, 150, 47–55. [Google Scholar] [CrossRef]
  4. Wood, J.; Richardson, R.; Nute, G.; Fisher, A.; Campo, M.; Kasapidou, E.; Sheard, P.; Enser, M. Effects of fatty acids on meat quality: a review. Meat science 2004, 66, 21–32. [Google Scholar] [CrossRef]
  5. Kimura, I.; Ozawa, K.; Inoue, D.; Imamura, T.; Kimura, K.; Maeda, T.; Terasawa, K.; Kashihara, D.; Hirano, K.; Tani, T. The gut microbiota suppresses insulin-mediated fat accumulation via the short-chain fatty acid receptor GPR43. Nature communications 2013, 4, 1829. [Google Scholar] [CrossRef]
  6. Parséus, A.; Sommer, N.; Sommer, F.; Caesar, R.; Molinaro, A.; Ståhlman, M.; Greiner, T.U.; Perkins, R.; Bäckhed, F. Microbiota-induced obesity requires farnesoid X receptor. Gut 2017, 66, 429–437. [Google Scholar] [CrossRef]
  7. Yin, J.; Li, Y.; Han, H.; Ma, J.; Liu, G.; Wu, X.; Huang, X.; Fang, R.; Baba, K.; Bin, P. Administration of exogenous melatonin improves the diurnal rhythms of the gut microbiota in mice fed a high-fat diet. Msystems 2020, 5. [Google Scholar] [CrossRef]
  8. Icaza-Chávez, M. Gut microbiota in health and disease. Revista de Gastroenterología de México (English Edition) 2013, 78, 240–248. [Google Scholar] [CrossRef]
  9. Jandhyala, S.M.; Talukdar, R.; Subramanyam, C.; Vuyyuru, H.; Sasikala, M.; Reddy, D.N. Role of the normal gut microbiota. World journal of gastroenterology: WJG 2015, 21, 8787. [Google Scholar] [CrossRef]
  10. Yadav, S.; Jha, R. Strategies to modulate the intestinal microbiota and their effects on nutrient utilization, performance, and health of poultry. Journal of animal science and biotechnology 2019, 10, 1–11. [Google Scholar] [CrossRef]
  11. Balfour Sartor, R.; Muehlbauer, M. Microbial host interactions in IBD: implications for pathogenesis and therapy. Current gastroenterology reports 2007, 9, 497–507. [Google Scholar] [CrossRef]
  12. Morowitz, M.J.; Carlisle, E.M.; Alverdy, J.C. Contributions of intestinal bacteria to nutrition and metabolism in the critically ill. Surgical Clinics 2011, 91, 771–785. [Google Scholar] [CrossRef]
  13. Xie, G.; Zhang, S.; Zheng, X.; Jia, W. Metabolomics approaches for characterizing metabolic interactions between host and its commensal microbes. Electrophoresis 2013, 34, 2787–2798. [Google Scholar] [CrossRef]
  14. Demain, A.L.; Fang, A. The natural functions of secondary metabolites. History of modern biotechnology I 2000, 1–39. [Google Scholar] [CrossRef]
  15. Roessner, U.; Dias, D.A. Metabolomics tools for natural product discovery; Springer: 2013.
  16. Zhao, W.; Wang, Y.; Liu, S.; Huang, J.; Zhai, Z.; He, C.; Ding, J.; Wang, J.; Wang, H.; Fan, W. The dynamic distribution of porcine microbiota across different ages and gastrointestinal tract segments. PloS one 2015, 10, e0117441. [Google Scholar] [CrossRef]
  17. Yang, H.; Huang, X.; Fang, S.; Xin, W.; Huang, L.; Chen, C. Uncovering the composition of microbial community structure and metagenomics among three gut locations in pigs with distinct fatness. Scientific reports 2016, 6, 27427. [Google Scholar] [CrossRef]
  18. Kelly, J.; Daly, K.; Moran, A.W.; Ryan, S.; Bravo, D.; Shirazi-Beechey, S.P. Composition and diversity of mucosa-associated microbiota along the entire length of the pig gastrointestinal tract; dietary influences. Environmental microbiology 2017, 19, 1425–1438. [Google Scholar] [CrossRef]
  19. Xiao, Y.; Kong, F.; Xiang, Y.; Zhou, W.; Wang, J.; Yang, H.; Zhang, G.; Zhao, J. Comparative biogeography of the gut microbiome between Jinhua and Landrace pigs. Scientific reports 2018, 8, 5985. [Google Scholar] [CrossRef]
  20. Yang, H.; Wu, J.; Huang, X.; Zhou, Y.; Zhang, Y.; Liu, M.; Liu, Q.; Ke, S.; He, M.; Fu, H. ABO genotype alters the gut microbiota by regulating GalNAc levels in pigs. Nature 2022, 606, 358–367. [Google Scholar] [CrossRef]
  21. Sebastià, C.; Folch, J.M.; Ballester, M.; Estellé, J.; Passols, M.; Muñoz, M.; García-Casco, J.M.; Fernández, A.I.; Castelló, A.; Sánchez, A. Interrelation between gut microbiota, SCFA, and fatty acid composition in pigs. Msystems 2024, 9, e01049-01023. [Google Scholar] [CrossRef]
  22. Hwang, Y.-H.; Lee, E.-Y.; Lim, H.-T.; Joo, S.-T. Multi-Omics Approaches to Improve Meat Quality and Taste Characteristics. Food Science of Animal Resources 2023, 43, 1067. [Google Scholar] [CrossRef]
  23. Wu, J.; Yang, D.; Gong, H.; Qi, Y.; Sun, H.; Liu, Y.; Liu, Y.; Qiu, X. Multiple omics analysis reveals that high fiber diets promote gluconeogenesis and inhibit glycolysis in muscle. BMC genomics 2020, 21, 1–13. [Google Scholar] [CrossRef]
  24. Muroya, S. An insight into farm animal skeletal muscle metabolism based on a metabolomics approach. Meat science 2023, 195, 108995. [Google Scholar] [CrossRef]
  25. Yin, J.; Li, Y.; Tian, Y.; Zhou, F.; Ma, J.; Xia, S.; Yang, T.; Ma, L.; Zeng, Q.; Liu, G. Obese Ningxiang pig-derived microbiota rewires carnitine metabolism to promote muscle fatty acid deposition in lean DLY pigs. The Innovation 2023, 4. [Google Scholar] [CrossRef]
  26. Liu LiGang, L.L.; Zhang ShuMin, Z.S.; Li ZhaoHua, L.Z.; Li Na, L.N.; Jin Xin, J.X.; Yu YongSheng, Y.Y.; Zhao XiaoDong, Z.X. Comparative study on growing-finishing performance and meat quality of different hybrid combinations in pigs. 2009.
  27. Tang, D.; Chen, M.; Huang, X.; Zhang, G.; Zeng, L.; Zhang, G.; Wu, S.; Wang, Y. SRplot: A free online platform for data visualization and graphing. PLoS One 2023, 18, e0294236. [Google Scholar] [CrossRef]
  28. Hall, M.; Beiko, R.G. 16S rRNA gene analysis with QIIME2. Microbiome analysis: methods and protocols 2018, 113–129. [Google Scholar] [CrossRef]
  29. Chen, H.; Boutros, P.C. VennDiagram: a package for the generation of highly-customizable Venn and Euler diagrams in R. BMC bioinformatics 2011, 12, 1–7. [Google Scholar] [CrossRef]
  30. Gaude, E.; Chignola, F.; Spiliotopoulos, D.; Spitaleri, A.; Ghitti, M.; Garcìa-Manteiga, J.M.; Mari, S.; Musco, G. muma, an R package for metabolomics univariate and multivariate statistical analysis. Current Metabolomics 2013, 1, 180–189. [Google Scholar] [CrossRef]
  31. Caspi, R.; Billington, R.; Fulcher, C.A.; Keseler, I.M.; Kothari, A.; Krummenacker, M.; Latendresse, M.; Midford, P.E.; Ong, Q.; Ong, W.K. The MetaCyc database of metabolic pathways and enzymes. Nucleic acids research 2018, 46, D633–D639. [Google Scholar] [CrossRef]
  32. Rohart, F.; Gautier, B.; Singh, A.; Lê Cao, K.-A. mixOmics: An R package for ‘omics feature selection and multiple data integration. PLoS computational biology 2017, 13, e1005752. [Google Scholar] [CrossRef]
  33. Wood, J.D.; Enser, M. Factors influencing fatty acids in meat and the role of antioxidants in improving meat quality. British journal of Nutrition 1997, 78, S49–S60. [Google Scholar] [CrossRef]
  34. Hoa, V.B.; Cho, S.-H.; Seong, P.-N.; Kang, S.-M.; Kim, Y.-S.; Moon, S.-S.; Choi, Y.-M.; Kim, J.-H.; Seol, K.-H. Quality characteristics, fatty acid profiles, flavor compounds and eating quality of cull sow meat in comparison with commercial pork. Asian-Australasian journal of animal sciences 2020, 33, 640. [Google Scholar] [CrossRef]
  35. Cheng, L.; Li, X.; Tian, Y.; Wang, Q.; Li, X.; An, F.; Luo, Z.; Shang, P.; Liu, Z.; Huang, Q. Mechanisms of cooking methods on flavor formation of Tibetan pork. Food Chemistry: X 2023, 19, 100873. [Google Scholar] [CrossRef]
  36. Wang, L.; Huang, Y.; Wang, Y.; Shan, T. Effects of polyunsaturated fatty acids supplementation on the meat quality of pigs: a meta-analysis. Frontiers in nutrition 2021, 8, 746765. [Google Scholar] [CrossRef]
  37. Oppedisano, F.; Macrì, R.; Gliozzi, M.; Musolino, V.; Carresi, C.; Maiuolo, J.; Bosco, F.; Nucera, S.; Caterina Zito, M.; Guarnieri, L. The anti-inflammatory and antioxidant properties of n-3 PUFAs: Their role in cardiovascular protection. Biomedicines 2020, 8, 306. [Google Scholar] [CrossRef]
  38. Qi, R.; Pfeifer, B.A.; Zhang, G. Engineering heterologous production of salicylate glucoside and glycosylated variants. Frontiers in microbiology 2018, 9, 2241. [Google Scholar] [CrossRef]
  39. Wang, L.; Xu, H.; Yang, H.; Zhou, J.; Zhao, L.; Zhang, F. Glucose metabolism and glycosylation link the gut microbiota to autoimmune diseases. Frontiers in Immunology 2022, 13, 952398. [Google Scholar] [CrossRef]
  40. Takihara, H.; Okuda, S. Glycan-related genes in human gut microbiota exhibit differential distribution and diversity in carbohydrate degradation and glycan synthesis. Frontiers in Molecular Biosciences 2023, 10, 1137303. [Google Scholar] [CrossRef]
  41. Andersen, S.; Møller, M.S.; Poulsen, J.-C.N.; Pichler, M.J.; Svensson, B.; Lo Leggio, L.; Goh, Y.J.; Abou Hachem, M. An 1, 4-α-glucosyltransferase defines a new maltodextrin catabolism scheme in Lactobacillus acidophilus. Applied and Environmental Microbiology 2020, 86, e00661-00620. [Google Scholar] [CrossRef]
  42. Lacombe, R.S.; Chouinard-Watkins, R.; Bazinet, R.P. Brain docosahexaenoic acid uptake and metabolism. Molecular Aspects of Medicine 2018, 64, 109–134. [Google Scholar] [CrossRef]
  43. Sinclair, A.J. Docosahexaenoic acid and the brain-what is its role? Asia Pacific journal of clinical nutrition 2019, 28, 675–688. [Google Scholar]
  44. Kuratko, C.N.; Barrett, E.C.; Nelson, E.B.; Norman Jr, S. The relationship of docosahexaenoic acid (DHA) with learning and behavior in healthy children: a review. Nutrients 2013, 5, 2777–2810. [Google Scholar] [CrossRef]
  45. EFSA Panel on Dietetic Products, N.; Allergies. Scientific Opinion on the substantiation of health claims related to EPA, DHA, DPA and maintenance of normal blood pressure (ID 502), maintenance of normal HDL-cholesterol concentrations (ID 515), maintenance of normal (fasting) blood concentrations of triglycerides (ID 517), maintenance of normal LDL-cholesterol concentrations (ID 528, 698) and maintenance of joints (ID 503, 505, 507, 511, 518, 524, 526, 535, 537) pursuant to Article 13 (1) of Regulation (EC) No 1924/2006. EFSA Journal 2009, 7, 1263. [Google Scholar] [CrossRef]
  46. Holub, B.J. Docosahexaenoic acid (DHA) and cardiovascular disease risk factors. Prostaglandins, Leukotrienes and Essential Fatty Acids 2009, 81, 199–204. [Google Scholar] [CrossRef]
  47. Wahid, S.T.; Kim, I.H. Effect of DHA supplementation on broilers' growth performance, meat quality and blood profile. Journal of Animal Physiology and Animal Nutrition 2023, 107, 703–711. [Google Scholar] [CrossRef]
  48. Scollan, N.D.; Price, E.M.; Morgan, S.A.; Huws, S.A.; Shingfield, K.J. Can we improve the nutritional quality of meat? Proceedings of the Nutrition Society 2017, 76, 603–618. [Google Scholar] [CrossRef]
  49. Carta, G.; Murru, E.; Banni, S.; Manca, C. Palmitic acid: physiological role, metabolism and nutritional implications. Frontiers in physiology 2017, 8, 902. [Google Scholar] [CrossRef]
  50. Beeler, J.A.; Frazier, C.R.; Zhuang, X. Putting desire on a budget: dopamine and energy expenditure, reconciling reward and resources. Frontiers in integrative neuroscience 2012, 6, 49. [Google Scholar] [CrossRef]
  51. Mao, X.; Yang, Q.; Chen, D.; Yu, B.; He, J. Benzoic acid used as food and feed additives can regulate gut functions. BioMed research international 2019, 2019, 5721585. [Google Scholar] [CrossRef]
  52. Wankhade, U.D.; Zhong, Y.; Kang, P.; Alfaro, M.; Chintapalli, S.V.; Piccolo, B.D.; Mercer, K.E.; Andres, A.; Thakali, K.M.; Shankar, K. Maternal high-fat diet programs offspring liver steatosis in a sexually dimorphic manner in association with changes in gut microbial ecology in mice. Scientific reports 2018, 8, 16502. [Google Scholar] [CrossRef]
  53. Usuda, H.; Okamoto, T.; Wada, K. Leaky gut: effect of dietary fiber and fats on microbiome and intestinal barrier. International journal of molecular sciences 2021, 22, 7613. [Google Scholar] [CrossRef]
  54. Cantarel, B.L.; Lombard, V.; Henrissat, B. Complex carbohydrate utilization by the healthy human microbiome. PloS one 2012, 7, e28742. [Google Scholar] [CrossRef]
  55. Dalile, B.; Van Oudenhove, L.; Vervliet, B.; Verbeke, K. The role of short-chain fatty acids in microbiota–gut–brain communication. Nature reviews Gastroenterology & hepatology 2019, 16, 461–478. [Google Scholar] [CrossRef]
  56. Salonen, A.; Lahti, L.; Salojärvi, J.; Holtrop, G.; Korpela, K.; Duncan, S.H.; Date, P.; Farquharson, F.; Johnstone, A.M.; Lobley, G.E. Impact of diet and individual variation on intestinal microbiota composition and fermentation products in obese men. The ISME journal 2014, 8, 2218–2230. [Google Scholar] [CrossRef]
  57. Baothman, O.A.; Zamzami, M.A.; Taher, I.; Abubaker, J.; Abu-Farha, M. The role of gut microbiota in the development of obesity and diabetes. Lipids in health and disease 2016, 15, 1–8. [Google Scholar] [CrossRef]
  58. Silva, Y.; Bernardi, A.; Frozza, R. The role of short-chain fatty acids from gut microbiota in gut-brain communication. Front Endocrinol (Lausanne) 11: 25. 2020. ttps://doi.org/10.3389/fendo.2020.00025. [CrossRef]
  59. Metzler-Zebeli, B.U.; Klinsoda, J.; Vötterl, J.; Sharma, S.; Koger, S.; Sener-Aydemir, A. Short-, medium-, and long-chain fatty acid profiles and signaling is responsive to dietary phytase and lactic acid treatment of cereals along the gastrointestinal tract of growing pigs. Journal of animal science 2021, 99, skab117. [Google Scholar] [CrossRef]
  60. Zhang, L.S.; Davies, S.S. Microbial metabolism of dietary components to bioactive metabolites: opportunities for new therapeutic interventions. Genome medicine 2016, 8, 1–18. [Google Scholar] [CrossRef]
  61. Rowland, I.; Gibson, G.; Heinken, A.; Scott, K.; Swann, J.; Thiele, I.; Tuohy, K. Gut microbiota functions: metabolism of nutrients and other food components. European journal of nutrition 2018, 57, 1–24. [Google Scholar] [CrossRef]
  62. Reed, K.J.; Kunz, I.G.; Scare, J.A.; Nielsen, M.K.; Turk, P.J.; Coleman, R.J.; Coleman, S.J. The pelvic flexure separates distinct microbial communities in the equine hindgut. Scientific Reports 2021, 11, 4332. [Google Scholar] [CrossRef]
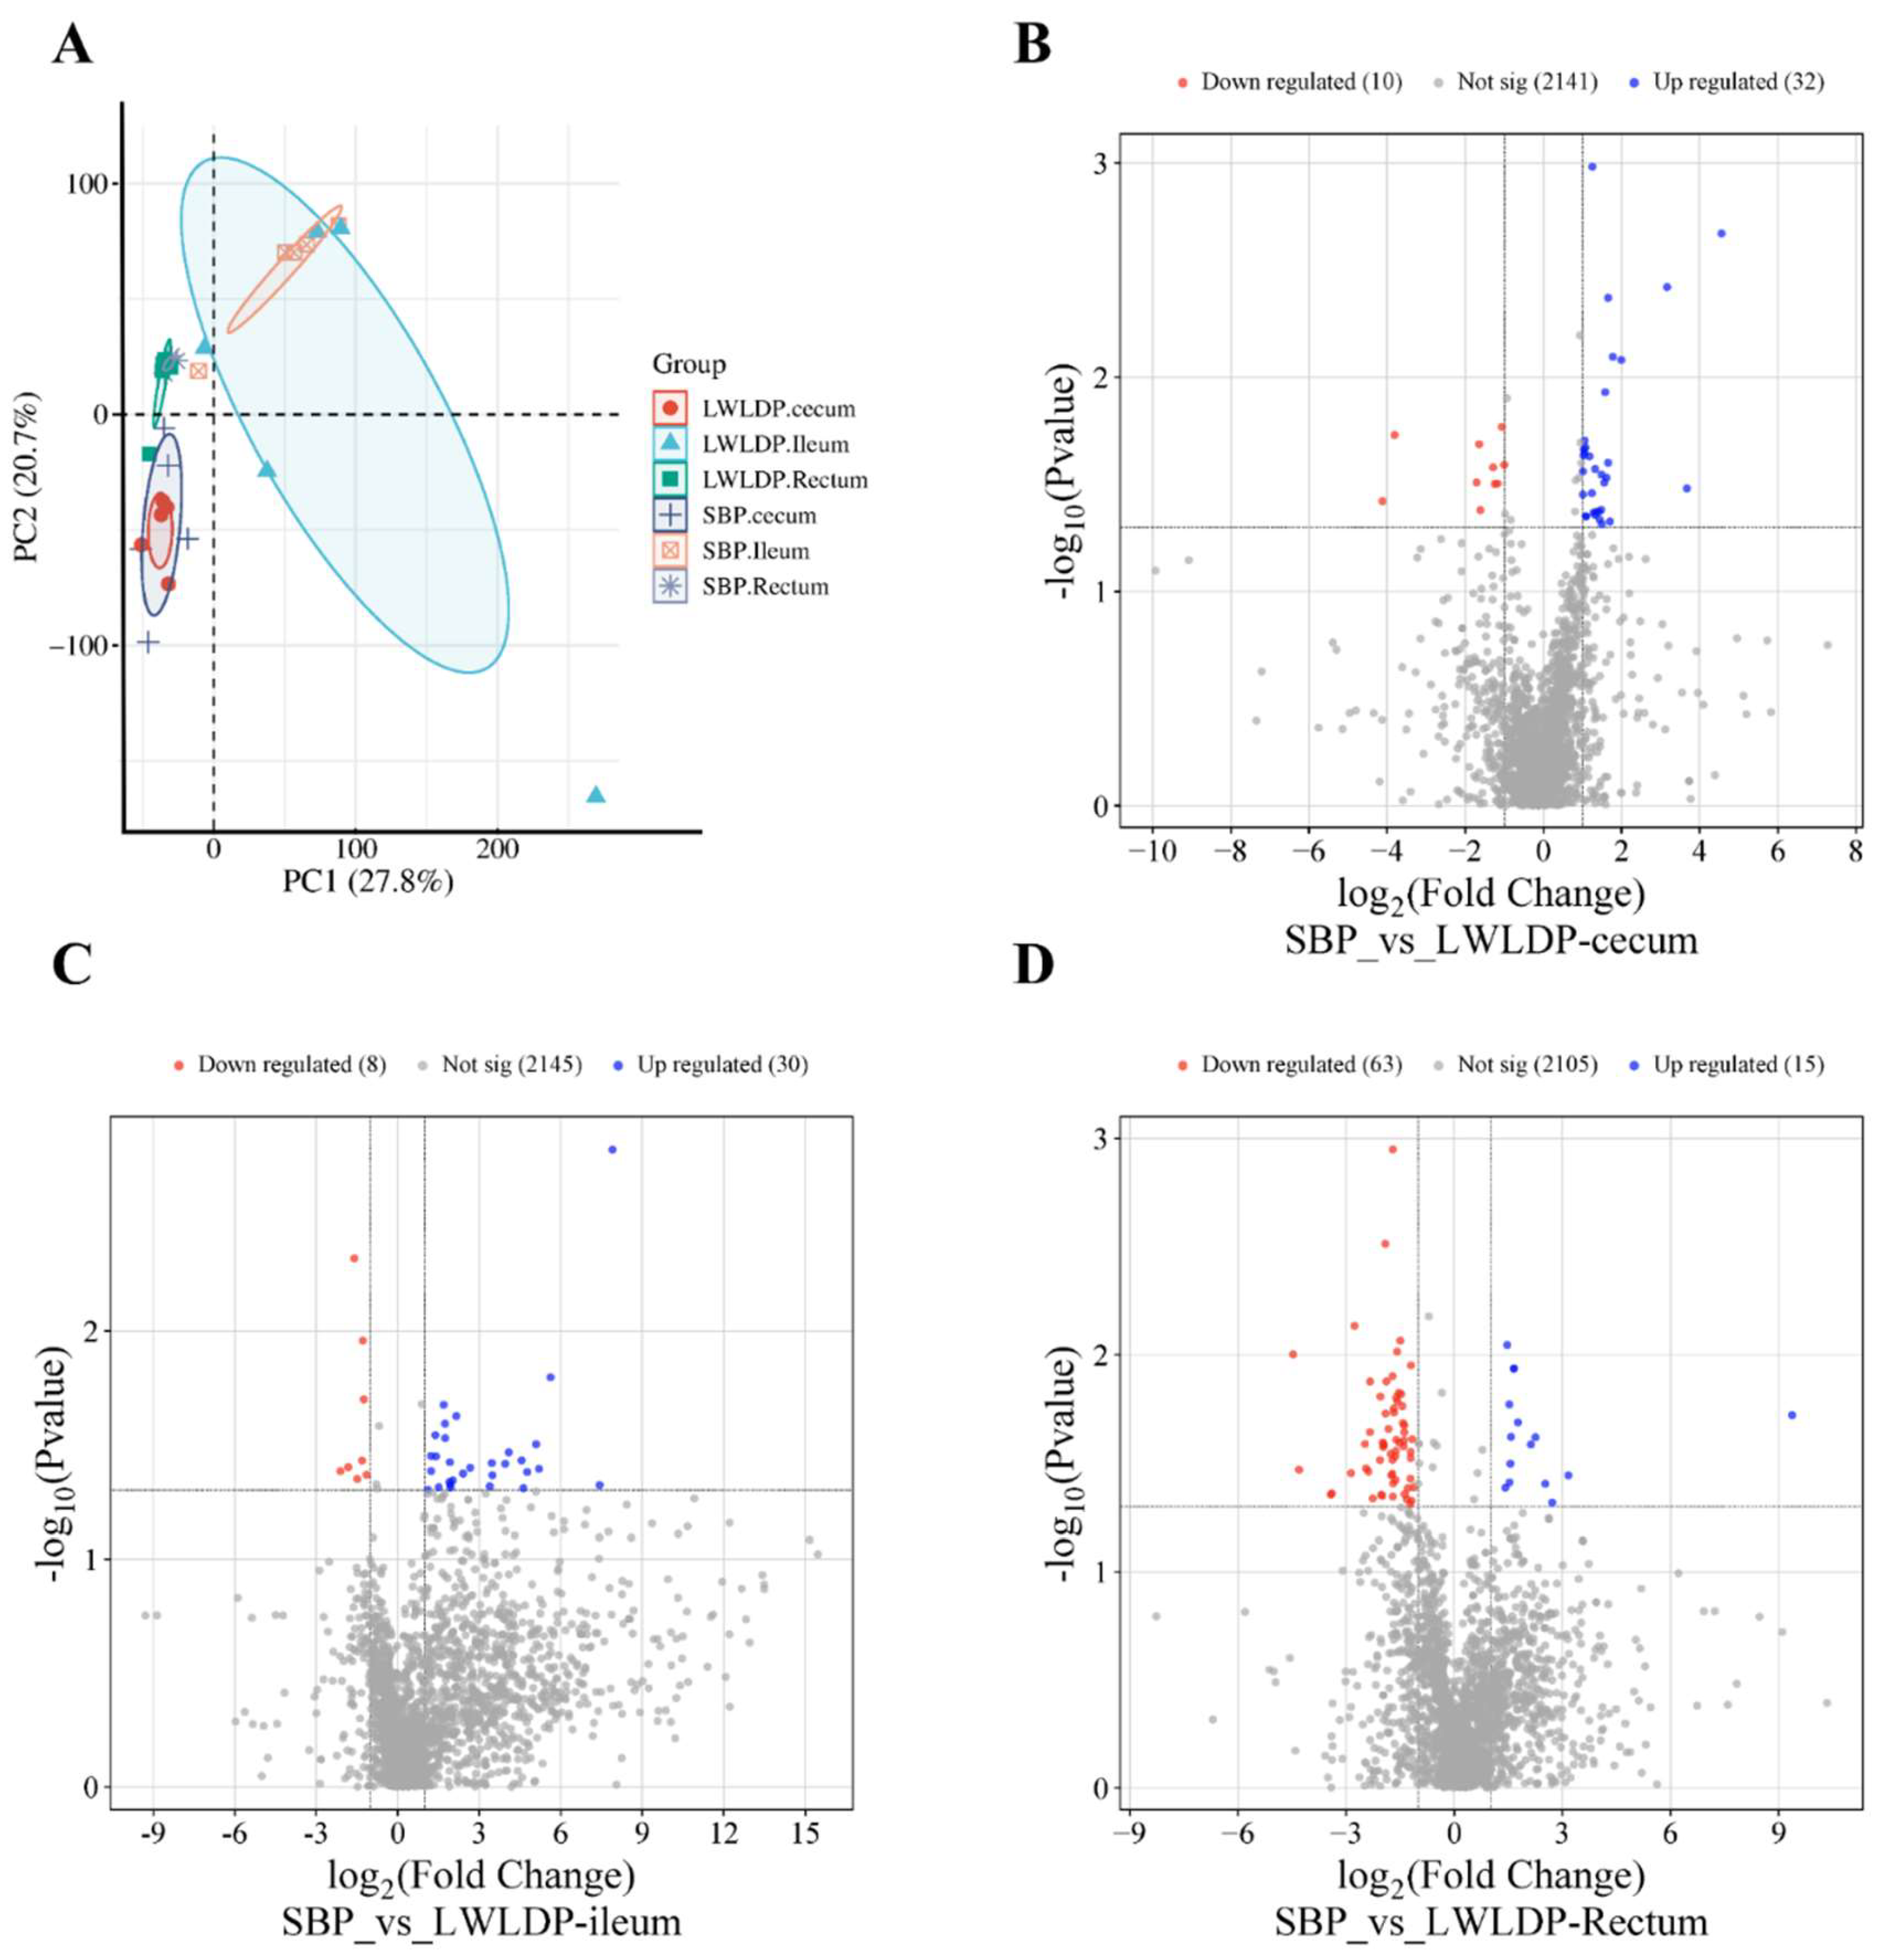
Figure 1. Comparative metabolites and different expressed metabolites (DEMs) analysis (A) principles component analysis of cecum, ileum and rectum metabolites of SBP and LWLDP pig breeds. (B) DEMs analysis of cecum between SBP and LWLDP. (C) DEMs analysis of ileum between SBP and LWLDP. (D) DEMs analysis of rectum between SBP and LWLDP.
Preprints 119454 g001
Figure 2. Functional analysis of intestine metabolites. (A) KEGG pathways of cecum metabolites (B) KEGG pathways of Ileum metabolites. (C) KEGG pathways of rectum metabolites (D) Cluster heat map of DEMs in cecum, ileum and rectum in each sample of both breeds.
Preprints 119454 g002
Figure 3. Microbial diversity analysis (A) phylogenetic tree plot of ASVs and the abundance of microbial diversity at phylum and genus level present in each sample of different region of cecum, ileum and rectum of SBP and LWLDP pig breeds. (B) Hierarchical clustering analysis of microbial taxas with in each group of samples of SBP and LWLDP pig breeds (C) Average OTUs distribution in different hierarchies (D) Ven diagram of ASVs distribution in different groups of SBP and LWLDP (E) Principal Coordinate Analysis (PCoA) of microbial communities based on Bray-Curtis dissimilarity. (F) Non-metric Multidimensional Scaling (NMDS) plot based on Bray-Curtis dissimilarity of microbial communities in the cecum, ileum, and rectum with stress value of the NMDS analysis is 0.08, indicating a good fit of the ordination. Closer points indicate more similar microbial communities, while distant points represent greater dissimilarity. NMDS1 and NMDS2 axes show the spread of microbial composition across samples (G) Linear Discriminant Analysis Effect Size (LEfSe) analysis identifying significantly different microbial taxa between Songliao Black Pig (SBP) and Large White × Landrace (LWLDP) breeds across the cecum, ileum, and rectum. Taxa with a linear discriminant analysis (LDA) score greater than 2.0 were considered significantly enriched.
Preprints 119454 g003
Figure 4. Alpha diversity analysis of gut microbial communities in the cecum, ileum, and rectum of Songliao Black Pig (SBP) and Large White × Landrace (LWLDP) pigs. Alpha diversity was measured using the Shannon, Simpson, and Chao1 indices, representing microbial richness and evenness. Box plots indicate the median and interquartile range of diversity values for each intestinal section and pig breed. Higher values indicate greater microbial diversity within the respective groups.
Preprints 119454 g004
Figure 5. The relative abundance of gut microbial communities at different taxonomic levels in the cecum, ileum, and rectum of Songliao Black Pig (SBP) and Large White × Landrace (LWLDP) pigs. (A) shows the relative abundance at the phylum level, highlighting the predominant microbial phyla. (B) presents the relative abundance at the family level, illustrating the variation in microbial families. (C) displays the relative abundance at the genus level (D) focuses on the species level, providing a detailed breakdown of microbial composition in each gut region. The bar plots represent the percentage composition of the microbial community, with distinct colors corresponding to different taxa.
Preprints 119454 g005
Figure 6. The Diablo model analysis and the correlation circle plot illustrating the relationships among microbial diversity, metabolites, and fatty acids across different gut regions (cecum, ileum, rectum) in Songliao Black Pig (SBP) and Large White × Landrace (LWLDP) pigs. (A) Diablo model analysis shows the multivariate integration of microbial taxa, metabolites, and fatty acids, highlighting key contributors across the intestinal sections. (B) correlation circle plot visualizes the correlations between microbial taxa, metabolites, and fatty acids, with vectors indicating the strength and direction of associations.
Preprints 119454 g006
Figure 7. Diablo model analysis, and the correlation circle plots for microbial diversity, metabolites, and fatty acids in different intestinal regions of Songliao Black Pig (SBP) and Large White × Landrace (LWLDP) pigs. (A) Diablo model for the cecum region, showing the integration of microbial taxa, metabolites, and fatty acids. (B) Correlation circle plot for the cecum, highlighting the relationships between microbial taxa, metabolites, and fatty acids. (C) Diablo model for the ileum region, demonstrating significant contributors to fatty acid composition. (D) Correlation circle plot for the ileum, visualizing correlations among the variables. (E) Diablo model for the rectum region, presenting integrated microbial and metabolic data. (F) Correlation circle plot for the rectum, showing the associations between microbial diversity, metabolites, and fatty acids.
Preprints 119454 g007
Table 1. Profile of fatty acids concentration (mg/100 g) longissimus muscles of SBP and LWLDP pig.
Fatty acids SBP LWLDP
Mean ± std Mean ± std Significant level
Butyric acid (C4:0) 0.11±0.055 0.10±0.02 ns
Caproic acid (C6:0) 0.012±0.003 0.02±0.004 **
Caprylic acid (C8:0) 0.042±0.009 0.08±0.02 **
Capric acid (C10:0) 0.484±0.176 0.94±0.28 **
Undecanoic acid (C11:0) 0.016±0.003 0.02±0.01 ns
Lauric acid (C12:0) 0.407±0.22 0.74±0.22 *
Tridecanoic acid (C13:0) 0.004±0.002 0.007±0.002 *
Myristic acid (C14:0) 6.26±3.23 10.96±3.05 *
Myristoleic acid (C14:1n5) 0.13±0.064 0.23±0.1 ns
Pentadecanoic acid (C15:0) 0.122±0.06 0.19±0.04 ns
Palmitic acid (C16:0) 67.40±15.28 101.1±20.20 **
Palmitoleic acid (C16:1n7) 13.7±4.47 23.59±7.12 *
Margaric acid (C17:0) 0.74±0.41 1.119±0.21 ns
Heptadecenoic acid (C17:1n7) 0.62±0.33 0.99±0.24 ns
Stearic acid (C18:0) 40.34±10.09 57.9±11.72 *
Elaidic acid (C18:1n9t) 0.736±0.56 1.03±0.26 ns
Oleic acid (C18:1n9c) 94.60±17.27 132.2±26.25 *
Linolelaidic acid (C18:2n6t) 0.029±0.01 0.03±0.005 ns
Linoleic acid (C18:2n6c) 28.70±8.9 39.87±4.38 *
Arachidic acid (C20:0) 1.08±0.30 1.8±0.51 *
γ-linolenic acid (C18:3n6) 0.16±0.049 0.27±0.04 **
Gadoleic acid (C20:1) 4.63±2.20 7.0±2.12 ns
α-linolenic acid (C18:3n3) 1.37±0.74 1.84±0.27 ns
Heneicosanoic acid (C21:0) 0.0084±0.003 0.014±0.004 ns
Eicosadienoic acid (C20:2) 1.95±1.05 2.9±0.52 ns
Behenic acid (C22:0) 0.057±0.007 0.10±0.016 ***
Di-homo-γ-linolenic-acid (C20:3n6) 0.63±0.16 0.96±0.15 **
Eicosatrienoic acid (C20:3n3) 0.22±0.16 0.39±0.09 ns
Arachidonic acid (C20:4n6) 3.85±0.64 4.72±0.75 ns
Docosadienoic acid (C22:2n6) 0.15±0.10 0.076±0.03 ns
Lignoceric acid (C24:0) 0.029±0.01 0.04±0.008 ns
Eicosapentaenoic acid (C20:5n3) 0.071±0.03 0.079±0.003 ns
DHA (C22:6n3) 0.86±0.36 0.42±0.06 *
n3 PUFA 0.64±0.25 0.68±0.091 ns
n6 PUFA 1.20±0.17 1.50±0.22 *
n3/n6 PUFA 0.92±0.17 1.09±0.11 ns
SFA 117.1±29.5 175.32±35.69 *
UFA 152.5±35.4 216.78±38.83 *
MUFA 116.42±25.4 168.08±35.95 *
PUFA 36.11±10.1 48.69±5.05 *
T. FA 269.6964.6 392.10±73.78 *
Mean values represent the average fatty acid concentrations in pig samples within each breed, with standard deviation (std) indicating variability. The significance of p-values is denoted as *** for p < 0.0001, ** for p < 0.001, * for p < 0.05, and ns for p > 0.05 (no significance), reflecting the statistical significance in the analysis. Abbreviations and corresponding fatty acids include: n3 PUFA (Omega-3 polyunsaturated fatty acids) such as α-Linolenic acid (C18:3n3), Eicosapentaenoic acid (C20:5n3), and Docosahexaenoic acid (C22:6n3); n6 PUFA (Omega-6 polyunsaturated fatty acids) including Linoleic acid (C18:2n6c), γ-Linolenic acid (C18:3n6), Arachidonic acid (C20:4n6), and Di-homo-γ-linolenic acid (C20:3n6); SFA (Saturated fatty acids) such as Butyric acid (C4:0), Caproic acid (C6:0), Caprylic acid (C8:0), Capric acid (C10:0), Undecanoic acid (C11:0), Lauric acid (C12:0), Tridecanoic acid (C13:0), Myristic acid (C14:0), Pentadecanoic acid (C15:0), Palmitic acid (C16:0), Margaric acid (C17:0), Stearic acid (C18:0), Arachidic acid (C20:0), Behenic acid (C22:0), and Lignoceric acid (C24:0); MUFA (Monounsaturated fatty acids) including Myristoleic acid (C14:1n5), Palmitoleic acid (C16:1n7), Heptadecenoic acid (C17:1n7), and Oleic acid (C18:1n9c), and Gadoleic acid (C20:1); PUFA (Polyunsaturated fatty acids) encompassing all n3 and n6 PUFAs; and T. FA (Total fatty acids), representing the sum of all measured fatty acids, both saturated and unsaturated.
Table 2. Top 30 up and down regulated metabolites in cecum of SBP and LWLDP pig breed Intestine .
Metabolite ID Metabolite Name log2FC value P-Value
M1069.pos Di(3,7-dimethyl-1-octyl) phthalate -0.83192 0.046301
M1371.pos Hecogenin -0.98083 0.04355
M1403.pos (3S,4S,4aR,6R,11bS,11cS)-11c-Ethenyl-2-methyl-1,2,3,4,4a,5,6,11c-octahydro-6,4-(epoxymethano)-3,11b-methanopyrido[4,3-c] carbazole -0.93327 0.012531
M1453.pos 3-Benzylpiperidine -1.61786 0.041685
M1615.neg (2,2,3,3-Tetrafluoropropoxy) acetic acid -1.00123 0.025629
M1712.pos (R)-4-((8S,9S,10R,13R,14S,17R)-10,13-dimethyl-3-oxo-2,3,8,9,10,11,12,13,14,15,16,17-dodecahydro-1H-cyclopenta[a]phenanthren-17-yl) pentanoic acid -1.2868 0.026356
M1753.pos (R)-4-((7R,8S,9S,10R,13R,14S,17R)-7-hydroxy-10,13-dimethyl-3-oxo-2,3,6,7,8,9,10,11,12,13,14,15,16,17-tetradecahydro-1H-cyclopenta[a]phenanthren-17-yl) pentanoic acid -1.06664 0.017033
M1866.pos N-Oleoyltaurine -1.17102 0.031286
M2333.neg 10-Formyldihydrofolate -4.12055 0.037883
M406.neg Inosine 5'-monophosphate (IMP) -3.81249 0.018608
M599.pos Gabapentin -1.24879 0.031443
M718.pos (R)-Aminocarnitine -1.70991 0.030991
M74.pos PC(P-16:0/0:0) -1.64491 0.02053
M1022.neg 5-KETO-GLUCONIC ACID 1.580694 0.01174
M1034.neg trans-3'-Hydroxycotinine O-. beta. -D-glucuronide 1.655328 0.004261
M1131.pos N-Benzyladenine 1.702923 0.047175
M1135.neg (2E)-4-Hydroxybut-2-enoic acid 1.181196 0.023398
M1136.neg N-Acetylgalactosamine_6-sulfate 3.671372 0.033051
M122.neg Glucose 1.030966 0.023176
M1386.neg Halofenozide 1.074294 0.021257
M1423.pos 2-Chloro-5,6,7,8-tetrahydroquinoxaline 1.056675 0.022562
M1485.neg 1,3-Dihydroxy-7,8,9,10-tetrahydro-6H-benzo[c]chromen-6-one 0.825711 0.030275
M162.neg sn-Glycerol 3-phosphate 1.086599 0.044527
M1690.pos Dehydrogriseofulvin 1.613374 0.029414
M1740.pos ZON 1.655373 0.025052
M1741.neg 3-O-Feruloylquinic acid 1.011234 0.027509
M1769.neg 5-Methoxypsoralen 0.914868 0.0294
M1843.neg (1S,4R)-4-[[(2S,3aS,4S)-2-Butan-2-yl-4-hydroxy-1-oxo-3,3a-dihydro-2H-imidazo[1,2-a] indol-4-yl]methyl]-1-methyl-2,4-dihydro-1H-pyrazino[2,1-b]quinazoline-3,6-dione 1.776069 0.00802
Table 3. Top 30 up and down regulated metabolites in ileum of SBP and LWLDP pig breed Intestine.
Metabolite ID Metabolite Name log2FC value P-Value
M1215.neg [2.3-dihydroxypropoxy] [2-[docosa-4.7.10.13.16.19-hexaenoyloxy]-3-[octadec-9-enoyloxy] propoxy]phosphinic acid -1.59791 0.004795
M1462.neg 2-Benzimidazolinone, 1-benzyl- -0.75022 0.049191
M1549.neg (2-aminoethoxy) [2-[docosa-4.7.10.13.16.19-hexaenoyloxy]-3-[octadeca-1.9-dien-1-yloxy] propoxy]phosphinic acid -1.31198 0.037041
M1840.neg 1-Palmitoyl-2-docosahexaenoyl-sn-glycero-3-phospho-(1'-rac-glycerol) -1.82212 0.039609
M2232.neg Nicotinurate -0.79274 0.047029
M318.neg Capric acid -1.28503 0.011012
M367.neg cis-9-Palmitoleic acid -0.68697 0.026125
M524.pos PC(P-18:0/18:1(9Z)) -2.10508 0.041248
M882.neg 2-Hydroxy-2',3'-dichlorobiphenyl -1.48729 0.044641
M905.neg (24E)-12,15-Dihydroxy-3-(pentopyranosyloxy)-9,19-cyclolanost-24-en-26-oic acid -1.14334 0.042769
M972.neg Ethyldodecanoate -1.24549 0.019967
M1016.neg [6]-Gingerdiol_3,5-diacetate 4.088465 0.034114
M1017.neg Canrenone 1.118609 0.049823
M1087.neg 4-Hydroxy-3-[(E)-7-hydroxy-3,7-dimethyl-4-oxooct-5-enyl]-5-[(E)-4-hydroxy-3-methylbut-2-enyl] benzoic acid 2.15706 0.023635
M1103.neg 3-[(Ethylanilino)methyl] benzenesulfonic acid 3.486875 0.042944
M1121.neg 8-Geranyl-7-hydroxycoumarin 1.227386 0.03537
M1147.neg 5-Ethyl-N-phenyl-2-pyridinecarbothioamide 1.908612 0.045952
M1265.pos PA (12:0/0:0) 3.468987 0.037976
M1347.pos Progabide 5.204754 0.040273
M1375.pos (2-Biphenyl) dicyclohexylphosphine 4.559945 0.036992
M1524.neg Mangostine 2.405721 0.042286
M1635.pos 16-Phenoxytetranorprostaglandin F2. alpha. cyclopropyl methyl amide 7.433494 0.047492
M1636.pos Polyvidone 3.963228 0.03826
M1760.neg Antibiotic FR 901512 1.689833 0.021109
M1875.neg N-(2-Methylphenyl) benzenesulfonamide 1.743374 0.02551
Table 4. Top 30 up and down regulated metabolites in rectum of SBP and LWLDP pig breed Intestine.
Metabolite ID Metabolite Name log2FC value P-Value
M1057.neg 3-Heptanone, 1,7-bis(3,4-dihydroxyphenyl)-6-methoxy- -1.18067 0.047272
M1061.pos LysoPC(0:0/18:0) -1.2026 0.028103
M1111.pos Flavidulol_C -1.6351 0.029404
M1142.pos 1-O-Hexadecyl-2-O-(2E-butenoyl)-sn-glyceryl-3-phosphocholine -1.61897 0.027758
M1151.pos LPC (18:1) -1.47418 0.015168
M1215.neg [2.3-dihydroxypropoxy] [2-[docosa-4.7.10.13.16.19-hexaenoyloxy]-3-[octadec-9-enoyloxy] propoxy]phosphinic acid -1.28737 0.041294
M1219.pos Bortezomib__ -1.31754 0.046516
M1241.pos Americine -3.42564 0.044253
M1259.pos PC (22:4(7Z,10Z,13Z,16Z)/P-18:1(9Z)) -2.4722 0.025806
M129.pos LPS (18:1) -1.9801 0.025347
M1333.pos 2-(3-Hydroxyphenyl)-1H-isoindole-1,3(2H)-dione -1.6313 0.037885
M134.pos 1-Myristoyl-sn-glycero-3-phosphocholine (LPC (14:0/0:0)) -1.82494 0.021964
M135.pos LPC (20:0) -1.52303 0.025362
M1453.pos 3-Benzylpiperidine -0.99566 0.039404
M1522.pos PC (18:0/18:3(6Z,9Z,12Z)) -1.60944 0.01577
M1091.pos Edaravone 0.650092 0.0352
M1134.pos Val-Asn 1.534942 0.038822
M1305.neg Ikarugamycin 9.372605 0.018966
M1414.neg 7-Oxopimara-8(14),15-dien-20-oic acid 3.165438 0.036013
M1479.neg Phe(Benzoyl)-Leu-Arg 1.469218 0.009001
M151.neg 4-Hydroxybenzaldehyde 1.529151 0.016922
M1550.pos Sterebin_D 1.560733 0.031825
M1739.neg 5-(2-Furyl)-1,3,4-oxadiazole-2(3H)-thione 1.419276 0.041087
M1920.neg Erythronolactone 0.783752 0.02743
M1944.neg 3-[(3-Carboxypropanoyl) amino] benzoic acid 1.577807 0.023923
M1979.neg 3-(Dodecylsulfonyl)propanoic acid 2.128976 0.025944
M2353.neg 16-Oxopalmitate 2.25613 0.024024
M299.neg Benzoic acid 1.6551 0.011532
M387.neg p-Toluquinone 1.654802 0.011544
M442.neg Pseudolaric Acid B 2.718804 0.048124
Disclaimer/Publisher’s Note: The statements, opinions and data contained in all publications are solely those of the individual author(s) and contributor(s) and not of MDPI and/or the editor(s). MDPI and/or the editor(s) disclaim responsibility for any injury to people or property resulting from any ideas, methods, instructions or products referred to in the content.
Copyright: This open access article is published under a Creative Commons CC BY 4.0 license, which permit the free download, distribution, and reuse, provided that the author and preprint are cited in any reuse.
Prerpints.org logo

Preprints.org is a free preprint server supported by MDPI in Basel, Switzerland.

Subscribe

© 2024 MDPI (Basel, Switzerland) unless otherwise stated