1. Introduction
Global greenhouse gas (GHG) emissions are continuously increasing. To achieve the objective of zero GHG by 2050, the maritime industry needs to start to reduce emissions as soon as possible. Given the long-life span of vessels (15-40 years) it is necessary to retrofit the existing fleet before the end of their life to reduce GHG emissions. Reducing fuel consumption, and therefore increasing engine efficiency, directly reduces the amount of CO
2 emissions. Marine Diesel engines are typically turbocharged in order to increase the power output they can deliver. The coupling of turbomachines and the reciprocating engine requires a carefully conducted dimensioning process, referred to as turbo-matching. The thermal efficiency of the system depends on this dimensioning process [
1]. The simplest and most common marine propulsion matching is the free-floating without waste-gate valves, matched for nominal engine operating point (100% of load, and 100% of speed). Under these conditions, the system operates at its highest efficiency only at matching point. Any other operating point is considered a trade-off in efficiency [
2].
As propulsion plants become more electrified, electric hybridization has gained interest in the transport industry. Electric hybridization introduces a new approach to turbo-matching [
3]. Hybridization in the air-charging system can complement the exhaust gas energy with another type of energy. Providing an additional energy source increases the energy available for the compressor. Excess energy also can now be converted into electric energy for immediate use, or storage, replacing the energy sink of a waste-gate. There can be identified two functions for the electric hybridization: source and sink.
A compressor driven by an electric motor, generally installed together with a turbocharger, works as an electric source to the air-charging system. In steady-state applications, the electric compressor can increase engine torque at low engine speeds at expenses of fuel consumption [
4]. To reduce fuel consumption, it is possible to use the torque increase at low speeds to downsize engines for a specific application during the conception and design phase. Fuel consumption is reduced up to 12% compared with a not downsized system [
5]. In marine propulsion applications, the torque of the engine is related with the rotational speed (propeller law). To profit of the increase of torque at low speeds it would be necessary to redesign the power plant, by adding a high torque electric machine in parallel of the propeller or driving more than one propeller with one engine [
6]. To reduce fuel consumption by means of an electric assistance it is possible to retune the valve timing, creating a Miller effect by reducing the opening time of the intake valve without scarifying air-mass flow rate [
7].
An electric generator linked to turbine in the exhaust line works as a sink to divert the excess of energy from the exhaust gases. In a free-floating matching at steady state, it does not occur an excess of energy, this can be solved by changing the size of the turbomachinery. Harvesting of energy with an electric recovery turbine have negative impacts on the engine’s efficiency, but it can increase the overall system efficiency [
8]. The negative impacts are caused by increased backpressure and pumping losses [
9], as increased exhaust temperature [
10]. A retuning of the engine can extend the benefits of an electric recovery turbine. Valve timing of the exhaust valve is more relevant for the recovery than the intake valve [
11], which is more important for the assistance. Advancing the opening of exhaust valve reduces engine efficiency but increases the energy available for the turbine. Increasing valve overlap can reduce pumping losses at high loads, but reduces efficiency at low loads [
12]. The start of injection (SOI) determines how much energy is recovered inside the cylinder and how much is available for the turbines, at high engine loads delaying SOI can increase turbine power at expense of engine power [
13].
An electric machine in the turbocharger’s shaft allows both functions: source and sink. With both functions available, different studies propose different configuration of exhaust valve, some recommend an early opening [
14] accompanied by a larger turbine, meanwhile others recommend a late opening [
15] due to the losses in electric production. It is not clear which configuration is best but is clear the importance of the correct estimation of the losses.
This study aims to obtain a deep understanding of the effect of each variable in the optimal fuel consumption when both functions, source and sink are available. Even if it has been demonstrated that the electric hybrid turbocharger outperforms the electrically separated turbocharger in terms of efficiency [
16], the present study focuses on the separated device approach as it enables the analysis of the turbine and compressor individually, allowing to fully understand their contribution to the system.
In this study, a marine free-floating matched turbocharged diesel engine is equipped with a hybrid air-charging variation. The modification involves decoupling the turbocharger shaft and connecting the compressor and turbine to independent electric machines (EMs). Additionally, an extra EM is installed on the engine crankshaft, serving as a shaft motor-generator. This machine has the function to maintain an electric energy balance between the compressor and turbine, ensuring their demand and production are aligned.
The objective of the study is centered in retrofitting existing engines, minimizing fuel consumption by keeping same engine power delivery (same propeller law). The identification of the influence of each variable on the hybrid configuration is conducted by performing several optimizations, adding one variable at the time.
2. Methodology
In this section there are described the models used in this study and the optimization methodology used.
2.1. Baseline Engine Model
The engine chosen for this study is a prototype version of the engine type PA6B, developed by MAN Energy Solutions. It is a 4 cylinder in V developed for testing new technologies, variant of the PA6B family of engines, which typically ranges from 12 to 20 cylinders. The main characteristics of the engine are listed in
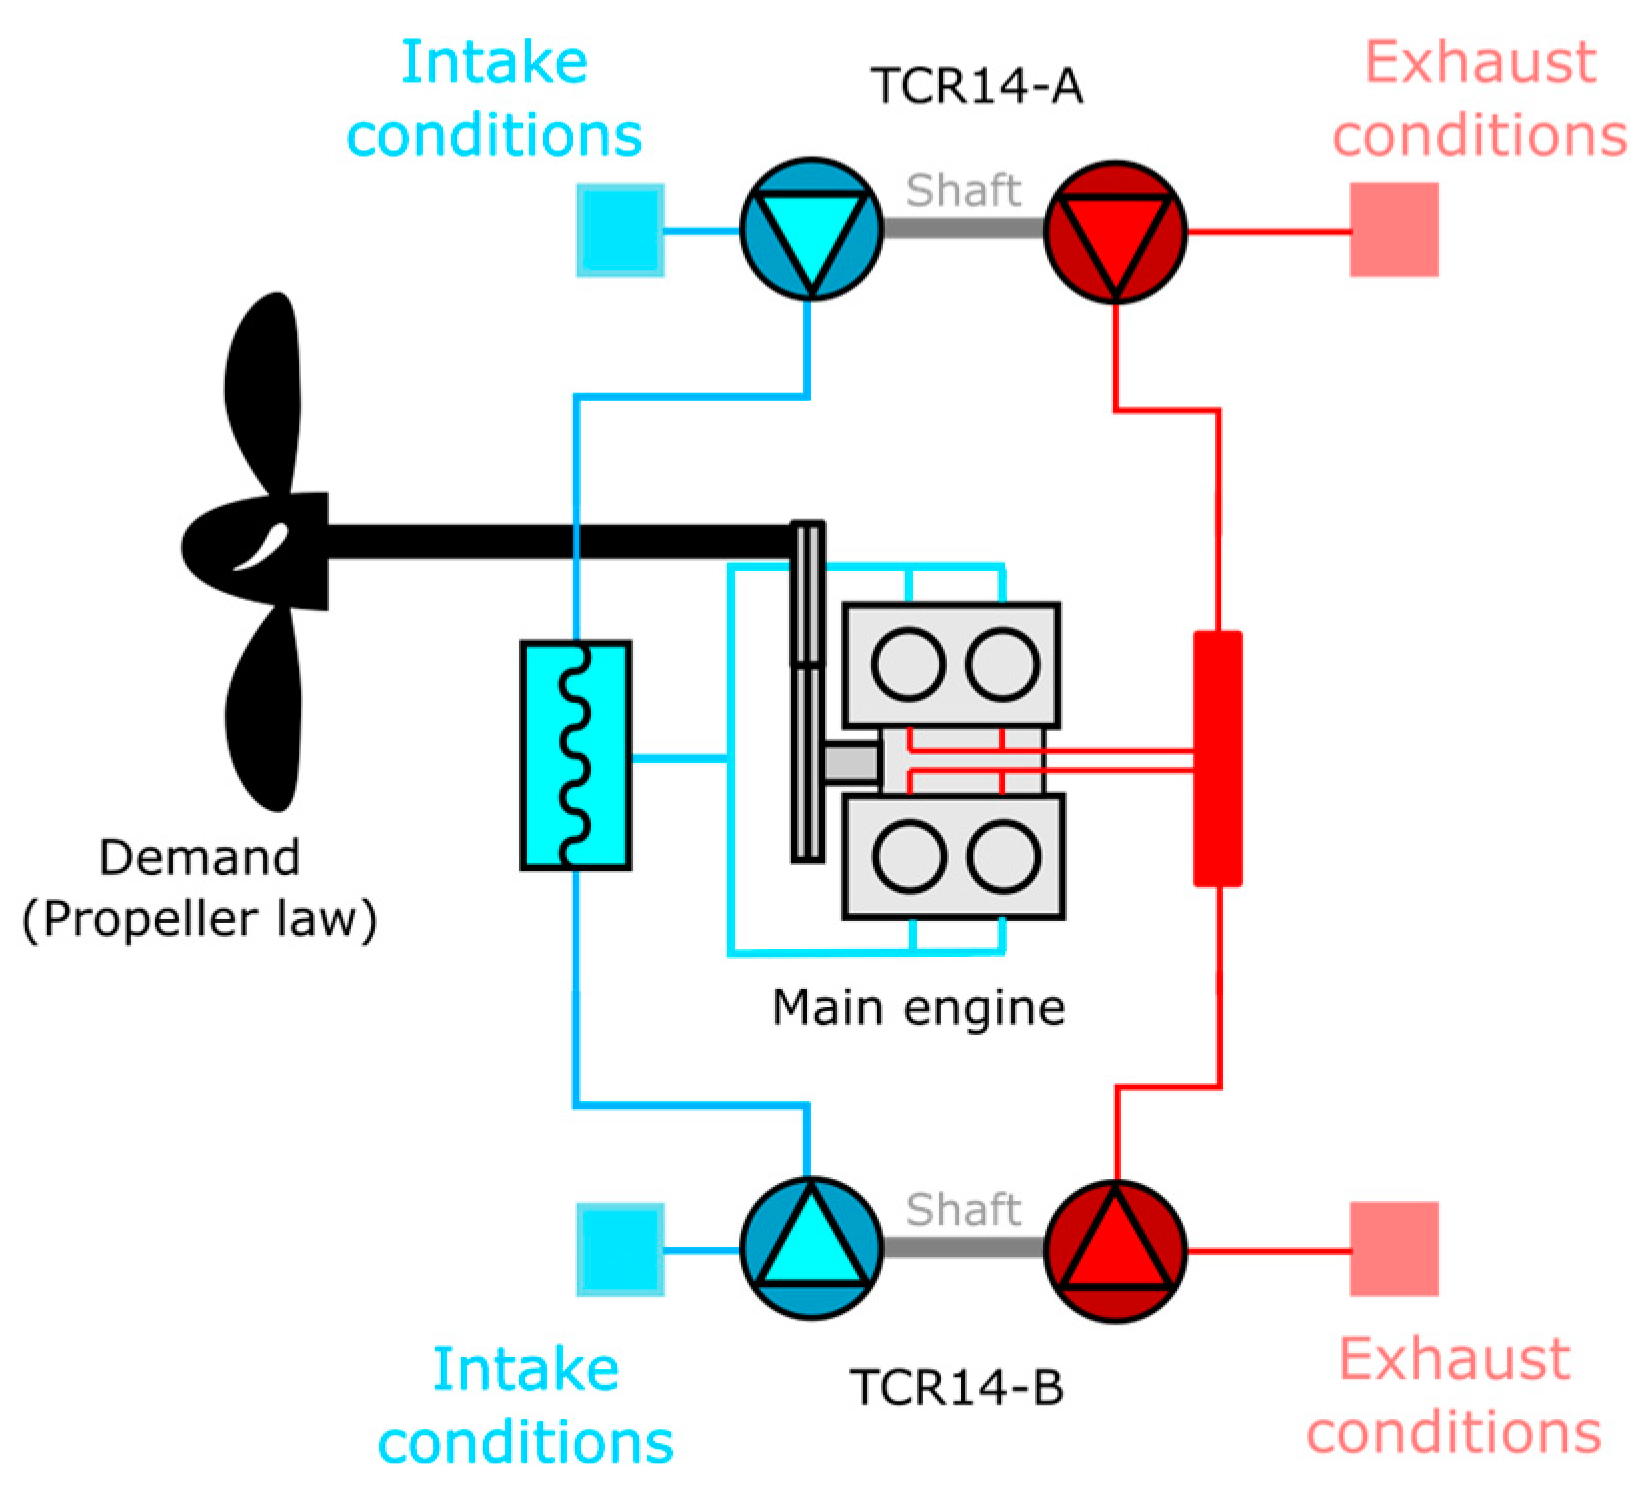
Table 1. The engine studied is equpped with fixed cam timing. In marine applications, the PA6B engines typically employ two turbochargers, as shown in the engine diagram in
Figure 1.
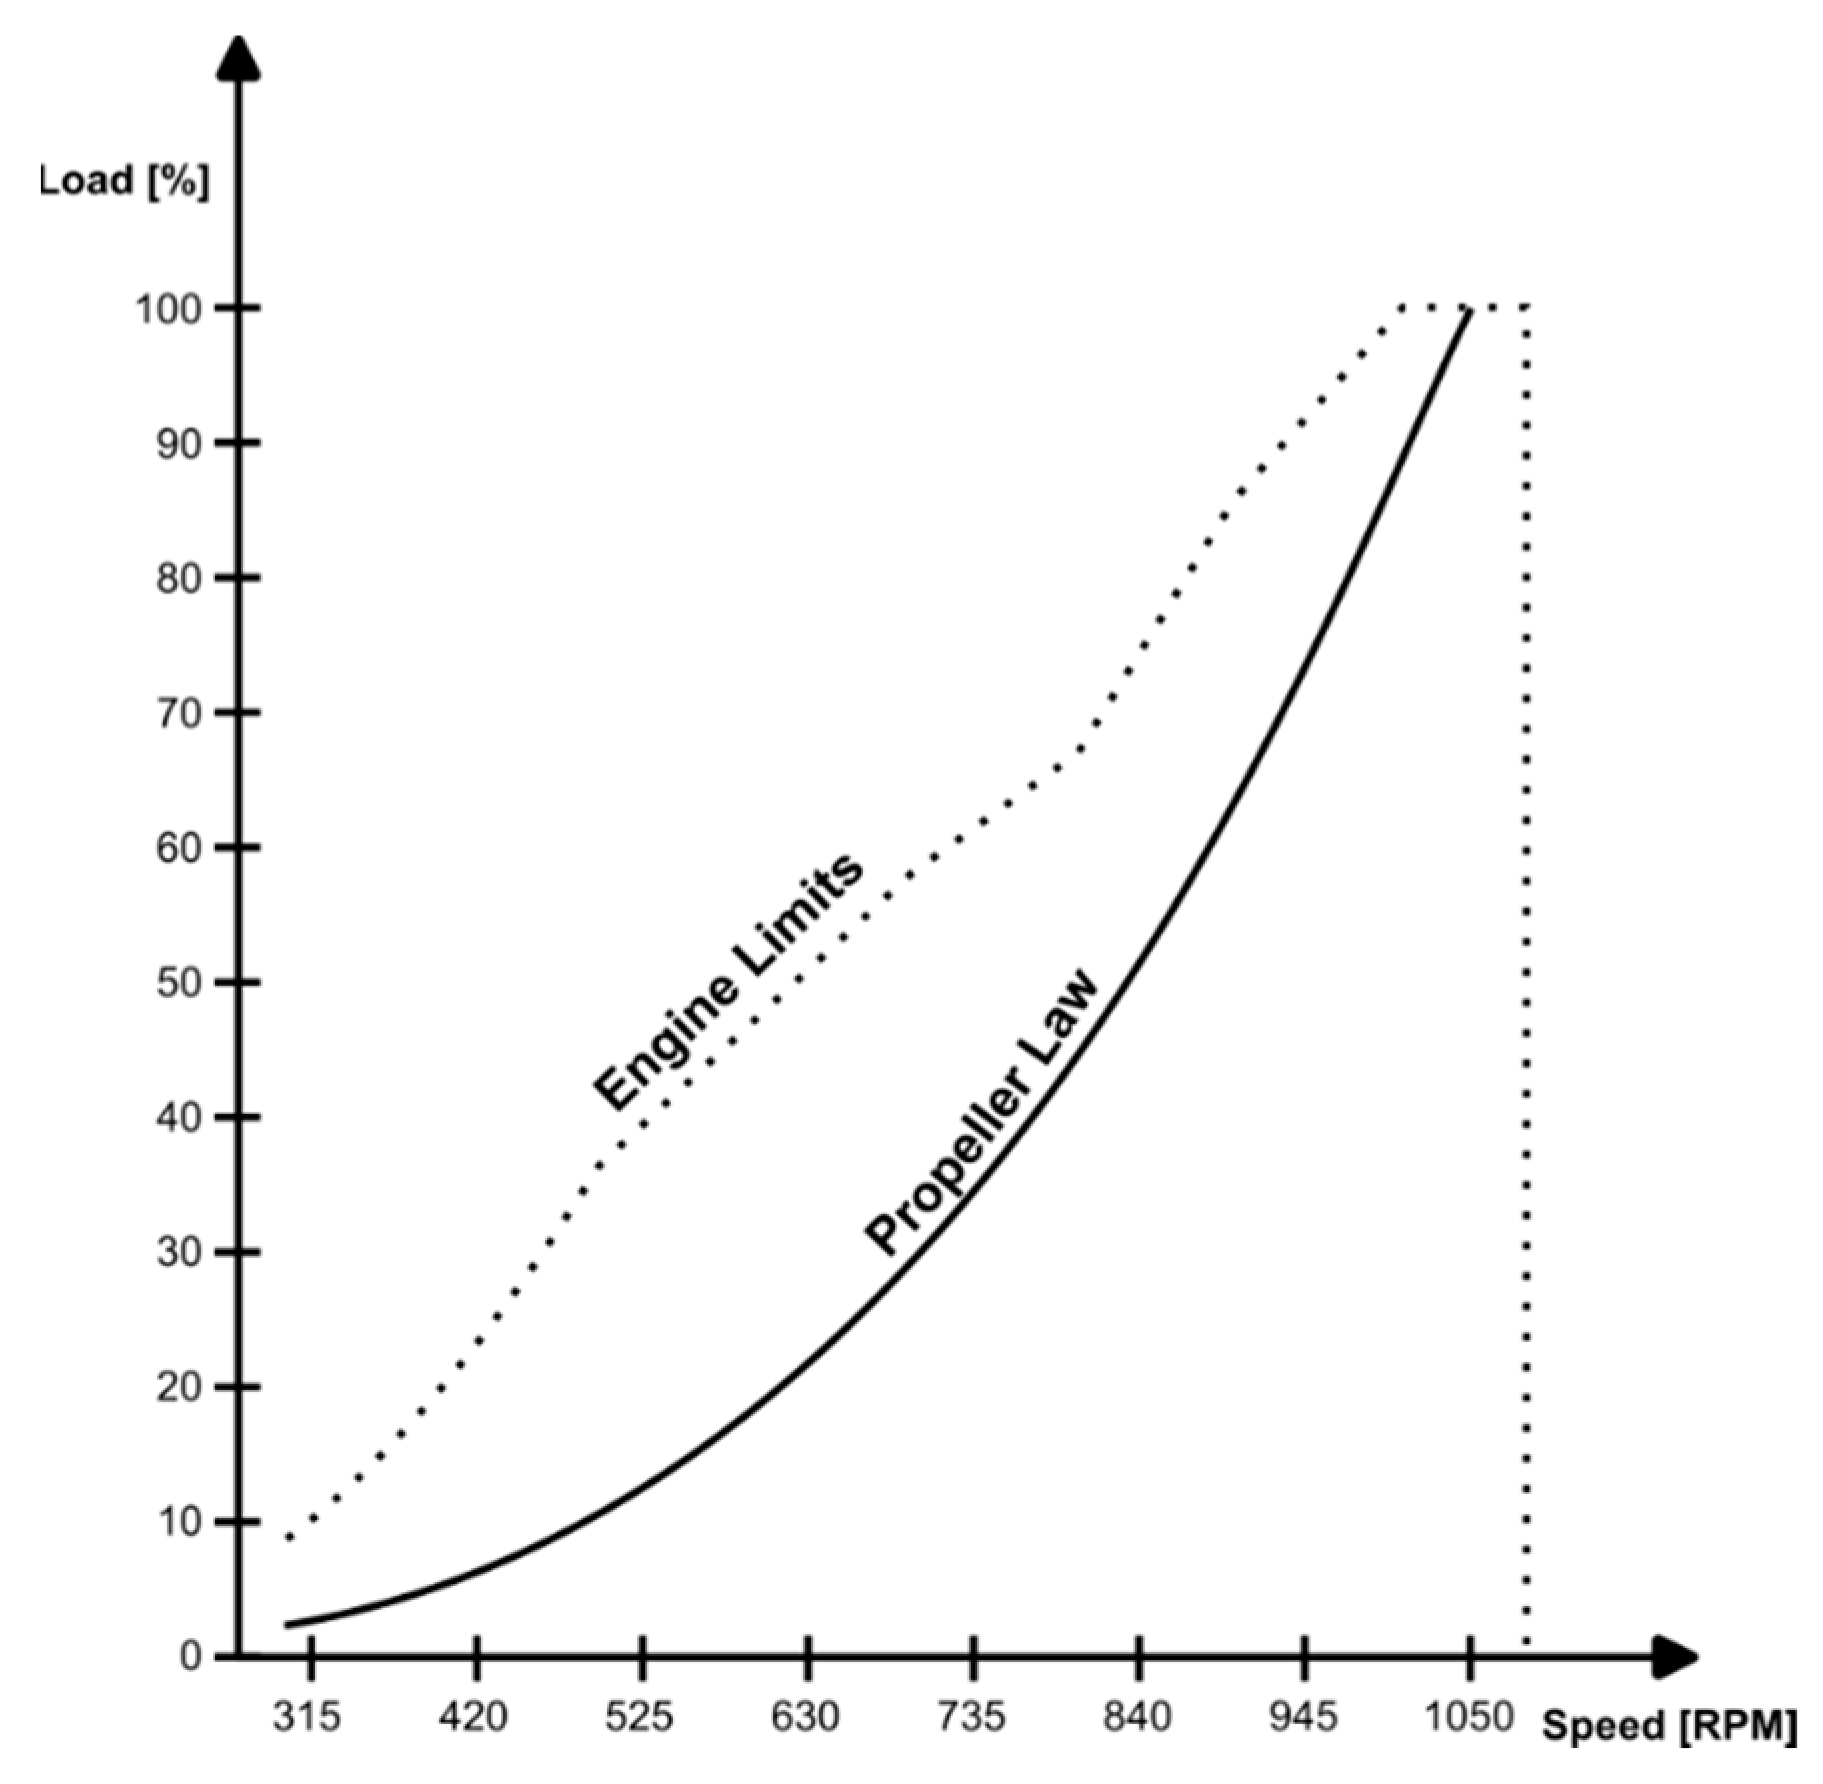
When an internal combustion engine is coupled with a propeller for marine propulsion, the power demanded by the propeller (resistance power) must equal the brake power provided by the engine, under steady-state conditions. This brake power is expressed as a percentage of the engine's nominal power, which in marine propulsion is referred to as the engine load. The propeller’s resistance torque depends on its rotational speed, which is directly related to the engine’s speed. Assuming calm water and a single fixed-pitch propeller, the brake power is proportional to the cube of the speed, a relationship commonly known as the propeller law (formerly referred to as the light propeller law).
This study is focused on retrofit applications, where the same propeller is used in the ship. The propeller law shown in
Figure 2 is kept constant for all future modifications. In the same figure there are shown the current engine limits, these corresponds to physical limitations imposed by mechanical stress, oil-film thickness, and exhaust gas temperature, which are different from the engine limits of small-vehicle applications. These limitations are considered constant as well, as the engine itself is not modified, just the air-charging circuit.
The engine is modeled on the commercial software GT-Suite, as it is widely used for engine applications. The DI-Pulse combustion model has been calibrated using experimental data from a 12V engine, this model have been used in a previous publication from the research team [
17]. The model of the 4V engine is built using the same friction and combustion models previously calibrated, with the gas-circuit, firing-order, cooler and turbochargers characteristics of the new engine.
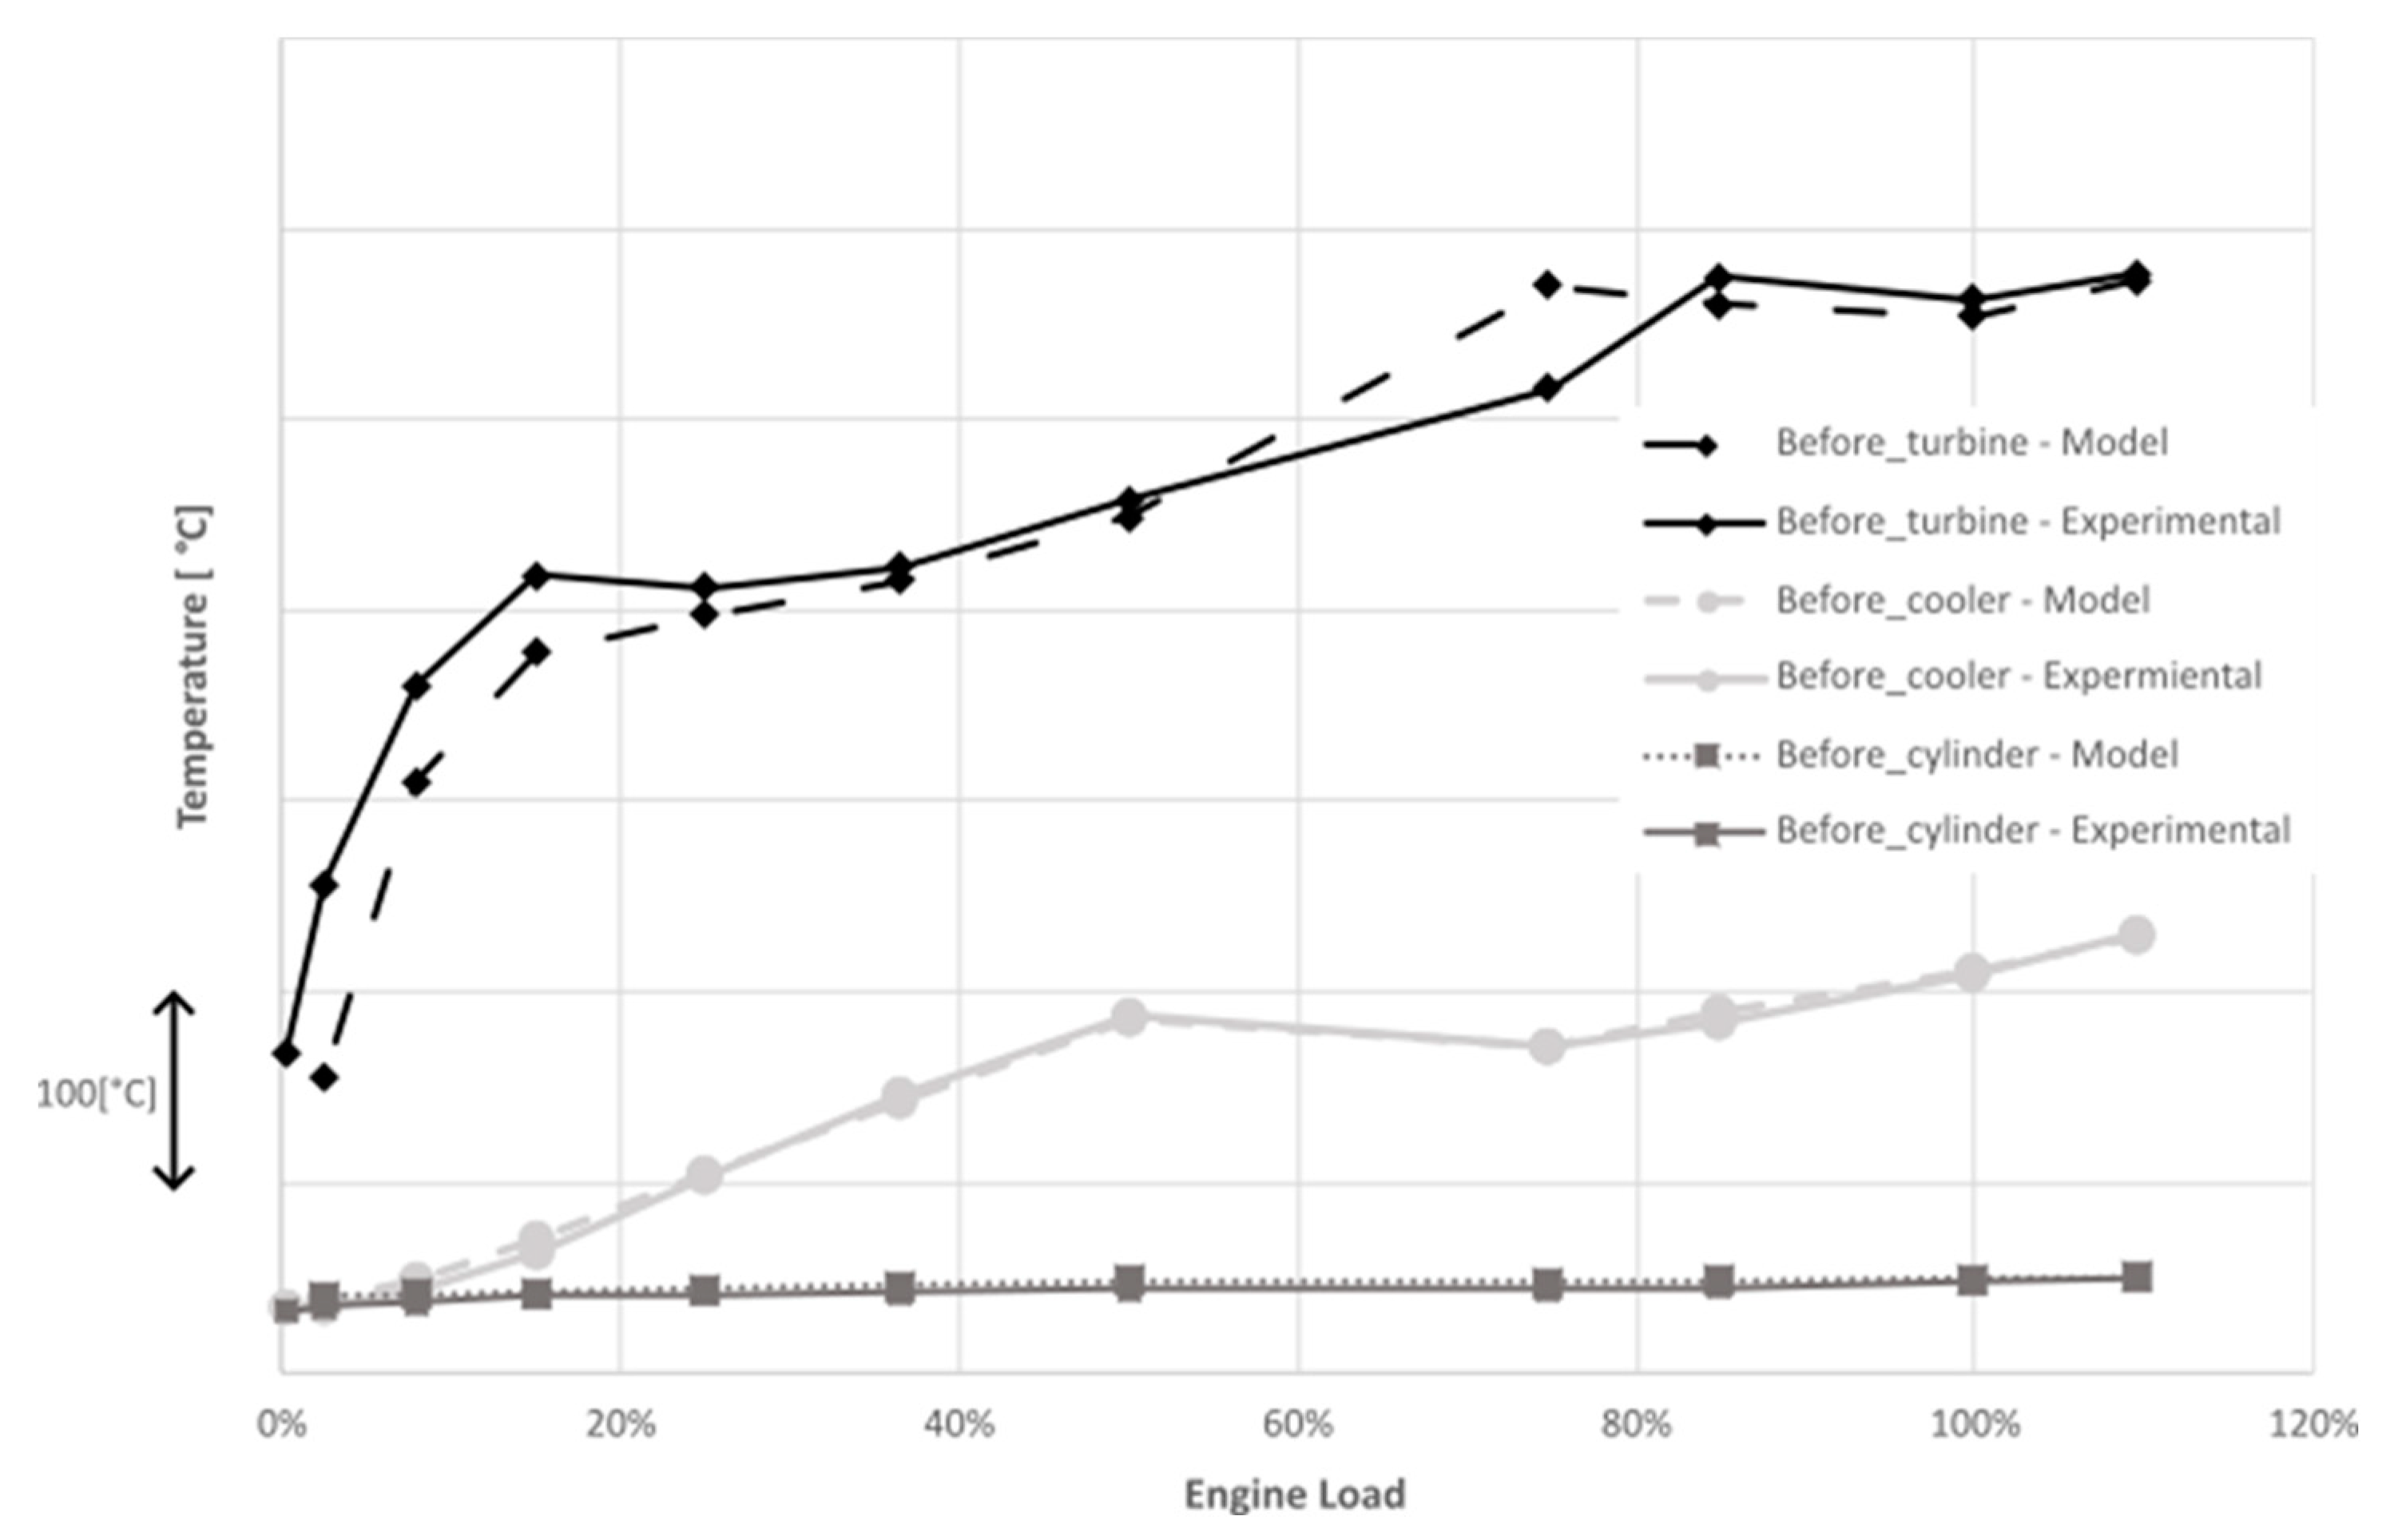
Figure 3 compares the temperature measurements with the model at three different locations,
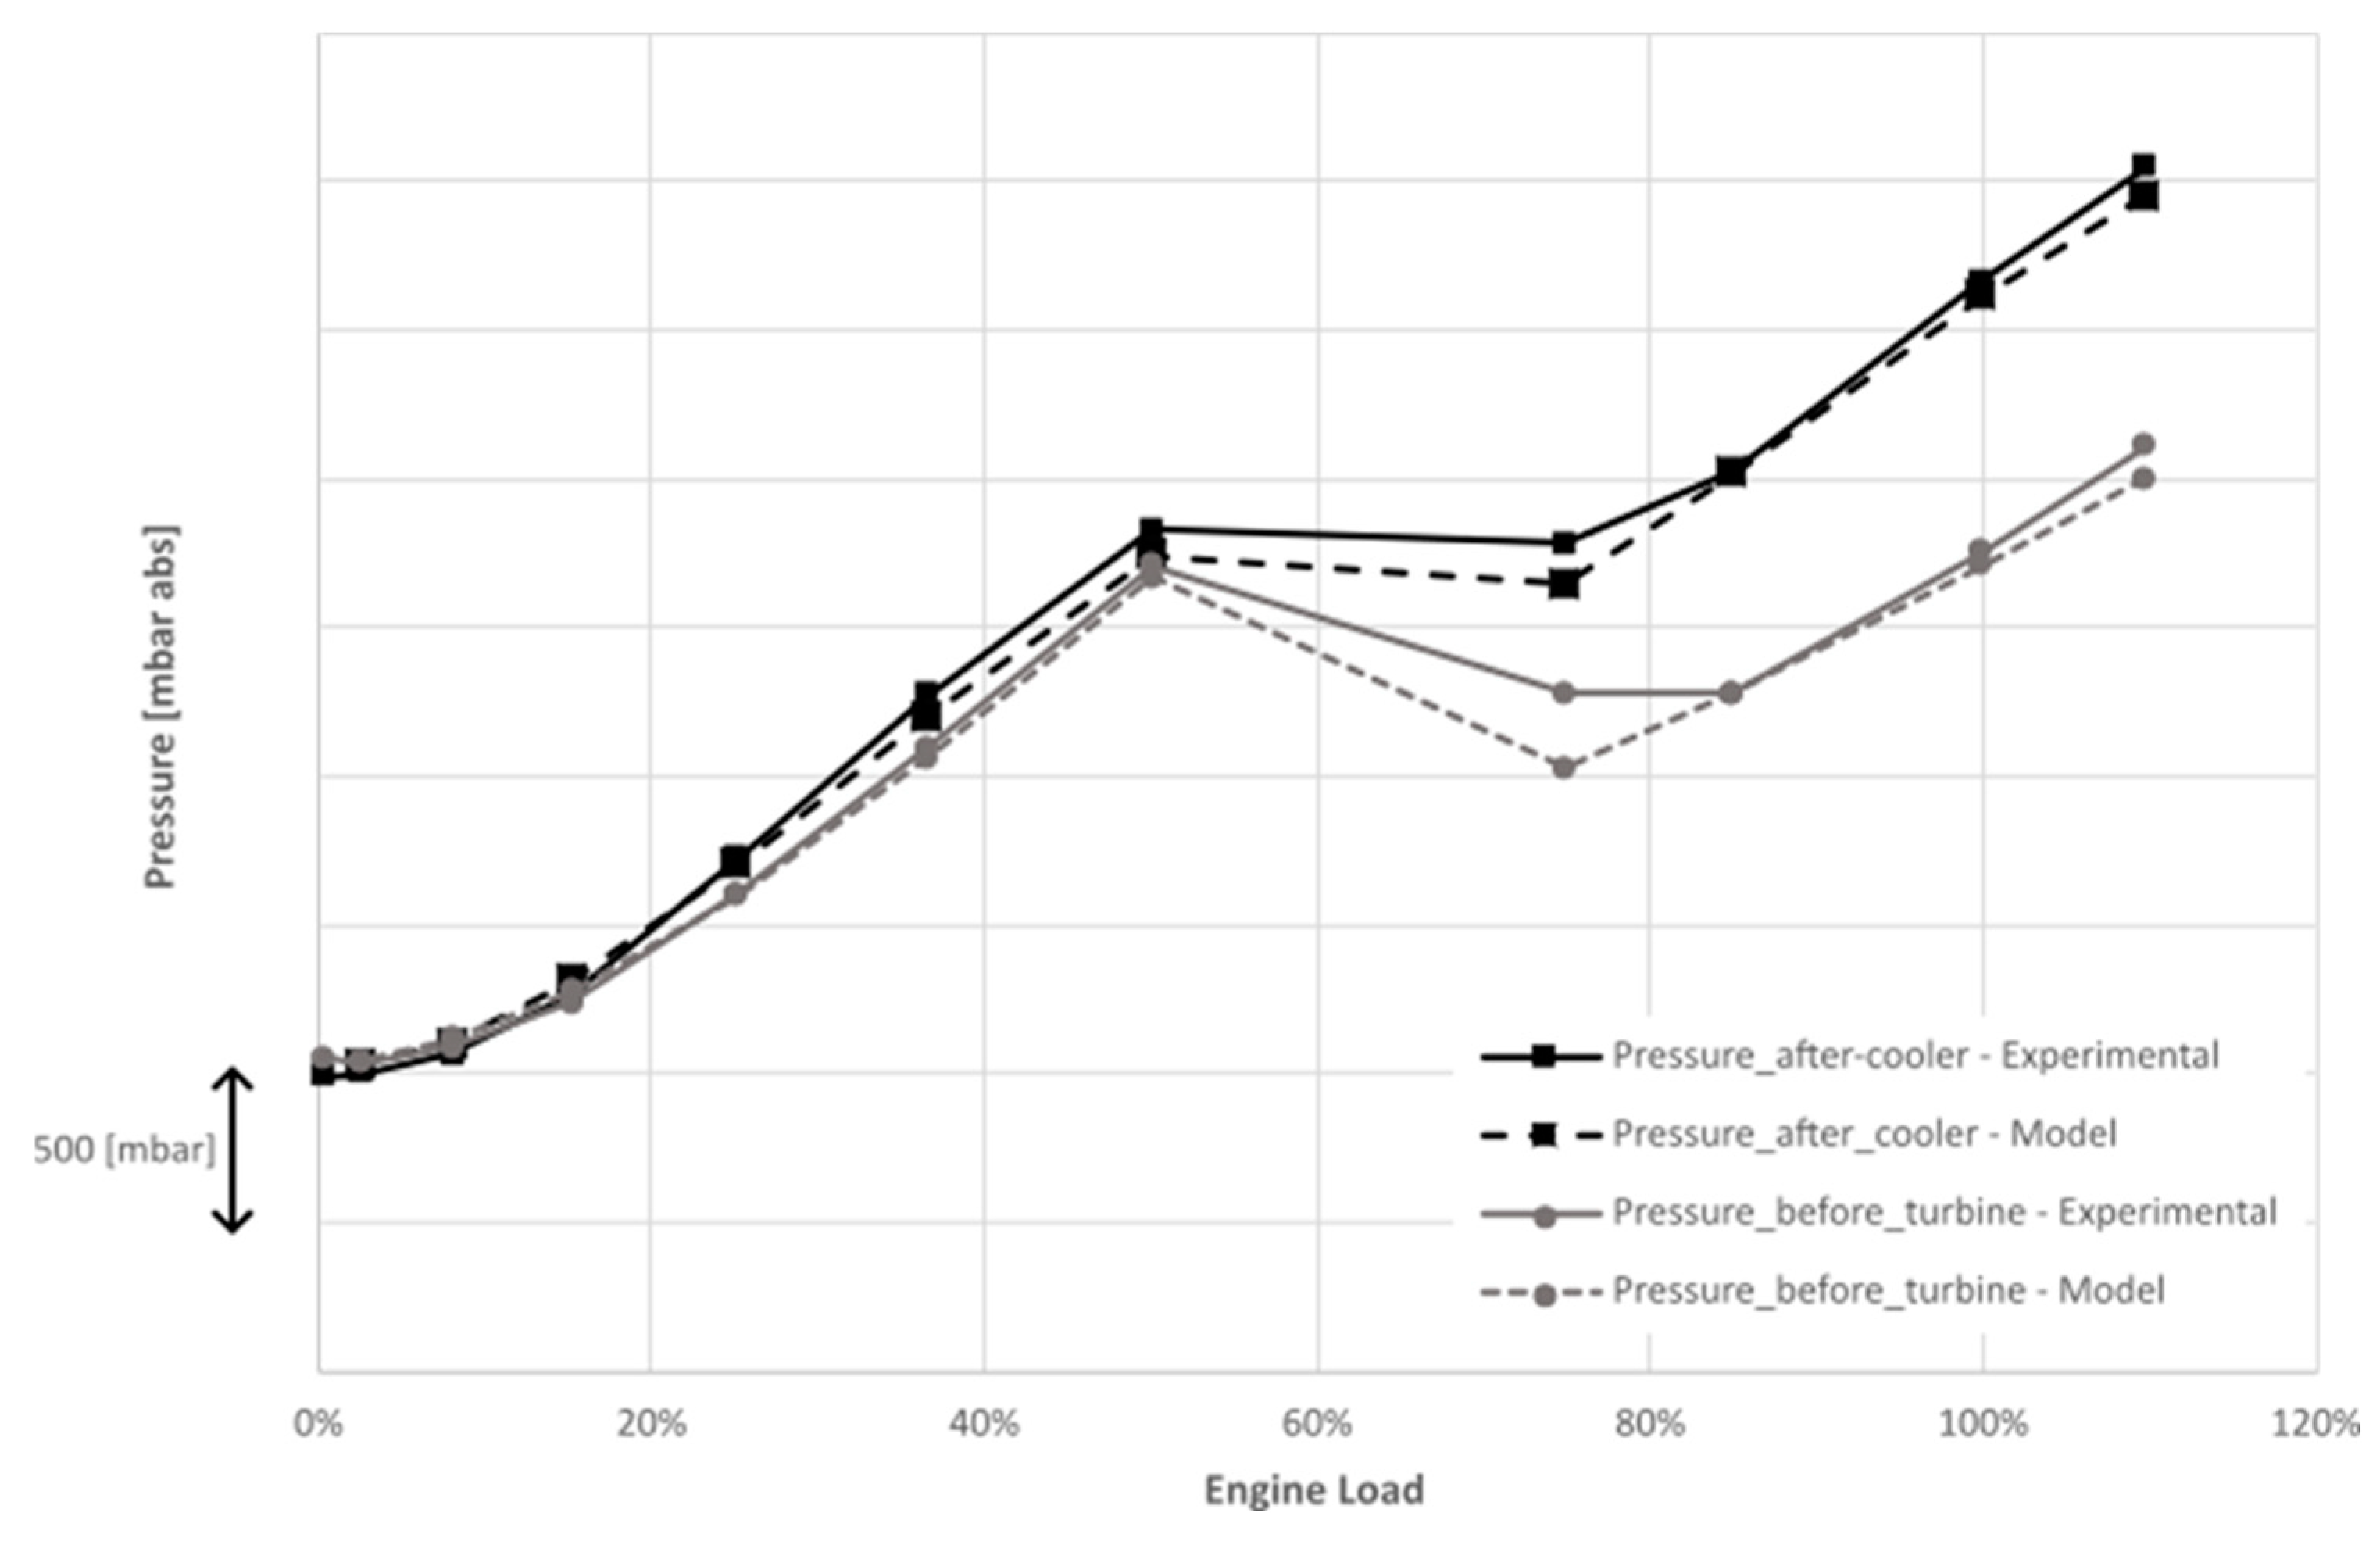
Figure 4 compares the pressure measurements and model after the compressor and before the turbine of the turbochargers, and lastly,
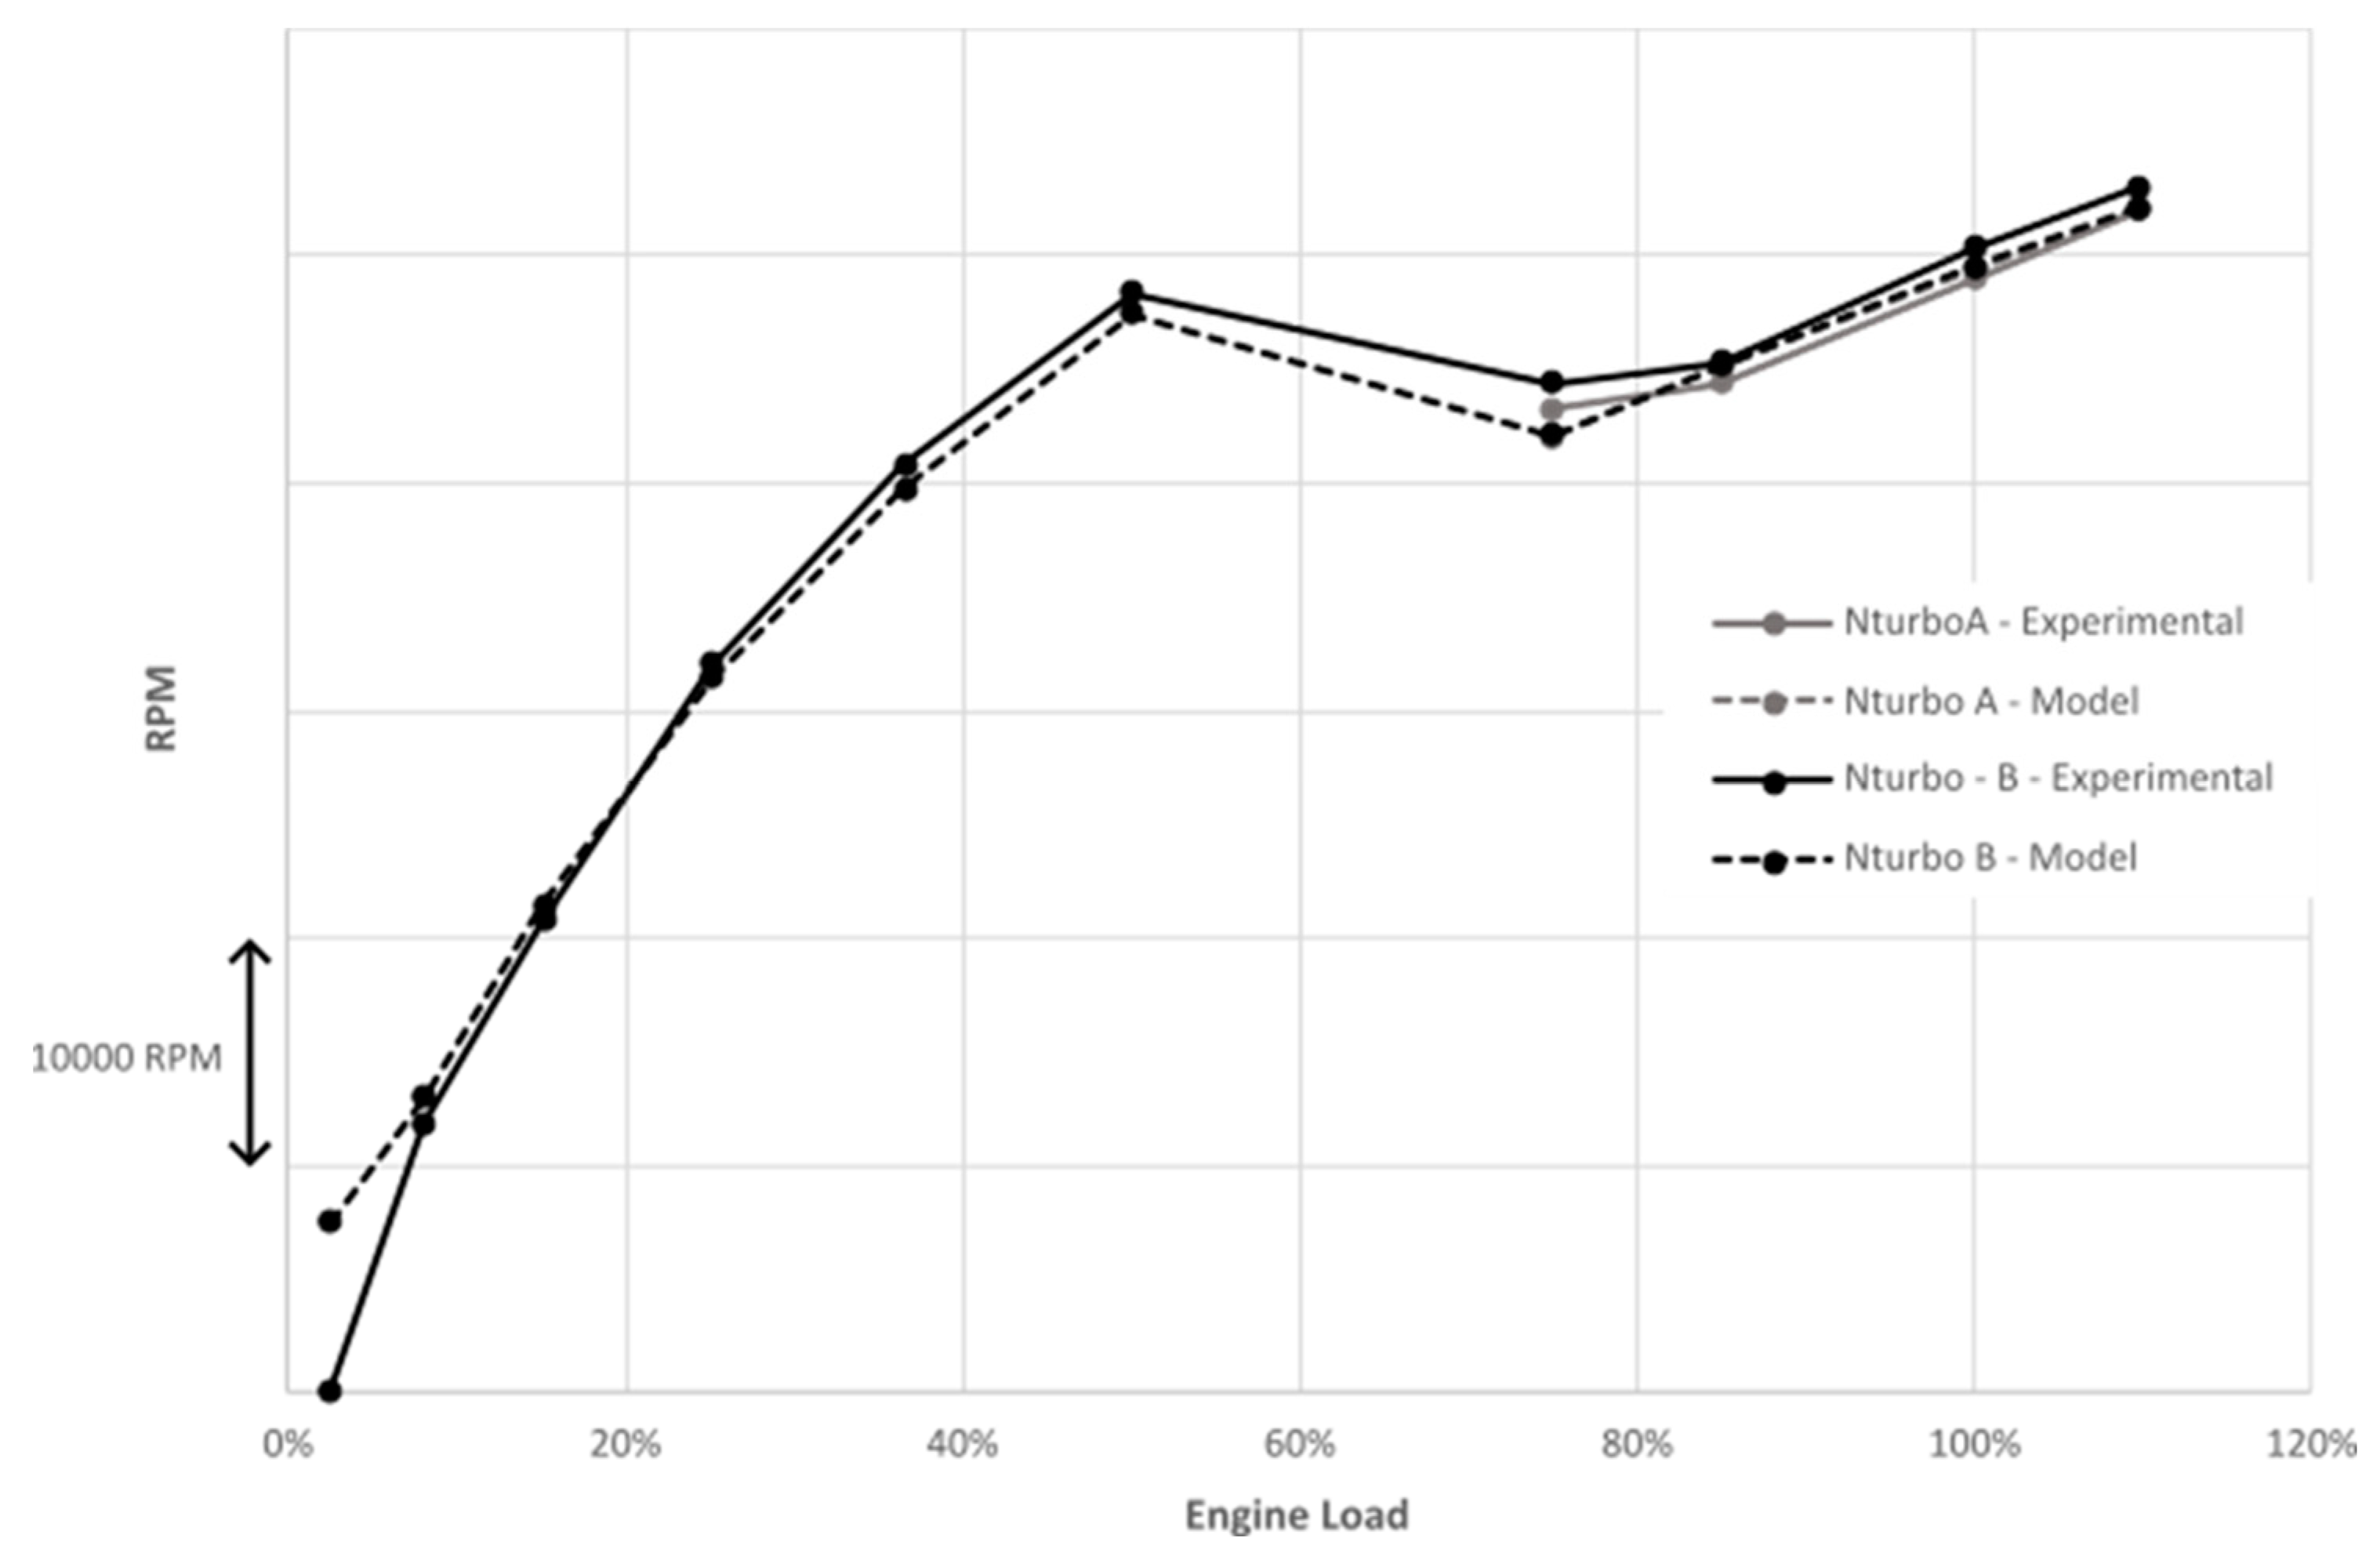
Figure 5 compares the turbocharger speed between measurements and model. In all comparisons, the engine is running along the propeller law of
Figure 2. The parallel turbochargers are operating here sequentially, with the second turbocharger being activated at loads above 50%. The sequential parallel turbocharger is not a common practice for marine civil applications, for this reason the study considers simple parallel turbocharging without deactivating/activating ability. The model has good predictability of the turbocharger operating conditions of pressure, temperature, and speed.
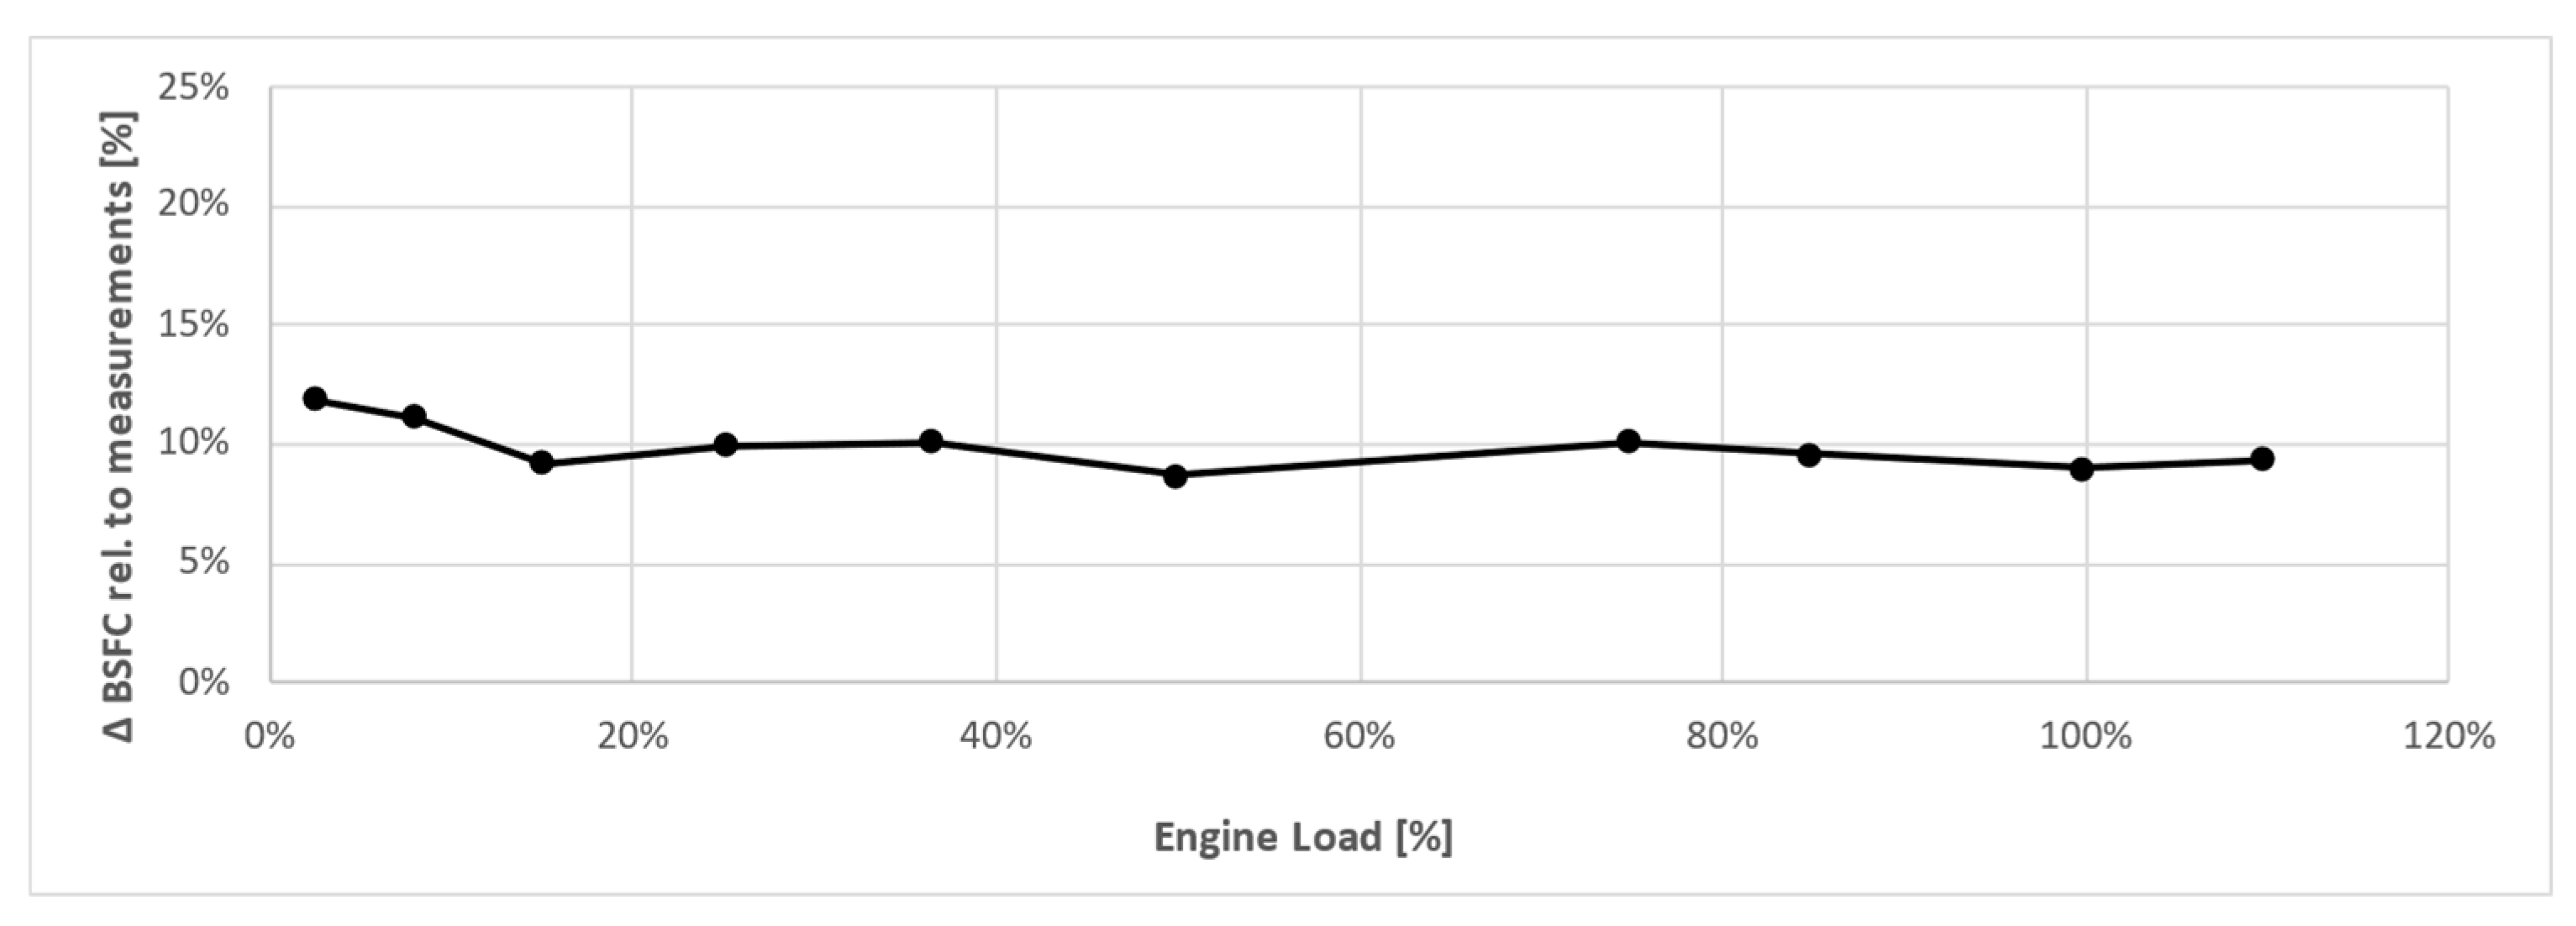
In terms of engine brake specific fuel consumption (BSFC), it is observed an average error of 9.89% almost constant along the propeller law, as seen in
Figure 6 (standard-deviation of 0.985) between model and measurements. To avoid the influence of this error in the study, results of the modified engine will be shown relatively to the baseline engine.
Engines compliant with Tier III standards of the International Maritime Office (IMO) are equipped with a selective catalytic reduction (SCR) filter. The baseline engine and the optimized engine require the presence of this element. Due to the difficulty of knowing the exact characteristics of the SCR, it was decided to not integrate it in the simulation. Eventually, its impact on the engine back-pressure will be considered the same in both cases (considered same size of SCR).
The PA6B engines use individual conventional plunger jerk-type fuel pumps, with a constant fixed start of injection (SOI). The 4V prototype engine is equipped with new fuel pump technology for these large engines. The electronic fuel injection, almost standard in small-vehicle applications, has been recently adopted for the 4V engine. The fuel pump uses the mechanics of the conventional plunger jerk-type fuel pump with a new electronic command for the fuel valve opening, which allows to adjust the SOI during engine operation. This was not possible with the conventional plunger jerk-type fuel pump. A proportional-integral-derivative (PID) controller acts on the duration of the injection, to regulate the injected mass of fuel. A feed-back loop from the brake power allows the PID to achieve the specific demanded target load.
The baseline configuration using simple parallel turbochargers is found by optimizing the intake and exhaust valve profiles and the SOI for each operating point with the single objective of reducing fuel consumption, while considering physical constraints such as maximum cylinder pressure, turbine inlet temperature, and surge-free operation.
The free-floating turbocharger is being characterized experimentally by the manufacturer in form of maps, regulated by the Society of American Engineers (SAE), known as SAE curves [
18]. These curves are obtained ensuring the compressor is not operating outside of the limits of choke and surge. For any operation inside these limits there are used specific interpolation methods [
19]. However, it is known that the turbine can operate outside the limits of the compressor [
20]. For this reason, a turbine model is adapted, based on the SAE curves, to extrapolate the turbine operation. The turbine model used is the model developed by Gamma Technologies (software GT-Power), as it is proved that it can outperform other 0D physic-based models [
21]. Both parallel turbochargers are identical, the size of the compressors and turbines is selected from the discretely available commercial turbochargers. A theoretically perfectly matched turbocharger is searched by adding mass-flow and pressure-rate multiplicators in both, the turbine and compressor maps. These multipliers are referred as turbomachine-size multipliers.
For comparison purposes, the theoretically perfectly matched turbocharged engine, referred to as baseline-optimized, is included in the study. This configuration, similar to the baseline engine, is obtained by optimizing the SOI and the moment of opening and closing of intake and exhaust valves, with the single objective to reduce fuel consumption. The difference between baseline and baseline-optimized is that the four turbomachine-size multipliers are added to the optimization of the baseline-optimized configuration.
Table 2 shows the characteristics of the baseline-optimized configuration in terms of baseline values.
2.2. Elements of the Hybrid Electric Air-Charging Architecture
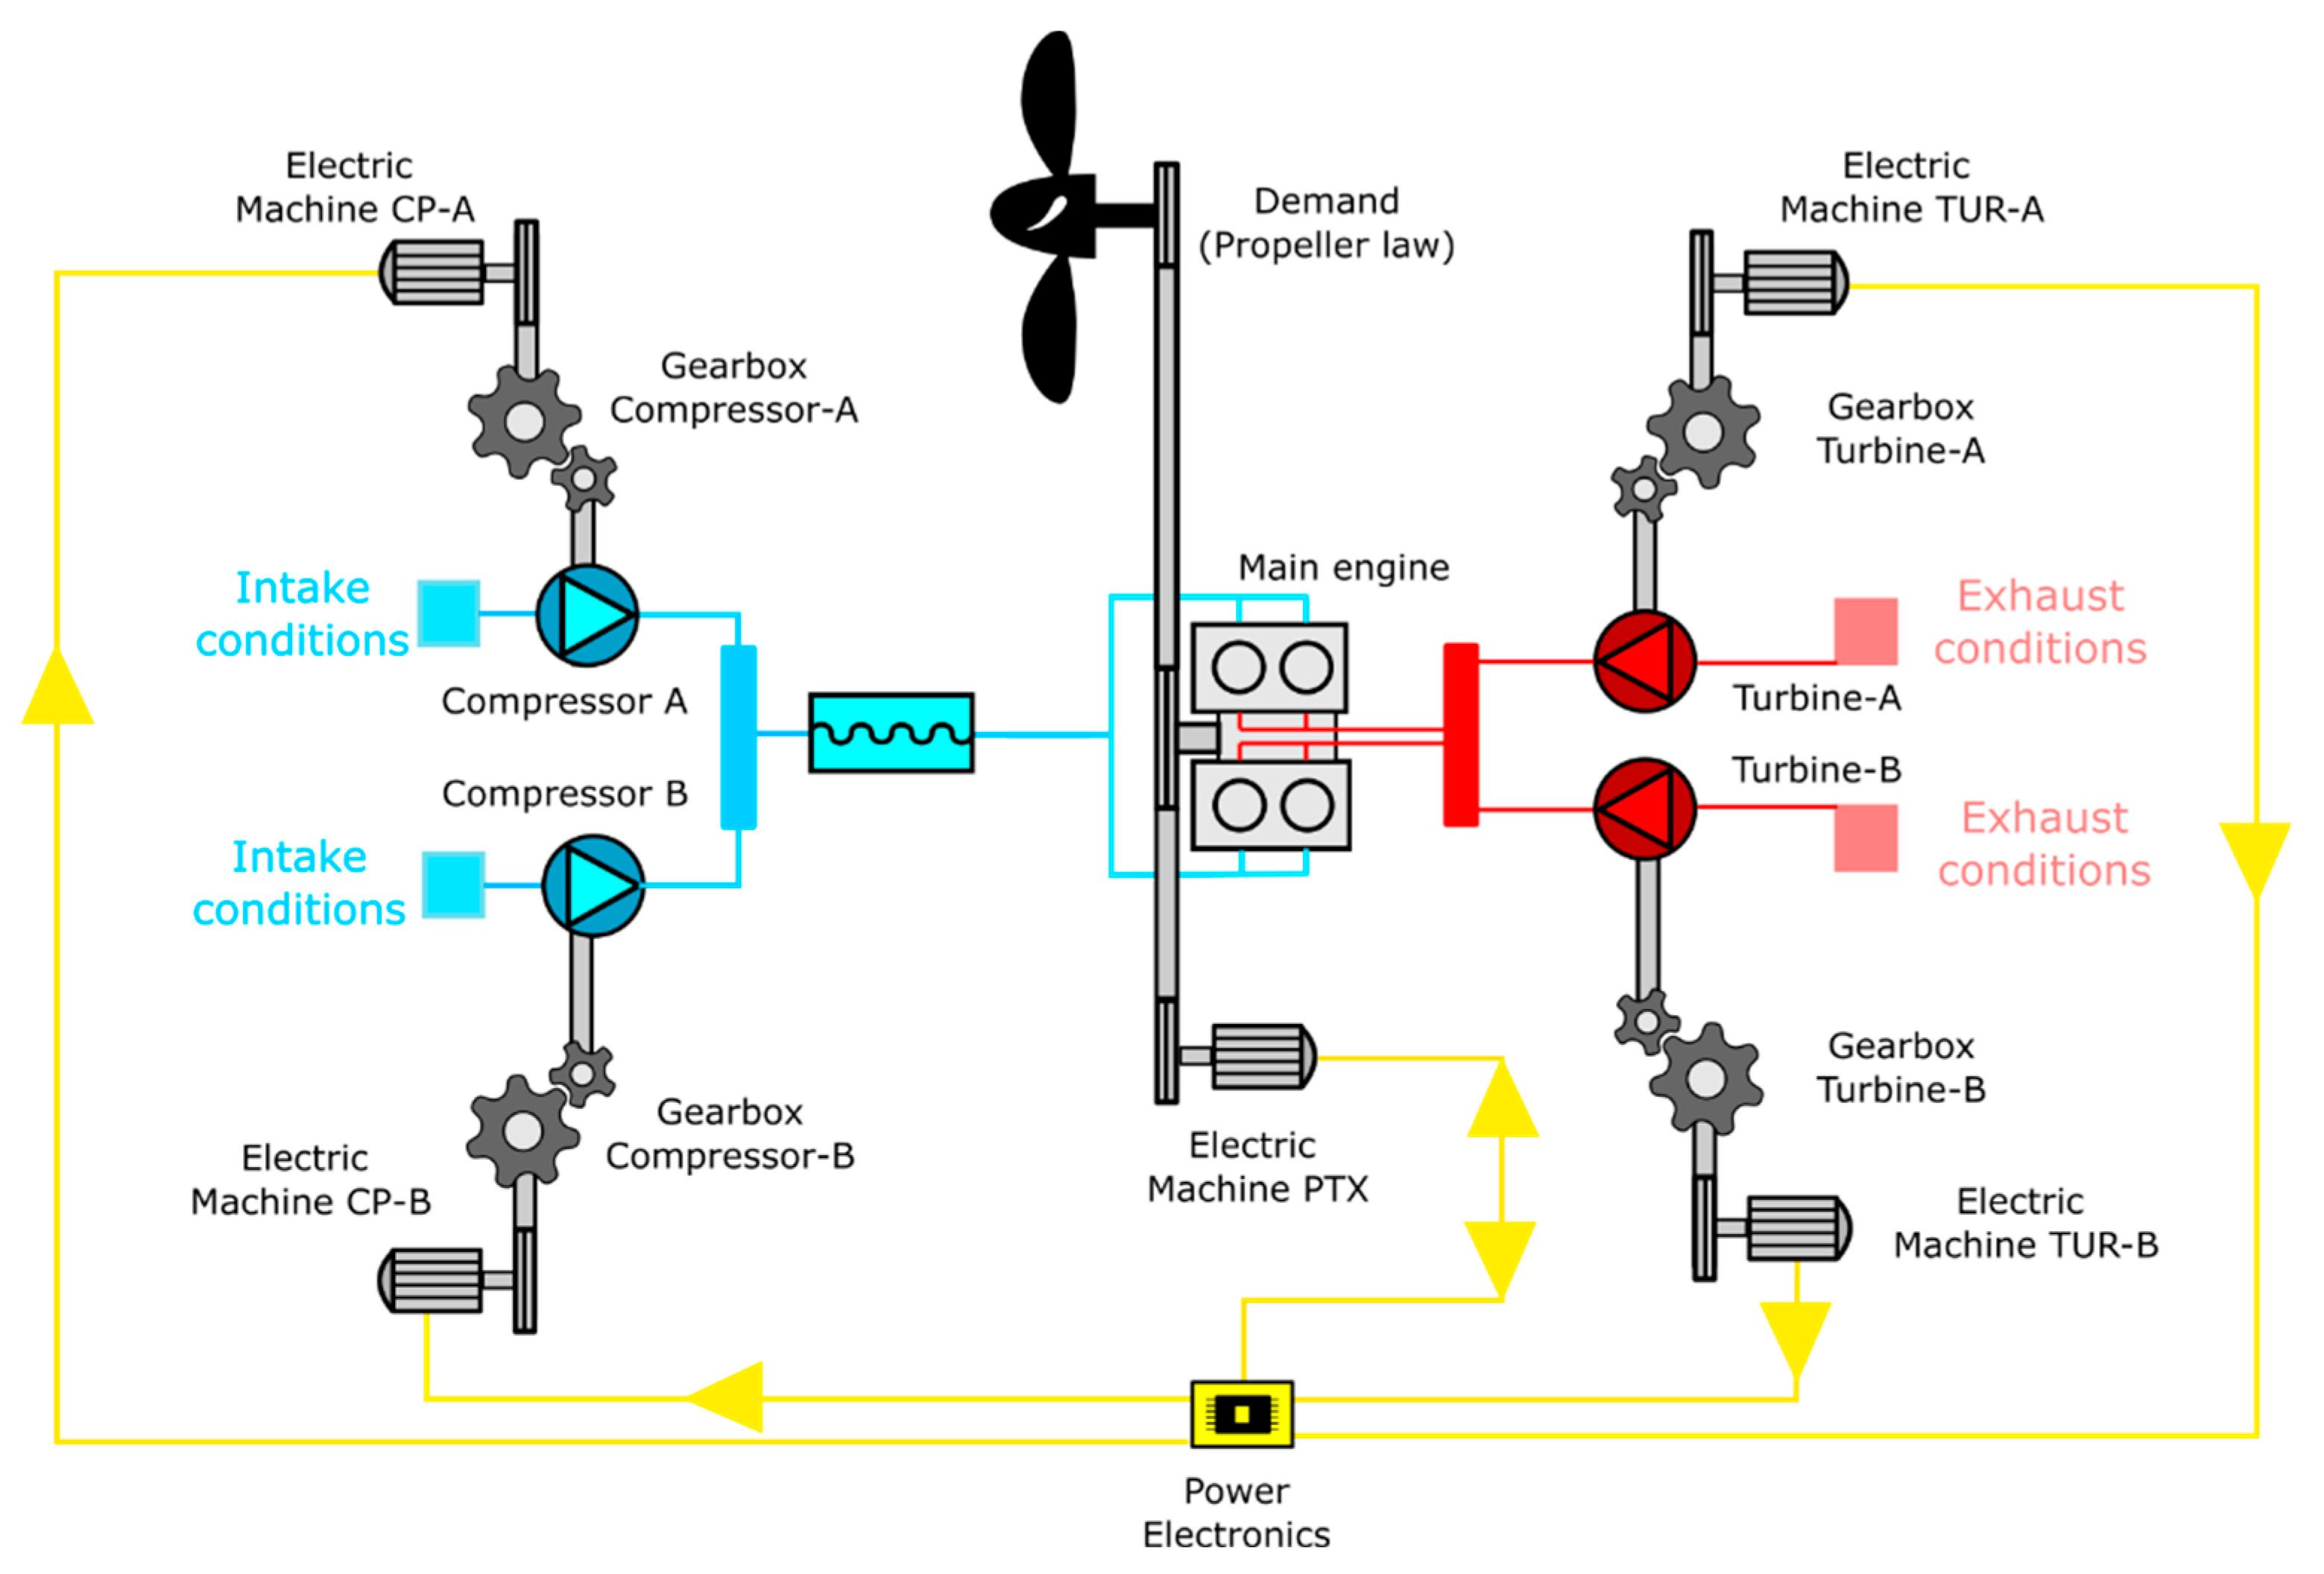
The modified air-charging architecture consists of an electrically split turbocharging system, as seen in
Figure 7. The two turbochargers are separated using electric machines (EMs), with each turbine connected to an electric generator, and each compressor connected to an electric motor. Additionally, an EM acting as a shaft-motor-generator (PTX) is added to the engine crankshaft output. This PTX can function as a motor, also known as power-take-in (PTI), and as a generator, or power-take-off (PTO).
In the following sections there are presented the elements that constitute the electric hybrid air-charging system of this study.
2.2.1. Power Electronics
In
Figure 7, the power electronics model represents the controller and converter of electric power between EMs, in an energetic approach. As the study does not include a battery at this stage, the power electronics model is configured to maintain an electric power balance. This means that all the electric power produced is being consumed. Without considering conversions losses, this statement can be expressed in terms of the power of the EMs using equation 1,
this equation implies that if there is a surplus power from the turbines, the PTX will operate as a motor, reducing the engine power to maintain the same system brake power, and vice versa.
The conversion losses depend on the arrangement chosen for the power converter. In
Figure 8 there are shown two possible arrangements of converters to be used in a propulsion plant. The most used arrangement in hybrid propulsion plants is the use of individual converters for every component (
Figure 8a), in this arrangement each converter represents a single stage of conversion losses. On the other hand, multiport converters are a relatively new technology in which the conversion is made by a single centralized unit [
22]. This arrangement has the particularity to reduce conversion losses and reduce complexity in the control, in expense of cost of the unit. For its high efficiency, this study considers the converter as a multiport arrangement.
Conversion efficiency of the electrical system of
Figure 8b is expressed differently whether the PTX is working as a generator or as a motor, as shown in equation 2.
Previous studies in the literature have determined the conversion efficiency of single inductor arrangements to be around 94 and 97% [
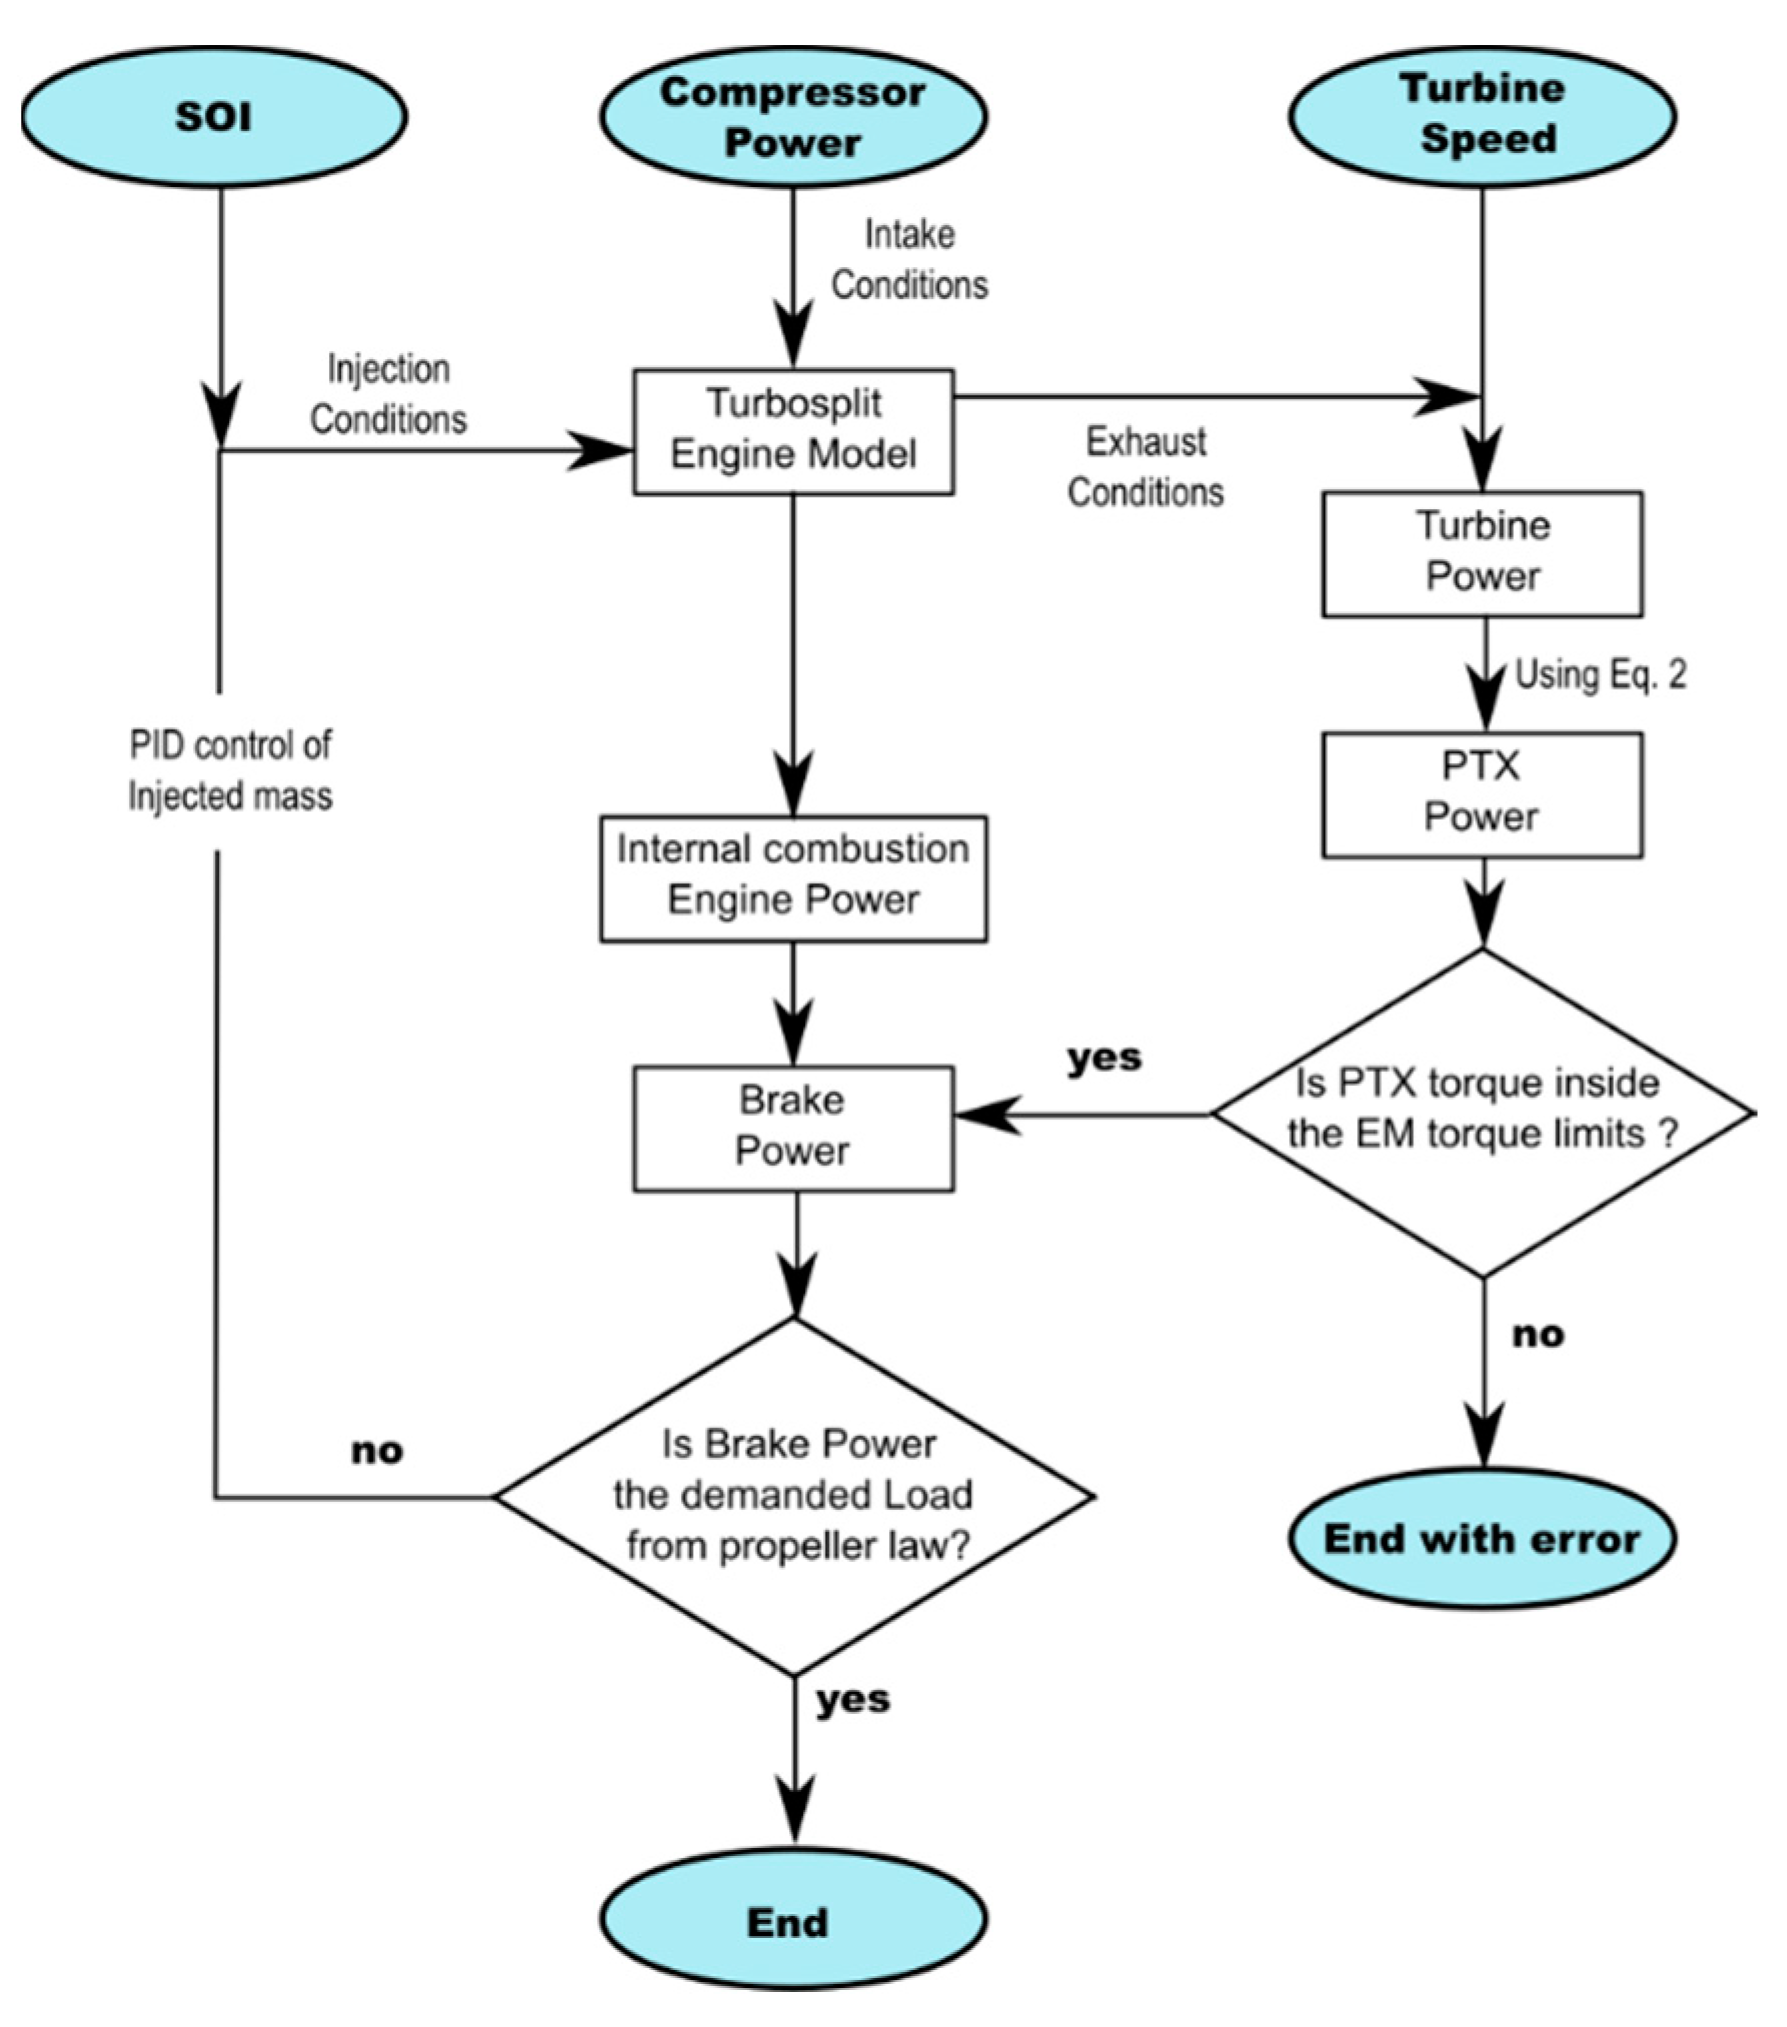
23]. This efficiency depends on factors such as the switching frequency and other variables that are beyond the scope of this study. For this reason, we consider it constant and equal to 95%. The equation 2 allows to determine the electric demand from the PTX based on the production and consumption of turbine and compressor. The diagram of
Figure 9 summarizes how this strategy is integrated in the system, only end conditions without errors are taken as valid solutions. A proper initialization and other convergence criteria avoid falling into the error end before the steady state has been achieved.
2.2.2. Electric Machines
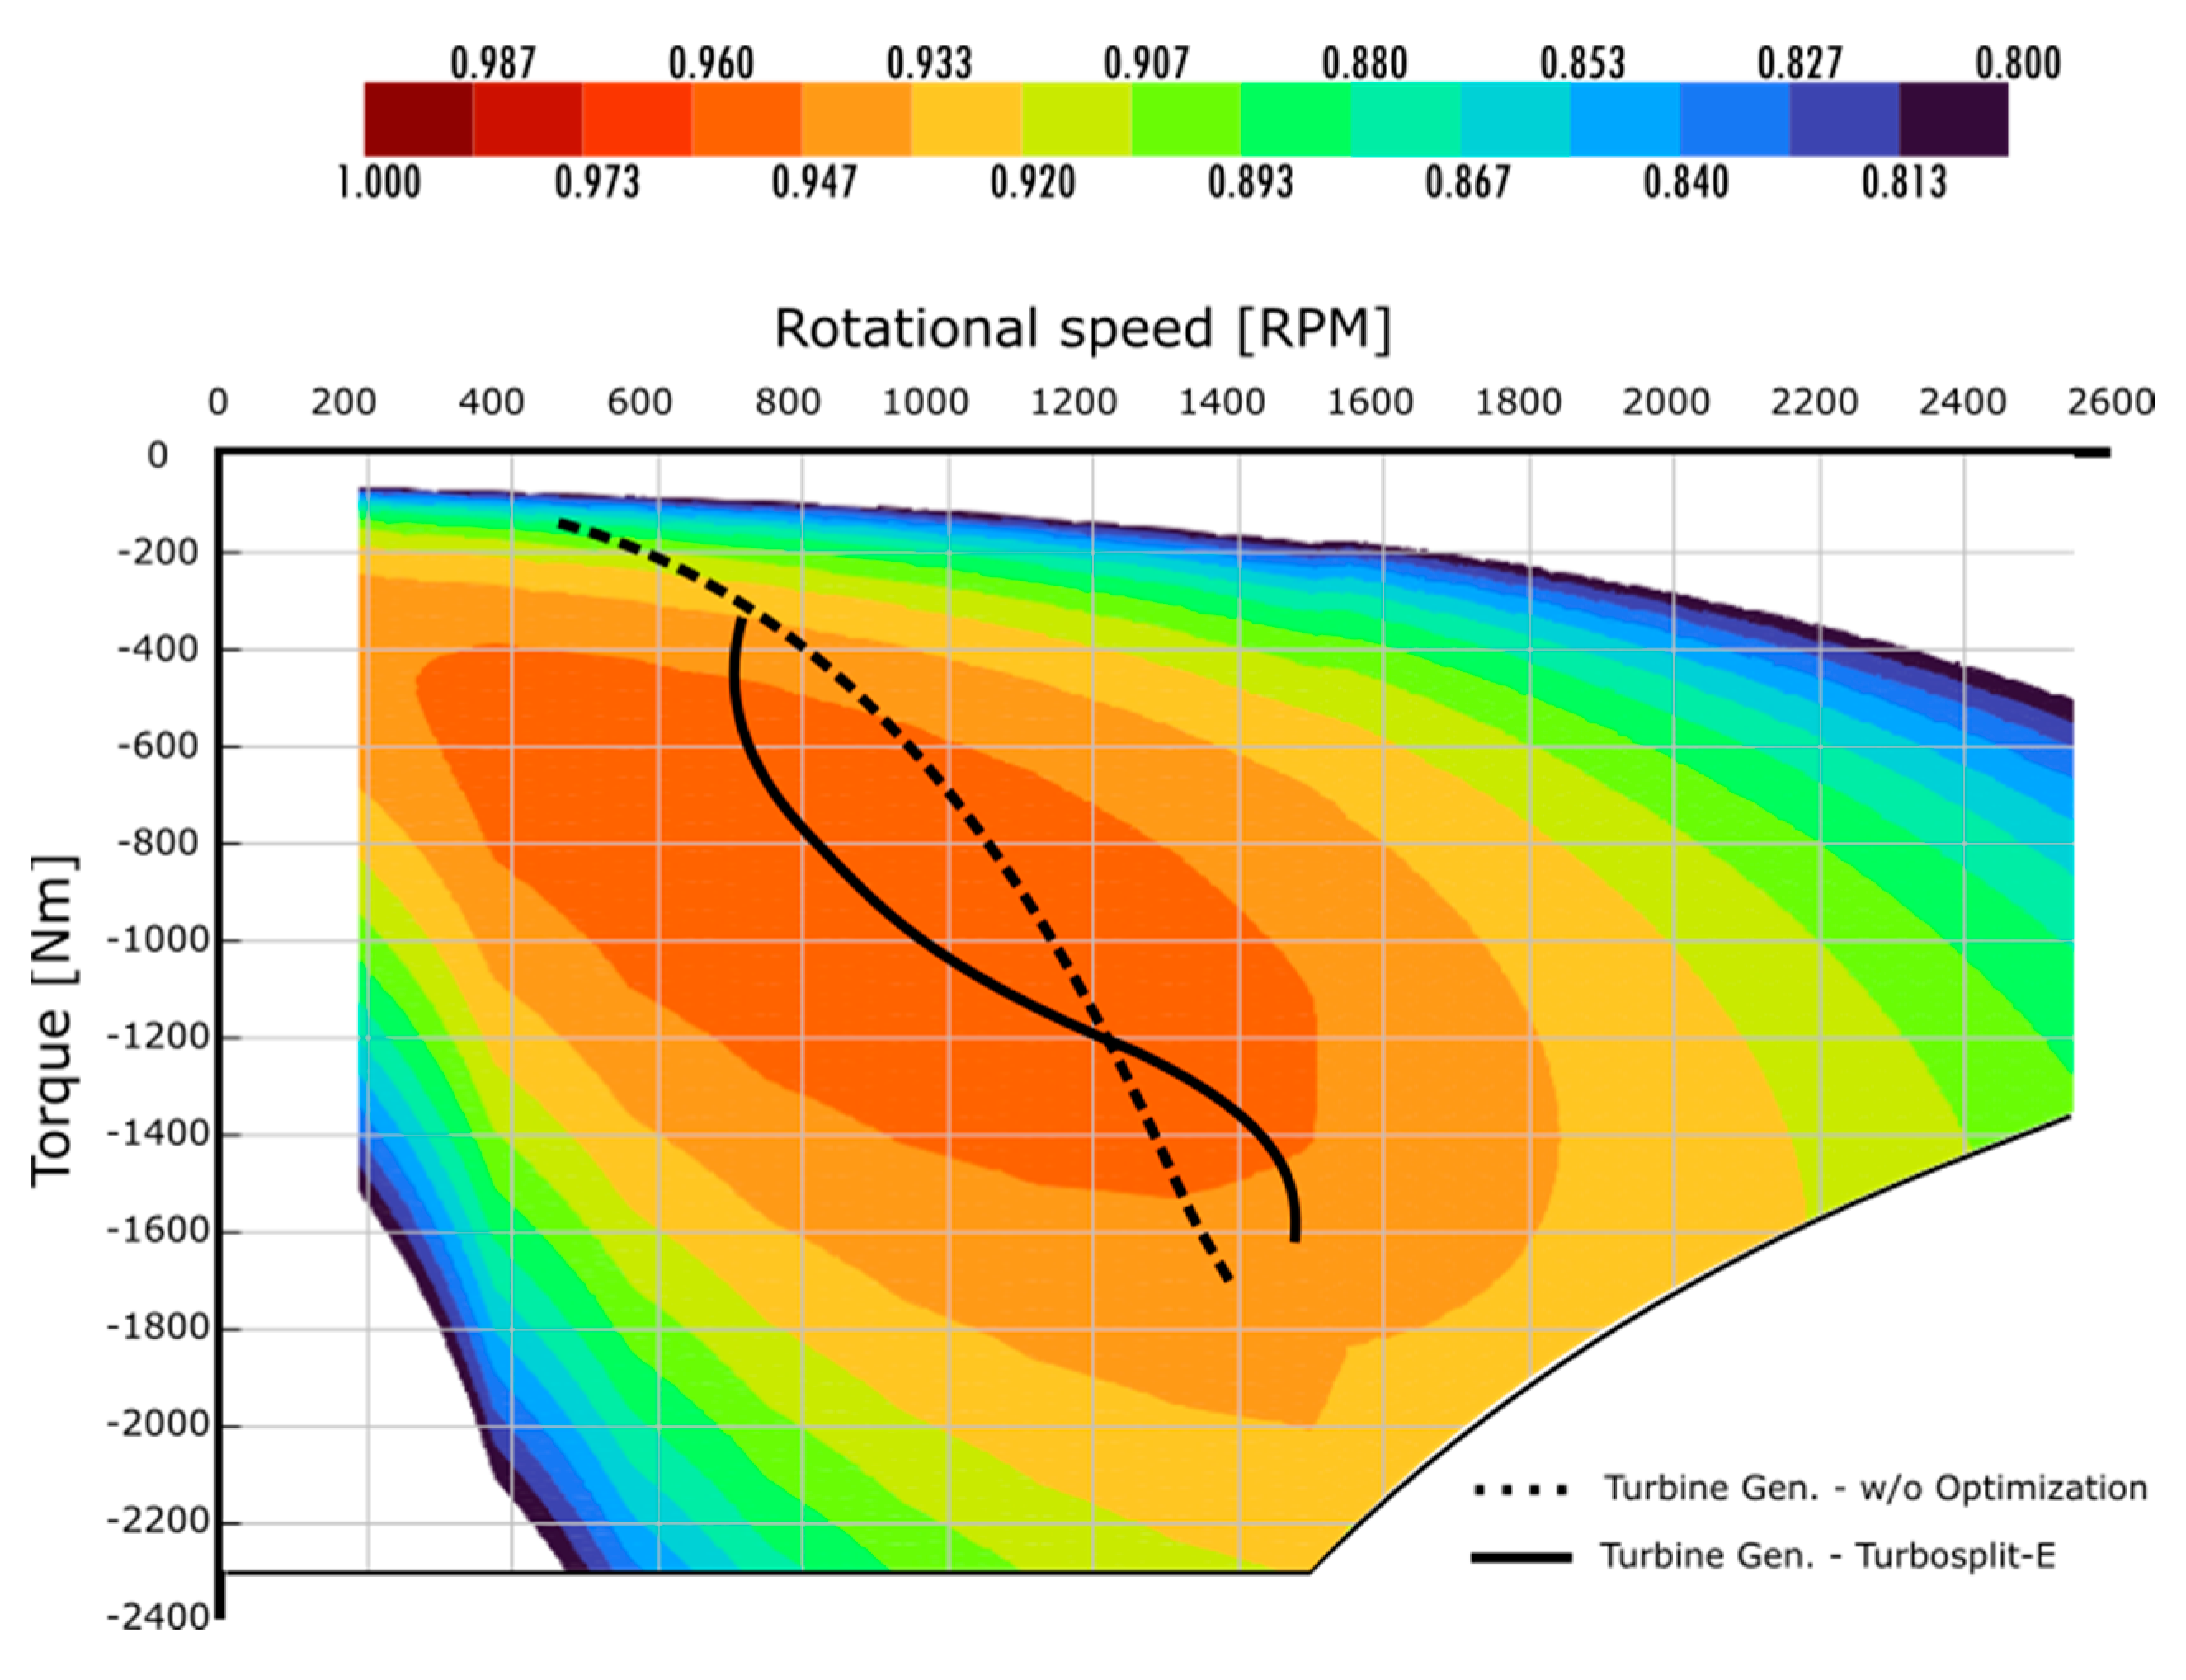
The electromechanical efficiency of an EM varies according to the speed and torque on the shaft. This efficiency is typically represented on contour maps with rotational speed and torque on x and y axis, respectively. For this study, we selected the surface permanent magnets (SPM) type of machine, as it is the most commonly used type of EM for forced air-charging applications [
24].
It is a common practice to model the electromechanical efficiency of EMs as a constant efficiency value, however this study treats the EMs as maps to obtain a detailed approach of the losses in the system. To model the electromechanic efficiency of the EMs there are two possible approaches: physic-based models and regression models. The regression model proposed by Mahmoudi et al. [
25] require much less information than any physical model to create a map of electromechanic efficiency. For the theoretical electric machines in this study, the nominal losses are dimensioned to limit the maximum efficiency to 96%, as most of permanent magnet EMs [
26].
The EM mounted on the main engine shaft (PTX) is represented in the model with a value of requested electrical power and a map of electromechanical efficiency. The output of the model is the mechanical output power on the shaft. Nominal torque and base speed are selected from an existing EM used for marine applications. This EM is the only in the model capable of working as a motor (positive torque) and as a generator (negative torque). The compressor is driven by a motor, both elements are connected via a gearbox. The modeling principles of the motor are the same used in the PTX, electromechanical efficiency to determine mechanical power given an electric demanded power.
The turbine cannot be modeled using the same principles of previous machines. Imposing an electric demanded power in the generator creates a constant resistive torque, while the turbine can provide different torques according to the gas conditions. If the turbine produces more torque than the EM is resisting, the speed of the system increases creating over-speeding. If the turbine produces less torque, the system speed reduces progressively until the complete stop of the shaft. For this reason, the turbine arrangement is controlled with the rotating speed, a sensor reads the power produced by the turbine at the imposed speed and imposes the same resistive power in the generator. This control strategy for power recovery turbines has already been employed in other studies [
27].
Both gas-lines, A and B, are controlled equally. This arrangement creates two new degrees of freedom in the system, the compressor electric power and the turbine speed. The PTX power is a consequence of the operation of both (see equation 2).
The dimensioning of the compressor motor and turbine generator, and their gearboxes, is carried using the maximum allowable speed of the turbocharger, 56500 RPM, and the maximum allowable power, estimated around 300 kW. With these characteristics, the combination of EM and gearbox selected is shown in
Table 3 and
Table 4. The PTX is considered connected via a direct-drive connection to the crankshaft, due to the relative low engine speed (1050 RPM maximum) and the power is considered arbitrarily a 15% of engine nominal power. The mechanical efficiency of the gearbox is imposed as 99,3%.
2.2.3. Electric-Hybrid Air-Charging Model
The model of the electric hybrid air-charging architecture is implemented using the elements previously described. The
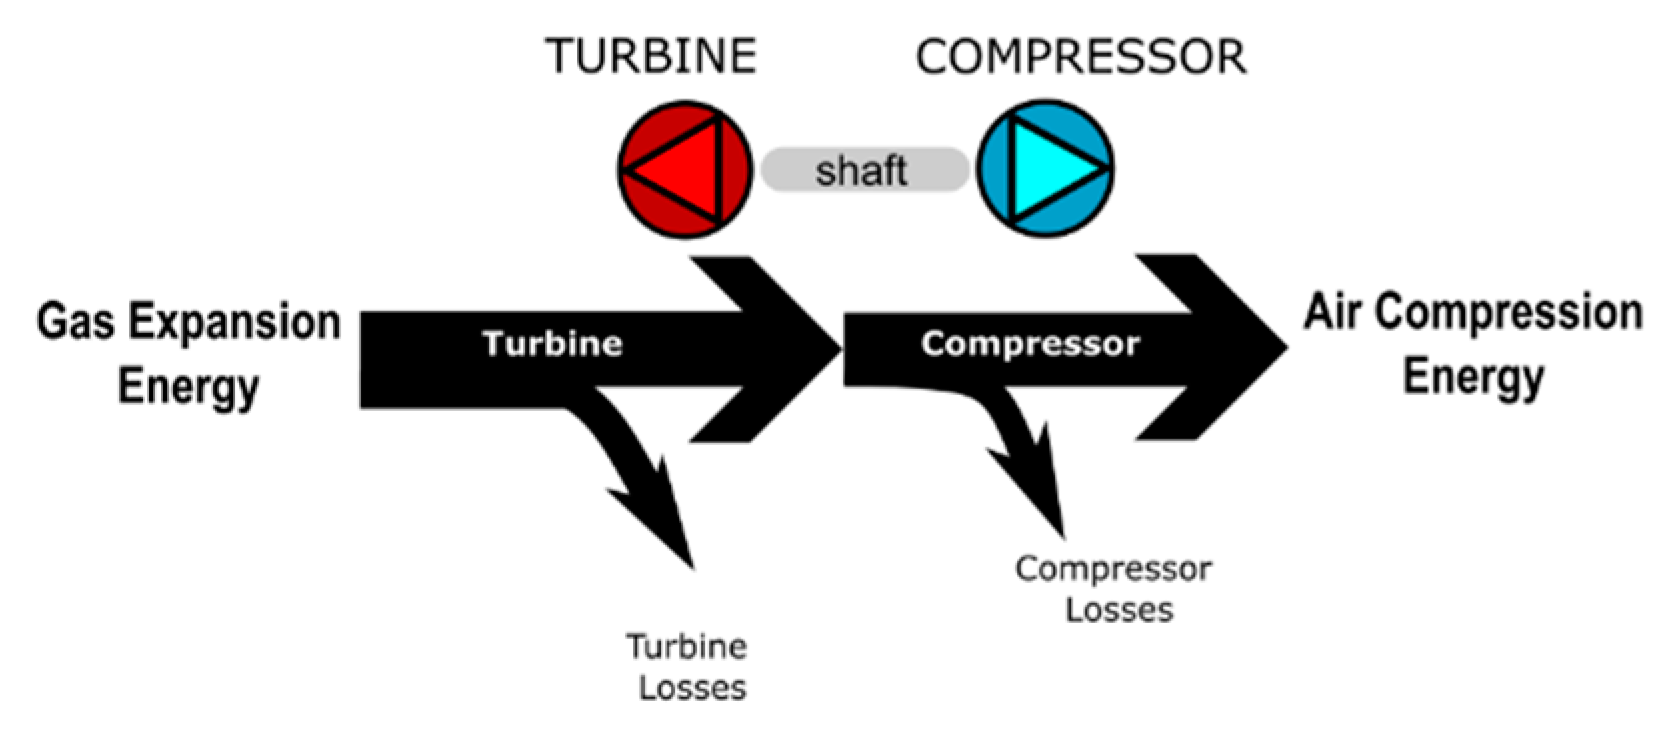
Figure 10 shows the energy losses on a turbocharger diagram. Generally, on turbocharger SAE maps, turbocharger mechanical efficiency is not measured separately, as it is already included in turbine SAE map as turbine efficiency [
28]. In this study, the efficiency of the shaft is included in the turbine SAE map.
Figure 11 illustrates the efficiency chain on the electrically separated turbocharger. According to this efficiency chain, if the electromechanical, gearbox efficiency and conversion efficiency are equal to one, the remaining efficiency chain becomes equivalent to the turbocharger efficiency shown in
Figure 10. The losses in the air-charging system would be only due to the turbine and compressor efficiencies.
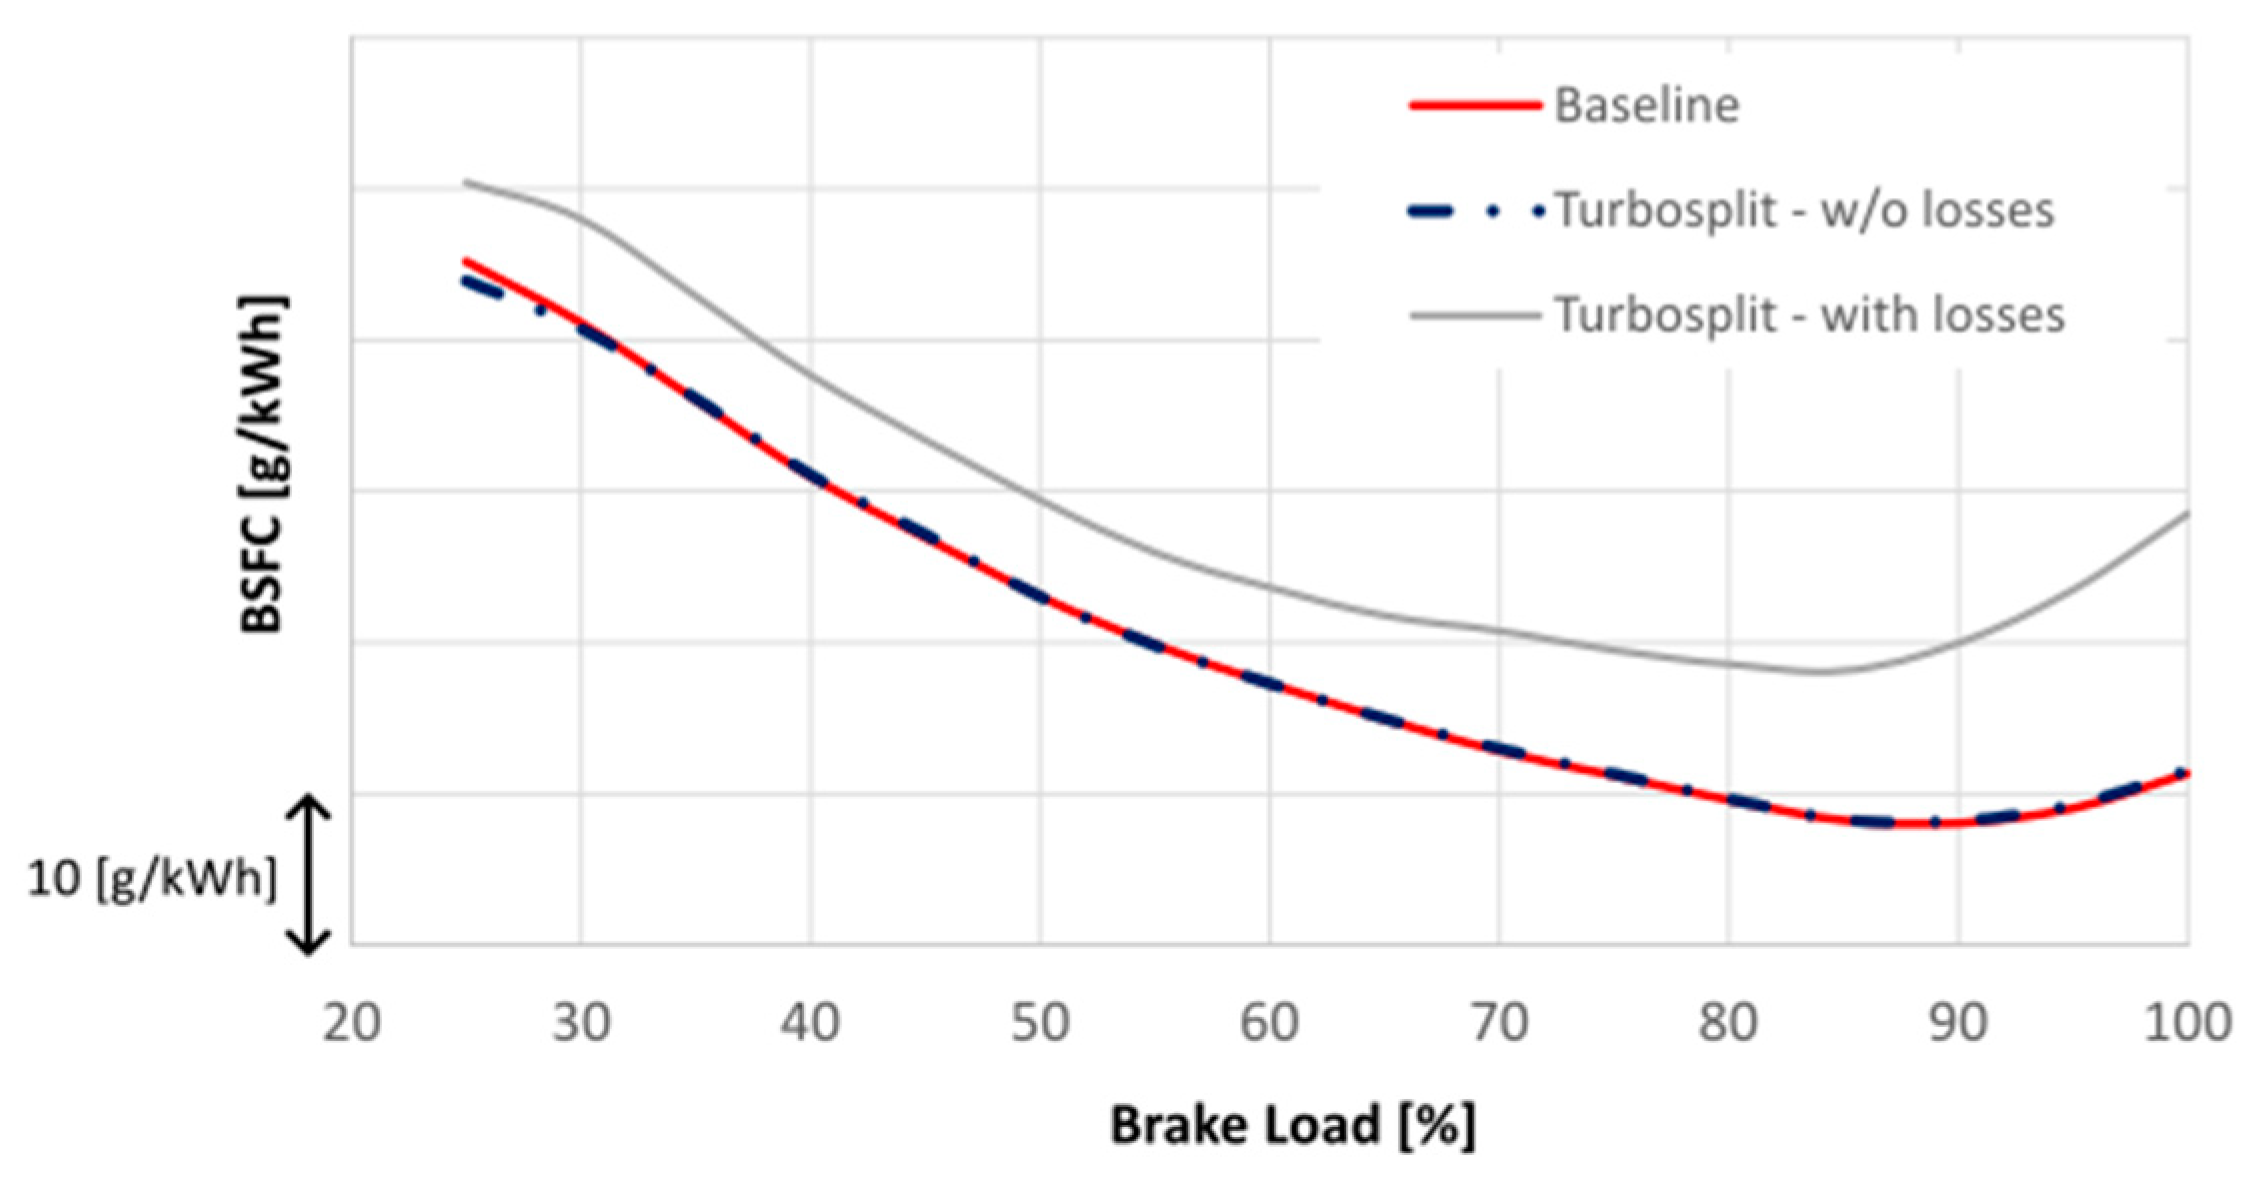
To verify that the electric-hybrid model is equivalent to the baseline, an initial test was conducted with all the electromechanical, gearboxes, and conversion efficiencies set to one. By matching the compressor power and turbine speed of the baseline turbocharger configuration, the electrical turbocharger successfully reproduces the results of fuel consumption of baseline as shown in
Figure 12. When the efficiency is set back to values below 100% from the models described before, the system increases fuel consumption as new losses are now introduced in the system.
2.3. Optimization Methodology
The objective of the study is to provide a retrofit solution which increase efficiency of marine propulsion diesel engines. In this context, the propeller of the vessel is assumed to be kept same as the baseline, which means the brake power of the Turbosplit architecture follows the same propeller law.
The hybridization of the air-charging system and the addition of the EM in the engine’s shaft introduces a variety of degrees of freedom to the system. The dimensioning of these, together with the re-tuning of the internal combustion engine (ICE), is carried out through an optimization process. The optimization problem is composed by the factors listed in
Table 5 and the constraints listed in
Table 6. The single objective is to reduce average brake specific fuel consumption (BSFC) of the system. The BSFC of the system differs of the BSFC of the isolated engine, as the PTX machine changes the brake power (P
brake). System BSFC is calculated using equation 3,
Where the PTX mechanical power (P
mech,PTX) is positive if the EM is working as an PTI and negative if PTO. The average BSFC is calculated using a weighted summation of BSFC at four different operating points of the propeller law, defined in the procedure found in the ISO 8178-5, as seen in equation 4, this procedure is recommended by the International Maritime Office (E3 cycle) for average BSFC. The weights used are shown in
Table 7.
The design space is the space formed by all the possible input variables, or dimensions. For a low dimensional design space (below 3), it is possible to use brute-force research, which means evaluating all possible combinations. This method is not the most effective, but it provides a visual representation of the solution surface which allows for interpretability of the results. When the dimensions grow above of what can be graphically handled, the optimization is carried out with stochastic algorithms [
29], specifically in this case, the Genetic Algorithm (GA). The use of stochastic algorithms, however, difficult the interpretation of the influence of each factor.
From
Table 6, the design space is limited by the range of the variables. Turbine maximum speed and compressor maximum power are the maximum values from the turbocharger the turbine and compressor come from in the baseline. The SOI maximum advancement angle is the maximum that has been tested on the electronic fuel pump in the 4V engine. Size of turbomachines is limited to 25% times larger and smaller than baseline, as further scaling factors would require a correction in speed curves. Valve timing is modified by adding shifters for the crank-angle value corresponding to the opening and closing. These shifters act on angle value of the original cam profile. Important to note is that the shifter for the opening affects the whole cam profile; also affecting the moment of closing. This means that the effective closing angle is the addition of opening shifter and closing shifter. All shifters are arbitrarily limited to 30 degrees in advance and retard. For simplicity, the results will show the closing angle as the effective angle shift, by adding both shifters. This may result in the closing angle being effectively shifted beyond the 30-degree limit.
Additionally, there are included three physical constraints: the maximum inlet turbine temperature limited to protect the turbine blades; the maximum in-cylinder pressure as a limitation from the engine itself; and the compressor surge margin to ensure a surge-free operation. As retrofit have no intends to redesign the engine internal components and materials, all physical limits are considered same as baseline limits.
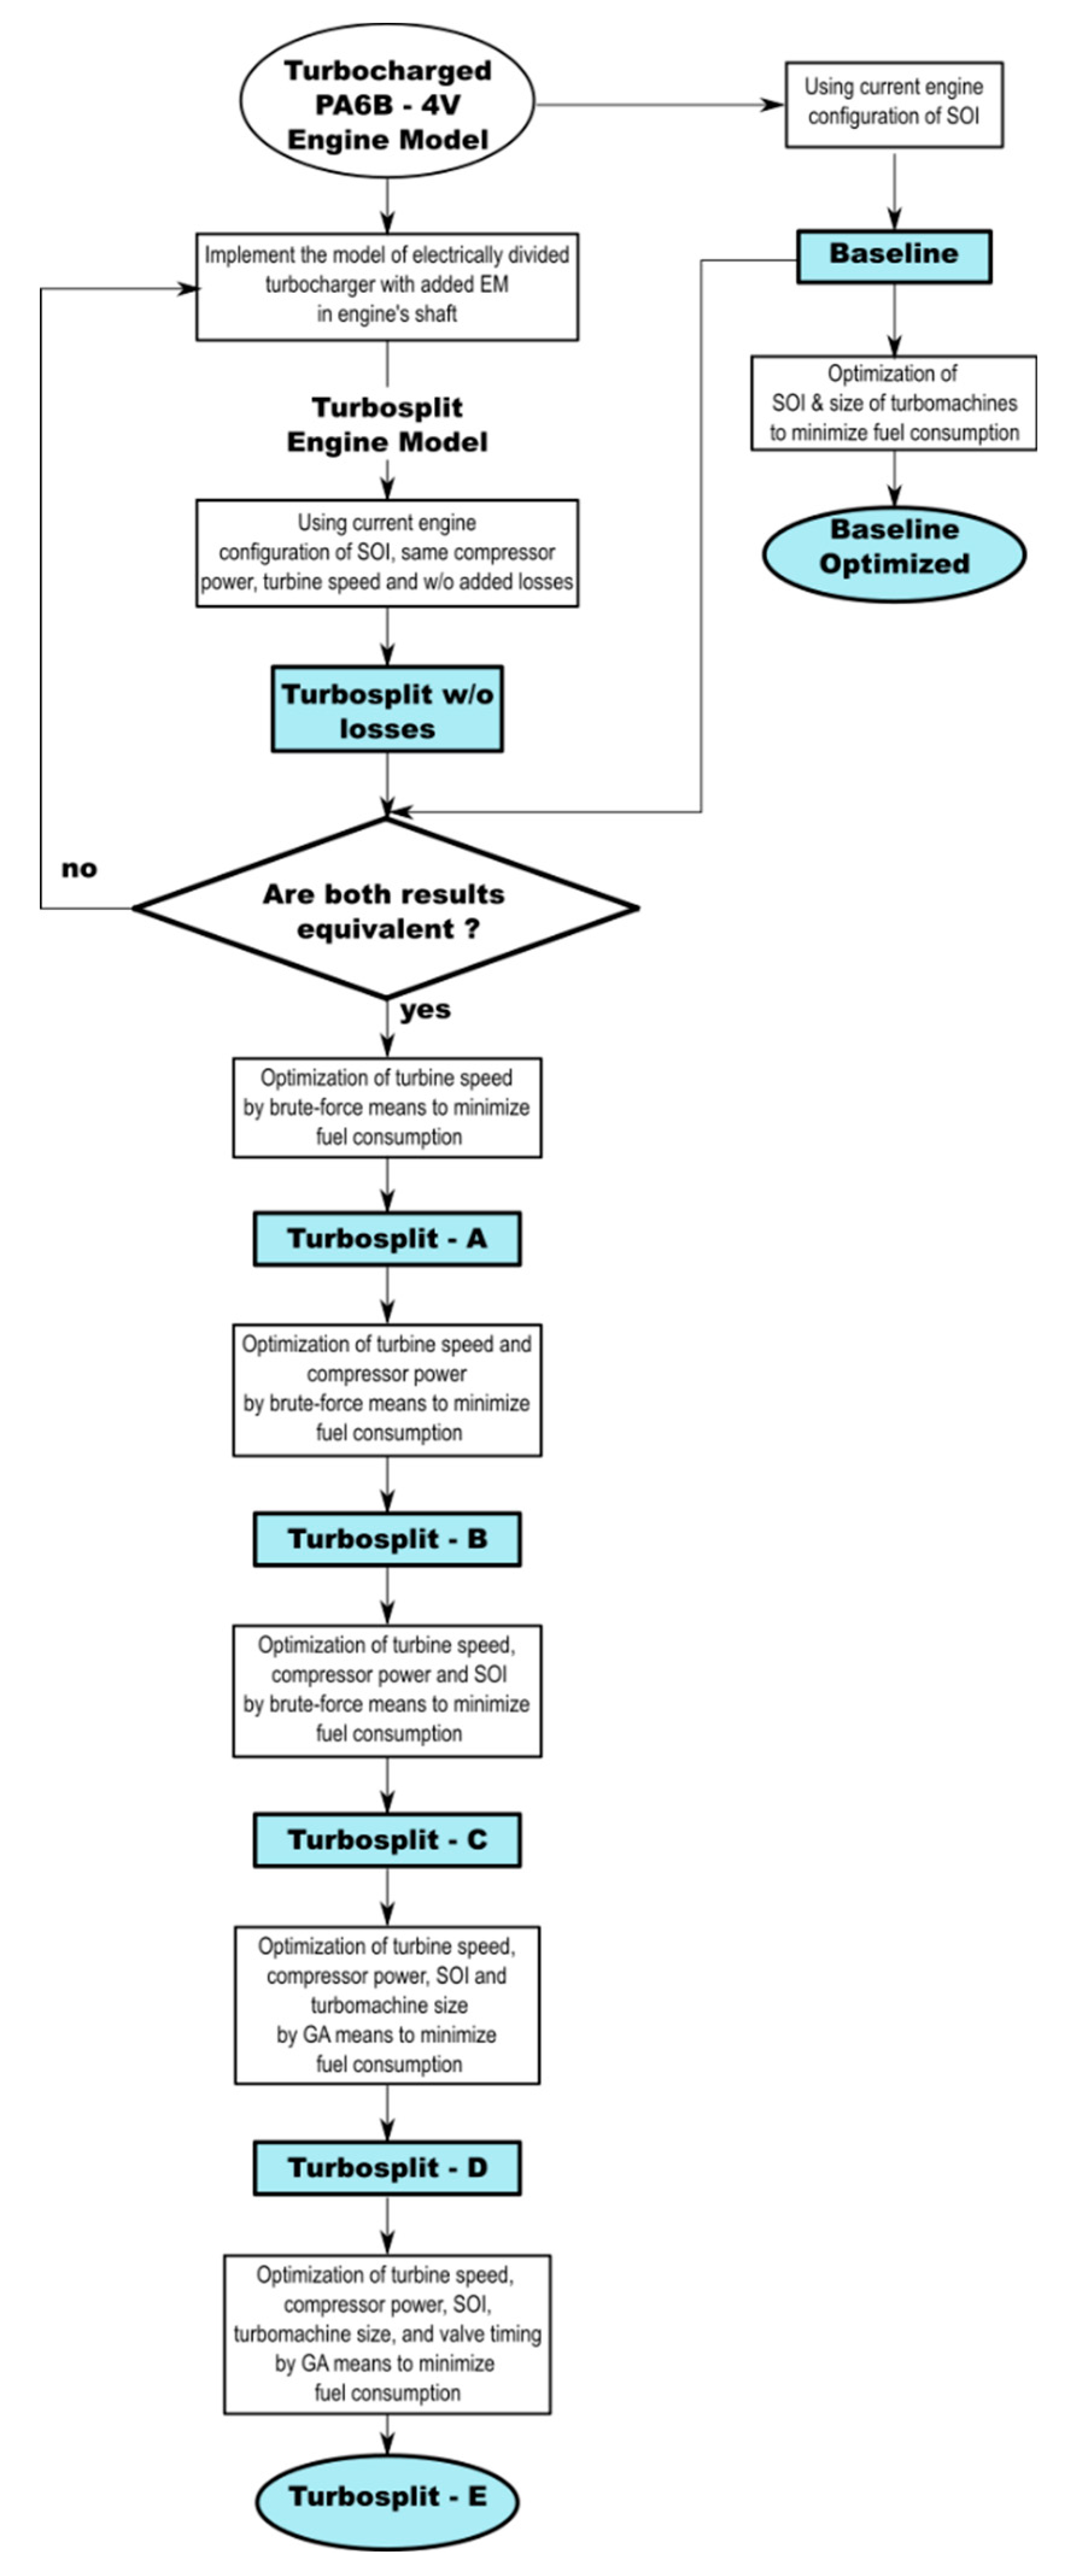
The global optimization process of the Turbosplit architecture is being divided into five stages, as seen in the diagram of
Figure 13. Each variable is added one by one into the global optimization to understand their effect in the optimal configuration. For brute-force based optimization, the analyze can be carried out by analyzing the surface of the response, meanwhile for the stochastic, the analyze can only be done by studying the evolution of the optimal solution when each new variable is added to optimization.
The brute-force exploration begins with the turbine speed (Turbosplit-A) inside the limits shown in
Table 6. Once all the optimal turbine speeds are determined, the compressor power is added together with the turbine speed (Turbosplit-B), in a 2D exploration process. This allows for finding a new combination of turbine speed and compressor power. Similarly, the SOI is added (Turbosplit-C), leading to a 3D exploration to determine the optimal combination of turbine speed, compressor power and SOI. This allows to understand the effect of adding each variable. The addition of turbomachines sizes (Turbosplit-D) into the optimization adds four new factors (two multipliers for compressors and turbines) which expand the design space to a total of seven factors, therefore, GA is used to solve the optimization. Similarly for the last optimization, where the valve timing is added (Turbosplit-E), four new factors are added which represent the angle shifters for the moment of: intake valve opening (IVO), intake valve closing (IVC), exhaust valve opening (EVO) and exhaust valve closing (EVC).
There are two approaches for configuring GA: one considers the algorithm primarily driven by the crossover term, while the other emphasizes the importance of the mutation rate [
29]. The configuration parameters used in the genetic-algorithm optimizations are shown in
Table 8. A reduced crossover rate of 50% is employed alongside a mutation rate of 50%. This configuration, coupled with a large population size, ensures an extensive exploration of the design space, even in advanced stages of the optimization, thus avoiding premature convergence. However, compared to the approach primarily driven by crossover, this configuration may require an increased number of generations to achieve convergence.
3. Results
In this section there are analyzed the effect of state variables (section 3.1) and system properties (section 3.2 on different engine variables such as power on the turbomachines and power of PTX. The effect on final system BSFC is specifically analyzed in section 3.3. An analyze of added losses is included in section 3.4. Finally, the results are applied to real operating profiles in section 3.5.
3.1. Influence of State Variables
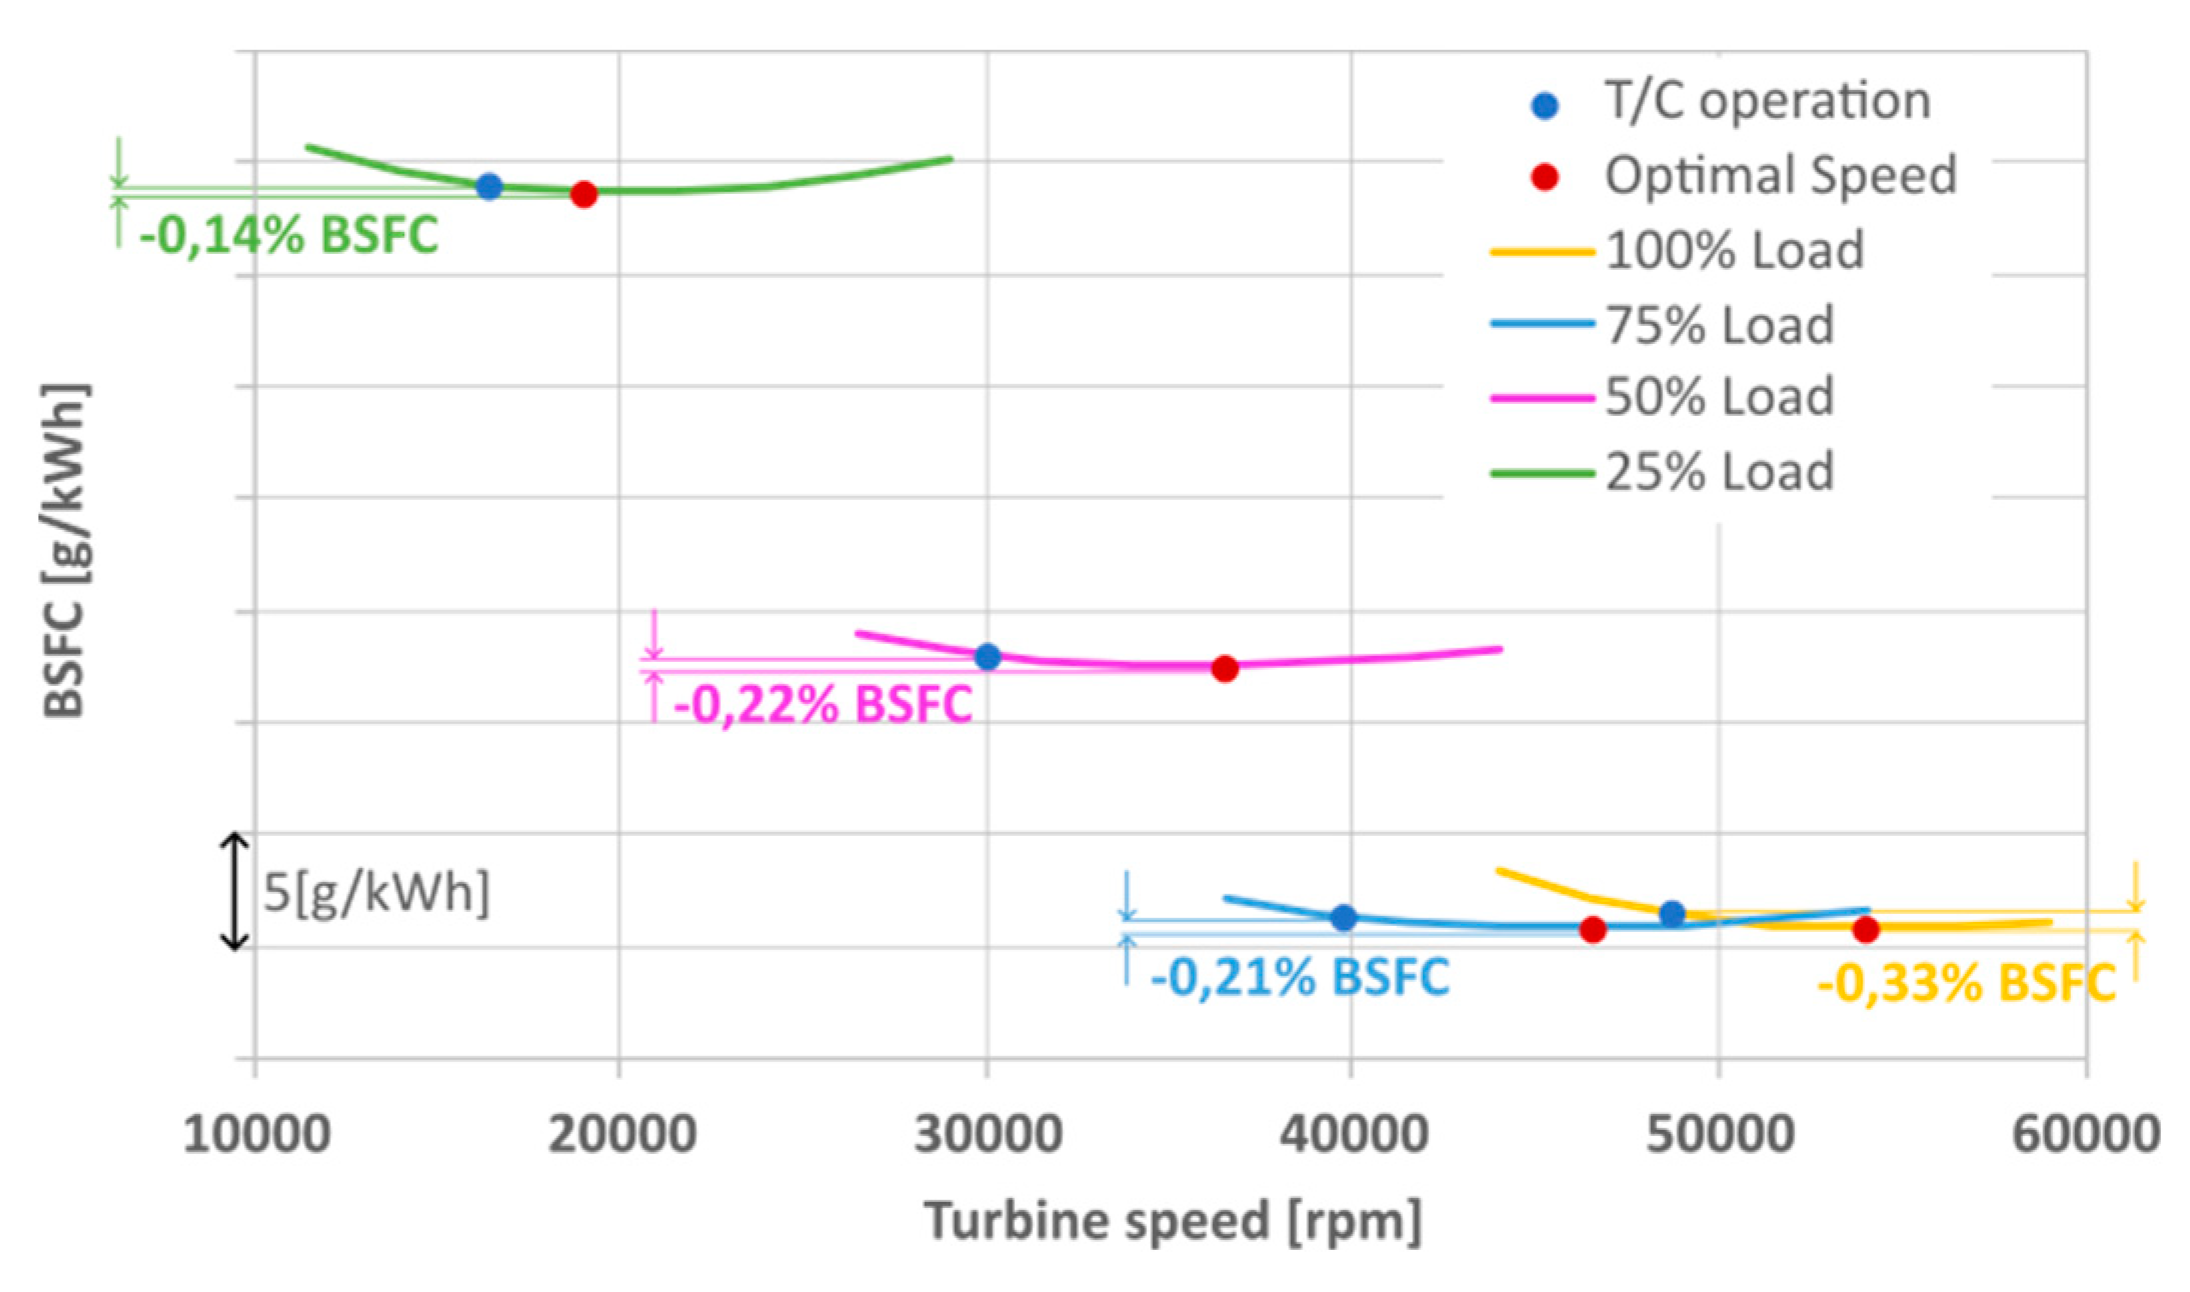
The graph of
Figure 14 is obtained by imposing the same efficiency chain as the turbocharger (without electromechanical, gearbox and converter losses), allowing for a direct comparison with the baseline turbocharger configuration, as the efficiency chains are equivalent. The variation of turbine speed does not significantly affect the system BSFC. Without considering added losses, the optimal turbine speed obtains a marginal benefit below 1% reduction of BSFC. This benefit is lost when the efficiency chain is converted back to the hybrid electric architecture.
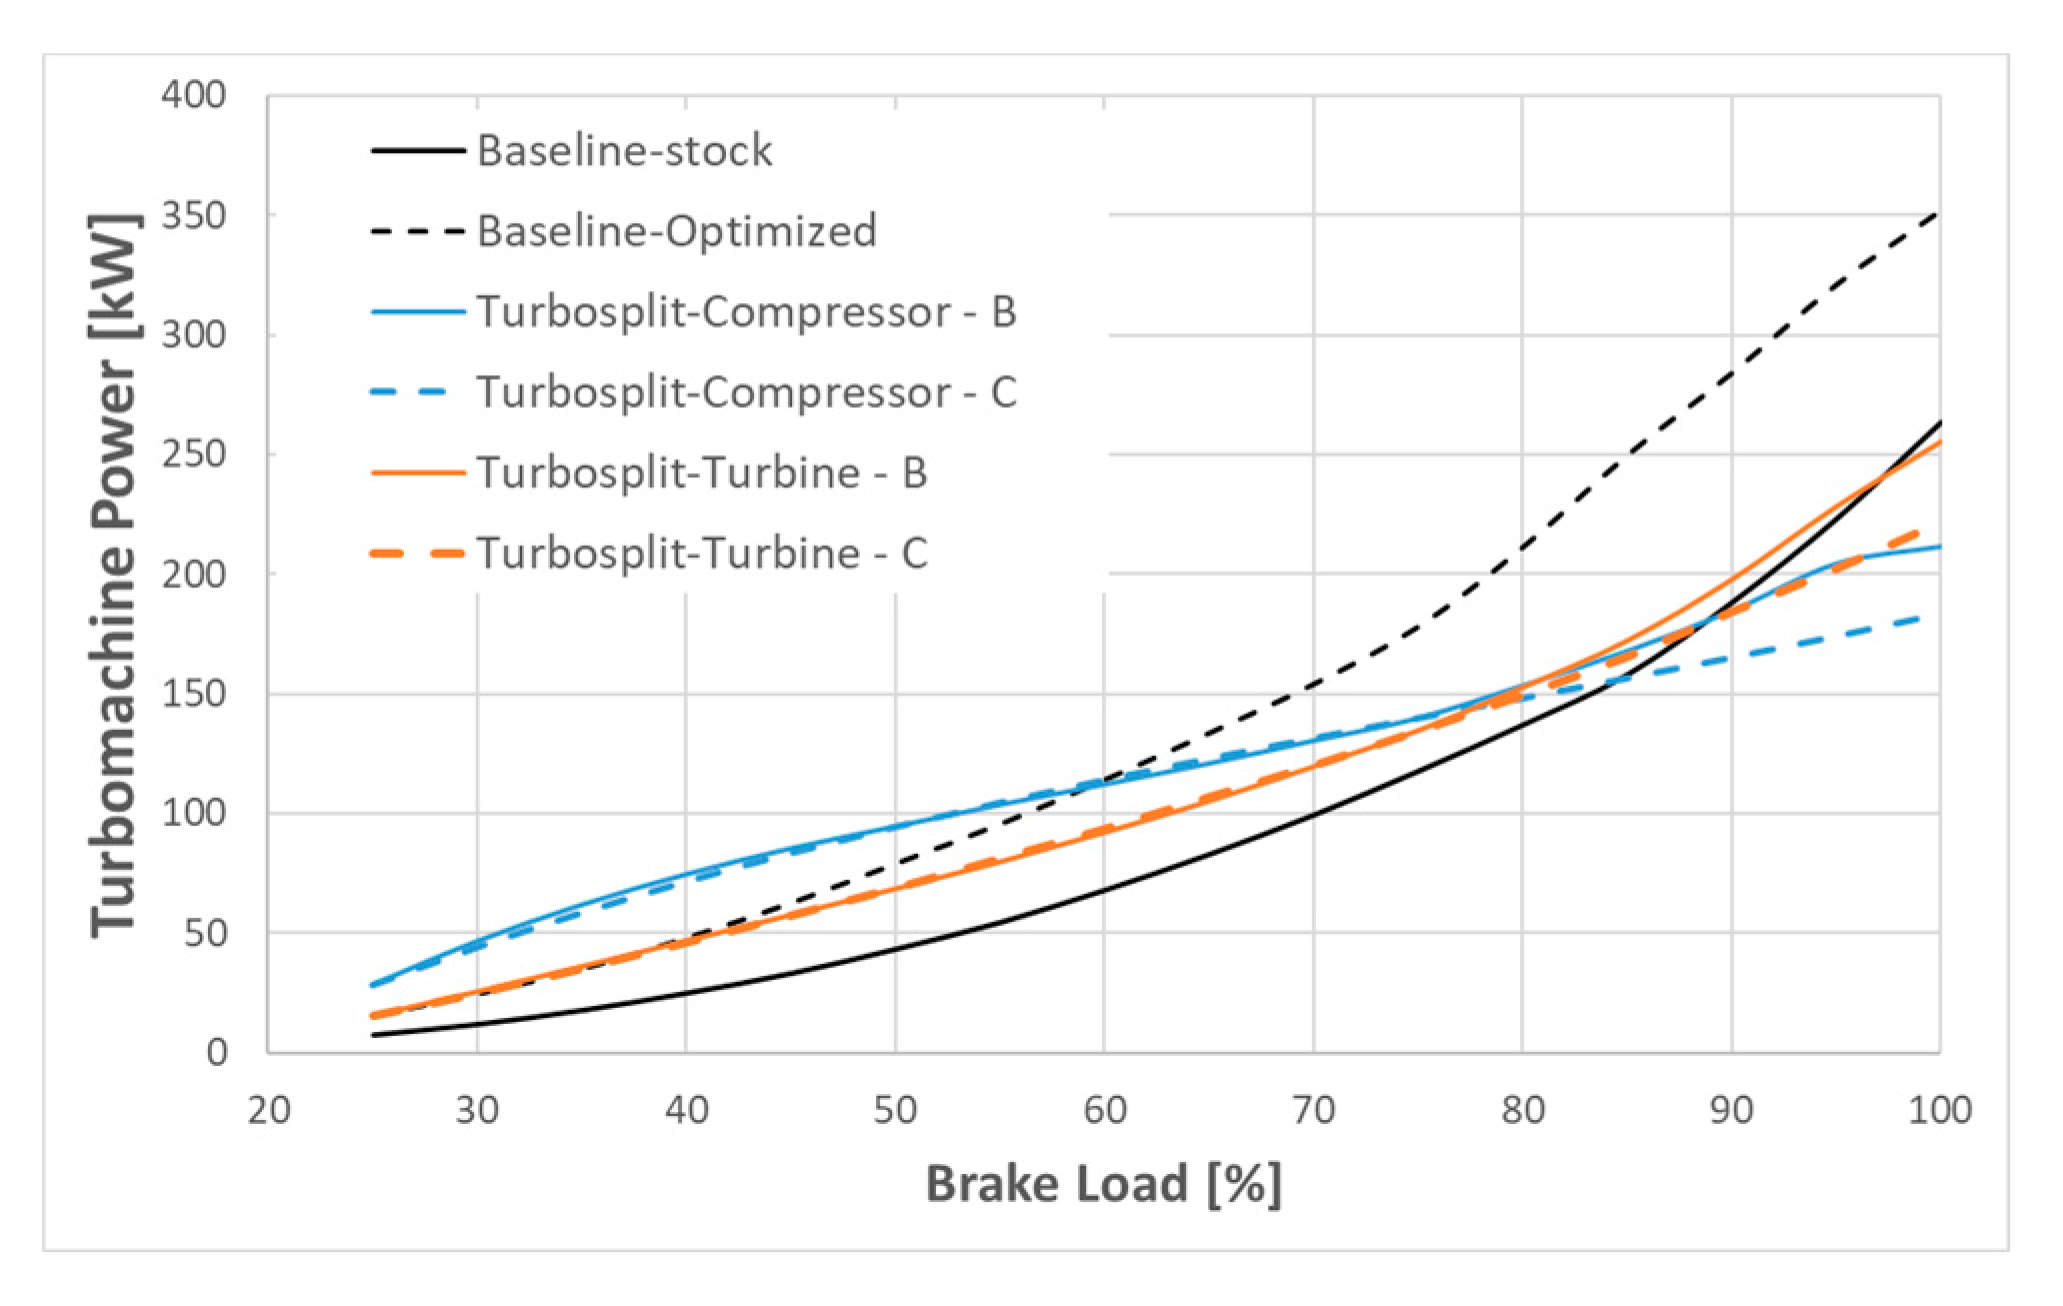
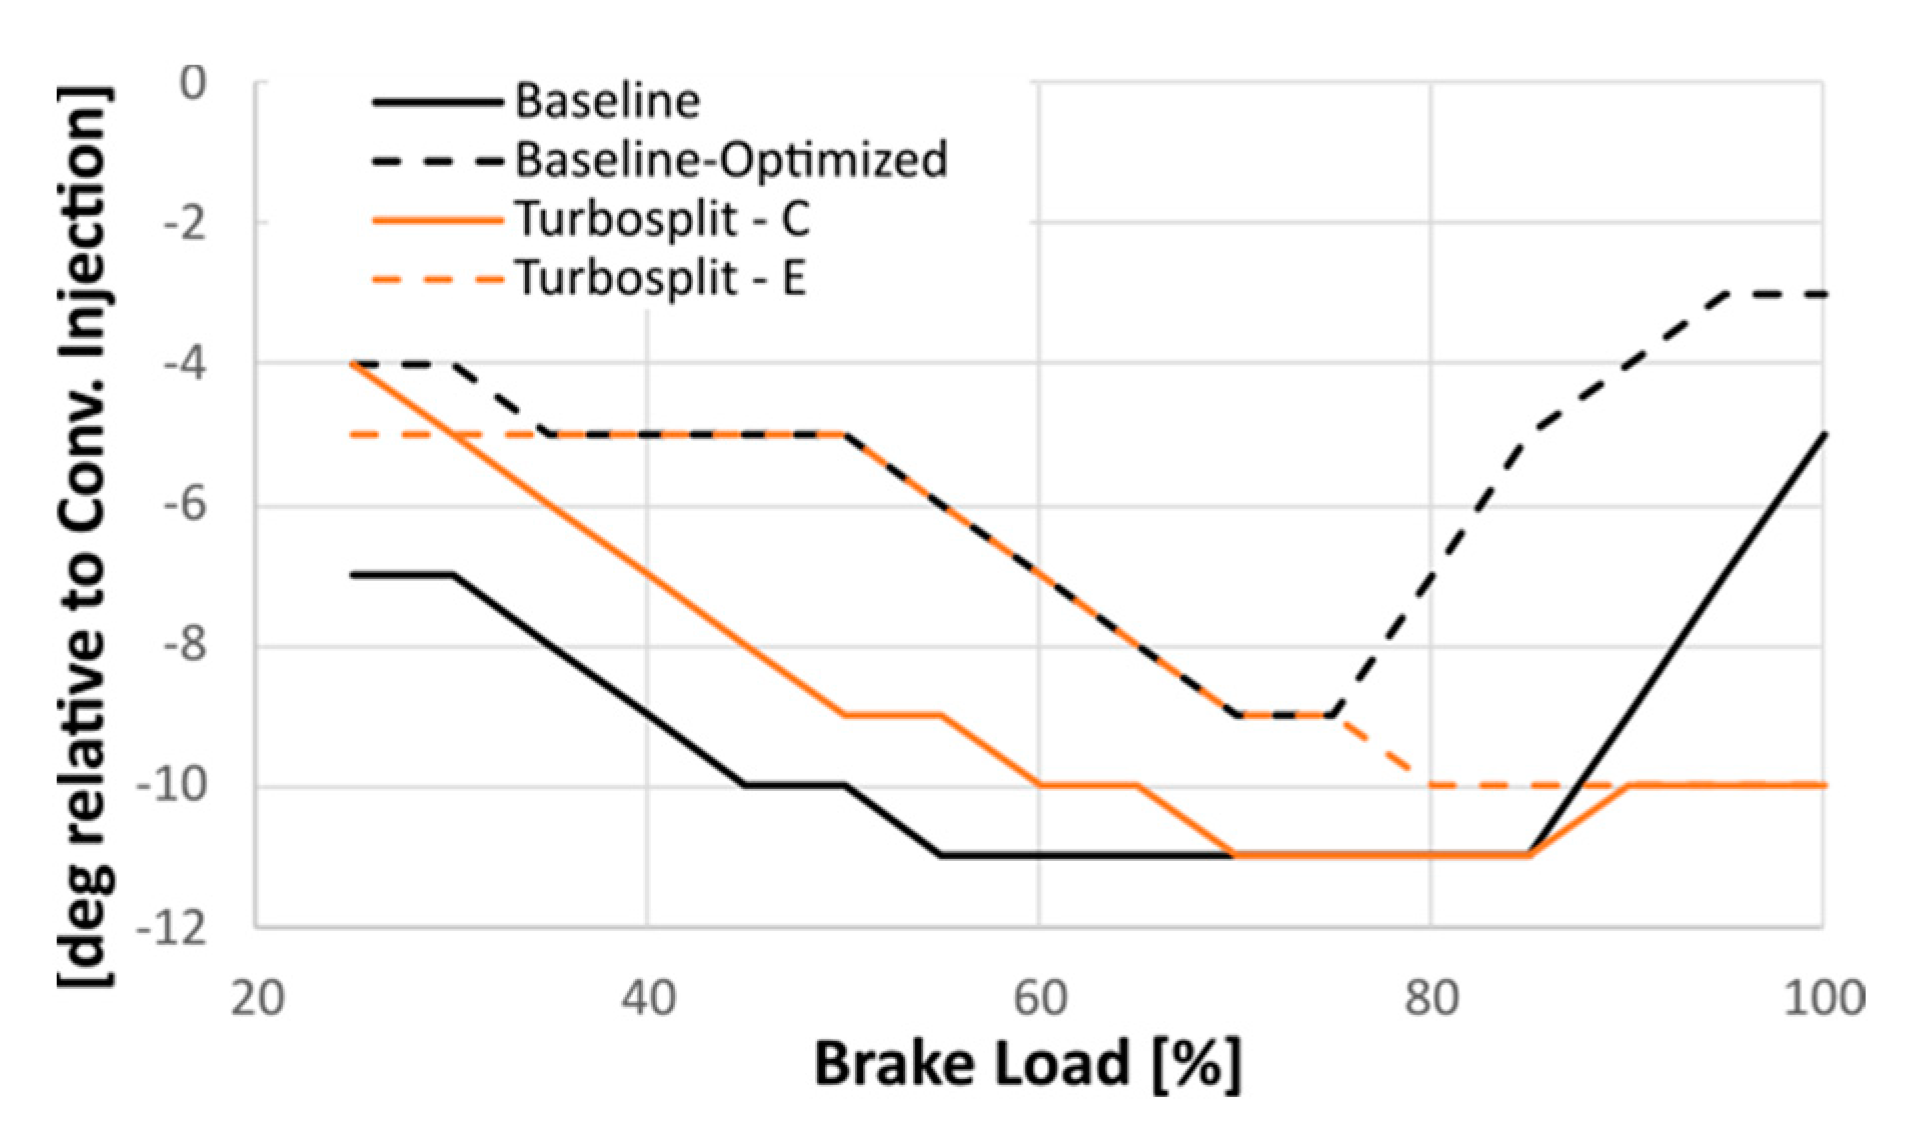
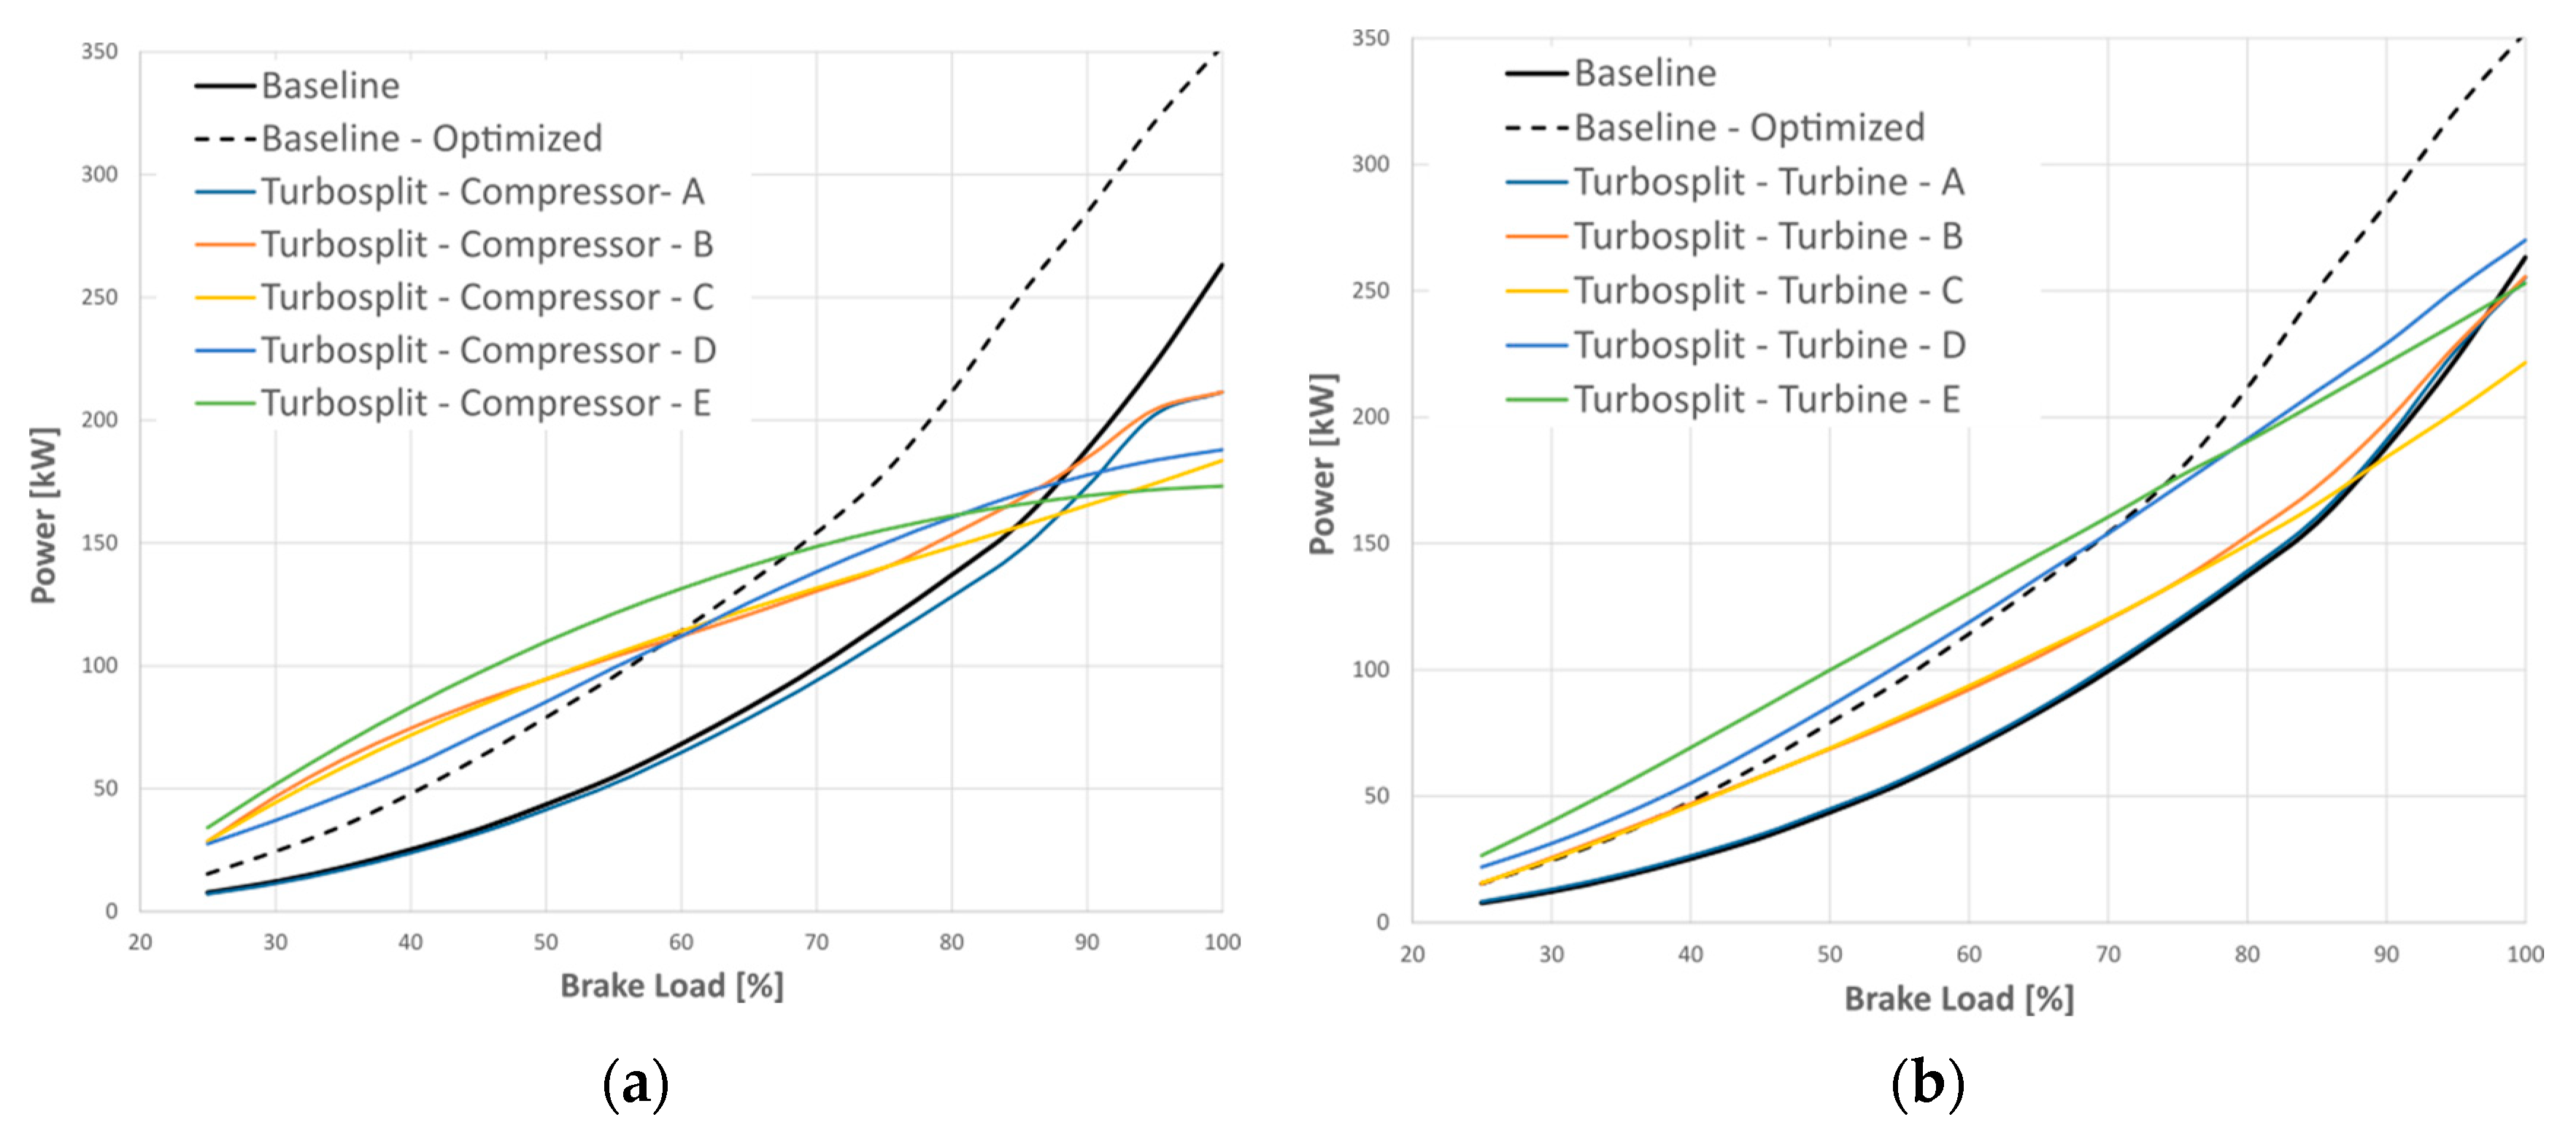
Figure 15 shows the turbomachines power along the engine propeller law. Baseline curves correspond to the turbocharger power, while Turbosplit results are separated between turbine and compressor power. The baseline-optimized configuration significantly increases the turbocharger power by adapting the turbine and compressor sizes. Due to the high compressor power, at high engine loads, the system must reduce the injection advance, as shown in
Figure 16, due to the constraints on maximum in-cylinder pressure.
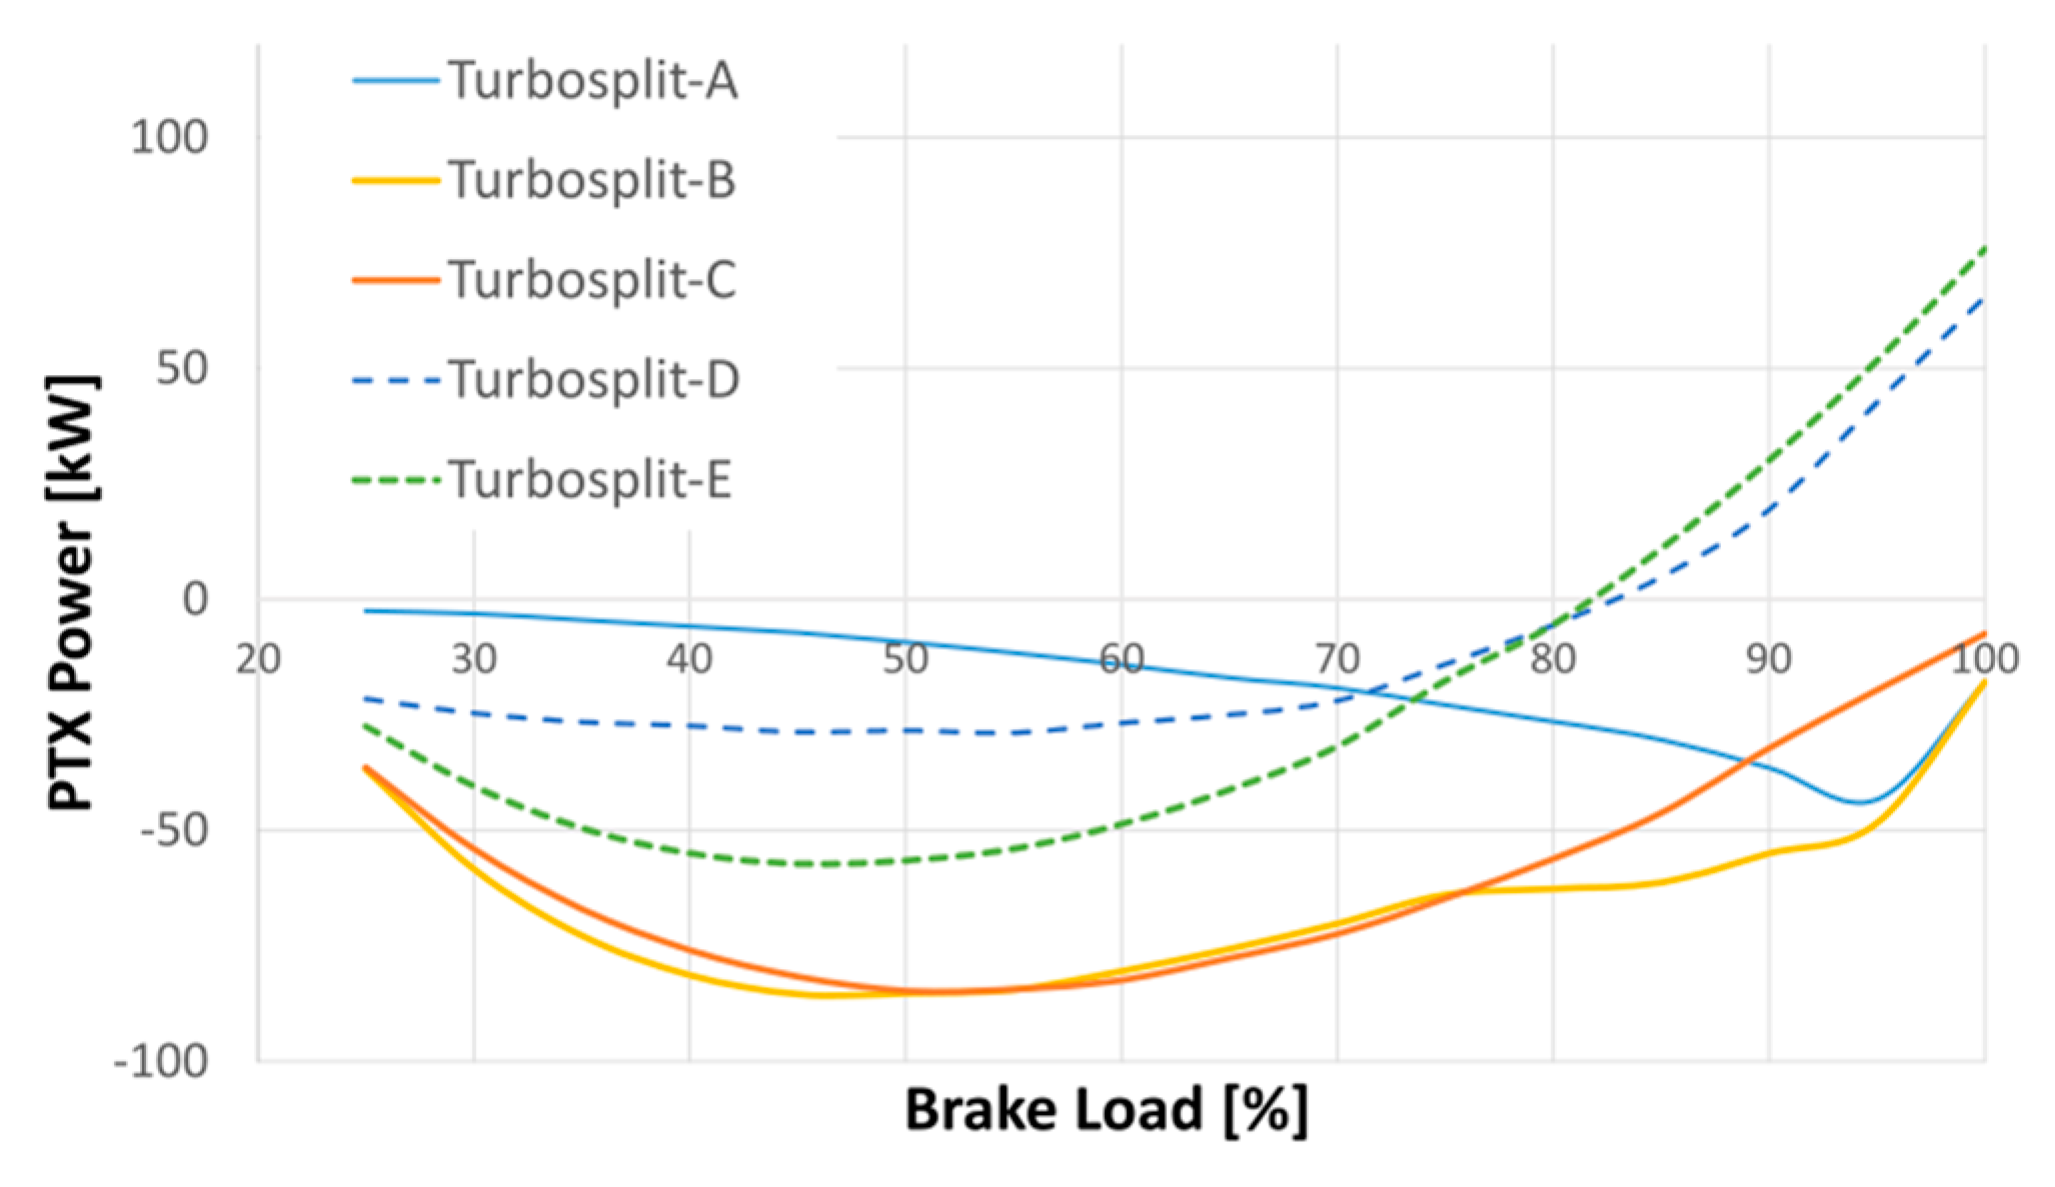
In the Turbosplit architecture, freely adapting the compressor power allows for an increase in the compressor power at low engine loads, similar to the baseline-optimized configuration. However, at high engine loads, it becomes possible to maintain a high injection advance by reducing the compressor power. This combination of an early SOI and a reduction of the compressor power enables the turbine to produce a surplus of power at high engine loads, which is then recovered by the PTX machine.
Figure 17 illustrates that the PTX machine remains working as a generator only until SOI is added to the optimization.
3.2. Influence of System Properties
The first system property to be included is the size of turbomachines. This property is parameterized with four multiplier factors: pressure ratio and mass flow rate multipliers on compressors and turbines maps. Due to the high number of variables, the optimization is conducted using the genetic algorithm with the settings shown in
Table 8. The optimal combination of size multiplier factors for turbine and compressor is presented in
Table 9 and the resulting maps are displayed in
Figure 18.
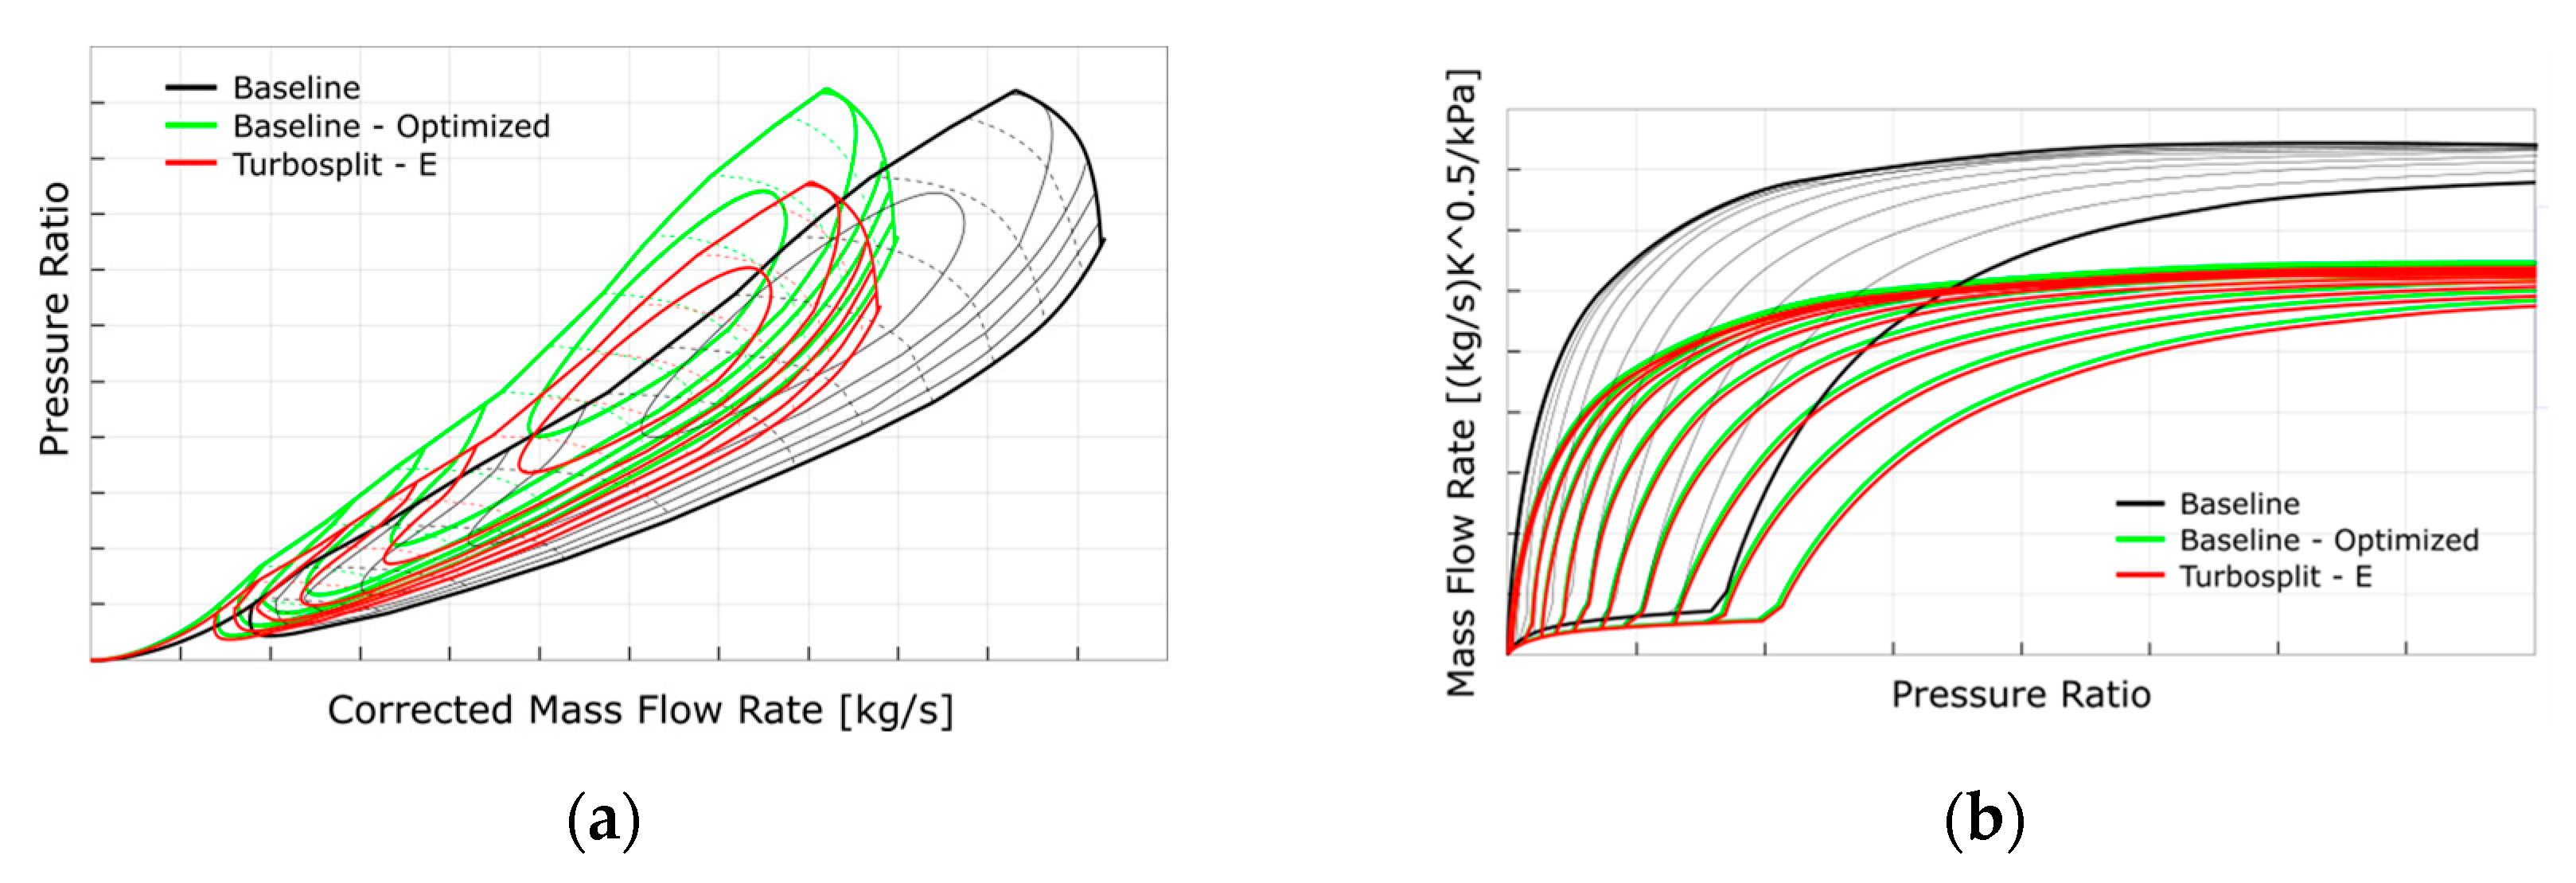
Regarding the compressor maps of
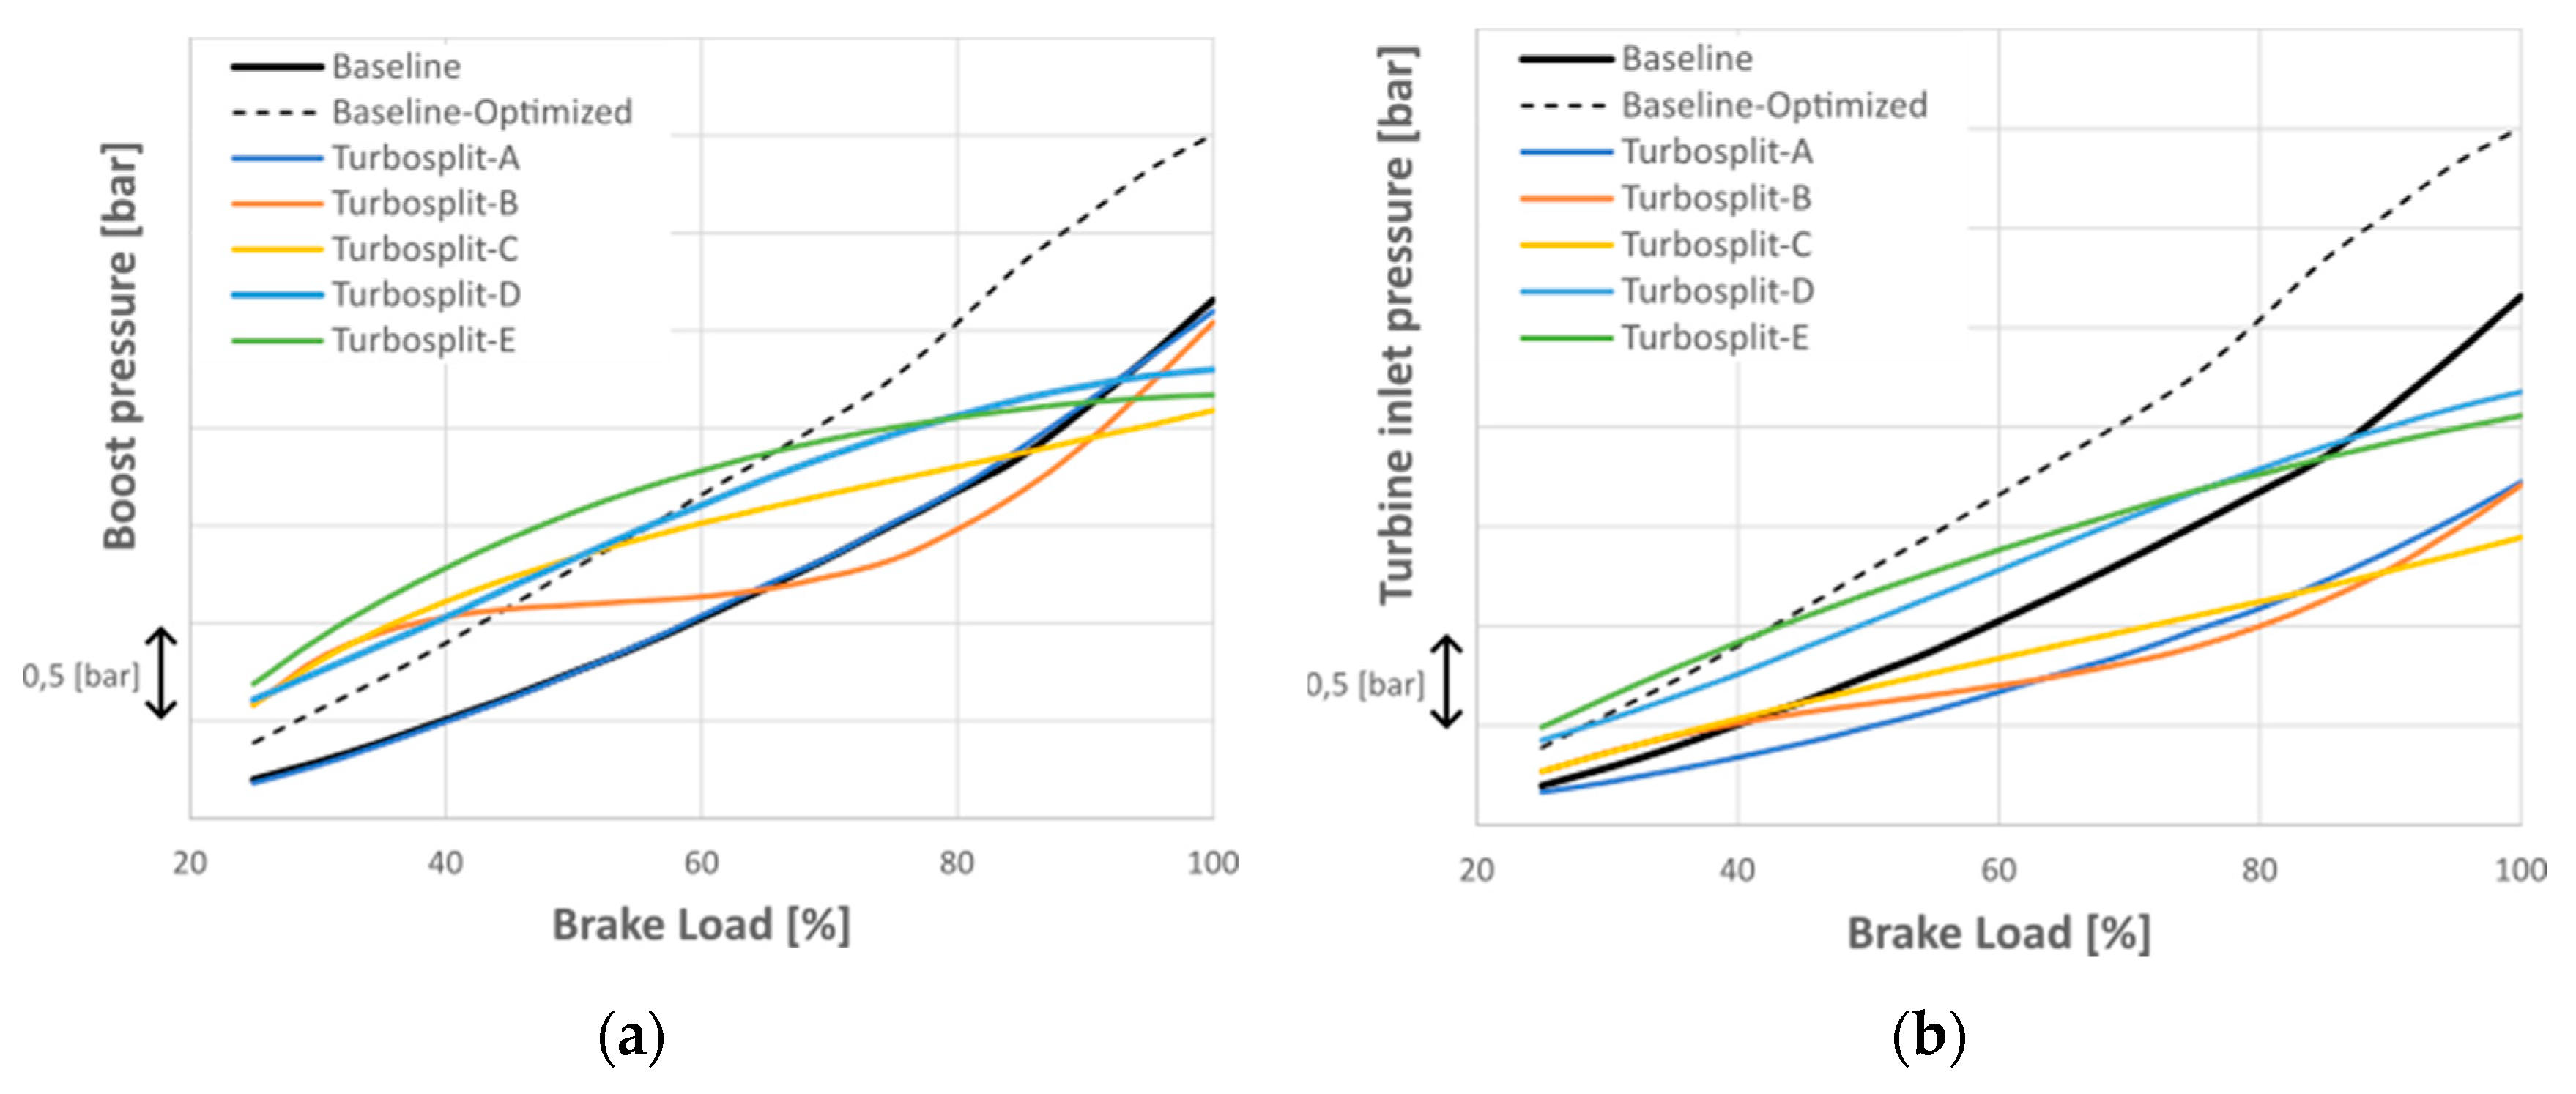
Figure 18a, the baseline-optimized compressor has been modified with a smaller mass flow capacity and the pressure ratio remains almost invariant. This modification shifts the surge limit, enabling higher-pressure ratios for the same mass flow rates. In the Turbosplit-E configuration, the pressure ratio is scaled down due to the reduced maximum compressor power in the hybrid architecture. The Turbosplit-E optimal map shows a high-efficiency area at lower pressure ratios. Comparing curves Turbosplit-C and Turbosplit-D, below 50% of brake load, the new compressor size to obtain similar boost pressures (See
Figure 19a) with less demanded compressor power (See
Figure 20a).
Regarding the turbine maps of
Figure 18b, both optimal maps are similar since the turbine mass flow rate multiplier reaches the limit of 25% smaller scale (0.75). Smaller mass flow rate capacity pushes the turbine to produce more power. Turbine generated power has significantly increased due to the turbine new scale, as seen in
Figure 20b.
At nominal brake load, the modified size of the turbomachine enables to obtain a surplus of energy, which it is not possible to achieve with only modifying turbine speed, compressor power and SOI when starting from a free-floating turbocharger. The PTX, working as a PTI, can satisfy 4,04% (65 kW) of the brake power demand with the surplus of energy recovered from the turbines when the size of the turbomachine is included (Turbosplit-D), and 4.67% of brake power demand (75.7 kW) when all factors are included (Turbosplit-E).
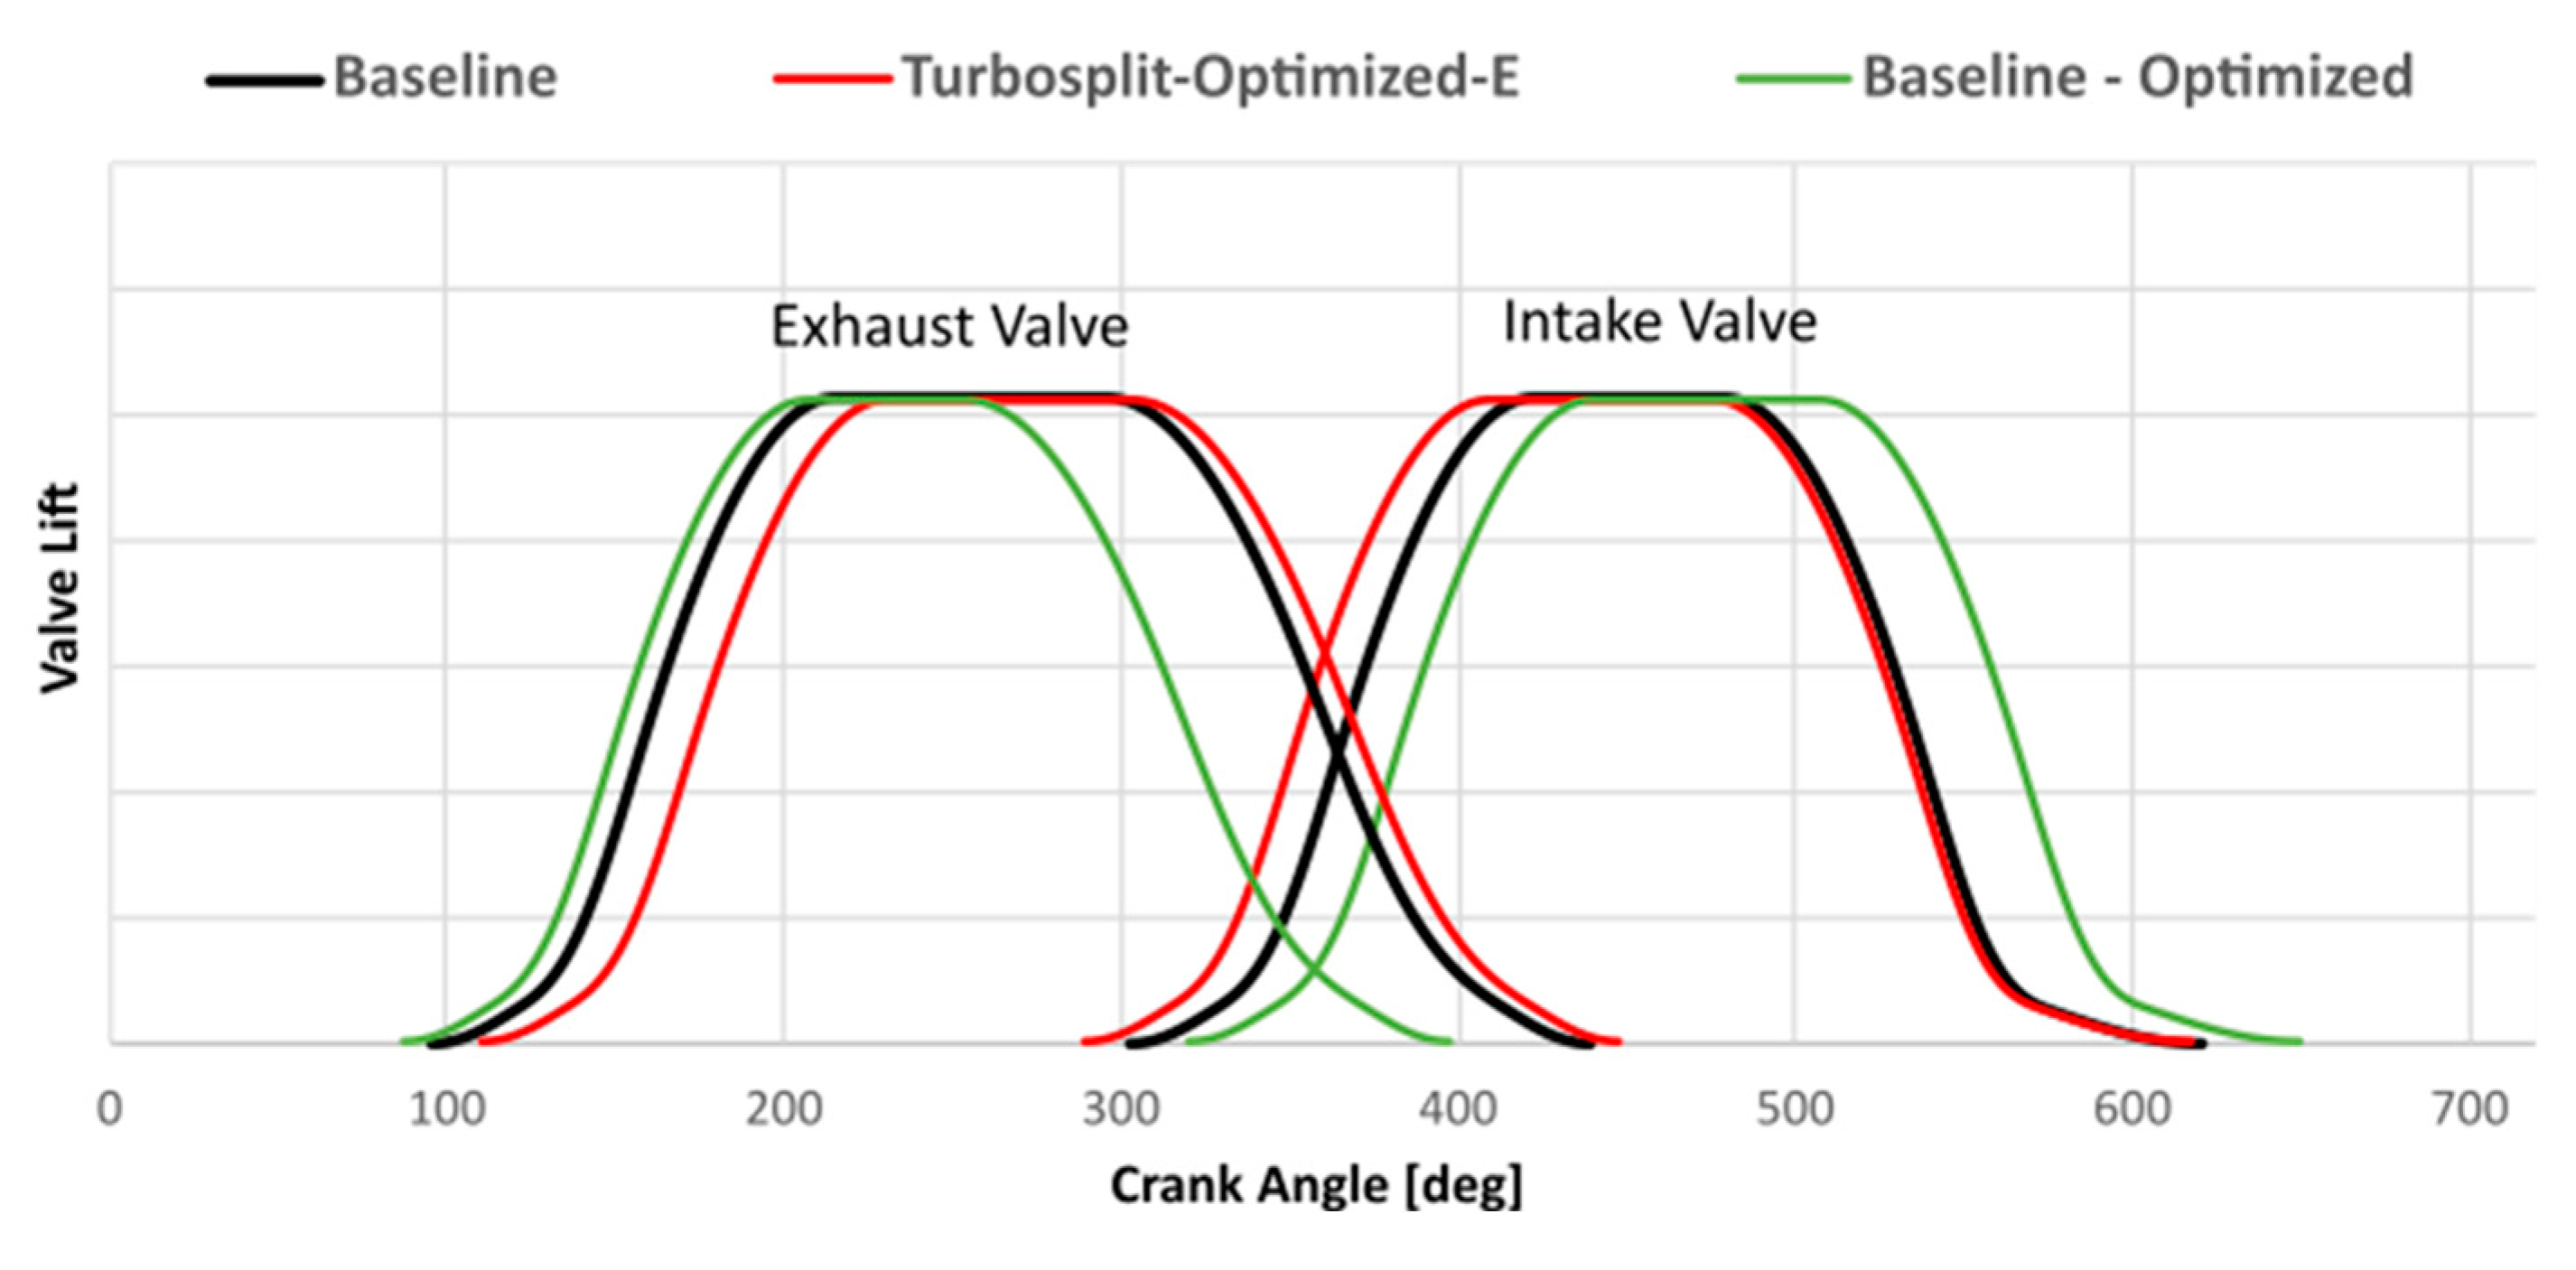
The effect of modifying the moment of opening and closing of the intake and exhaust valves has been studied last (Turbosplit-E). The new optimized intake and exhaust valve lift profiles are shown in
Figure 21. In the optimized baseline version, the increase in the boost pressure (
Figure 19a) with respect to baseline, allows for a more effective Miller effect by reducing the total opening of the intake valves without decreasing the airflow. In the baseline-optimized version, the valve overlap increases from 136 degrees to 150 degrees, and the EVO occurs 10 degrees later than in stock version. In the optimized Turbosplit (E), valve overlap increases further to 158 degrees, while the EVO delays to 16 degrees. In addition, the total duration of the exhaust valve opening is reduced by 8 degrees, and the duration of the intake valve opening is increased by 10 degrees compared to the baseline-optimized version.
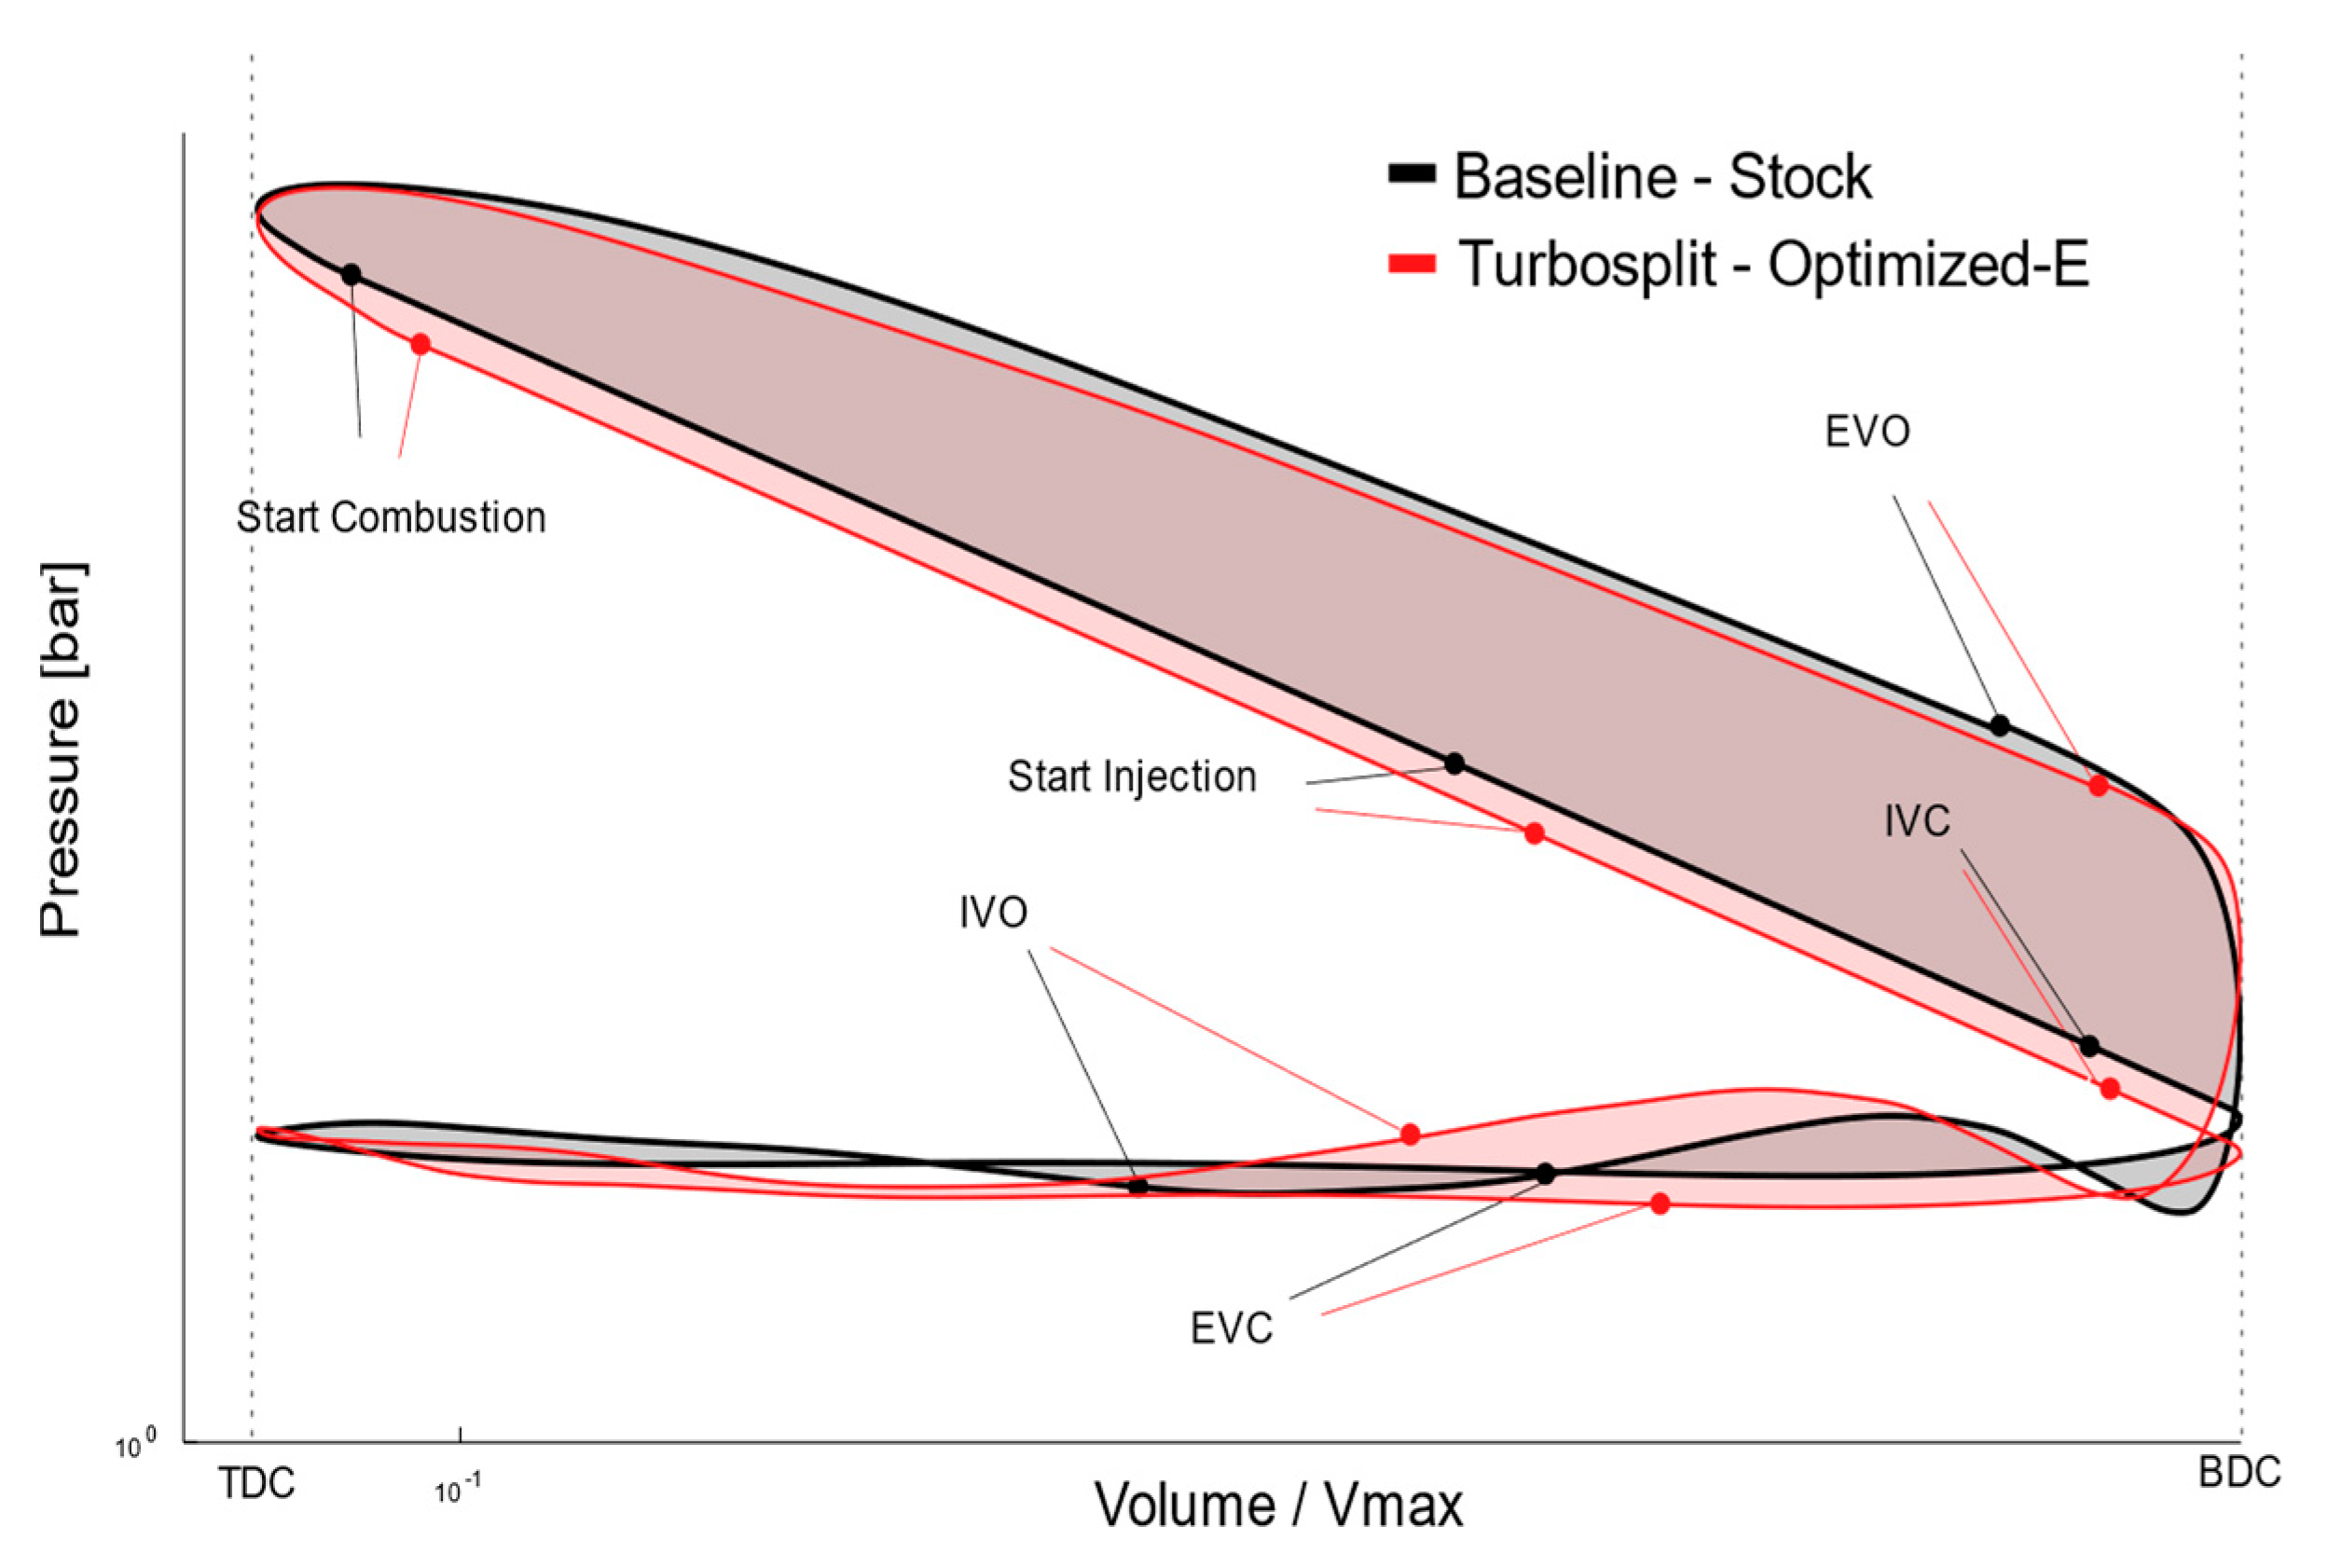
The new camshafts in both optimized configurations improve the indicated engine efficiency by extending the closed-cylinder expansion, despite the increment in engine pumping losses observed in
Figure 22.
3.3. Effect of Each Factor in System BSFC
The
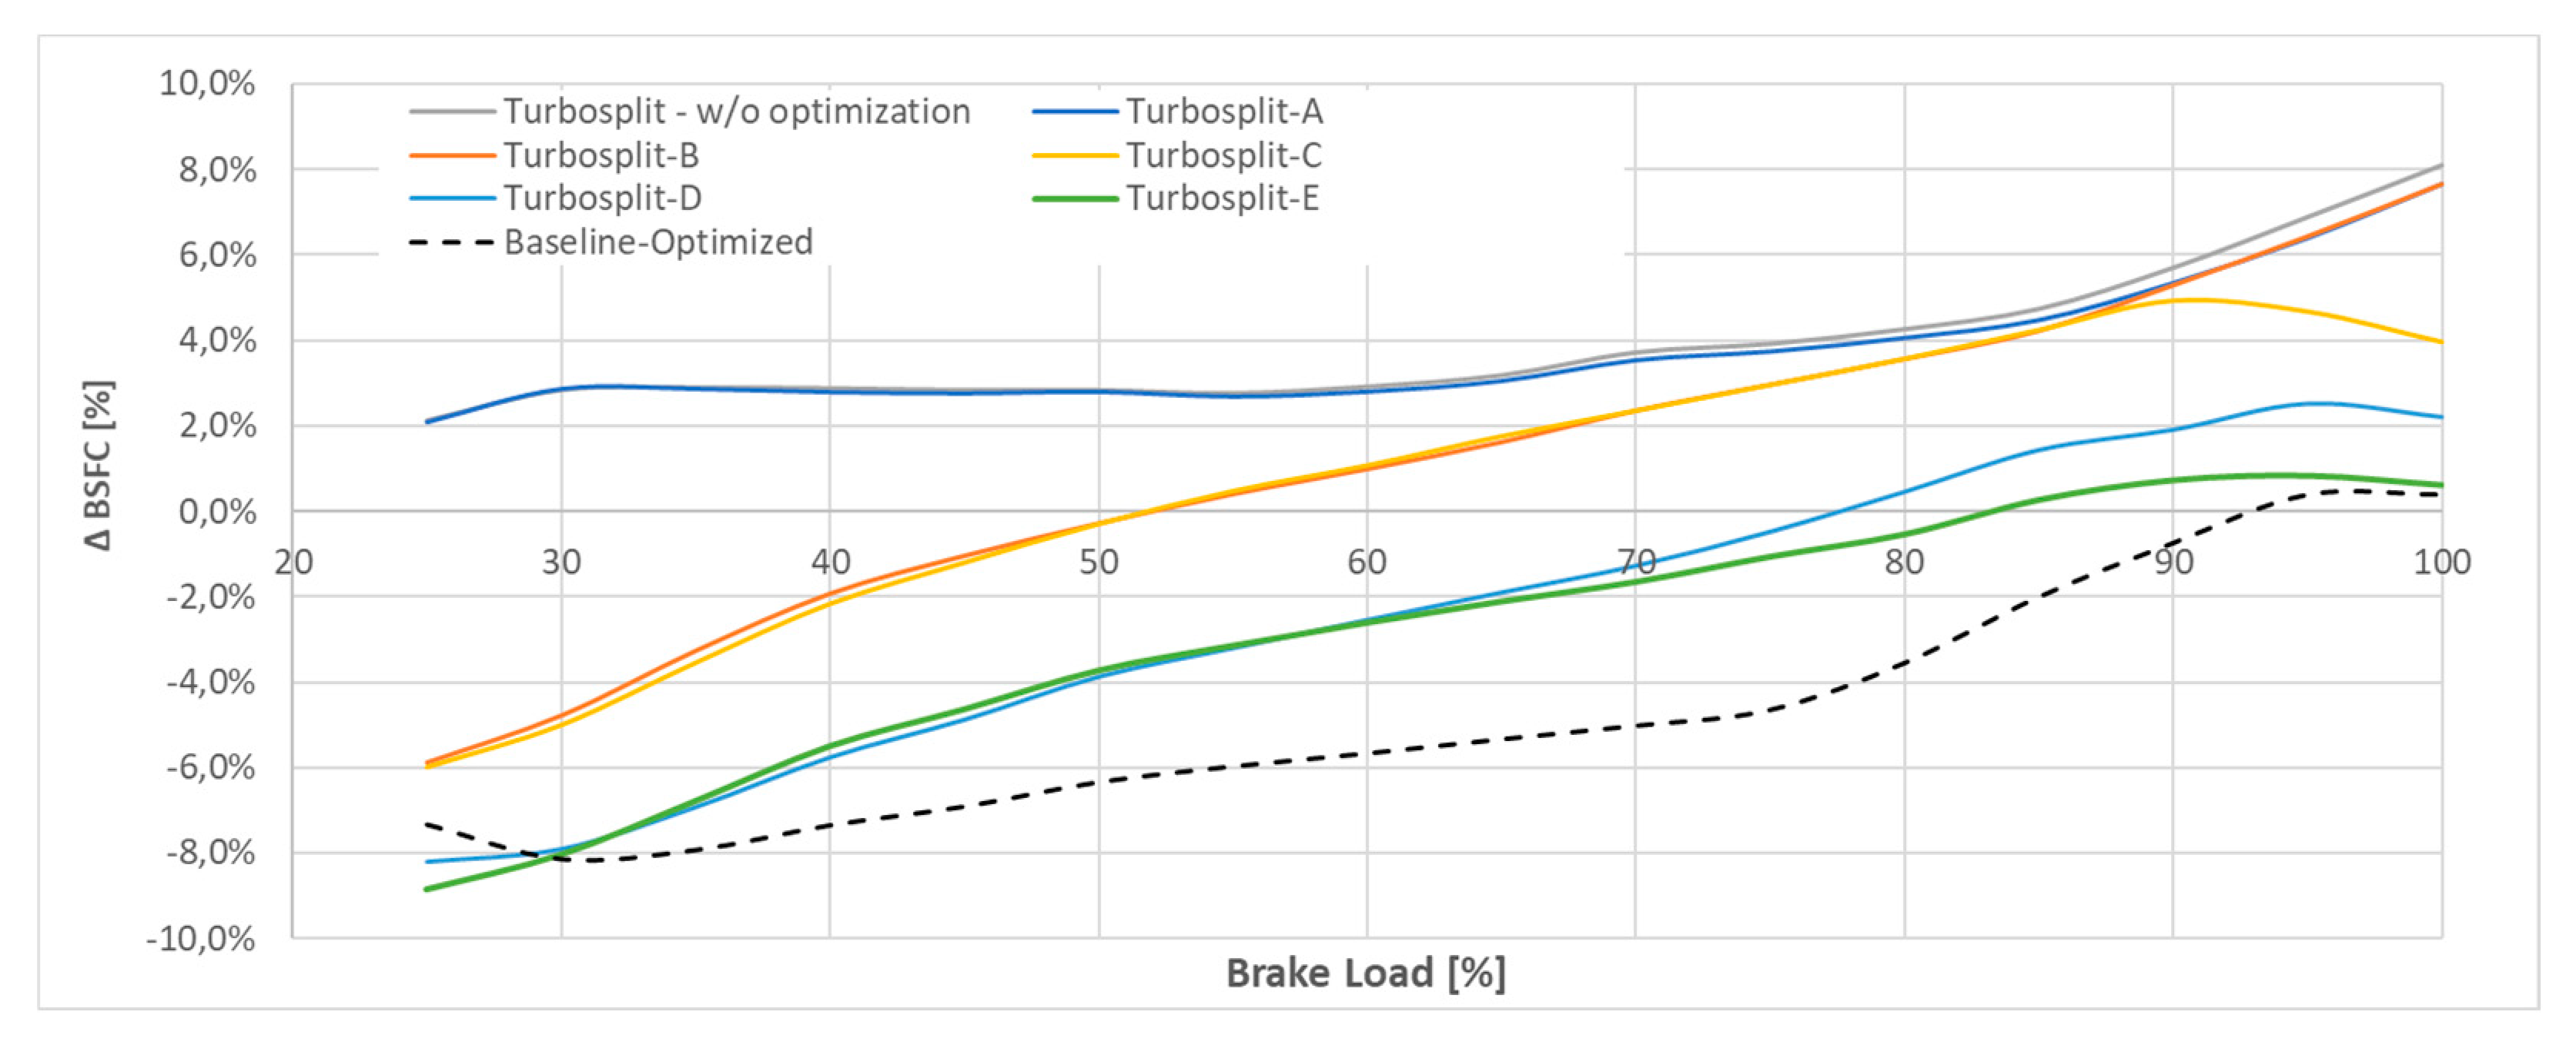
Figure 23 shows the relative difference of system BSFC with different configurations compared with baseline configuration. Each curve represents the optimal BSFC when including progressively the optimization factors. As a reminder, all curves are evaluated along the propeller law.
The turbine speed (Turbosplit-A), and consequently turbine efficiency, have low impact on brake efficiency. Combining its effect with compressor power (Turbosplit-B), improves fuel consumption at low loads. Comparing curve Turbosplit-B with baseline curve shows that fuel consumption is reduced by 6% at 25% of brake-load, however for loads above 52%, the losses overcome the benefits, and no benefits on fuel consumption are observed. The combined effect of previous parameters together with SOI (Turbosplit-C) allows to reduce fuel consumption at high engine loads above 88% of brake-load. Below these loads, the SOI is already at its optimal value and improvements can be achieved compared with previous curve (Turbosplit-B).
The addition of the size of turbomachine to the optimization (Turbosplit-D) obtains the deeper impact on BSFC of all variables studied. Compared with previous case, Turbosplit-D obtains 7 [g/kWh] less than Turbosplit-C almost consistently along the propeller law, and lower fuel consumption than baseline curve for loads below 78% of brake-load. The effect of valve timing is observed mainly at high loads, reducing BSFC with respect previous curve (Turbosplit-D) at loads above 63%. The added losses are higher at high brake-loads, and the optimization of all parameters cannot overcome the losses, increasing fuel consumption relatively with baseline at loads above 83%. At loads below 63%, the fuel consumption is kept as Turbosplit-D, being 8,8 % lower than baseline at 25% of load.
3.4. Added Losses in the System
The
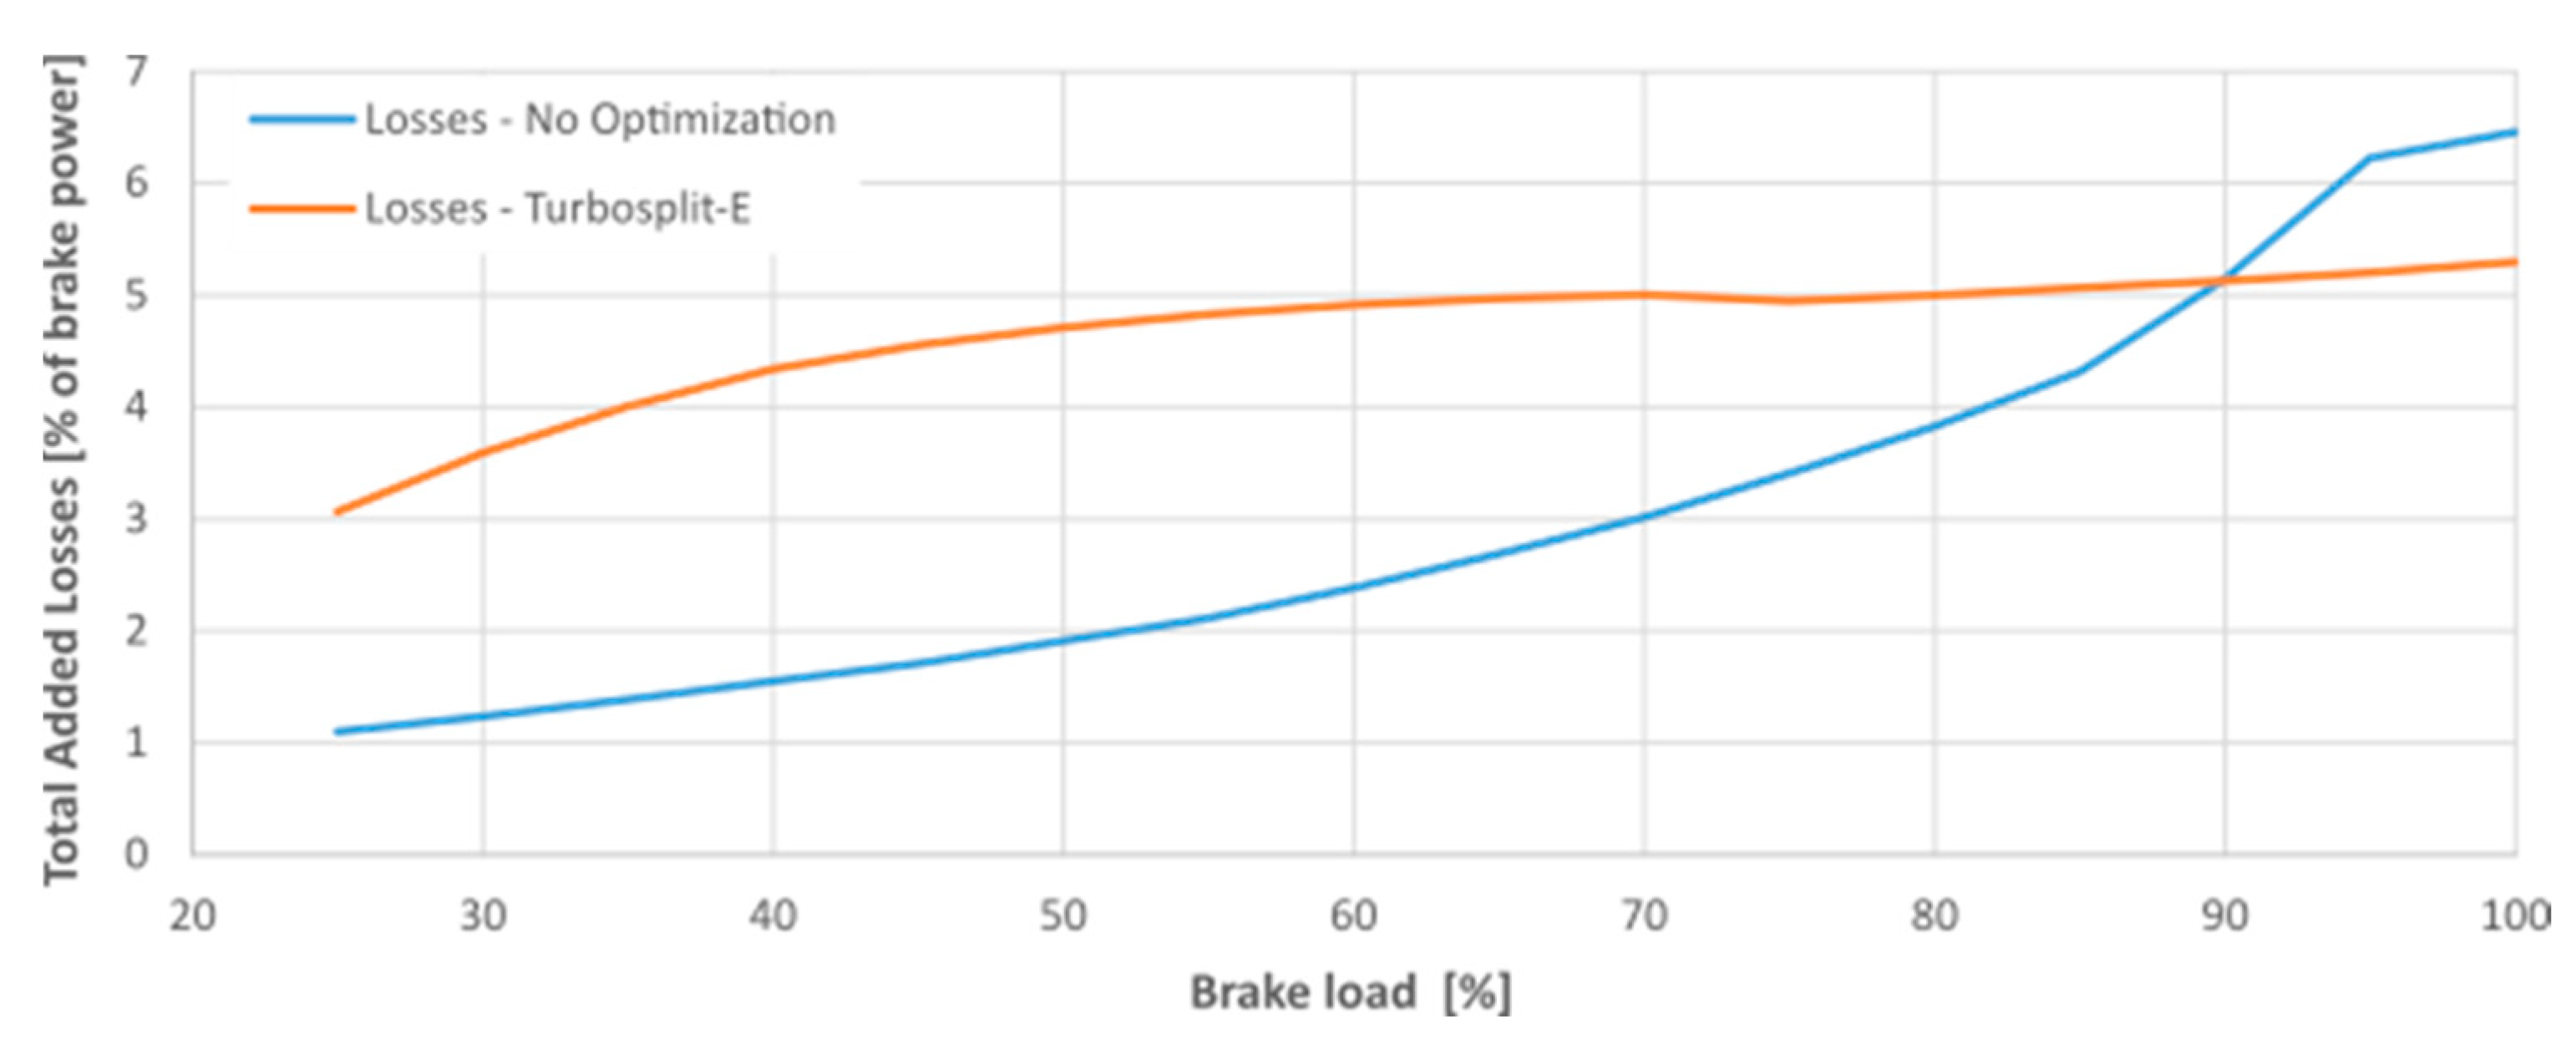
Figure 24 compares the total added losses to the system of the electrically divided turbocharger architecture relatively to brake power. Two curves are selected for the analyze, when all factors are equal to baseline configuration (see
Figure 12), named without optimization, and the totally optimized curve (Turbosplit-E). In
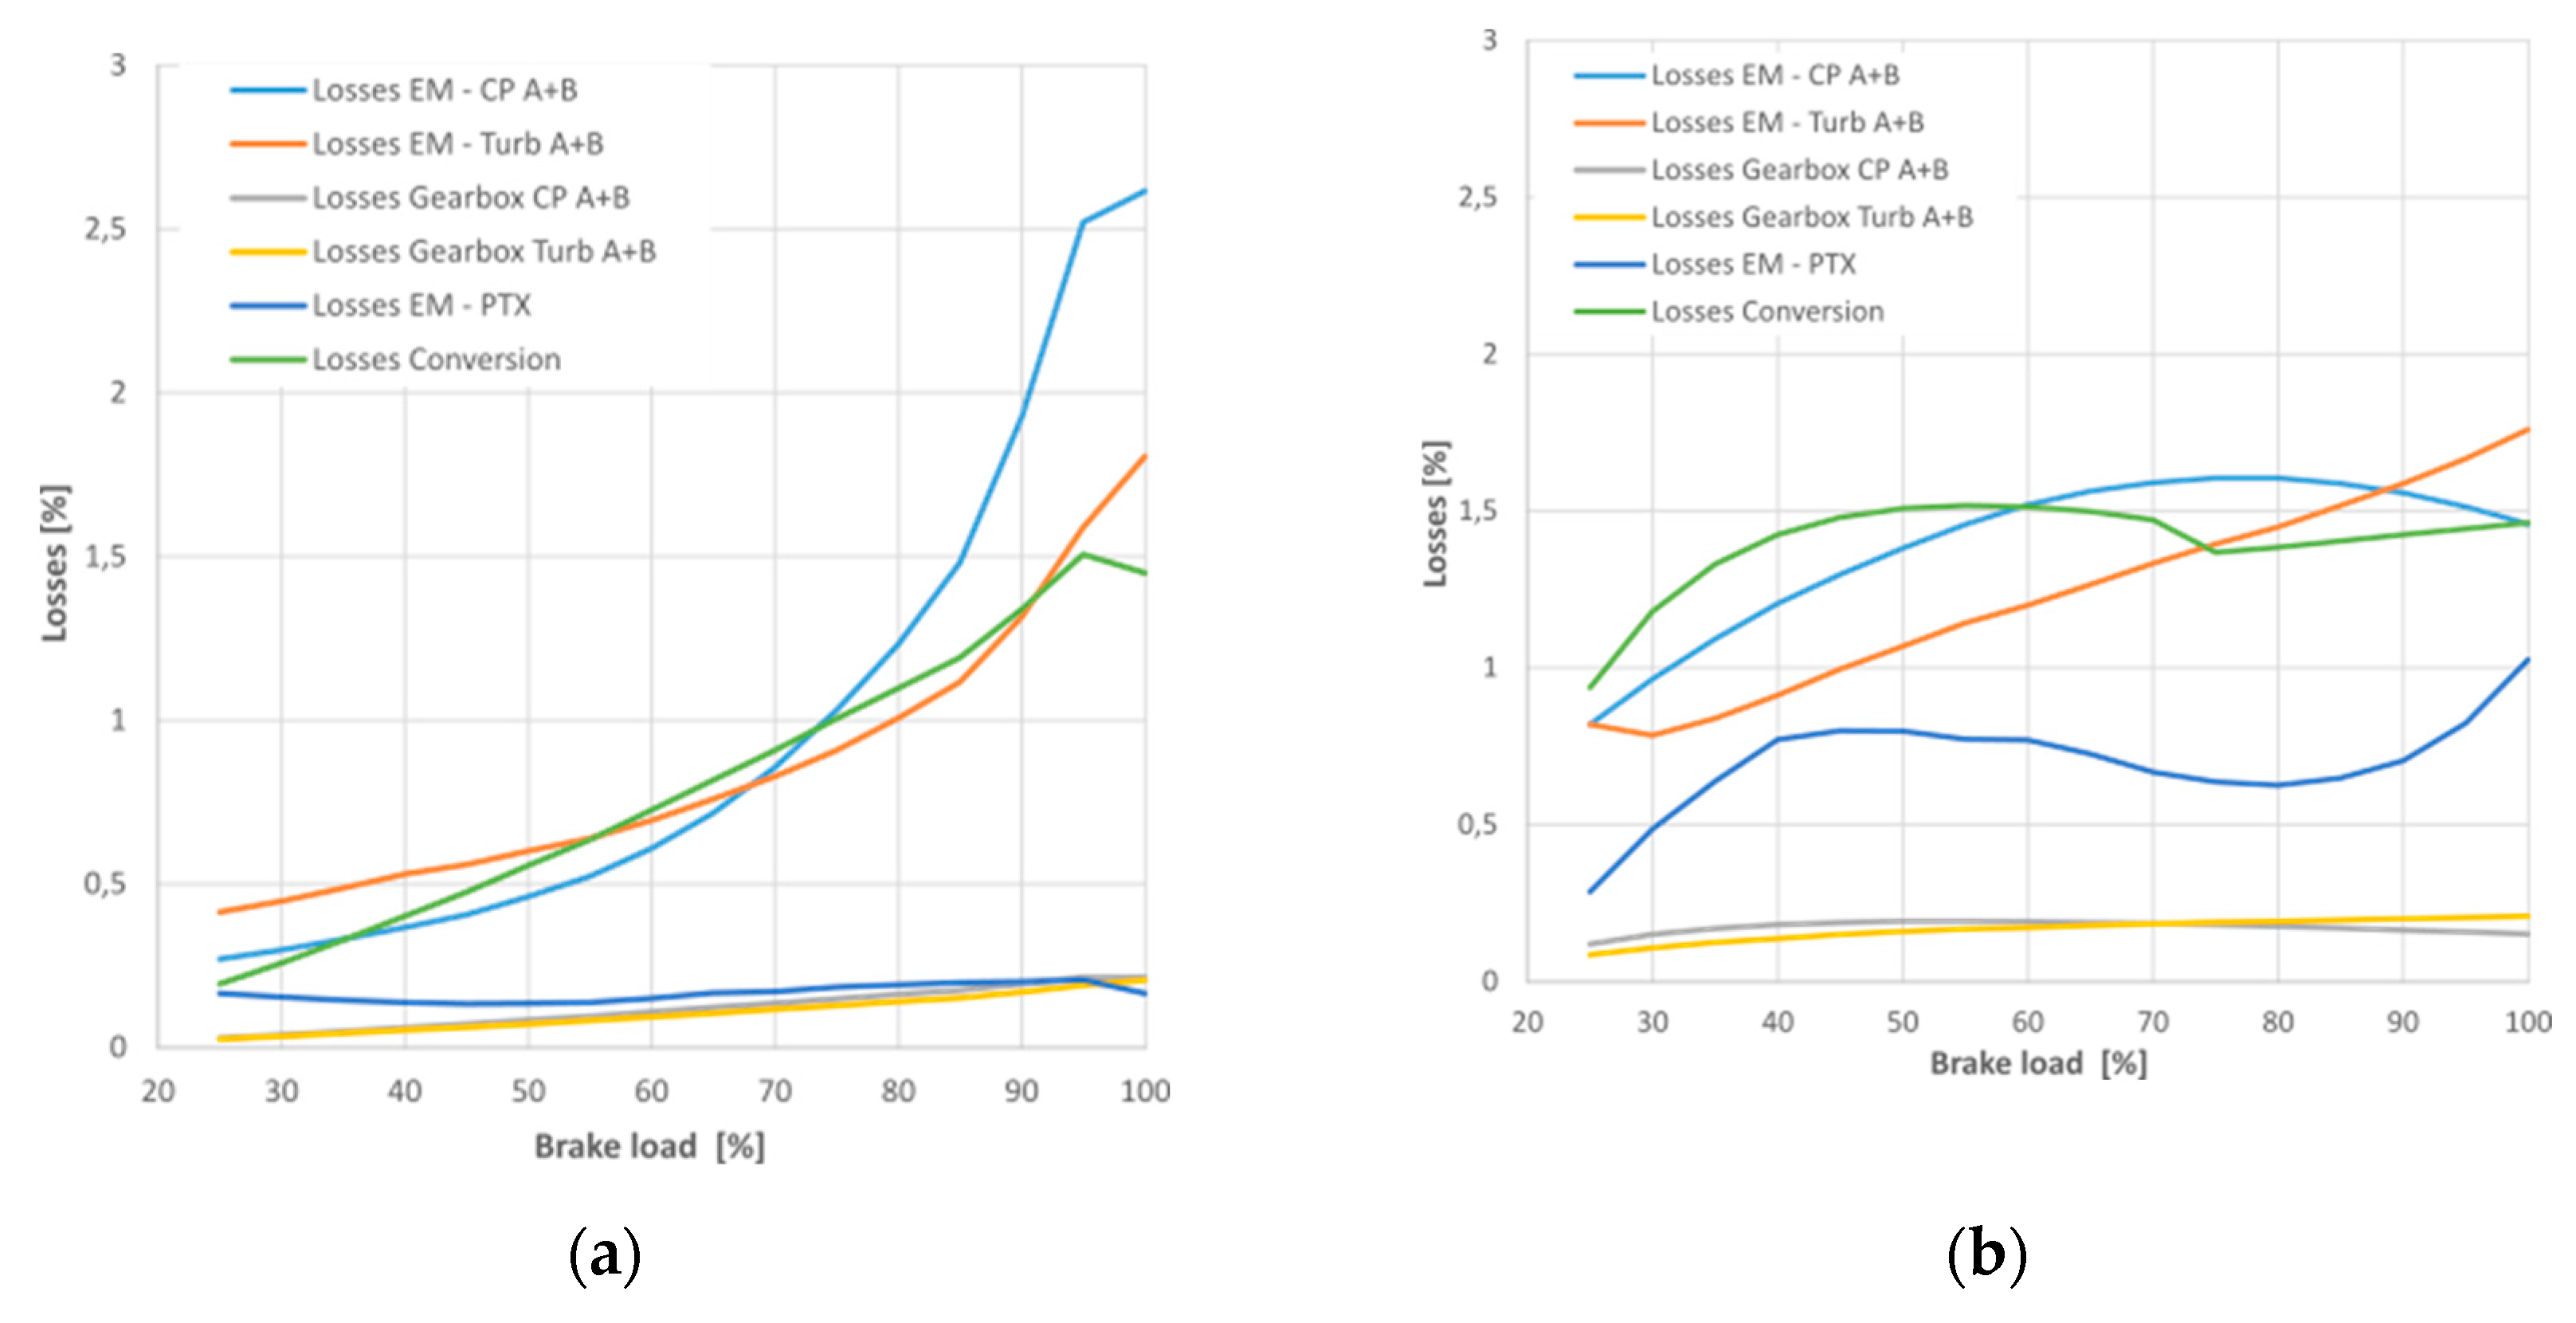
Figure 25, these added losses are decomposed by source,
Figure 25a represents the decomposed losses from the not optimized configuration and
Figure 25b the totally optimized configuration.
Before the optimization, there almost no demand from the PTX, as the turbomachines are close to their power equilibrium, coming from the turbocharger configuration. After the optimization at low brake loads, it can be noticed in
Figure 25b, the PTX demand used to cover the increased compressor power increases the conversion losses and thus the total added losses. The added losses of the optimized configuration (Turbosplit-E) are higher for any brake load below 90%, however the efficiencies of the EMs in the architecture are higher in the optimized configuration as seen in
Figure 26. Which confirms that the increased added losses are not due to poor efficiency.
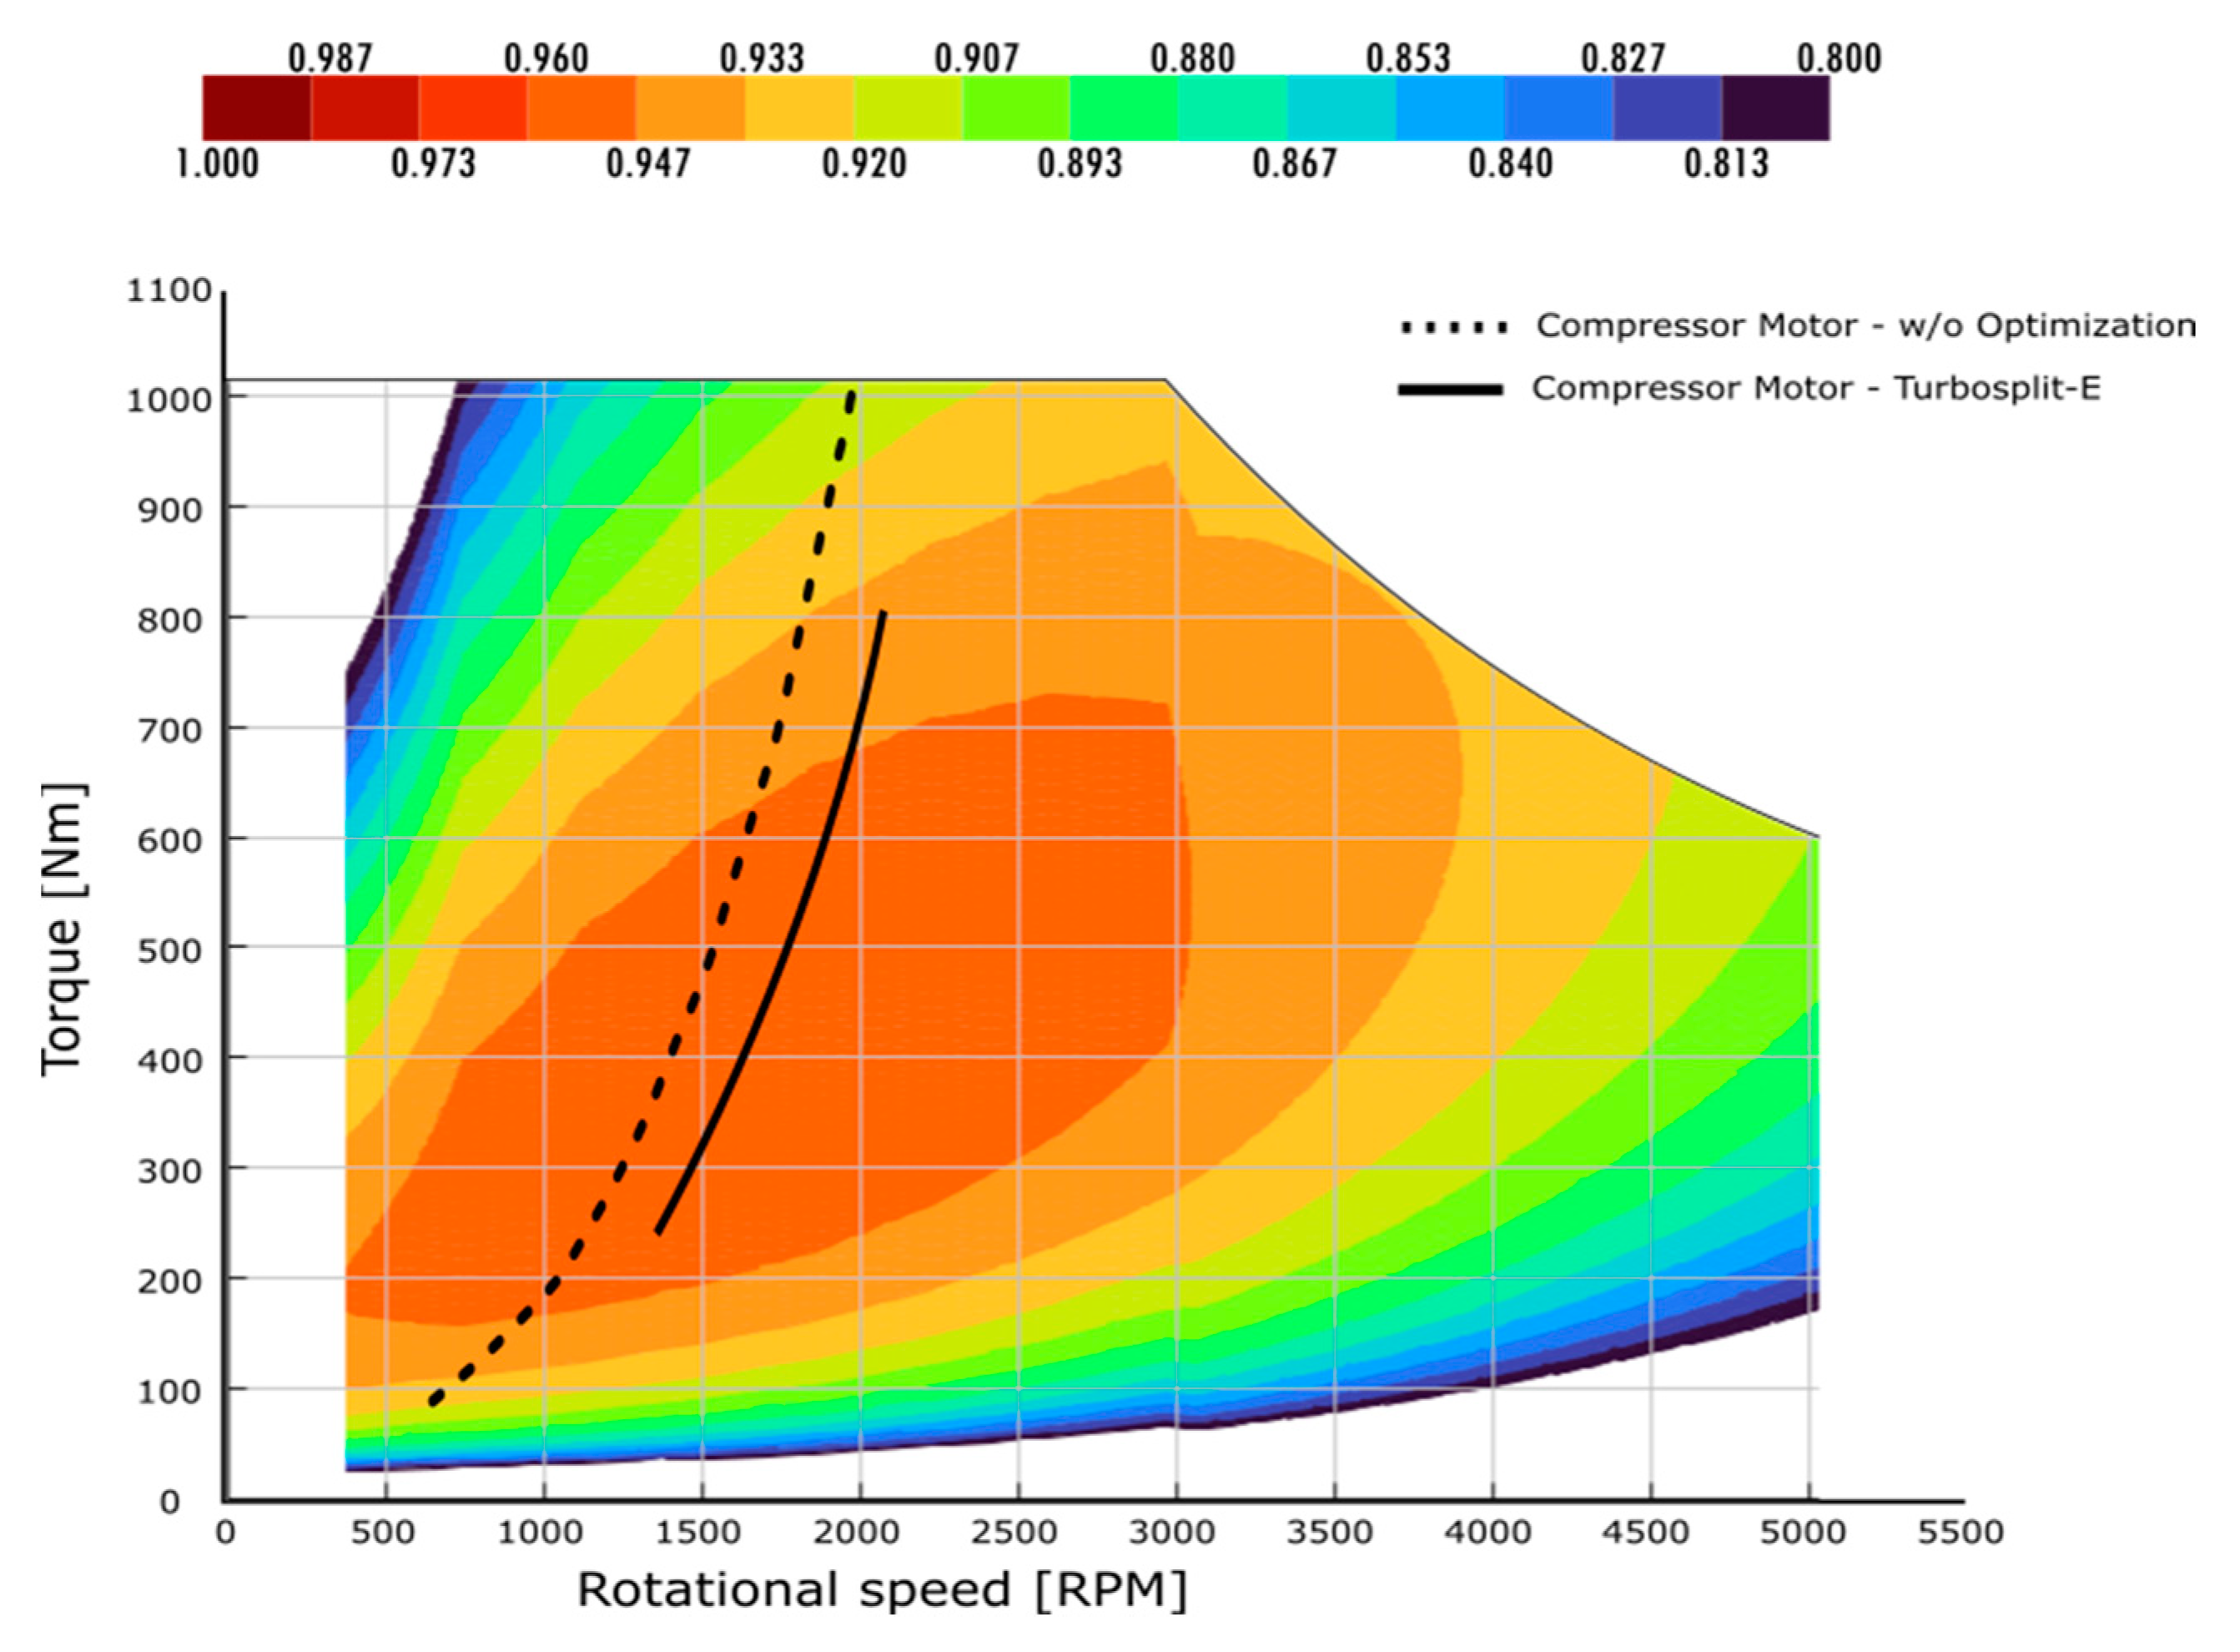
A deeper sight into the electromechanical efficiency maps of the EMs shows that the motor associated to the compressor, in
Figure 27, reaches the limits of maximum torque at nominal brake-load. The optimization shifts the torque curve towards the high efficiency region. Regarding the generator associated to the turbine in
Figure 28, the speed control allows a different shape of the torque-speed curve, keeping a constant increasing power, as saw in
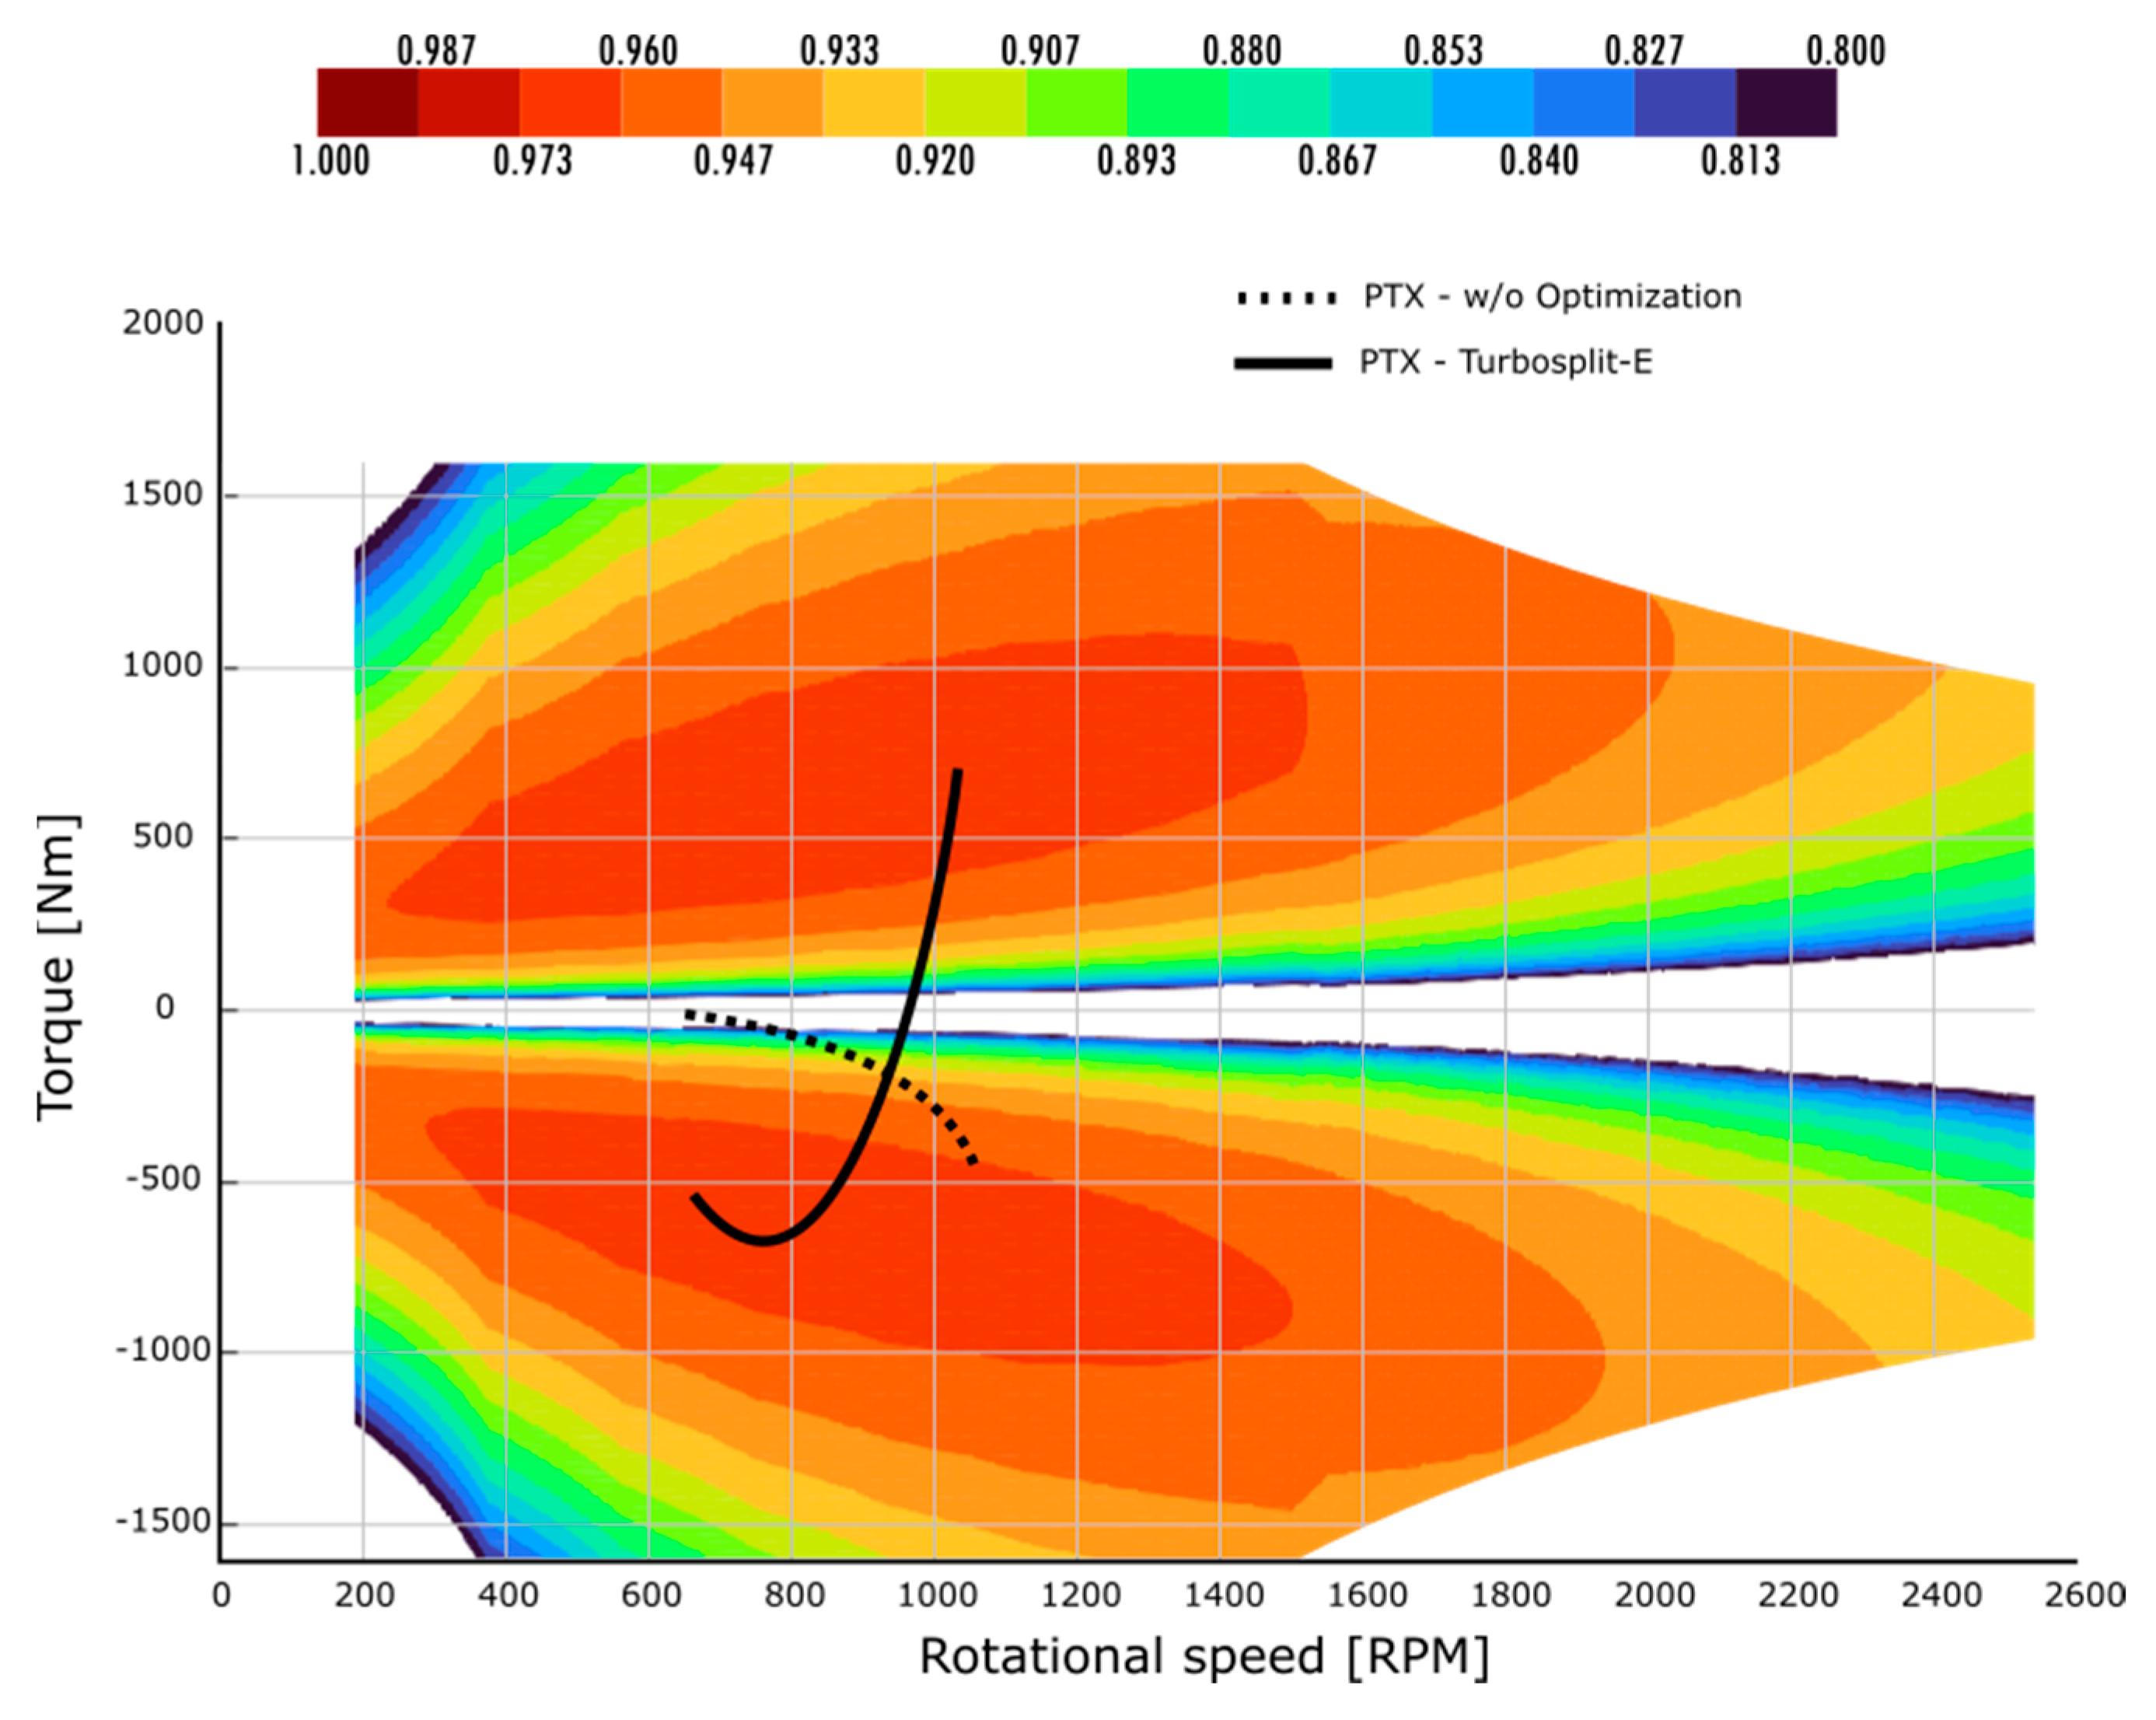
Figure 20b. The PTX machine is the only capable of motor/generator operation in the system. In the optimized configuration, the generator demanded torque reduces when brake-load increases, and the torque-curve of the PTX approaches the x-axis. At near zero torque, the electromechanical efficiency of the PTX drops to near zero values. In
Figure 26b it can be noticed the drop of electromechanical efficiency marking the passage to motor.
3.5. Weighted Average BSFC in Real-Life Cycles
Table 10 shows the relative difference between both optimized architecture, baseline-optimized and Turbosplit-E, according to the weighted averaged BSFC on the ISO 8178 cycle, results are expressed relatively to baseline values. The Turbosplit-E configuration obtains higher fuel consumptions due to the efficiency losses and it cannot overcome a perfectly matched turbocharger with an optimized engine for this specific cycle operation. This section examines how these two configurations perform along three different real-life cycle operations.
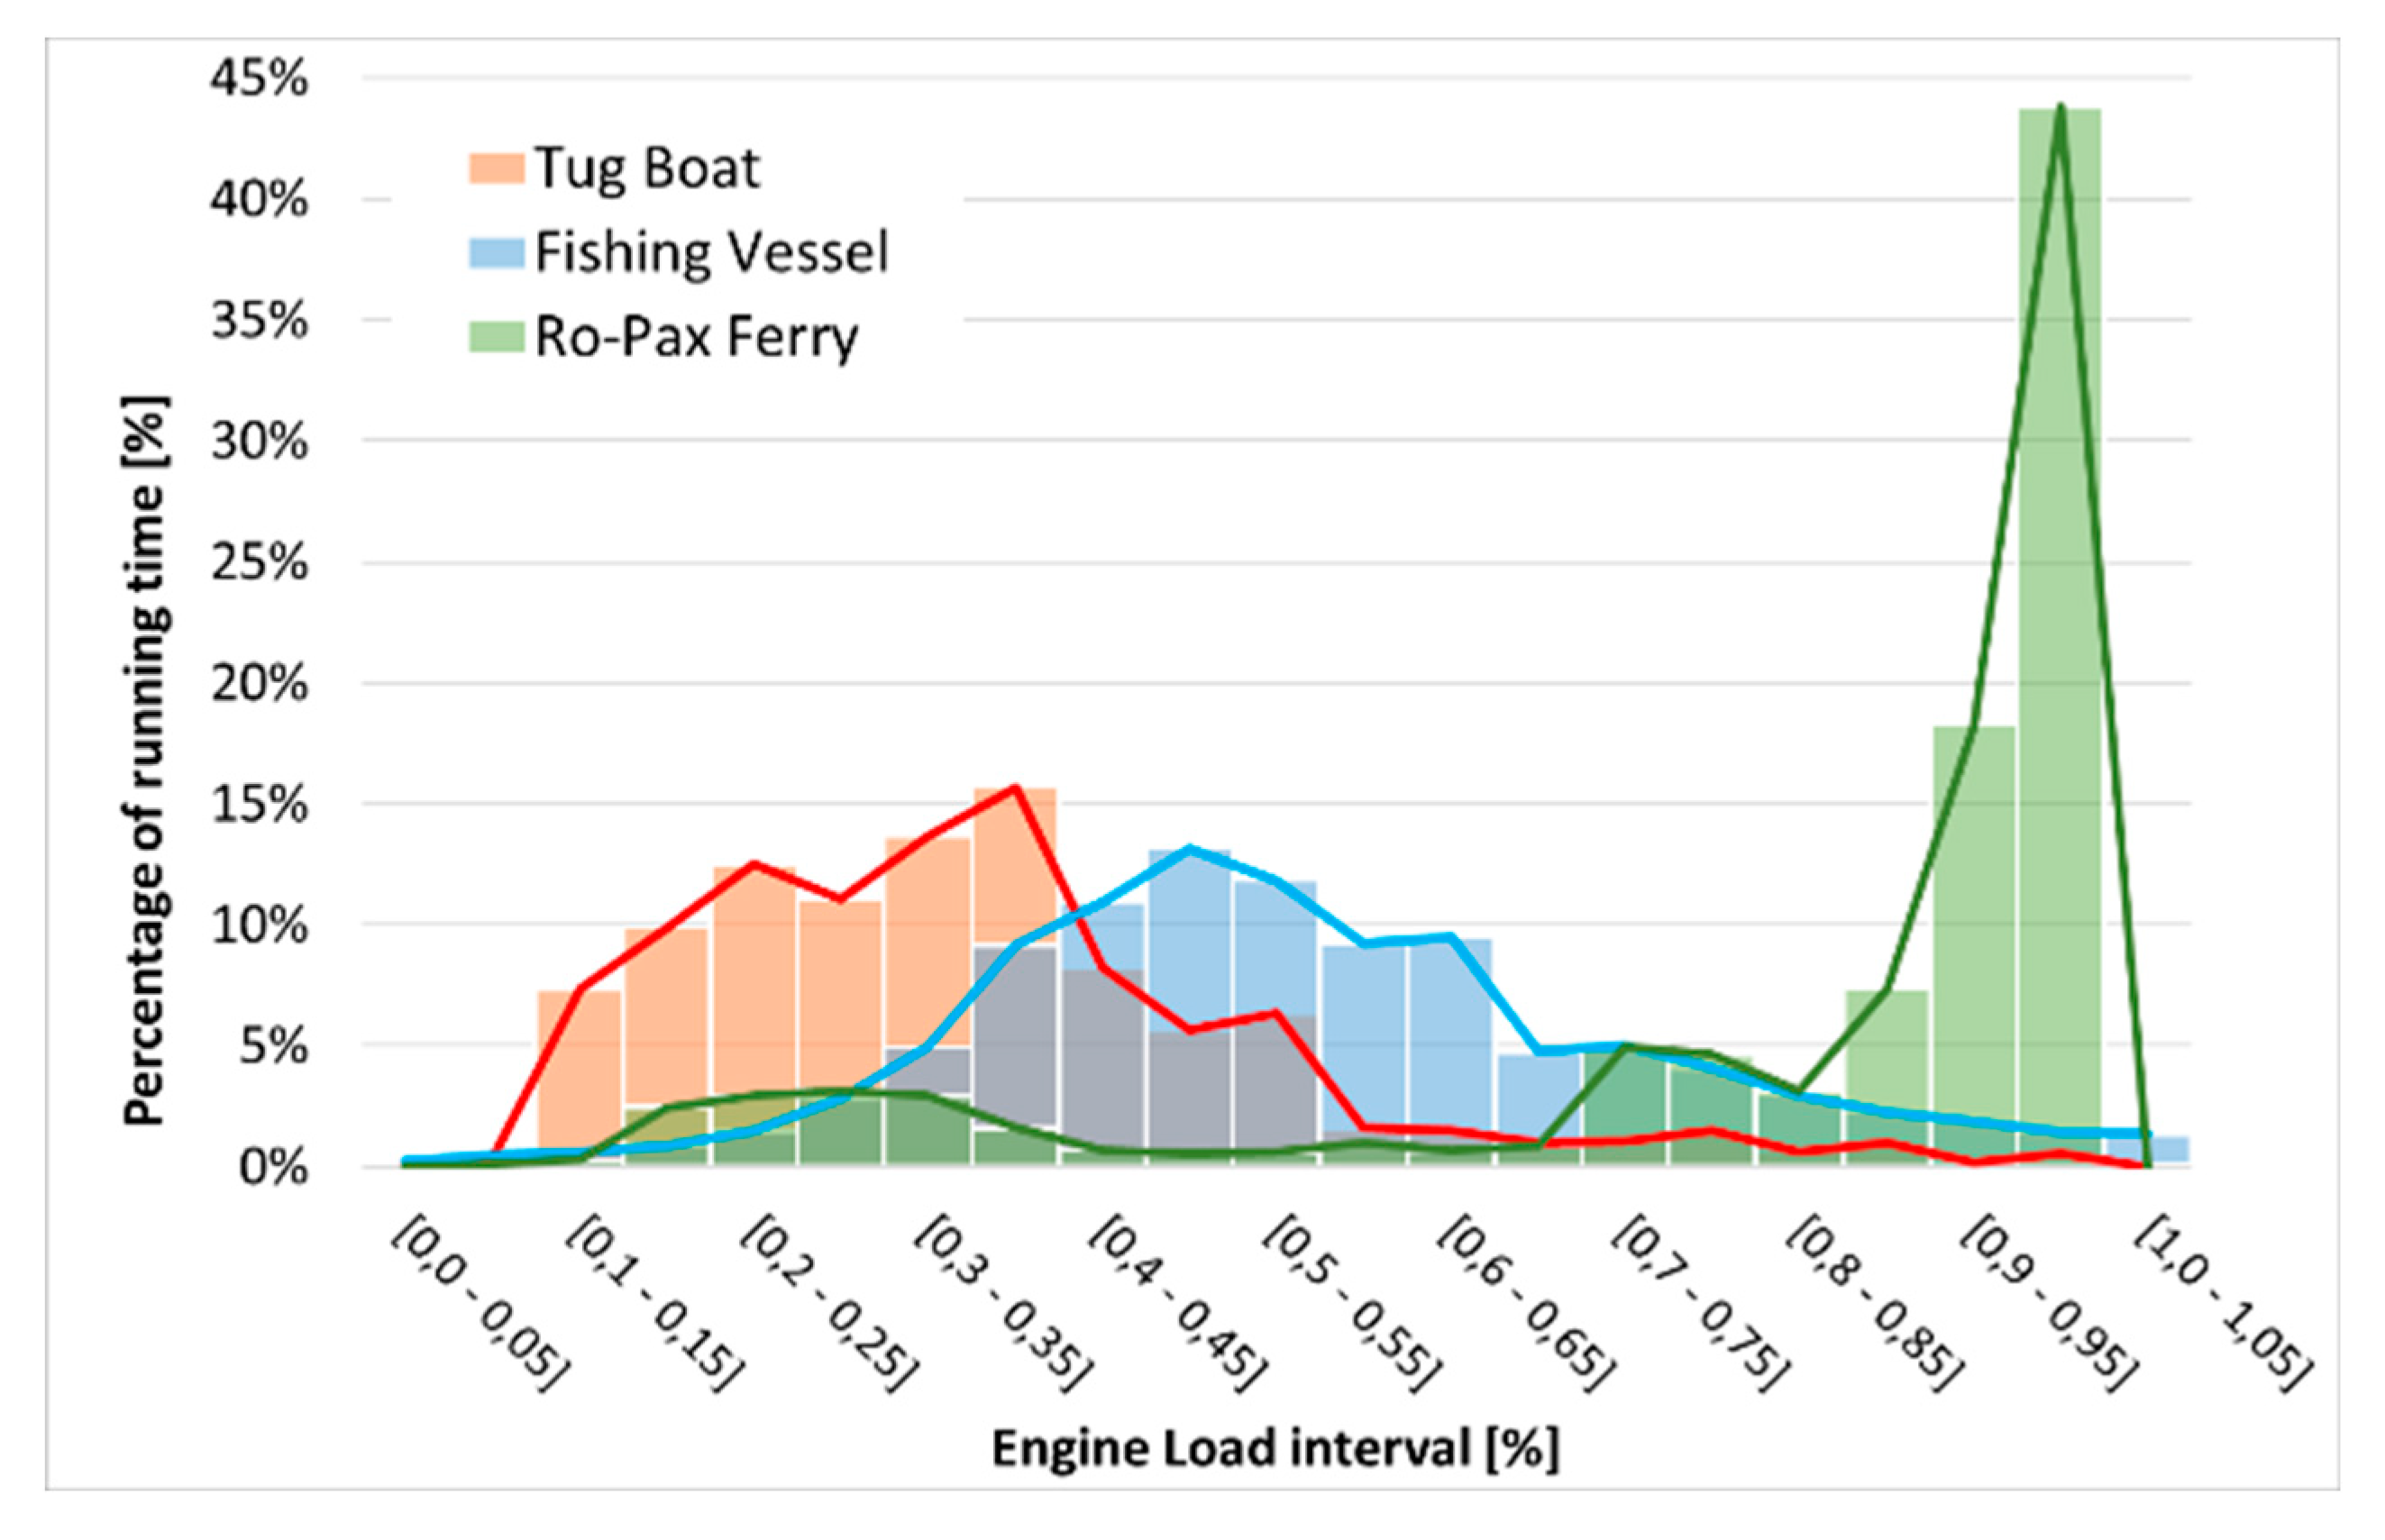
The three different operating profiles of vessels to analyze are obtained from the MAN Energy Solutions database. This data is represented in form of an histogram in
Figure 30, where each bar represents the percentage of running hours under certain interval of engine load, for each operating cycle.
The total fuel consumption associated with each type of ship is calculated by applying the BSFC to each interval of the histogram and then scaled it to its respective nominal vessel power from
Table 11. The differences in the operating profiles of the three types of vessels are significant: tugboats operate mainly at low engine loads, the fishing vessels operate most of the time at mid-engine loads, and the Ro-pax ferries are being driven mostly at high engine loads.
When both configurations are evaluated in the ISO 8178 cycle, the Turbosplit-E configuration obtains -1,36% less fuel consumption than baseline. When evaluated in a Tugboat profile, the improvement increases up to -5,3 % less fuel consumption, as the benefits of Turbosplit-E are focused on low brake loads, where the tugboats are mainly driven. In a fishing-vessel, the Turbosplit-E configuration obtains an improvement of -2,7% less fuel consumption than baseline, which is still higher than the estimation with the fictional ISO 8178 cycle. Due the fact that ro-pax ferries are mainly driven at high brake-loads, the Turbosplit-E cannot overcome the baseline consumption.
Compared with the baseline-optimized configuration, the benefits obtained with Turbosplit-E are no match for a perfectly matched turbocharger. However, in terms of total tons of fuel consumed per year in a tugboat, the difference between the baseline optimized (-42 tons) and Turbosplit-E (-34 tons) is 8 tons per year. This demonstrate that improving the air-changing system by electric hybridization have more potential in reducing fuel consumption in vessels being driven like tugboats, more than ro-pax ferries, and the adoption of different arrangements of turbochargers and electric machines could overpass a baseline-optimized configuration.
4. Discussion
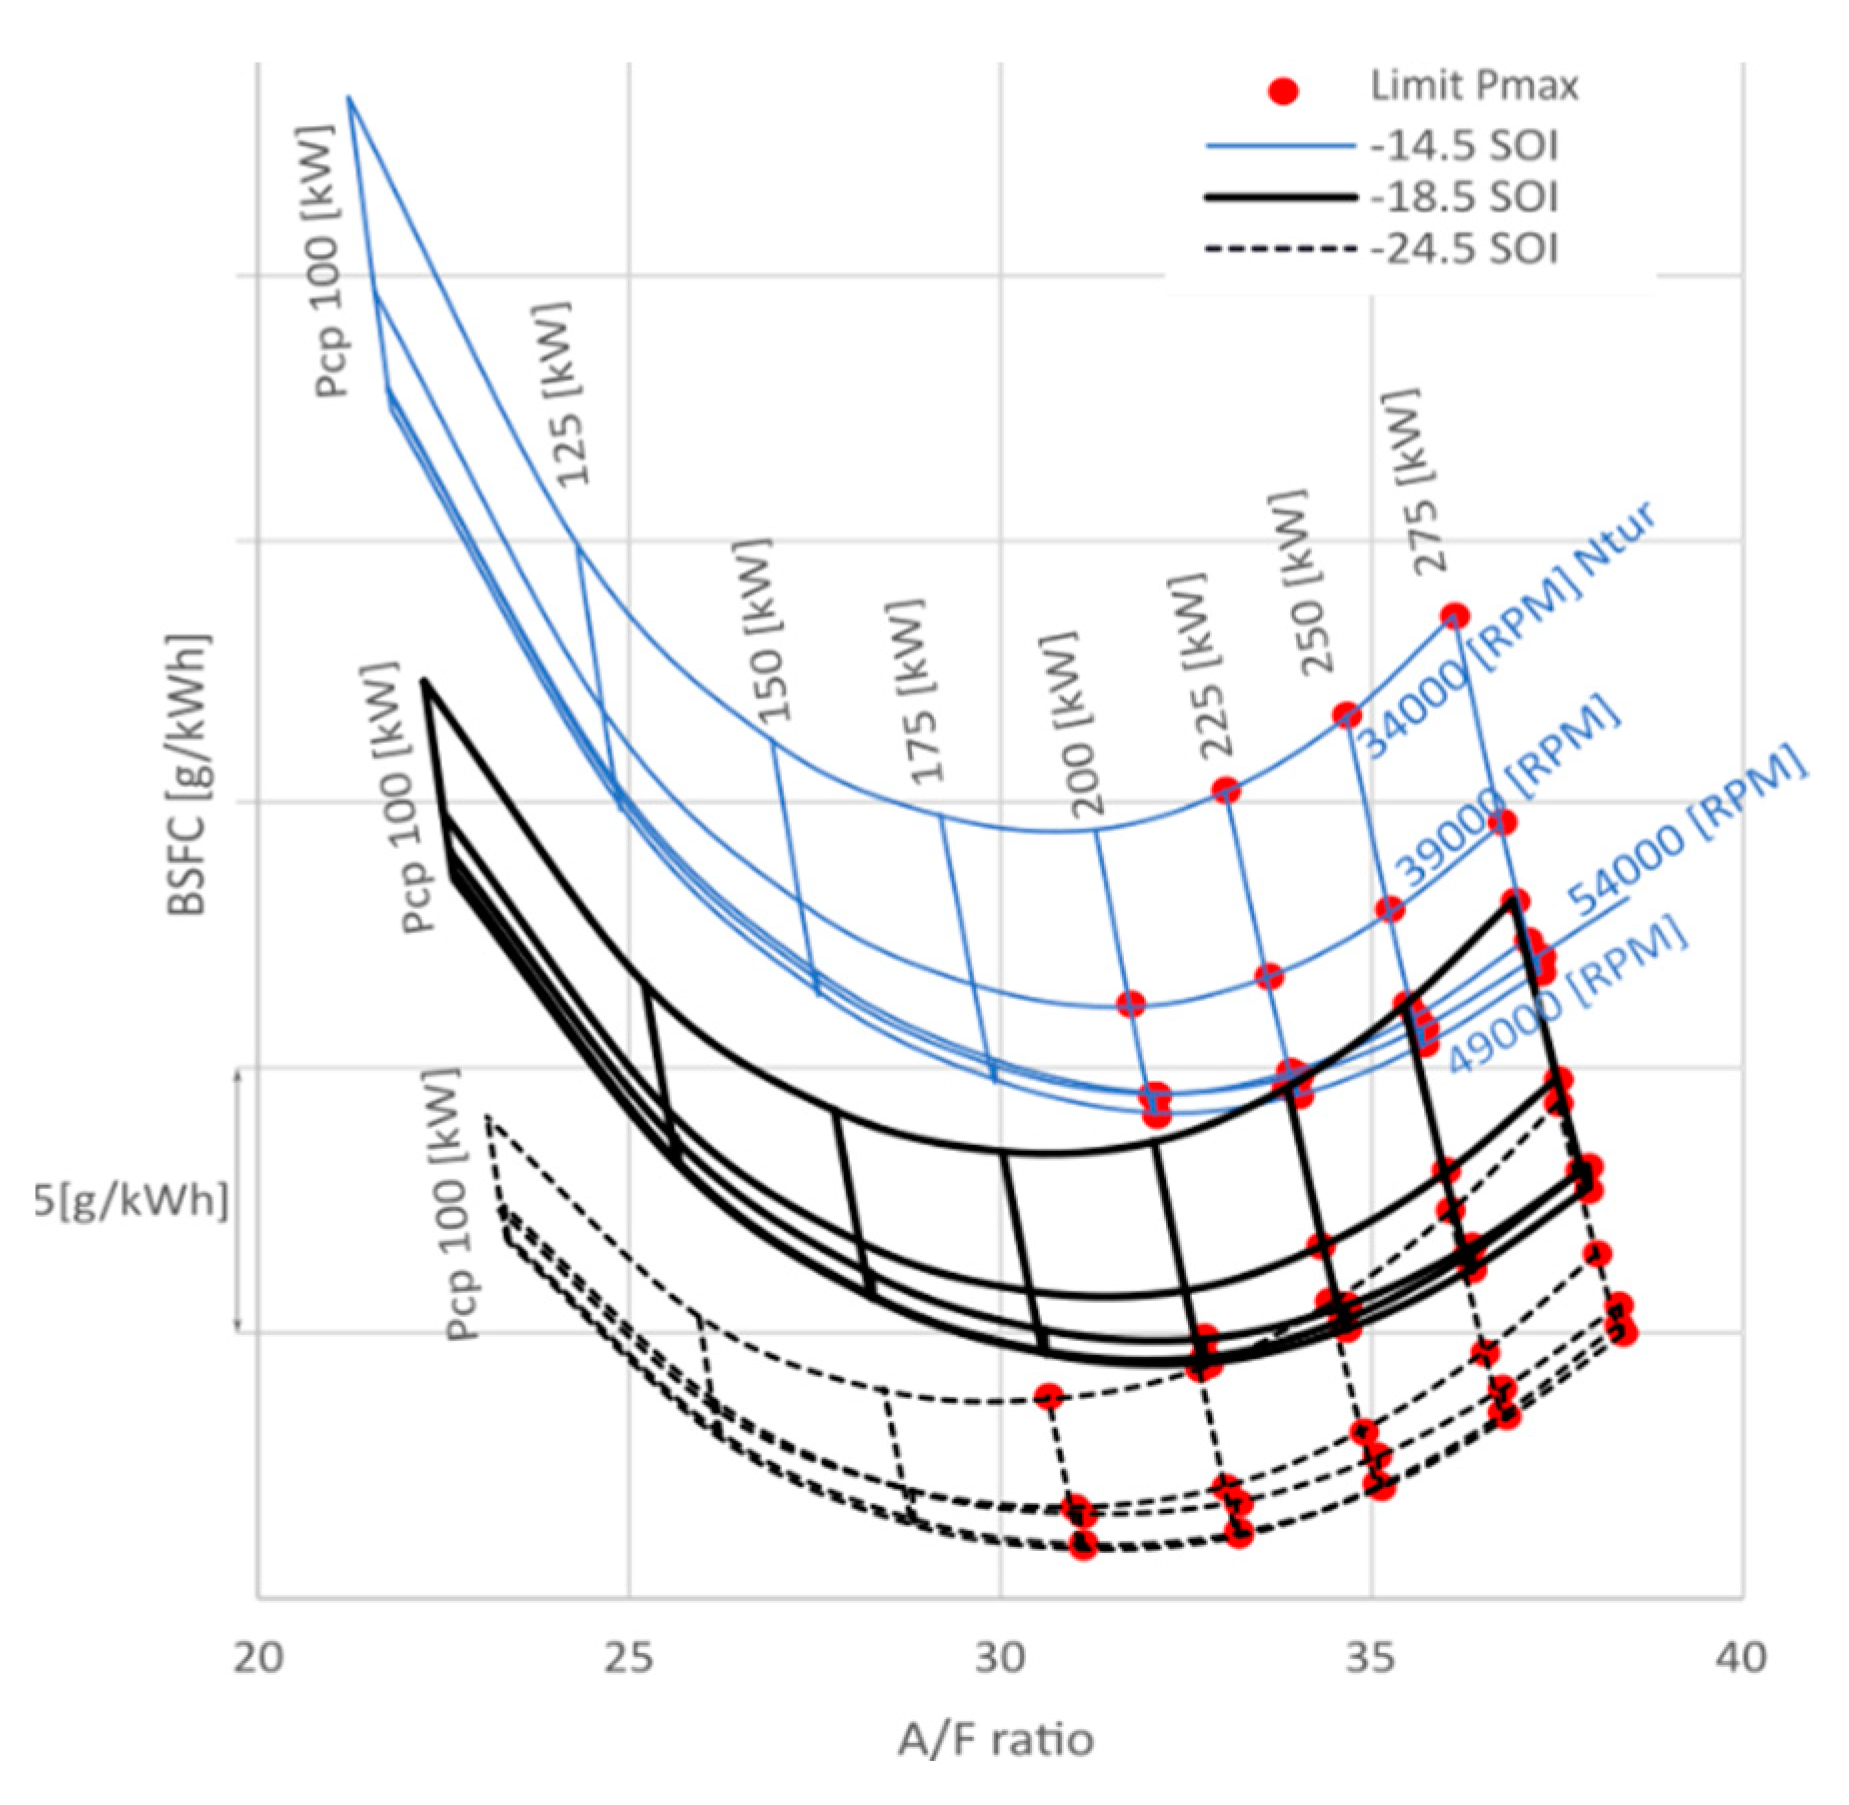
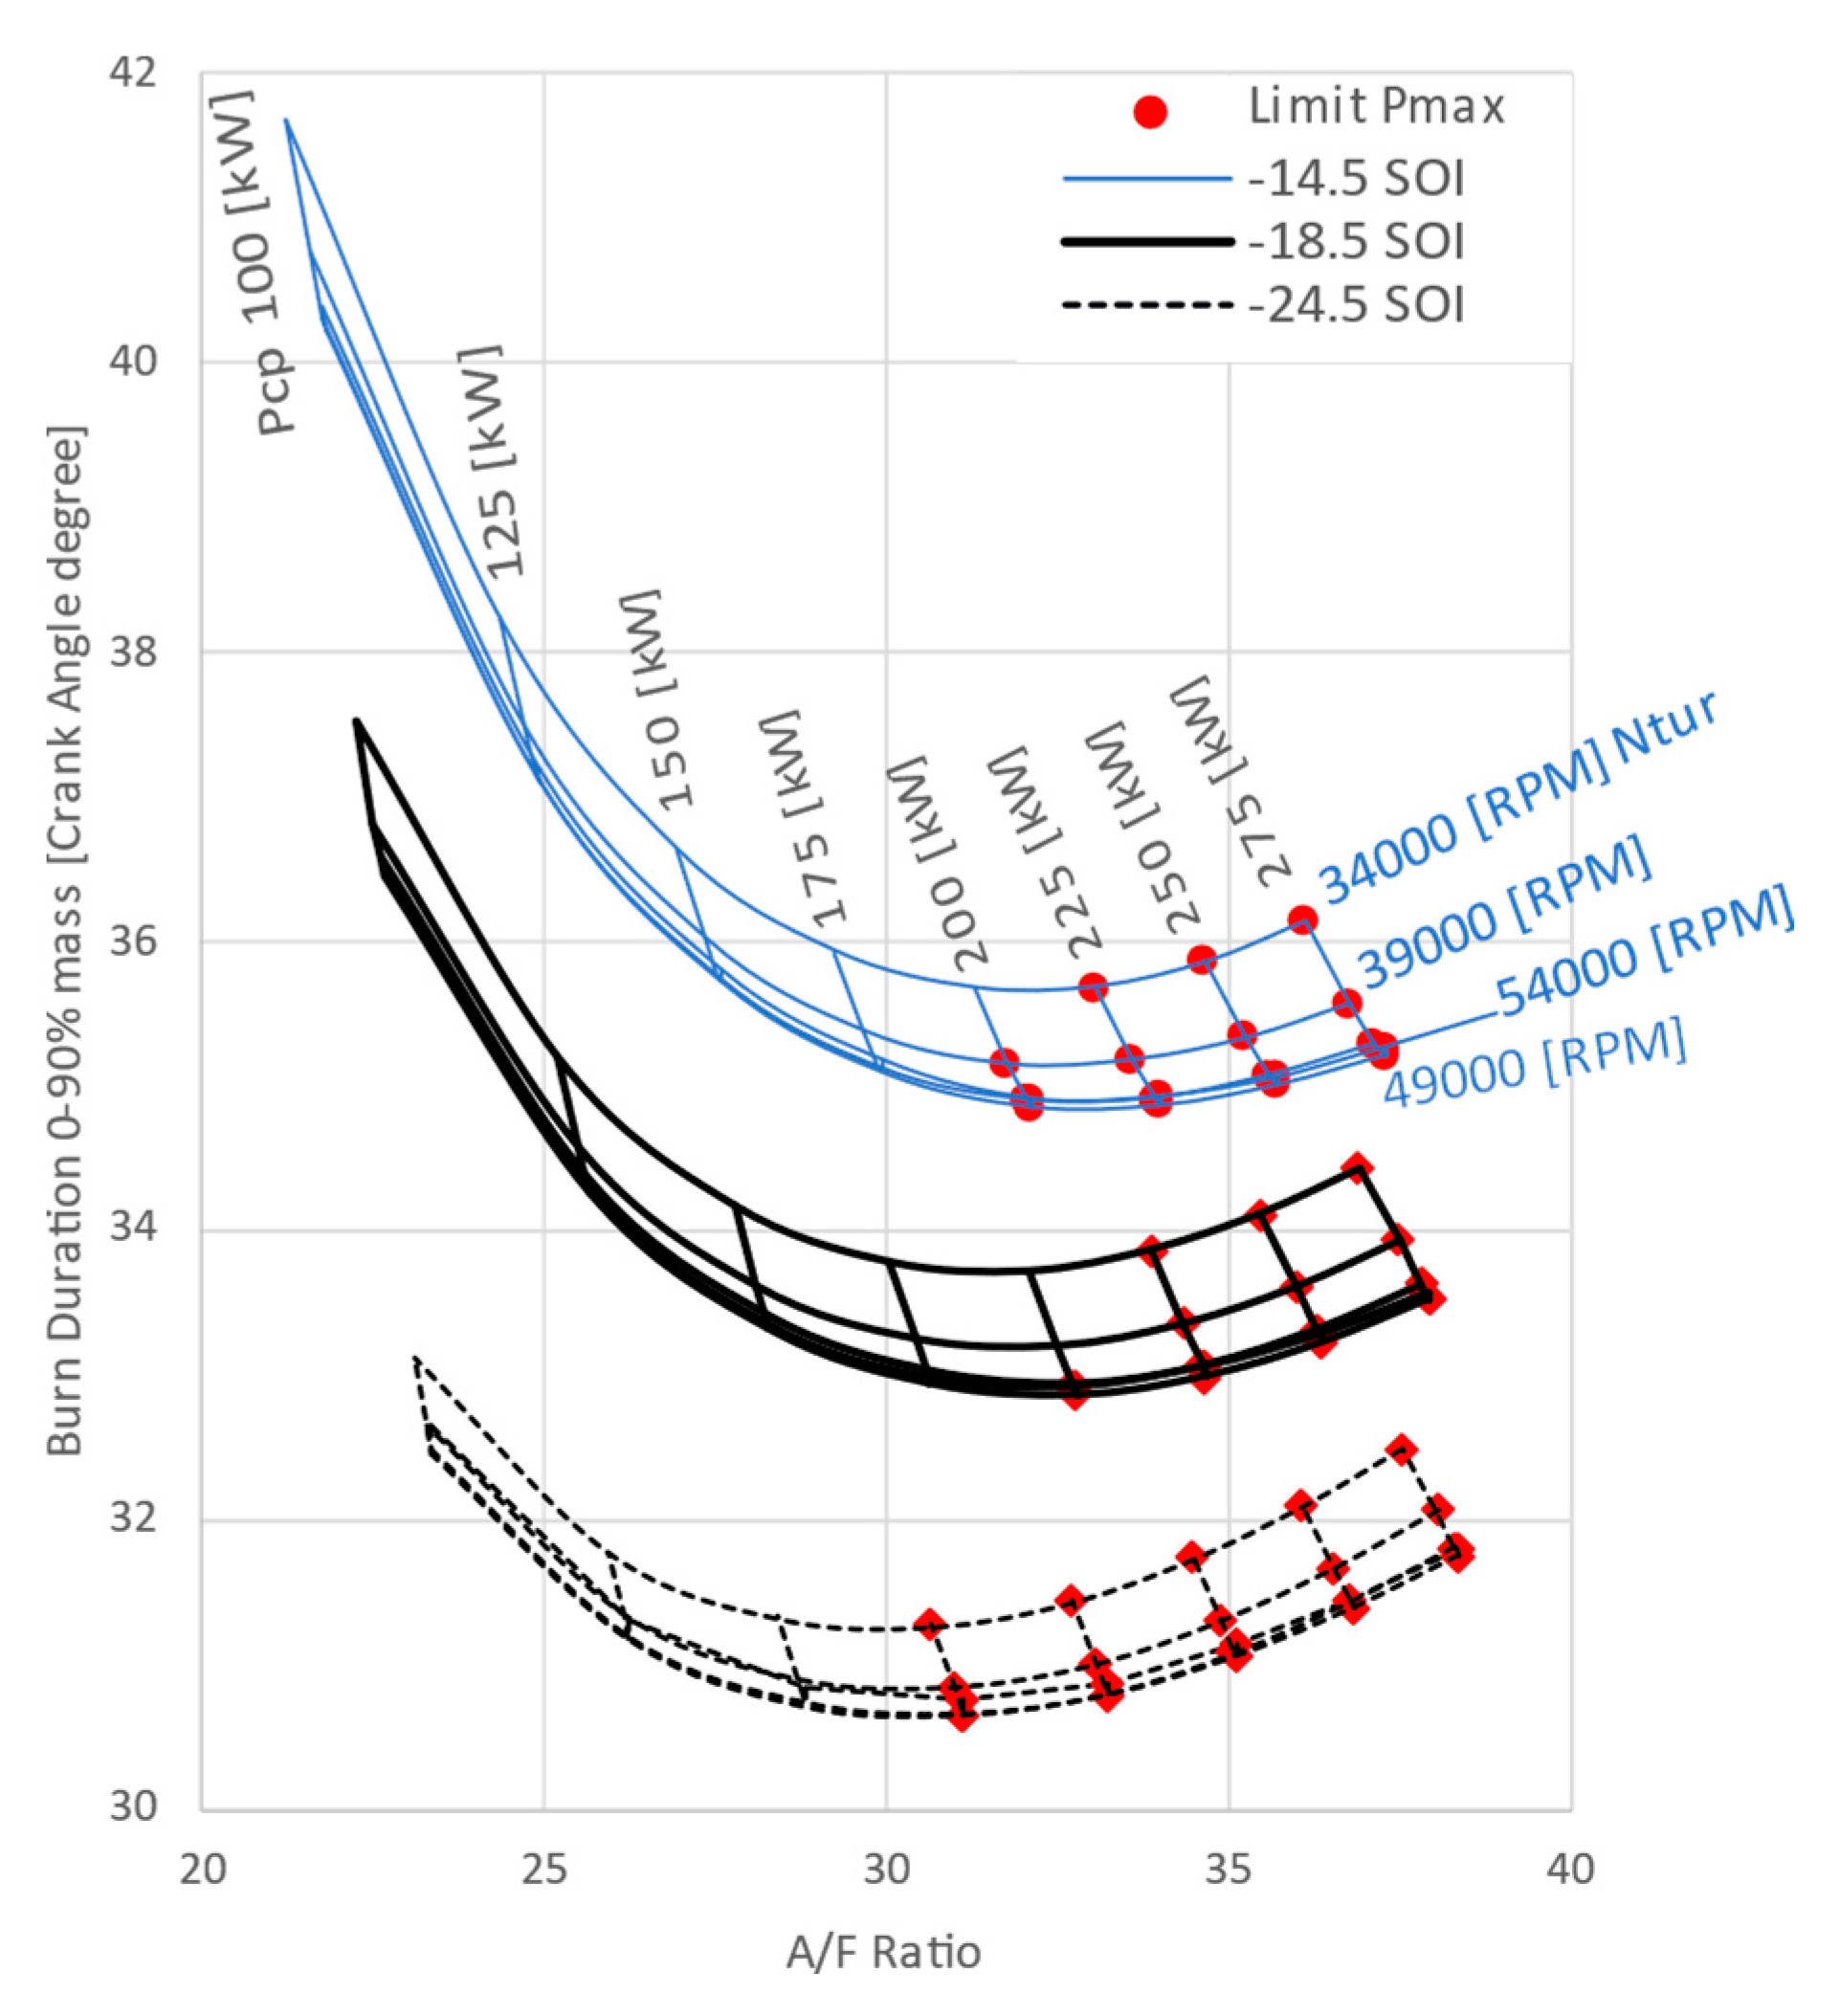
Figure 31 shows the evolution of system BSFC for a constant demanded brake load (75% of brake load, propeller-law), while varying compressor power, turbine speed, and SOI. Results are presented in terms of air-to-fuel ratio (in-cylinder trapped). An increase in air-to-fuel (A/F) ratio accelerates the combustion, as seen in
Figure 32, improving engine gross efficiency [
30].
However, due to the electric energy balance, increasing the A/F ratio requires additional compressor power, increasing the power demand from the PTX. To maintain the same load demand, the internal combustion engine (ICE) must produce more power to meet the PTX power requirement. This results in extending the injection duration for a constant SOI, leading to longer combustion durations. The balance of these competing factors requires finding an optimal operational point that minimizes the combustion duration; and thus, system BSFC.
The effect of the system properties is difficult to interpret due to the choice of use genetic algorithm upfront brute force searching. A smaller turbine size increases considerably turbine power as seen in
Figure 20. The new compressor size allows to reduce the demand of power, which increase the surplus of energy. The effect of valve timing observed at high engine loads in
Figure 23 is mainly due to the increase of valve overlapping. The Miller effect achieved with reduced intake opening time is counteracted with increased boost pressure at loads below 70%, as saw in
Figure 19. Exhaust valve opening is delayed, preferring in-cylinder engine energy production upfront the turbine energy recovery.
While this study demonstrates that purely adapting the engine operation without batteries can reduce fuel consumption compared to the stock version, optimizing the existing turbocharged engine may offer greater fuel savings with reduced complexity. Future studies should explore the potential benefits of adding an electric accumulator to the system. Different arrangements of turbochargers and electric machines could improve the benefits obtained with a purely electrically divided turbocharger. The ability to control the A/F ratio might be attracting for new applications requiring specific control of the combustion, such as new alternative decarbonized fuels.
Figure 1.
Diagram of the prototype 4V PA6B MAN-Pielstick engine.
Figure 1.
Diagram of the prototype 4V PA6B MAN-Pielstick engine.
Figure 2.
Propeller Law for a PA6B engine.
Figure 2.
Propeller Law for a PA6B engine.
Figure 3.
Temperature comparison between measurements and model results, along the propeller law.
Figure 3.
Temperature comparison between measurements and model results, along the propeller law.
Figure 4.
Pressure comparison between measurements and model results, along the propeller law.
Figure 4.
Pressure comparison between measurements and model results, along the propeller law.
Figure 5.
Turbocharger speed comparison between measurements and model results, along the propeller law. Sequential operation deactivates turbocharger-A below 50%.
Figure 5.
Turbocharger speed comparison between measurements and model results, along the propeller law. Sequential operation deactivates turbocharger-A below 50%.
Figure 6.
Relative error of brake-specific fuel consumption between model and measurements of the 4V engine.
Figure 6.
Relative error of brake-specific fuel consumption between model and measurements of the 4V engine.
Figure 7.
Diagram of the hybrid air-charging system studied.
Figure 7.
Diagram of the hybrid air-charging system studied.
Figure 8.
Two possible converter arrangements: (a) individual DC-DC converters and a BUS-link; (b) single multiport DC-DC converter without BUS.
Figure 8.
Two possible converter arrangements: (a) individual DC-DC converters and a BUS-link; (b) single multiport DC-DC converter without BUS.
Figure 9.
Schemes of the functioning of the electric-hybrid architecture.
Figure 9.
Schemes of the functioning of the electric-hybrid architecture.
Figure 10.
Efficiency chain on a simple turbocharger.
Figure 10.
Efficiency chain on a simple turbocharger.
Figure 11.
Efficiency chain on the electrically divided turbocharger.
Figure 11.
Efficiency chain on the electrically divided turbocharger.
Figure 12.
Comparison between baseline turbocharged engine and electrically divided (Turbosplit) configuration, with and without the added losses.
Figure 12.
Comparison between baseline turbocharged engine and electrically divided (Turbosplit) configuration, with and without the added losses.
Figure 13.
Flow-chart of the optimization process.
Figure 13.
Flow-chart of the optimization process.
Figure 14.
Variation of turbine speed on Turbosplit architecture with efficiency chain equivalent to turbocharger. Comparison with turbocharger stock operating points.
Figure 14.
Variation of turbine speed on Turbosplit architecture with efficiency chain equivalent to turbocharger. Comparison with turbocharger stock operating points.
Figure 15.
Power on a single turbomachine along the propeller law.
Figure 15.
Power on a single turbomachine along the propeller law.
Figure 16.
SOI along propeller law. angles are shown relatively to the SOI used on the actual conventional plunger-type jerk fuel pump configuration.
Figure 16.
SOI along propeller law. angles are shown relatively to the SOI used on the actual conventional plunger-type jerk fuel pump configuration.
Figure 17.
PTX power evolution along the propeller law for different optimizations. Negative power indicates generator mode (PTO), and positive power indicates motor mode (PTI).
Figure 17.
PTX power evolution along the propeller law for different optimizations. Negative power indicates generator mode (PTO), and positive power indicates motor mode (PTI).
Figure 18.
Comparison of turbomachine sizes: (a) Compressor SAE map size comparison; (b) Turbine SAE map size comparison.
Figure 18.
Comparison of turbomachine sizes: (a) Compressor SAE map size comparison; (b) Turbine SAE map size comparison.
Figure 19.
Optimal pressure in the turbomachines: (a) Compressor outlet pressure; (b) Turbine inlet pressure.
Figure 19.
Optimal pressure in the turbomachines: (a) Compressor outlet pressure; (b) Turbine inlet pressure.
Figure 20.
Power on turbomachines along the propeller law: (a) Compressor power; (b) Turbine power.
Figure 20.
Power on turbomachines along the propeller law: (a) Compressor power; (b) Turbine power.
Figure 21.
Intake and exhaust valve profiles. Comparison of baseline stock with baseline optimized and Turbosplit optimized (E).
Figure 21.
Intake and exhaust valve profiles. Comparison of baseline stock with baseline optimized and Turbosplit optimized (E).
Figure 22.
LogP vs LogV cycle Diagram. Comparison between turbocharger stock configuration and Turbosplit-E configuration. Nominal operating point (100% load- 100% speed).
Figure 22.
LogP vs LogV cycle Diagram. Comparison between turbocharger stock configuration and Turbosplit-E configuration. Nominal operating point (100% load- 100% speed).
Figure 23.
Difference of system BSFC relatively to baseline values, in percentage.
Figure 23.
Difference of system BSFC relatively to baseline values, in percentage.
Figure 24.
Total added losses [kW] of the electrically divided turbocharger relatively to brake-power, with and without optimization.
Figure 24.
Total added losses [kW] of the electrically divided turbocharger relatively to brake-power, with and without optimization.
Figure 25.
Added losses decomposed by source: (a) Case without optimization (b) case Turbosplit-E.
Figure 25.
Added losses decomposed by source: (a) Case without optimization (b) case Turbosplit-E.
Figure 26.
Electromechanical efficiency of the EMs in the architecture: (a) Case without optimization; (b) Case Turbosplit-E.
Figure 26.
Electromechanical efficiency of the EMs in the architecture: (a) Case without optimization; (b) Case Turbosplit-E.
Figure 27.
Electromechanical efficiency map of the motor which drives the compressor-A.
Figure 27.
Electromechanical efficiency map of the motor which drives the compressor-A.
Figure 28.
Electromechanical efficiency map of the generator linked to the turbine.
Figure 28.
Electromechanical efficiency map of the generator linked to the turbine.
Figure 29.
Electromechanical efficiency of the PTX machine.
Figure 29.
Electromechanical efficiency of the PTX machine.
Figure 30.
Three different operating profiles shown in form of a histogram of percentage of running time and engine load.
Figure 30.
Three different operating profiles shown in form of a histogram of percentage of running time and engine load.
Figure 31.
System BSFC variation according to A/F ratio (trapped) when modifying turbine speed and compressor power, for three different configurations of SOI. (75% of brake load).
Figure 31.
System BSFC variation according to A/F ratio (trapped) when modifying turbine speed and compressor power, for three different configurations of SOI. (75% of brake load).
Figure 32.
Variation of turbine speed and compressor power for the same three configurations of SOI on combustion duration. (75% of brake load).
Figure 32.
Variation of turbine speed and compressor power for the same three configurations of SOI on combustion duration. (75% of brake load).
Table 1.
Main characteristics of prototype 4V PA6B MAN-Pielstick engine.
Table 1.
Main characteristics of prototype 4V PA6B MAN-Pielstick engine.
| Variable |
Value |
| No. of cylinders |
4 in V |
| Bore |
280 mm |
| Stroke |
330 mm |
| Nominal speed |
1050 RPM |
| Nominal power |
405 kW/cyl |
| Air-charging system |
2-parallel free-floating turbochargers |
Table 2.
Configuration of Baseline-optimized, values relative to baseline values.
Table 2.
Configuration of Baseline-optimized, values relative to baseline values.
| Variable |
Unit |
Value of Baseline-optimized |
| SOI at 100% of load |
Degrees |
+2 |
| SOI at 75% of load |
Degrees |
+2 |
| SOI at 50% of load |
Degrees |
+5 |
| SOI at 25% of load |
Degrees |
+3 |
| Pressure-ratio multiplier (compressor) |
- |
1,002 |
| Mass-flow multiplier (compressor) |
- |
0,796 |
| Pressure-ratio multiplier (turbine) |
- |
1,187 |
| Mass-flow multiplier (turbine) |
- |
0,754 |
| Exhaust valve opening (EVO) |
Degrees |
+10 |
| Exhaust valve closing (EVC) |
Degrees |
-13 |
| Intake valve opening (IVO) |
Degrees |
-20 |
| Intake valve closing (IVC) |
Degrees |
-40 |
Table 3.
Main characteristics of the EMs used in the study.
Table 3.
Main characteristics of the EMs used in the study.
| Position |
EM model |
Variable |
Value |
| PTX |
SE 315 S4 |
Rated speed |
1500 RPM |
| Rated power |
250 kW |
| Compressor |
AH 315 M2 |
Rated speed |
2965 RPM |
| |
|
Rated power |
315 kW |
| Turbine |
SE 315 LL4 |
Rated speed |
1500 RPM |
| Rated power |
360 kW |
Table 4.
Main characteristics of gearboxes used in the study.
Table 4.
Main characteristics of gearboxes used in the study.
| Position |
Gearbox type |
Gear-ratio |
| Compressor |
High-speed planetary |
1:23,14 |
| Turbine |
High-speed helical |
1:35 |
Table 5.
Optimization factors categorized by state variable or system properties.
Table 5.
Optimization factors categorized by state variable or system properties.
| Type |
Name |
Unit |
Along cases |
| State variables |
Turbine speed |
[rpm] |
Independent |
| Compressor power |
[kW] |
Independent |
| SOI |
[deg] |
Independent |
System
properties |
Turbomachine size |
[-] |
Case sweep |
| Valve timing |
[deg] |
Case sweep |
Table 6.
Limits and constraints for the optimization problem.
Table 6.
Limits and constraints for the optimization problem.
| Name |
Unit |
Minimum |
Maximum |
| Turbine speed |
[rpm] |
5000 |
56500 |
| Compressor power |
[kW] |
5 |
300 |
| SOI |
[deg] 1
|
-12 |
0 |
| Turbomachine size |
[-]2
|
0,75 |
1,25 |
| Valve timing |
[deg]2
|
-30 |
30 |
| Max. in-cylinder pressure |
[bar] |
Ignore |
Same maximum than baseline |
| Max. Turbine inlet temperature |
[K] |
Ignore |
Same maximum than baseline |
| Surge margin |
[%] |
15 |
Ignore |
Table 7.
Weights for the ISO 8178-5 cycle.
Table 7.
Weights for the ISO 8178-5 cycle.
| Load (i) [%] |
100 |
75 |
50 |
25 |
| Weight (wi) |
0,2 |
0,5 |
0,15 |
0,15 |
Table 8.
Genetic algorithm parameters.
Table 8.
Genetic algorithm parameters.
| |
Baseline-optimized |
Turbosplit-D |
Turbosplit-E |
| Population size |
40 |
80 |
100 |
| No. of generations |
60 |
75 |
80 |
| Cross-over rate |
50% |
50% |
50% |
| Mutation rate |
50% |
50% |
50% |
Table 9.
Optimal turbomachine sizes.
Table 9.
Optimal turbomachine sizes.
| Compressor |
|---|
| Multipliers |
Baseline-optimized |
Turbosplit-D |
Turbosplit-E |
| Pressure-ratio |
1,002 |
1,041 |
0,842 |
| Mass-flow rate |
0,796 |
0,858 |
0,779 |
| Turbine |
| Multipliers |
Baseline-optimized |
Turbosplit-D |
Turbosplit-E |
| Pressure-ratio |
1,187 |
1,202 |
1,229 |
| Mass-flow rate |
0,754 |
0,751 |
0,779 |
Table 10.
Weighted average system BSFC for the optimized architectures, values relative to baseline configuration.
Table 10.
Weighted average system BSFC for the optimized architectures, values relative to baseline configuration.
| Case |
Δ BSFC averaged ISO 8178 |
| Baseline-optimized |
-3,58 % |
| Turbosplit - E |
-1,36 % |
Table 11.
Characteristics of vessel operating profiles compared on the study.
Table 11.
Characteristics of vessel operating profiles compared on the study.
| Vessel type |
Nominal Power |
Running time
(% of the year) |
| Tugboat |
2040 [kW] x2 |
22,6 % |
| Fishing vessel |
2970 [kW] |
60,9 % |
| Ro-pax ferry |
10350 [kW] |
54,3 % |
Table 12.
Fuel consumption of both optimized architectures, relative to baseline values.
Table 12.
Fuel consumption of both optimized architectures, relative to baseline values.
| Vessel type |
Baseline
fuel consumption.
(tons/year) |
Δ consumption
Baseline-optimized
(tons/year [%]) |
Δ consumption
Turbosplit-E
(tons/year [%]) |
| Tugboat |
636 |
-42 [-6,6 %] |
-34 [5,3 %] |
| Fishing vessel |
1773 |
-90 [-5,1 %] |
-47 [-2,7 %] |
| Ro-pax ferry |
16029 |
-127 [-0,8 %] |
+ 2 [+ 0,01 %] |
