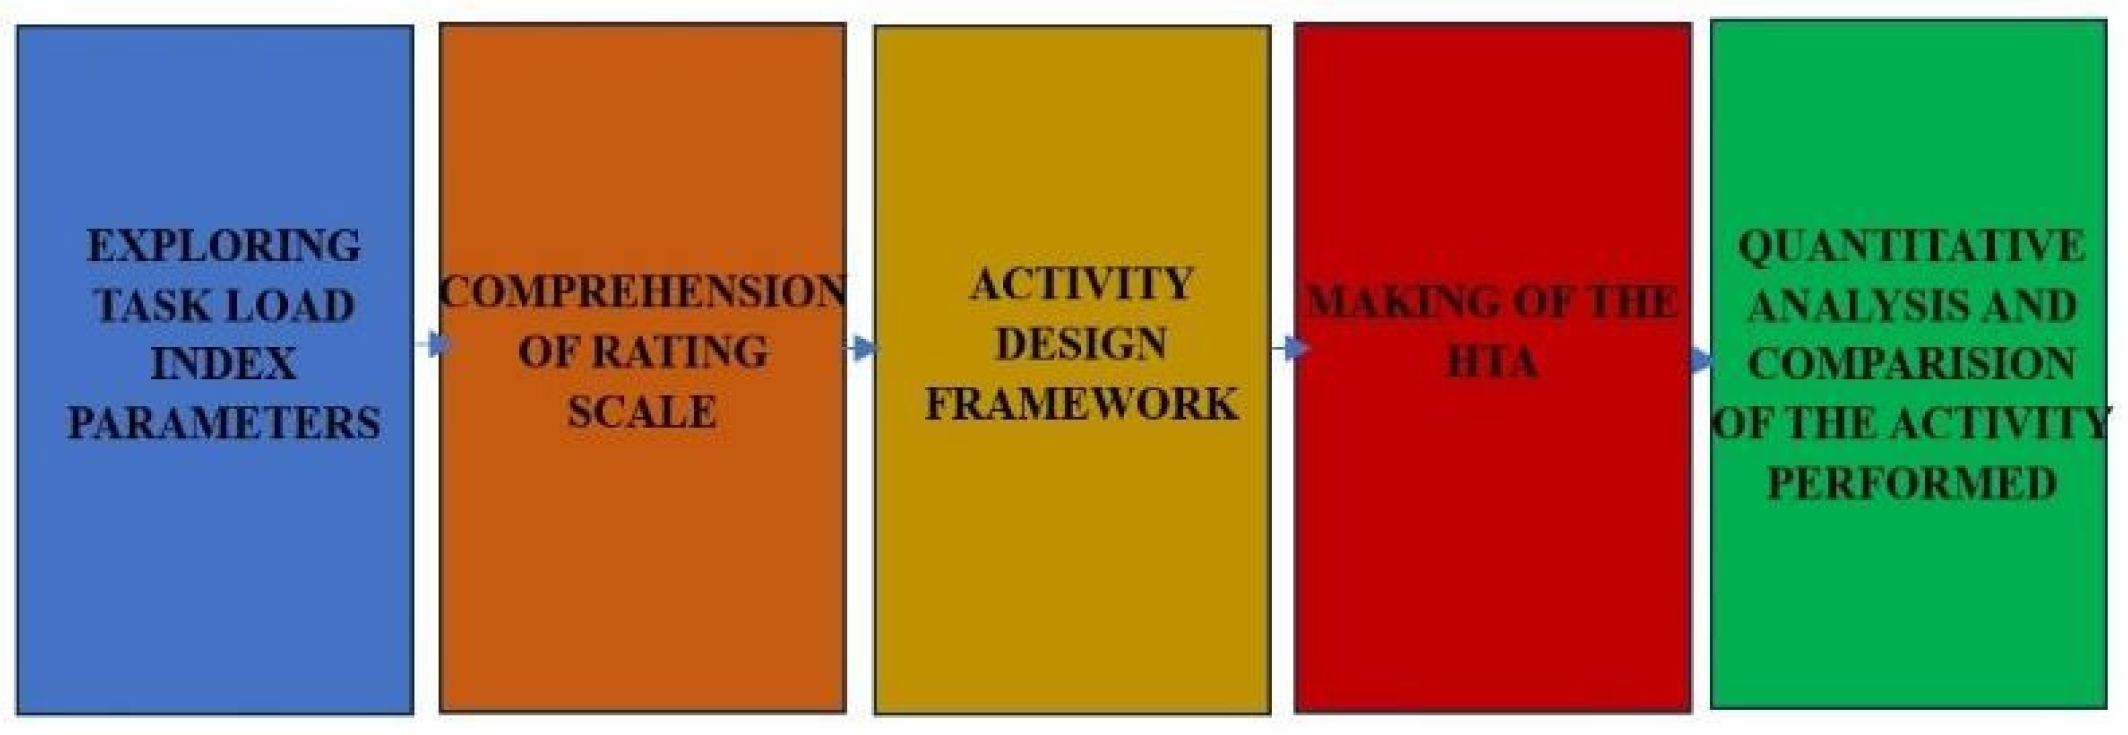
The Three Jaw Chuck assembly process was analyzed using Hierarchical Task Analysis (HTA) to systematically break down the task into subtasks. The subject’s cognitive workload was then measured using the NASA Task Load Index (NASA-TLX) both before and after the introduction of HTA. Assessment of workload included six dimensions: mental demand, physical demand, temporal demand, performance, effort, and frustration. This methodological approach allowed a comprehensive assessment of how HTA affects cognitive workload and provided insight into possible improvements in task performance and ergonomics.
3.1. Exploring Task Load Index Parameters
Explanation of the parameters considered for the 3-jaw chuck assembly based on NASA TLX:
How much mental and perceptual activity was required (e.g., thinking, deciding. calculating, remembering, looking. searching, etc.)? Was the 3-jaw chuck assembly easy or demanding, simple or complex, exacting or forgiving?
-
[ii].
Physical Demand:
How much physical activity was required (e.g., pushing, pulling, turning, controlling. activating, etc.)? Was the assembly easy or demanding, slow or brisk, slack or strenuous, restful or laborious?
-
[iii].
Temporal Demand:
How much time pressure did you feel due to the rate or pace at which the assembly of 3-jaw chuck was done? Was the pace slow and leisurely or rapid and frantic?
-
[iv].
Performance:
How successful do you think you were in accomplishing the goals of the assembly set by the experimenter (or yourself)? How satisfied were you with your performance in accomplishing these goals?
-
[v].
Effort:
How hard did you have to work (mentally and physically) to accomplish the assembly of 3-jaw chuck?
-
[vi].
Frustration level:
How insecure, discouraged, irritated, stressed, and annoyed versus secure, gratified, content, relaxed, and complacent did you feel during the assembly?
3.2. Comprehension of Rating Scale
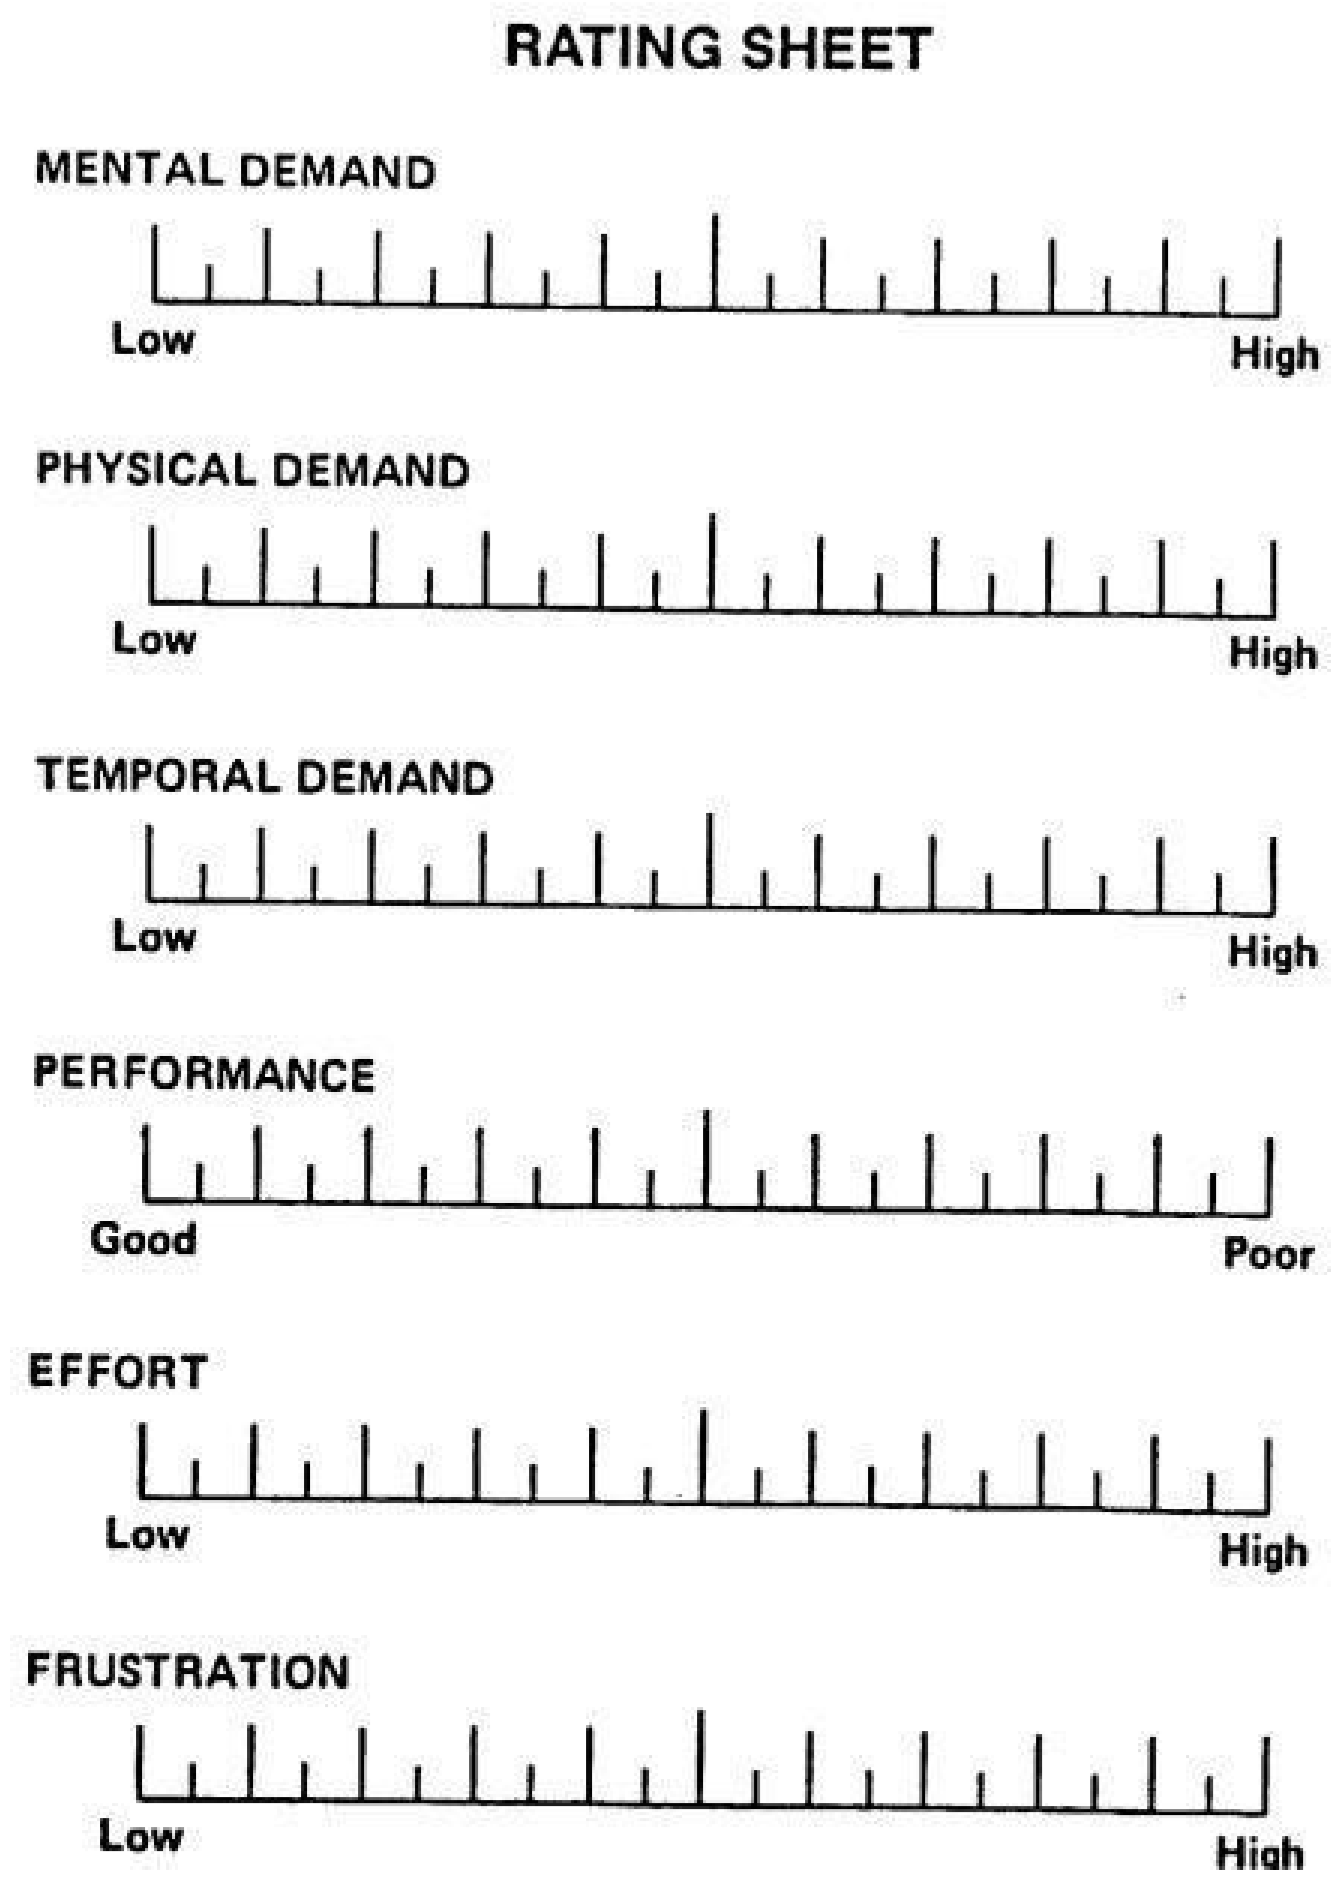
The NASA TLX provides us with a rating chart, which considers the 6 parameters and the subject uses subjective rating to rate themselves thus being able to quantify their experience in performing the task.
The rating scale as shown in
Figure 3, ranges from 0-100, with 0 being the lowest possible level of the parameter being rated and 100 being the highest, thus enabling flexibility and precision in workload assessment, using which we can capture nuanced differences in workload perception among participants [
1].
One of the main advantages of using rating scale from 0-100 is its ease of analysis as calculation of aggregate workload by summing or averaging individual ratings for each parameter, thus establishing a standard procedure for workload calculation, and hence enabling quantitative analysis and comparison across participants, tasks, or experimental conditions with minimal complexity. This simplifies the process of deriving meaningful insights from workload data collected using NASA-TLX. This granularity enables researchers to capture subtle variations in mental demand, physical demand, temporal demand, performance, effort, and frustration level, enhancing the depth of workload assessment.
From the above rating scale as shown in
Figure 3, the parameters like mental demand, physical demand, temporal demand, effort, and frustration have a scale ranging from Low to High whereas the performance parameter ranges from Good to Poor because in the case of low to high if the subject rates his/her ability to complete the task as low, then it would mean that they are not satisfied with their performance which is generally associated with the higher rating on the rating scale, thus establishing uniformity in the way the parameters are rated.
3.3. Activity Design Framework
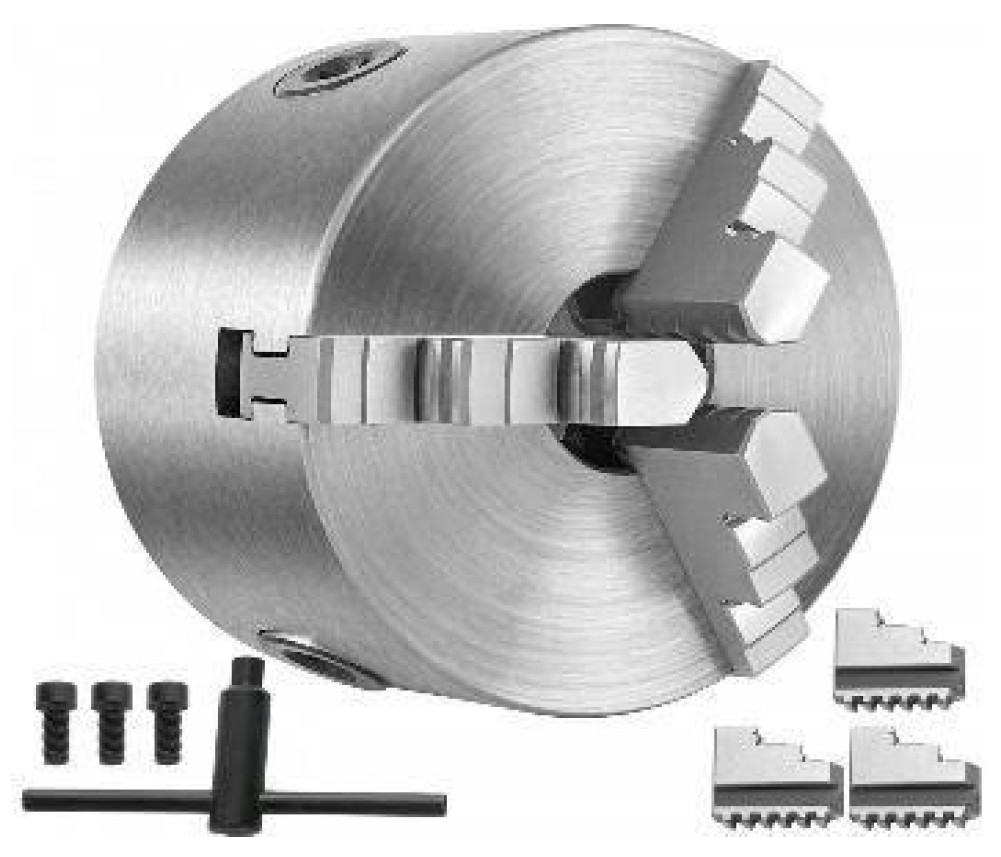
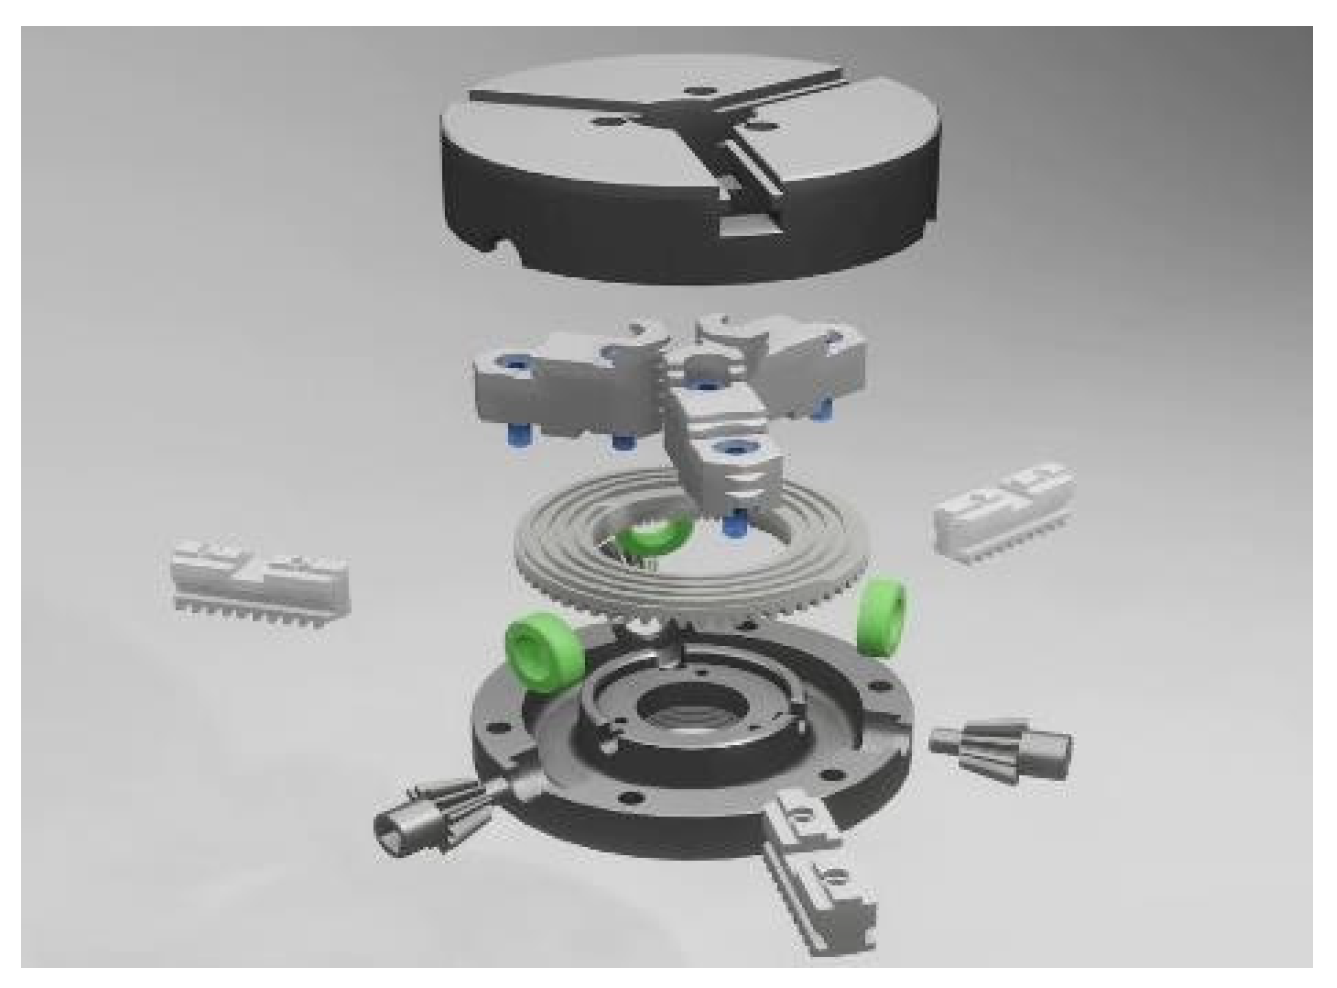
The activity that is considered for this experiment is the assembly of the three-jaw chuck which has 14 parts in total which are categorized into 7 components. The whole activity can be broken down into two phases which is Phase 1 and Phase 2.
A disassembled 3-jaw chuck is provided to the operator, along with a reference image as shown in
Figure 4. The subject analyzes the given image and starts assembling the 3-jaw chuck. Irrespective of the subject being able to complete the assembly or not, the time is noted down and we proceed to calculate the total cognitive workload experienced by the subject.
Figure 4.
Reference image (provided to the subject).
Figure 4.
Reference image (provided to the subject).
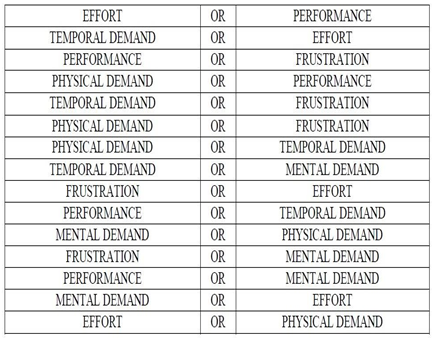
We use a questionnaire table as suggested by [
1] and shown in the
Table 1 below, that has a list of 15 questions which are essentially a combination of two parameters considered at one instance. The parameter factoring majorly to the cognitive workload between the two instances is noted down which helps us narrow down the parameters that are major contributors to the cognitive workload.
Table 1.
Questionnaire table.
Table 1.
Questionnaire table.
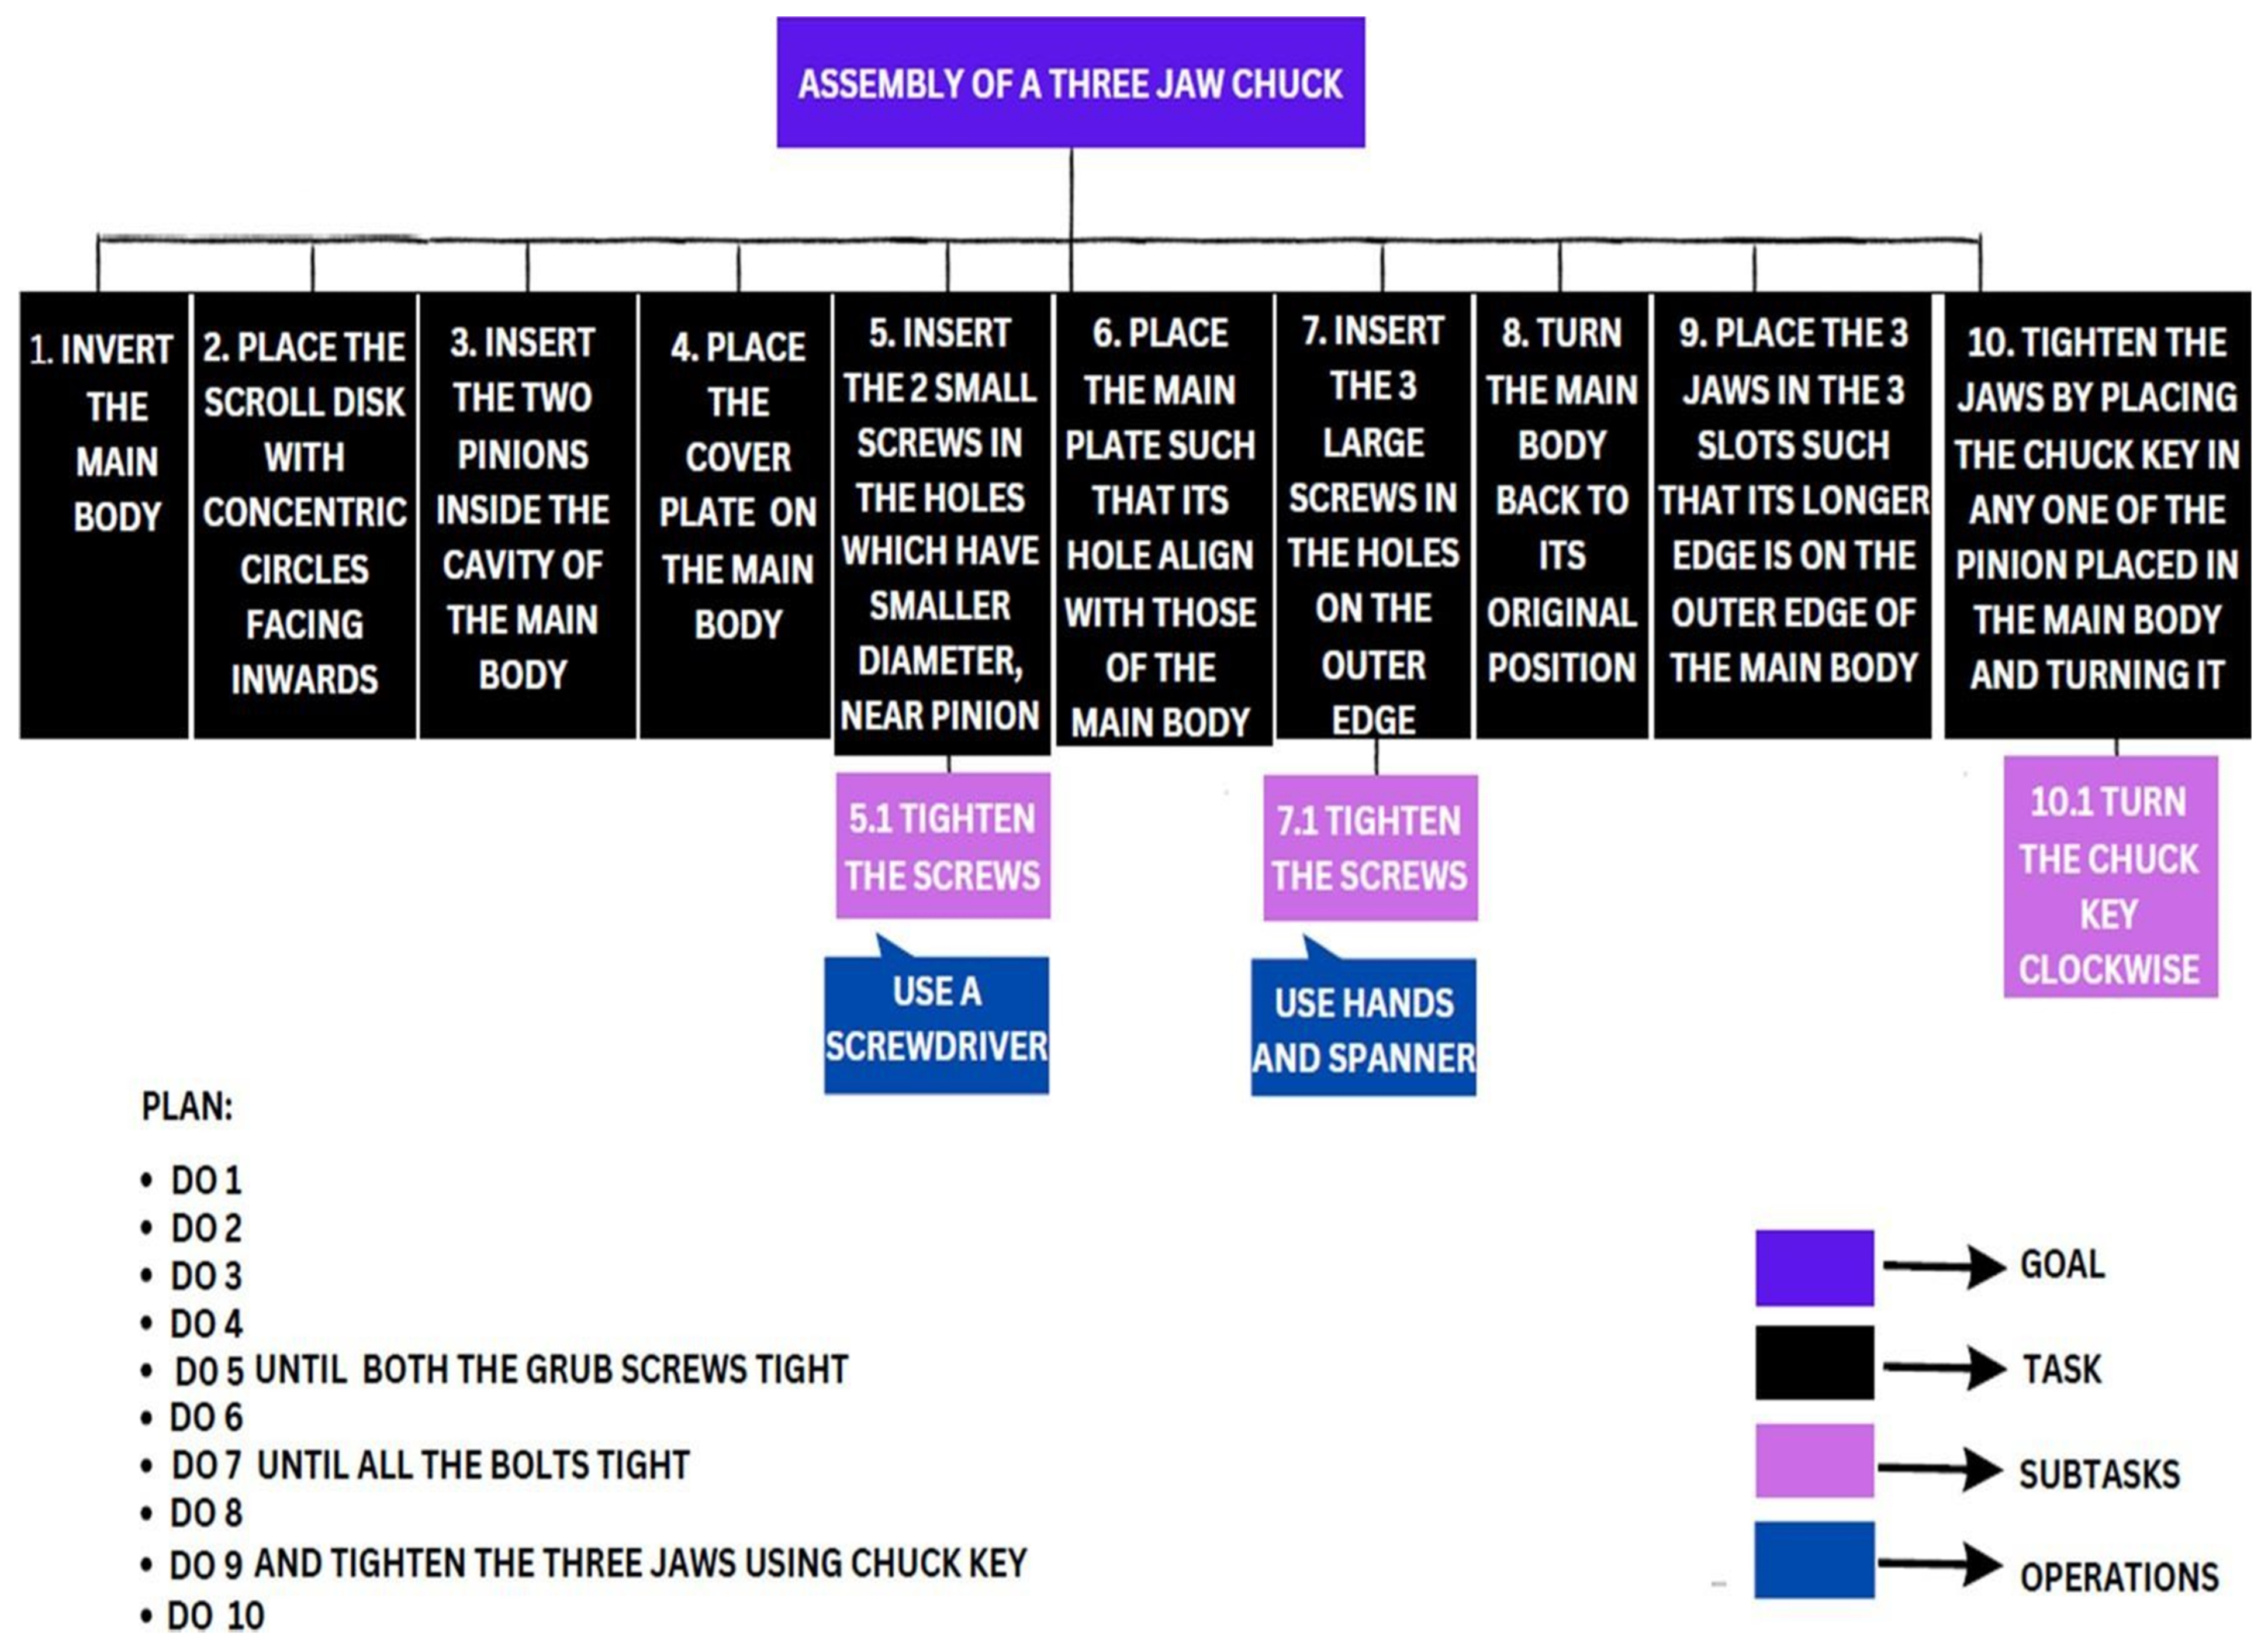
After the completion of first phase, the subject is given a HTA chart as shown in
Figure 5 which is analyzed by the subject. The subject now performs the assembly while navigating through the HTA chart and the completion time is noted. The subject answers the questionnaire table as shown in
Table 1 which is further used to calculate the total cognitive workload experienced.
We now compare the subjective ratings and the total cognitive workload experienced in both the phases for different parameters, where we observe that there has been a significant decrease in the total cognitive workload as perceived by the subject, thus validating the concept of HTA as a tool capable of reducing the overall cognitive effort required for performing an assembly.
3.4. Making of the HTA
Hierarchical Task Analysis [HTA] is a systematic method which is used to break down complex tasks into a hierarchy of smaller, more manageable subtasks. The process of HTA is to decompose tasks into different subtasks to any desired level of detail. Each subtask, or “operation” is specified by a goal, the input conditions under which the goal is activated, the actions required to attain the goal, and the feedback indicating goal attainment [
20].
The main advantage of using HTA with respect to this paper is:
HTA provides a structured and systematic method for breaking down complex tasks into manageable components. This systematic approach ensures thorough analysis and understanding of task processes.
-
ii)
Interdisciplinary Collaboration:
HTA encourages collaboration between different disciplines, such as human factors engineering, cognitive psychology, and systems design. By bringing together diverse perspectives, HTA ensures a comprehensive understanding of task performance and fosters innovative solutions.
-
iii)
Visualization of Task Structure:
HTA results in a hierarchical diagram that visually represents the structure of tasks, including subtasks, actions, and dependencies. This visualization aids in understanding the relationships between different task elements.
The process of creating a Hierarchical Task Analysis (HTA) involves several critical steps. Initially, the purpose of the analysis must be defined, whether it is for system design, developing personnel specifications, or analyzing workload. Next, the boundaries of the system description are established, specifying equipment’s to be considered. To ensure the accuracy and validity of HTA, experimentation and multiple iterations needs to be performed before its finalization. Goals are linked to tasks, with detailed descriptions of the conditions that trigger each task, forming a comprehensive plan that guides the sequence and iterations of tasks. Each task is linked to different subtasks detailing out its methodology which is in turn linked to different operations mentioning about the equipment to be used for performing that specific task.
The Hierarchical Task Analysis (HTA) for assembling a three- jaw chuck is systematically divided into multiple levels, detailing the specific actions required to achieve the final assembly. The primary goal of assembling the chuck is broken down into several main tasks, each further divided into detailed subtasks and operations. These tasks include inserting components such as the scroll disk and pinions, placing the large cover plate, inserting, and tightening screws, and using tools like the wrench for final adjustments. Each main task is subdivided into specific steps to ensure precise alignment, correct orientation, and secure fastening of all parts. This structured approach provides a comprehensive and methodical plan of action, ensuring the assembly process is thorough and precise.
An action plan is included in the HTA chart which directs the subject to use the HTA as intended, thus setting up a standard procedure for all the subjects in terms of the HTA utilization. The Hierarchical Task Analysis (HTA) shown in
Figure 5 has proven to be effective in lowering the cognitive workload, as it helps subjects to concentrate more on task execution rather than cognitive strain by streamlining the process and delivering information in a structured manner hence enhancing efficiency and lowering the possibility of making mistakes during assembly.
Figure 5.
HTA for assembly of a 3-jaw chuck.
Figure 5.
HTA for assembly of a 3-jaw chuck.
3.5. Quantitative Analysis & Comparison of the Activty Performed
The readings obtained in both the phases are noted down for analysis. The below tables show the readings that are obtained before and after HTA implementation in the assembly of the 3- jaw chuck. This data helps us to plot graphs for each parameter thus helping for a better visual comprehension. The table below is derived from the two phases mentioned previously, Phase 1 and Phase 2 which helps us identify the parameters that have decreased significantly after the implementation of HTA as shown in
Figure 5, thus giving us an idea as to which parameter needs to be focused upon while optimizing the process and hence eliminating the major contributor for increased cognitive work load.
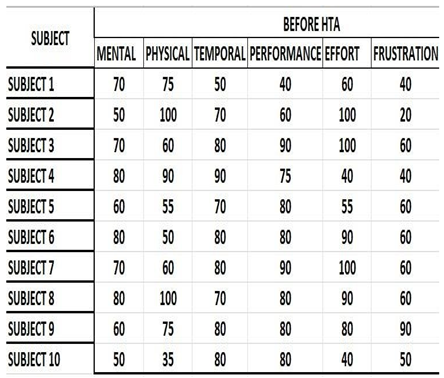
Table 2 provides a comprehensive analysis of the workload experienced by ten subjects before the implementation of the Hierarchical Task Analysis (HTA) during the assembly of a three-jaw chuck. The cognitive workload is evaluated across 6 dimensions: Mental Demand, Physical Demand, Temporal Demand, Performance, Effort and Frustration. As seen from the table above, we can state that most of the subjects are not satisfied with their performance and all the ratings marked above are based on subjective rating. Frustration levels, indicating emotional stress, range from 20 to 90, showing variability in how subjects coped emotionally with the task.
We can infer from
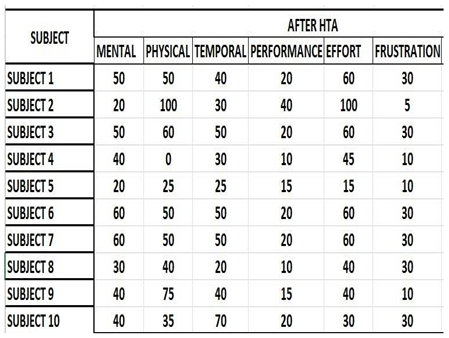
Table 3 that there is a stark difference in the ratings of the parameters that is a testament as to how effective HTA as a tool is. If we compare the performance parameter of
Table 3 with
Table 2, we see that the subjects have given a better performance rating that ranges from 10 to 40. Mental Demand scores show a reduction, ranging from 20 to 60, indicating that the cognitive effort required has decreased for most subjects. Temporal Demand scores vary from 20 to 70, suggesting that the time pressure felt by subjects has generally reduced, with some variation among individuals. Effort scores are more varied, with some subjects reporting high effort (up to 100 for Subject 2) while others report significantly lower effort, highlighting individual differences in exertion required post-HTA. Frustration levels have generally decreased, with scores ranging from 5 to 30, indicating reduced emotional stress during the task. This data highlights the positive impact of HTA on reducing both cognitive and physical demands, improving performance perceptions, and lowering frustration, thereby enhancing the overall efficiency and experience of the assembly process.
As seen in
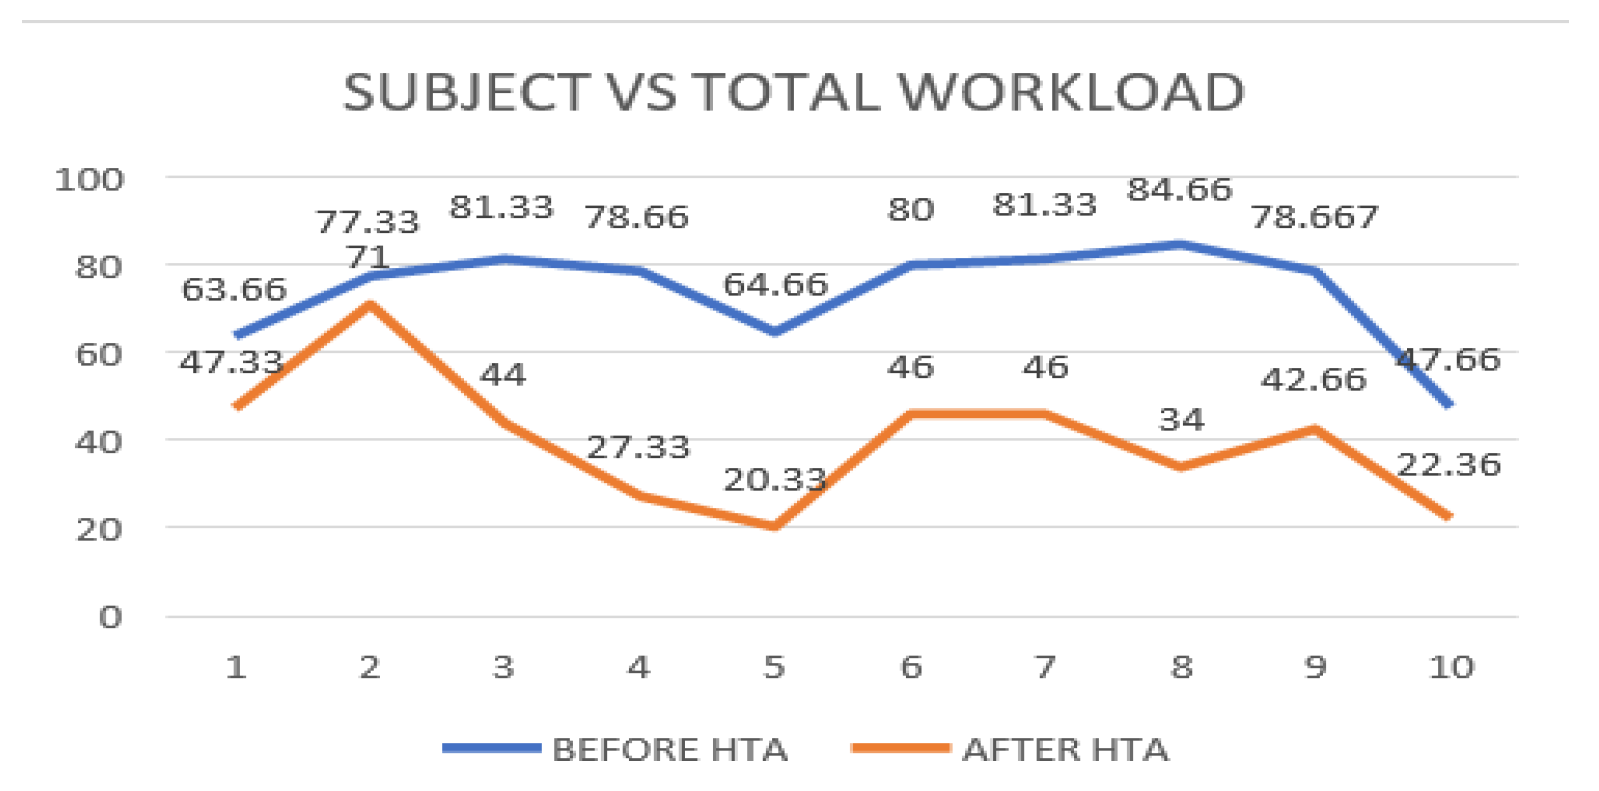
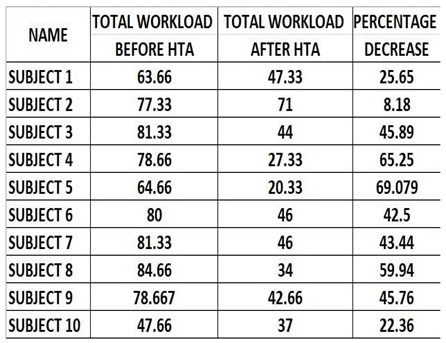
Table 4, before the HTA was applied, total workload scores ranged from 47.66 to 84.66. After the HTA implementation, these scores decreased across all subjects, with post-HTA workload scores ranging from 20.33 to 71. All the subjects saw a significant decrease in their workload with subject 5 experiencing the most significant reduction from 64.66 to 20.33. Similarly, Subject 4, and Subject 8 saw substantial decreases of 65.25% and 59.94%, respectively. On the other hand, Subject 2 had the smallest reduction, with an 8.18% decrease, showing a relatively modest drop in workload from 77.33 to 71. The subject answers the questionnaire table and we tally the number of times, each parameter has been selected which is multiplied with the given rating and in the case of before and after HTA, we calculate the total workload with the formula:
The thorough analysis of HTA as tool for reducing the cognitive demand not only finds its usage in the manufacturing segment but also in other aligned fields like medical, military, aerospace etc. Further graphs can be plotted to provide a more intuitive understanding of the data.
Figure 6.
Subject vs Mental Demand.
Figure 6.
Subject vs Mental Demand.
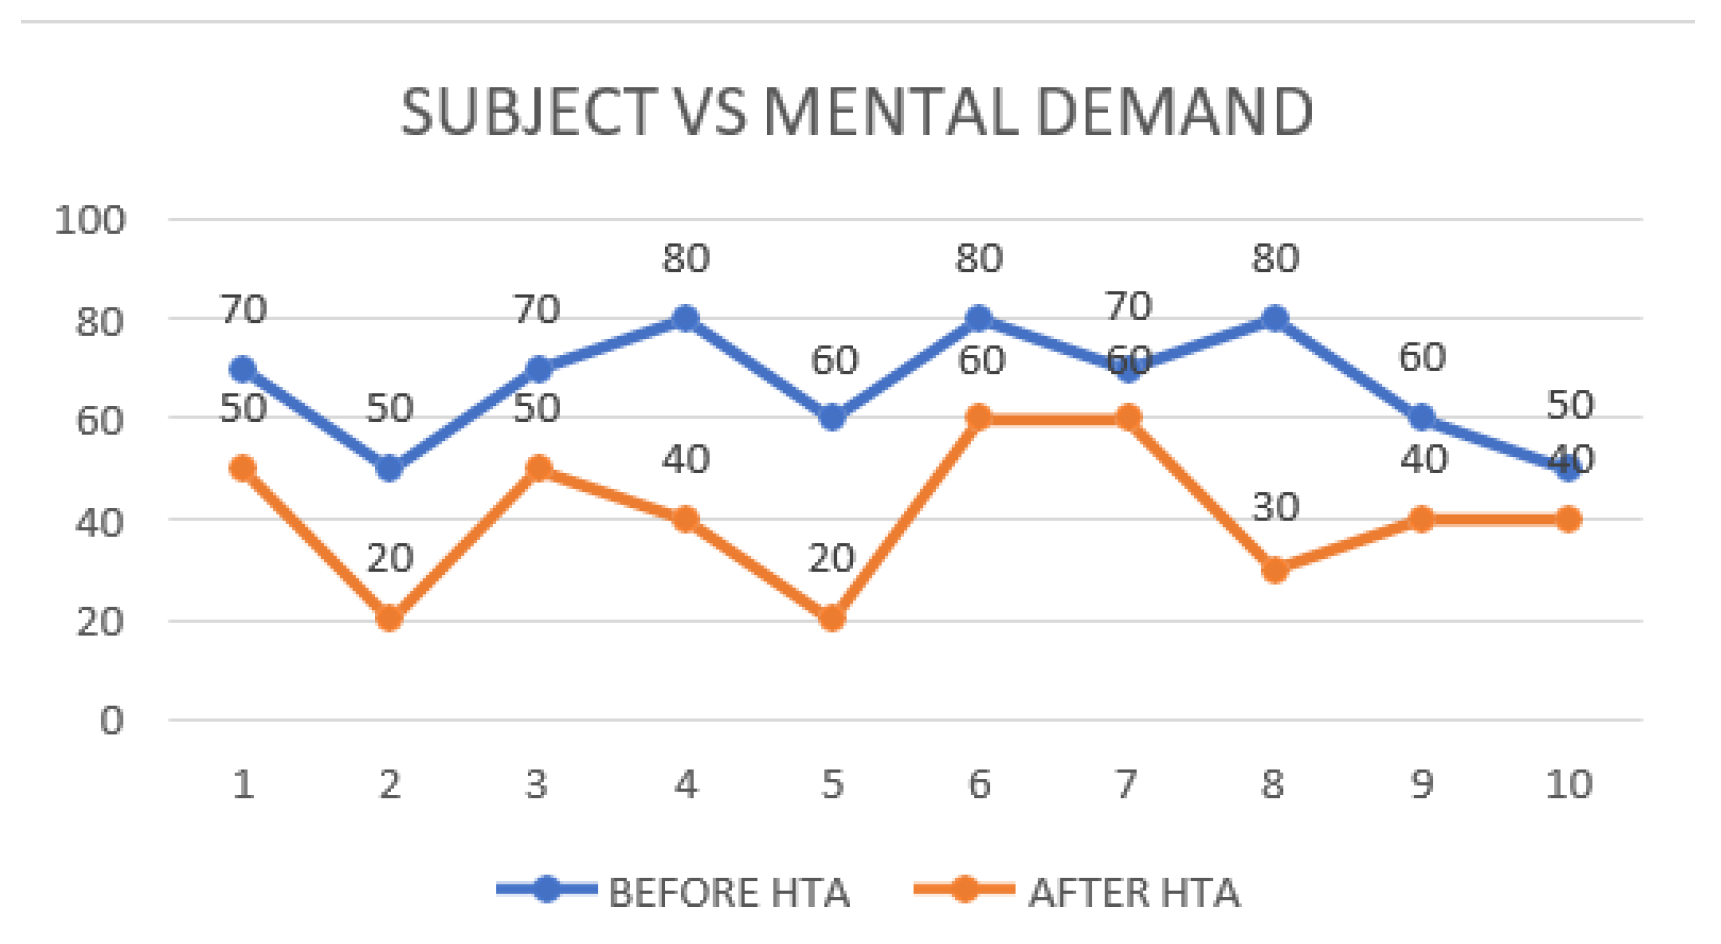
This comparative line graph illustrates the impact on the mental demand before and after the application of Hierarchical Task Analysis (HTA) experienced by 10 subjects’ during the assembly of a three-jaw chuck. Before the use of HTA, the subjects’ average mental demand was roughly 67, suggesting a significant cognitive load. On the other hand, following the implementation of HTA, mental demand dropped significantly, with values averaging about 40. HTA likely contributed to better task understanding, minimized errors, and enhanced focus by breaking down the assembly process into hierarchical steps.
Figure 7.
Subject vs Temporal Demand.
Figure 7.
Subject vs Temporal Demand.
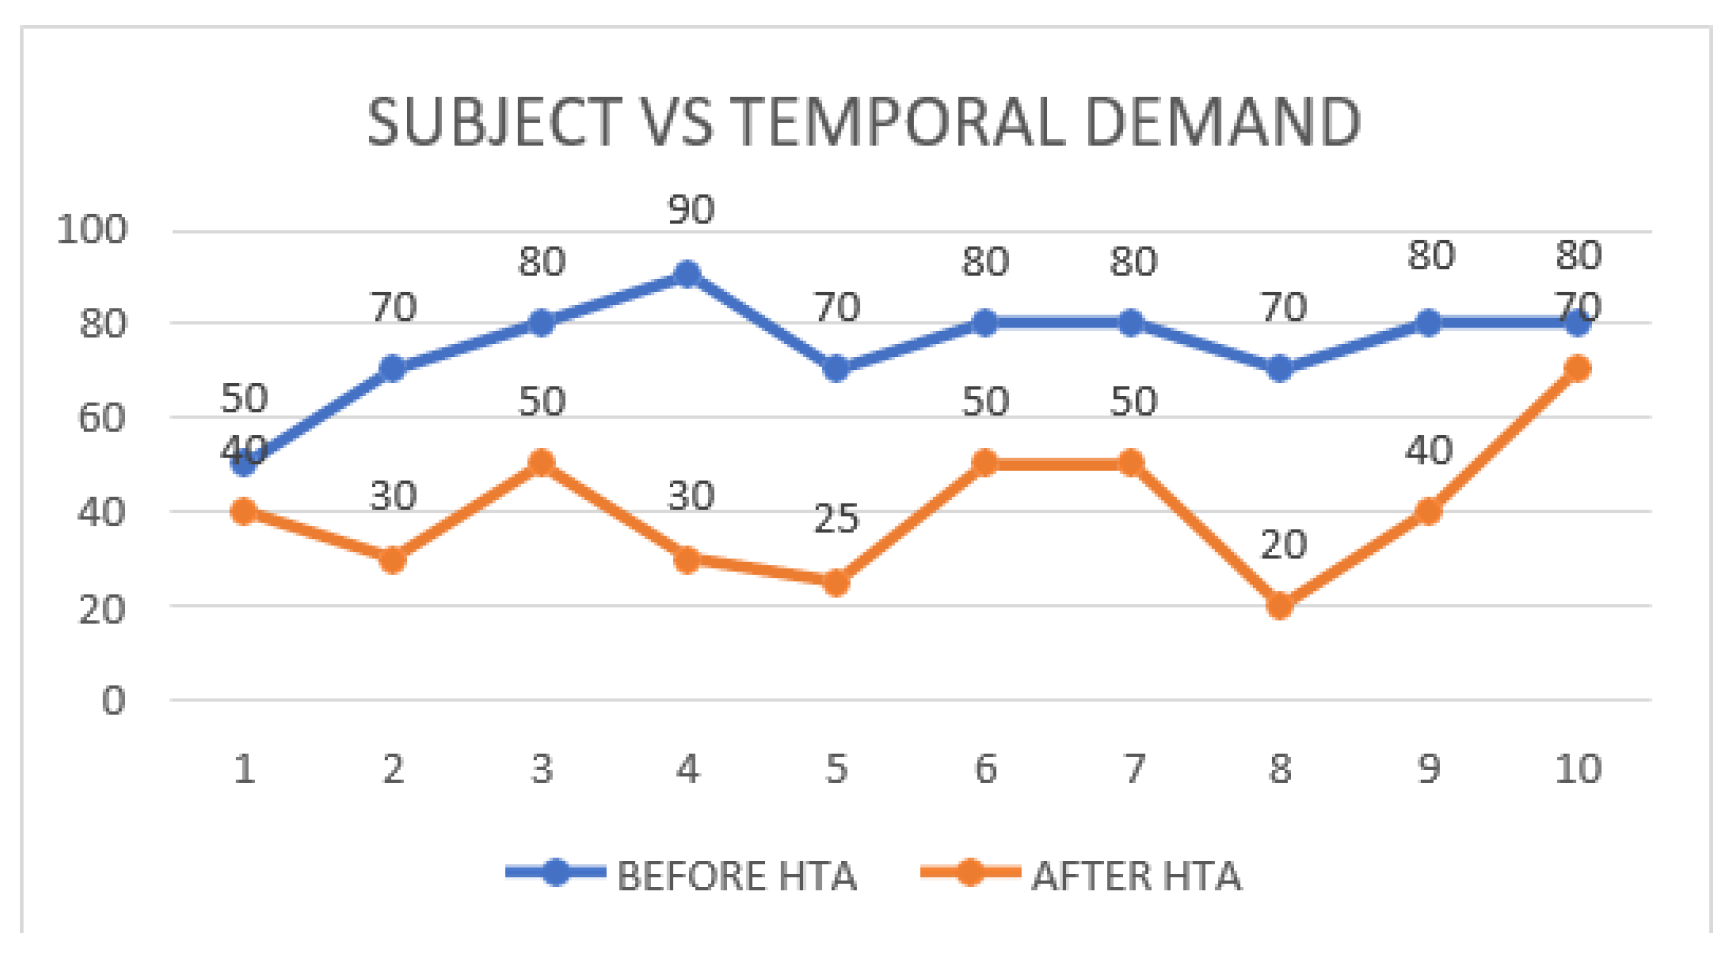
This comparative line graph illustrates the impact on temporal demand before and after the application of Hierarchical Task Analysis (HTA) experienced by 10 subjects during the assembly of a three-jaw chuck. Before HTA implementation, the subjects experienced an average temporal demand of approximately 75, indicating substantial time pressure. Following the application of HTA, the temporal demand decreased significantly, with average values dropping to about 40.5 suggesting that the use of HTA likely helped streamline the assembly process by providing structured steps, thereby reducing time constraints and improving workflow efficiency.
Figure 8.
Subject vs Performance.
Figure 8.
Subject vs Performance.
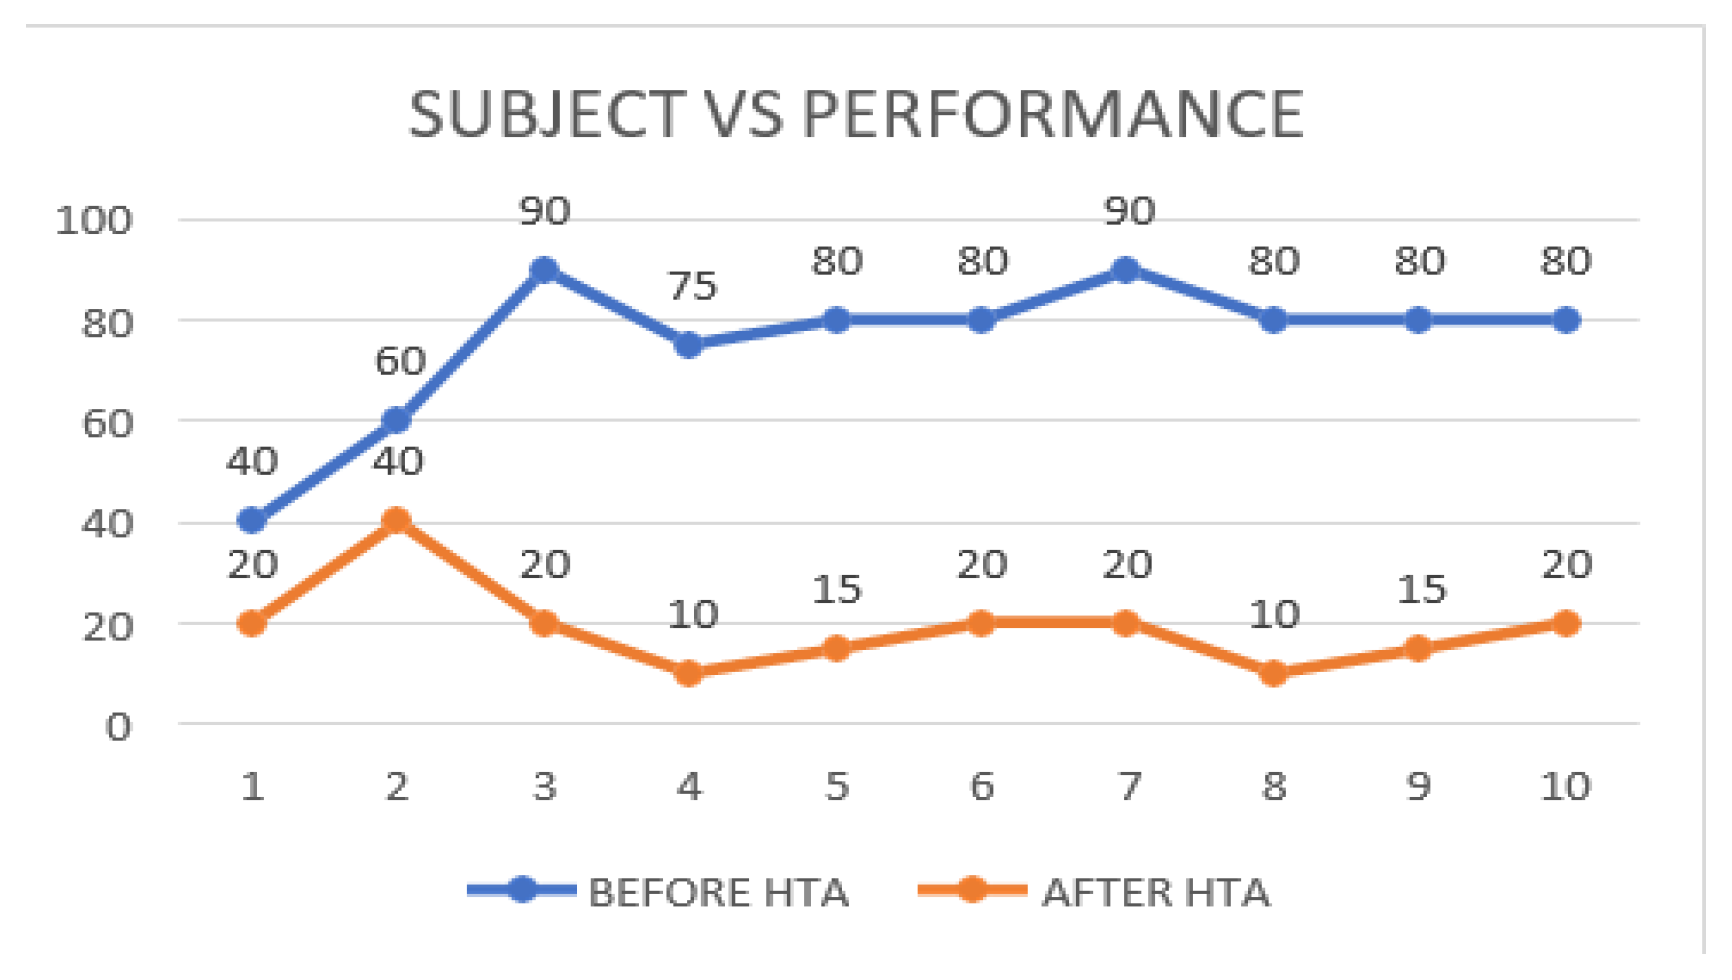
This comparative line graph illustrates the impact on performance before and after the application of Hierarchical Task Analysis (HTA) experienced by 10 subjects during the assembly of a three-jaw chuck. Before the implementation of HTA, the average performance level was 75.5, indicating poor satisfaction among the subjects with regard to their performance. After applying HTA, performance has improved significantly, averaging around 19, suggesting that HTA helped in decreasing the need for cognitive effort and improving overall consistency across subjects. Majorly, except for the first two subjects, most subjects reported being much more satisfied with their performance after the use of HTA.
Figure 9.
Subject vs Effort.
Figure 9.
Subject vs Effort.
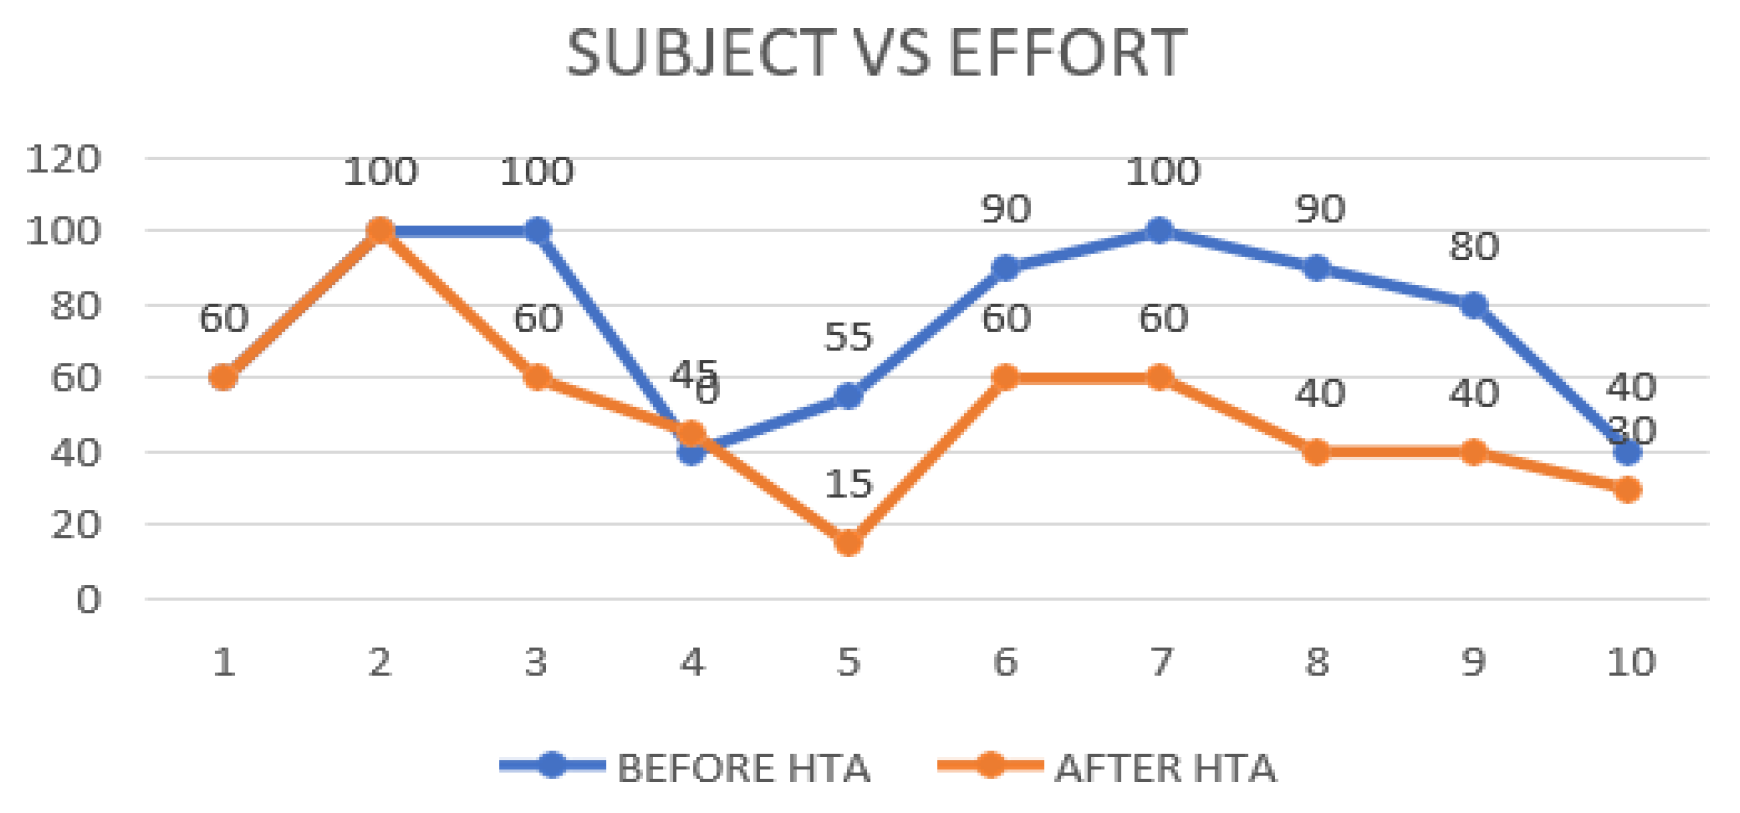
This comparative line graph illustrates the impact on effort before and after the application of Hierarchical Task Analysis (HTA) experienced by 10 subjects during the assembly of a three-jaw chuck. Subjects’ effort levels before HTA deployment averaged roughly to 76, indicating high and varying levels of physical and cognitive exertion. Following the application of HTA, the average dramatically dropped to 49.5. Notably, a few subjects reported that their perceived effort remained relatively unchanged, indicating that the difference was not universally significant for everyone, yet still evident for the majority.
Figure 10.
Subject vs Frustration.
Figure 10.
Subject vs Frustration.
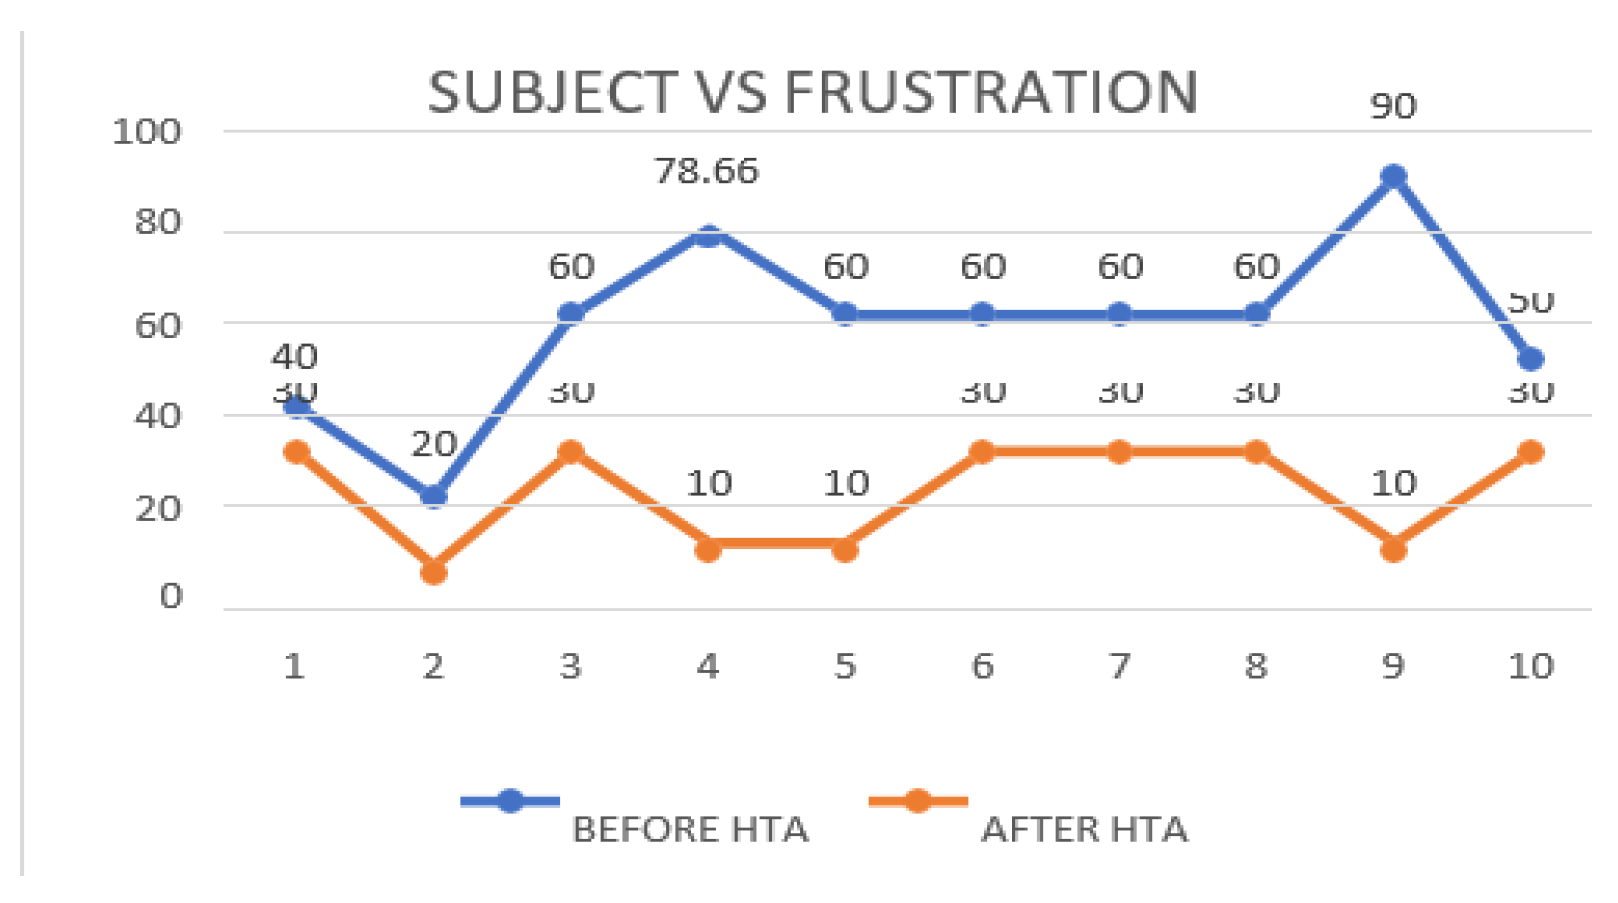
This comparative line graph illustrates the impact on frustration levels before and after the application of Hierarchical Task Analysis (HTA) experienced by 10 subjects. Before the use of HTA, the subjects' reported high levels of frustration with an average of about 57.86, suggesting high emotional strain and discontent. After using HTA, the average dropped to 23. Showing that the HTA has helped reduce frustration. Notably, the majority of participants reported a significant decrease in frustration, demonstrating how HTA might improve the workplace, while few individuals reported equal levels of frustration before and after the intervention, suggesting that the impact, though significant, isn't entirely consistent.
Figure 11.
Subject vs Total Workload.
Figure 11.
Subject vs Total Workload.
This comparative line graph illustrates the impact on total workload before and after the application of Hierarchical Task Analysis (HTA) experienced by 10 subjects. Before using HTA, individuals' workload levels were high, averaging about 73.8, indicating a considerable amount of mental and physical strain. The average workload decreased to roughly 40 after HTA was implemented, indicating that HTA successfully optimized the assembly process suggesting its efficiency as a technique for enhancing job satisfaction, lowering stress levels, and streamlining daily tasks.

