Submitted:
29 September 2024
Posted:
30 September 2024
You are already at the latest version
Abstract
Keywords:
1. Introduction
2. IoT and Wind Energy
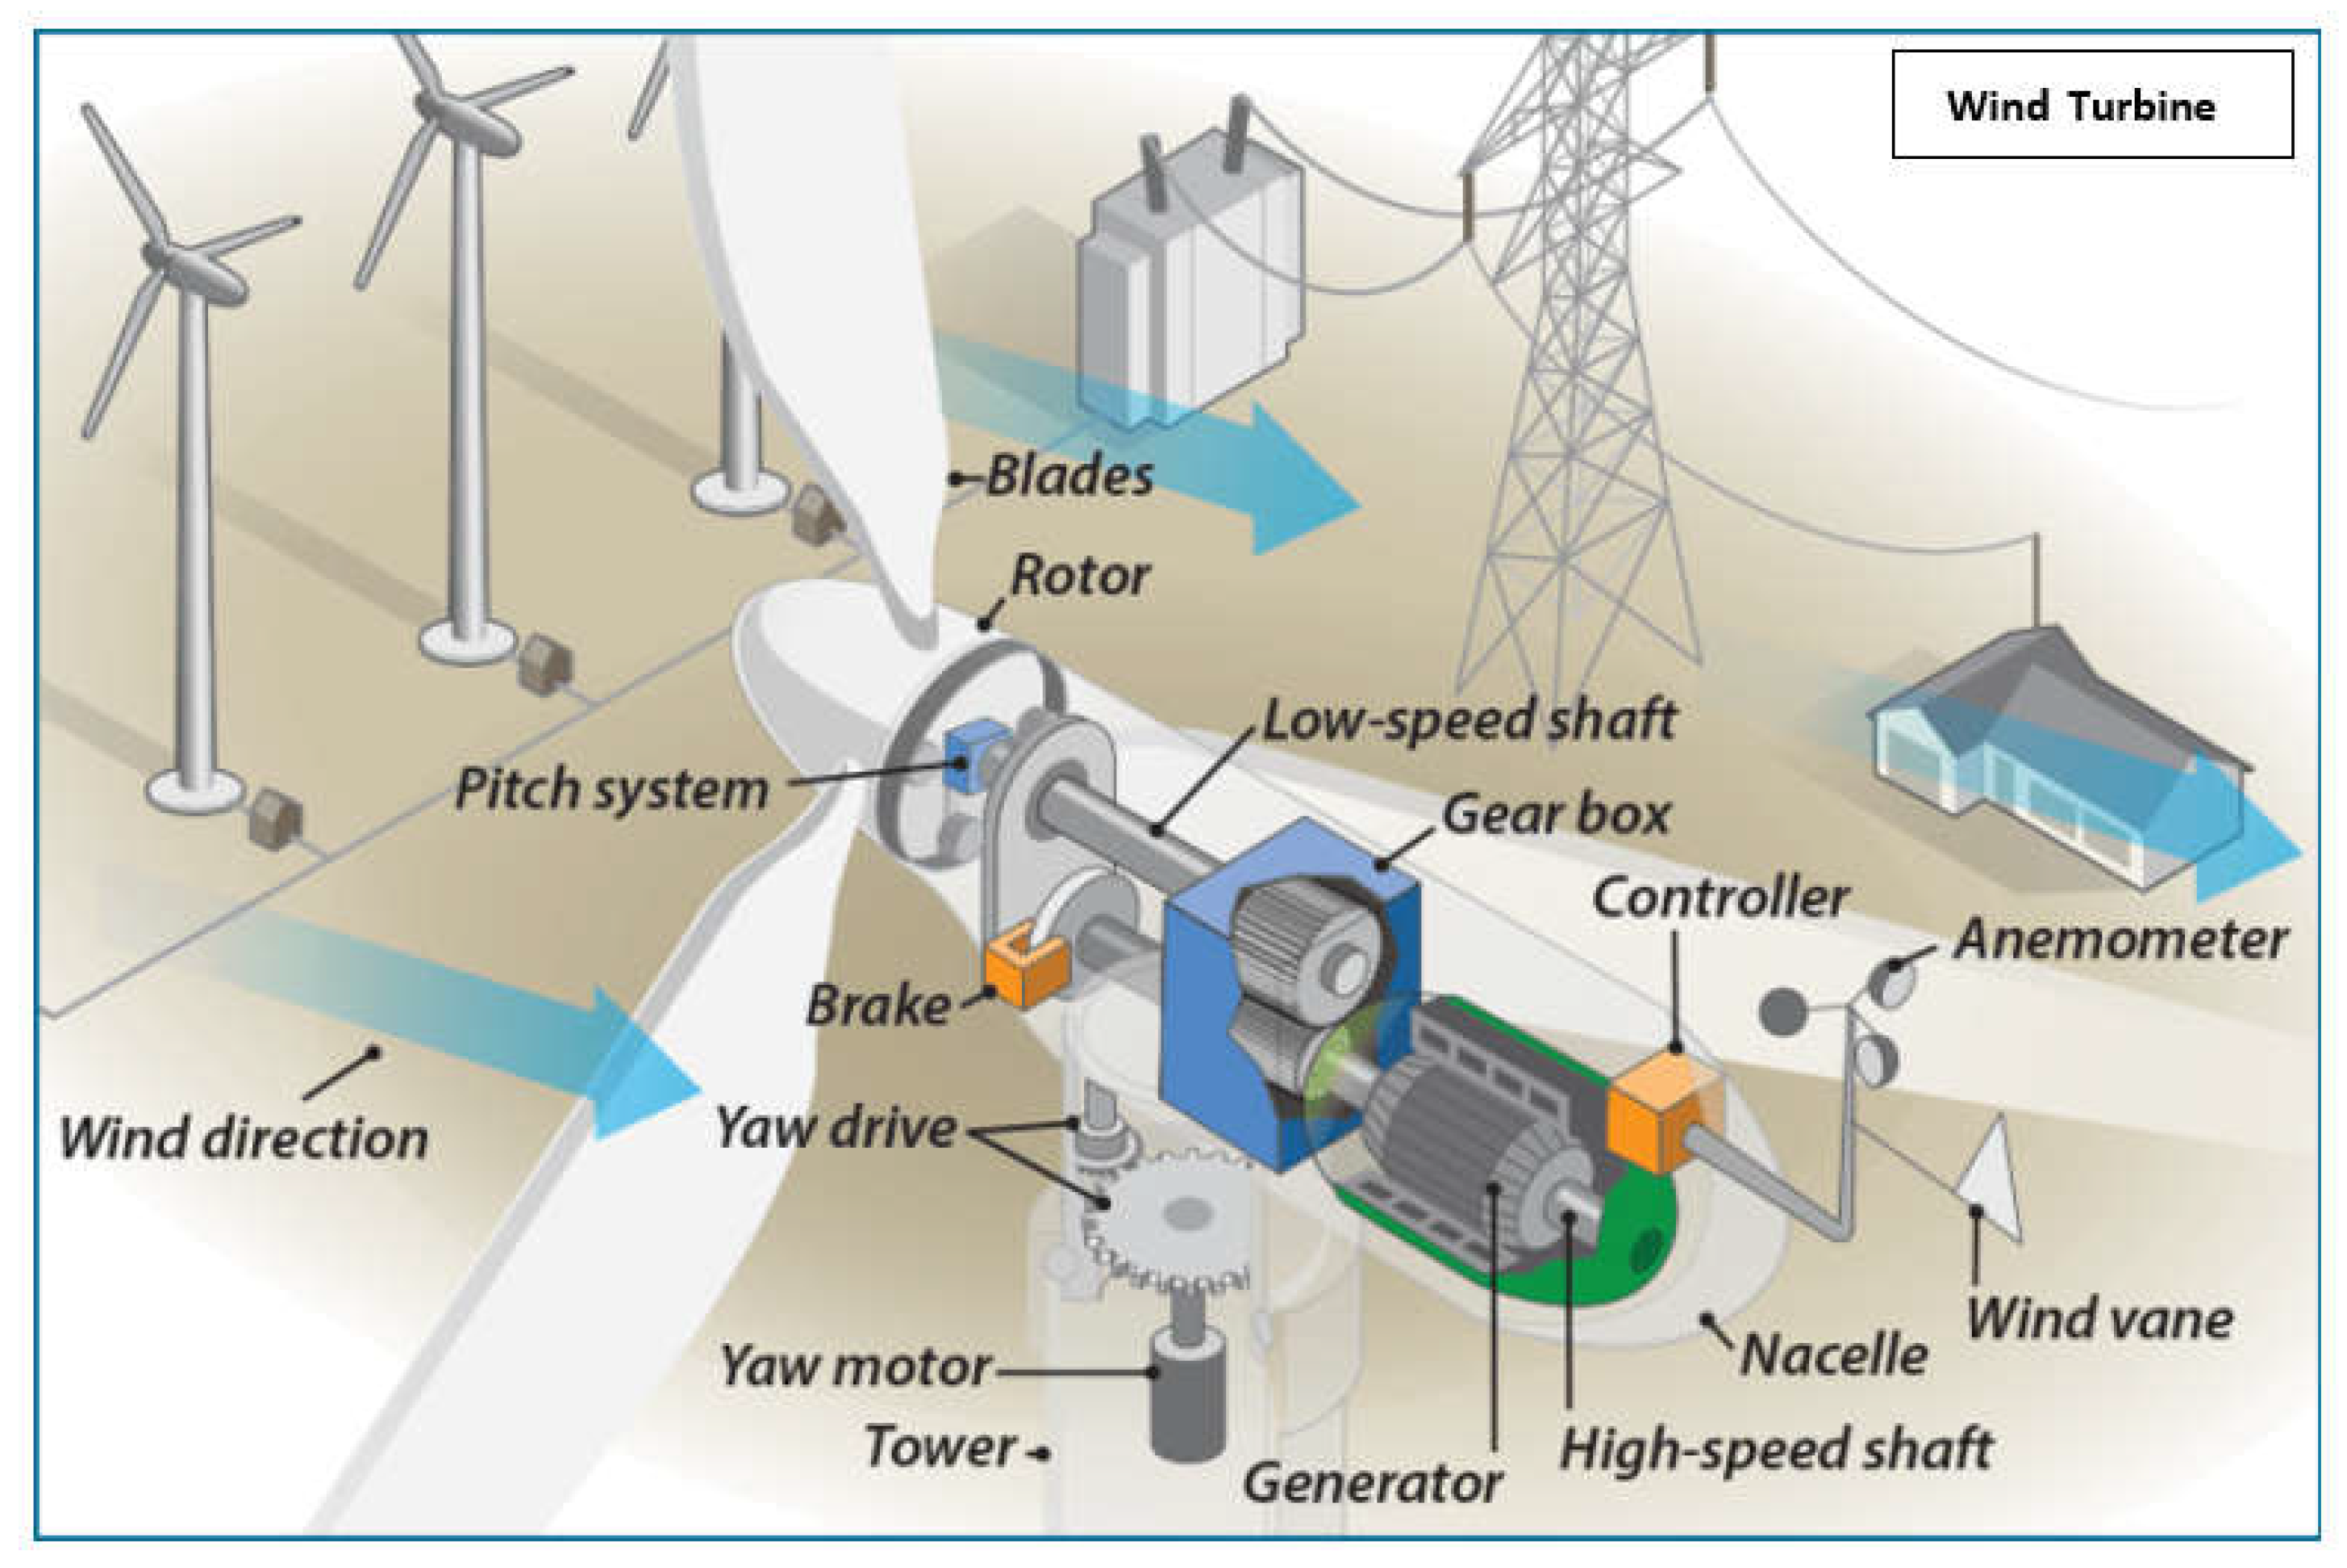
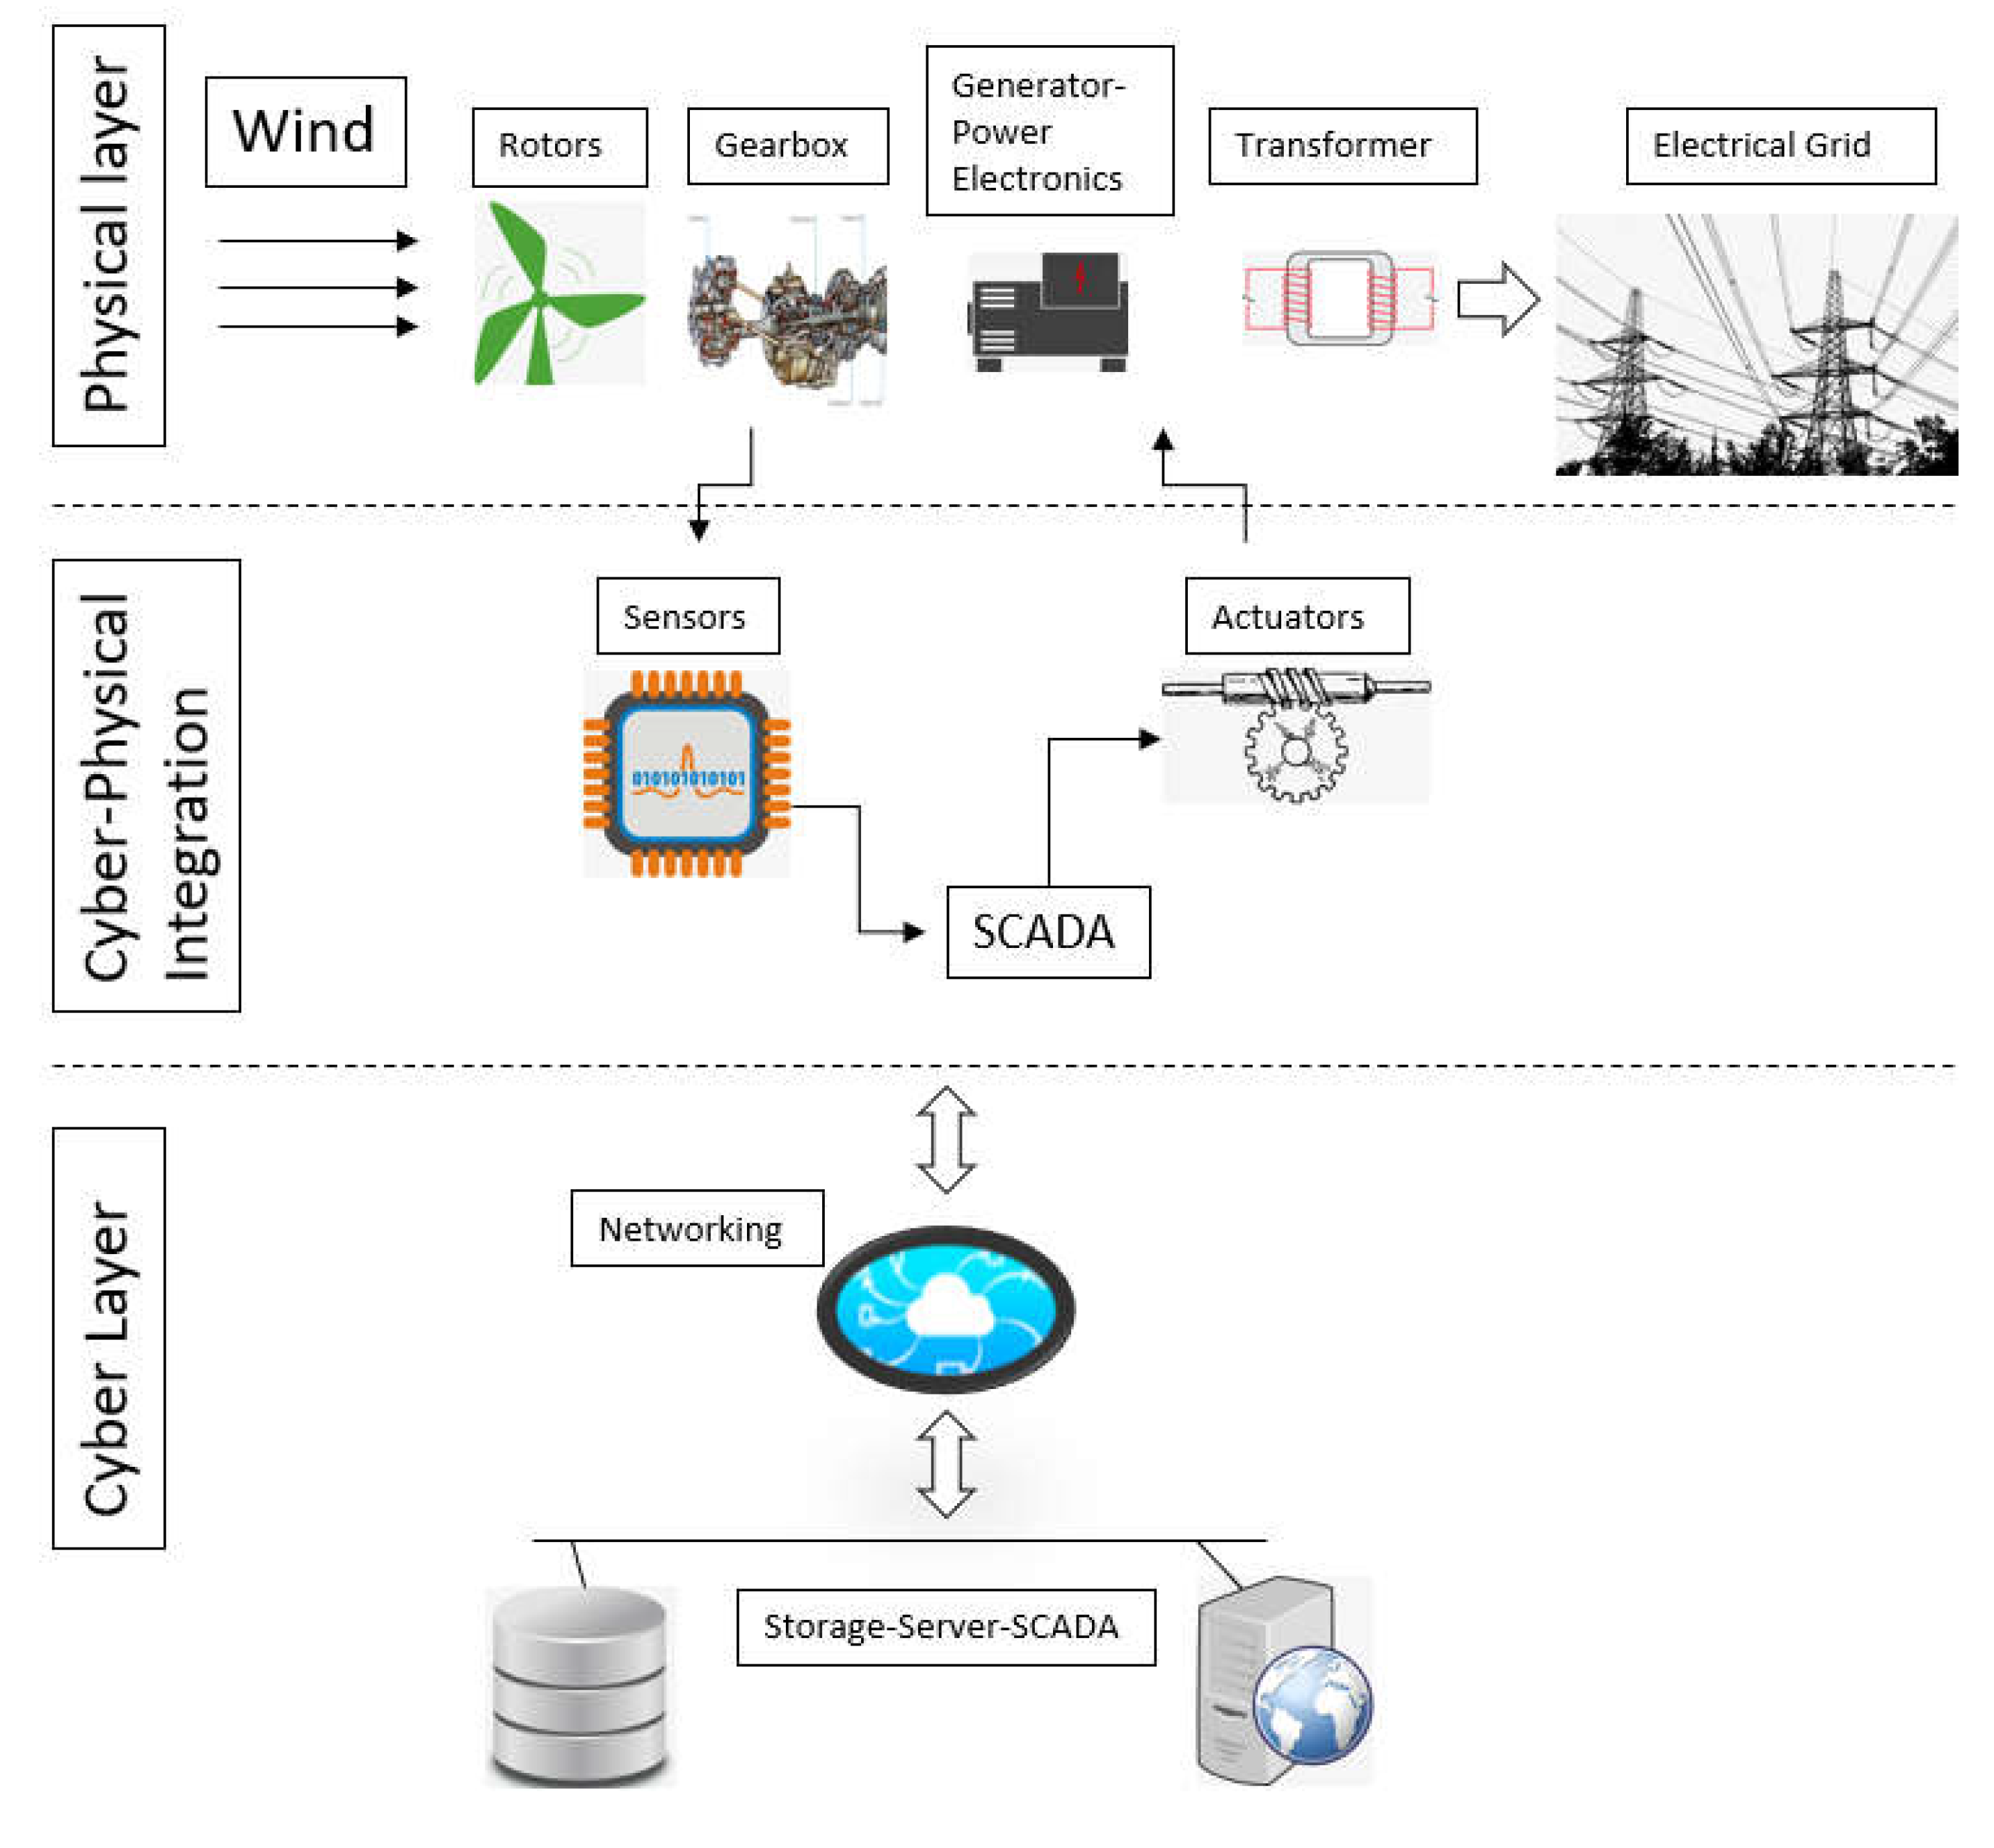
2.1. Composition of WECS
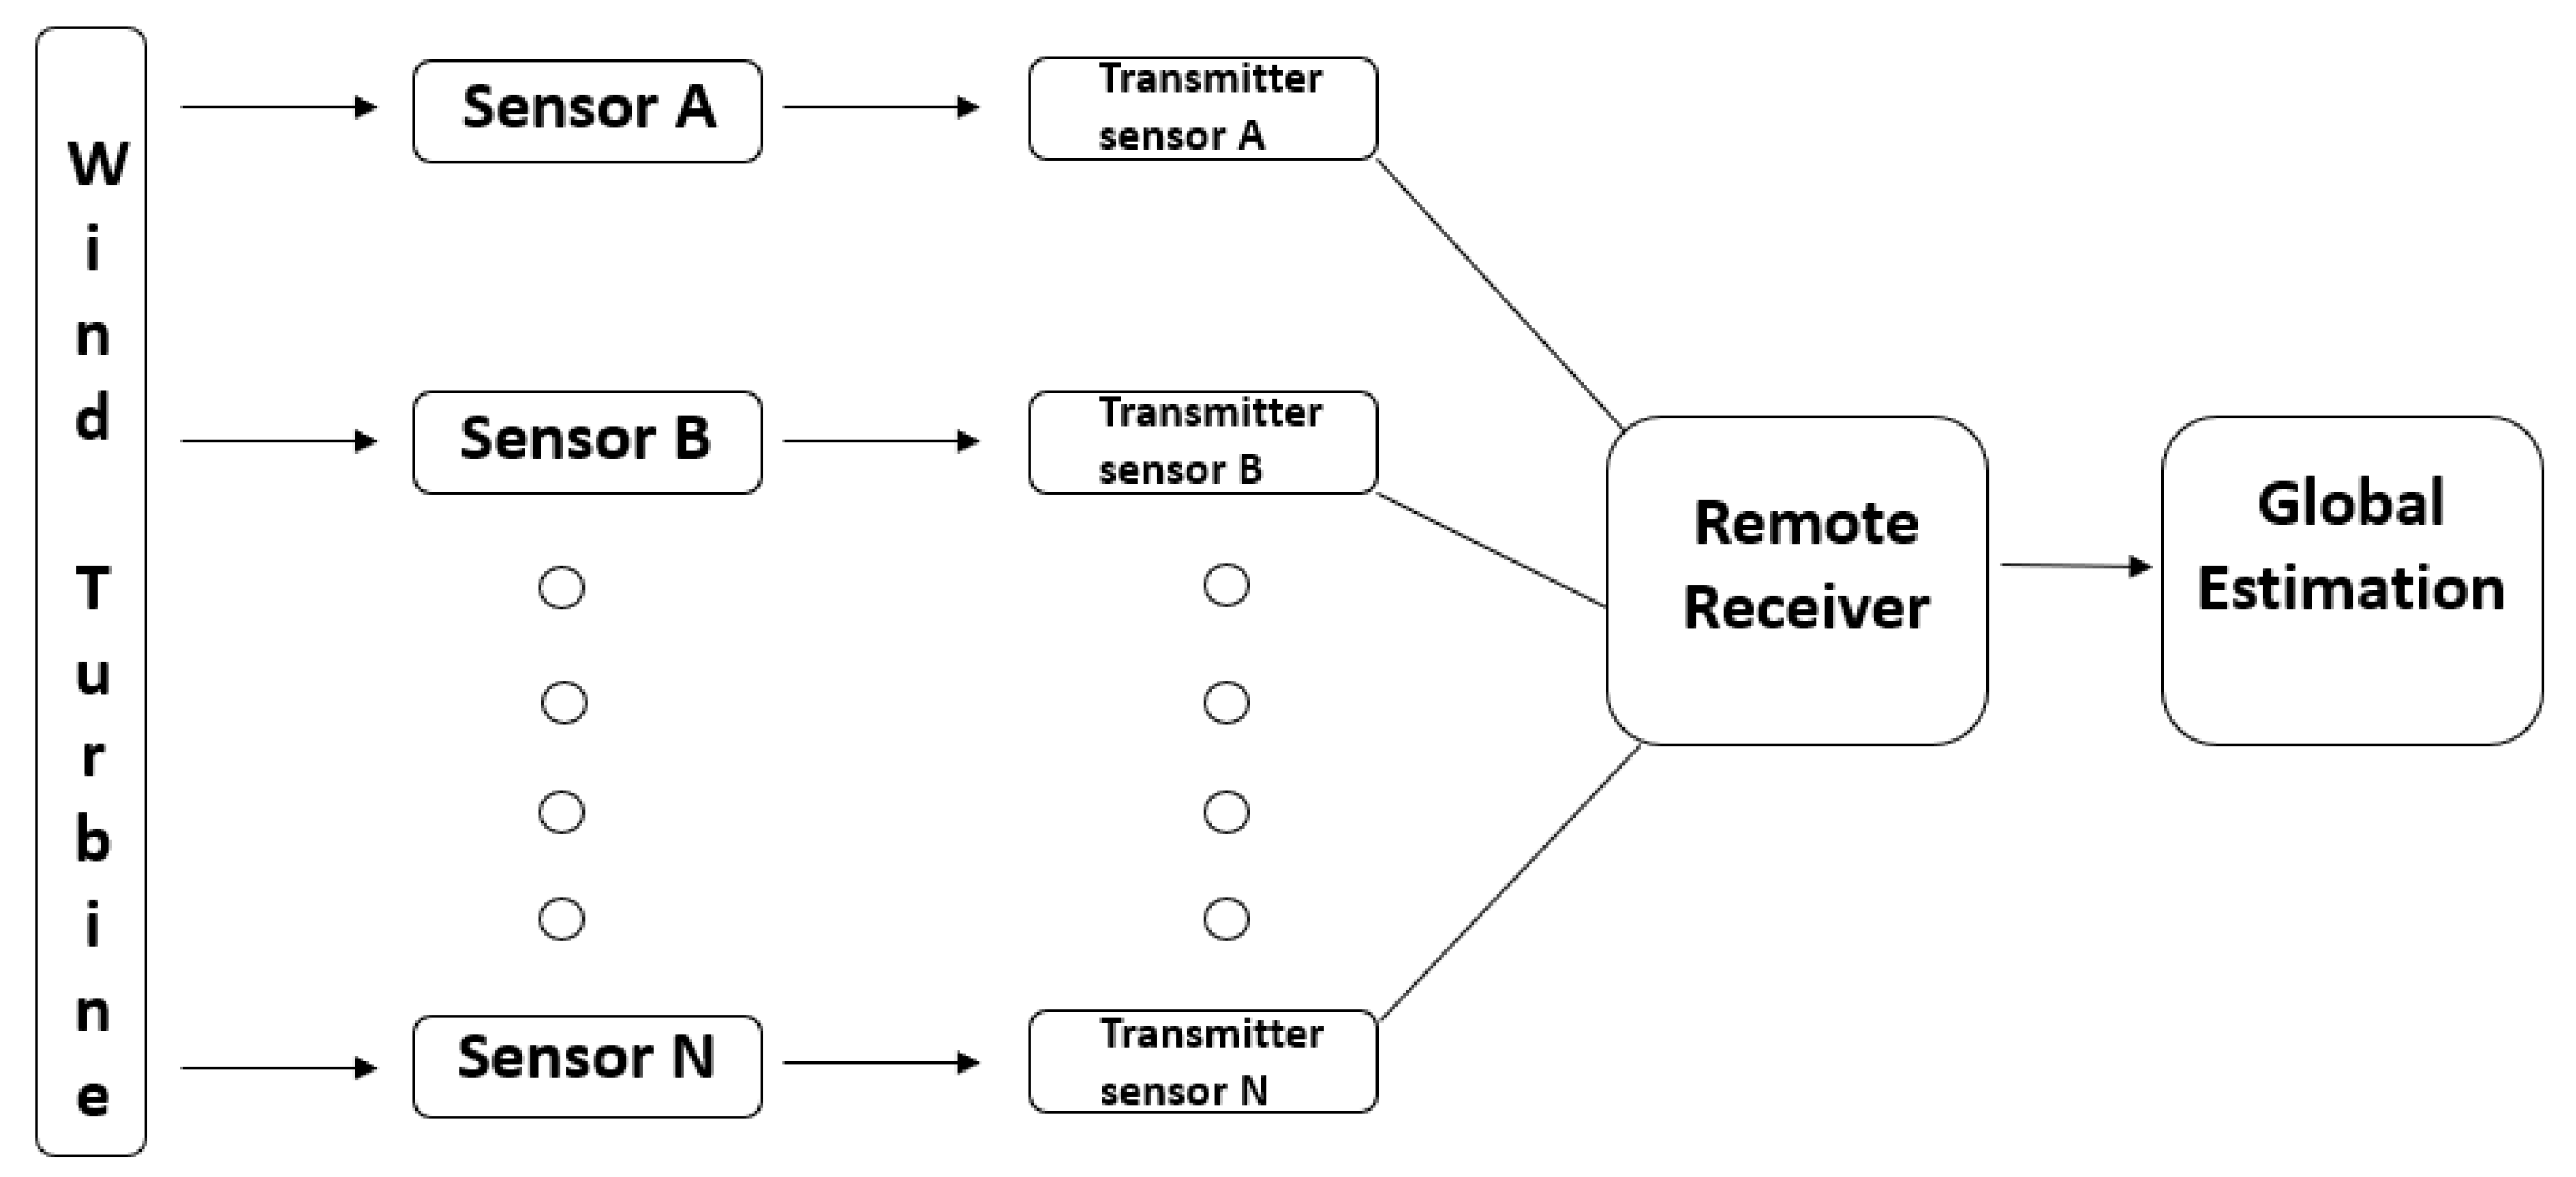
- : A vector of measurements with dimension , where is the number of components or parameters being measured by the sensor.
- : A matrix that represents the measurement or sensing data from sensor with dimensions where is the number of measurements or components observed by the sensor and n refers to the number of state variables of the system being observed by the sensors.
- : A vector contains the state variables that describe the system’s internal dynamics, such as electrical power generation, rotor speed, or internal parameters that are being monitored or controlled.
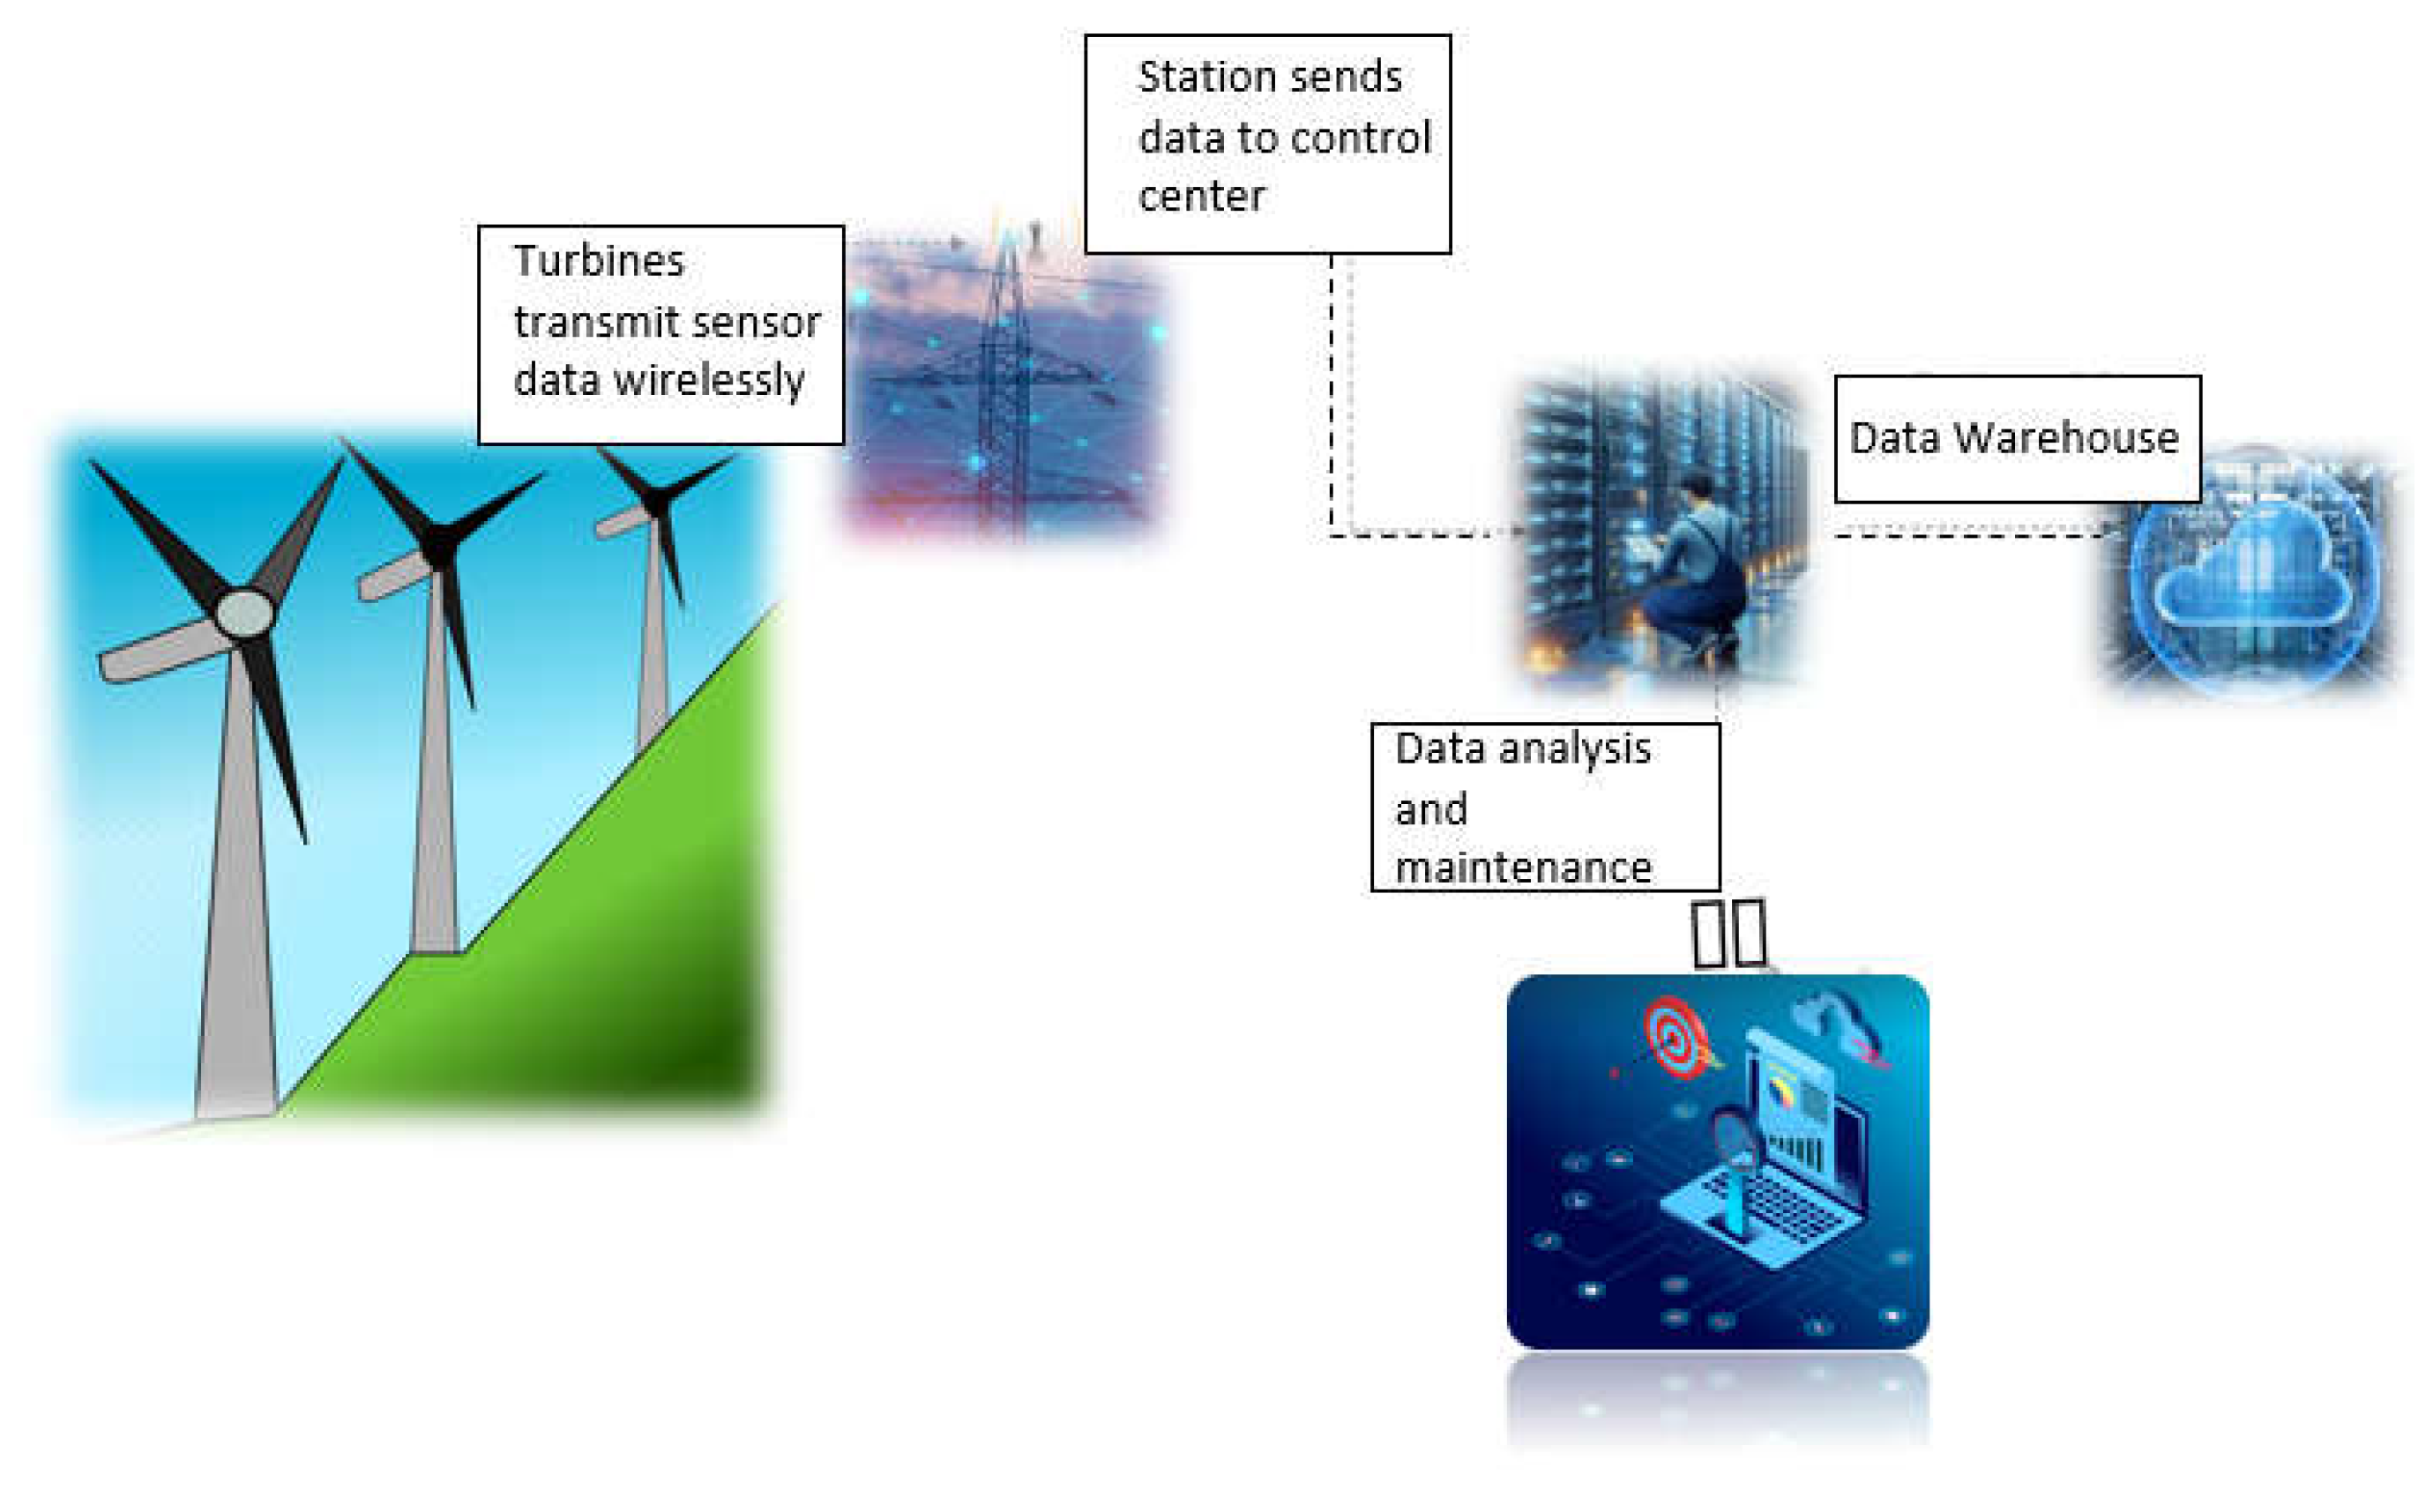
2.2. Cyber Physical Integration of a Wind Turbine
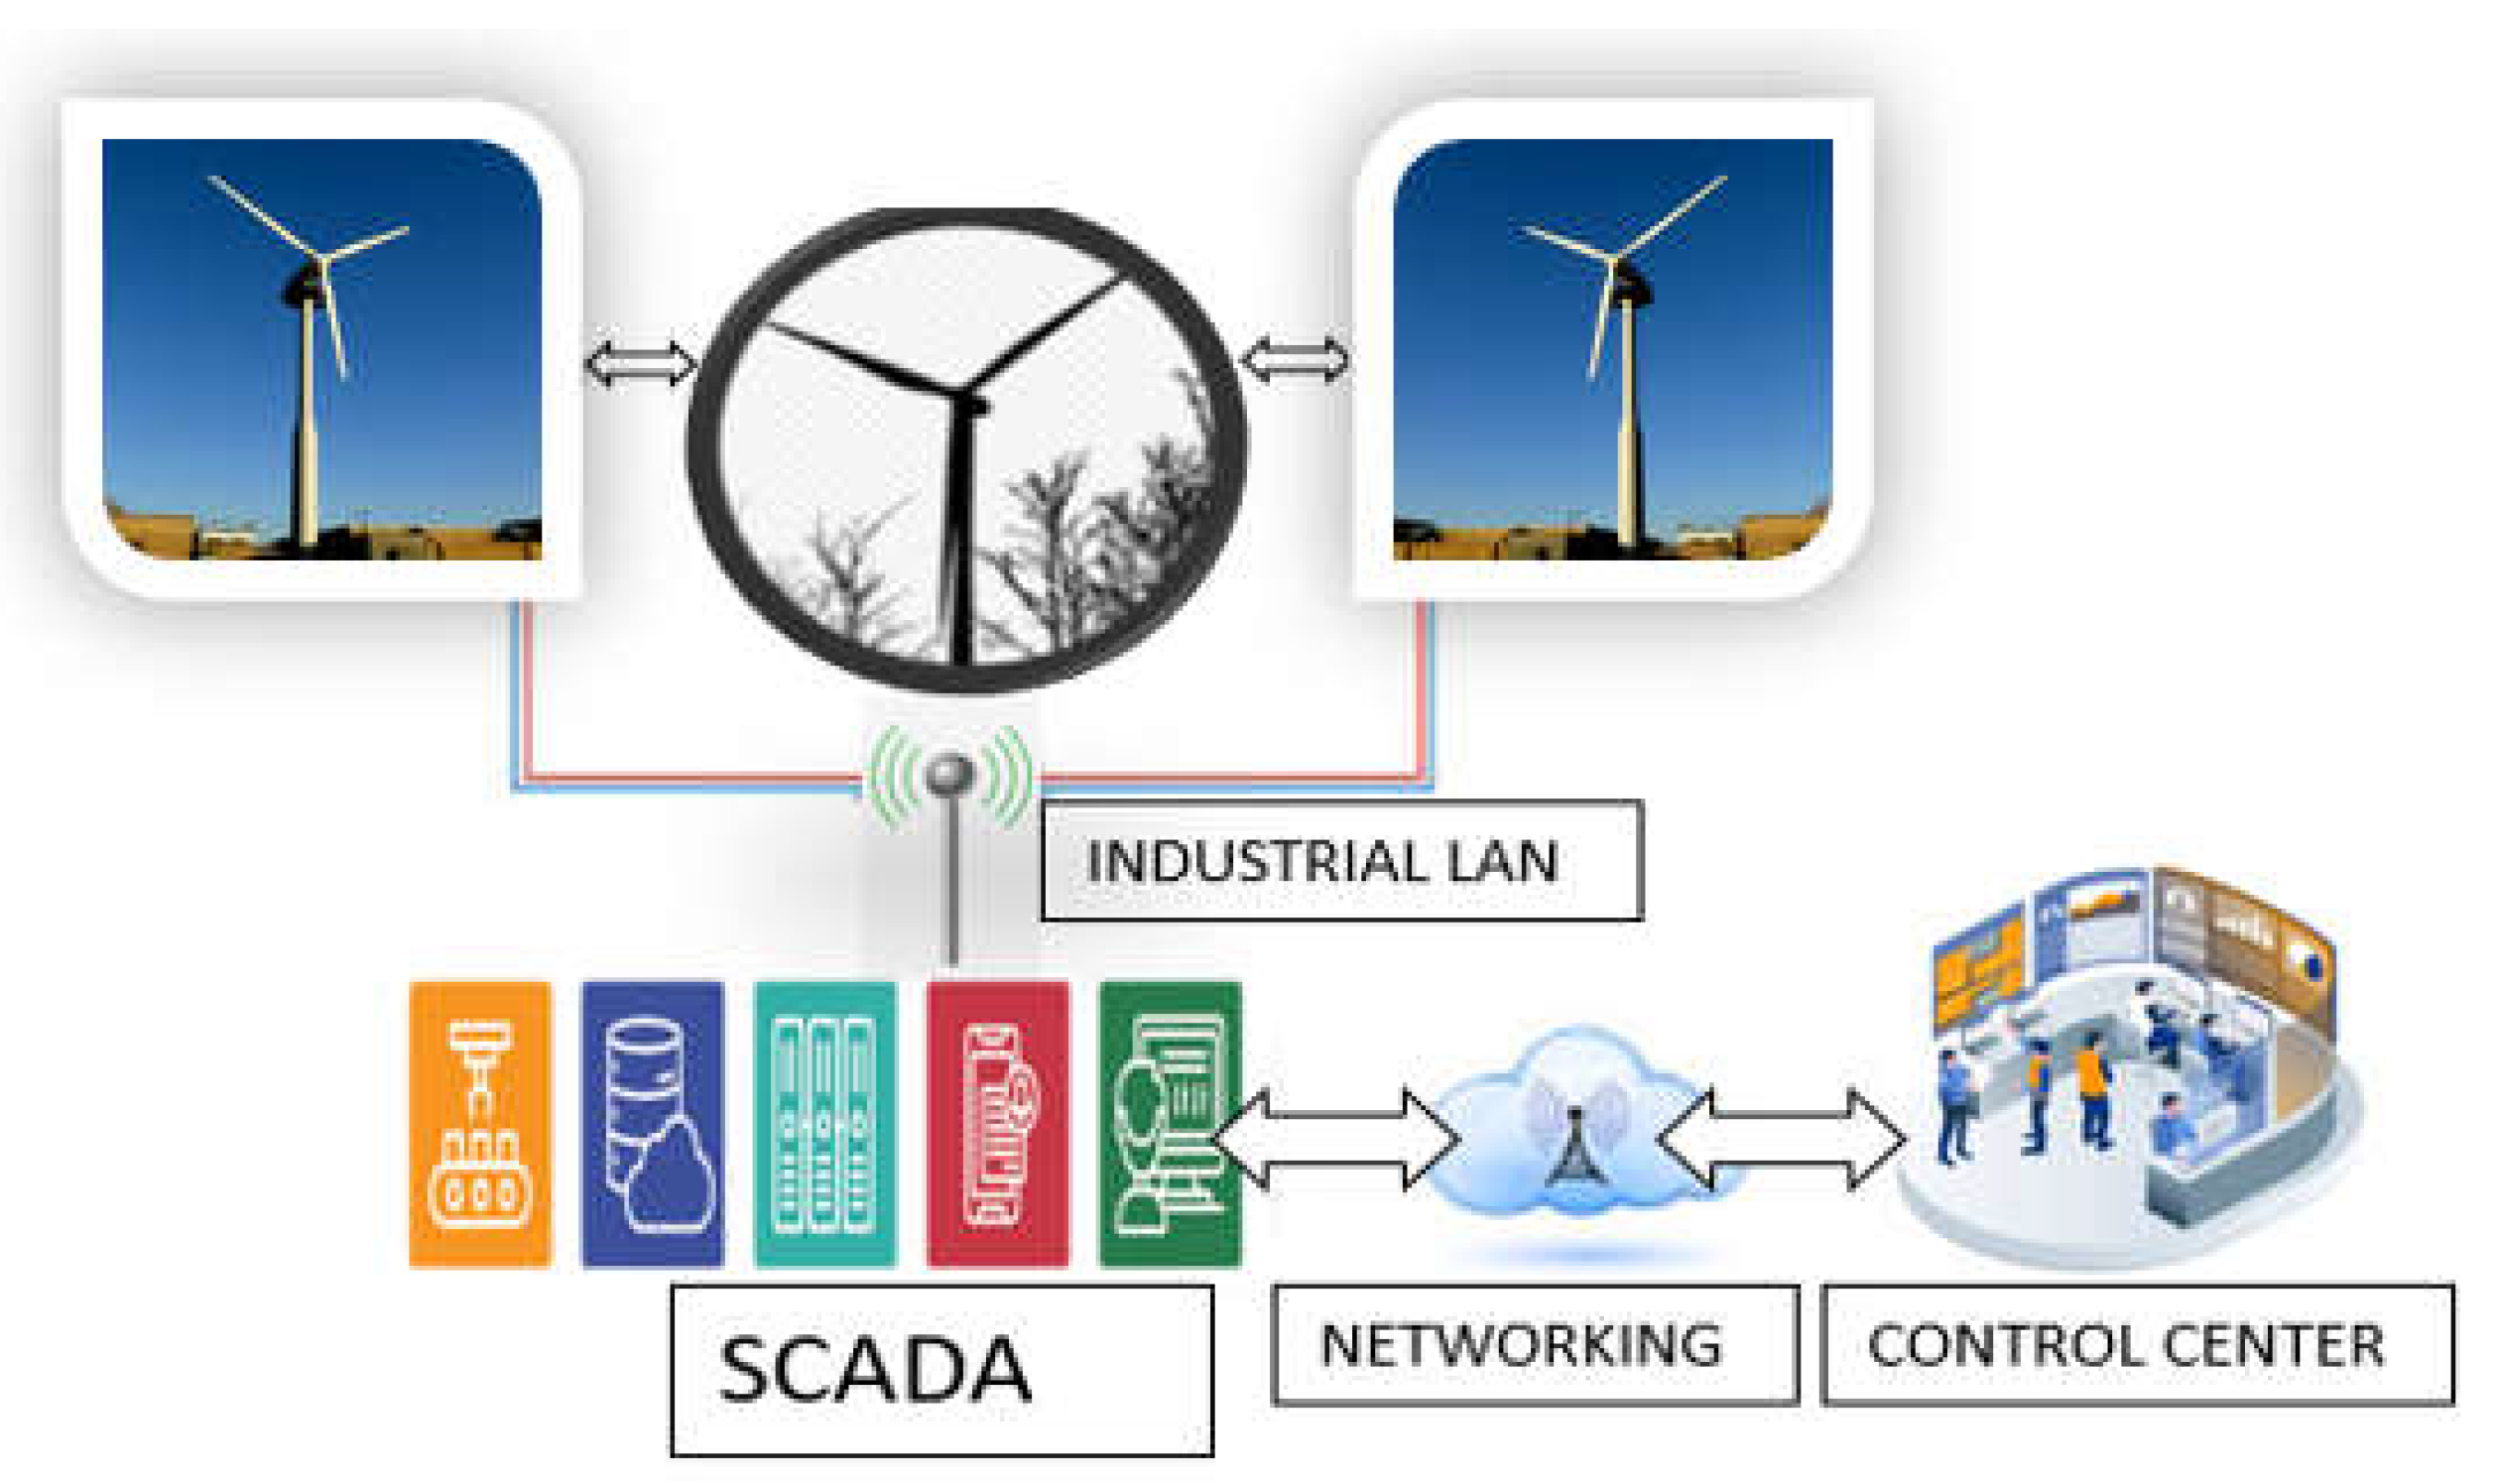
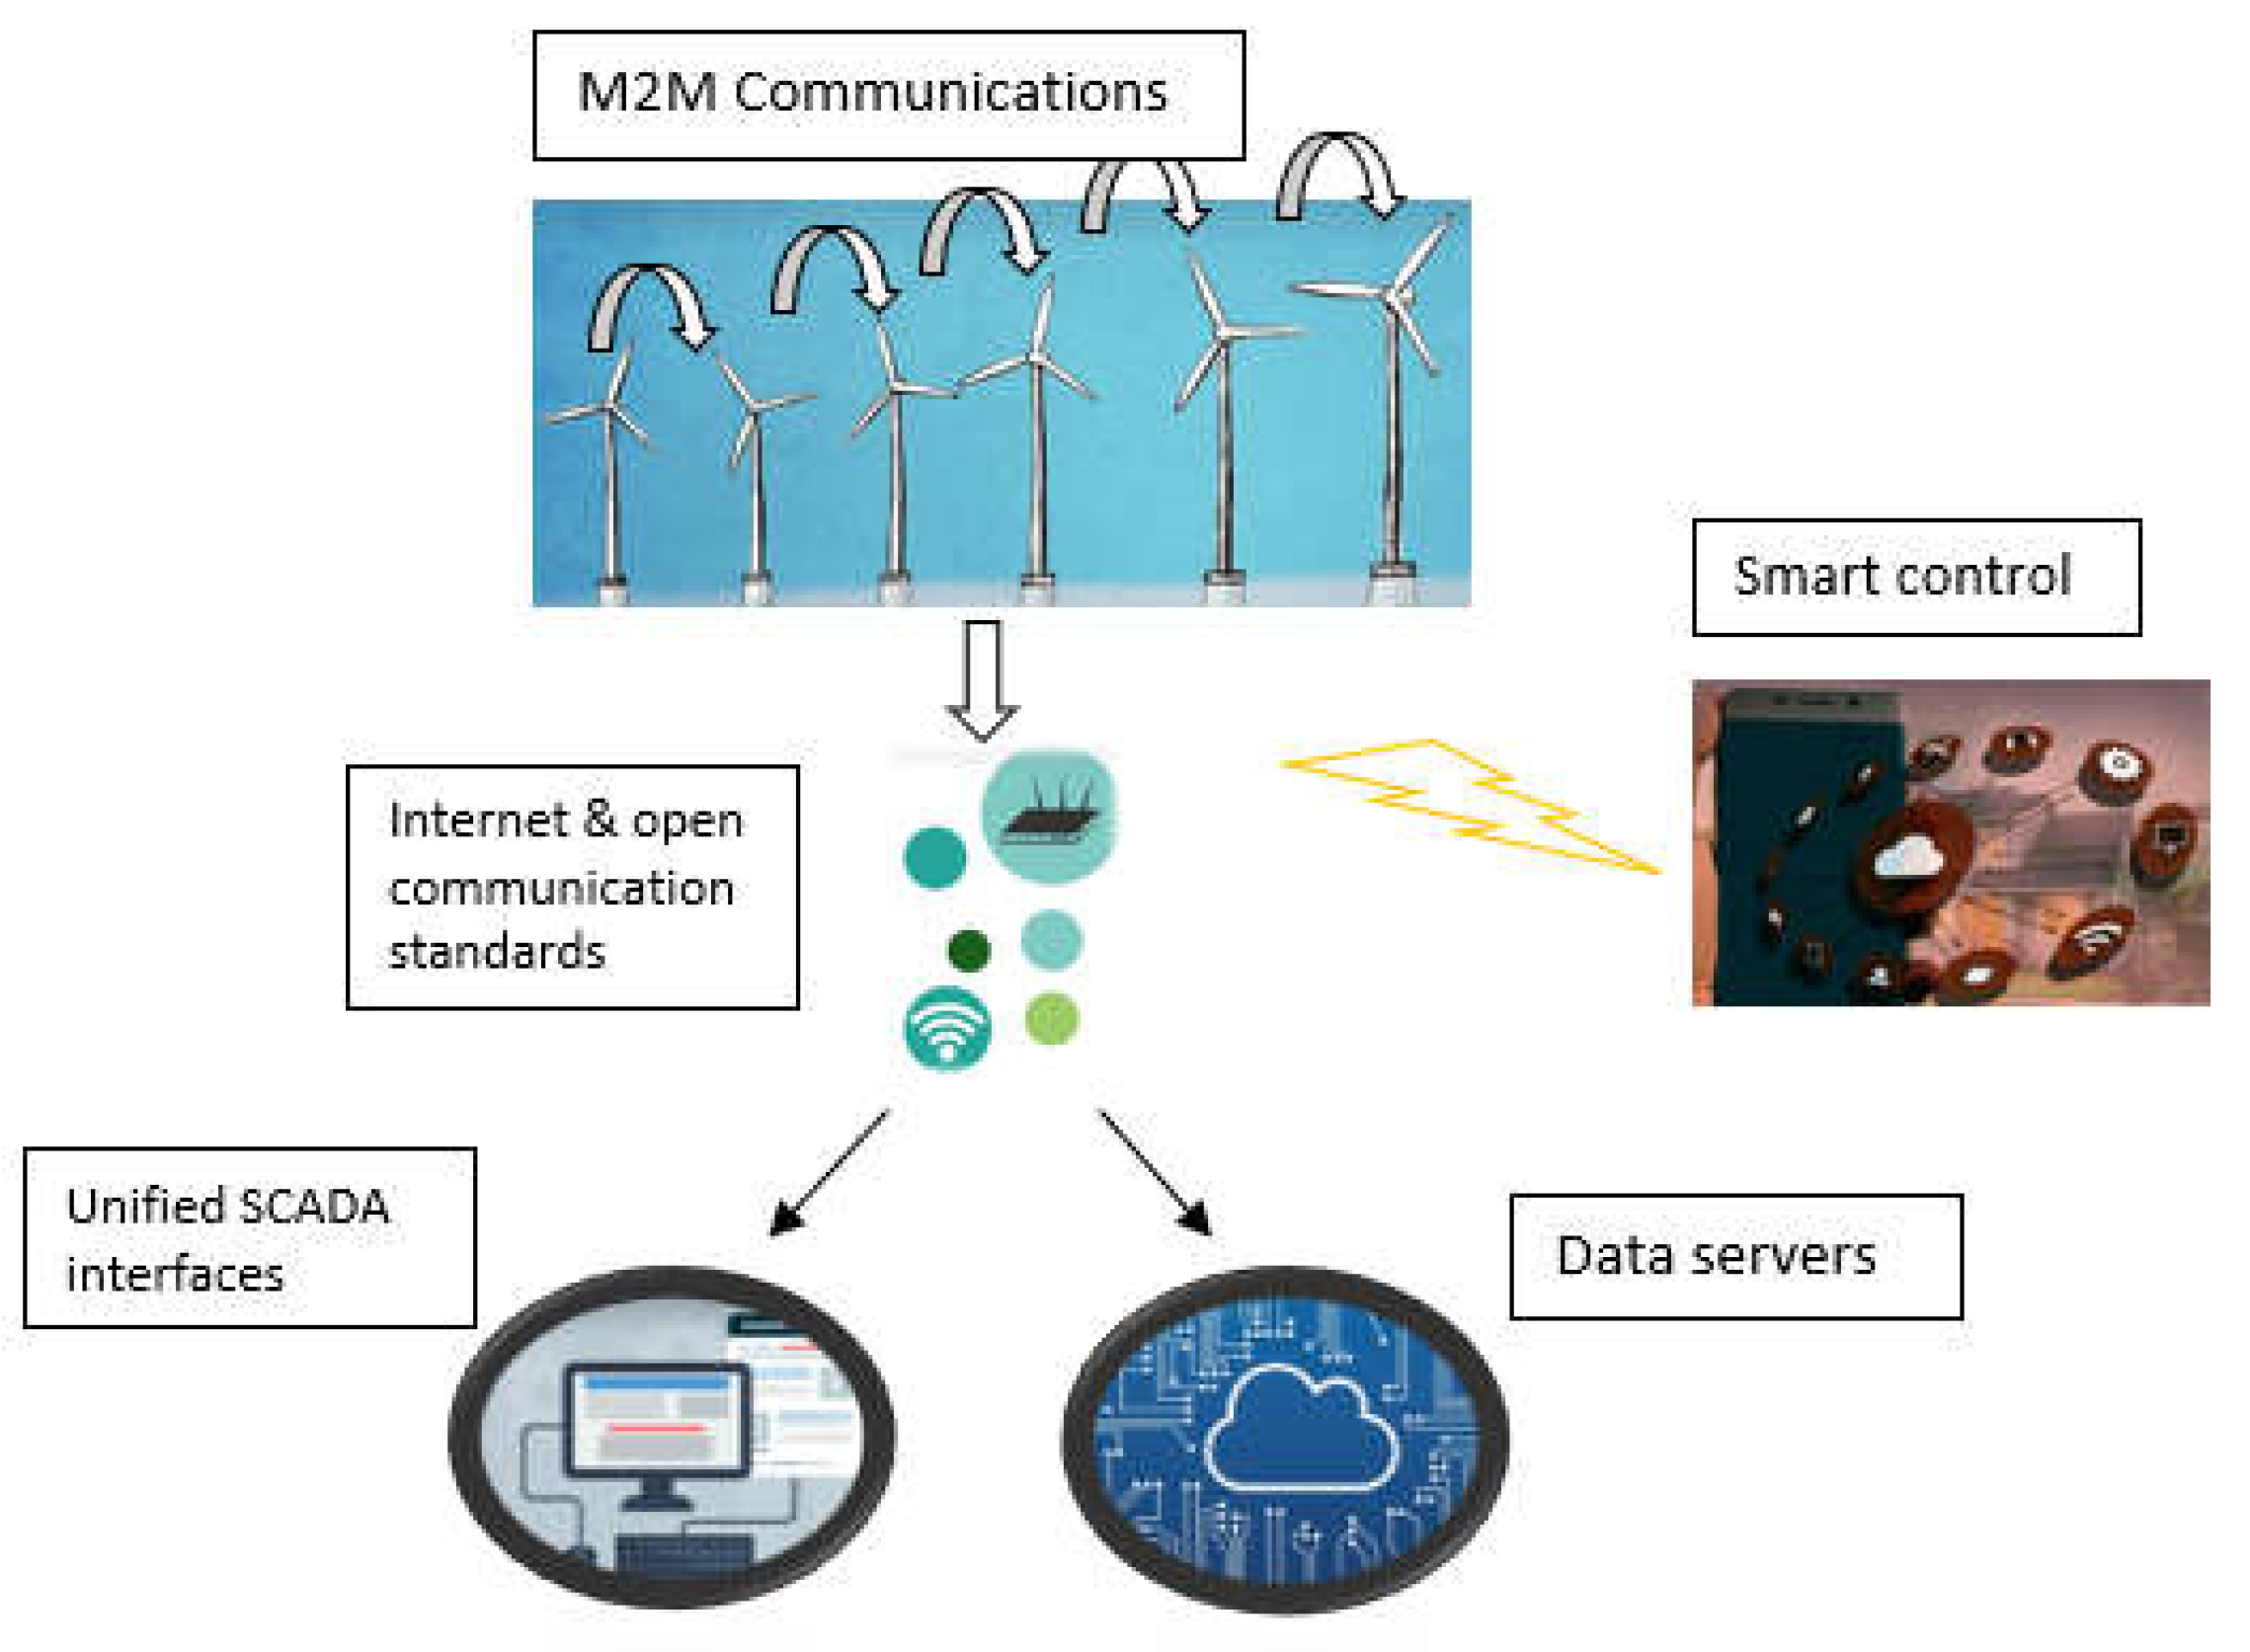
2.3. SCADA Systems and M2M for IoE-Enabled Wind Farms
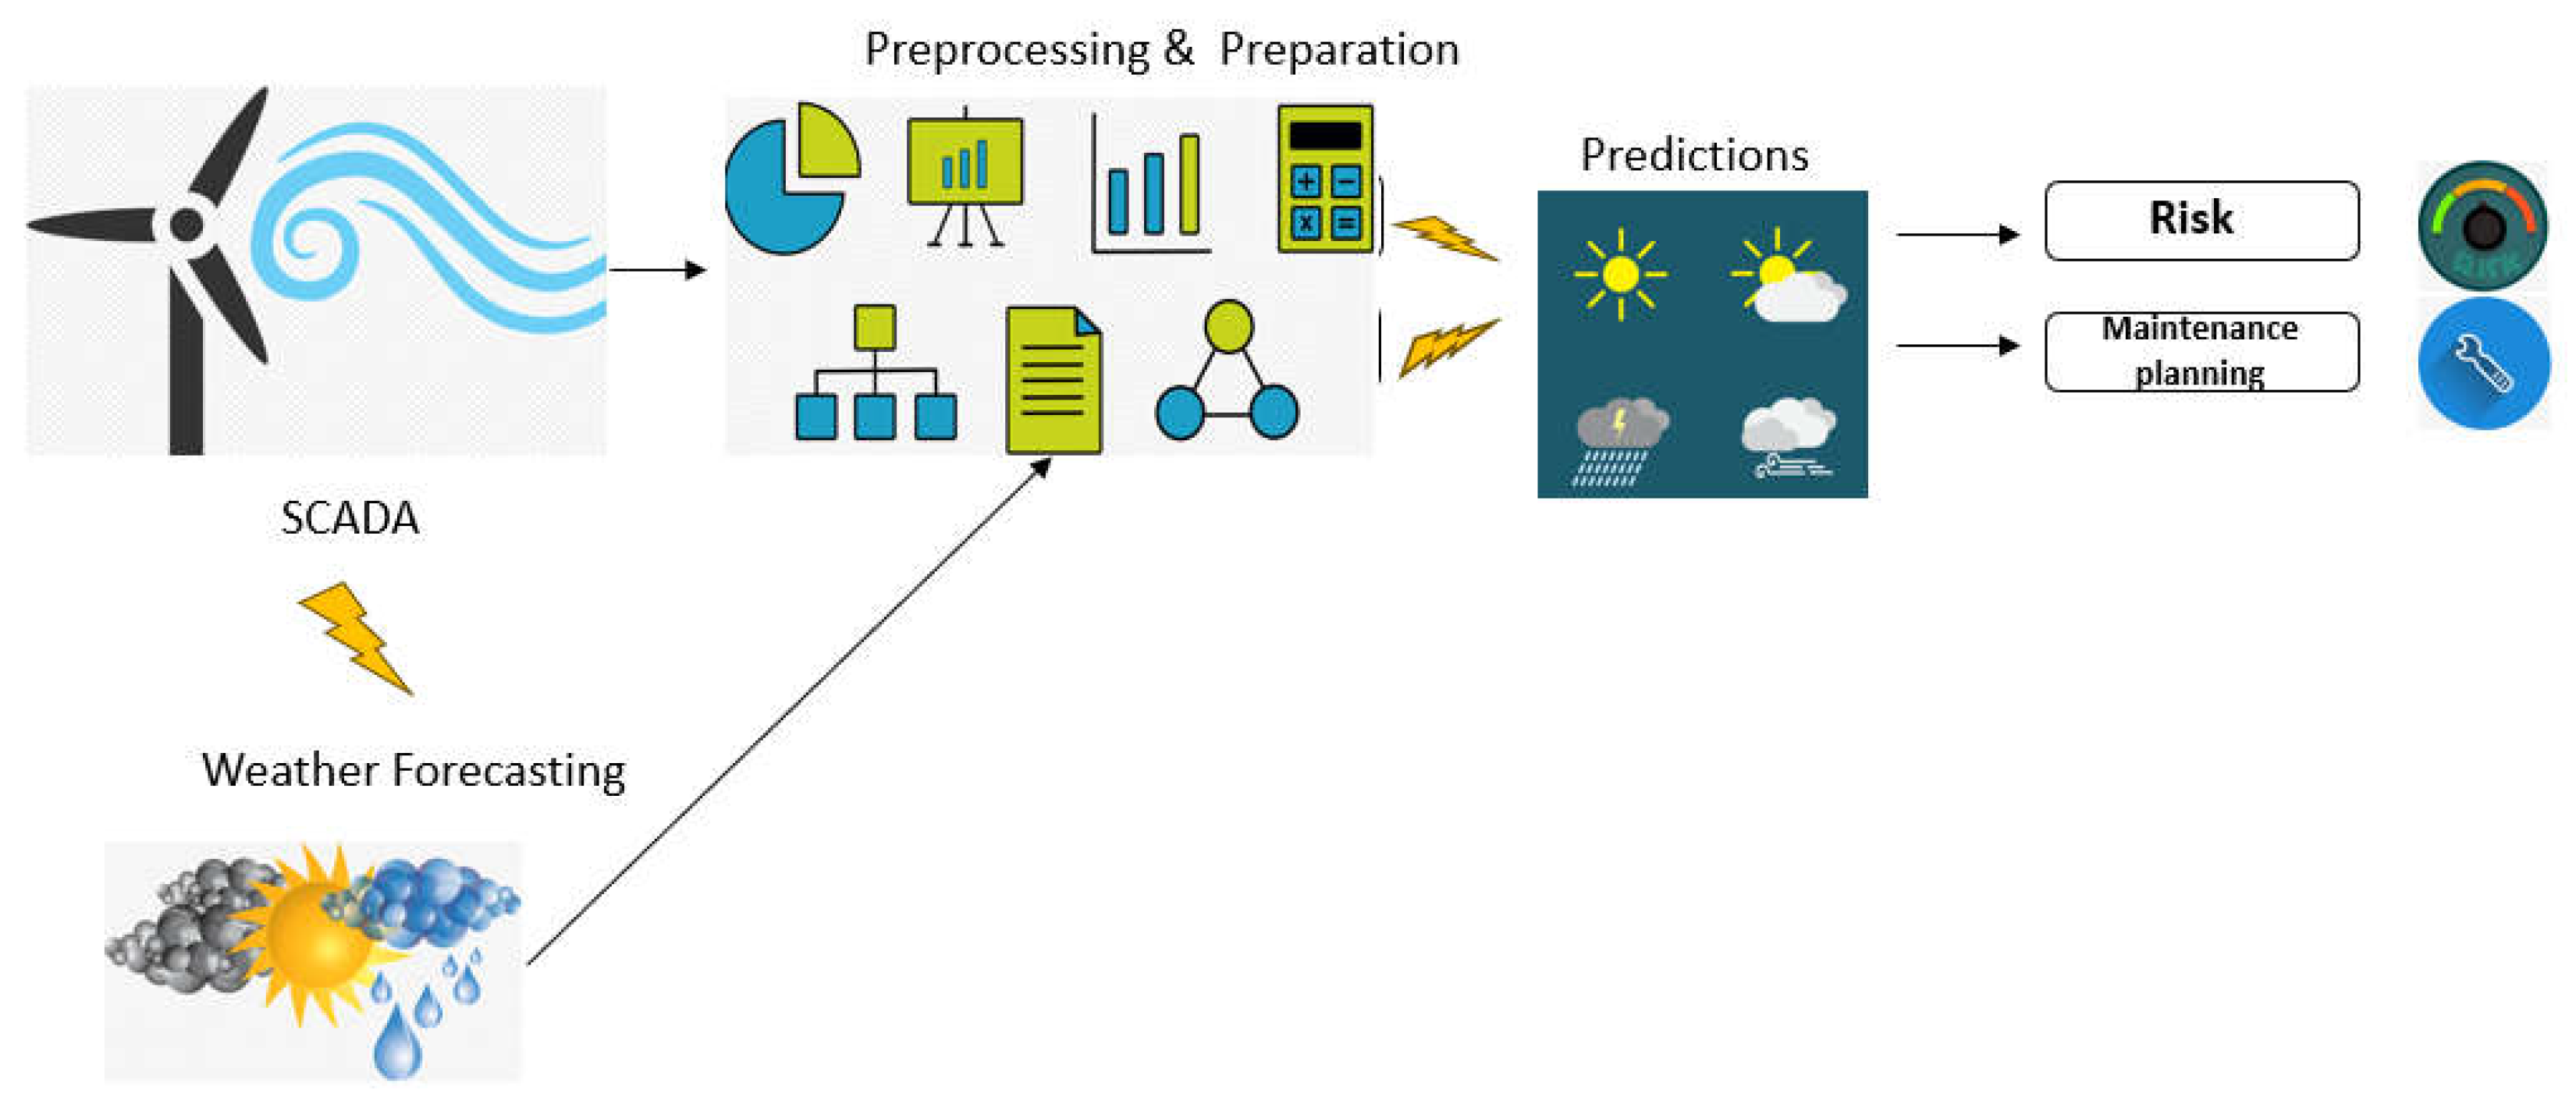
3. ML for Wind Energy Forecasting
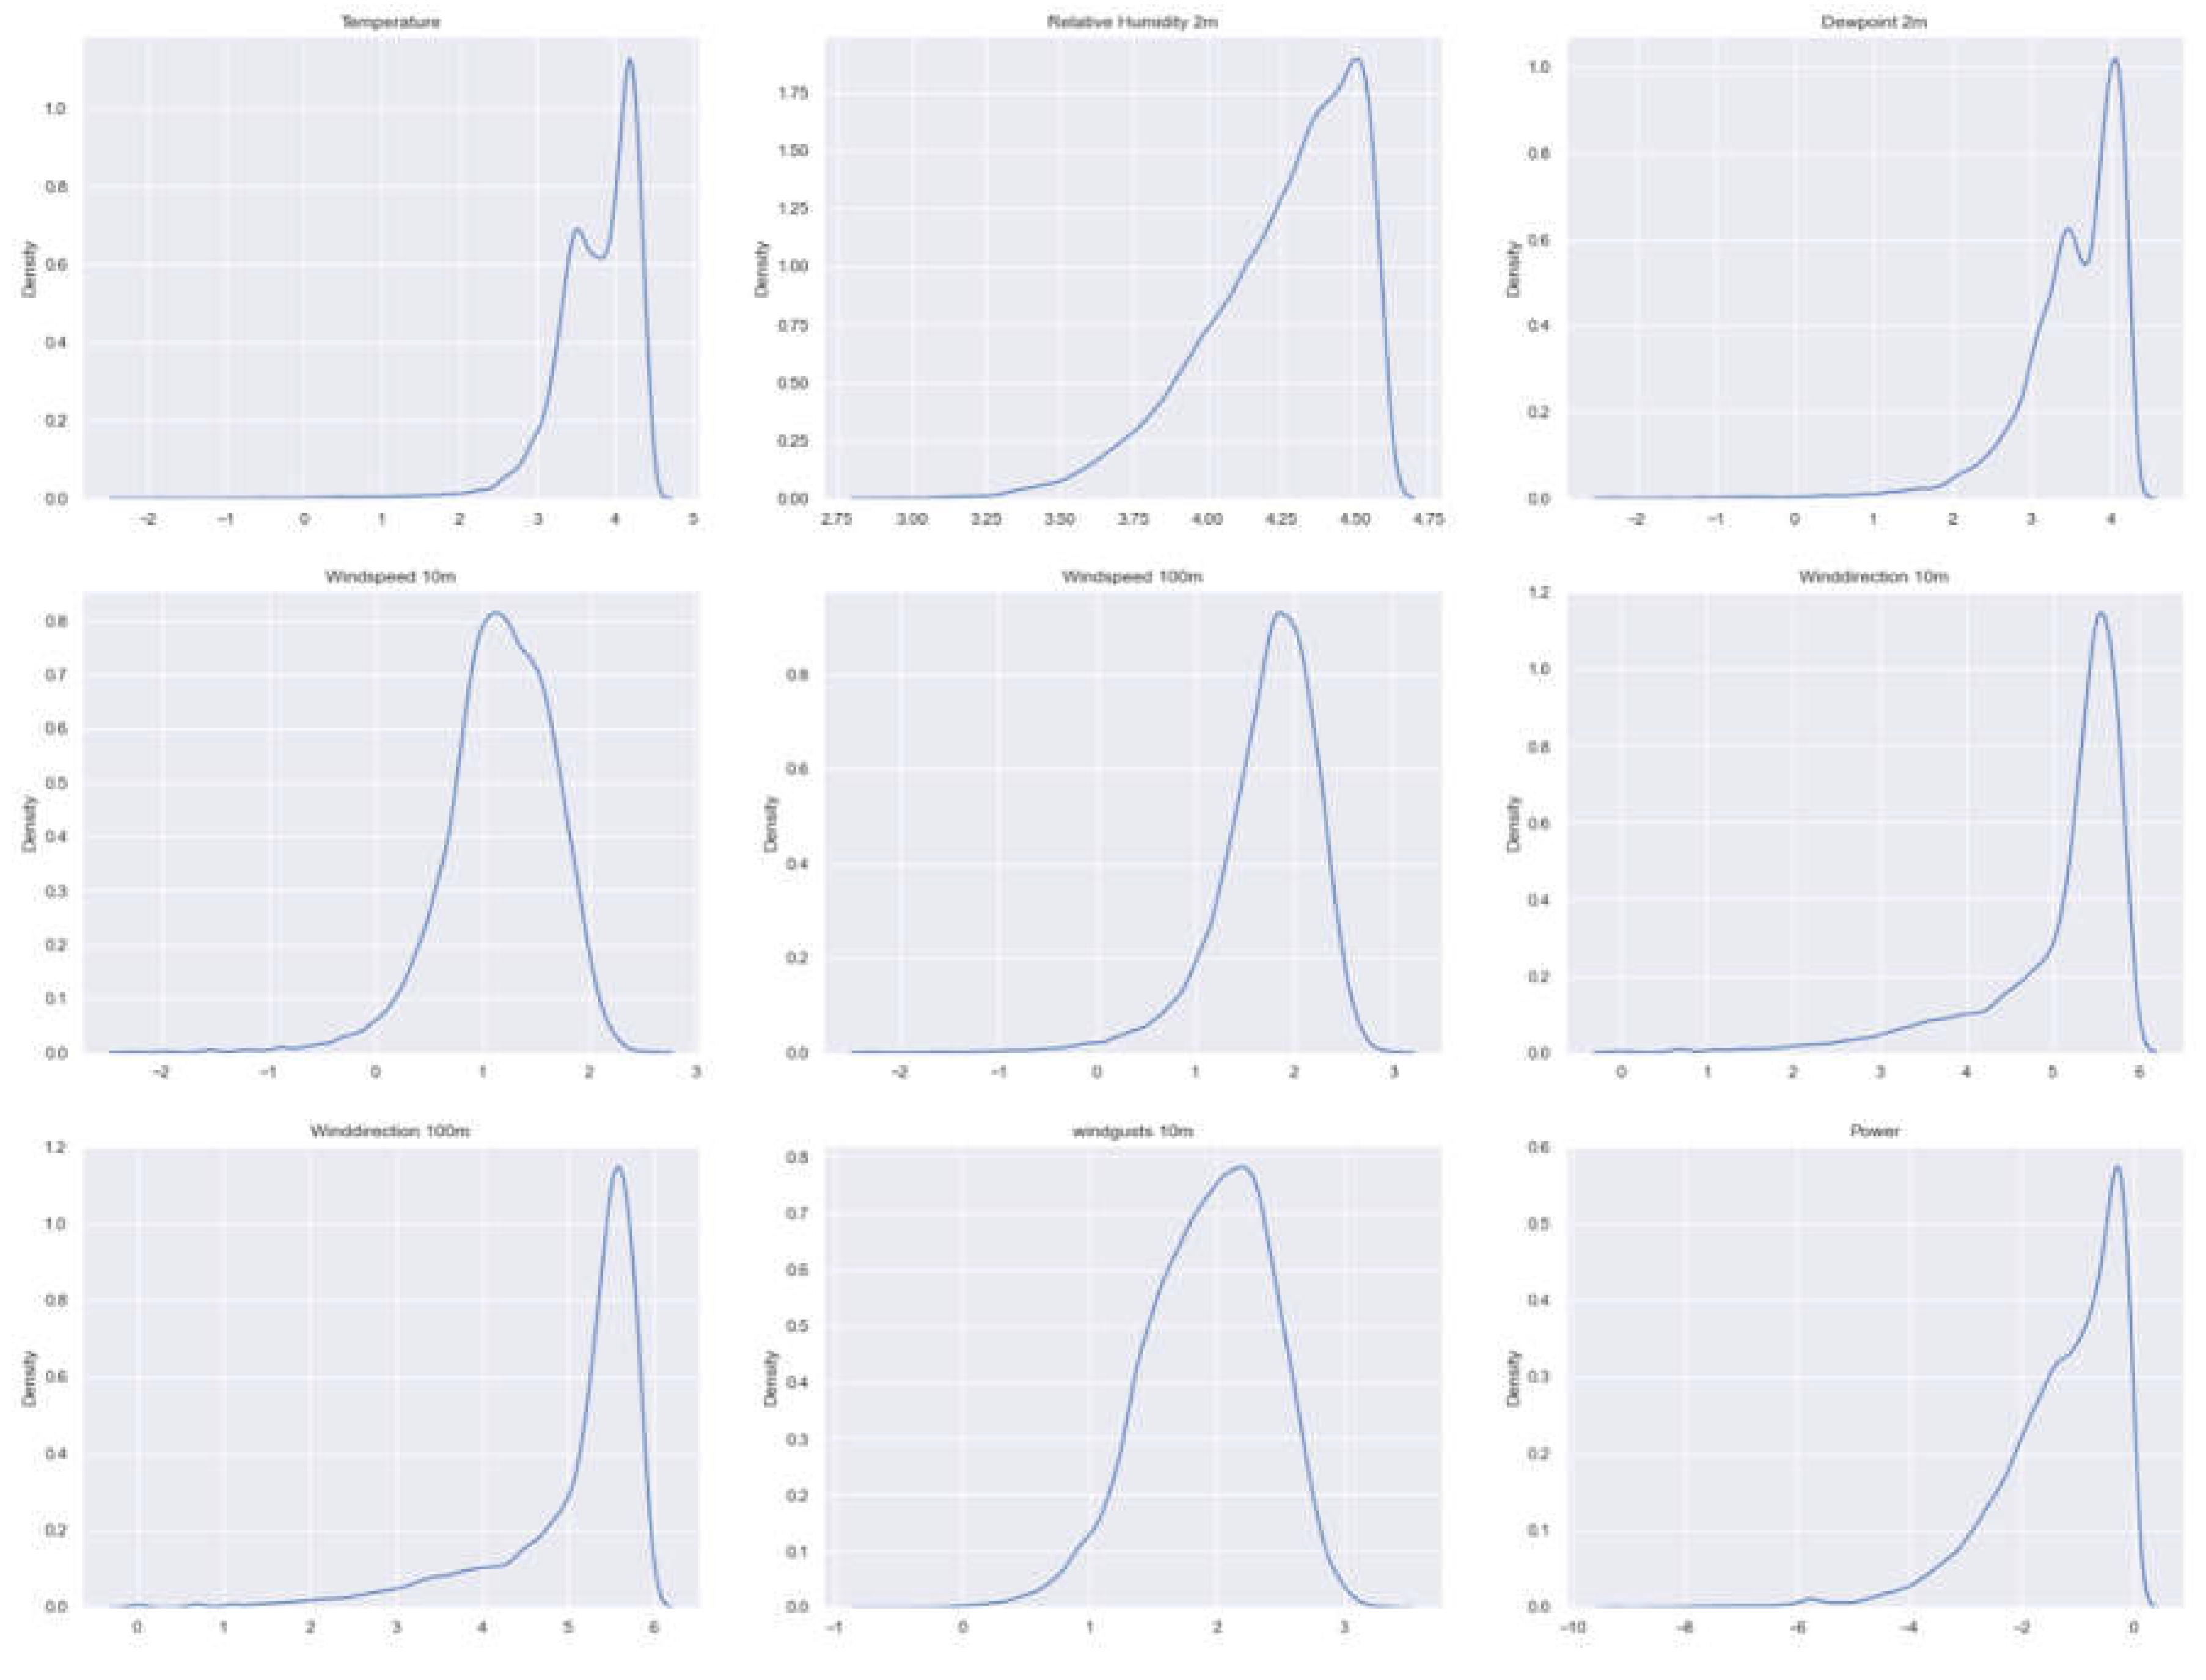
3.1. Dataset and Preprocessing
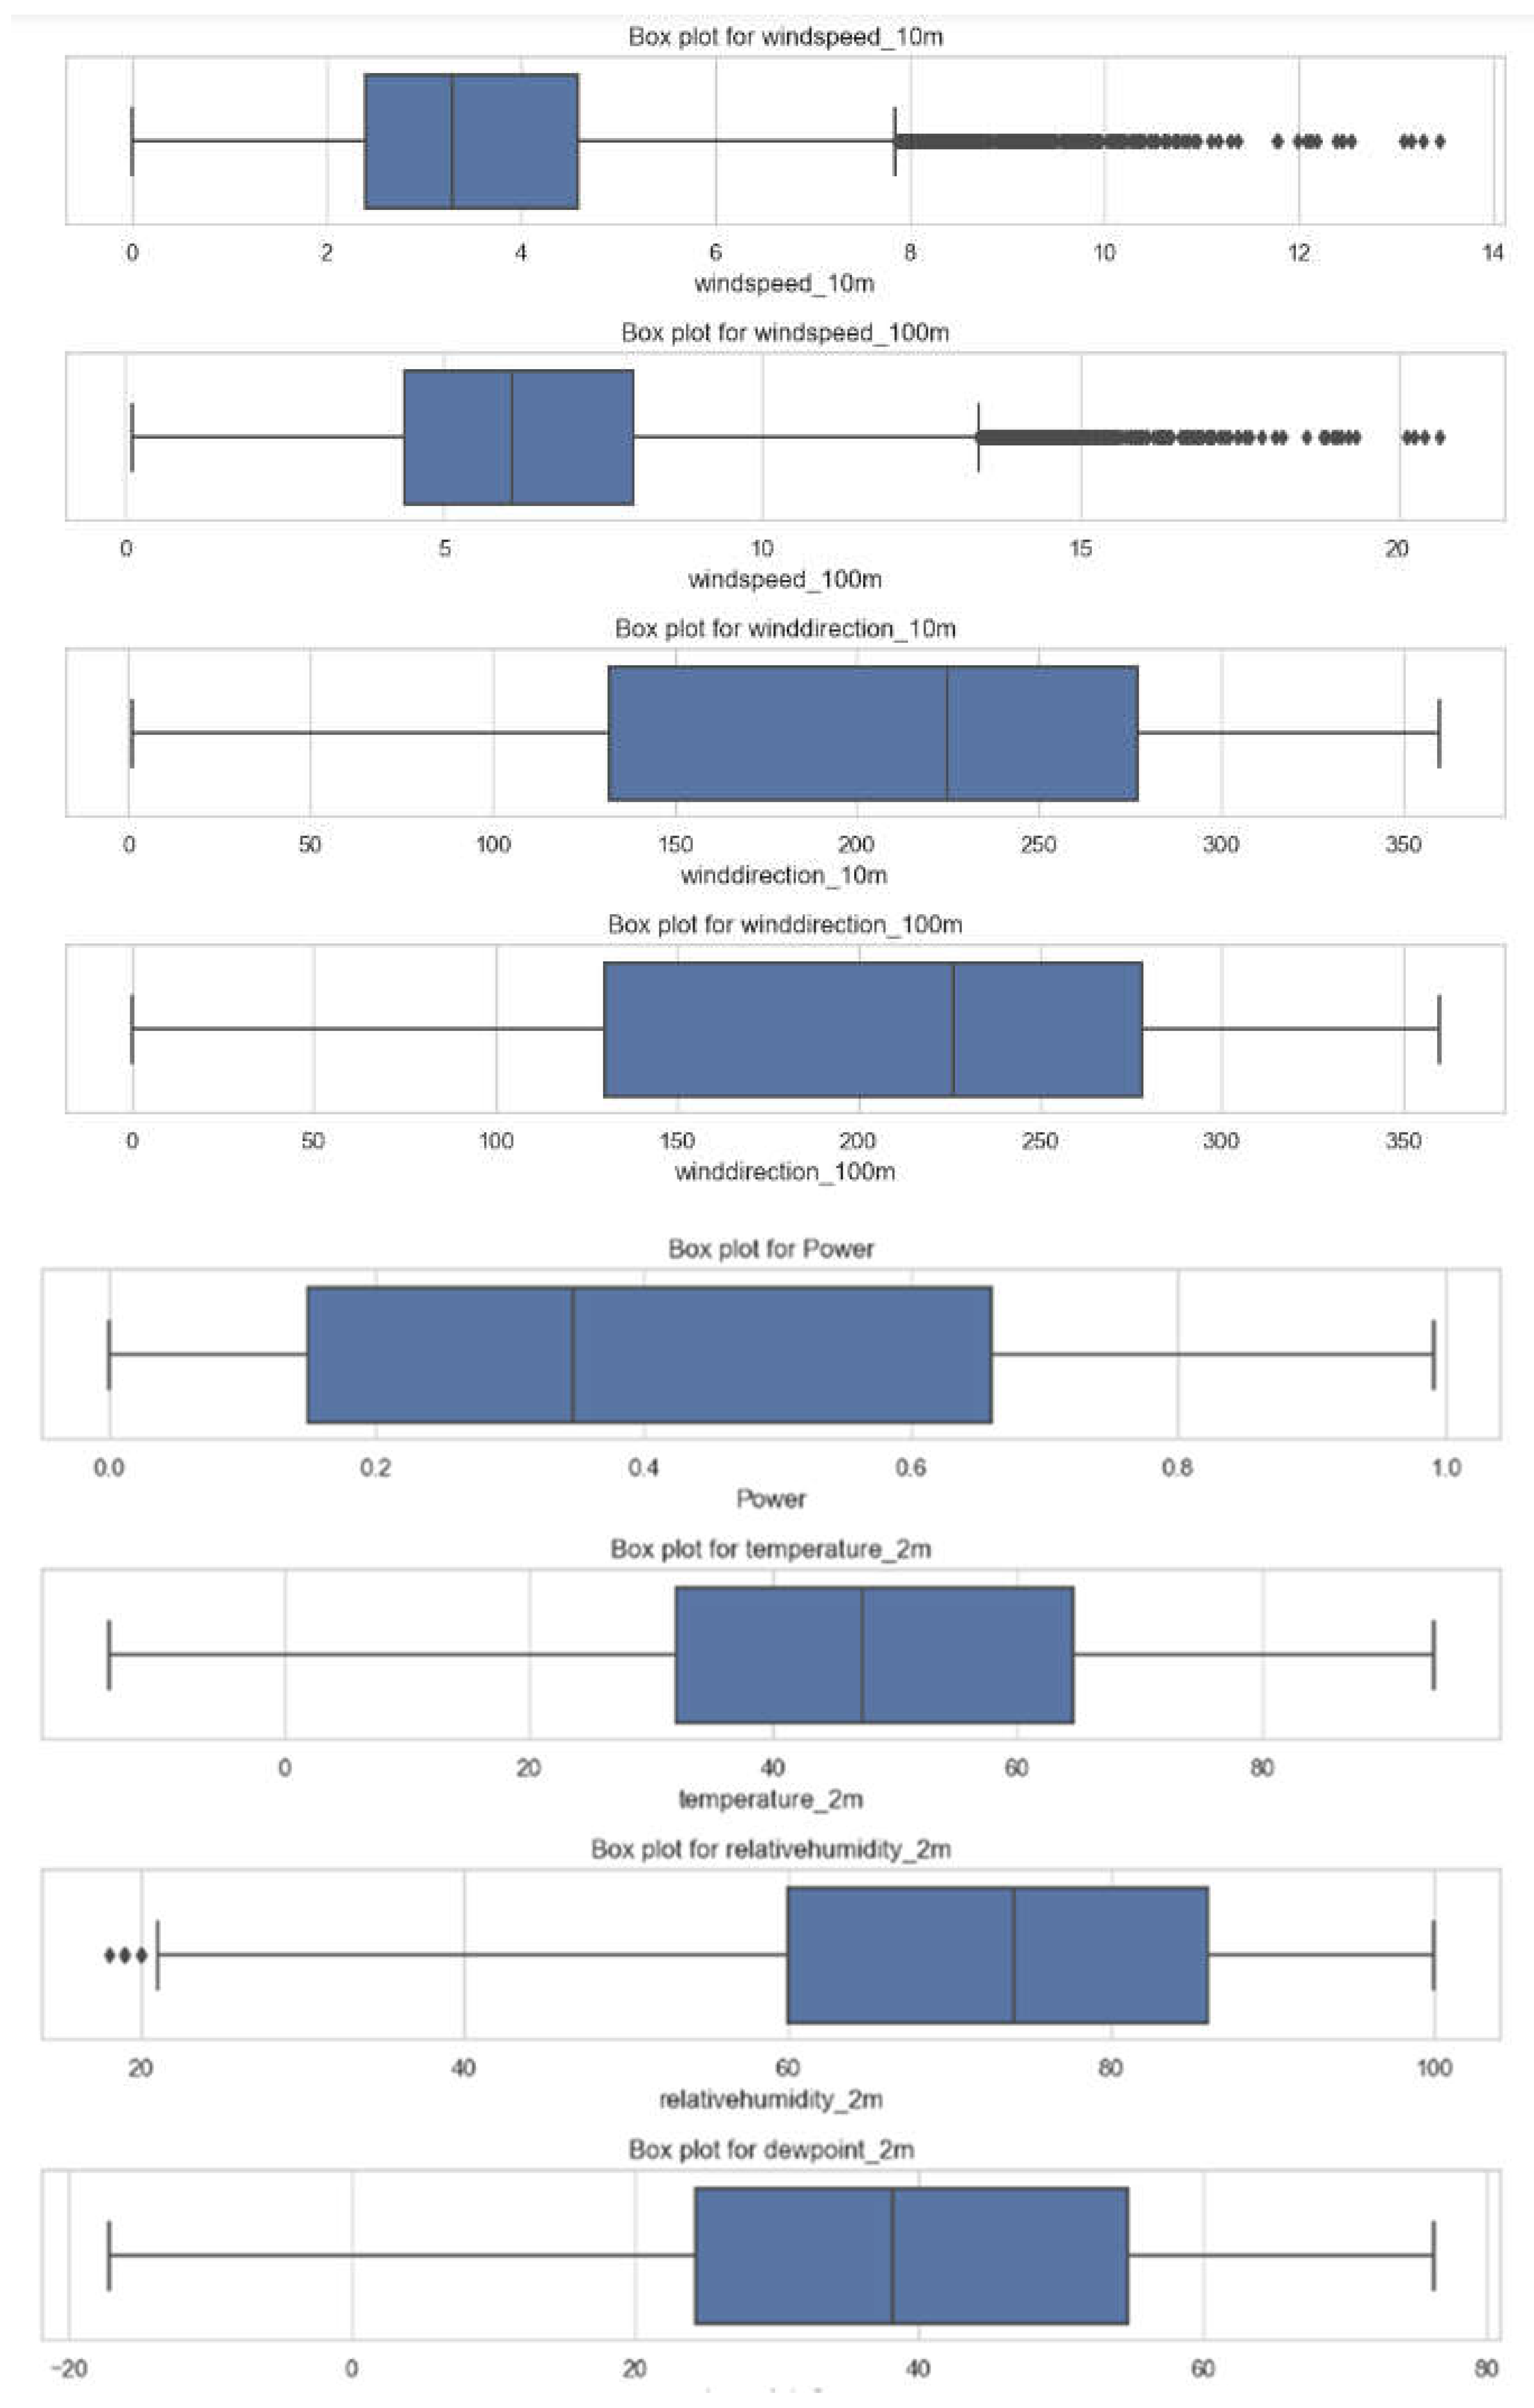
- Time: The moment in the day when the measurements were made.
- temperature_2m: The temperature in degrees Fahrenheit at two meters above the surface.
- relativehumidity_2m: The proportion of relative humidity at two meters above the surface.
- dewpoint_2m: Dew point, measured in degrees Fahrenheit at two meters above the surface.
- windspeed_10m: The wind speed, expressed in meters per second, at 10 meters above the surface.
- windspeed_100m: The speed of the wind at 100 meters above sea level, expressed in meters per second.
- winddirection_10m: The wind direction at 10 meters above the surface is represented in degrees. (0-360).
- winddirection_100m: The direction of the wind at 100 meters above the surface, expressed in degrees (0–360).
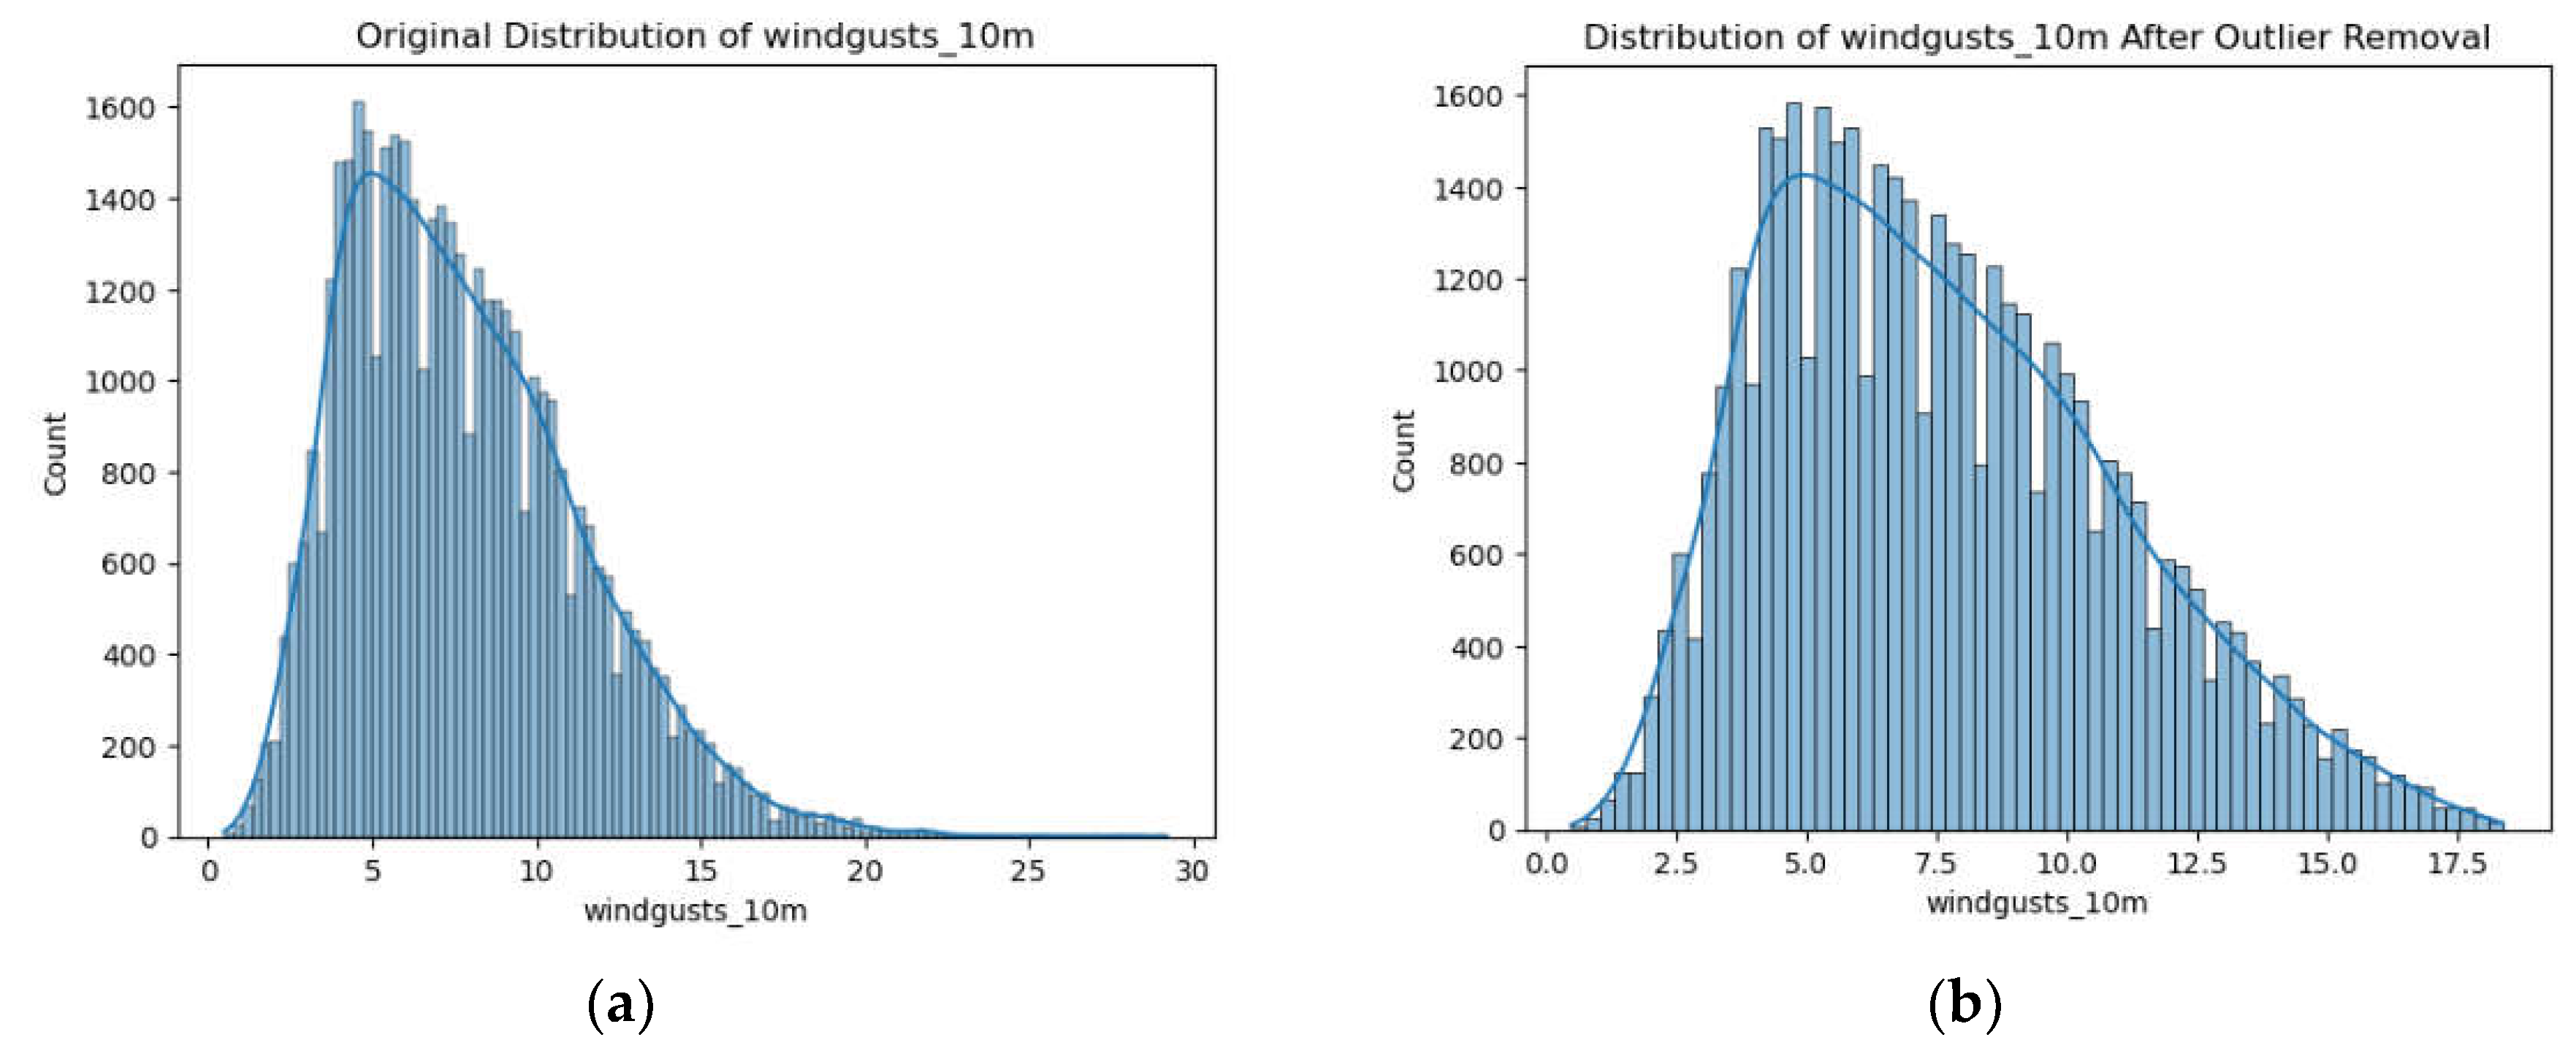
- windgusts_10m: A wind gust is an abrupt, transient increase in wind speed at 10 meters.
- Power: The normalized turbine output, expressed as a percentage of the turbine’s maximum potential output, and set between 0 and 1.
- Pandas is a robust Python package utilized for the manipulation and analysis of data. The software provides data structures such as DataFrames and Series, which facilitate the manipulation and analysis of organized data.
- NumPy is an essential library for scientific computation in Python, commonly referred to as “Numerical Python.” The software provides support for large, complex arrays and matrices, together with a collection of mathematical algorithms to effectively handle these arrays.
- Matplotlib is a flexible toolbox that enables the generation of static, interactive, and animated visualizations in the Python computer language. The pyplot module offers a MATLAB-like interface for producing plots and visualizations, simplifying the process of generating charts, histograms, scatter plots, and other graphical representations.
- Seaborn is a data visualization package that enhances the capabilities of matplotlib and provides a more sophisticated interface for creating visually appealing and meaningful statistical graphics. It streamlines the procedure of generating intricate visualizations and provides pre-installed themes and color palettes to increase the visual appeal of plots.
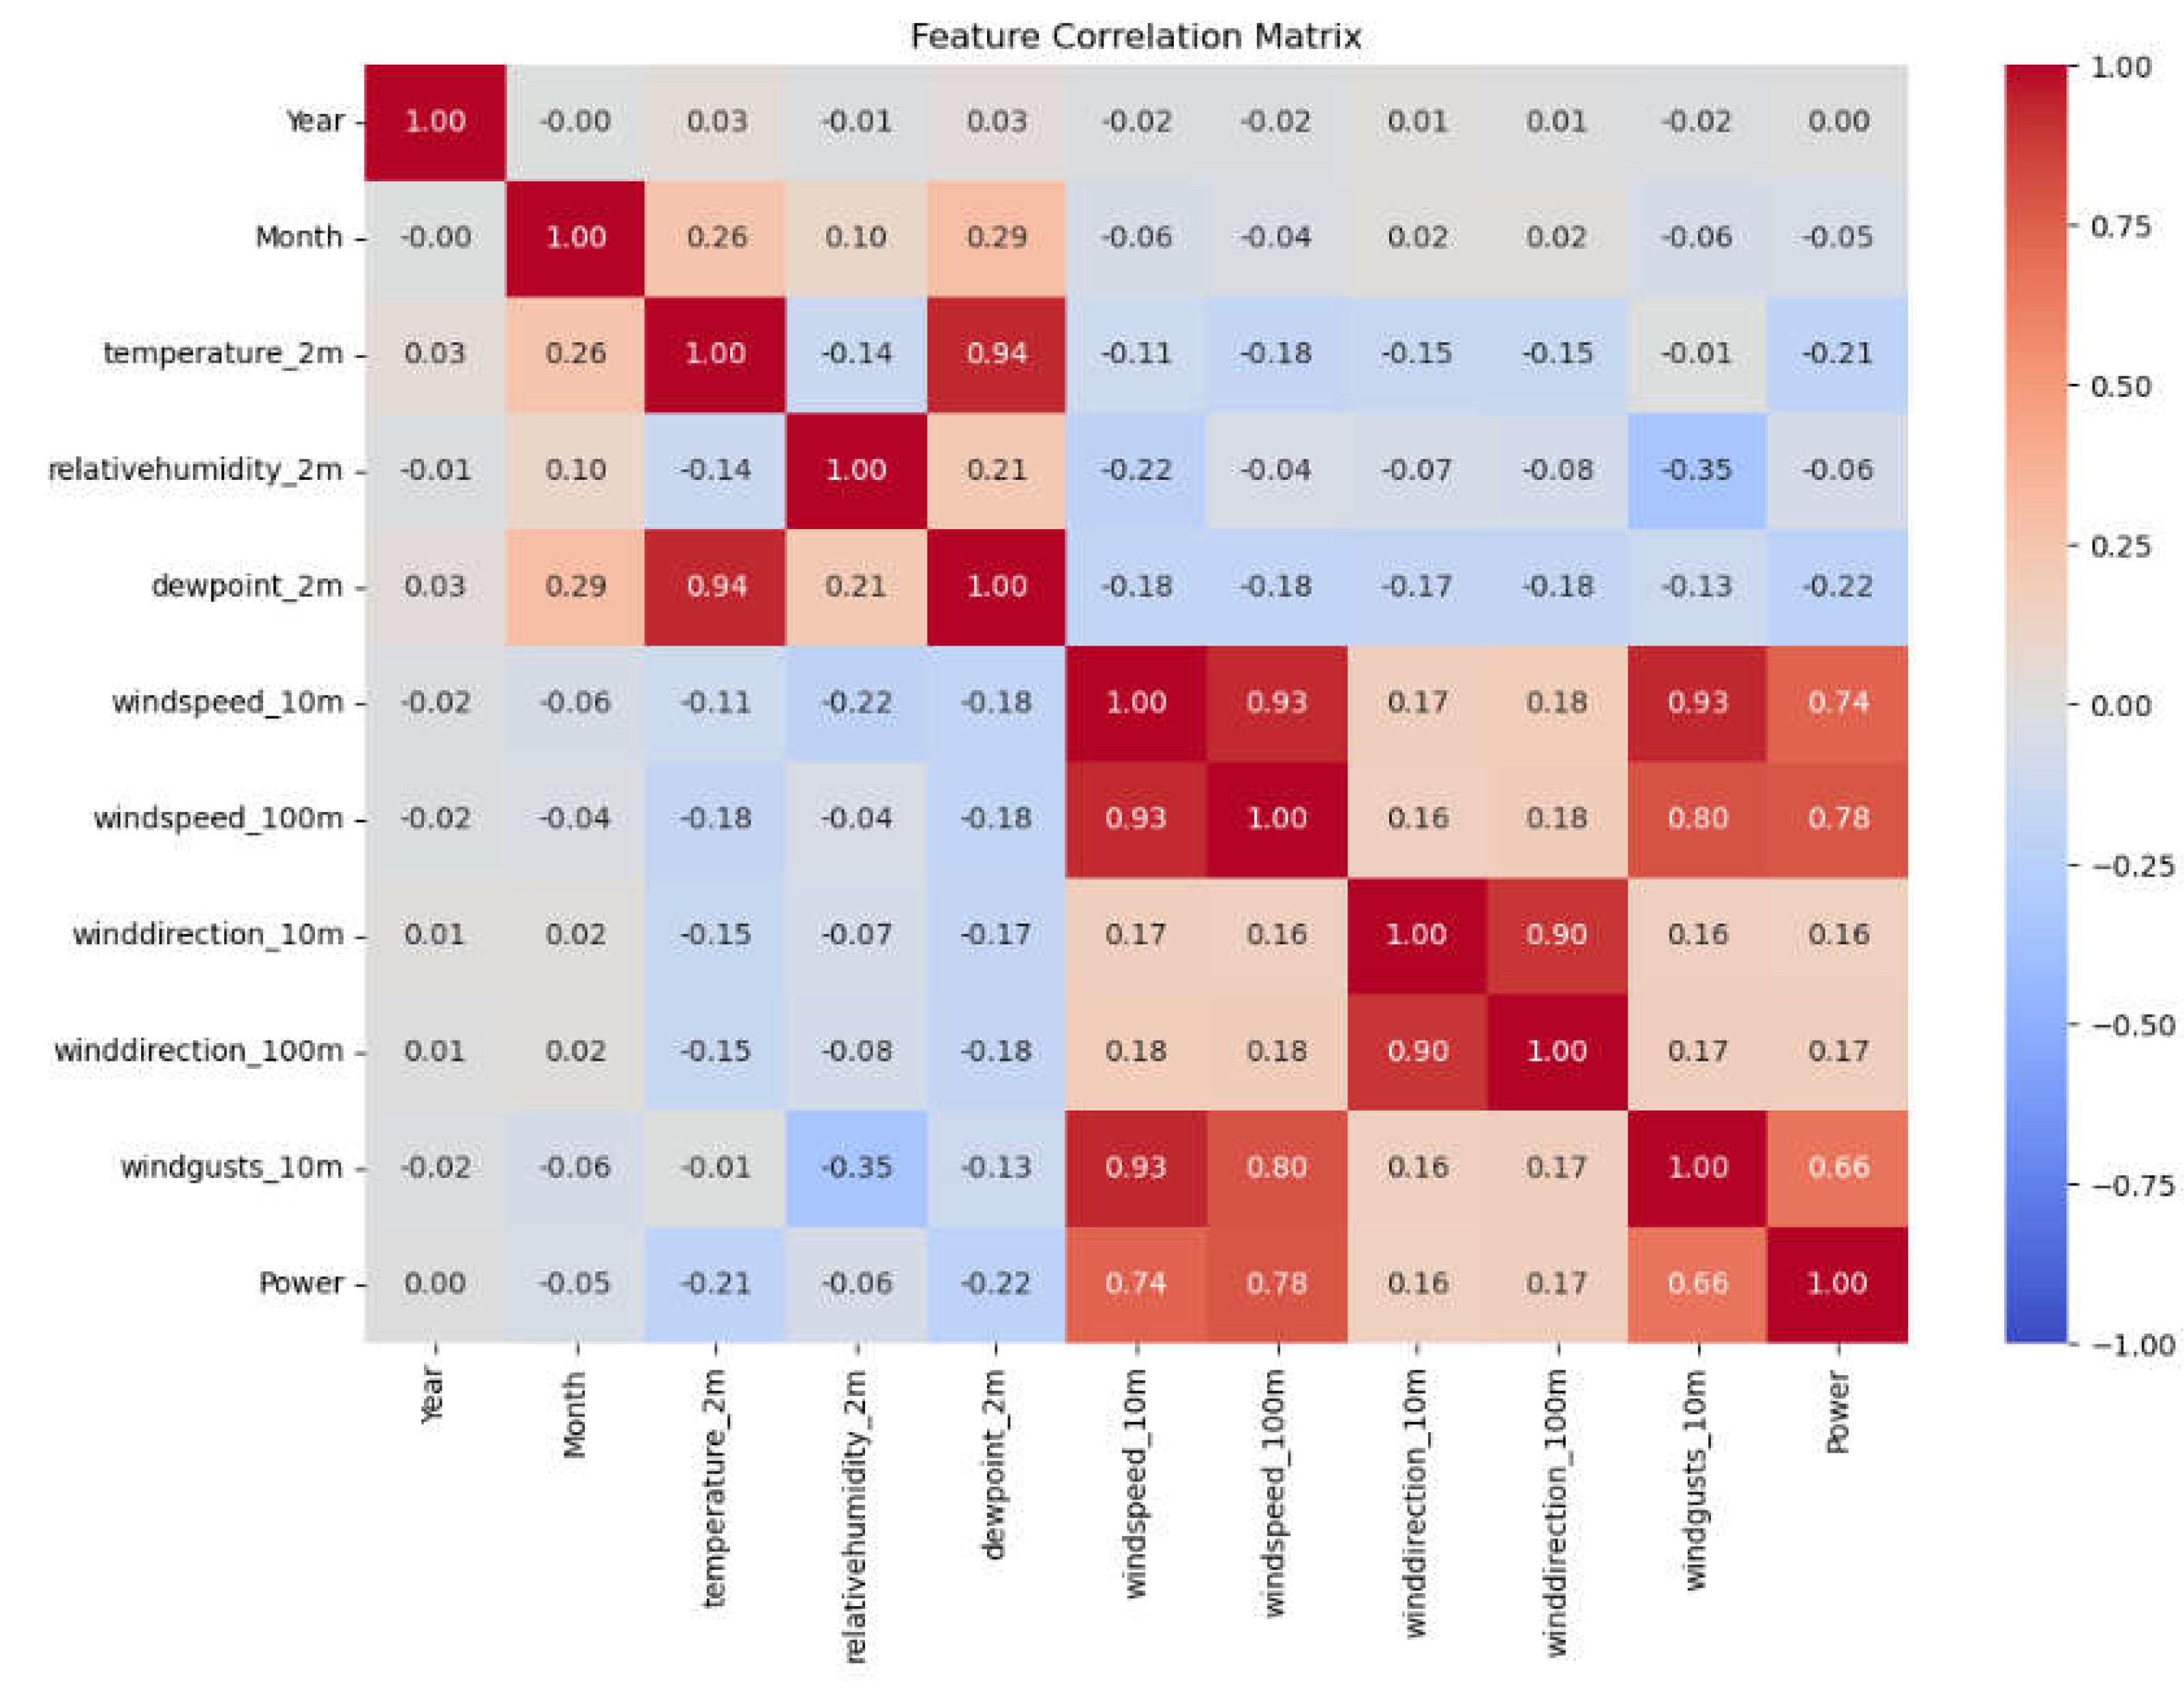
- is the mean of the feature.
- is the standard deviation of the feature.
3.2. Machine Learning and Wind Energy Forecast
- Dependent Variable: The dependent variable is the primary factor that one seeks to anticipate or comprehend.
- Independent Variables: These variables are postulated to exert an influence on the dependent variable.
- The metrics included in the regression models are R2, Adjusted R2, MSE, RMSE, and MAE.
- R2 (Coefficient of Determination): Assesses the model’s efficacy in elucidating the variance of the target variable. Varies from 0 to 1, with proximity to 1 indicating a superior fit [24].
- Adjusted R2: Analogous to R2, although modified to account for the quantity of predictors in the model. Addresses overfitting; increases solely if additional predictors enhance the model.
- MSE: The mean of the squared deviations between expected and actual values. Imposes more penalties on larger faults compared to lesser ones.
- RMSE: The square root of the MSE. Denotes the mean error in the identical units as the target variable.
- MAE: The mean of the absolute discrepancies between expected and actual values. More robust to outliers than MSE or RMSE.
3.2.1. Linear Regression
- is the dependent variable.
- is the intercept.
- The coefficients represent the values assigned to the independent variables .
- R2 (0.6199): This means that about 61.99% of the variance in the target variable can be explained by the model’s features. This indicates a moderately strong fit, but there is still 38% of variability in the target that the model does not explain.
- Adjusted R2 (0.6194): The Adjusted R2 is slightly lower than the R2 (0.6194 vs. 0.6199), which accounts for the number of predictors. It’s close to R2, suggesting that the added features are useful, but not overfitting.
- MSE (0.0312): The low value of 0.0312 of MSE indicates that the model’s predictions are generally close to the actual values, though it’s harder to interpret MSE without comparing it to the scale of the data.
- RMSE (0.1767): An RMSE of 0.1767 means that, on average, the model’s predictions are off by around 0.18 units from the actual values.
- MAE (0.1389): An MAE of 0.1389 means that, on average, the model is off by 0.14 units, which is slightly lower than the RMSE. This suggests the model is performing well with relatively small errors.
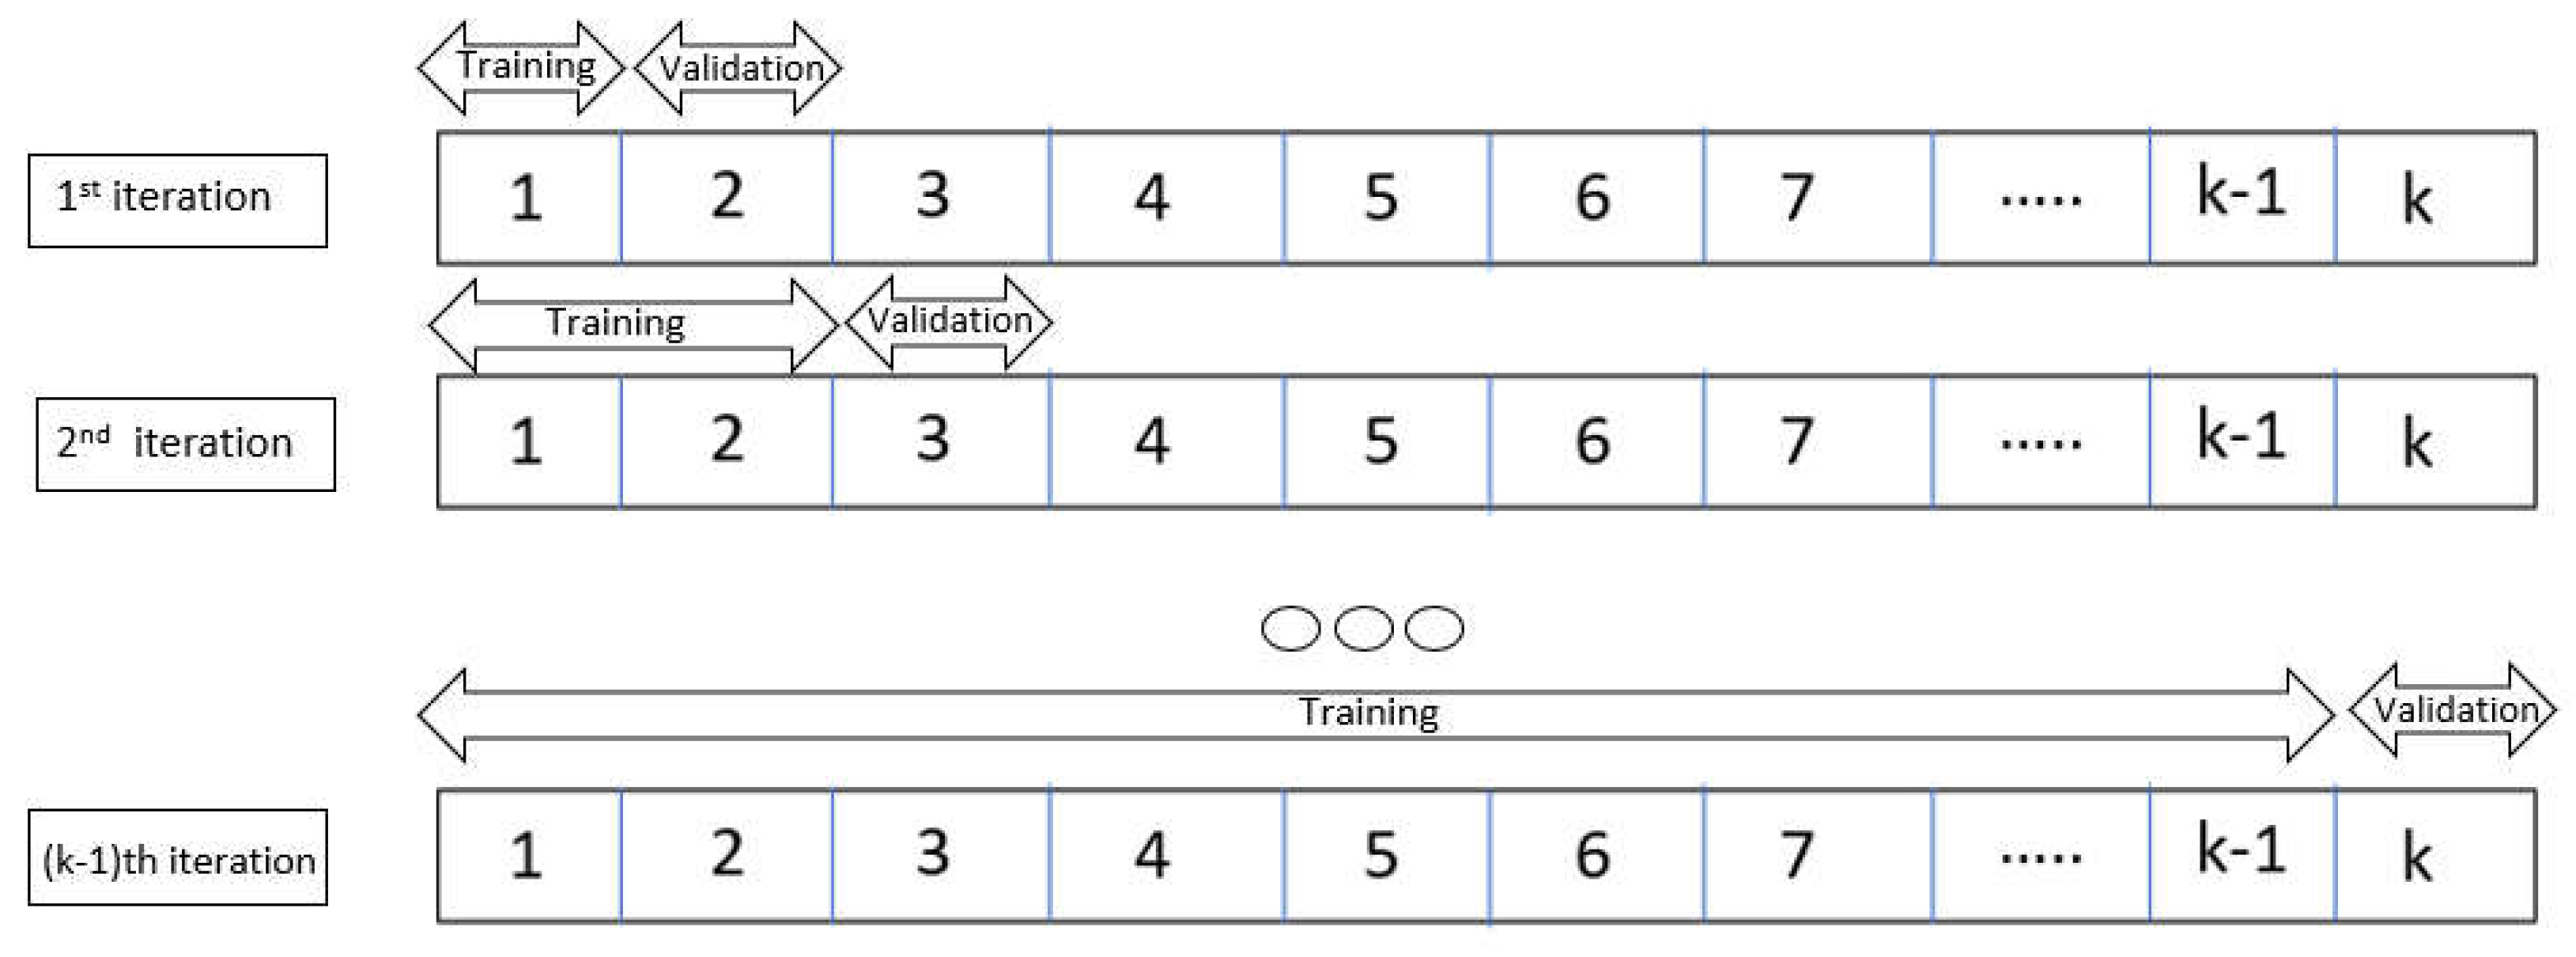
- R2 (0.6299 ± 0.0082): The average R2 across cross-validation is 62.99%, slightly higher than the original R2. The standard deviation (±0.0082) indicates stable performance across different data splits.
- Adjusted R2 (0.6290 ± 0.0082): The adjusted R2 is 62.90% with minimal variability, confirming that the model generalizes well without overfitting.
- MSE (0.0303 ± 0.0007): The average error across cross-validation sets is 0.0303 with a small standard deviation (±0.0007), showing that the model is consistent.
- RMSE (0.1741 ± 0.0021): The average RMSE is 0.1741, meaning the average prediction error is about 0.174 units, with slight variability (±0.0021).
- MAE (0.1376 ± 0.0015): The average MAE is 0.1376, indicating that, on average, the model is 0.1376 units off. The small standard deviation (±0.0015) shows good consistency.
3.2.2. Random Forest Regression
- R2 (0.76087): An R2 of 0.76087 signifies that the model accounts for approximately 76.09% of the variance in the target variable, which is commendable. The model effectively catches most patterns within the data.
- Adjusted R2 (0.76060): Adjusted R2 is closely aligned with the R2, indicating that the model is appropriately fitted without superfluous complexity.
- MSE (0.01976): The MSE is notably low, signifying that the model’s prediction errors are minimal.
- RMSE (0.14057): An RMSE of 0.14057 implies that, on average, the model’s predictions diverge from the actual values by approximately 0.14 units, reflecting commendable performance, particularly relative to the data’s scale.
- MAE (0.10439): An MAE of 0.10439 indicates that, on average, the model’s predictions deviate by around 0.10 units. Given that MAE exhibits less sensitivity to outliers compared to MSE, it indicates that the model is continuously producing relatively minor mistakes.
- Mean Cross-Validation R2 (0.64517): With an average R2 value of 0.64517—lower than the test set R2—0.76087—over the cross-valuation folds. This implies that, on average, during cross-valuation, the model explains roughly 64.5% of the variation, whereas on the test set it explains about 76% of the variance. Although this difference suggests some variation in model performance over several data subsets, overall, the finding is still really strong.
- Mean Cross-Validation Adjusted R2 (0.64509): Considered as lower than the Adjusted R2 on the test set (0.76060), the average Adjusted R2 across cross-valuation is 0.64509. Like the R2 score, this indicates that although the model may be slightly overfitting the test data relative to its performance on several validation sets, it generalizes somewhat reasonably.
- Mean Cross-Validation MSE (0.02943): Higher than the test set MSE (0.01976), the average MSE among several cross-valuation folds is 0.02943. This implies that, on the test data, the model did rather better than on the average validation folds. Still, the variation is not significant, suggesting a rather steady performance.
- Mean Cross-Validation RMSE (0.17155): Higher than the test RMSE (0.14057), the average RMSE for the validation sets is 0.17155. This suggests that, although still within a reasonable range, the model’s mistakes during cross-valuation are rather greater than on the test set on average.
- Mean Cross-Validation MAE (0.13200): Higher than the test MAE, 0.10439, the average MAE during cross-valuation is 0.13200. Consequently, the model performs really well over several data splits but makes somewhat more mistakes on the cross-valuation folds.
- R2 Score: 0.67234
- Adjusted R2 Score: 0.67223
- MSE: 0.02707
- RMSE: 0.16453
- MAE: 0.12603
3.2.3. Lasso Regression
- R2 (0.6110): This means that 61.10% of the variance in the target variable (y) is explained by the Lasso regression model. It’s a moderate grade, demonstrating that the model captures a good percentage of the variability, however there is potential for improvement.
- Adjusted R2 (0.6108): The Adjusted R2 value is quite close to the R2 score (0.6108 vs. 0.6110). This shows that the model’s performance does not diminish when accounting for the amount of predictors used. Since the model isn’t overfitting with irrelevant variables, the adjusted R2 stays virtually the same as the regular R2.
- MSE (0.0319): A lower MSE (0.0319) shows the model’s predictions are pretty close to the actual values, while there are some inaccuracies.
- RMSE (0.1787): RMSE is 0.1787, suggesting on average, the predictions are wrong by around 0.1787 units of the target variable, which is a substantial amount of inaccuracy.
- MAE (0.1410): With a MAE of 0.1410, the predictions average from the actual values by roughly 0.1410 units. This implies somewhat minimal error, although RMSE (which penalizes more significant errors) indicates somewhat more fluctuation in the errors.
- Mean R2 (0.6132 ± 0.0533): With an average R2 score of 0.6132—rather close to the test set R2 of 0.6110—the 10 cross-valuation folds Although the performance of the model fluctuates somewhat throughout the few cross-valuation folds, the standard deviation (±0.0533) indicates minimal fluctuation that suggests consistency.
- Adjusted R2 (0.6108 ± 0.0533): With a mean of 0.6108, the modified R2 is also rather consistent; it indicates that the model can generalize effectively over several folds and is not overfitting.
- Mean MSE (0.0313 ± 0.0052): With a tiny standard deviation (±0.0052), the average MSE over the cross-valuation folds is 0.0313, somewhat near to the test set MSE of 0.0319. This indicates that the model is not unduly sensitive to several subsets of the data and is rather steady in performance.
- Mean RMSE (0.1769 ± 0.0722): Again, revealing a comparable average prediction error, the RMSE from cross-validation (0.1769) is once more near to the test set RMSE of 0.1787. Though it’s still reasonable, the standard deviation (±0.0722) indicates far more fluctuation in mistakes between folds than in MSE.
- Mean MAE (0.1399 ± 0.0105): With cross-validation, the average MAE (0.1399) is rather close to the test set MAE (0.1410). Furthermore, showing consistency in the prediction accuracy across several subsets is the low standard deviation (±0.0105).
4. Results and Discussion
4.1. Performance Metrics on Test Set
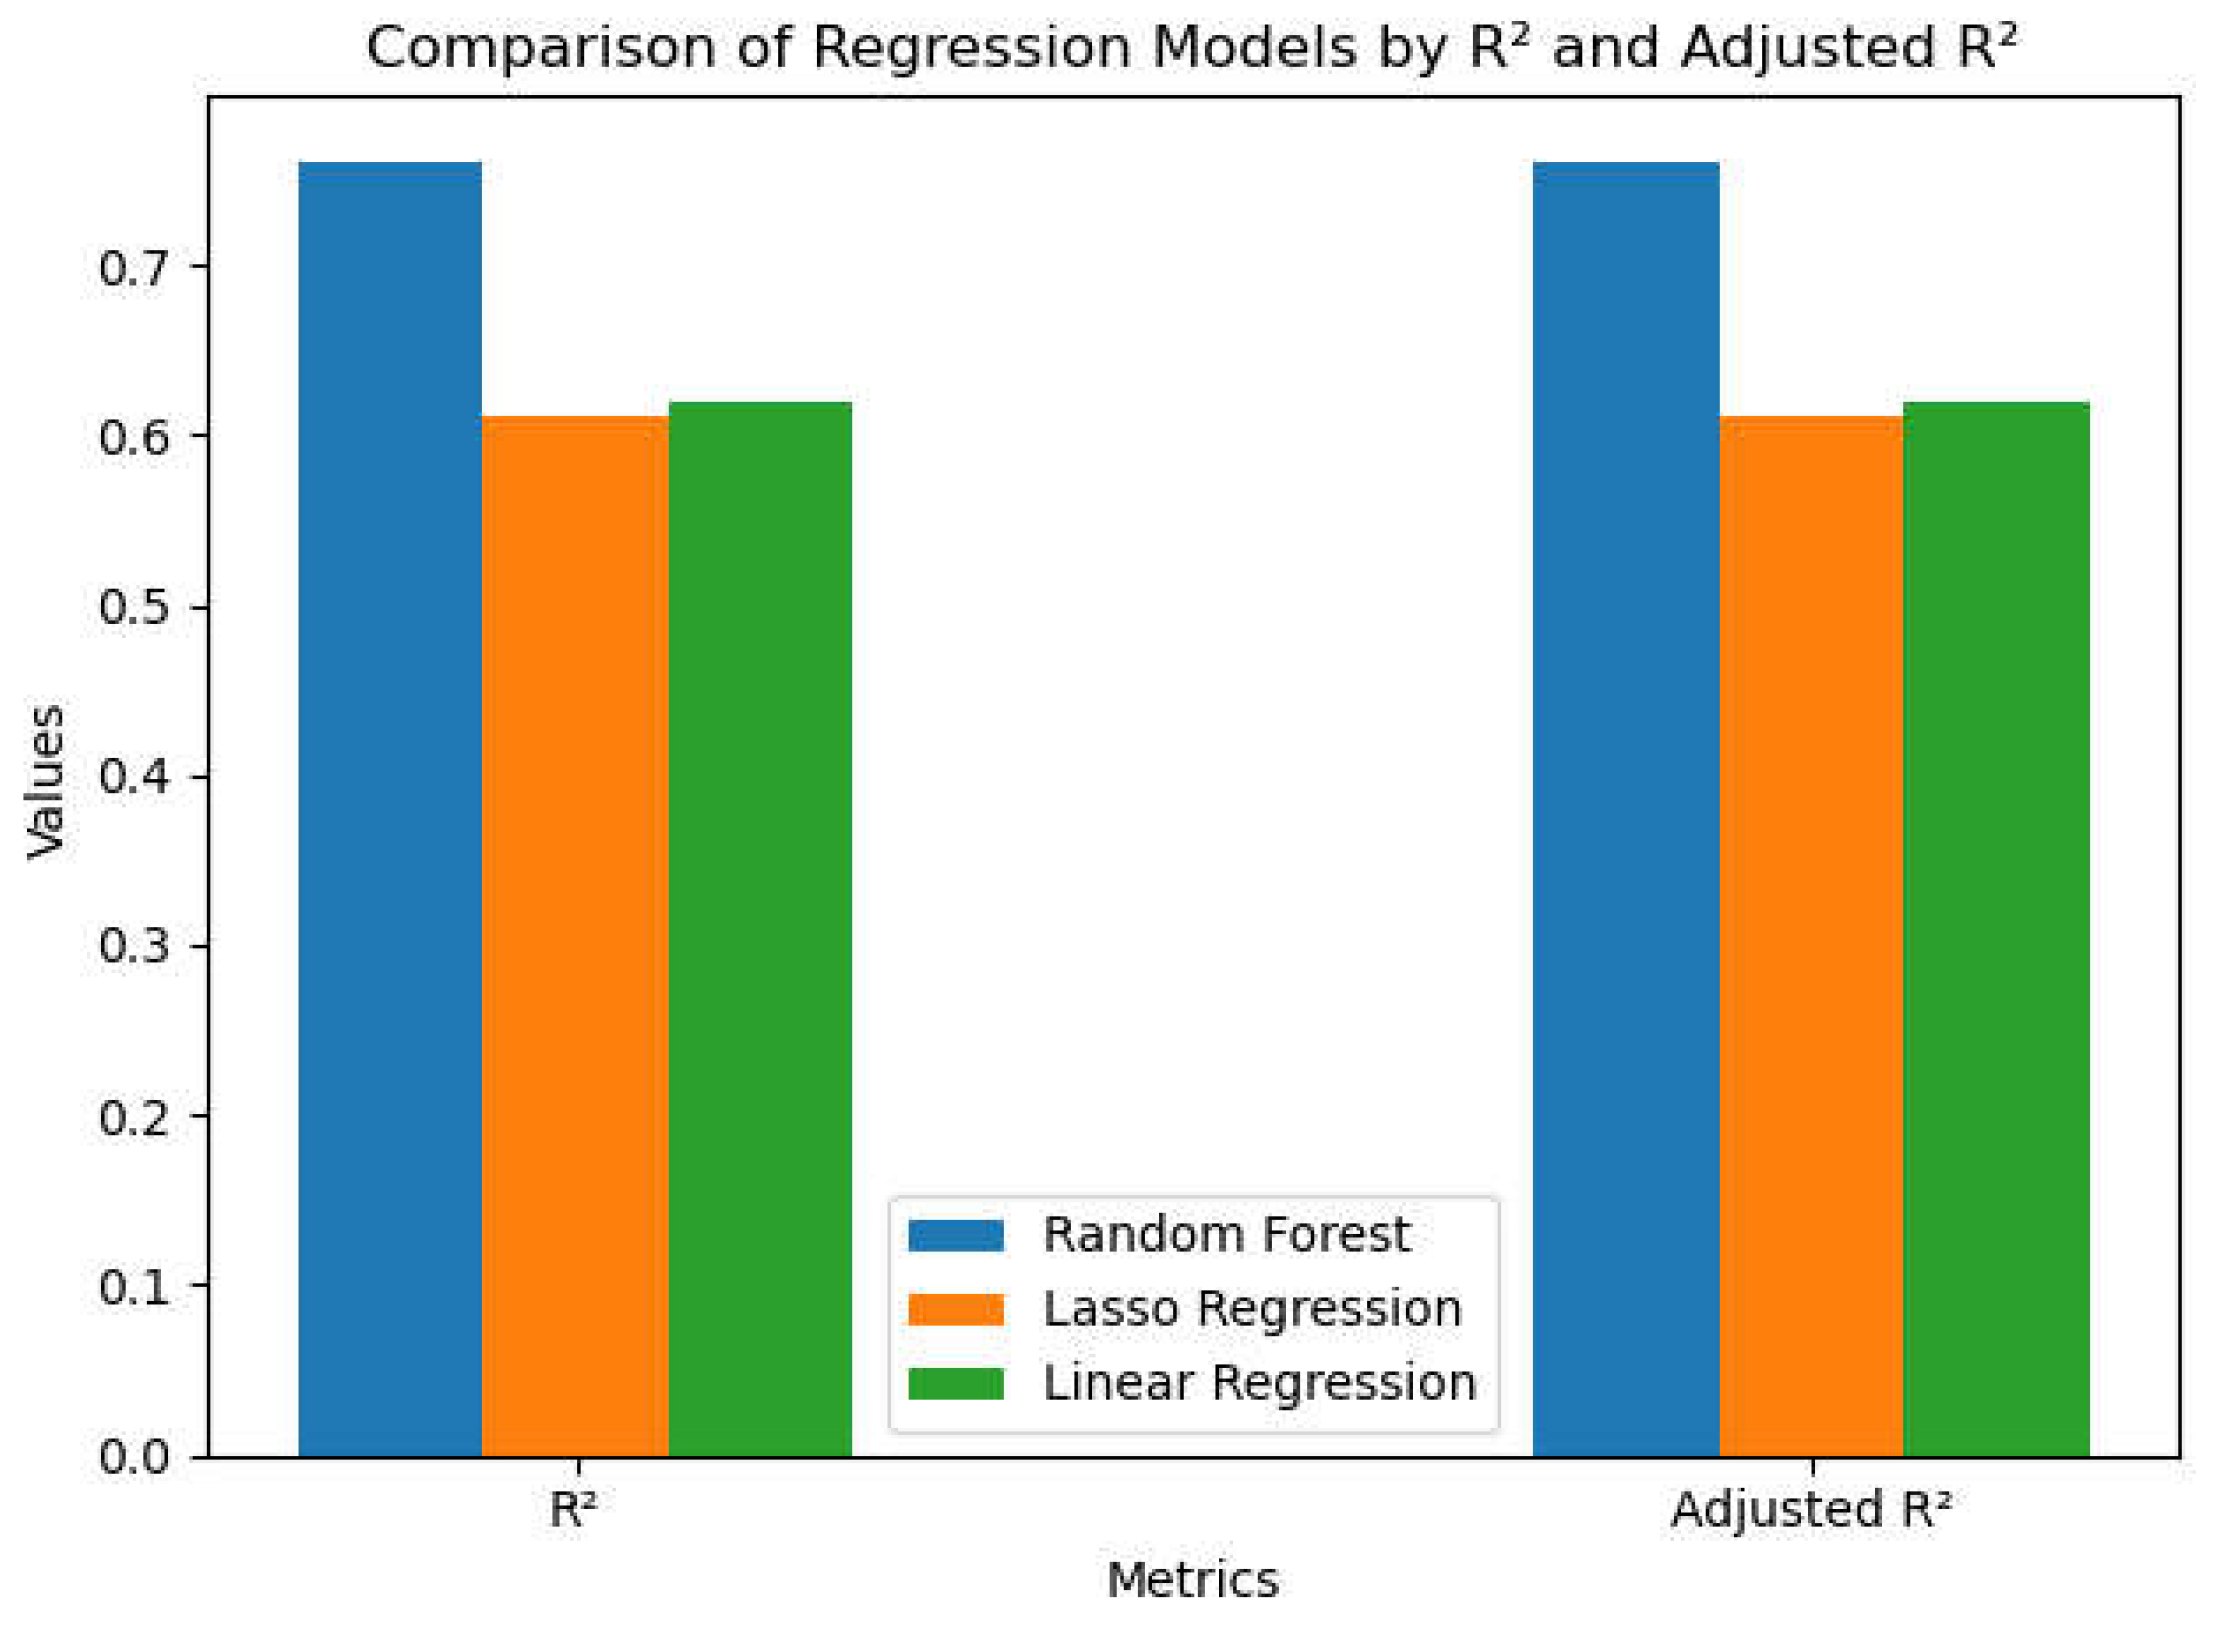
- R2 and Adjusted R2: Random Forest exhibits enhanced predictive capability, evidenced by significantly elevated R2 and Adjusted R2 values relative to Linear and Lasso models. Both Linear and Lasso regressions exhibit comparable performance; however, Lasso slightly underperforms Linear Regression due to the effects of regularization. On Figure 16, the blue bar represents the RFR, the orange bar represents the LASSO regression, and the green bar represents Linear regression.
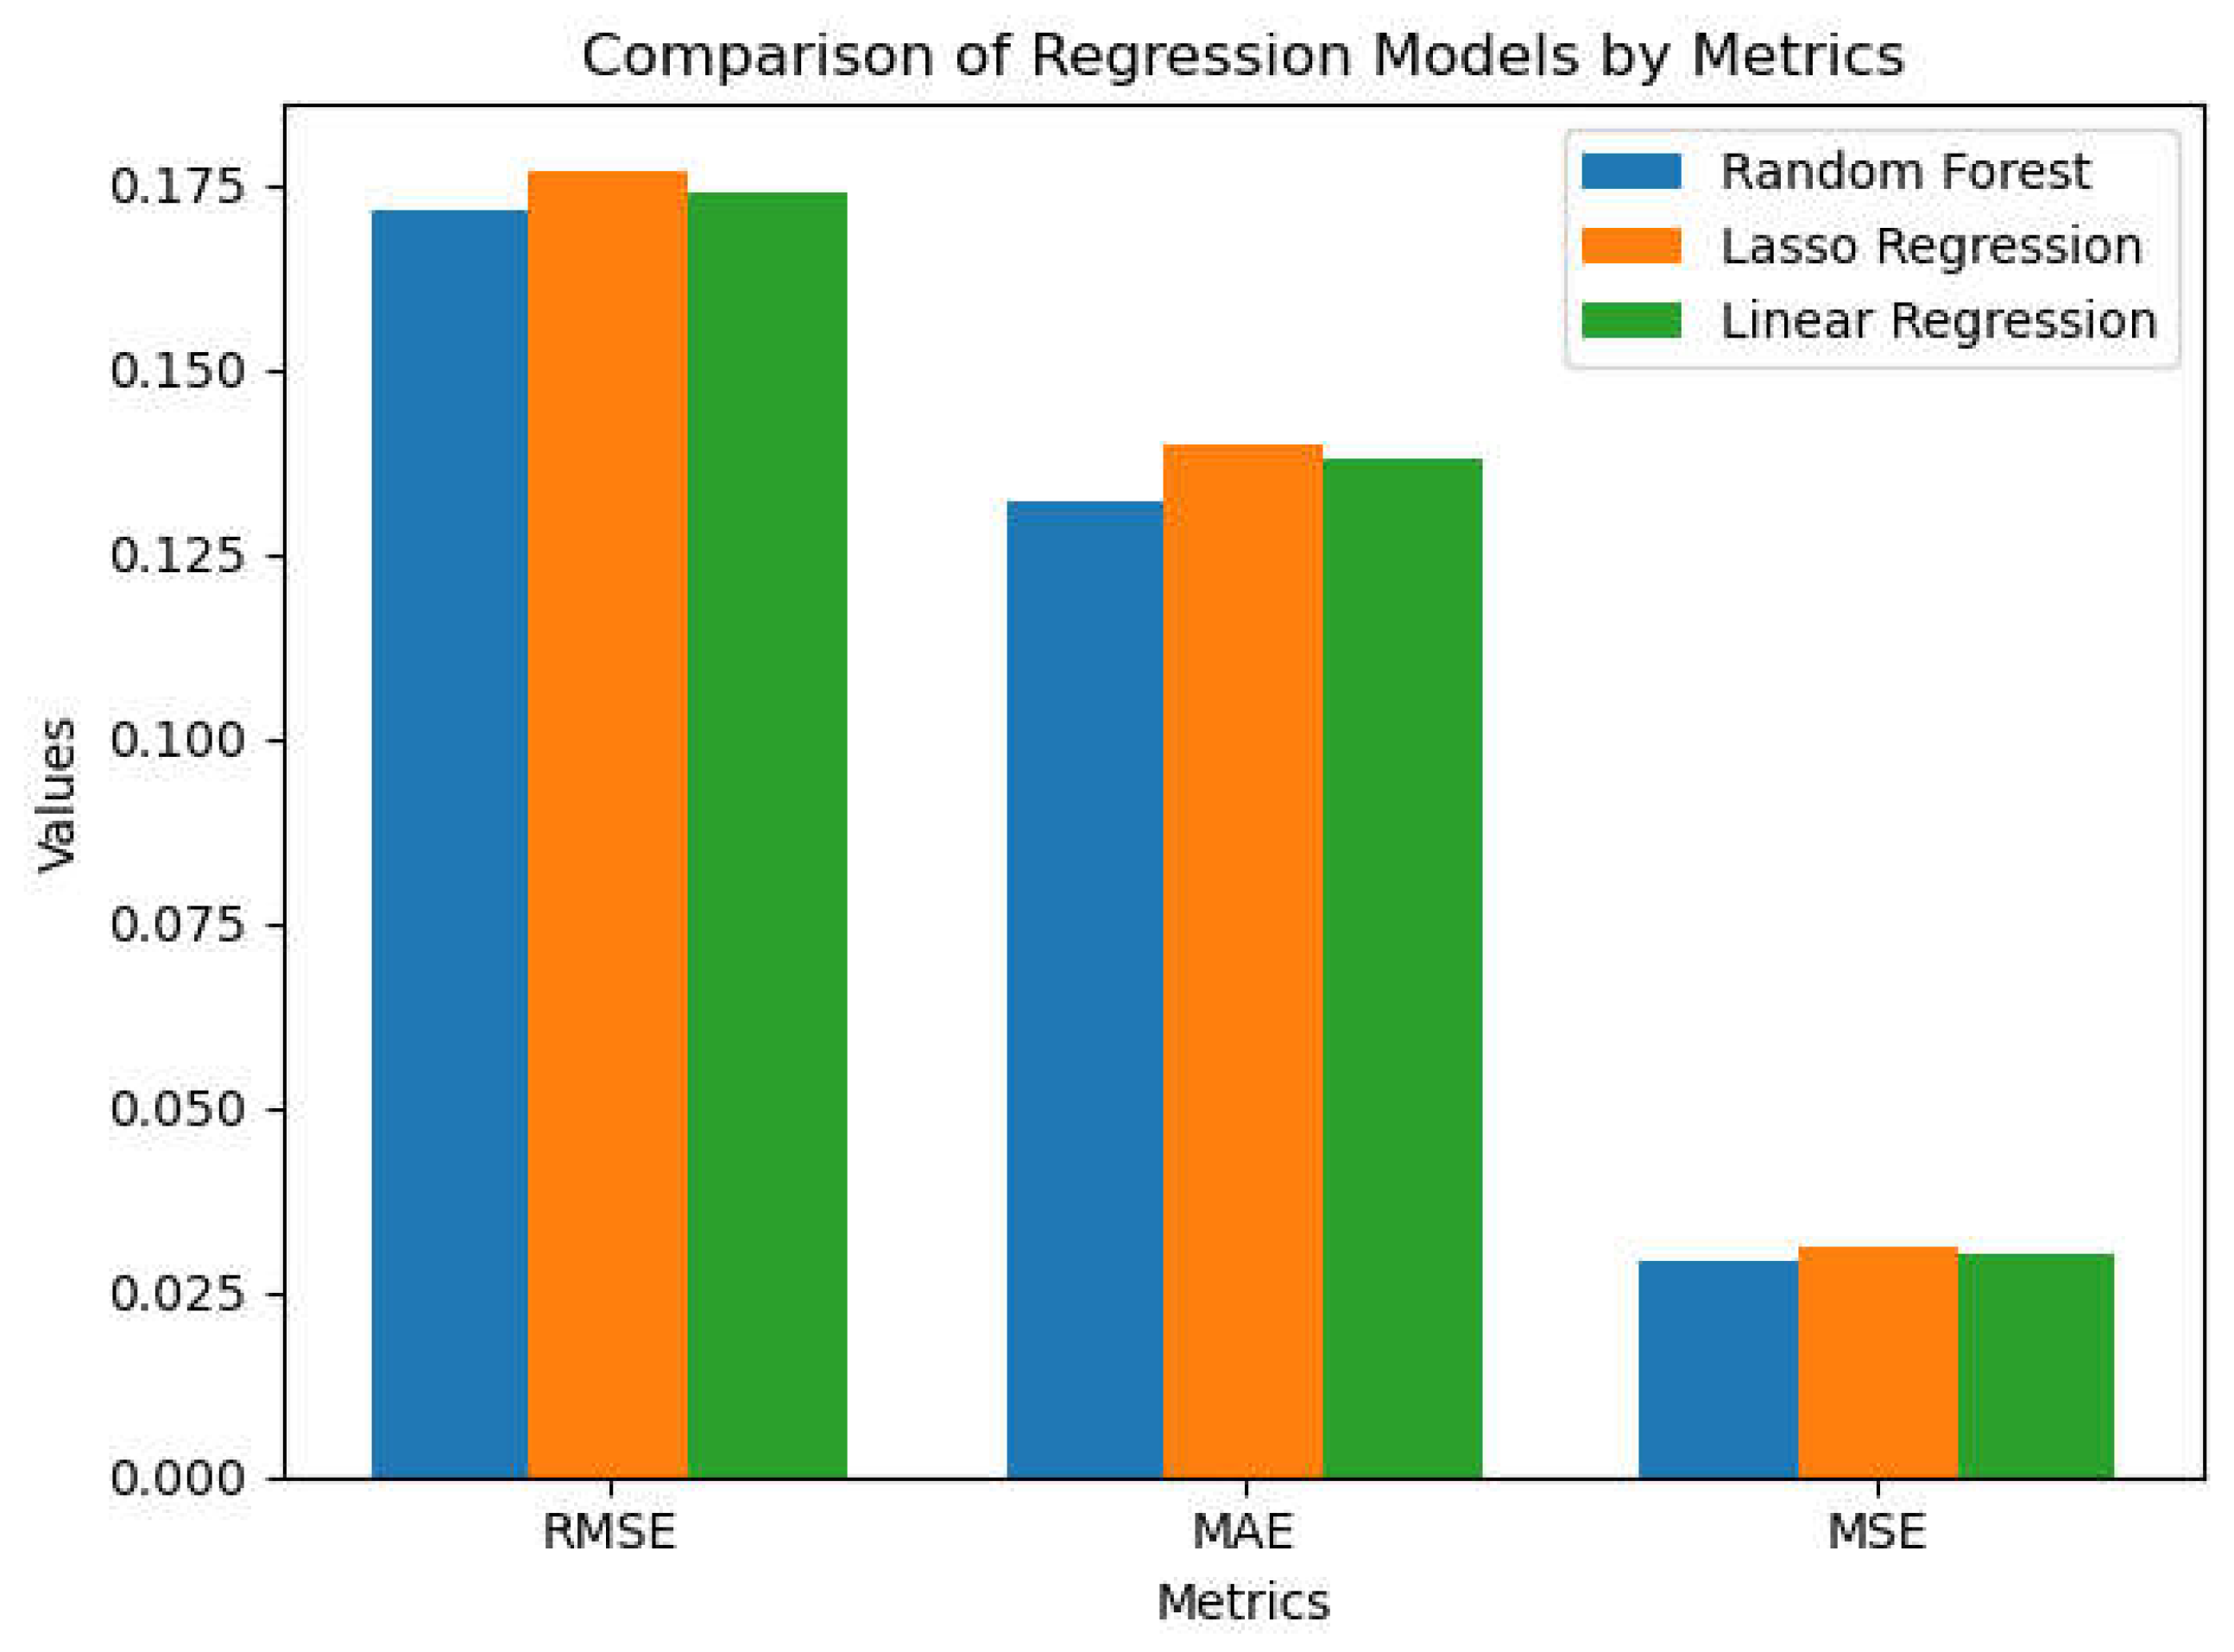
- MSE, RMSE, and MAE: The Random Forest model exhibits significantly lower MSE, RMSE, and MAE, underscoring its enhanced accuracy and diminished prediction errors. Linear Regression and Lasso have similar performance, while Lasso demonstrates somewhat inferior outcomes due to its penalization of certain characteristics. The differences are minimal, as evidenced by the proximity of each bar’s heights in Figure 17, but they have a significant impact.
4.1. Cross-Validation Results
- R2 and Adjusted R2: The Random Forest algorithm has improved performance on average over cross-validation folds, however it displays significantly greater variability than on the test set. Linear Regression exhibits marginally superior performance compared to Lasso in cross-validation, although the disparity is negligible.
- MSE, RMSE, and MAE: Random Forest consistently surpasses both linear and Lasso regressions in terms of MSE, RMSE, and MAE throughout cross-validation folds, exhibiting a narrower error range. Linear Regression exhibits marginally superior cross-validation performance compared to Lasso; yet, both models demonstrate considerable stability with minimal discrepancies in error.
4.1. Model Complexity and Interpretability
- Linear Regression: Linear regression is the most elementary of the three models, yielding highly interpretable outcomes with direct coefficients that represent the correlation between features and the target variable. Nonetheless, it may encounter difficulties in capturing intricate, non-linear interactions.
- Random Forest Regression: Random Forest is an advanced, non-linear model that identifies relationships among variables and accommodates intricate patterns within the data. Nonetheless, it compromises interpretability for enhanced efficiency, as the aggregation of decision trees complicates the understanding of each feature’s individual impact.
- Lasso Regression: Employs regularization to penalize insignificant characteristics, hence potentially streamlining the model by removing unimportant variables. This enhances interpretability and mitigates overfitting. Nonetheless, it fails to account for non-linearity in the data.
5. Conclusions
Author Contributions
Funding
Conflicts of Interest
Abbreviations
| Adjusted R2 | Adjusted Coefficient of Determination |
| ANOVA | Analysis of Variance |
| ANNs | Artificial Neural Networks |
| AWGN | Additive White Gaussian Noise |
| CART | Categorical Regression Tree |
| CM | Configuration Management |
| CMS | Content Management Systems |
| CNNs | Convolutional Neural Networks |
| CPS | Cyber-Physical System |
| CRM | Customer Resource Management |
| ERP | Enterprise Resource Planning |
| IoE | Internet of Everything |
| IoT | Internet of Things |
| kNN | k-Nearest Neighbors |
| KPI | Key Performance Indicator |
| LCoE | Levelized Cost of Energy |
| LR | Linear Regression |
| LSTM | Long Short-Term Memory |
| MAE | Mean Absolute Error |
| M2M | Machine to Machine |
| ML | Machine Learning |
| MLR | Multilinear Regression |
| MSE | Mean Squared Error |
| R2 | Coefficient of Determination |
| RFR | Random Forest Regression |
| RMSE | Root Mean Squared Error |
| RNNs | Recurrent Neural Networks |
| SCADA | Supervisory Control and Data Acquisition |
| WECS | Wind Energy Conversion System |
References
- Mohammed, N. Q.; Ahmed, M. S.; Mohammed, M. A.; Hammood, O. A.; Alshara, H. A. N.; Kamil, A. A. Comparative Analysis between Solar and Wind Turbine Energy Sources in IoT Based on Economical and Efficiency Considerations. 22nd International Conference on Control Systems and Computer Science (CSCS), Bucharest, Romania, 2019, pp. 448–452.
- Kaur, N.; Sood, S.K. An Energy-Efficient Architecture for the Internet of Things (IoT). IEEE Syst. J. 2017, 11, 796–805. [Google Scholar] [CrossRef]
- Adekanbi, M.L. Optimization and digitization of wind farms using internet of things: A review. Internet of Things 2021, 45, 15832–15838. [Google Scholar] [CrossRef]
- Noor-A-Rahim, M.; Khyam, M. O.; Li, X.; Pesch, D. Sensor Fusion and State Estimation of IoT Enabled Wind Energy Conversion System. Sensors 2019, 19, 71566. [Google Scholar] [CrossRef] [PubMed]
- Karaman, Ö.A. Prediction of Wind Power with Machine Learning Models. Appl. Sci. 2023, 13, 11455. [Google Scholar]
- Demolli, H.; Dokuz, A. S.; Ecemis, A.; Gokcek, M. Wind power forecasting based on daily wind speed data using machine learning algorithms. Energy Convers. Manag. 2019, 198, 111823. [Google Scholar] [CrossRef]
- Alhmoud, L.; Al-Zoubi, H. IoT Applications in Wind Energy Conversion Systems. Open Eng. 2019, 9, 490–499. [Google Scholar] [CrossRef]
- Shields, M.; Beiter, P.; Nunemaker, J.; Cooperman, A.; Duffy, P. Impacts of Turbine and Plant Upsizing on the Levelized Cost of Energy for Offshore Wind. Appl. Energy 2021, 298, 117189. [Google Scholar] [CrossRef]
- Moness, M.; Moustafa, A.M. A Survey of Cyber-Physical Advances and Challenges of Wind Energy Conversion Systems: Prospects for Internet of Energy. IEEE Internet Things J. 2016, 3, 134–145. [Google Scholar] [CrossRef]
- Ahmed, M. A.; Eltamaly, A. M.; Alotaibi, M. A.; Alolah, A. I.; Kim, Y. C. Wireless Network Architecture for Cyber Physical Wind Energy System. IEEE Access 2020, 8, 40180–40197. [Google Scholar] [CrossRef]
- Maldonado-Correa, J.; Martín-Martínez, S.; Artigao, E.; Gómez-Lázaro, E. Using SCADA Data for Wind Turbine Condition Monitoring: A Systematic Literature Review. Energies 2020, 13, 3132. [Google Scholar] [CrossRef]
- Chen, H.; Chen, J.; Dai, J.; Tao, H.; Wang, X. Early Fault Warning Method of Wind Turbine Main Transmission System Based on SCADA and CMS Data. Machines 2022, 10, 1018. [Google Scholar] [CrossRef]
- Chen, X.; Eder, M. A.; Shihavuddin, A. S. M.; Zheng, D. A Human-Cyber-Physical System toward Intelligent Wind Turbine Operation and Maintenance. Sustainability 2021, 13, 561. [Google Scholar] [CrossRef]
- Win, L.L.; Tonyalı, S. Security and Privacy Challenges, Solutions, and Open Issues in Smart Metering: A Review. In Proceedings of the 2021 6th International Conference on Computer Science and Engineering (UBMK), IEEE 2021. [Google Scholar]
- Cox, S. L.; Lopez, A. J.; Watson, A. C.; Grue, N. W.; Leisch, J. E. Renewable Energy Data, Analysis, and Decisions: A Guide for Practitioners. National Renewable Energy Lab. (NREL), Golden, CO (United States).
- Pontes, E.A.S. A Brief Historical Overview Of the Gaussian Curve: From Abraham De Moivre to Johann Carl Friedrich Gauss. Int. J. Eng. Sci. Invent. 2018, 7, 28–34. [Google Scholar]
- Scikit-learn: Machine Learning in Python. 2024.
- Kwak, S.K.; Kim, J.H. Statistical data preparation: management of missing values and outliers. Korean J. Anesthesiol. 2017, 70, 407–411. [Google Scholar] [CrossRef] [PubMed]
- Gu, Z.; Eils, R.; Schlesner, M. Complex heatmaps reveal patterns and correlations in multidimensional genomic data. Bioinformatics 2016, 32, 2847–2849. [Google Scholar] [CrossRef]
- Famoso, F.; Oliveri, L. M.; Brusca, S.; Chiacchio, F. A Dependability Neural Network Approach for Short-Term Production Estimation of a Wind Power Plant. Energies 2024, 17, 71627. [Google Scholar] [CrossRef]
- Ahsan, M. M.; Mahmud, M. P.; Saha, P. K.; Gupta, K. D.; Siddique, Z. Effect of Data Scaling Methods on Machine Learning Algorithms and Model Performance. Technologies 2021, 9, 52. [Google Scholar] [CrossRef]
- Alkesaiberi, A.; Harrou, F.; Sun, Y. Efficient Wind Power Prediction Using Machine Learning Methods: A Comparative Study. Energies 2022, 15, 72327. [Google Scholar] [CrossRef]
- Palmer, P.B.; O’Connell, D.G. Research Corner: Regression Analysis for Prediction: Understanding the Process. J. Chiropr. Med. 2009, 8, 89–93. [Google Scholar] [CrossRef]
- James, G.; Witten, D.; Hastie, T.; Tibshirani, R. Linear regression. An Introduction to Statistical Learning, 2nd ed.; Springer: New York, NY, USA, 2023; pp. 69–134. [Google Scholar]
- Roelofs, R., Shankar, V., Recht, B., Fridovich-Keil, S., Hardt, M., Miller, J., & Schmidt, L. A Meta-Analysis of Overfitting in Machine Learning. In Proceedings of the 36th Conference on Neural Information Processing Systems (NeurIPS 2019), Vancouver, BC, Canada, 8–14 December 2019, 32.
- Xiong, Z. , Cui, Y. , Liu, Z., Zhao, Y., Hu, M., & Hu, J. Evaluating explorative prediction power of machine learning algorithms for materials discovery using k-fold forward cross-validation. Comput. Mater. Sci. 2020, 171, 109203. [Google Scholar]
- Maulud, D.; Abdulazeez, A.M. A Review on Linear Regression Comprehensive in Machine Learning. J. Appl. Sci. Technol. Trends 2020, 1, 140–147. [Google Scholar] [CrossRef]
- Filzmoser, P. , & Nordhausen, K. Robust linear regression for high-dimensional data: An overview. Wiley Interdiscip. Rev. Comput. Stat. 2021, 13, e1524. [Google Scholar]
- Breiman, L. Random Forests. Mach. Learn. 2001, 45, 5–32. [Google Scholar] [CrossRef]
- Cutler, A.; Zhao, G. Pert-Perfect Random Tree Ensembles. Comput. Sci. Stat. 2001, 33, 90–94. [Google Scholar]
- Lingjun, H.; Levine, R. A.; Fan, J.; Beemer, J.; Stronach, J. Random Forest as a predictive analytics alternative to regression in institutional research. Pract. Assess. Res. Eval. 2018, 23, 1–10. [Google Scholar]
- Sadorsky, P. A Random Forests Approach to Predicting Clean Energy Stock Prices. J. Risk Financial Manag. 2021, 14, 20048. [Google Scholar] [CrossRef]
- Aljuboori, A.; Abdulrazzq, M.A. Enhancing Accuracy in Predicting Continuous Values through Regression. Int. J. Comput. Dig. Syst. 2024, 16, 1–10. [Google Scholar]
- Steurer, M.; Hill, R.J.; Pfeifer, N. Metrics for evaluating the performance of machine learning based automated valuation models J. Prop. Res. 2021, 38, 99–129. [Google Scholar] [CrossRef]
- Ranstam, J.; Cook, J.A. Lasso regression. Br. J. Surg. 2018, 105, 1348. [Google Scholar] [CrossRef]
- Lind, S.J.; Rogers, B.D.; Stansby, P.K. Review of Smoothed Particle Hydrodynamics: Towards Converged Lagrangian Flow Modelling. Proc. R. Soc. A 2020, 476, 20190801. [Google Scholar] [CrossRef]
- Tatachar, A.V. Comparative Assessment of Regression Models Based on Model Evaluation Metrics. Int. J. Innov. Technol. Explor. Eng. 2021, 8, 853–860. [Google Scholar]


| Columns | Null values |
|---|---|
|
Time temperature_2m |
43800 non-null datetime64 43800 non-null float64 |
|
relativehumidity_2m dewpoint_2m windspeed_10m windspeed_100m winddirection_10m winddirection_100m windgusts_10m Power Year Month Day |
43800 non-null int64 43800 non-null float64 43800 non-null float64 43800 non-null float64 43800 non-null int64 43800 non-null int64 43800 non-null float64 43800 non-null float64 43800 non-null int32 43800 non-null int32 43800 non-null object |
| Columns | Null values |
|---|---|
| temperature_2m | 0 |
| relativehumidity_2m dewpoint_2m windspeed_10m windspeed_100m winddirection_10m winddirection_100m windgusts_10m Power Year Month |
0 0 0 0 0 0 0 0 0 0 |
| Columns | Removed Outliers |
|---|---|
| temperature_2m | 5 |
| relativehumidity_2m dewpoint_2m windspeed_10m windspeed_100m winddirection_10m winddirection_100m windgusts_10m Power Year Month |
11 0 318 199 0 0 337 Not included Not included Not included |
| Models | R2 | Adjusted R2 | MSE | RMSE | MAE |
|---|---|---|---|---|---|
| Linear Regression | 0.6199 | 0.6194 | 0.0303 | 0.1741 | 0.1376 |
| Random Forest Regression | 0.7608 | 0.7606 | 0.0294 | 0.1715 | 0.1320 |
| Lasso Regression | 0.6110 | 0.6108 | 0.0313 | 0.1769 | 0.1399 |
Disclaimer/Publisher’s Note: The statements, opinions and data contained in all publications are solely those of the individual author(s) and contributor(s) and not of MDPI and/or the editor(s). MDPI and/or the editor(s) disclaim responsibility for any injury to people or property resulting from any ideas, methods, instructions or products referred to in the content. |
© 2024 by the authors. Licensee MDPI, Basel, Switzerland. This article is an open access article distributed under the terms and conditions of the Creative Commons Attribution (CC BY) license (http://creativecommons.org/licenses/by/4.0/).


