Preprint
Article

BOANN: Bayesian-Optimized Attentive Neural Network for Classification

Altmetrics

Downloads

85

Views

99

Comments

0

Submitted:

29 September 2024

Posted:

30 September 2024

You are already at the latest version

Alerts
Abstract
This study presents the Bayesian-Optimized Attentive Neural Network (BOANN), a novel approach enhancing image classification performance by integrating Bayesian optimization with channel and spatial attention mechanisms. Traditional image classification struggles with the extensive data in today's big data era. Bayesian optimization has been integrated into neural networks in recent years to enhance model generalization, while channel and spatial attention mechanisms improve feature extraction capabilities. This paper introduces a model combining Bayesian optimization with these attention mechanisms to boost image classification performance. Bayesian optimization optimizes hyperparameter selection, accelerating model convergence and accuracy; the attention mechanisms augment feature extraction. Compared to traditional deep learning models, our model utilizes attention mechanisms for initial feature extraction, followed by a Bayesian-optimized neural network. On the CIFAR-100 dataset, our model outperforms classical models in metrics such as accuracy, loss, precision, recall, and F1 score, achieving an accuracy of 77.6%. These technologies have potential for broader application in image classification and other computer vision domains.
Keywords: 
Subject: Computer Science and Mathematics  -   Computer Science

I. Introduction

Image classification is one of the basic tasks of computer vision, that is, given an input image, a certain classification algorithm is used to determine the category to which the image belongs. There are many ways to classify images, and different classification results will be obtained based on different classification standards. The main processes of image classification include image preprocessing, image feature description and extraction, and classifier design. Preprocessing includes image filtering (such as median filtering, mean filtering, Gaussian filtering, etc.) and normalization operations, whose purpose is to facilitate the subsequent processing of the target image. Image features are descriptions of its salient attributes, and each image has unique characteristics [1,2,3,4,5,6]. Feature extraction is to select and extract appropriate features according to the established classification method based on the characteristics of the image itself. A classifier is an algorithm that classifies target images based on selected features.
Traditional image classification methods are processed according to the above process. Their performance differences mainly depend on feature extraction and classifier selection. The features in traditional image classification algorithms are all manually selected. Commonly used image features include low-level visual features such as shape, texture, and color, as well as local invariant features such as scale-invariant feature transforms , local binary pattern, and oriented gradient histograms [7,8,9]. Although these features have a certain degree of universality, they are not very targeted to specific images and specific division methods. In addition, for images of some complex scenes, it is very difficult to find artificial features that can accurately describe the target image. Traditional classifiers include K nearest neighbors and support vector machines [10,11]. For some simple image classification tasks, these classifiers are simple to implement and have good results. However, when the category differences are subtle or the image interference is serious, their classification accuracy drops significantly. Therefore, traditional classifiers are not suitable for the classification of complex images.
With the advent of the intelligent information age, deep learning has emerged. As a branch of machine learning, deep learning aims to simulate the human neural network system, build a deep artificial neural network, analyze and interpret the input data, and combine the underlying features of the data into abstract high-level features. This technology has played an irreplaceable role in artificial intelligence fields such as computer vision and natural language processing. As a typical representative of deep learning, the Deep Convolutional Neural Network (DCNN) performs well in computer vision tasks [33]. For example, in autonomous driving, CNNs have improved image recognition, environment perception, and path planning [34]. Similarly, methods like Class Probability Space Regularization (CPSR) have enhanced pixel-level precision in semantic segmentation [35]. Techniques like Multiple Distributions Representation Learning (MDRL) have further refined segmentation in complex scenes [36]. In the field of medical image recognition, deep learning systems have been used to automatically identify features in images, improving diagnostic accuracy in tasks like tumor detection [48]. In cybersecurity and defense, AI and ML have shown great potential in boosting data security and defense capabilities through faster threat detection, predictive analysis, and strategic decision-making. Recent advancements in remote sensing image segmentation with U-Net enhancements using SimAM and CBAM, along with Transformer-based multimodal approaches in healthcare that combine imaging data with clinical reports, have significantly improved segmentation accuracy and stroke treatment outcome predictions over single-modality models [50,51,52,53].
Compared with traditional image classification algorithms that rely on manual feature extraction, convolutional neural networks extract features from input images through convolution operations, and can effectively learn feature expressions from a large number of samples, thereby enhancing the generalization ability of the model.
Figure 1 shows a classic neural network structure with three levels. The number of nodes in the input layer and the output layer is often fixed, and the number of nodes in the middle layer can be freely specified. The topology and arrows in the neural network structure diagram represent the data flow in the prediction process; the key in the structure diagram is not the circle (representing the neuron), but the connecting line (representing the connection between neurons), each connecting line corresponds to a different weight (its value is called weight), which needs to be trained.
Among the many neural network models, AlexNet, GoogleNet, VGG16 and ResNet are classic representative architectures that have achieved breakthrough results in large-scale image recognition tasks [12,13,14,15]. These models have demonstrated exceptional performance in real-world applications, including optimizing GPU partitioning techniques in autonomous systems to achieve better control performance [37]. Additionally, methods like Bayesian optimization have shown tremendous success in tasks such as black-box model optimization, where Neural Processes are used to address the challenges of large parameter spaces and numerous observations [38]. The introduction of these models not only promoted the development of deep learning research, but also demonstrated strong performance in practical applications [30,31,32].
Although these classic deep learning models have performed well in image classification tasks, as application requirements increase and data scale expands, how to further improve the performance of neural networks remains an important research direction. In recent years, Bayesian optimization, channel attention mechanism, and spatial attention mechanism have received widespread attention as effective means to improve the performance of neural networks. Bayesian optimization efficiently searches for optimal hyperparameters by constructing a proxy model, while channel attention mechanism and spatial attention mechanism enhance the representation ability of the model by adaptively adjusting important information in the feature map [28,29]. For instance, in remote sensing, location-refined feature pyramid networks (LR-FPNs) have enhanced the ability to extract positional information, leading to improvements in object detection tasks [39].
Bayesian optimization has been applied in real-world settings, such as retail, where deep learning systems using optimized YOLOv10 models have improved product recognition accuracy and checkout speed [40]. Parameter-efficient transfer learning methods like the VMT-Adapter have also enhanced multi-task vision performance in dense scene understanding with minimal overhead [41]. Additionally, multi-modal learning frameworks like the Multi-modal Alignment Prompt (MmAP) have boosted task complementarity while reducing trainable parameters [42].
Innovative approaches such as self-training with label-feature consistency (ST-LFC) have tackled domain adaptation challenges, significantly improving benchmark performance [43]. Similarly, advanced pedestrian detection methods like V2F-Net, which handle occluded pedestrian detection by separating visible region detection and full-body estimation, have shown superior results [44]. Duality-based approaches for regret minimization in Markov decision processes have demonstrated sublinear regret in decision-making strategies [45]. Visual defect detection models leveraging confident learning techniques have addressed noisy, imbalanced data in industrial applications [46]. Lastly, multi-modal deep learning methods have enabled more accurate classification of repairable defects, especially by fusing tabular and image data [47]. K-means clustering enhanced Support Vector Machine (SVM), have also been employed to improve classification performance in robotics tasks [49].
This paper aims to reproduce the classic neural network models AlexNet, GoogleNet, VGG16 and ResNet, and on this basis, design and implement an improved model that combines Bayesian optimization, channel attention and spatial attention. Through experimental comparison, this paper will analyze and verify the performance advantages of the improved model in image classification tasks.

II. Methods

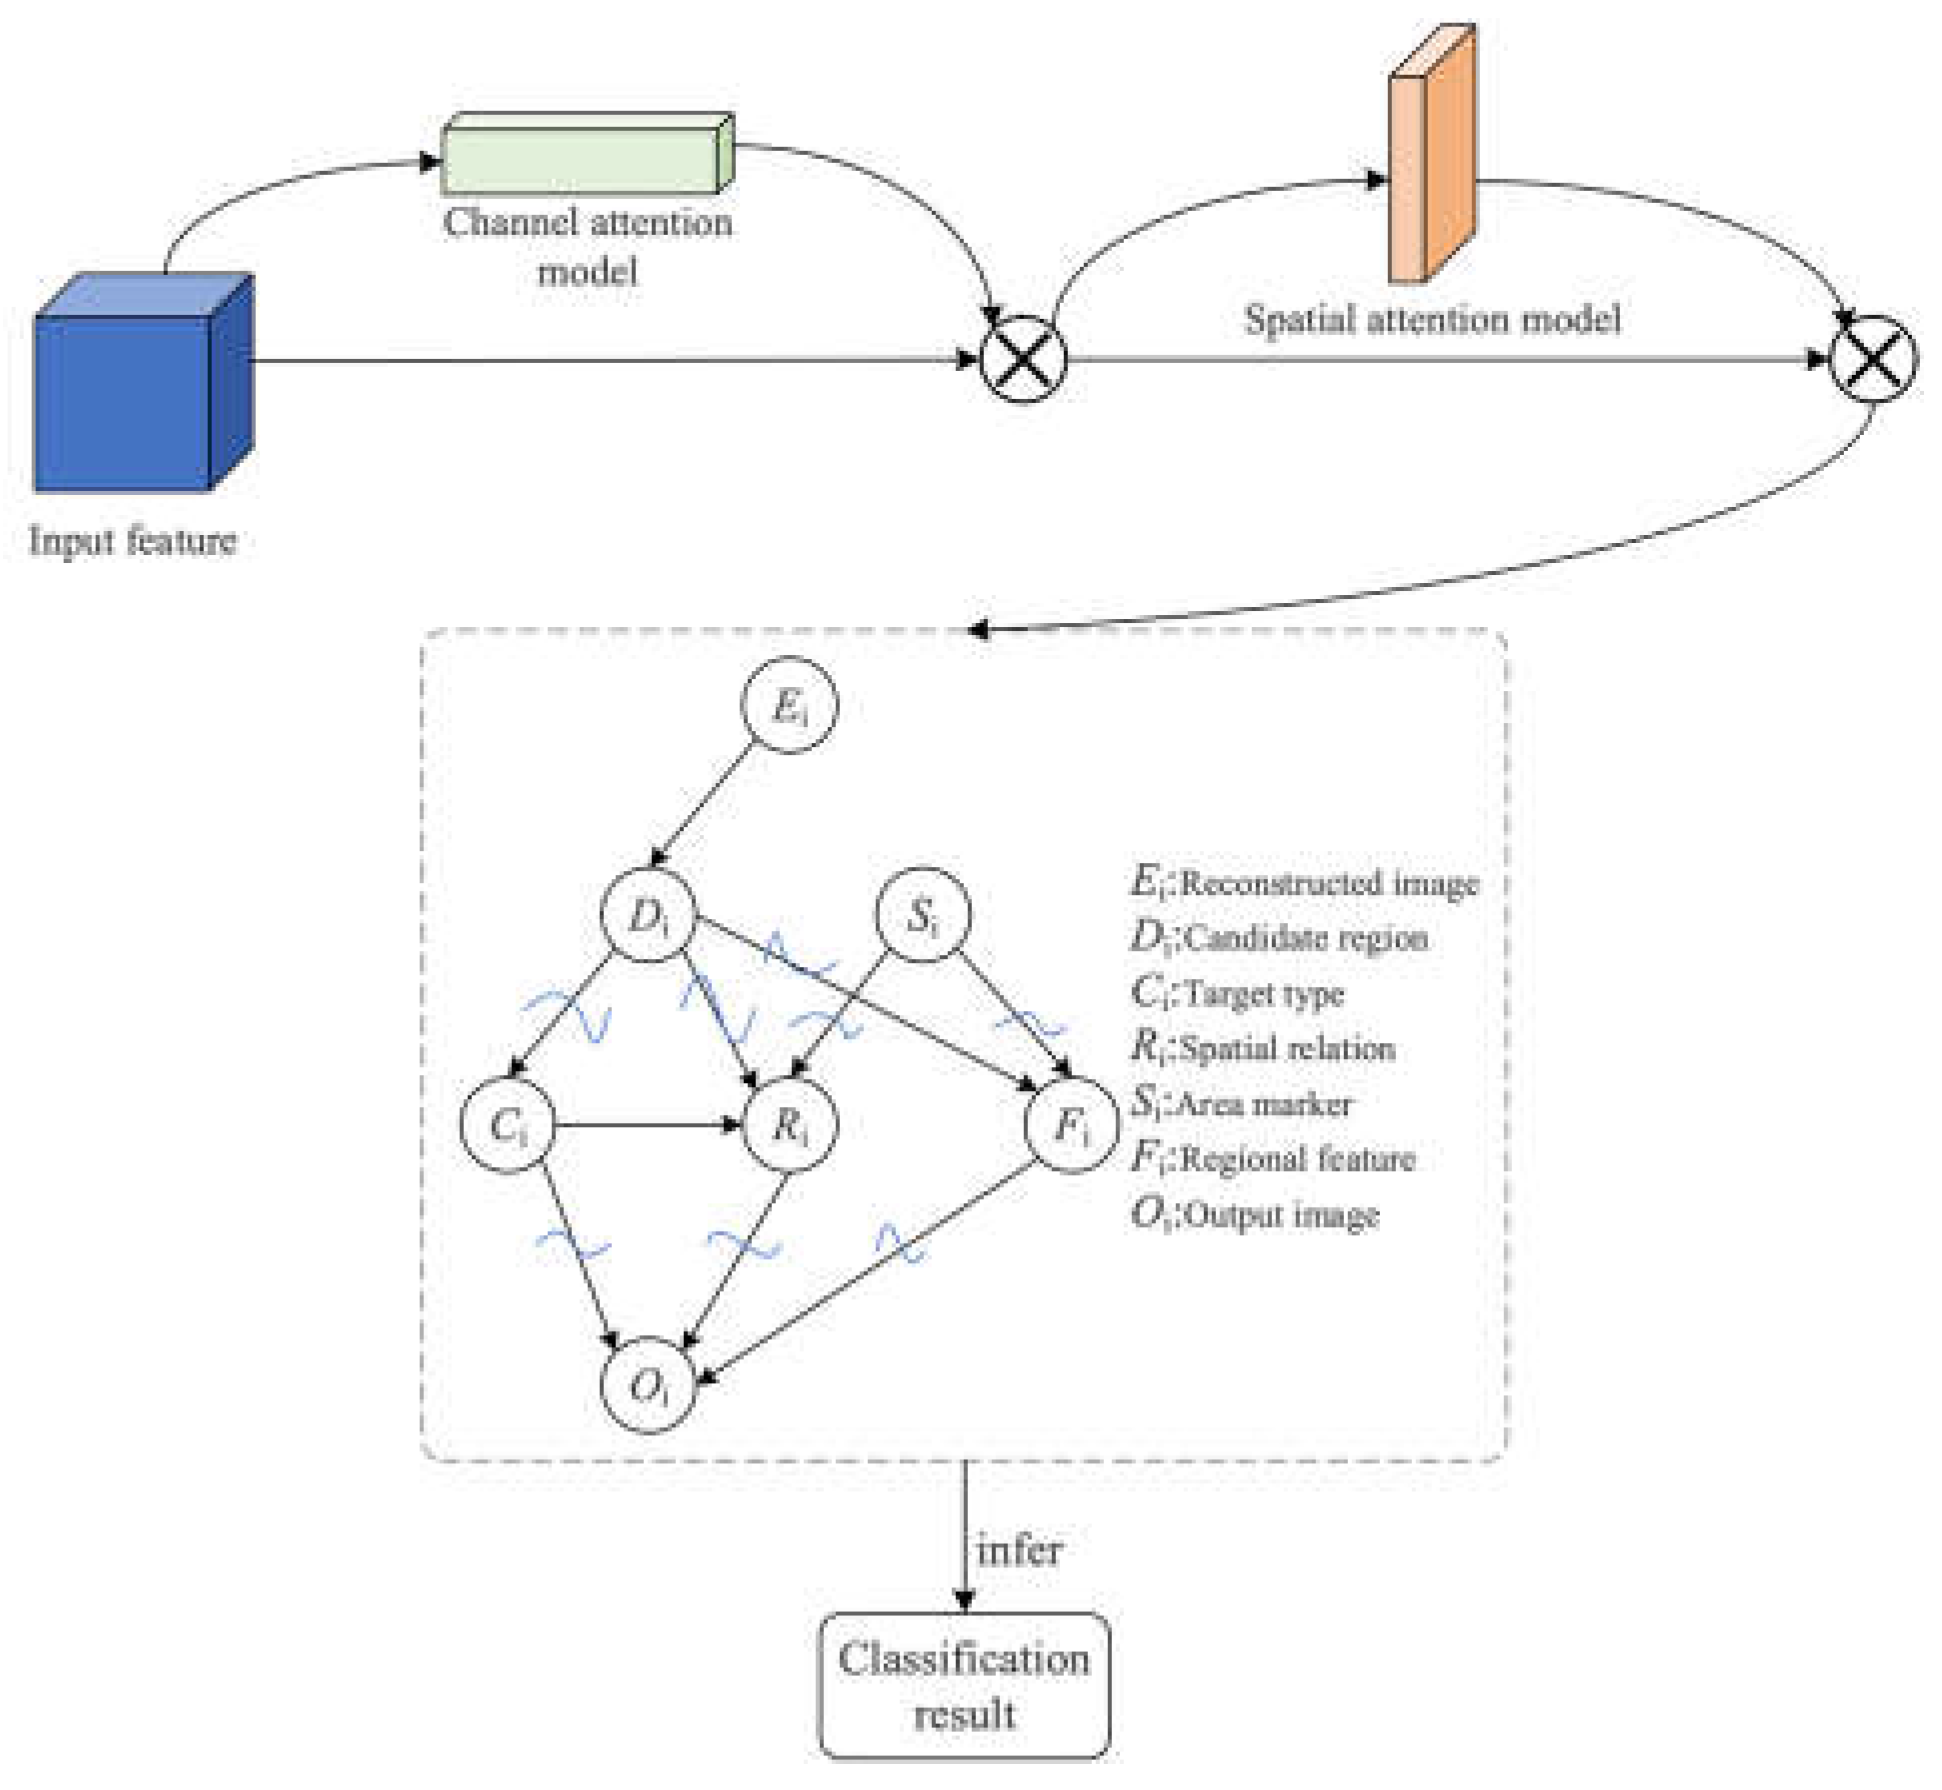
In this chapter, we will introduce our proposed method in detail. The network mainly includes channel attention mechanism, spatial attention mechanism and neural network based on Bayesian optimization. First, the input features are processed by the channel attention model and the spatial attention model respectively to extract relevant feature information. The network weights based on Bayesian optimization are not traditional weight values, but are replaced by probability distribution, which greatly increases the generalization ability of the network. Such a model design not only increases the feature extraction capability, but also increases the classification performance of unknown data. Figure 2 shows the classification network structure proposed in this paper.

A. Bayesian Optimization

In the practice of machine learning and deep learning, the tuning of model parameters is a key step. Common hyperparameters include learning rate, regularization coefficient, number of network layers, number of neurons in each layer, etc. Appropriate parameter configuration can significantly improve the performance of the model. In order to find these optimal parameters, researchers have developed a variety of optimization methods, such as grid search, random search, and Bayesian optimization.
Bayesian optimization is a global optimization algorithm based on Bayesian theorem, which is applicable to situations where the objective function is difficult to calculate or the computational cost is high. The core idea is to guide the search process by establishing a probability model of the objective function, so as to find the parameter configuration that makes the objective function achieve the optimal value. Specifically, in Bayesian optimization, we first assume that the objective function f obeys a Gaussian process (GP), which is in the form of this:
Preprints 119719 i001
where is the mean function, usually set to zero, and is the kernel function that describes the similarity between any two points. Based on the current observation data , the posterior distribution of the Gaussian process can then be updated:
Preprints 119719 i002
The mean function and variance function are:
Preprints 119719 i003
In each iteration, we select a point that is most likely to improve performance for evaluation based on the current probability model of the objective function. After the evaluation is completed, we add the new observations to the model and update the probability model. This process is repeated until the preset number of iterations is reached or other stopping conditions are met. The advantage of Bayesian optimization is that it can intelligently select the next evaluation point based on historical observations, thereby finding a parameter configuration close to the optimal solution in a smaller number of iterations. In addition, Bayesian optimization can also handle complex objective functions such as multi-peak and non-convex, which makes it perform well in many practical applications.
Traditional hyperparameter selection methods mainly include grid search and random search, but they have several problems. Generally, grid search needs to traverse all possible parameter combinations, and the computational cost increases rapidly with the increase in the number of parameters and the range of values. For large neural networks, this method is very time-consuming. Among them, although random search can improve search efficiency in some cases, it may still encounter search blind spots in high-dimensional parameter space, resulting in failure to find the best parameter combination. At the same time, these two methods are prone to fall into local optimal solutions in high-dimensional space, making it difficult to find the global optimal solution.
Assume that the hyperparameter to be optimized is , and the goal is to minimize the loss function . The search process of the traditional method can be expressed as:
Preprints 119719 i004
where represents the search space of hyperparameters. In this case, Bayesian optimization is a good solution. Because Bayesian optimization uses prior knowledge and existing observation data to continuously update the proxy model (such as Gaussian process), it efficiently explores and utilizes the search space. At the same time, through proxy model prediction and acquisition function selection, Bayesian optimization can quickly approach the optimal solution with limited computing resources, reducing invalid calculations. Its update process is to update the mean and variance of the proxy model:
Preprints 119719 i005
Among them, is the observation vector and is the covariance matrix. In this way, Bayesian optimization can better escape from the local optimum and find the global optimal solution by constantly adjusting the proxy model and balancing exploration and development. In the Bayesian optimization process, the selection of hyperparameters can be expressed as:
Preprints 119719 i006
Among them, is the acquisition function, and the next set of hyperparameters is selected by maximizing . Through Bayesian optimization, the neural network model can find the optimal hyperparameter combination in a shorter time, thereby improving the performance and training efficiency of the model. This optimization method has proven its effectiveness and advantages in multiple deep learning applications.

B. Channel Attention Mechanism

The channel attention mechanism in the field of computer vision is an important technique used to improve the performance and efficiency of models. The channel attention mechanism enables the model to better understand and process the input data by focusing on specific areas or features of the image.
The core idea of the channel attention mechanism is to perform weighted processing on different channels of the input data in order to better utilize multi-channel information. In computer vision, multi-channel information usually refers to different color channels or different feature channels of an image. By learning the importance of different channels, the channel attention mechanism can automatically adjust the weight of the input data, thereby achieving better performance in tasks such as classification and detection. Figure 3 shows the channel attention structure [16,17,18,19,20].
Assume that the input feature map is , where is the number of channels, is the height, and is the width. The traditional convolution operation applies the same convolution kernel to each channel to obtain the output feature map :
Preprints 119719 i007
The channel attention mechanism adaptively adjusts the importance of feature maps by assigning different weights to the feature maps of each channel, thereby extracting key information more effectively.
The channel attention mechanism usually obtains the global information of each channel through global average pooling and global maximum pooling operations, and then calculates the weight of each channel through the fully connected layer. In the channel attention mechanism, global average pooling and global maximum pooling are performed on the input feature map to obtain the global description vector z:
Preprints 119719 i008
where is the height and is the width. The weight s of each channel is calculated through two fully connected layers and an activation function:
Preprints 119719 i009
Among them, and are the weight matrices of the fully connected layer, is the ReLU activation function, and is the Sigmoid activation function. Apply the calculated weight vector s to each channel of the original feature map to obtain the weighted feature map :
Preprints 119719 i010
Among them, is the weighted feature map of the -th channel, and is the weight of the -th channel.

C. Spatial Attention Mechanism

As a type of attention mechanism, the spatial attention mechanism has attracted particular attention from researchers. It is an adaptive region selection mechanism that enables the model to pay more attention to the key areas in the image and improve the performance of the model.
The core idea of the spatial attention mechanism is to enable the model to adaptively select the areas that need attention. Specifically, the spatial attention mechanism adjusts the model’s attention to different areas by assigning different weights to each pixel in the image. The size of the weight depends on the importance of the pixel to the task. For important areas, the weight is larger, and the model will pay more attention to it; for unimportant areas, the weight is smaller, and the model will pay less attention to it. Figure 4 shows the structure of the spatial attention mechanism [21,22,23,24,25].
Assume that the input feature map is , where C is the number of channels, H is the height, and W is the width. The traditional convolution operation applies the same convolution kernel w to all spatial positions to obtain the output feature map Y:
Preprints 119719 i011
Among them, and are the position coordinates in the feature map. The spatial attention mechanism adjusts the feature map’s spatial distribution by assigning weights to each position based on both local and global information. This mechanism highlights key areas and suppresses irrelevant data by recalculating weights for varying inputs, enhancing model adaptability. It typically uses maximum and average pooling to gather local data, then applies convolution to compute position weights, initially fusing data through pooling to derive two feature maps and :
Preprints 119719 i012
Next, the weight calculation is performed, the two feature maps are stacked, and the weight of each spatial position is calculated through a convolutional layer:
Preprints 119719 i013
Among them, is the Sigmoid activation function, and is the convolution operation. Finally, the feature map is re-weighted, and the calculated spatial weight map is applied to each channel of the original feature map to obtain the weighted feature map :
Preprints 119719 i014
To sum up, the spatial attention mechanism can significantly improve the feature representation ability and classification performance of the model.

D. Loss Function

KL divergence loss (KLDivLoss), also known as Kullback-Leibler divergence loss. KL divergence loss is used to measure the difference between the model’s predicted probability distribution and the true probability distribution. Usually, the true probability distribution is represented by one-hot encoding, while the model’s predicted probability distribution is represented by the probability vector output by the model. KL divergence loss is calculated as follows:
Preprints 119719 i015
Among them, represents the true probability distribution (one-hot encoding), represents the predicted probability distribution of the model, and represents the summation operation.
KL divergence loss first calculates the ratio of the true probability distribution to the model’s predicted probability distribution, then takes the logarithm, and finally multiplies the two element-by-element and sums them. The smaller the KL divergence loss value, the closer the model’s predicted distribution is to the true distribution [26,27].

III. Experimental Results

A. Experimental Design

In order to verify the experiments in this paper, this paper uses the Ubuntu 20.04 LTS operating system, builds the environment on the NVIDIA RTX3080 GPU, uses CUDA 11.2 and cuDNN 8.1.0 to build the CUDA environment, and uses the Pytorch 1.12 deep learning framework based on Python 3.8. This experiment uses the CIFAR-100 dataset for training and evaluation. The CIFAR-100 dataset is a widely used image classification dataset consisting of 60,000 color images, of which 50,000 are used for training and 10,000 are used for testing. Each image is 32x32 pixels in size and contains 100 categories, with 600 images in each category. Compared with the CIFAR-10 dataset, the CIFAR-100 dataset has more categories and is more difficult to classify. In the data preprocessing stage, this paper standardizes and enhances the CIFAR-100 dataset to improve the generalization ability of the model.

B. Model Performance Verification

The proposed method is compared with the original AlexNet, GoogleNet, VGG16, ResNet and others on the CIFTA-100 dataset. Accuracy, precision, recall and F1 score are used as evaluation indicators. In the experiment, the size of the input image is 32pixel×32pixel. The learning rate of AlexNet is set to 0.01, the loss function momentum is 0.5, and the Dropout rate is 0.5. The learning rate, momentum and Dropout rate are set the same in GoogleNet, VGG16 and ResNet. The results of these models and the results of the proposed model are shown in the table 1.
As shown in Table 1, the improved model in this article is better than other classic models in all indicators. The accuracy of the improved model is 77.6%, which is significantly higher than AlexNet’s 65.2%, GoogleNet’s 70.8%, VGG16’s 68.3% and 74.5% of ResNet. This shows that the improved model has better classification performance on the CIFAR-100 dataset and can identify image categories more accurately. The accuracy of the improved model is 78.3%, which is also higher than other models. It means that the improved model has higher accuracy in predicting positive class samples, and the number of samples misjudged as positive class is smaller. The recall rate of the improved model is 76.8%, which is also higher than other models. This shows that the improved model is more sensitive in identifying positive samples, and the number of samples missed as negative samples is smaller. The F1 score of the improved model is 77.5%, which achieves a good balance between precision and recall, and has the best overall performance. It can be seen from the above results that the improved model effectively improves the feature extraction capability and classification performance of the model by introducing Bayesian optimization, channel attention and spatial attention mechanisms. It has excellent performance in various indicators such as accuracy, loss value, precision, recall and F1 score, which verifies the effectiveness of the improved method.

C. Ablation Experiments

In order to evaluate the impact of each improvement technique on model performance, this paper trains and evaluates the above models on the CIFAR-100 dataset and records their accuracy, loss value, precision, recall, F1 score and other indicators. The results of the ablation experiment are shown in the table 2.
It can be seen from the ablation experiment results in Table 2 that removing different improvement technologies has varying degrees of impact on model performance. The improved model is better than the basic model in all evaluation indicators, especially the accuracy rate is increased by 3.1 percentage points. It shows that the introduced improvement technology significantly improves the model performance. After removing Bayesian optimization, the accuracy and other metrics of the model decreased, but were still better than the baseline model. This shows that Bayesian optimization plays an important role in hyperparameter tuning and can help the model find a better parameter combination. After removing the channel attention mechanism, the model performance declined, especially in accuracy and F1 score, indicating that the channel attention mechanism plays an important role in enhancing the model’s feature extraction capabilities. After removing the spatial attention mechanism, the model performance also declined, but the decline was slightly smaller than that of the channel attention mechanism. This shows that the spatial attention mechanism plays a certain role in improving the model’s attention to key areas. After removing all attention mechanisms, the model performance degrades further, but is still better than the base model. This shows that although the attention mechanism significantly contributes to performance improvement, Bayesian optimization also plays an important role in improving model performance. Through the above ablation experiments, we verified the effectiveness of Bayesian optimization, channel attention mechanism, and spatial attention mechanism in improving model performance. By using these improved techniques, the classification performance of the basic model on the CIFAR-100 data set is significantly improved.
It can be seen from the ablation experiment results in Table 3 that using different loss functions has varying degrees of impact on model performance. The cross entropy loss is better than other loss functions in all evaluation indicators. Compared with the lowest accuracy, the accuracy is The rate increased by 3.6 percentage points, indicating that the introduced loss function significantly improved the model performance. After using the mean square error loss, the model performance has declined, especially in accuracy and precision, indicating that the cross-entropy loss is important in accurately quantifying errors, effectively guiding parameter updates, and significantly improving the classification accuracy of the model. effect. Through the above ablation experiments, we verified the effectiveness of different loss functions in improving model performance. By using these improved techniques, the classification performance of the basic model on the CIFAR-100 data set is significantly improved.

IV. Conclusion

This paper conducts detailed research and experiments on the performance improvement of classic neural network models in image classification tasks. This article reproduces the classic neural network models (AlexNet, GoogleNet, VGG16 and ResNet), and based on this, proposes an improved model that integrates Bayesian optimization, channel attention mechanism and spatial attention mechanism. This article adopts Bayesian optimization method in hyperparameter tuning, which significantly improves the convergence speed and final performance of the model. Bayesian optimization reduces unnecessary calculations and finds better hyperparameter configurations by intelligently selecting evaluation points, thereby improving the accuracy and other performance indicators of the model. At the same time, this article introduces a channel attention mechanism into the model, allowing the model to adaptively adjust the importance of different channels. By emphasizing important features and weakening irrelevant features, the channel attention mechanism effectively improves the feature extraction capability of the model, thereby improving classification performance. The spatial attention mechanism enables the model to better capture the spatial relationships in the image and focus on key areas. This mechanism improves the model’s classification ability on complex images by optimizing the spatial distribution of feature maps. Through experimental verification on the CIFAR-100 data set, the improved model is significantly better than the classic model in terms of accuracy, loss value, precision, recall and F1 score, especially the accuracy rate reached 77.6%, proving The effectiveness of the proposed improvement method was demonstrated. The successful application of the improved model not only demonstrates the potential of Bayesian optimization and attention mechanisms in improving model performance, but also provides new ideas for the design of future deep learning models. In the future, these improved technologies may be applied and promoted in a wider range of image classification tasks and other computer vision fields, further promoting the development of deep learning technology.

References

  1. Bhattacharyya S. A brief survey of color image preprocessing and segmentation techniques[J]. Journal of Pattern Recognition Research, 2011, 1(1): 120-129.
  2. Vega-Rodriguez M A. Feature extraction and image processing[J]. The Computer Journal, 2004, 47(2): 271-272.
  3. Perreault, S., & Hébert, P. (2007). Median filtering in constant time. IEEE transactions on image processing, 16(9), 2389-2394.
  4. Ślot, K., Kowalski, J., Napieralski, A., & Kacprzak, T. (1999). Analogue median/average image filter based on cellular neural network paradigm. Electronics Letters, 35(19), 1619-1620. [CrossRef]
  5. Direkoglu C, Nixon M S. Image-based multiscale shape description using Gaussian filter[C]//2008 Sixth Indian Conference on Computer Vision, Graphics & Image Processing. IEEE, 2008: 673-678.
  6. Zhang, D., Liu, B., Sun, C., & Wang, X. (2011). Learning the Classifier Combination for Image Classification. J. Comput., 6(8), 1756-1763. [CrossRef]
  7. Tao, Y., Jia, Y., Wang, N., & Wang, H. (2019, July). The fact: Taming latent factor models for explainability with factorization trees. In Proceedings of the 42nd international ACM SIGIR conference on research and development in information retrieval (pp. 295-304).
  8. Amato G, Falchi F. Local feature based image similarity functions for knn classification[C]//International Conference on Agents and Artificial Intelligence. SCITEPRESS, 2011, 2: 157-166.
  9. Joachims, T. (1999). Making large-scale svm learning practical. advances in kernel methods-support vector learning. http://svmlight. joachims. org/.
  10. Xu, Y., Cai, Y., & Song, L. (2023). Latent fault detection and diagnosis for control rods drive mechanisms in nuclear power reactor based on GRU-AE. IEEE Sensors Journal, 23(6), 6018-6026. [CrossRef]
  11. Zhang, J., Wang, X., Ren, W., Jiang, L., Wang, D., & Liu, K. (2024). RATT: AThought Structure for Coherent and Correct LLMReasoning. arXiv preprint arXiv:2406.02746.
  12. Lyu, W., Zheng, S., Ma, T., & Chen, C. (2022). A study of the attention abnormality in trojaned berts. arXiv preprint arXiv:2205.08305.
  13. Szegedy, C., Liu, W., Jia, Y., Sermanet, P., Reed, S., Anguelov, D., ... & Rabinovich, A. (2015). Going deeper with convolutions. In Proceedings of the IEEE conference on computer vision and pattern recognition (pp. 1-9).
  14. Simonyan, K., & Zisserman, A. (2014). Very deep convolutional networks for large-scale image recognition. arXiv preprint arXiv:1409.1556.
  15. Xu H, Yuan Y, Ma R, et al. Lithography hotspot detection through multi-scale feature fusion utilizing feature pyramid network and dense block[J]. Journal of Micro/Nanopatterning, Materials, and Metrology, 2024, 23(1): 013202-013202.
  16. He K, Zhang X, Ren S, et al. Deep residual learning for image recognition[C]//Proceedings of the IEEE conference on computer vision and pattern recognition. 2016: 770-778.
  17. Dan, H. C., Yan, P., Tan, J., Zhou, Y., & Lu, B. (2024). Multiple distresses detection for Asphalt Pavement using improved you Only Look Once Algorithm based on convolutional neural network. International Journal of Pavement Engineering, 25(1), 2308169. [CrossRef]
  18. Tao, Y. (2023, August). Meta Learning Enabled Adversarial Defense. In 2023 IEEE International Conference on Sensors, Electronics and Computer Engineering (ICSECE) (pp. 1326-1330). IEEE.
  19. Yu, L., Cao, M., Cheung, J. C. K., & Dong, Y. (2024). Mechanisms of non-factual hallucinations in language models. arXiv preprint arXiv:2403.18167.
  20. Grabner M, Grabner H, Bischof H. Fast approximated SIFT[C]//Computer Vision–ACCV 2006: 7th Asian Conference on Computer Vision, Hyderabad, India, January 13-16, 2006. Proceedings, Part I 7. Springer Berlin Heidelberg, 2006: 918-927.
  21. He L, Zou C, Zhao L, et al. An enhanced LBP feature based on facial expression recognition[C]//2005 IEEE Engineering in Medicine and Biology 27th Annual Conference. IEEE, 2006: 3300-3303.
  22. Déniz O, Bueno G, Salido J, et al. Face recognition using histograms of oriented gradients[J]. Pattern recognition letters, 2011, 32(12): 1598-1603.
  23. Guan, R., Li, Z., Tu, W., Wang, J., Liu, Y., Li, X., ... & Feng, R. (2024). Contrastive multi-view subspace clustering of hyperspectral images based on graph convolutional networks. IEEE Transactions on Geoscience and Remote Sensing.
  24. Guan, R., Li, Z., Li, X., & Tang, C. (2024, April). Pixel-superpixel contrastive learning and pseudo-label correction for hyperspectral image clustering. In ICASSP 2024-2024 IEEE International Conference on Acoustics, Speech and Signal Processing (ICASSP) (pp. 6795-6799). IEEE.
  25. Xu, Y., Cai, Y. Z., & Song, L. (2023). Anomaly Detection for In-core Neutron Detectors Based on a Virtual Redundancy Model. IEEE Transactions on Instrumentation and Measurement. [CrossRef]
  26. Li, Y., Yu, X., Liu, Y., Chen, H., & Liu, C. (2023, July). Uncertainty-Aware Bootstrap Learning for Joint Extraction on Distantly-Supervised Data. In Proceedings of the 61st Annual Meeting of the Association for Computational Linguistics (Volume 2: Short Papers) (pp. 1349-1358).
  27. Li, C., Liu, X., Wang, C., Liu, Y., Yu, W., Shao, J., & Yuan, Y. (2024). GTP-4o: Modality-prompted Heterogeneous Graph Learning for Omni-modal Biomedical Representation. arXiv preprint arXiv:2407.05540.
  28. Zhou, Y., Geng, X., Shen, T., Long, G., & Jiang, D. (2022, April). Eventbert: A pre-trained model for event correlation reasoning. In Proceedings of the ACM Web Conference 2022 (pp. 850-859).
  29. Lyu, W., Zheng, S., Pang, L., Ling, H., & Chen, C. (2023). Attention-enhancing backdoor attacks against bert-based models. arXiv preprint arXiv:2310.14480.
  30. Zhang, X., Wang, Z., Jiang, L., Gao, W., Wang, P., & Liu, K. (2024). TFWT: Tabular Feature Weighting with Transformer. arXiv preprint arXiv:2405.08403.
  31. Sun, D., Liang, Y., Yang, Y., Ma, Y., Zhan, Q., & Gao, E. (2024). Research on Optimization of Natural Language Processing Model Based on Multimodal Deep Learning. arXiv preprint arXiv:2406.08838.
  32. Liu, X., Dong, Z., & Zhang, P. (2024). Tackling data bias in music-avqa: Crafting a balanced dataset for unbiased question-answering. In Proceedings of the IEEE/CVF Winter Conference on Applications of Computer Vision (pp. 4478-4487).
  33. Xin, Yi, et al. “Vmt-adapter: Parameter-efficient transfer learning for multi-task dense scene understanding.” Proceedings of the AAAI Conference on Artificial Intelligence. Vol. 38. No. 14. 2024. [CrossRef]
  34. Zhang, Jingyu, et al. “Research on the Application of Computer Vision Based on Deep Learning in Autonomous Driving Technology.” arXiv preprint arXiv:2406.00490 (2024).
  35. Yin, Jianjian, et al. “Class Probability Space Regularization for semi-supervised semantic segmentation.” Computer Vision and Image Understanding (2024): 104146. [CrossRef]
  36. Yin, Jianjian, et al. “Class-level multiple distributions representation are necessary for semantic segmentation.” International Conference on Database Systems for Advanced Applications. Singapore: Springer Nature Singapore, 2024.
  37. Xu, Shengjie, et al. “Neural Architecture Sizing for Autonomous Systems.” 2024 ACM/IEEE 15th International Conference on Cyber-Physical Systems (ICCPS). IEEE, 2024.
  38. Shangguan, Zhongkai, et al. “Neural process for black-box model optimization under bayesian framework.” arXiv preprint arXiv:2104.02487 (2021).
  39. Li, Hanqian, et al. “Lr-fpn: Enhancing remote sensing object detection with location refined feature pyramid network.” arXiv preprint arXiv:2404.01614 (2024).
  40. Tan, Lianghao, et al. “Enhanced self-checkout system for retail based on improved YOLOv10.” arXiv preprint arXiv:2407.21308 (2024). [CrossRef]
  41. Xin, Yi, et al. “Mmap: Multi-modal alignment prompt for cross-domain multi-task learning.” Proceedings of the AAAI Conference on Artificial Intelligence. Vol. 38. No. 14. 2024. [CrossRef]
  42. Gong, Hao, and Mengdi Wang. “A duality approach for regret minimization in average-award ergodic markov decision processes.” Learning for Dynamics and Control. PMLR, 2020.
  43. Cheng, Qisen, Shuhui Qu, and Janghwan Lee. “72-3: Deep Learning Based Visual Defect Detection in Noisy and Imbalanced Data.” SID Symposium Digest of Technical Papers. Vol. 53. No. 1. 2022. [CrossRef]
  44. Xin, Yi, et al. “Self-Training with Label-Feature-Consistency for Domain Adaptation.” International Conference on Database Systems for Advanced Applications. Cham: Springer Nature Switzerland, 2023.
  45. Balakrishnan, Kaushik, et al. “6-4: Deep Learning for Classification of Repairable Defects in Display Panels Using Multi-Modal Data.” SID Symposium Digest of Technical Papers. Vol. 54. No. 1. 2023. [CrossRef]
  46. Shang, Mingyang, et al. “V2F-Net: Explicit decomposition of occluded pedestrian detection.” arXiv preprint arXiv:2104.03106 (2021).
  47. Kang, Yixiao, et al. “6: Simultaneous Tracking, Tagging and Mapping for Augmented Reality.” SID Symposium Digest of Technical Papers. Vol. 52. 2021.
  48. Yukun, Song. “Deep Learning Applications in the Medical Image Recognition.” American Journal of Computer Science and Technology 9.1 (2019): 22-26. [CrossRef]
  49. Liu, Rui, et al. “Enhanced detection classification via clustering svm for various robot collaboration task.” arXiv preprint arXiv:2405.03026 (2024).
  50. Weng, Yijie, and Jianhao Wu. “Leveraging Artificial Intelligence to Enhance Data Security and Combat Cyber Attacks.” Journal of Artificial Intelligence General science (JAIGS) ISSN: 3006-4023 5.1 (2024): 392-399. [CrossRef]
  51. Weng, Yijie. “Big data and machine learning in defence.” International Journal of Computer Science and Information Technology 16.2 (2024): 25-35.
  52. Yang, Qiming, et al. “Research on Improved U-net Based Remote Sensing Image Segmentation Algorithm.” arXiv preprint arXiv:2408.12672 (2024).
  53. Ma, Danqing, et al. “Transformer-Based Classification Outcome Prediction for Multimodal Stroke Treatment.” arXiv preprint arXiv:2404.12634 (2024).
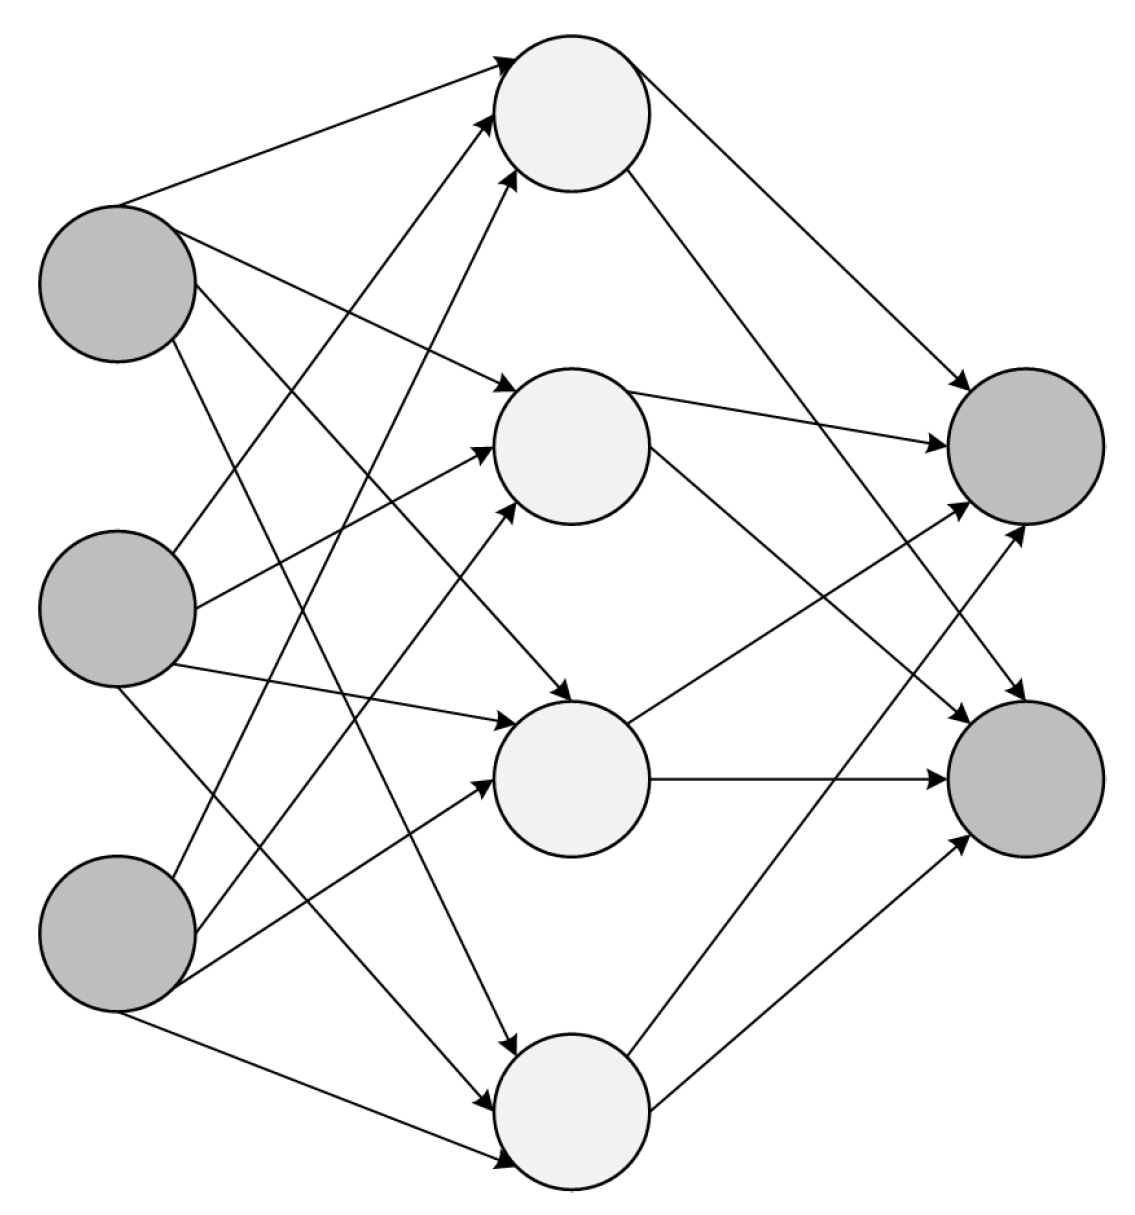
Figure 1. Classical neural network structure.
Preprints 119719 g001
Figure 2. The classification network structure is proposed.
Preprints 119719 g002
Figure 3. Channel attention module.
Preprints 119719 g003
Figure 4. Spatial attention module.
Preprints 119719 g004
Table 1. Performance comparison of different models.
Model Accuracy Precision Recall F1 Score
AlexNet 65.20% 66.00% 64.50% 65.20%
GoogleNet 70.80% 71.50% 69.80% 70.60%
VGG16 68.30% 68.90% 67.40% 68.10%
ResNet 74.50% 75.20% 73.80% 74.50%
BNNAM 77.60% 78.30% 76.80% 77.50%
Table 2. Ablation experiment.
Model Accuracy Precision Recall F1 Score
Baseline Model 74.50% 75.20% 73.80% 74.50%
w/o Bayesian Optimization 75.20% 75.80% 74.30% 75.00%
w/o Channel Attention Mechanism 76.00% 76.50% 75.20% 75.80%
w/o Spatial Attention Mechanism 75.50% 76.00% 74.70% 75.30%
w/o All Attention 75.00% 75.60% 74.20% 74.90%
w All Improve 77.60% 78.30% 76.80% 77.50%
Table 3. Performance comparison of different loss functions.
Model Accuracy Precision Recall F1 Score
Base Model 75.00% 73.00% 72.00% 72.50%
w Cross-Entropy 76.00% 74.00% 73.00% 73.50%
w KL Divergence 75.00% 73.00% 72.00% 72.50%
Proposed Model 77.60% 78.30% 76.80% 77.50%
Disclaimer/Publisher’s Note: The statements, opinions and data contained in all publications are solely those of the individual author(s) and contributor(s) and not of MDPI and/or the editor(s). MDPI and/or the editor(s) disclaim responsibility for any injury to people or property resulting from any ideas, methods, instructions or products referred to in the content.
Copyright: This open access article is published under a Creative Commons CC BY 4.0 license, which permit the free download, distribution, and reuse, provided that the author and preprint are cited in any reuse.
Prerpints.org logo

Preprints.org is a free preprint server supported by MDPI in Basel, Switzerland.

Subscribe

© 2024 MDPI (Basel, Switzerland) unless otherwise stated