1. Introduction
Ovarian cancer remains the 6th deadliest gynecological malignancy worldwide [
1] due to the absence of early symptoms and reliable screening methods. Consequently, most patients are diagnosed with ovarian cancer at advanced stages, and complete surgical removal of tumors is often unachievable, resulting in a poor prognosis [
2]. Advanced epithelial ovarian cancer (EOC) disease presents with extensive peritoneal spread, residual disease following debulking surgery, and resistance to chemotherapy [
2,
3,
4]. Metastasis in EOC primarily occurs through peritoneal dissemination, with over one-third of patients developing ascites, a condition that significantly lowers the five-year survival rate from 45% to a mere 5% [
5,
6].
Endometrial cancer, the most common gynecological malignancy, affects the uterine lining, and while primarily diagnosed in postmenopausal women, its incidence is rising in younger populations due to factors like obesity [
7,
8]. Type I (estrogen-dependent) endometrial cancer is often detected early through symptoms like abnormal bleeding, offering better outcomes. However, type II (more aggressive) endometrial cancer and disparities in survival rates across socioeconomic groups remain a concern for endometrial cancer [
9], emphasizing the need for targeted therapies and ongoing research to address these gaps [
10].
Extracellular vesicles (EVs), including exosomes (EXs) and microvesicles, have emerged as critical mediators in various aspects of cancer biology, including tumor progression, metastasis, chemotherapy resistance, and immune evasion [
11,
12]. Recent studies have demonstrated that cancer cells actively release EVs, which play roles in forming a tumor microenvironment conducive to invasion and metastasis [
13]. Those vesicles transport biomolecules, such as microRNAs, messenger RNAs, and proteins that facilitate communication between cancer cells and their surrounding environment [
14]. Due to their stability, abundance, and detectability in biological fluids, EXs hold promise as biomarkers for early detection of metastasis [
15].
In this study, we aimed to investigate the role of EXs derived from aggressive ovarian cancer cells in promoting disease aggressiveness. Through quantitative liquid chromatography-mass spectrometry (LC-MS/MS), we compared the differential protein expression profiles in selective culture media of ES2 cells, ES2 cells treated with EXs, and ascites-derived mesenchymal-like ovarian cancer stromal progenitor cells (MSC-OCSPCs). By correlating these findings with survival data from The Cancer Genome Atlas (TCGA), we identified three novel genes-SLC25A31, UBE2NL, and HIST2H3PS2—whose high expression is associated with poor progression-free and overall survival in EOC.
UBE2N, a ubiquitin-conjugating enzyme, has been implicated in DNA repair, immune signaling, and tumor progression, making it a potential target for cancer therapy [
16]. It has been linked to poor prognosis in cancers such as breast cancer with metastatic lung involvement [
17]. UBE2N’s involvement in DNA damage response and K63-linked ubiquitination is crucial for DNA repair protein recruitment, and its low expression or overexpression is associated with chemotherapy resistance and poor outcomes in some cancers [
18,
19,
20]. UBE2NL, as a related protein, though less understood, may function similarly in promoting tumor growth [
21]. It forms a heterodimer with UBE2V2, playing a role in polyubiquitination and cell cycle progression. As a potential drug target, inhibiting UBE2NL-UBE2V2 interactions could disrupt tumor growth [
21].
HIST2H3PS2 is related to histone H3, but its specific role in cancer is poorly characterized [
22]. HIST2H3PS2 was reported as significantly higher DNA methylation levels in endometrial cancer tissues than in benign control endometrial tissues [
23]. HIST2H3PS2 is notably expressed at higher levels in ovarian tissue than in other tissues [
24], indicating a tissue-enhanced expression pattern. However, the specific impact of this expression in gynecologic cancer is still not well understood and requires further research.
The discovery of these genes provides new insights into the molecular mechanisms underlying gynecologic cancer aggressiveness and highlights potential therapeutic targets for future research.
2. Results
2.1. Analyses of LC-MS/MS Data with TCGA and GEO, and Cathay General Hospital (CGH) Survival Data in EOC
We explored novel EXs from aggressive ES2 and ES2 tumor spheroids (TS), which promoted invasion in EOC cells and MSC-OCSPCs. Differentially expressed genes were selected from LC-MS/MS data across various groups and integrated with survival data from TCGA. The groups were defined as follows: Group 1 compared ES2 cells + ES2 EX to ES2 cells; Group 2 compared ES2 cells + ES2 spheroid (TS) EX to ES2 cells; Group 3 compared OCSPCs + ES2 EX to OCSPCs; Group 4 compared ES2 cells + ES2TS EX to ES2 cells + ES2 EX; and Group 5 compared OCSPCs + ES2 EX to ES2 cells + ES2 EX. Three novel genes with high expression correlated with progression-free survival (PFS) are associated. The exp (coef) of UBE2NL, HIST2H3PS2, and SLC25A31 was 3.007, 3.709, and 61.374 (
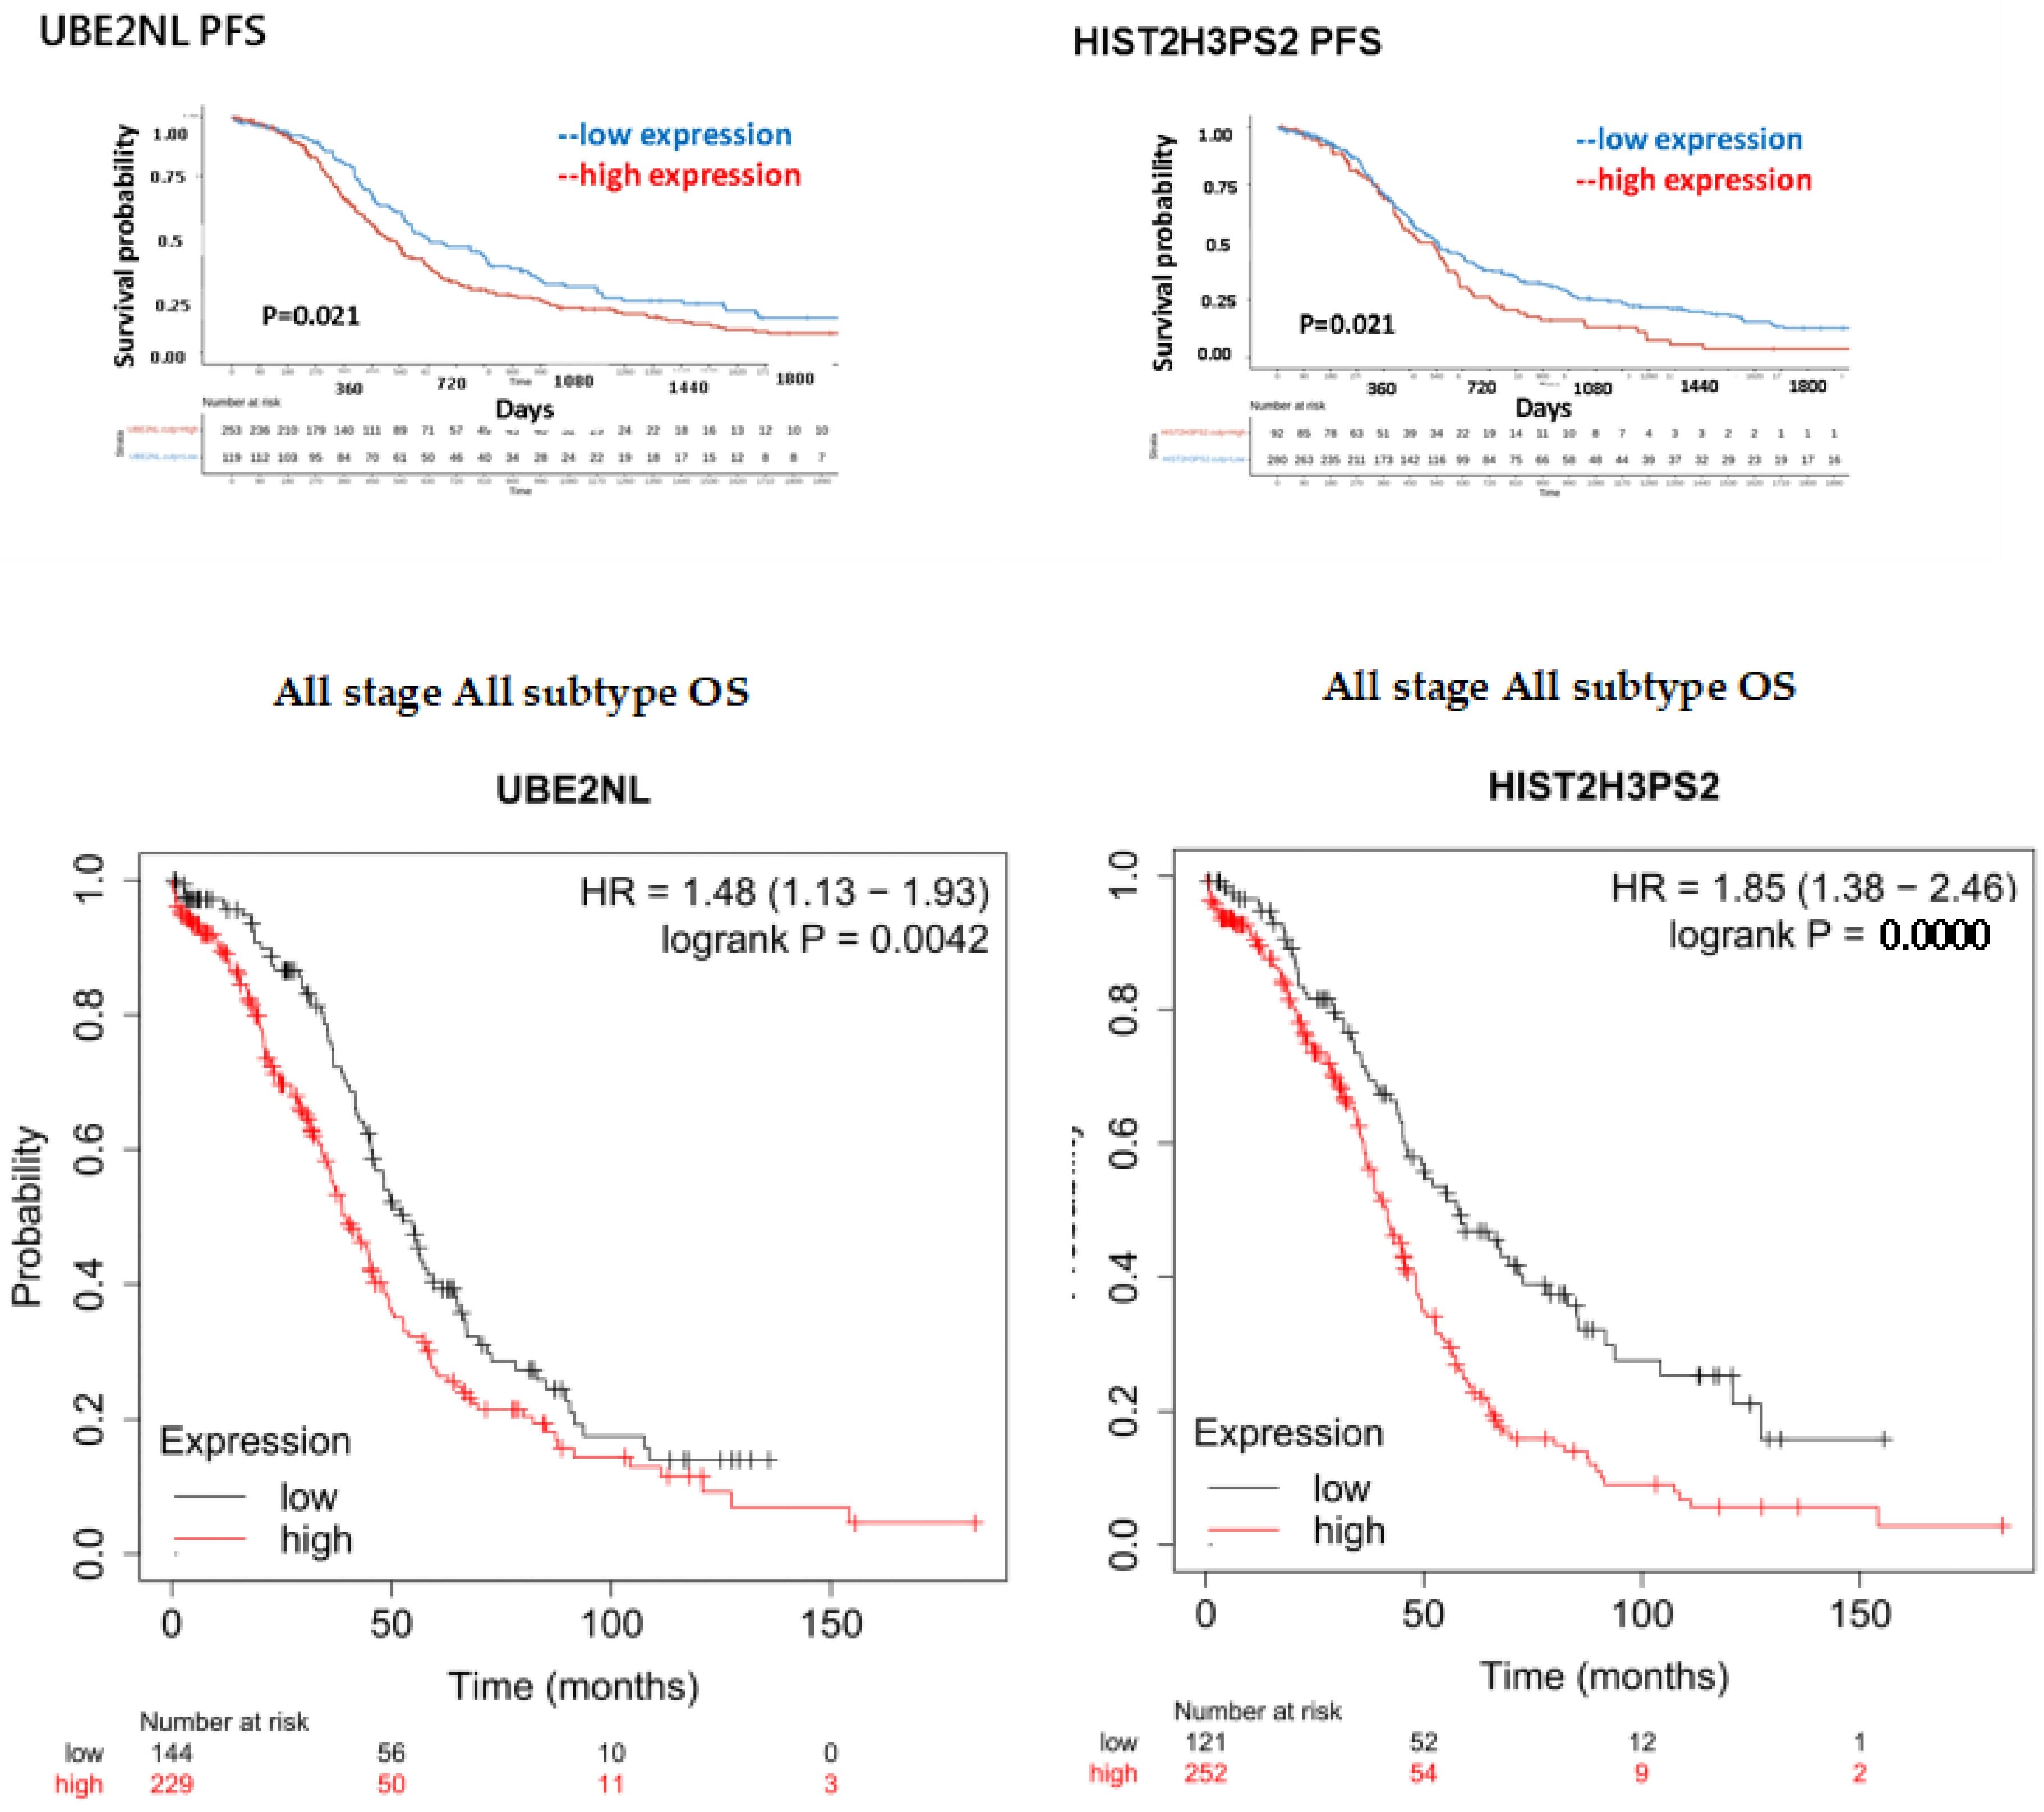
Supplemental Table 1). Progression-free survival (PFS) and overall survival (OS) for all ovarian cancer subtypes from TCGA were further validated, and showing significantly worse outcomes in the high-expression group compared to the low-expression group for both UBE2NL and HIST2H3PS2. Specifically, for UBE2NL, the high-expression group had poorer PFS (p=0.021) and OS (p=0.0042), while for HIST2H3PS2, the differences were also notable (p=0.021 for PFS and p=2.2×10⁻⁵ for OS) based on log-rank tests (
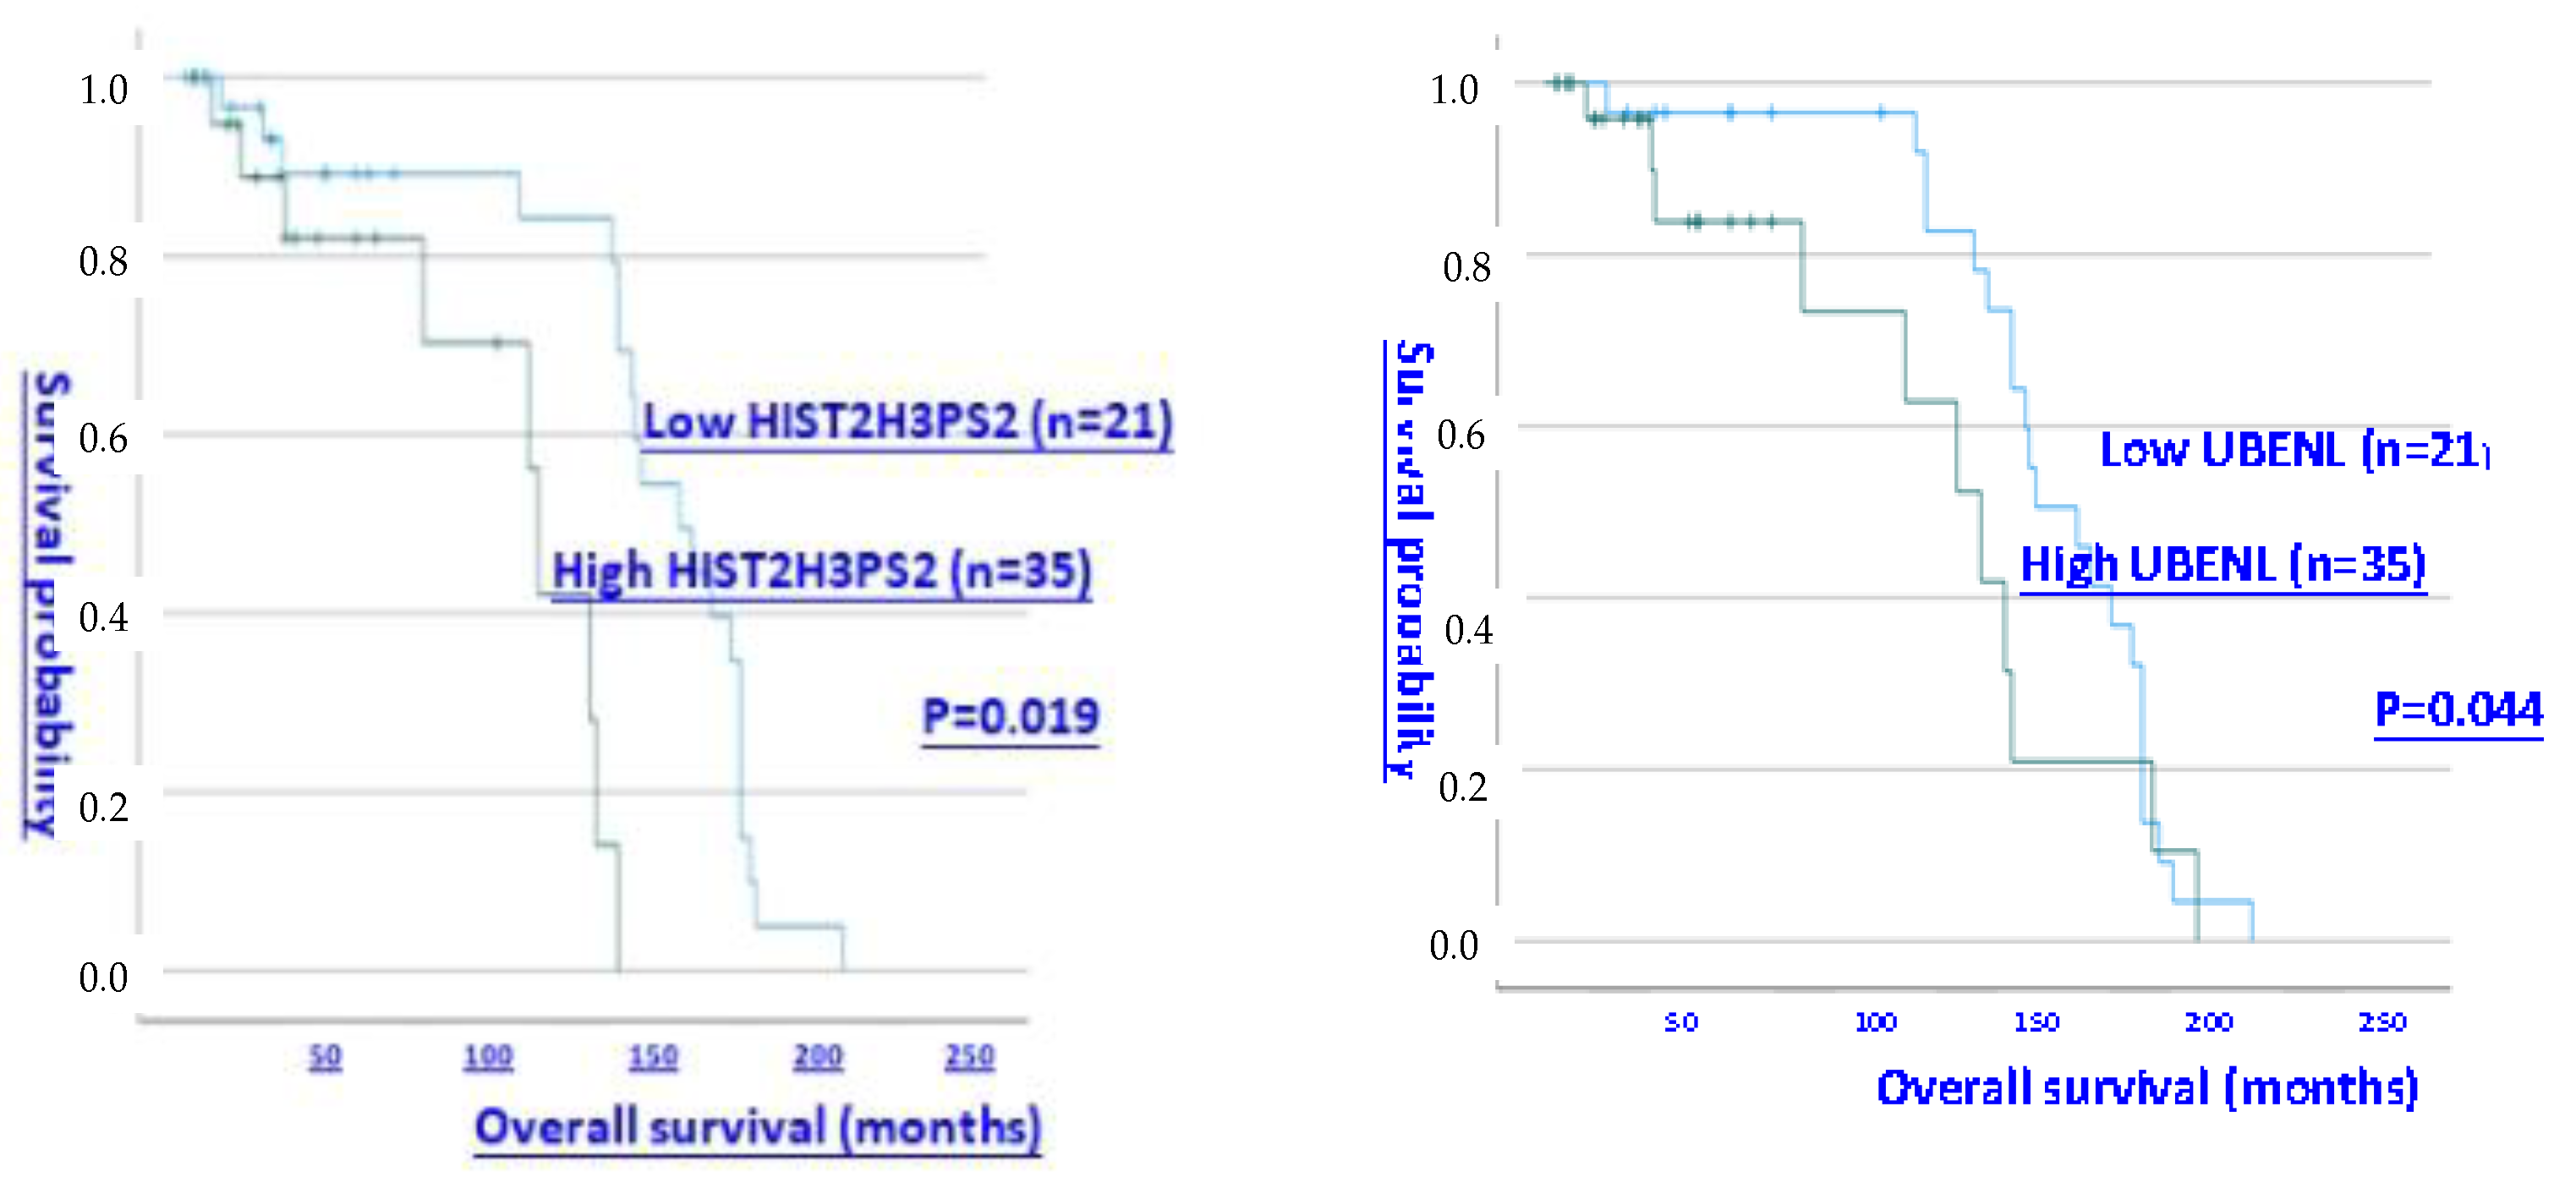
Figure 1, upper and middle). Further analysis of OS in CGH patients with all subtypes of ovarian cancer revealed that those with high expression levels (> median level) of UBE2NL and HIST2H3PS2 had shorter OS than did patients with low expression levels of UBE2NL and HIST2H3PS2 (P = 0.044 for UBE2NL; p = 0.019 for HIST2H3PS2, respectively by log-rank test) (
Figure 1, lower).
2.2. The Progression-Free Survival and Overall Survival of Expression of UBE2NL and HIST2H3PS2 in EC Patients
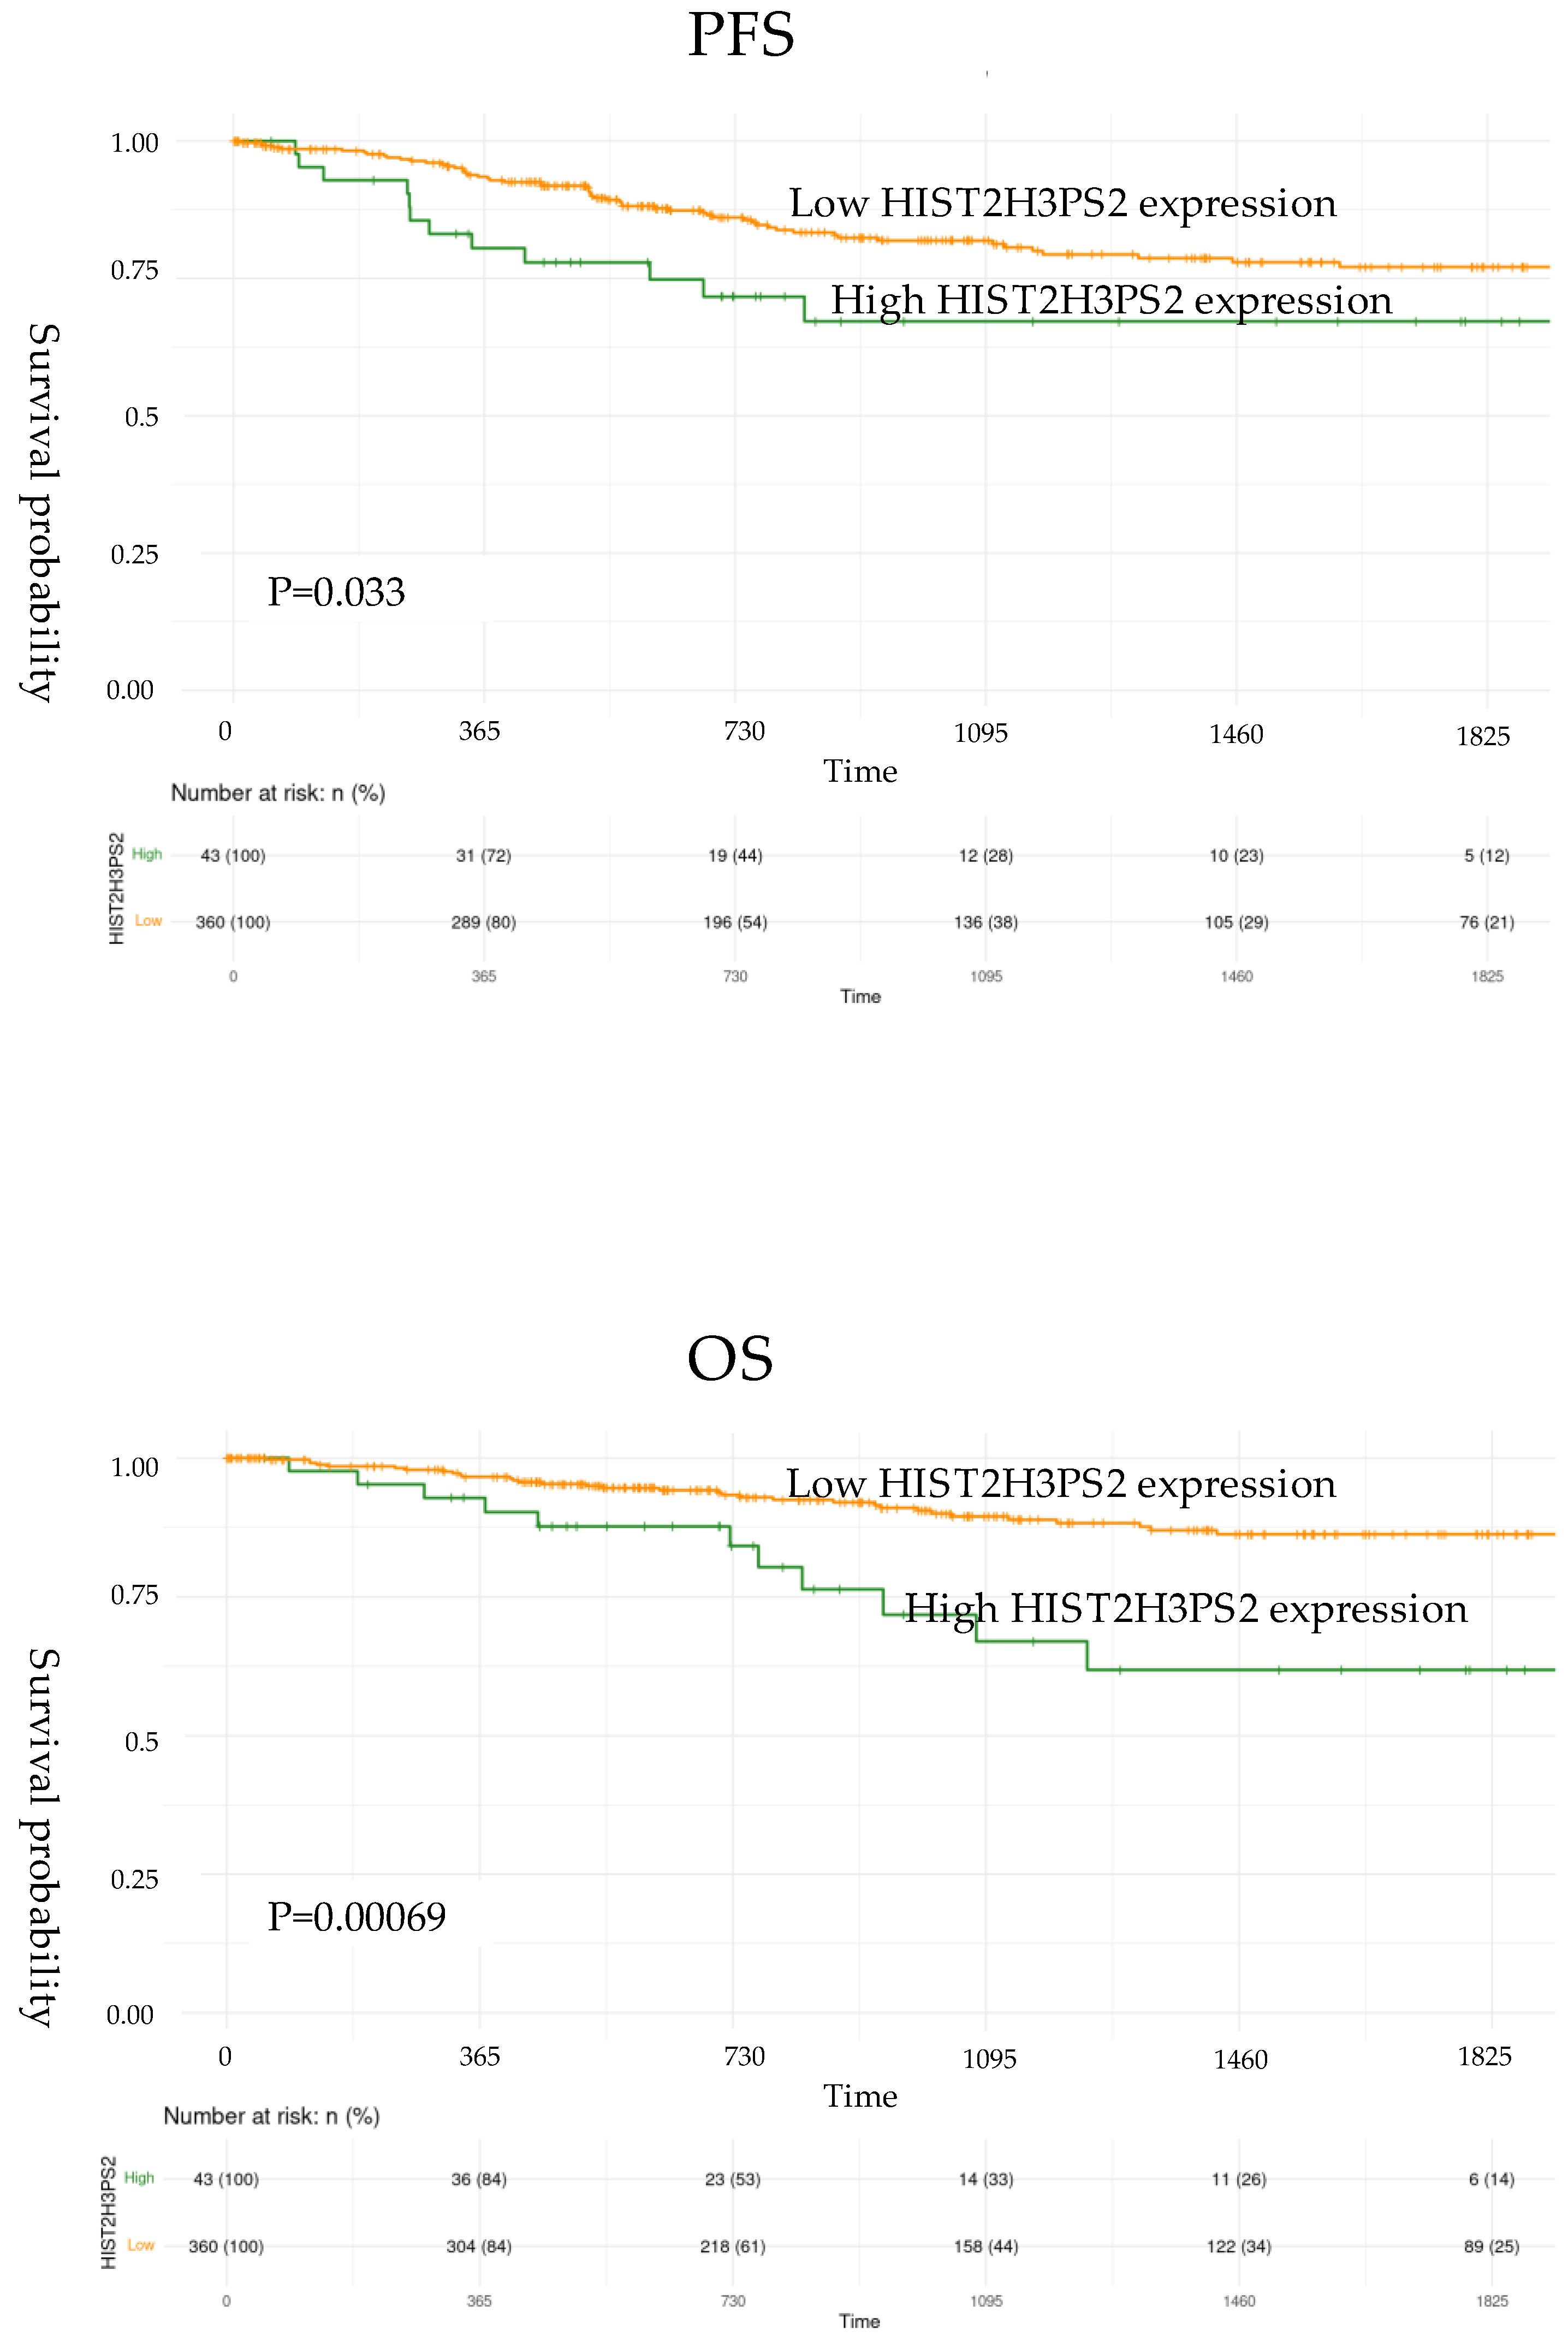
PFS and OS for EC patients from TCGA data were further validated and showed significantly worse outcomes in the high-expression group compared to the low-expression group for HIST2H3PS2. Specifically, for HIST2H3PS2, the high-expression group had poorer PFS (p=0.033) (upper) and OS (p=0.00069) (lower) in all stages based on log-rank tests (
Figure 2, lower). However, the survival outcomes in the high-expression group compared to the low-expression group for UBE2NL did not reach the statistical difference (p=0.272 for PFS, p=0.265 for OS).
2.3 The mRNA Expression Level and Folds of UBE2NL and HIST2H3PS2 in EOC Tissues, Cell Lines, and Derived EXs
The mean and median mRNA expression levels of UBE2NL and HIST2H3PS2 among benign ovarian cysts (n = 10), early-stage ovarian cancer (n = 21), and advanced-stage ovarian cancer (n = 35) tissues from CGH were significantly different (p<0.01, by Kruskal-Wallis test). The mean and median mRNA levels of UBE2NL were higher in the advanced stage than in early-stage and benign ovarian cysts (mean± SD: 0.1610±0.0523 v.s. 0.0792±0.0284 v.s. 0.0017±0.0006, p=0.001; median: 0.0200 v.s. 0.0134 v.s. 0.0001, p= 0.003, respectively by Kruskal-Wallis test) (
Table 1). The mean mRNA levels of HIST2H3PS2 were higher in advanced-stage than in early-stage and benign ovarian cysts (mean± SD: 0.0042±0.0025 v.s. 0.0015±0.0006 v.s. 0.0029±0.0015, p=0.019 by Kruskal-Wallis test) (
Table 1).
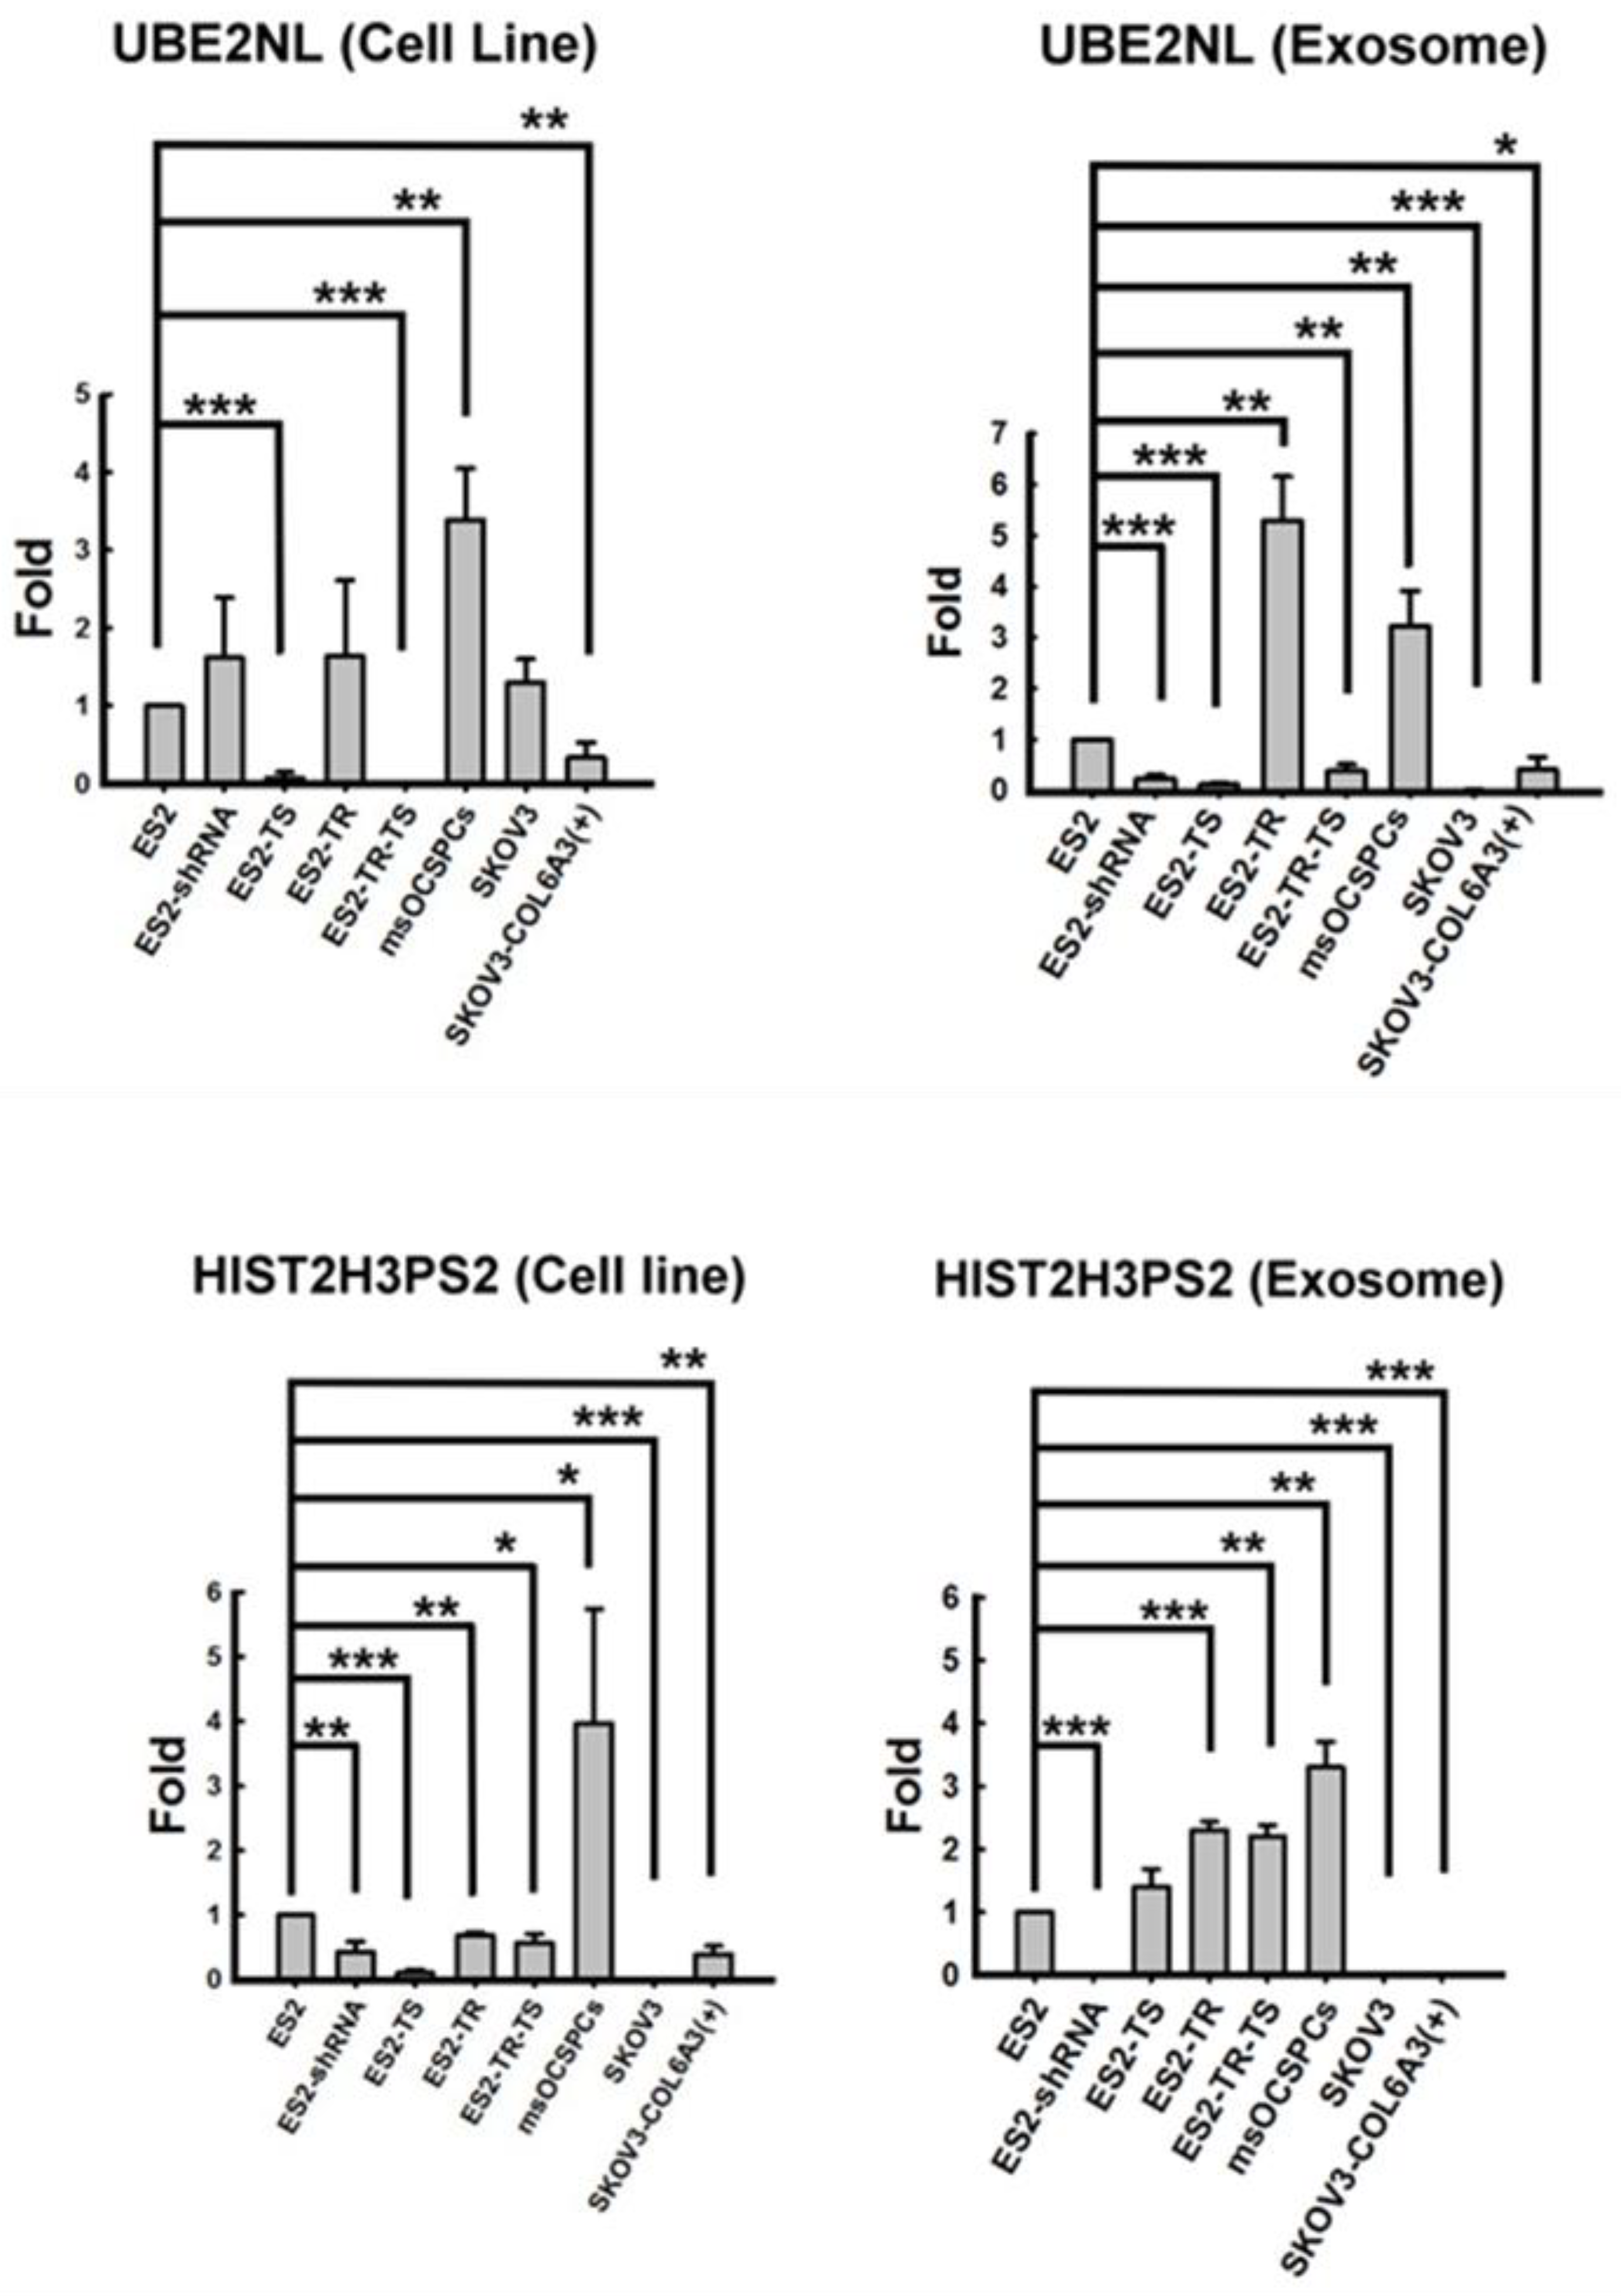
We then investigated the expression of UBE2NL and HIST2H3PS2 in both EXs and EOC cells. UBE2NL expression was in the more aggressive ES2, ES2TR, ES2 TS, ES2TR TS, SKOV3/COL6A3, and MS-OCSPCs cells and EXs, but it was absent in the less aggressive SKOV3 EXs (
Figure 3). UBE2NL expression derived from EXs were obviously in ES2TR cells and MSC-OCSPCs representing UBE2NL may participate in paclitaxel chemoresistance. HIST2H3PS2 was expressed in ES2, ES2TR, ES2 TS, ES2TR TS, SKOV3/COL6A3, and MSC-OCSPCs cells and EXs, but was not expressed in SKOV3 cells and EXs, ES2(shCOL6A3) EXs, or SKOV3/COL6A3 EXs (
Figure 3).
2.4. The Invasion Ability of SKOV3-over Luciferase, SKOV3-over UBE2NL, and SKOV3-over HIST2H3PS2 Cells
We next examined the invasion ability in SKOV3-over luciferase, SKOV3-over UBE2NL, and SKOV3-over HIST2H3PS2 cells, and the invasion ability was significantly greater in SKOV3-over UBE2NL cells or SKOV3-overHIST2H3PS2 cells, compared with SKOV3-over luciferase cells (p<0.01) (
Figure 4).
2.5. The invasion ability of SKOV3, SKOV3 with SKOV3 EXs, SKOV3 with SKOV3-over UBE2NL EXs, and SKOV3-over UBE2NL with SKOV3-over UBE2NL EXs
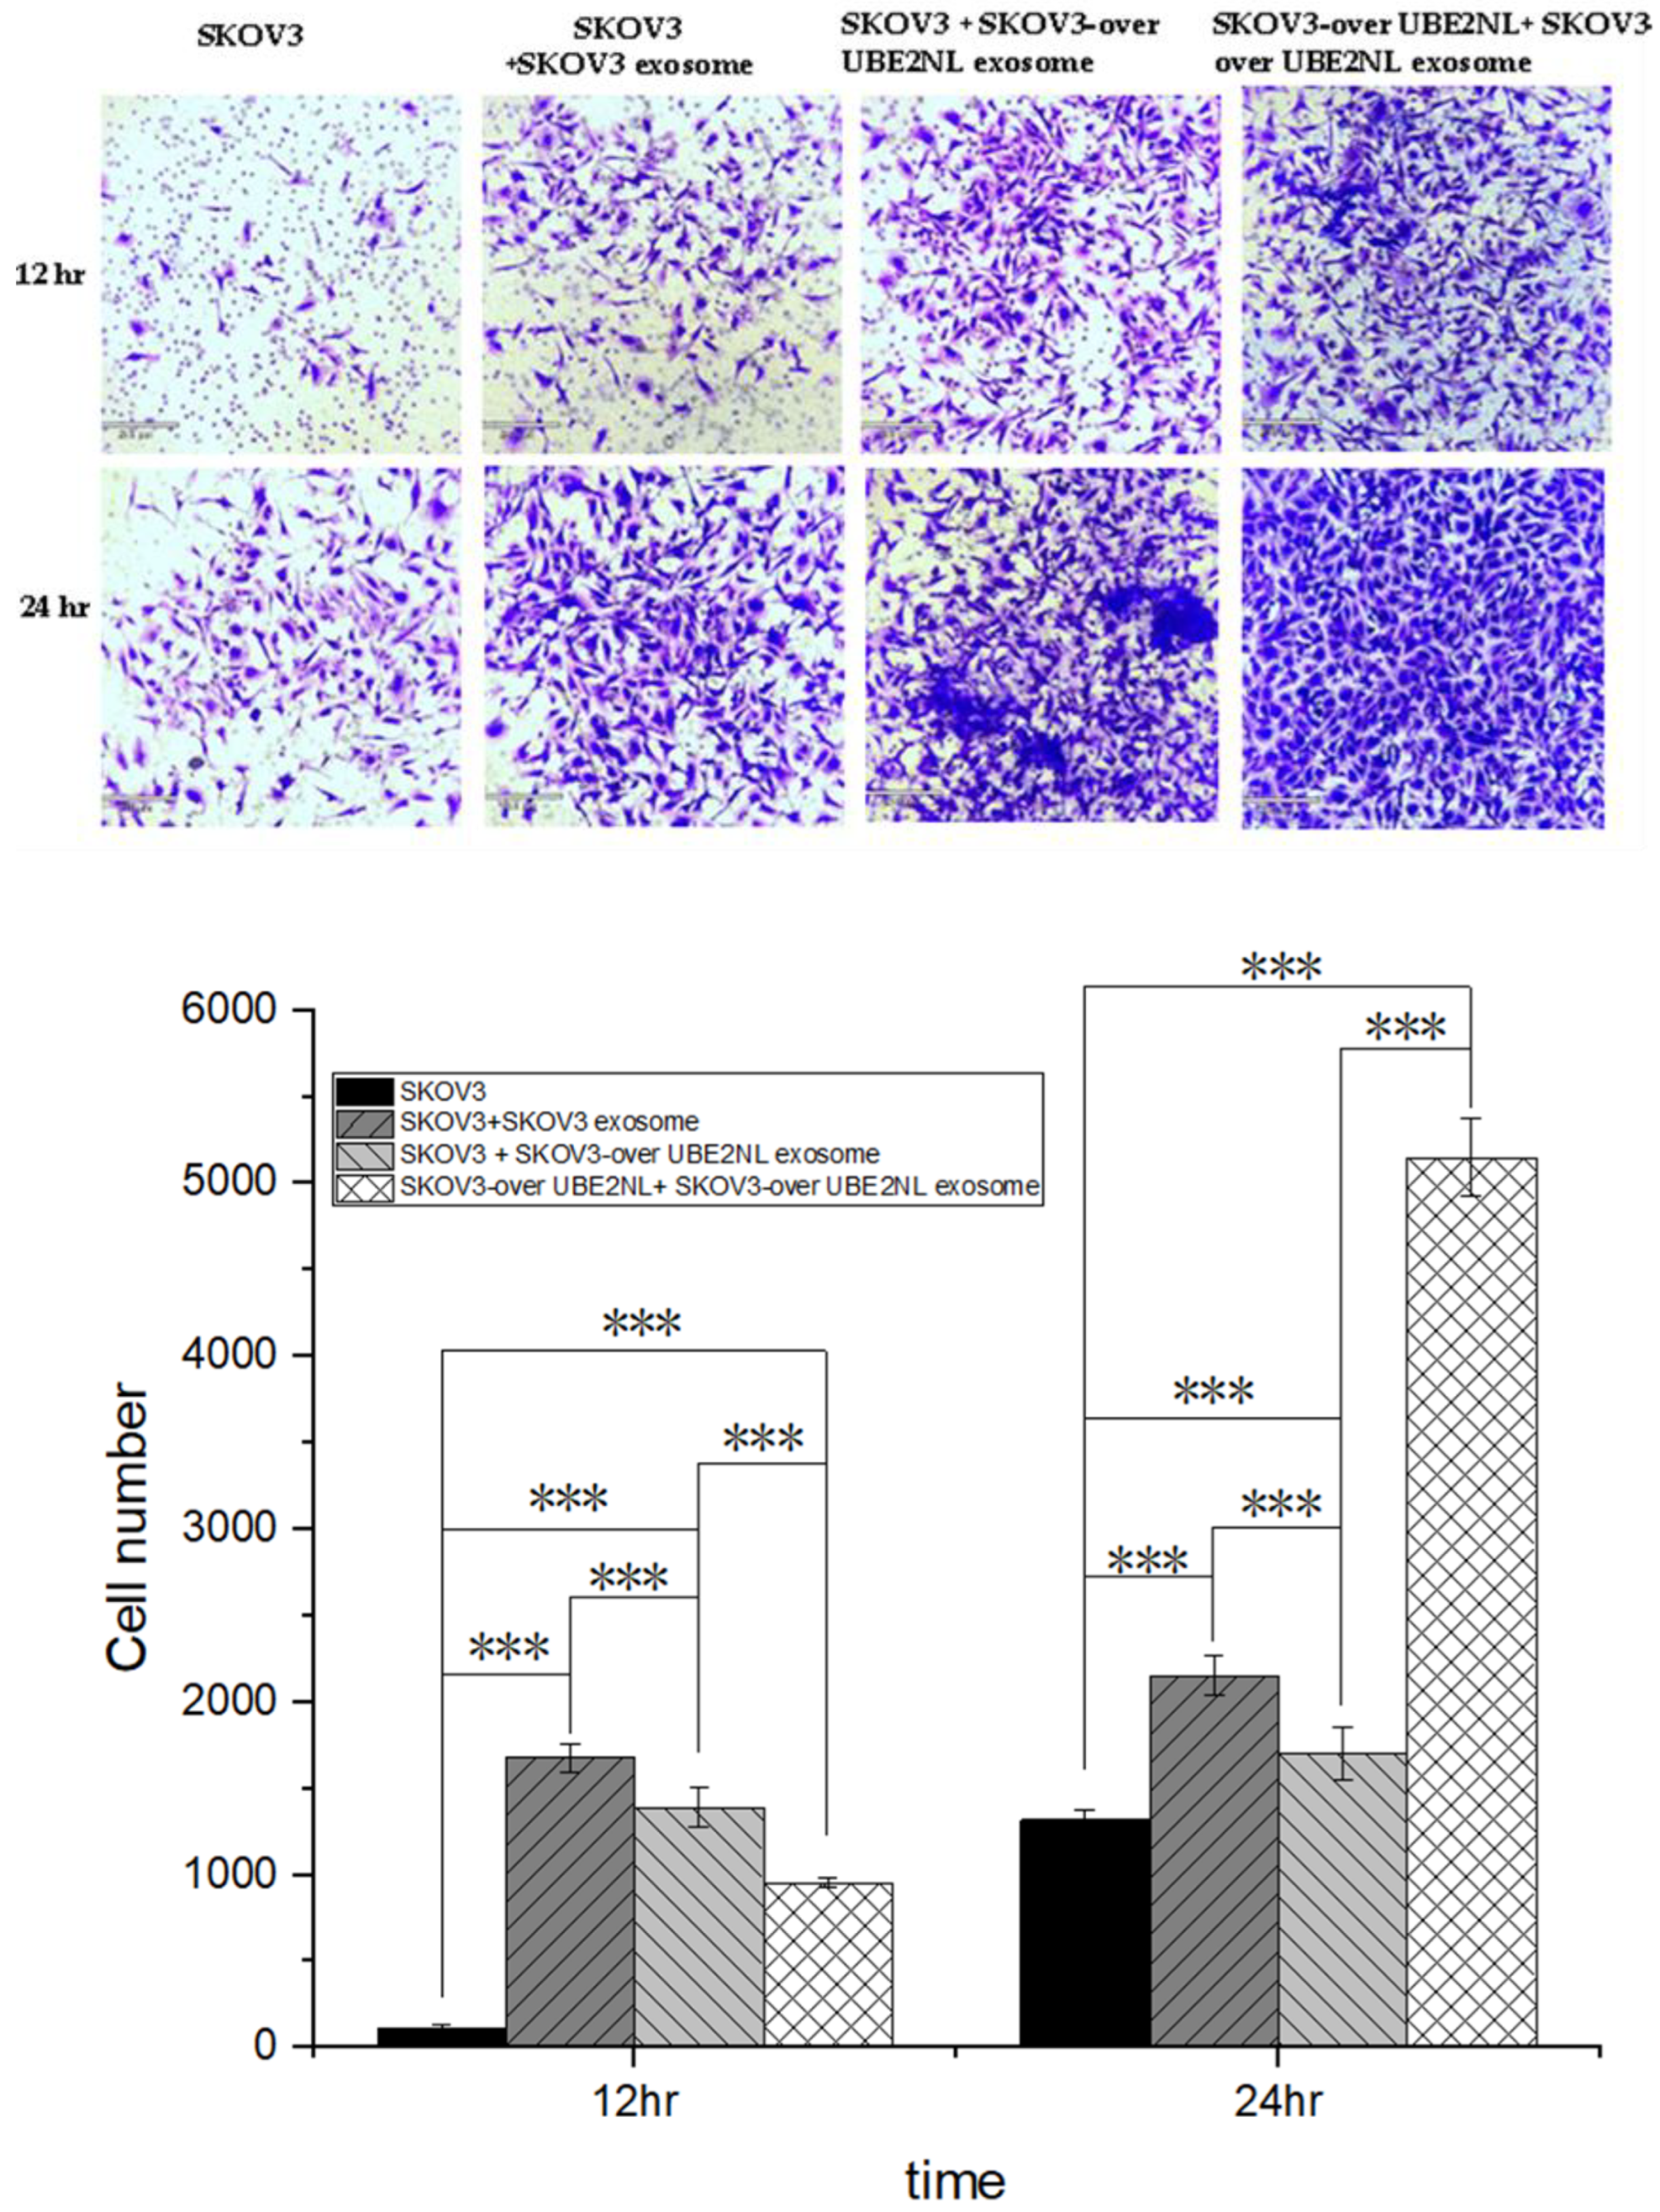
We next examined the invasion ability in SKOV3 cells with or without SKOV3 EXs, SKOV3/UBE2NL EXs, and SKOV3/UBE2NL cells with SKOV3/UBE2NL EXs. The invasion ability was significantly greater in SKOV3 cells with SKOV3 EXs, SKOV3 cells with SKOV3/UBE2NL EXs, or SKOV3/UBE2NL cells with SKOV3/UBE2NL EXs, compared with SKOV3 cells (all p<0.001) (
Figure 5).
2.6. The Invasion Ability of SKOV3, SKOV3 with SKOV3 EXs, SKOV3 with SKOV3-over HIST2H3PS2 EXs, and SKOV3-over HIST2H3PS2 with SKOV3-over HISH2T3PS2 EXs
In the same manner, we examined the invasion ability in SKOV3 cells with or without SKOV3 EXs, SKOV3/HIST2H3PS2 EXs, and SKOV3/HIST2H3PS2 cells with SKOV3/HIST2H3PS2 EXs. The invasion ability was significantly greater in SKOV3 cells with SKOV3 EXs, SKOV3 cells with SKOV3/HIST2H3PS2 EXs, or SKOV3/HIST2H3PS2 cells with SKOV3/HIST2H3PS2 EXs, compared with SKOV3 cells (all p<0.001) (
Figure 6).
2.7. The invasion ability of SKOV3, SKOV3 with SKOV3 EXs, SKOV3-over UBE2NL or HIST2H3PS2, and SKOV3 with SKOV3-over UBE2NL or HIST2H3PS2 EXs
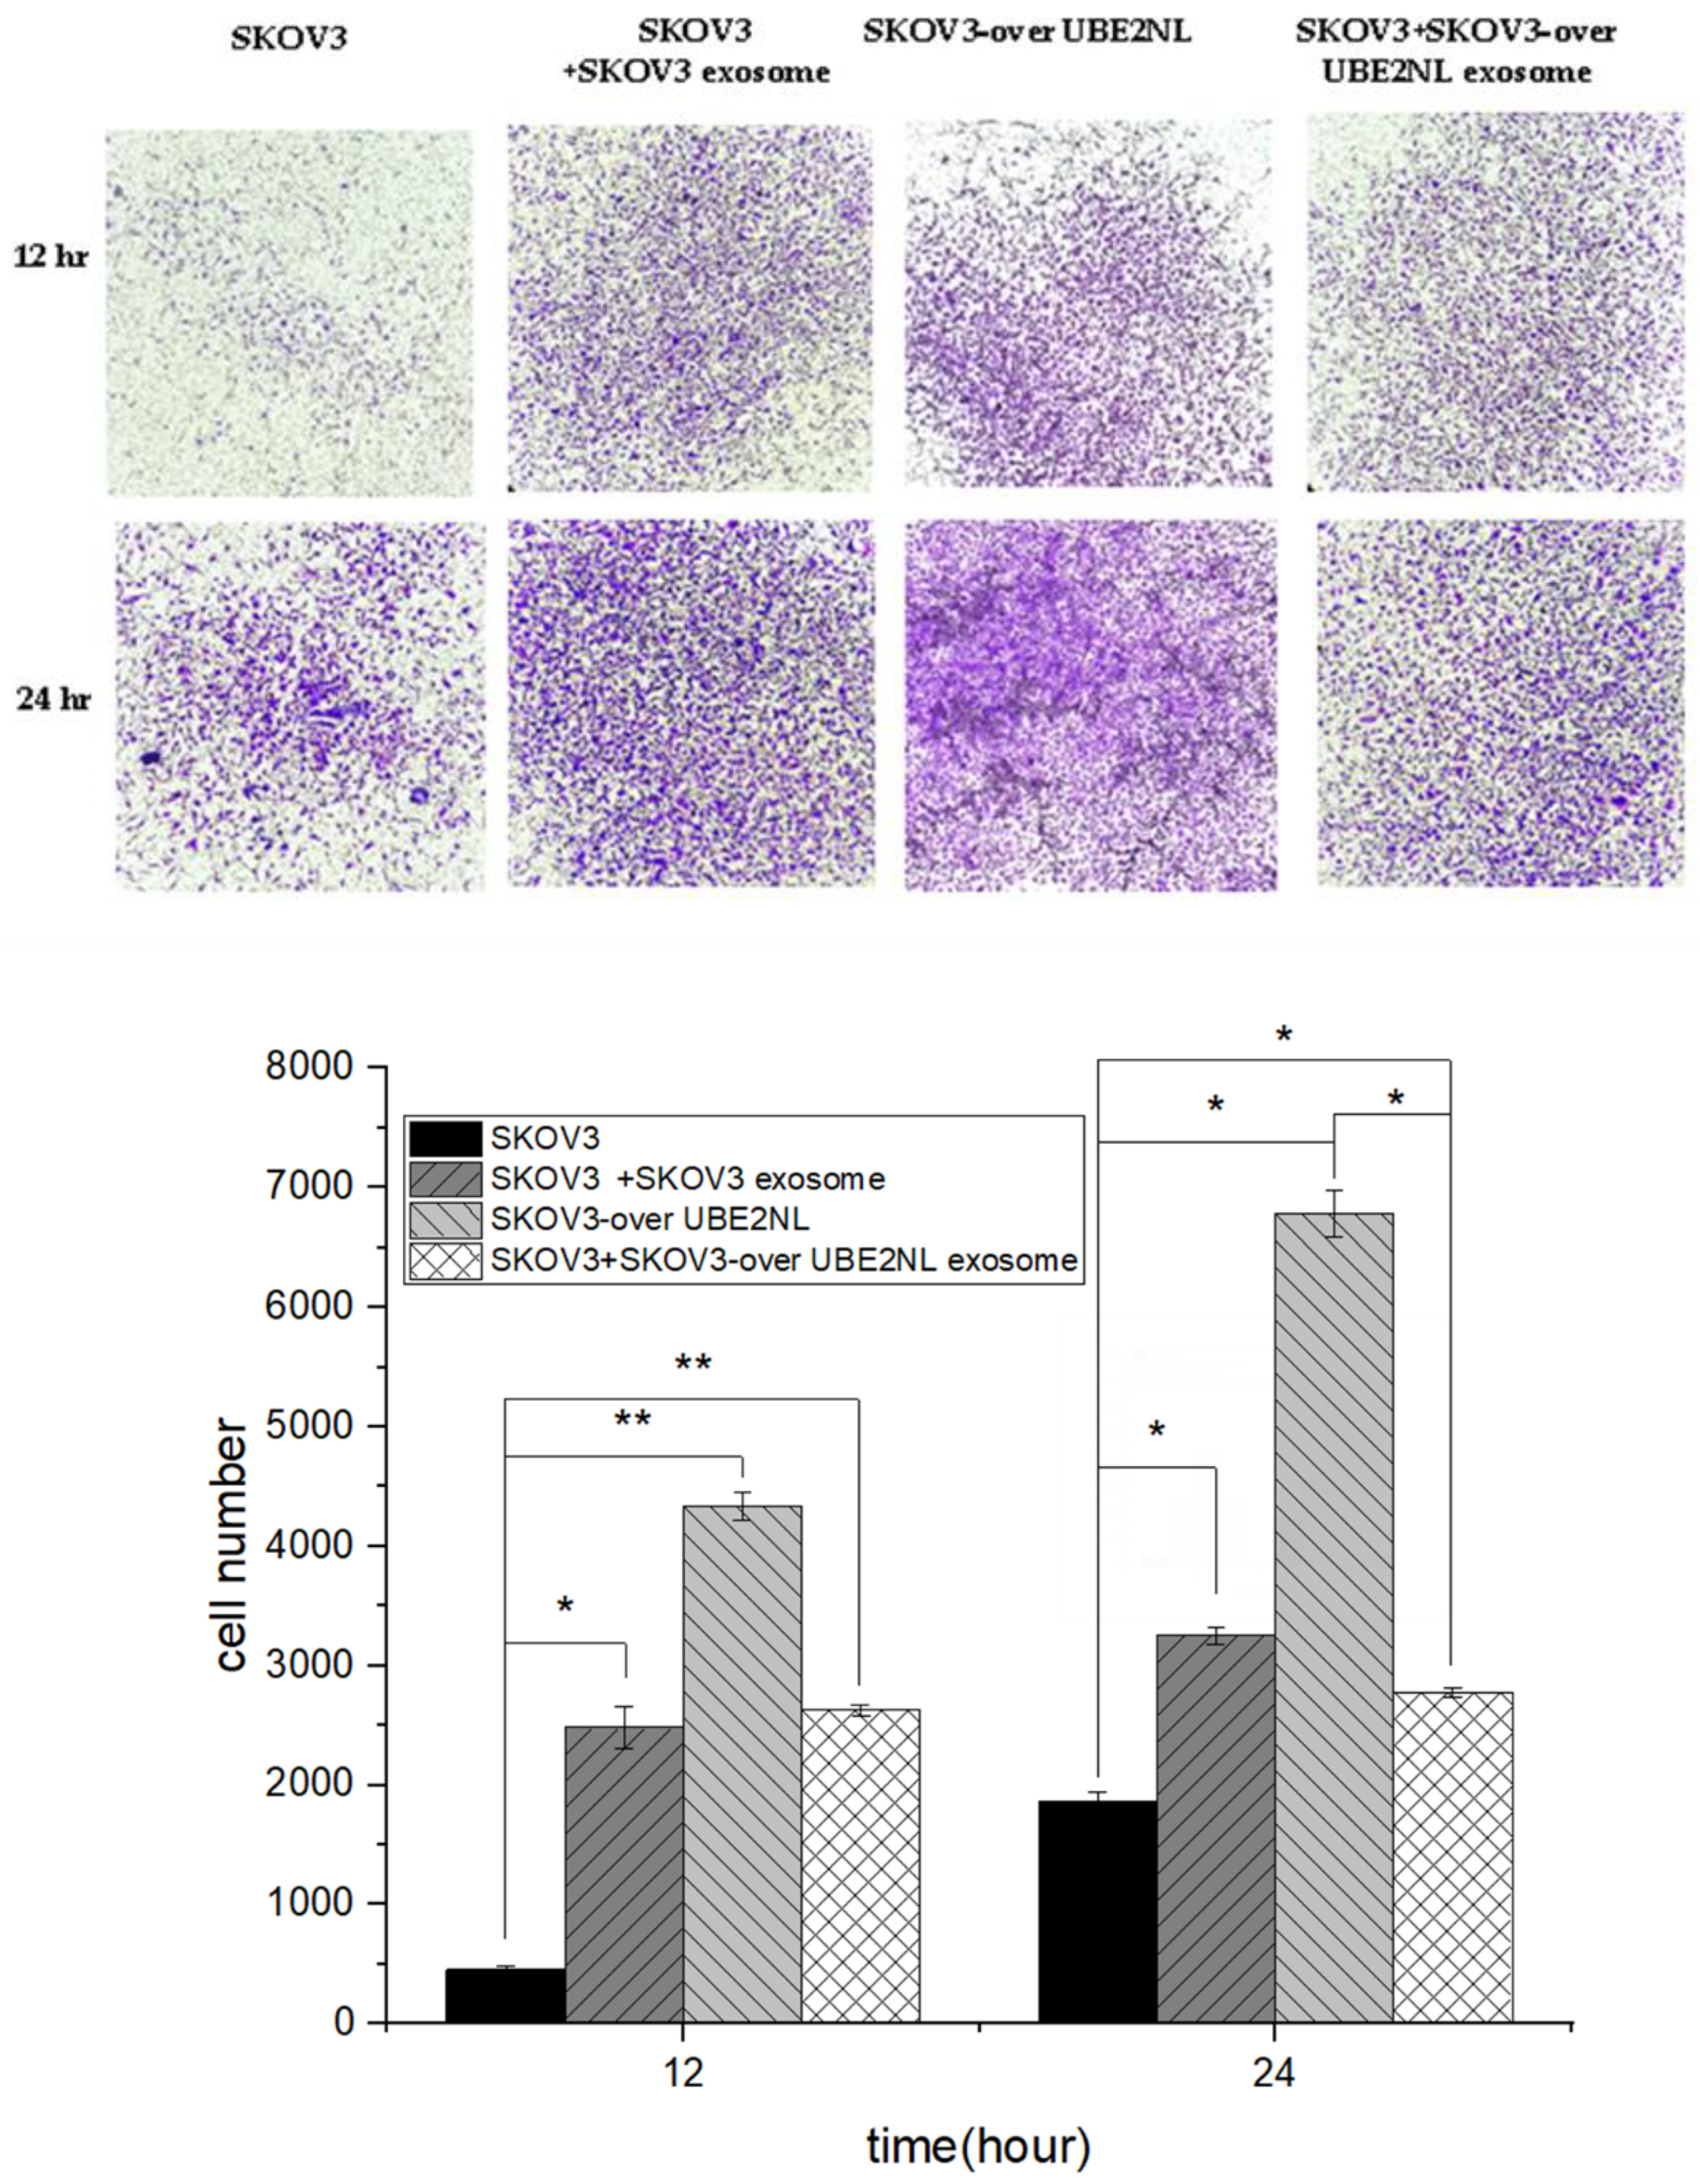
Moreover, the invasion ability was greater in SKOV3/UBE2NL or SKOV3/HIST2H3PS2 cells than in less SKOV3 cells with SKOV3/UBE2NL or SKOV3/HIST2H3PS2 EXs (p<0.05 for SKOV3/UBE2NL, p<0.01 for SKOV3/HIST2H3PS2) (
Figure 7).
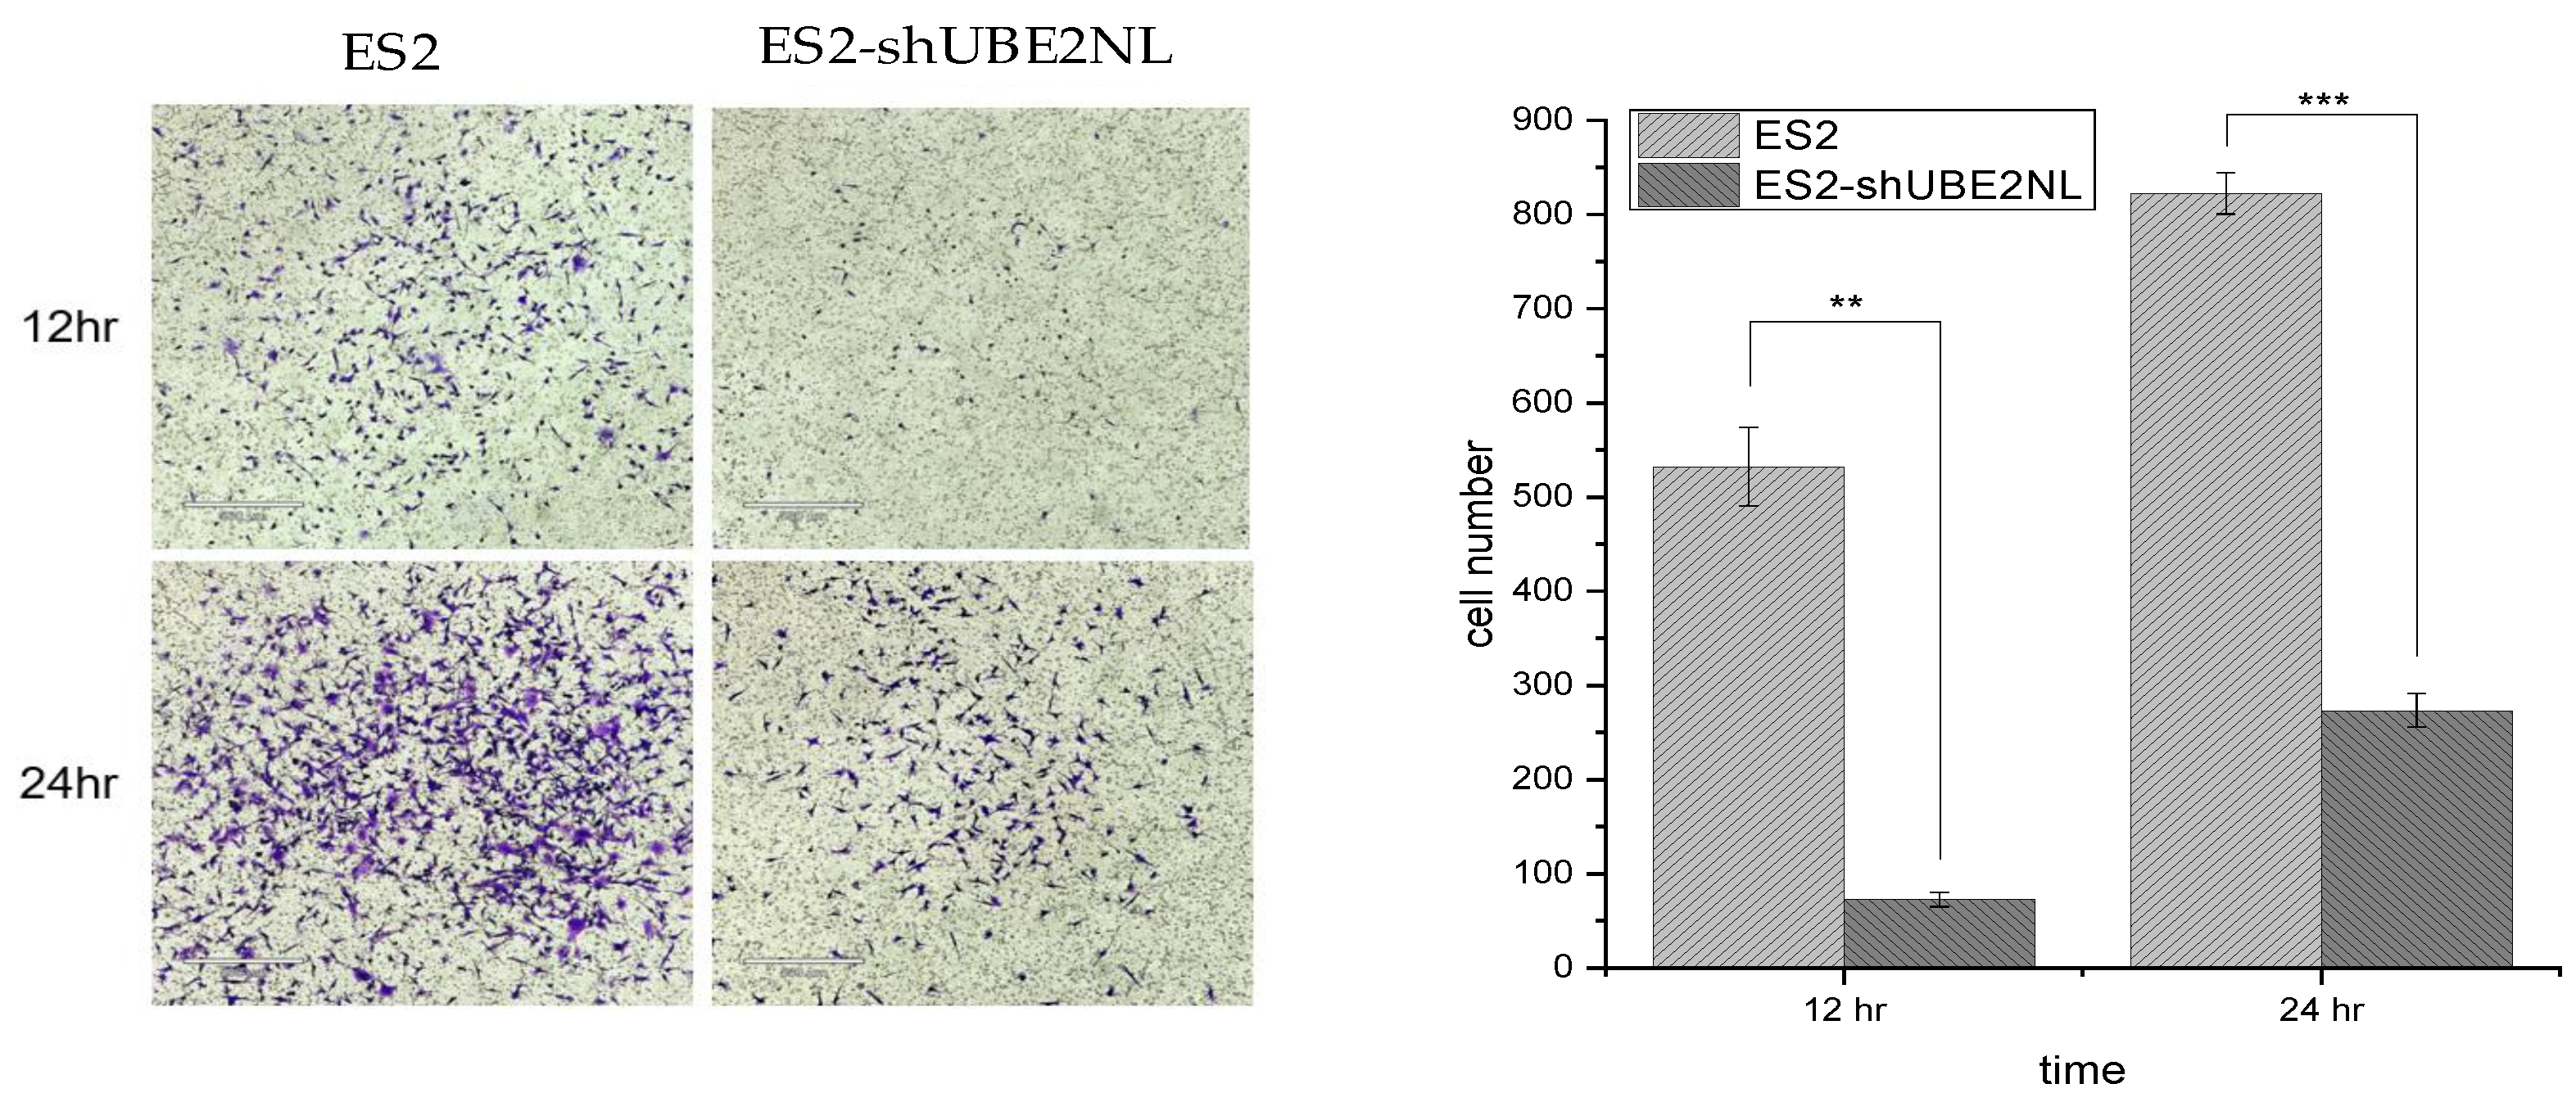
2.8. The Invasion Ability of ES2, ES2/shUBE2NL Cells
In contrast, the invasion ability was significantly decreased in ES2 knockdown UBE2NL (ES2/shUBE2NL) cells compared to ES2 cells (p<0.001) (
Figure 7).
Figure 8.
Knockdown UBE2NL decreased the invasion ability. The invasion ability of ES2 knockdown UBE2NL (ES2/shUBE2NL) cells was significantly lower than that in ES2 cells (p<0.001).
Figure 8.
Knockdown UBE2NL decreased the invasion ability. The invasion ability of ES2 knockdown UBE2NL (ES2/shUBE2NL) cells was significantly lower than that in ES2 cells (p<0.001).
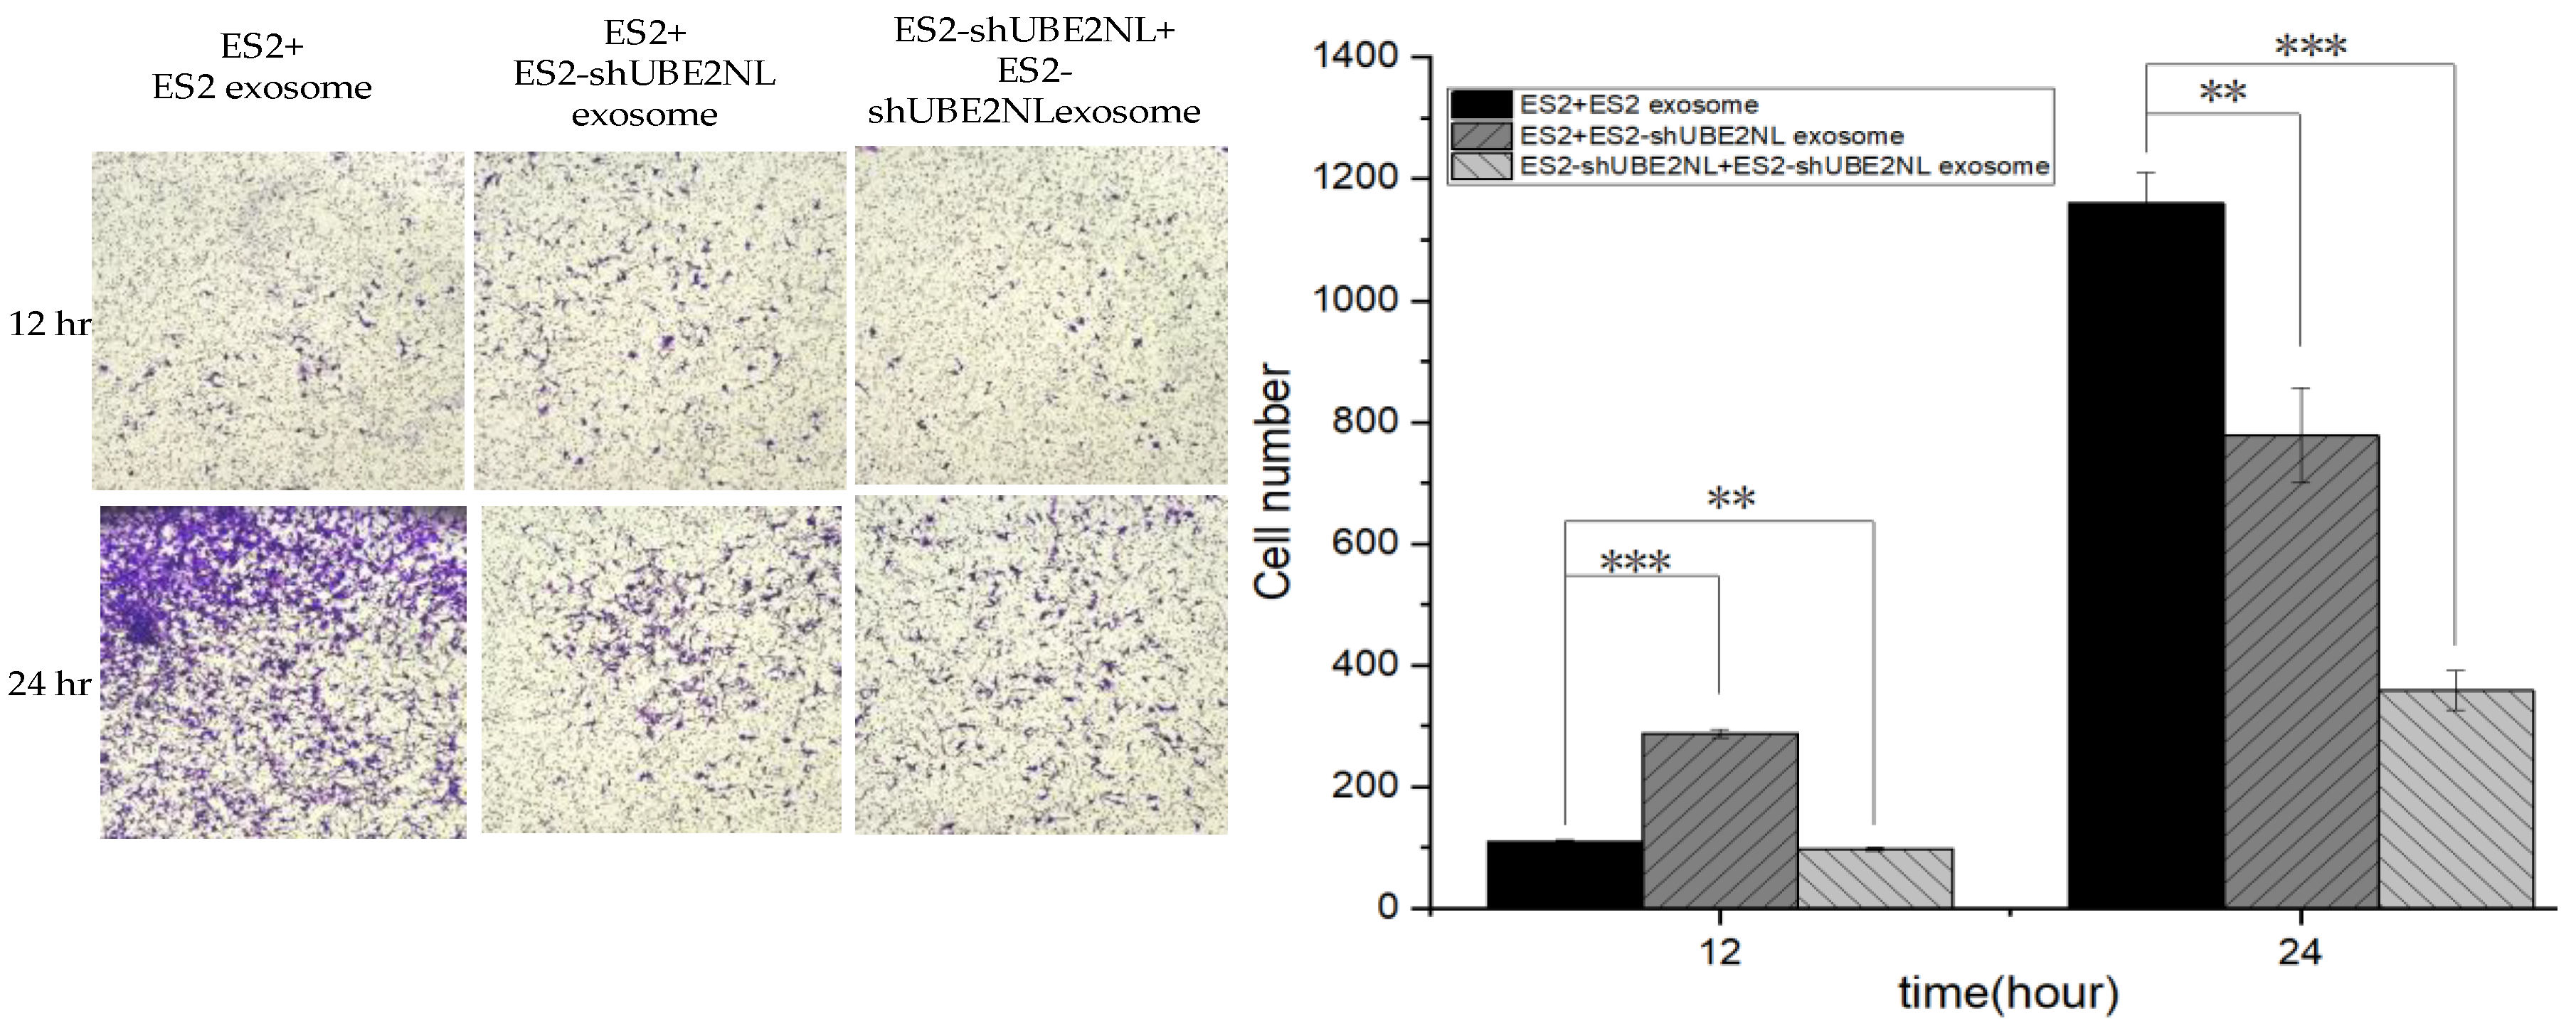
2.9. The Invasion Ability of ES2 with ES2 EXs, ES2 with ES2/shUBE2NL EXs, and ES2/shUBE2NL with ES2/shUBE2NL EXs
In addition, the invasion ability was significantly decreased in ES2/shUBE2NL cells with ES2/shUBE2NL cell EXs compared with ES2 cells with ES2/shUBE2NL EXs (p<0.01) and ES2 cells with ES2 EXs (p<0.001) (
Figure 9).
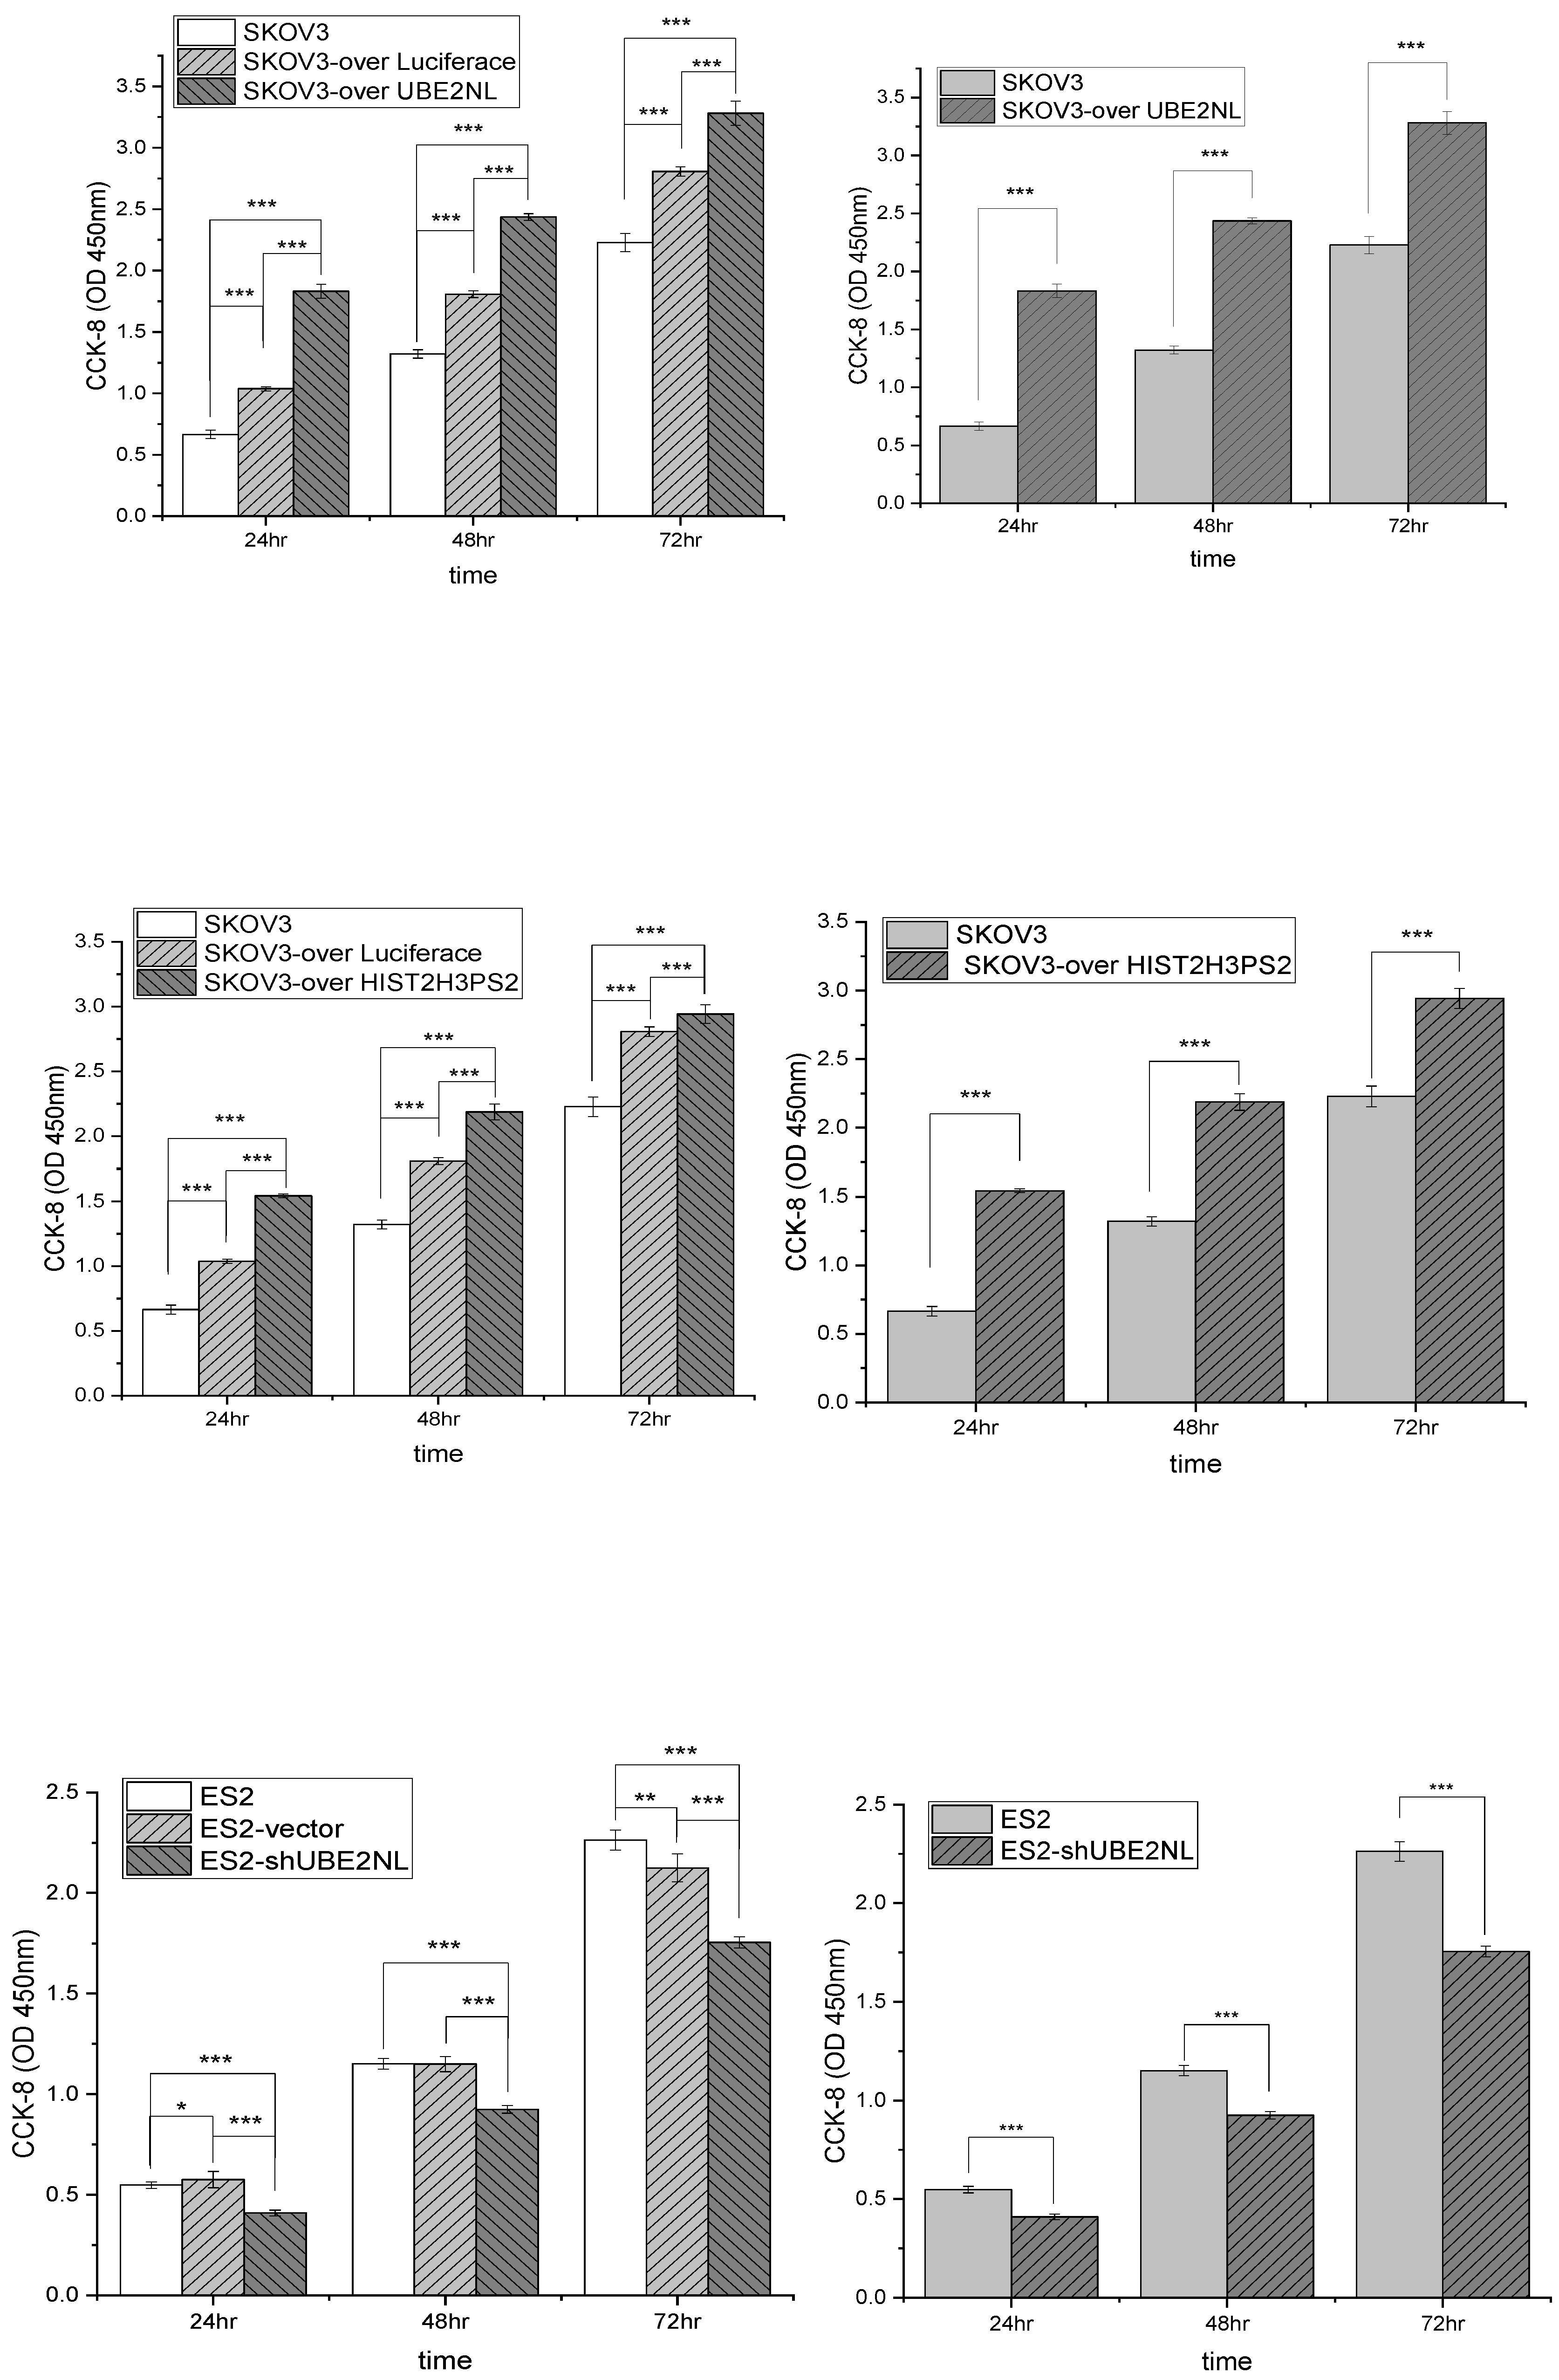
2.10. The Cell Viability by CCK8 in SKOV3, SKOV3-Over Luciferase, and SKOV3-over UBE2NL or HIST2H3PS2, ES2 Vector, and ES2/shUBE2NL
The cell viability analyses by CCK8 were significantly higher in SKOV3/UBE2NL and SKOV3/HIST2H3PS2 cells than in SKOV3 cells (both p<0.001) (
Figure 9, upper and middle). In contrast, the cell viability analyses by CCK8 were significantly lower in SKOV3/shUBE2NL cells than in SKOV3 cells (p<0.001) (
Figure 10, lower).
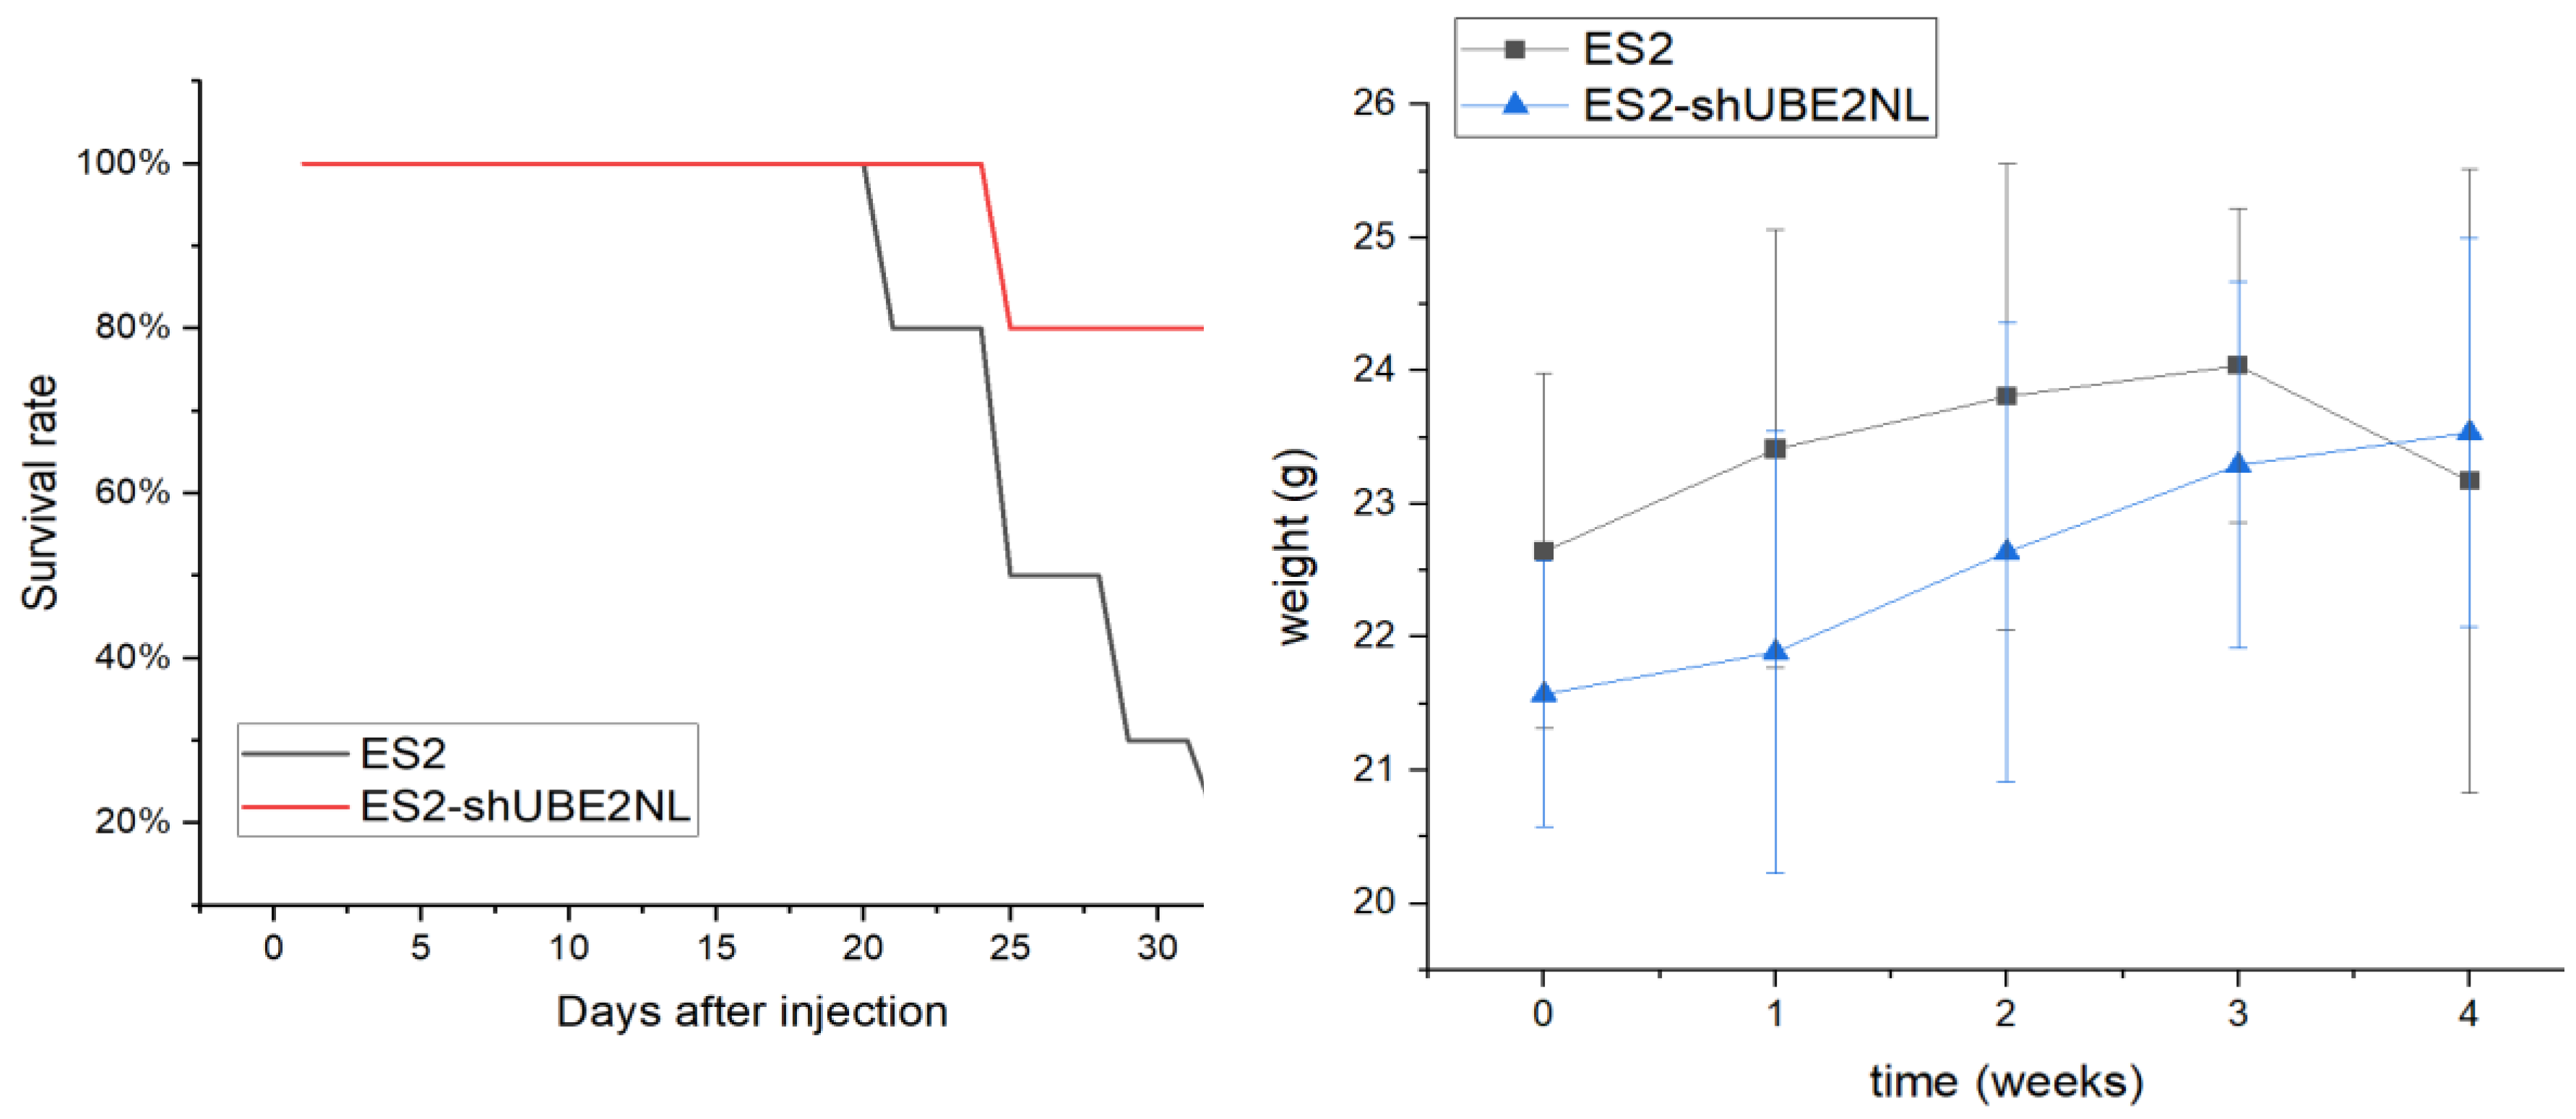
2.11. The In Vivo Experiment of IP Injection with ES2 and ES2/shUBE2NL Cells
In the in vivo experiment, 8 out of 10 mice expired after IP injection of 1×10
6 ES2 cells, compared to 2 out of 10 mice that expired after IP injection of 1×10
6 ES2 (shUBE2NL) on the 32nd day (p=0.007) (
Figure 11). The body weights before and after IP injection cells in 2 groups were not significantly different (p = 0.262, p = 0.139, respectively) (
Figure 11).
2.12. The Disseminated Tumor Number in IP Injection with ES2 Cells and ES2/shUBE2NL Cells
In addition, the average disseminated tumor number in the peritoneal cavity was significantly lower in mice (n=5) receiving intraperitoneally injected with 1×10
6 ES2/shUBE2NL cells than in mice injected with 1×10
6 ES2 cells (
Figure 12).
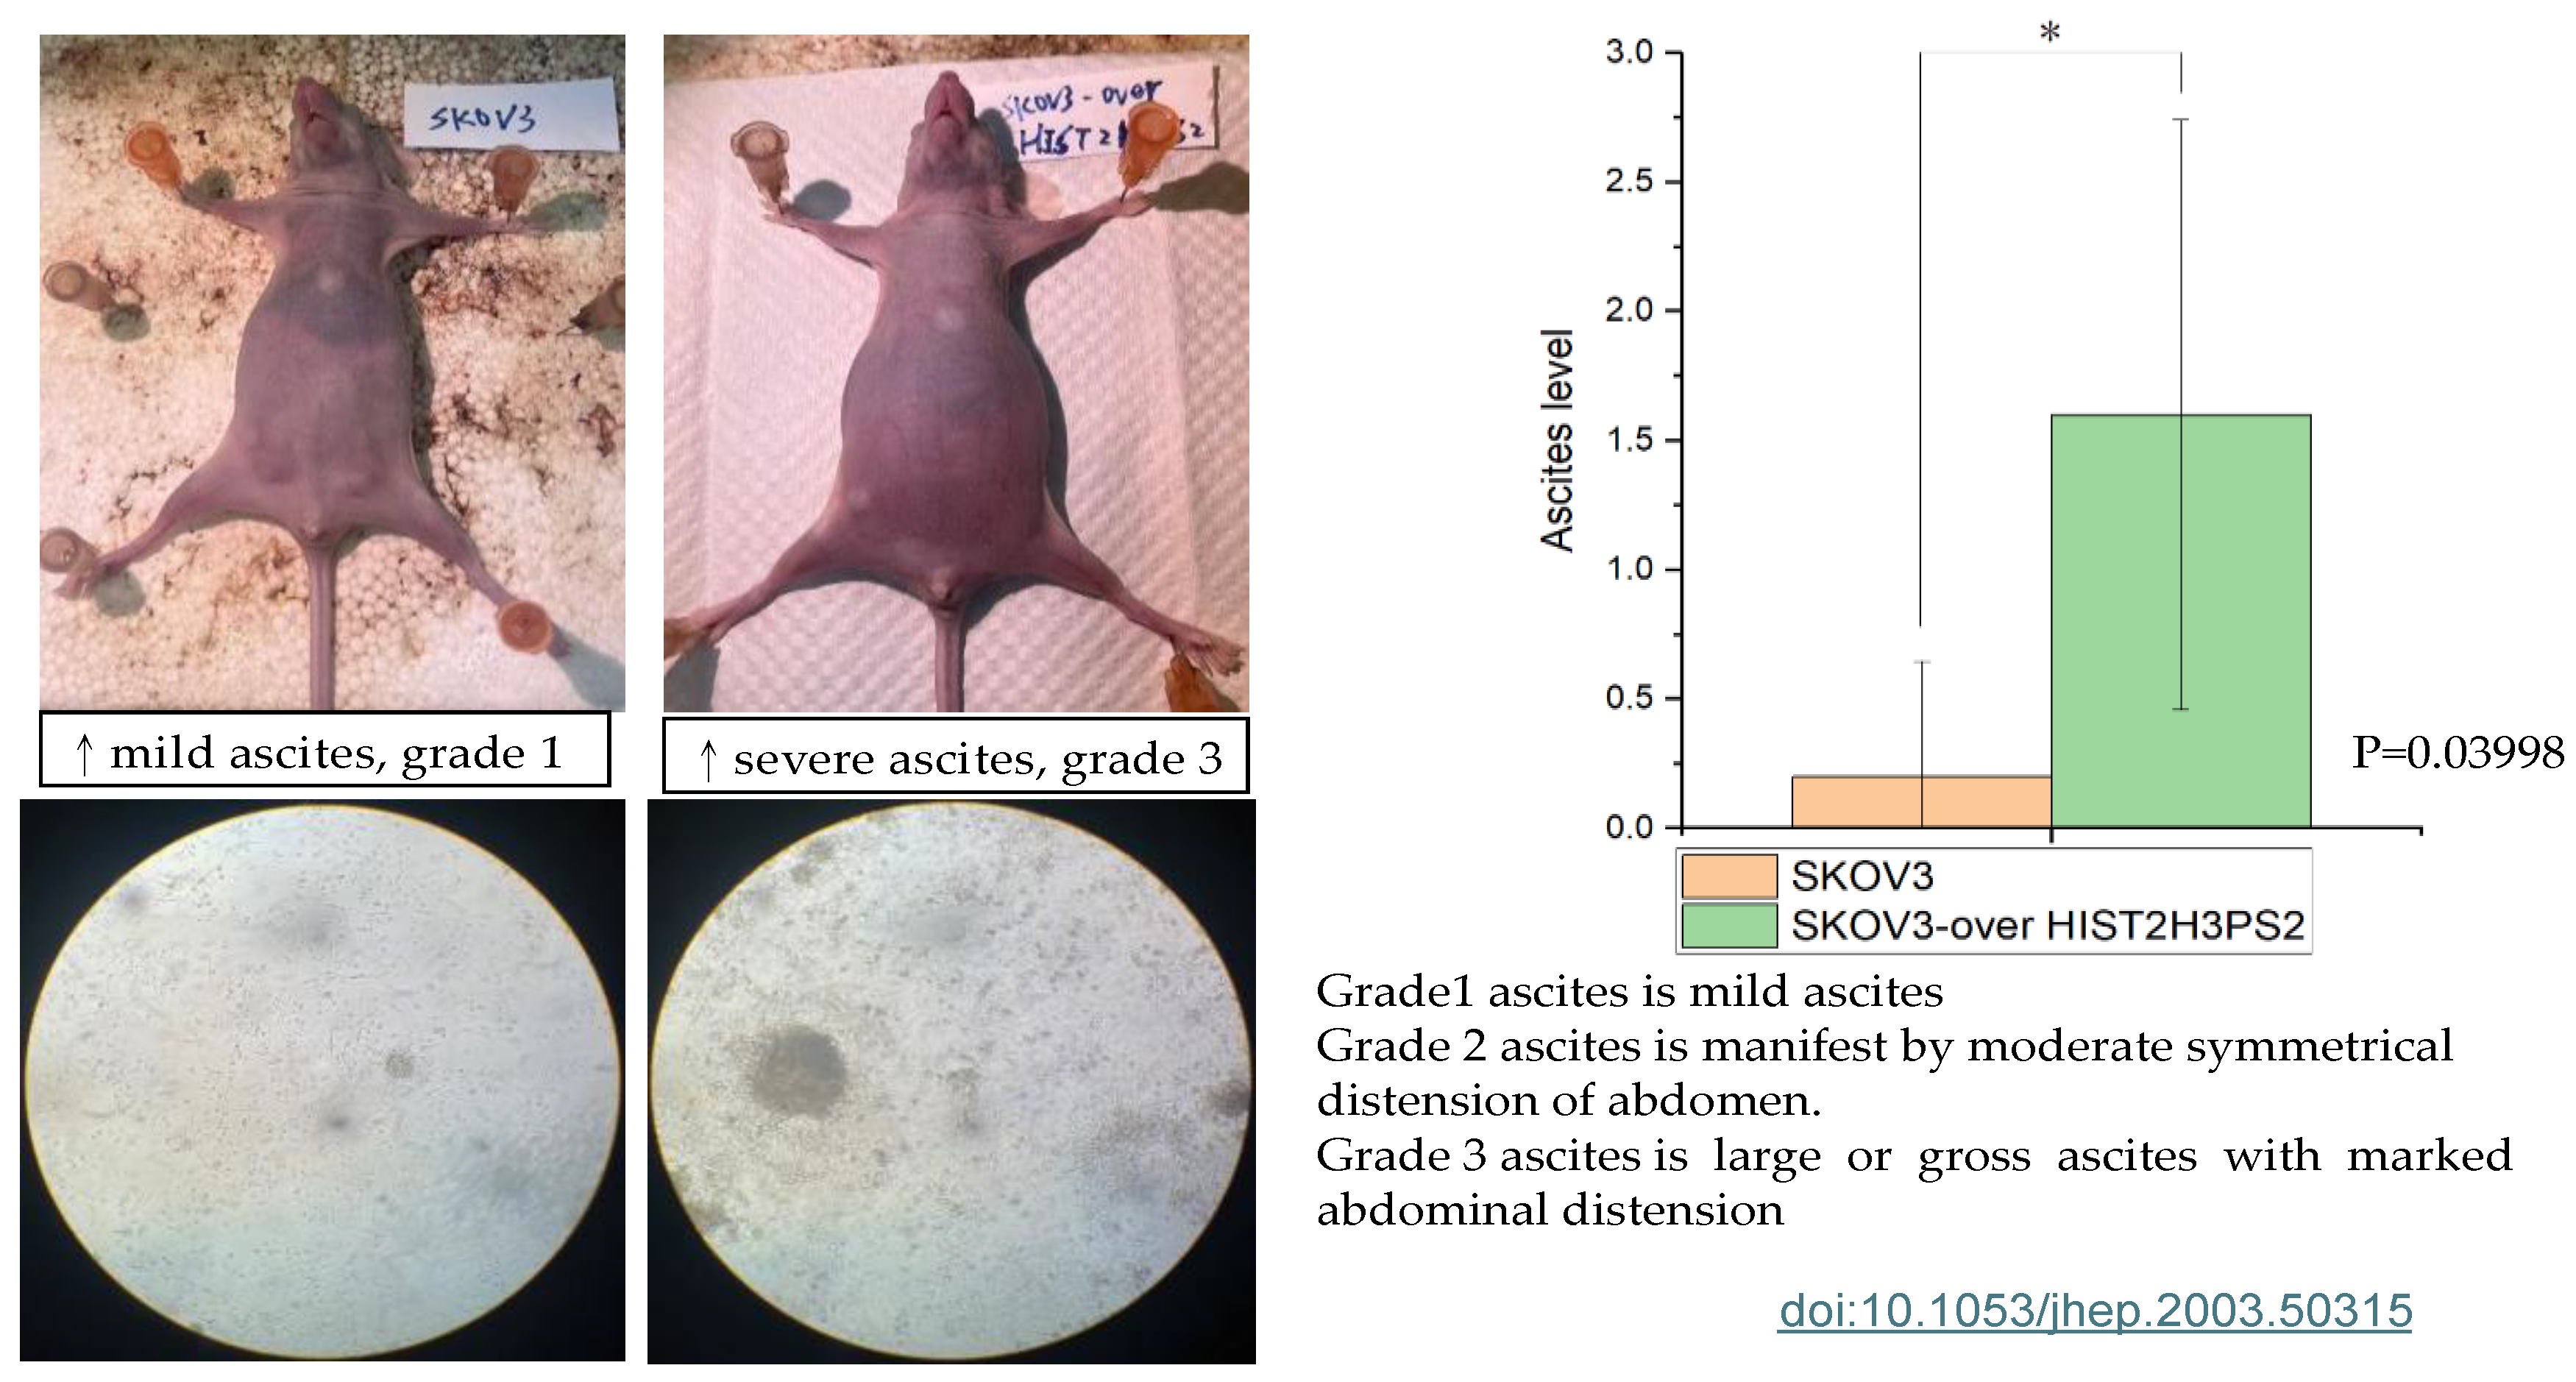
2.13. The Severity of Ascites in the Peritoneal Cavity in Mice Receiving SKOV3/HIST2H3PS2 or SKOV3 Cells
Figure 13.
The severity of ascites in mice. The bar chart represents the severities of ascites in the gross and microscopic pictures in the peritoneal cavity when mice receive SKOV3/HIST2H3PS2 and SKOV3 cells.
Figure 13.
The severity of ascites in mice. The bar chart represents the severities of ascites in the gross and microscopic pictures in the peritoneal cavity when mice receive SKOV3/HIST2H3PS2 and SKOV3 cells.
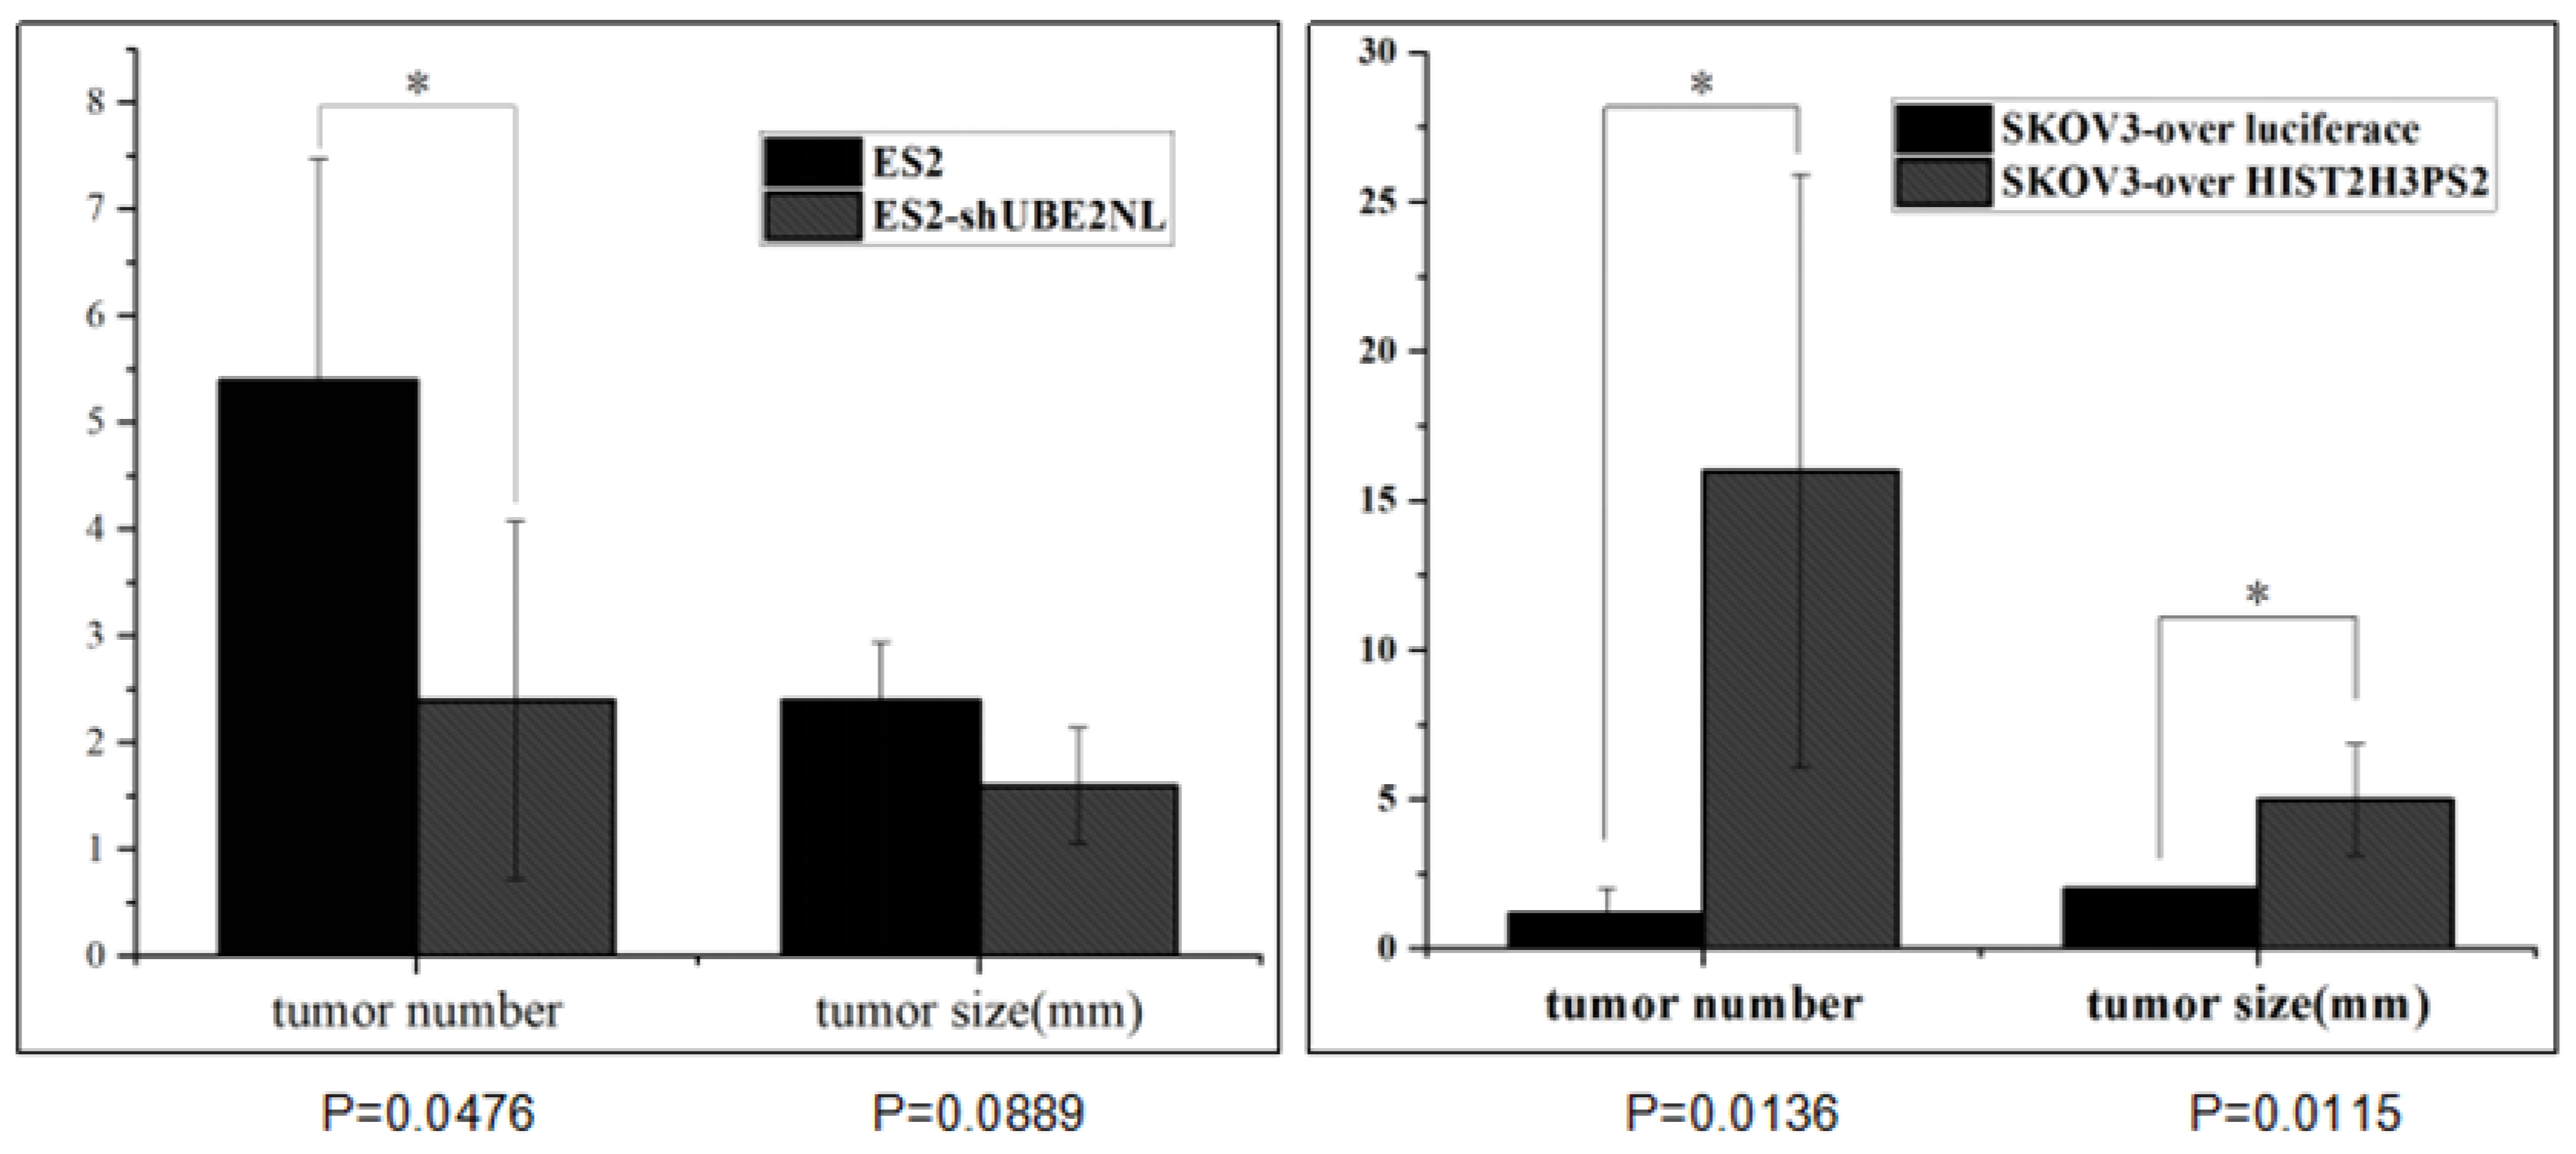
2.14. The Disseminated Tumor in Mice Receiving IP Injection with SKOV3/HIST2H3PS2 Cells and SKOV3/HIST2H3PS2 EXs or SKOV3 Cells with SKOV3 EXs
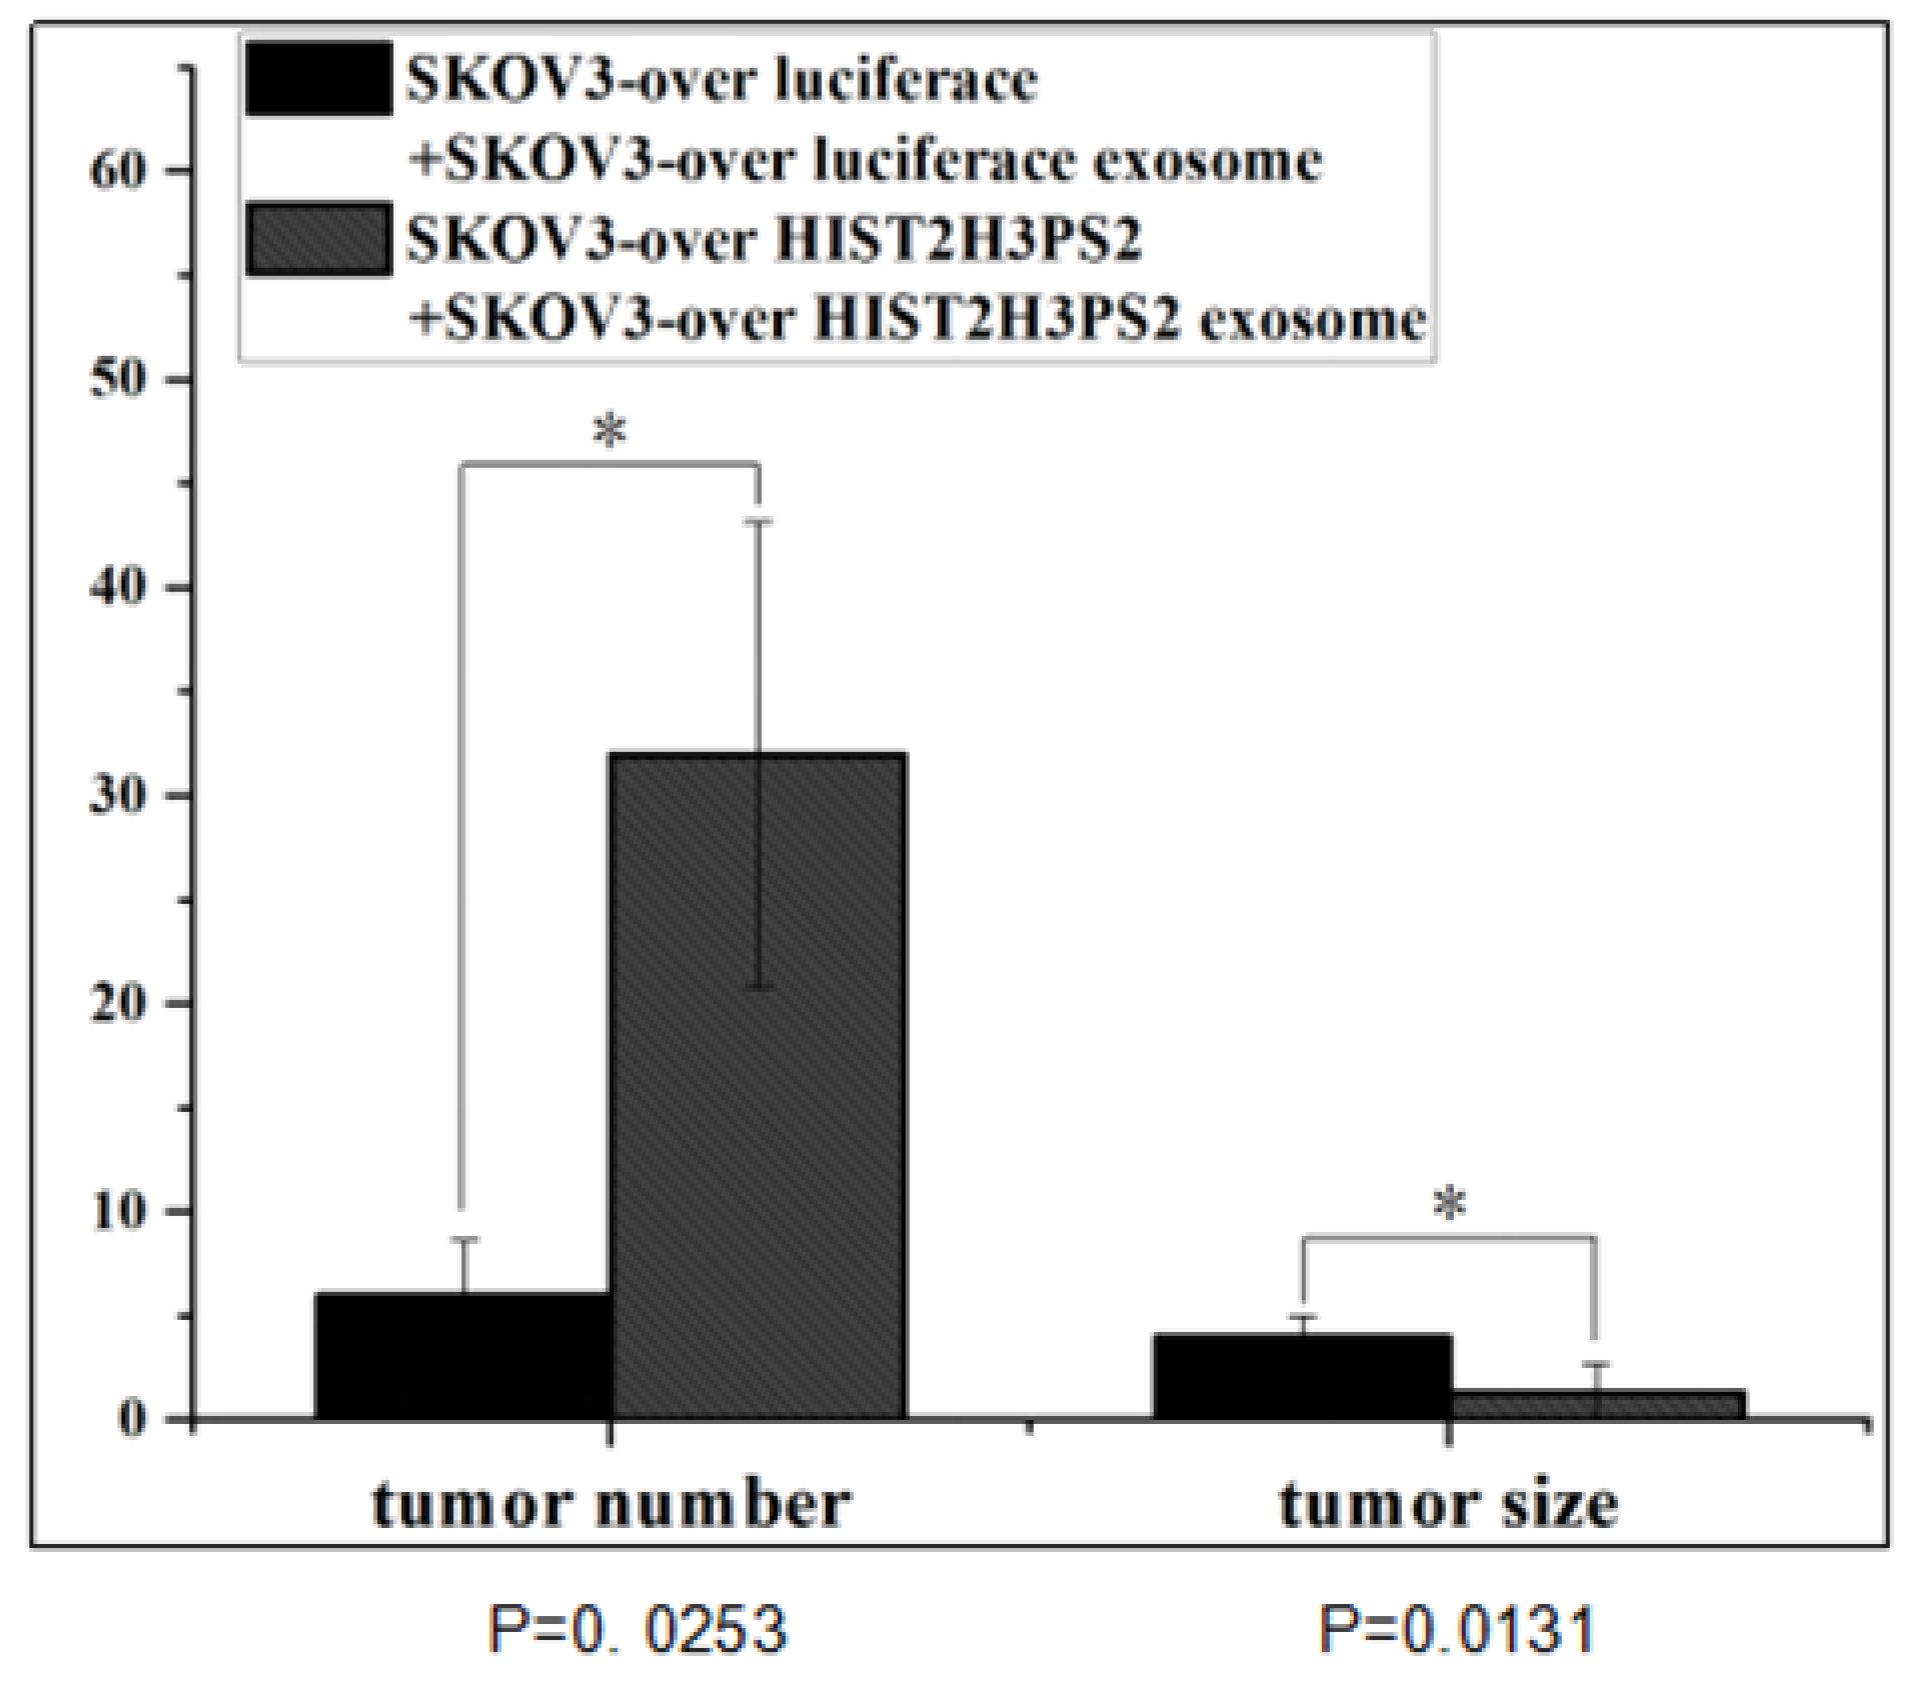
In addition, the disseminated tumor number in the peritoneal cavity was significantly greater in mice receiving intraperitoneally injected with 1×10
6 SKOV3/ HIST2H3PS2 cells with EXs than in mice injected with 1×10
6 SKOV3-over luciferase cells with EXs (p<0.05, by student’s t-test) (
Figure 14).
2.15. Treatment EX Inhibitor in ES2 Cells
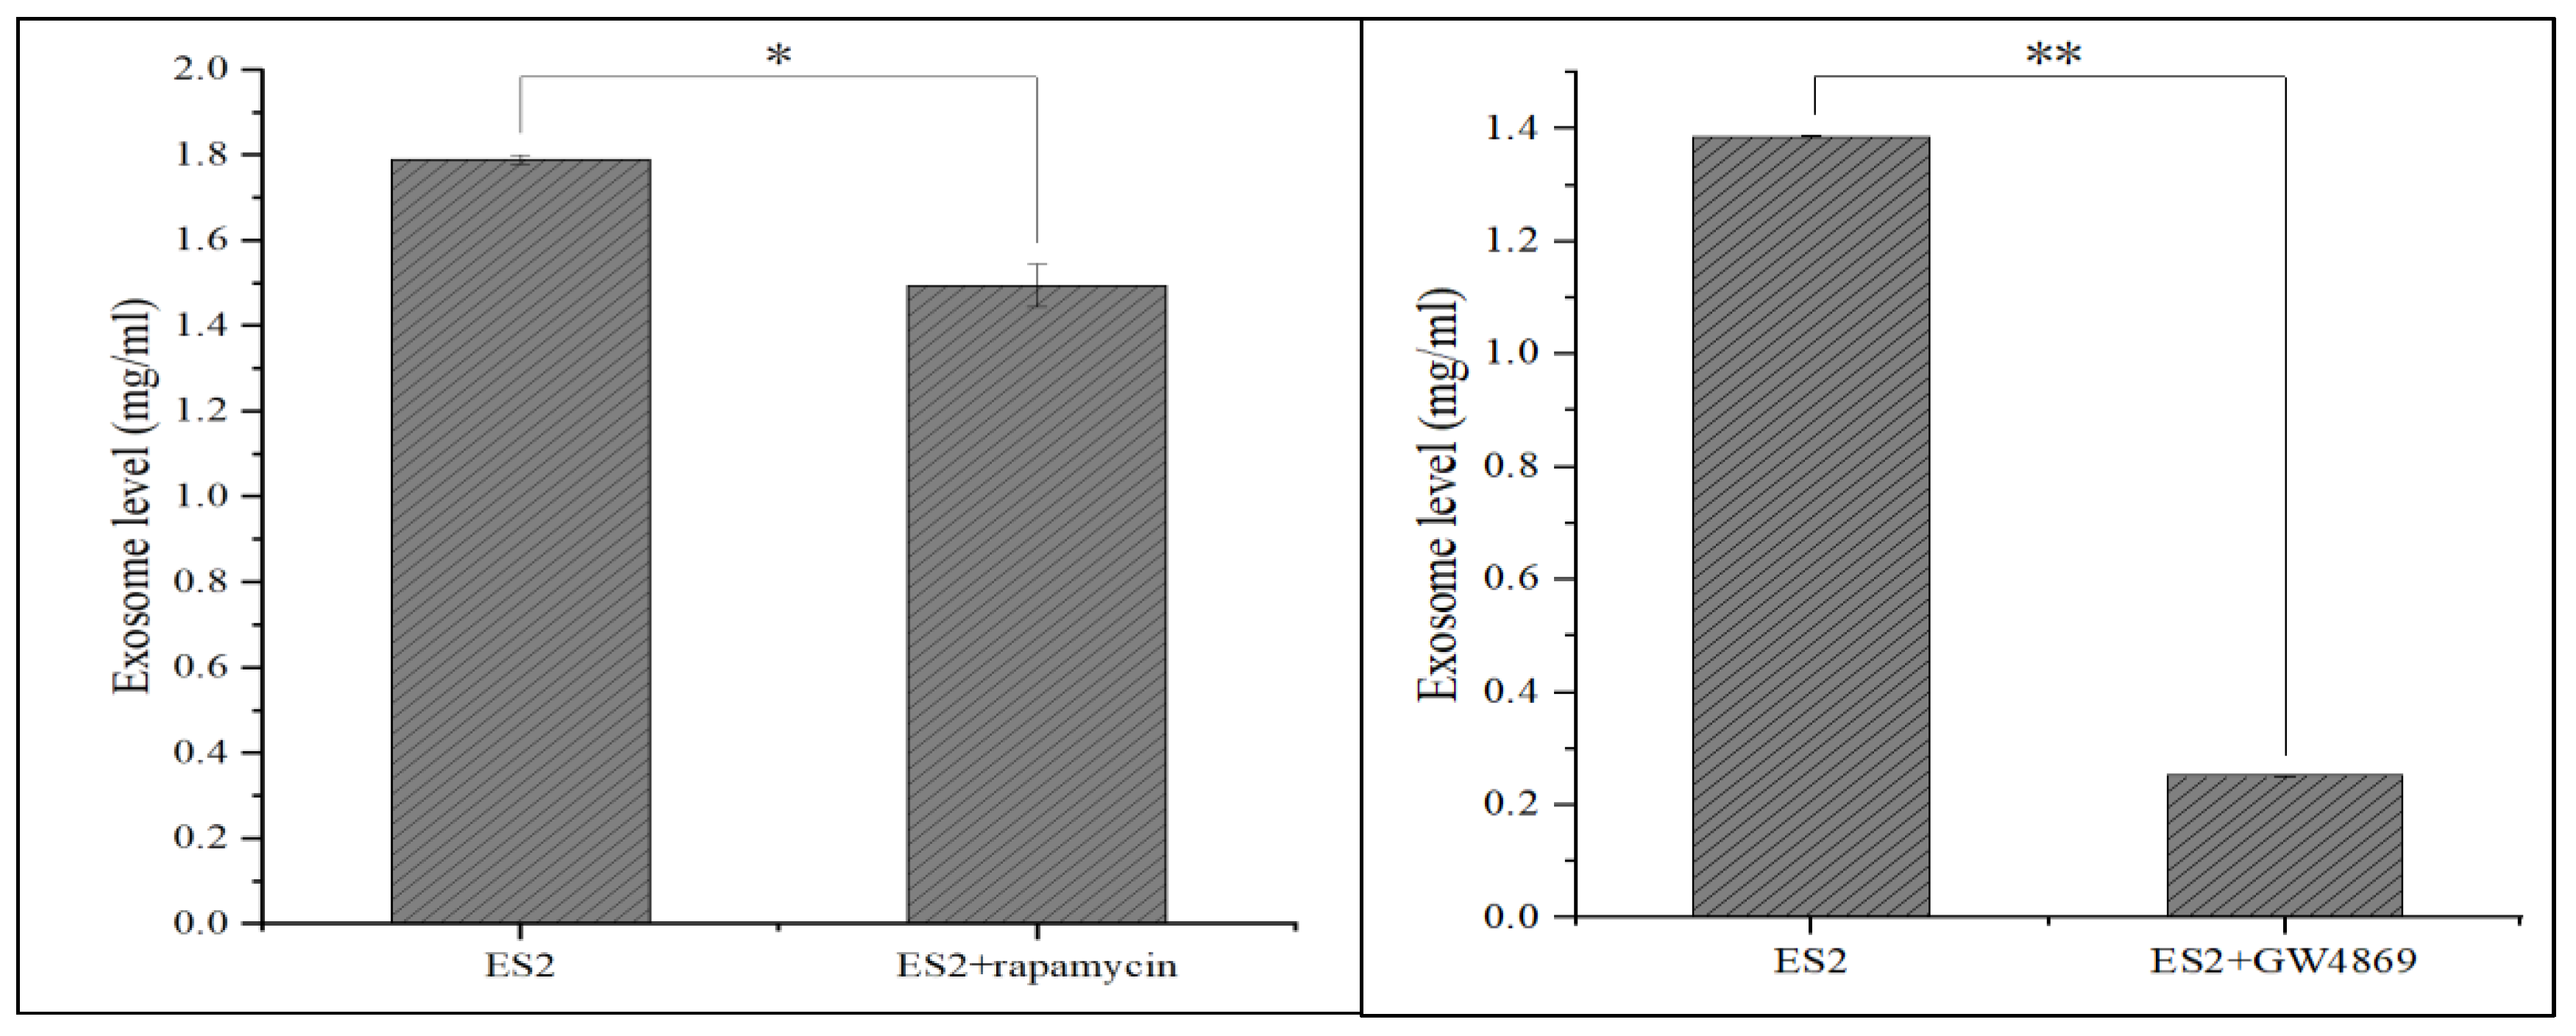
Treatment with EXs inhibitor 10uM GW4189 or 500 nM rapamycin in ES2cells significantly decreased ES2 autocrine EXs level, which may further inhibit the aggressiveness in EOC (p<0.05 for rapamycin, p<0.01 for GW4869) (
Figure 15).
3. Discussion
We first found high expressions of UBE2NL and HIST2H3PS2 in EOC patients with poor survival outcomes from TCGA data (p<0.01) and validated them in our EOC samples (p<0.05) from all subtypes of EOC patients. UBE2NL and HIST2H3PS2 expression was significantly higher in the advanced stage than in the early stage in our EOC patients. UBE2NL and HIST2H3PS2 expression was higher in ES2 paclitaxel-resistant and ascites-derived MSC-OCSPCs cells and EXs. Notably, high HIST2H3PS2 expression was associated with poor survival outcomes in all stages (p<0.001) and advanced stages (<0.0001) in EC patients. This study highlights the critical discovery of elevated UBE2NL and/or HIST2H3PS2 expression in patients with EOC and EC and their association with poor survival outcomes. These findings suggest that UBE2NL and HIST2H3PS2 could become biomarkers for disease progression and potential therapeutic targets in gynecologic cancer.
Ubiquitin-conjugating enzymes (E2s), such as UBE2N, have gained attention as potential targets for cancer treatment due to their involvement in critical processes like DNA repair, immune signaling, and tumor development [
25,
26]. UBE2N expression is associated with poor outcomes in breast cancer patients, especially those with metastatic lung colonization [
27]. It plays a crucial role in the DNA damage response (DDR) by partnering with UBE2V2 to modify essential proteins like PCNA and p53, which regulate the cell cycle [
28]. UBE2N's role in K63-linked ubiquitination is crucial for recruiting DNA repair proteins to damaged sites, and its malfunction can lead to genomic instability and cancer progression [
29]. Overexpression of UBE2N is linked to chemotherapy resistance and poor prognosis in several cancers, as it enables tumors to survive despite DNA damage and boosts NF-κB signaling, fostering a pro-tumor inflammatory environment [
30,
31].
On the other hand, UBE2NL is less well-studied compared to UBE2N. While it has a specialized function in specific tissues, research indicates that UBE2NL might participate in similar pathways, but its exact roles are not yet fully understood. Although its function is less understood, UBE2NL may still play roles in protein degradation pathways relevant to cancer. The ubiquitin-proteasome degradation pathway reveals that UBE2NL, like UBE2N, binds to the ubiquitin-conjugating enzyme E2 variant 2 (E2V2) to form a heterodimer [
32]. This UBE2NL-E2V complex interacts with the RING finger domain of E3 ubiquitin ligase, playing a role in polyubiquitination and cell cycle progression [
33].
HIST2H3PS2, a gene related to histone H3, has been explored in ovarian cancer research [
24], although its specific function remains somewhat unclear. Studies have indicated that epigenetic modifications, particularly those involving histones, play a significant role in ovarian cancer [
30]. Abnormal histone modifications can lead to the dysregulation of oncogenes and tumor suppressor genes, which contributes to cancer progression [
35]. For instance, histone deacetylases (HDACs) are often overexpressed in ovarian cancer, promoting tumor growth by repressing tumor suppressor genes [36]. These suggest that genes related to histones, like HIST2H3PS2, might indirectly influence cancer progression through their role in chromatin remodeling. Although the precise role of HIST2H3PS2 in ovarian cancer is not fully clarified, its involvement in histone modification processes highlights the crucial role of epigenetic regulation in the pathology of this disease.
In this study, we used the SKOV3 cell line as a model for gynecologic cancer study because the SKOV3 cell line is not actual ovarian cancer cell line. SKOV3 cell is a gynecologic high-grade carcinoma derived from either uterine or ovarian serous carcinoma. we found that the overexpression of UBE2NL and HIST2H3PS2 in SKOV3 cells significantly enhanced their invasive capacity, indicating a potential role for these genes in promoting tumor aggressiveness. Notably, cells overexpressing these genes showed even higher invasive abilities when combined with their respective exosomes (EXs), emphasizing the importance of EX-mediated communication in enhancing tumor progression. In contrast, knocking down UBE2NL or inhibiting EX production reduced the invasiveness of cancer cells, highlighting a critical role for autocrine EXs in maintaining the aggressive phenotype of these cancer cells. In vivo experiments further supported these findings, where mice injected with ES2 cells lacking UBE2NL (shUBE2NL) exhibited a significantly higher survival rate (p<0.001) and fewer disseminated tumors (p<0.05), underscoring the potential therapeutic value of targeting UBE2NL and EXs in EOC. In vivo, the experiments also supported these findings, as mice injected with SKOV3/HIST2H3PS2 cells showed more extensive tumor dissemination (p<0.01) and more severe ascites (p<0.05). In addition, the number of disseminated tumors in the peritoneal cavity was significantly higher in mice injected with SKOV3/HIST2H3PS2 cells along with EX, compared to those injected with either SKOV3 cells with EXs or SKOV3 cells with SKOV3/HIST2H3PS2 EXs (both p<0.05). These results suggest that exosomes derived from HIST2H3PS2 may contribute to increased tumor aggressiveness in gynecologic cancer, at least EOC and EC. In summary, UBE2NL and/or HIST2H3PS2 and their associated EXs play crucial roles in EOC and EC progression and could serve as valuable targets for future cancer therapies.
The implications of these results are profound. They underline the need for further research to fully elucidate the roles of UBE2NL and HIST2H3PS2 in gynecologic cancer. Understanding these mechanisms could pave the way for developing targeted therapies that inhibit these genes' functions, potentially improving survival rates for gynecologic patients. Future studies should focus on exploring the pathways regulated by UBE2NL and HIST2H3PS2, their interactions with other oncogenes, and their role in chemotherapy resistance. This research could lead to the development of novel treatment strategies and a deeper understanding of gynecologic cancer pathogenesis.
4. Materials and Methods
4.1. Samples Collection
Ovarian cancer tissues and ascites samples, obtained during surgery or for symptom relief from patients with primary or recurrent ovarian cancer, were immediately transported to the laboratory for further processing. Isolation and culture of ovarian cancer stromal progenitor cells (OCSPCs) from these samples followed established protocols.
4.2. Cell Lines and Cultures
ES2 and SKOV3 cell lines were from the American Type Culture Collection (ATCC). ES2 is a cell line exhibiting fibroblast-like morphology with clear cell carcinoma. SKOV3 is a cell line displaying epithelial morphology with gynecologic high-grade carcinoma from uterine or ovarian serous carcinoma. Cells were in a humidified atmosphere containing 5% CO2 at 37 °C and grown in McCoy's 5A medium with 10% FBS. We developed the paclitaxel-resistant ES2 cell line by continuously exposing cells to increasing the concentration of paclitaxel. The final paclitaxel concentrations to induce paclitaxel-resistant subclones called ES2TR were 160 nM.
4.3. Spheroid Formation of Ovarian Cancer Stem-Like Cells
ES2, ES2TR160, and ascites isolated from EOC patients cultured in spheroid-inducing conditions. Briefly, the cells were in DMEM/F12 medium with 20 ng/mL bFGF, 20 ng/mL EGF, 10 ng/mL IGF, and 2% B27 (Invitrogen, Carlsbad, CA). Dissociated single cells (1×10⁵ cells/mL) were in ultra-low attachment plates (Corning 3262, Pittston, PA). After seven days, we counted the spheres formed with an Olympus light microscope (Olympus, Tokyo, Japan). Then, spheroids obtained after 14 days were harvested and analyzed with flow cytometry.
4.4. Exosome Preparation
ExoQuick-TC™ Biofluid was collected and centrifuged at 3000 × g for 15 minutes to remove cells and cell debris. We transferred the supernatant to a sterile vessel to add the appropriate volume of ExoQuick-TC to the biofluid. The well was mixed by inverting or flicking the tube, refrigerating overnight (at least 12 hours) at +4°C, and centrifuging the ExoQuick-TC/biofluid mixture at 1500 × g for 30 minutes. After centrifugation, we aspirated the supernatant. We spin down the residual ExoQuick-TC solution by centrifugation at 1500 × g for 5 minutes, and all traces of fluids were aspirated out. We resuspended the exosome pellet in 100-500 μl using sterile 1X PBS.
4.5. Exosome Quantification
The concentration of exosomes was determined using a Bradford protein assay (SIGMA, B6916). Exosome samples were diluted in sterile 1X PBS and mixed with Bradford reagent according to the manufacturer’s instructions. After room temperature incubation, we measured the absorbance at 595 nm. We prepared the standard curve using bovine serum albumin (BSA) to calculate the concentration of exosomes, expressed as mg/mL.
4.6. UBE2NL, and HIST2H3PS2: Knockdown and Overexpression
We purchased the UBE2NL and HIST2H3PS2 knockdown and overexpression plasmids from the National RNAi Core Facility at Academia Sinica in Taiwan. For UBE2NL knockdown in ES2 cells, we used human pLKO TRC005 lentiviral shRNA plasmids (TRCN0000365724) targeting the sequences 5’-ACCCAGACATCTTCAGTTATT-3’. After infection, we treated with puromycin (2 ug/mL) to select the infected cells. For UBE2NL and HIST2H3PS2 overexpression in SKOV3 cells, we used the cDNA fragment encoding UBE2NL and HIST2H3PS2 cloning into pLAS3w.Ppuro, which is in NheI and PmeI sites of a puromycin-resistant lentiviral vector from the National RNAi Core Facility at Academia Sinica in Taiwan.
4.7. UBE2NL and HIST2H3PS2 Gene qPCR Preparation and Quantitative Real-Time Polymerase Chain Reaction
RNA was isolated by RNA purification kits from MACHEREY-NAGEL and stored at −80°C before use. We evaluated the RNA quantity and quality by spectrophotometric analysis. We subjected one microgram of total RNA to synthesizing the first-strand cDNA using the High Capacity cDNA Reverse Transcription Kit (Thermofisher). We performed one microliter of the reverse transcription product used for PCR amplification in a final 10-μl with the following conditions: 950 C for 2 minutes, followed by 60 cycles of 950 C for 10 seconds, 600 C for 20 seconds, and a final cooling step of 400C for 30 seconds. We amplified the genes with primers designed by Roche as below: We used GAPDH as an internal control, and the software analysis was applied using Roche LightCycler Software 4.05. The PCR product was detected using the specific primers of UBE2NL forward, 5'-GCAGAACCAGATGAAAGCAAC GC -3’ and reverse, 5’-GGGCTGCCATTGGGTATTCTTC -3’; and HIST2H3PS2 forward, 5’-GCTGTTCGAAGACACGAACC-3’ and reverse, 5’-CGGCTGACCAACTGGATGT-3’; GAPDH forward, 5’-GAGTCAACGGATTTG GTCGT-3’ and reverse; 5’-TTGATTTTGGAGGGATCTCG-3’ on a StepOne Plus RealTime PCR System (Applied Biosystems; Thermo Fisher Scientific, Inc., Austin, TX, USA) using the SYBR Green PCR Kit (QIAGEN GmbH, GERMANY). We calculated the relative mRNA expression levels using the 2 −∆∆Ct method, and GAPDH served as an internal control.
4.8. Cell Proliferation and Viability Assays by CCK8 Assay
The cell proliferation and viability of SKOV3, SKOV3-overluciferase, SKOV3/UBE2NL, SKOV3/HISH2T3PS2, ES2, ES2 vector, ES2/shUBE2NL cells were assessed by CCK8 (DOJINDO) assay. Briefly, cells (10,000 cells/well) in a 96-well plate were exposed to the culture medium and served as a control. CCK8 was added to the cells at the final 0.5 mg/ml and incubated at 370 C for two hours. At the end of incubation, the optical density was measured at 450 nm using a universal microplate reader Elx 800 (Bio-tek Instruments). Dishes determined cell proliferation. Briefly, SKOV3, SKOV3-overluciferase, SKOV3/UBE2NL, SKOV3/HISH2T3PS2, ES2, ES2 vector, ES2/shUBE2NL ES2 cells (1x10⁴ cells/well in 6-well plate) were transfected with SKOV3-overluciferase, SKOV3/UBE2NL, SKOV3/HISH2T3PS2, shUBE2NL, or HIST2H3PS2, in growth media for 6 days at 5% CO2 at 370 C. We counted the plates in the microscope.
4.9. LC-MS/MS analysis Protein Digestion and Dimethyl Labeling of Peptides
We used the reduced condition mediums with 10 mM dithiothreitol, alkylated with 50 mM iodoacetamide, and digested with Lys-C and trypsin. The digested peptides were labeled with isotopic formaldehyde (13CD2O, heavy labeled) and formaldehyde (CH2O, light labeled), respectively. Equal amounts of the heavy and light labeled peptides were mixed and desalted with StageTips with Empore™ SDB-CX disc membrane (3M, St. Paul, MN, USA). NanoLC-MS/MS analyses. The peptides were analyzed using nanoLC-MS/MS on a Dionex 3000 RSLC nanosystem (Thermo Fisher Scientific) and online coupled to an LTQ Orbitrap XL mass spectrometer (Thermo Fisher Scientific). The supernatant was dried using SpeedVac. Redissolved peptides with 0.5% acetic acid and 2% acetonitrile (ACN) were loaded onto an in-house-prepared 100μm×15cm tip column, packed with 3μm ReproSil-Pur 120 C18-AQ reverse-phase beads, and eluted at a flow rate of 500 nL/min. The mobile phases used for nanoLC will be 0.5% acetic acid in water (buffer A) and a mixture of 0.5% acetic acid and 80% ACN (buffer B). The LC gradient conditions were 5% to 40% buffer B in 60 min, 40% to 100% buffer B in 5 min, and 100% buffer B in 10 min. We operated the LTQ Orbitrap XL system in the positive ion mode, and full-scan MS spectra (m/z 300-600) were acquired on the Orbitrap analyzer with a resolution of 60000 at m/z 400. Raw files from LC-MS/MS were analyzed using the MaxQuant software.
4.10. Analysis of TCGA Data from Gynecologic Cancer Tissue Samples
We downloaded 372 TCGA OV RNA-Seq level 3 read count data (serous type) from the GDC Data Portal (
https://portal.gdc.cancer.gov/). We used the gene annotation file in GENCODE version 22 and obtained from GDC Reference Files (
https://gdc.cancer.gov/about-data/gdc-data-processing/gdc-reference-files), which the TCGA program used. We searched for follow-up clinical information in the PanCanAtlas publication (
https://gdc.cancer.gov/about-data/publications/pancanatlas). We calculated the TPM value for each gene in each sample based on the TPM calculation, and the formula is below. First, we investigated genes associated with the survival time of all ovarian cancer patients by an R function, COXPH (Cox Proportional-Hazards Model), with the TPM value of each gene. We calculated the hazard ratio (HR) and the Wald test of the p-value in each gene, and then each gene was filtered with an HR >=2 folds and a p-value less than <= 0.05. For progress-free survival analysis, we calculated the best cut point TPM value for each gene by using the “cutup” function from the R package, survMisc, and dividing samples into two groups (high and low TPM groups). Finally, survival analyses were used in the R package, Survminer, and generated Kaplan-Meier plots. We calculated the best cut point value by splitting patients into high and low expression, an auto-select, and computed all possible cut point values between the lower and upper quartiles. We performed the best threshold as a cut point. We analyzed the microarray data from GEO and TCGA for all subtypes, RNA-seq data from the TCGA data set for all subtypes, and serous types for survival analysis. We plotted the survival curve by overall survival (OS) and progression-free survival (PFS) from 1656 and 1435 patients for GEO and TCGA data and 373 and 177 patients for TCGA data.
A cohort of endometrial tumors was initially created on the GDC portal (
https://portal.gdc.cancer.gov/), and gene expression data and pertinent clinical data were extracted, including stage, follow-up duration, vital status, and recurrence. The final 404 samples can be obtained. The endometrial tumor samples were classified into two groups (high and low expression) using the survminer R package (version 0.4.9) with survival information and the addition of UBE2NL/HIST2H3PS2 gene expression TPM values, respectively. Ultimately, a survival analysis was conducted to examine the impact of early-stage versus advanced-stage disease, the four stages of cancer, and UBE2NL/HIST2H3PS2 high versus low gene expression groups.
4.11. Invasion experiments
We used matrigel-coated transwell chambers (Corning Incorporated, USA) inserted into 24-well cell culture plates for invasion assays. We added SKOV3 cells, ES2 cells, or MSC-OCSPCs, (3× 10⁴ cells in 0.1 mL of serum-free medium) to the upper chamber, and culture medium (McCoy’s 5A medium) in the lower chamber with a serum-free condition for the negative control, or containing 10% FBS for the positive control, or added culture medium (McCoy’s 5A medium) with a serum-free condition and treating EXs (18 ug) from ES2, ES2 TS, ES2TR, and ES2TR TS cell extracts. We cultivated the cells for 12 and 24 hours, and cells that invaded the inserts were fixed in formalin solution for 3 min, stained with crystal violet, and counted in three random microscope fields (Olympus BX3, Olympus, Tokyo, Japan) at a magnification of 40×, 100×, or 200×.
4.12. In Vivo Animal Experiments and Tumor Imaging
We purchased female null mice (BALB/cAnN.Cg-Foxn1nu/CrlNarl) from the National Animal Center (Taipei, Taiwan). The Institutional Animal Care and Use Committee of Cathay General Hospital approved all experiments. In experiment 1, null mice at 5–7 weeks of age (10mice/group) were injected intraperitoneally with 1 × 10⁶ ES2 (control group) or 1 × 10⁶ ES2/shUBE2NL cells, and we calculated the survival rate of two groups of mice until 80% of mice in the control group expired. In experiment 2, null mice at 5-7 weeks of age (5 mice/group) were injected intraperitoneally with 1 × 10⁶ ES2 or 1 × 10⁶ ES2/shUBE2NL cells; 1 × 10⁶ SKOV3-over luciferase or 1 × 10⁶ SKOV3/ HISH3T2PS2 cells to examine the severity of ascites, the tumor dissemination and growth in the peritoneal cavity when mice sacrificed. In experiment 4, null mice at 5-7 weeks of age (5 mice/group) were injected intraperitoneally with 1 × 10⁶ SKOV3-over luciferase and 10 μg of EXs from SKOV3-over luciferase cells or 1 × 10⁶ SKOV3/ HISH3T2PS2 cells and 10 μg of EXs from SKOV3/ HISH3T2PS2 cells were intraperitoneally injected twice weekly for six weeks to examine the tumor dissemination and growth in the peritoneal cavity when mice sacrificed. The body weight of mice was measured, recorded, and compared with the body change every week. We measured the number and size of metastatic tumor nodules and the severity of ascites in the abdominal cavity of mice after mice were sacrificed. Disseminated tumors were counted and measured in the greatest diameter using calipers.
4.13. Statistical Analysis
Data were analyzed using SPSS 16.0 (SPSS Inc., Chicago, IL, USA). We calculated all numerical data as the mean ± SD from at least three experiments. Significant differences between the two groups were determined using the student’s t-test, and the significance of differences among more than two groups will be determined using a Kruskal-Wallis test. We calculated the progression-free survival (PFS) and overall survival (OS) through the Kaplan-Meier method, and the differences in survival curves were using the log-rank test. p < 0.05, was considered statistically significant. P* means p-value <0.05, P** means p-value <0.01, and P*** means p-value <0.001.
Supplementary Materials
The following supporting information can be downloaded at the website of this paper posted on
Preprints.org.
Author Contributions
Conceptualization: CM.H., methodology: CM.H., TL.Y., TH.C., SH.H.; validation: TH.C, SH.H., formal analysis: TH.C. and CM.H; investigation and data curation: CM.H. and TL.Y.; first draft writing: CM.H., critics and improvements of the manuscript: CM.H TL.Y; review and editing: CM.H; supervision: TH.C. and SH.H. project administration: CM.H.; funding acquisition: CM.H. All authors have read and agreed to the published version of the manuscript.
Funding
This work was supported by research funds from the National Science Council, Taiwan (107-2314-B-281-005-MY3, 111-2314-B-281-008-MY3).
Institutional Review Board Statement
The institutional review board of Cathay General Hospital (CGH) approved this study (CGH-P110093). The study was conducted following the Declaration of Helsinki, and approved by the Institutional Review Board of Cathay General Hospital (CGH) (protocol code CGH-P110093).
Institutional Animal Care and Use Committee Statement: The Institutional Animal Care and Use Committee of the Cathay General Hospital approved this study (CGH-IACUC-111-003)
Informed Consent Statement
Informed consent was obtained from all subjects involved in the study.
Conflicts of Interest
The authors declare no conflicts of interest.
References
- Siegel, R.L.; Giaquinto, A.N.; Jemal, A. Cancer statistics, 2024. CA Cancer J. Clin. 2024, 74, 12–49. [Google Scholar] [CrossRef] [PubMed]
- Lheureux, S.; Braunstein, M.; Oza, A.M. Epithelial ovarian cancer: Evolution of management in the era of precision medicine. CA Cancer J. Clin. 2019, 69, 280–304. [Google Scholar] [CrossRef] [PubMed]
- Webb, P.M.; Jordan, S.J. Epidemiology of epithelial ovarian cancer. Best Pract. Res. Clin. Obstet. Gynaecol. 2017, 41, 3–14. [Google Scholar] [CrossRef] [PubMed]
- Kurman, R.J.; Shih, I.M. The dualistic model of ovarian carcinogenesis: Revisited, revised, and expanded. Am. J. Pathol. 2016, 186, 733–747. [Google Scholar] [CrossRef]
- Ahmed, N.; Stenvers, K.L. Getting to know ovarian cancer ascites: Opportunities for targeted therapy-based translational research. Front. Oncol. 2013, 3, 256. [Google Scholar] [CrossRef]
- Bray, F.; Ferlay, J.; Soerjomataram, I.; Siegel, R.L.; Torre, L.A.; Jemal, A. Global Cancer Statistics 2018: GLOBOCAN Estimates of Incidence and Mortality Worldwide for 36 Cancers in 185 Countries. CA Cancer J. Clin. 2018, 68, 394–424. [Google Scholar] [CrossRef]
- Felix, A.S.; Yang, H.P.; Bell, D.W.; Sherman, M.E. Epidemiology of Endometrial Carcinoma: Etiologic Importance of Hormonal and Metabolic Influences. Adv. Exp. Med. Biol. 2017, 943, 3–46. [Google Scholar] [CrossRef]
- Setiawan, V.W.; Yang, H.P.; Pike, M.C.; McCann, S.E.; Yu, H.; Xiang, Y.B.; Wolk, A.; Wentzensen, N.; Weiss, N.S.; Webb, P.M.; van den Brandt, P.A.; van de Vijver, K.; Thompson, P.J.; Australian National Endometrial Cancer Study Group; Strom, B. L.; Spurdle, A.B.; Soslow, R.A.; Shu, X.O.; Schairer, C.; Sacerdote, C.; Rohan, T.E.; Robien, K.; Risch, H.A.; Ricceri, F.; Rebbeck, T.R.; Rastogi, R.; Prescott, J.; Polidoro, S.; Park, Y.; Olson, S.H.; Moysich, K.B.; Miller, A.B.; McCullough, M.L.; Matsuno, R.K.; Magliocco, A.M.; Lurie, G.; Lu, L.; Lissowska, J.; Liang, X.; Lacey, J.V., Jr.; Kolonel, L.N.; Henderson, B.E.; Hankinson, S.E.; Håkansson, N.; Goodman, M.T.; Gaudet, M.M.; Garcia-Closas, M.; Friedenreich, C.M.; Freudenheim, J.L.; Doherty, J.; De Vivo, I.; Courneya, K.S.; Cook, L.S.; Chen, C.; Cerhan, J.R.; Cai, H.; Brinton, L.A.; Bernstein, L.; Anderson, K.E.; Anton-Culver, H.; Schouten, L.J.; Horn-Ross, P.L. Type I and II Endometrial Cancers: Have They Different Risk Factors? J. Clin. Oncol. 2013, 31, 2607–2618. [Google Scholar] [CrossRef]
- de Haydu, C.; Black, J.D.; Schwab, C.L.; English, D.P.; Santin, A.D. An Update on the Current Pharmacotherapy for Endometrial Cancer. Expert Opin. Pharmacother. 2016, 17, 489–499. [Google Scholar] [CrossRef]
- Becker, A.; Thakur, B.K.; Weiss, J.M.; Kim, H.S.; Peinado, H.; Lyden, D. Extracellular Vesicles in Cancer: Cell-to-Cell Mediators of Metastasis. Cancer Cell 2016, 30, 836–848. [Google Scholar] [CrossRef]
- Maacha, S.; Bhat, A.A.; Jimenez, L.; Raza, A.; Haris, M.; Uddin, S.; Grivel, J.C. Extracellular vesicles-mediated intercellular communication: Roles in the tumor microenvironment and anti-cancer drug resistance. Mol. Cancer 2019, 18, 55. [Google Scholar] [CrossRef] [PubMed]
- Lobb, R.J.; Lima, L.G.; Moller, A. Exosomes: Key mediators of metastasis and premetastatic niche formation. Semin. Cell Dev. Biol. 2017, 67, 3–10. [Google Scholar] [CrossRef] [PubMed]
- Kumar, M.A.; Baba, S.K.; Sadida, H.Q.; Marzooqi, S.A.; Jerobin, J.; Altemani, F.H.; Algehainy, N.; Alanazi, M.A.; Abou-Samra, A.B.; Kumar, R.; et al. Extracellular vesicles as tools and targets in therapy for diseases. Curr. Cancer Drug Targets 2016, 16, 34–42. [Google Scholar] [CrossRef] [PubMed]
- Zhou, L.; Lv, T.; Zhang, Q.; Zhu, Q.; Zhan, P.; Zhu, S.; Zhang, J.; Song, Y. The biology, function and clinical implications of exosomes in lung cancer. Cancer Lett. 2017, 407, 84–92. [Google Scholar] [CrossRef] [PubMed]
- Dikshit, A.; Jin, Y.J.; Degan, S.; Hwang, J.; Foster, M.W.; Li, C.Y.; Zhang, J.Y. UBE2N promotes melanoma growth via MEK/FRA1/SOX10 signaling. Cancer Res. 2018, 78, 6462–6472. [Google Scholar] [CrossRef] [PubMed]
- Wu, X.; Zhang, W.; Font-Burgada, J.; Palmer, T.; Hamil, A.S.; Biswas, S.K.; Poidinger, M.; Borcherding, N.; Xie, Q.; Ellies, L.G.; et al. Ubiquitin-conjugating enzyme Ubc13 controls breast cancer metastasis through a TAK1-p38 MAP kinase cascade. Proc. Natl. Acad. Sci. USA 2014, 111, 13870–13875. [Google Scholar] [CrossRef]
- Zhang, X.; Feng, Y.; Wang, X.Y.; Zhang, Y.N.; Yuan, C.N.; Zhang, S.F.; Shen, Y.M.; Fu, Y.F.; Zhou, C.Y.; Li, X.; et al. The inhibition of UBC13 expression and blockage of the DNMT1-CHFR-Aurora A pathway contribute to paclitaxel resistance in ovarian cancer. Cell Death Dis. 2018, 9, 93. [Google Scholar] [CrossRef]
- Shang, M.; Weng, L.; Xu, G.; Wu, S.; Liu, B.; Yin, X.; Mao, A.; Zou, X.; Wang, Z. TRIM11 suppresses ferritinophagy and gemcitabine sensitivity through UBE2N/TAX1BP1 signaling in pancreatic ductal adenocarcinoma. J. Cell Physiol. 2021, 236, 6868–6883. [Google Scholar] [CrossRef]
- Cheng, J.; Fan, Y.H.; Xu, X.; Zhang, H.; Dou, J.; Tang, Y.; Zhong, X.; Rojas, Y.; Yu, Y.; Zhao, Y.; et al. A small-molecule inhibitor of UBE2N induces neuroblastoma cell death via activation of p53 and JNK pathways. Cell Death Dis. 2014, 5, e1079. [Google Scholar] [CrossRef]
- Ramatenki, V.; Dumpati, R.; Vadija, R.; Vellanki, S.; Potlapally, S.R.; Rondla, R.; Vuruputuri, U. Identification of new lead molecules against UBE2NL enzyme for cancer therapy. Appl. Biochem. Biotechnol. 2017, 182, 1497–1517. [Google Scholar] [CrossRef]
- Ray-Gallet, D.; Almouzni, G. H3-H4 histone chaperones and cancer. Curr. Opin. Genet. Dev. 2022, 73, 101900. [Google Scholar] [CrossRef] [PubMed]
- Makabe, T.; Arai, E.; Hirano, T.; Ito, N.; Fukamachi, Y.; Takahashi, Y.; et al. Genome-wide DNA methylation profile of early-onset endometrial cancer: Its correlation with genetic aberrations and comparison with late-onset endometrial cancer. Carcinogenesis 2019, 40, 611–623. [Google Scholar] [CrossRef] [PubMed]
- The Human Protein Atlas. Search: HIST2H3PS2. Available online: http://www.proteinatlas.org/search/HIST2H3PS2 (accessed on 12 September 2024).
- Dikshit, A.; Jin, Y.J.; Degan, S.; Hwang, J.; Foster, M.W.; Li, C.Y.; Zhang, J.Y. UBE2N promotes melanoma growth via MEK/FRA1/SOX10 signaling. Cancer Res. 2018, 78, 6462–6472. [Google Scholar] [CrossRef] [PubMed]
- Andersen, P.L.; Zhou, H.; Pastushok, L.; Moraes, T.; McKenna, S.; Ziola, B.; et al. Distinct regulation of Ubc13 functions by the two ubiquitin-conjugating enzyme variants Mms2 and Uev1A. J. Cell Biol. 2005, 170, 745–755. [Google Scholar] [CrossRef] [PubMed]
- Wu, Z.; Shen, S.; Zhang, Z.; Zhang, W.; Xiao, W. Ubiquitin-conjugating enzyme complex Uev1A-Ubc13 promotes breast cancer metastasis through nuclear factor-кB mediated matrix metalloproteinase-1 gene regulation. Breast Cancer Res. 2014, 16, R75. [Google Scholar] [CrossRef]
- Topisirovic, I.; Gutierrez, G.J.; Chen, M.; Appella, E.; Borden, K.L.; Ronai, Z.A. Control of p53 multimerization by Ubc13 is JNK-regulated. Proc. Natl. Acad. Sci. U.S.A. 2009, 106, 12676–12681. [Google Scholar] [CrossRef] [PubMed]
- Wang, G.; Gao, Y.; Li, L.; Jin, G.; Cai, Z.; Chao, J.I.; Lin, H.K. K63-linked ubiquitination in kinase activation and cancer. Front. Oncol. 2012, 2, 5. [Google Scholar] [CrossRef] [PubMed]
- Yang, B.; Chen, W.; Tao, T.; Zhang, J.; Kong, D.; Hao, J.; Yu, C.; Liao, G.; Gong, H. UBE2N promotes cell viability and glycolysis by promoting Axin1 ubiquitination in prostate cancer cells. Biol. Direct 2024, 19, 35. [Google Scholar] [CrossRef]
- Wambecke, A.; Ahmad, M.; Morice, P.M.; Lambert, B.; Weiswald, L.B.; Vernon, M.; et al. The lncRNA UCA1 modulates the response to chemotherapy of ovarian cancer through direct binding to miR-27a-5p and control of UBE2N levels. Mol. Oncol. 2021, 15, 3659–3678. [Google Scholar] [CrossRef]
- Ramatenki, V.; Dumpati, R.; Vadija, R.; Vellanki, S.; Potlapally, S.R.; Rondla, R.; Vuruputuri, U. Identification of new lead molecules against UBE2NL enzyme for cancer therapy. Appl. Biochem. Biotechnol. 2017, 182, 1497–1517. [Google Scholar] [CrossRef]
- Metzger, M.B.; Pruneda, J.N.; Klevit, R.E.; Weissman, A.M. RING-type E3 ligases: Master manipulators of E2 ubiquitin-conjugating enzymes and ubiquitination. Nat. Rev. Mol. Cell Biol. 2014, 15, 763–775. [Google Scholar] [CrossRef] [PubMed]
- Wang, Y.; Huang, Z.; Li, B.; Liu, L.; Huang, C. The emerging roles and therapeutic implications of epigenetic modifications in ovarian cancer. Front. Endocrinol. (Lausanne) 2022, 13, 863541. [Google Scholar] [CrossRef] [PubMed]
- Chen, P.S.; Su, J.L.; Hung, M.C. Dysregulation of microRNAs in cancer. J. Biomed. Sci. 2012, 19, 90. [Google Scholar] [CrossRef] [PubMed]
- Hayashi, A.; Horiuchi, A.; Kikuchi, N.; Hayashi, T.; Fuseya, C.; Suzuki, A.; et al. Type-specific roles of histone deacetylase (HDAC) overexpression in ovarian carcinoma: HDAC1 enhances cell proliferation and HDAC3 stimulates cell migration with downregulation of E-cadherin. Int. J. Cancer 2010, 127, 1332–1346. [Google Scholar] [CrossRef] [PubMed]
Figure 1.
The progression-free and overall survival of expression of UBE2NL and HIST2H3PS2 in EOC patients. The progression-free and overall survival of low expression of UBE2NL and HIST2H3PS2 in EOC patients from TCGA (upper and middle) and CGH (lower) were significantly higher than those with low expression.
Figure 2.
The progression-free survival (PFS) and overall survival (OS) of expression of HIST2H3PS2 in EC patients. The PFS (upper) and OS (lower) of low expression of HIST2H3PS2 in EC patients from TCGA in all stages were significantly higher than those with high expression.
Figure 2.
The progression-free survival (PFS) and overall survival (OS) of expression of HIST2H3PS2 in EC patients. The PFS (upper) and OS (lower) of low expression of HIST2H3PS2 in EC patients from TCGA in all stages were significantly higher than those with high expression.
Figure 3.
The differential expression of UBE2NL and HISH3T2PS2 in EOC cells and exosome. UBE2NL was expressed in more aggressive ES2, ES2TR, ES2 TS, ES2TR TS, SKOV3/COL6A3, and MS-OCSPCs cells and EXs but was absent in less aggressive SKOV3 EXs. HIST2H3PS2 was expressed in ES2, ES2TR, ES2 TS, ES2TR TS, SKOV3/COL6A3, and MSC-OCSPCs cells and EXs, but was not expressed in SKOV3 cells and EXs, ES2/shCOL6A3 EXs, or SKOV3/COL6A3 EXs.
Figure 4.
The invasion ability of SKOV3-over luciferase, SKPV3-over UBE2NL, and SKOV3-over HISH3T2PS2. The invasion ability was significantly greater in SKOV3-over UBE2NL cells or SKOV3-overHIST2H3PS2 cells, compared with SKOV3-over luciferase (p<0.01).
Figure 4.
The invasion ability of SKOV3-over luciferase, SKPV3-over UBE2NL, and SKOV3-over HISH3T2PS2. The invasion ability was significantly greater in SKOV3-over UBE2NL cells or SKOV3-overHIST2H3PS2 cells, compared with SKOV3-over luciferase (p<0.01).
Figure 5.
The invasion ability in SKOV3 cells with or without SKOV3 EXs, SKOV3/UBE2NL EXs, and SKOV3/UBE2NL cells with SKOV3/UBE2NL EXs. The invasion ability was significantly greater in SKOV3 cells with SKOV3 EXs, SKOV3 cells with SKOV3/UBE2NL EXs, or SKOV3/UBE2NL cells with SKOV3/UBE2NL EXs, compared with SKOV3 cells (all p<0.001).
Figure 6.
The invasion ability in SKOV3 cells with or without SKOV3 EXs, SKOV3/HIST2H3PS2 EXs, and SKOV3/HIST2H3PS2 cells with SKOV3/HIST2H3PS2 EXs. The invasion ability was significantly greater in SKOV3 cells with SKOV3 EXs, SKOV3 cells with SKOV3/HIST2H3PS2 EXs, or SKOV3/HIST2H3PS2 cells with SKOV3/HIST2H3PS2 EXs, compared with SKOV3 cells (all p<0.001).
Figure 7.
The differential invasion ability was in SKOV3 cells with or without SKOV3 EXs, SKOV3 cells with SKOV3/UBE2NL or HIST2H3PS2 EXs. The invasion ability was greater in more aggressive SKOV3/UBE2NL or SKOV3/HIST2H3PS2 cells compared to less aggressive SKOV3 cells (p<0.05 for SKOV3/UBE2NL, p<0.001 for SKOV3/HIST2H3PS2), SKOV3 cells with EXs (p<0.05 for SKOV3/UBE2NL, p<0.05 for SKOV3/HIST2H3PS2), or SKOV3 cells with SKOV3/UBE2NL or SKOV3/HIST2H3PS2 EXs (p<0.05 for SKOV3/UBE2NL, p<0.01 for SKOV3/HIST2H3PS2).
Figure 9.
The differential invasion ability was in ES2/shUBE2NL cells with ES2/shUBE2NL cell EXs, ES2 cells with ES2/shUBE2NL EXs, and ES2 cells with ES2 EXs. The invasion ability was significantly decreased in ES2/shUBE2NL cells with ES2/shUBE2NL cell EXs compared with ES2 cells with ES2/shUBE2NL EXs (p<0.01) and ES2 cells with ES2 EXs (p<0.001).
Figure 10.
The cell viability analyses by CCK8 were in SKOV3 cells, SKOV3/UBE2NL, and SKOV3/HIST2H3PS2 cells, and SKOV3/shUBE2NL cells. The cell viability analyses by CCK8 were significantly higher in SKOV3/UBE2NL (upper) and SKOV3/HIST2H3PS2 cells (middle) than in SKOV3 cells (both p<0.001). In contrast, the cell viability analyses by CCK8 were significantly lower in SKOV3/shUBE2NL cells (lower) than in SKOV3 cells (p<0.001).
Figure 11.
The survival rate and body weight changes in mice. Eight out of 10 mice expired after IP injection of 1×10⁶ ES2 cells, compared to 2 out of 10 mice that expired after IP injection of 1×10⁶ ES2 (shUBE2NL) on the 32nd day (p=0.007). The body weights before and after IP injection cells in 2 groups were not significantly different (p = 0.262, p = 0.139, respectively).
Figure 12.
The disseminated tumors in the peritoneal cavity in mice. The average disseminated tumor number in the peritoneal cavity was significantly lower in mice (n=5) receiving intraperitoneally injected with 1×10⁶ ES2/shUBE2NL cells or SKOV3-over luciferase cells than in mice injected with 1×10⁶ ES2 cells or SKOV3-overHIST2H3PS2 cells (p<0.05). The red arrow indicates the location of the tumors.
Figure 14.
The disseminated tumor number and size in mice. The disseminated tumor number in the peritoneal cavity was significantly greater in mice receiving intraperitoneally injected with 1×10⁶ SKOV3/ HIST2H3PS2 cells with EXs than in mice injected with 1×10⁶ SKOV3 with EXs (p <0.05, by student’s t-test). In contrast, the disseminated tumor size in the peritoneal cavity was significantly smaller in mice receiving intraperitoneally injected with 1×10⁶ SKOV3/ HIST2H3PS2 cells with EXs than in mice injected with 1×10⁶ SKOV3 with EXs (p <0.05, by student’s t-test).
Figure 15.
The differential level of exosomes derived from ES2 treated with rapamycin or GW4869. The exosome level (mg/ml) derived from 1×10⁶ ES2 cells treated with 500nM rapamycin or 10uM GW4869 for 48 hours was significantly decreased than those without treatment using a Bradford reagent testing.
Figure 15.
The differential level of exosomes derived from ES2 treated with rapamycin or GW4869. The exosome level (mg/ml) derived from 1×10⁶ ES2 cells treated with 500nM rapamycin or 10uM GW4869 for 48 hours was significantly decreased than those without treatment using a Bradford reagent testing.
Table 1.
UBE2NL and HIST2H3PS2 expression levels correlate between ovarian cysts, early-stage, and advanced-stage ovarian cancer.
Table 1.
UBE2NL and HIST2H3PS2 expression levels correlate between ovarian cysts, early-stage, and advanced-stage ovarian cancer.
| gene |
|
Benign
ovarian cyst (n=10) |
Early-stage
ovarian cancer
(n=21) |
Advanced-stage
ovarian cancer
(n=35) |
*P value |
| UBE2NL |
mean±SD |
0.0017±0.0006 |
0.0792±0.0284 |
0.1610±0.0523 |
0.001 |
| median |
0.0001 |
0.0134 |
0.0200 |
0.003 |
| HST2H3PS2 |
mean±SD |
0.0029±0.0015 |
0.0015±0.0006 |
0.0042±0.0025 |
0.019 |
| median |
0.0001 |
0.0000 |
4.87×10⁻⁶
|
0.002 |
|
Disclaimer/Publisher’s Note: The statements, opinions and data contained in all publications are solely those of the individual author(s) and contributor(s) and not of MDPI and/or the editor(s). MDPI and/or the editor(s) disclaim responsibility for any injury to people or property resulting from any ideas, methods, instructions or products referred to in the content. |
© 2024 by the authors. Licensee MDPI, Basel, Switzerland. This article is an open access article distributed under the terms and conditions of the Creative Commons Attribution (CC BY) license (http://creativecommons.org/licenses/by/4.0/).
