1. Introduction
When conducting a seismic observation using ocean bottom seismographs (OBS) to detect Earth’s deep structures, signals are mainly from onboard air guns (active sources) and earthquakes (passive sources). Passive sources usually have massive power, so they are able to reveal much deeper and farther structures reaching the inner core with less cost [
1]. Receiver function (RF) is widely used in passive seismic observations and is an effective way to obtain the crust-upper mantle structures employing data recorded at a single seismic station [
2,
3,
4,
5]. Due to the approximately vertical incidence of ray path of tele-seismic event, the vertical component waveform is roughly assumed to be the source function. Seismic responses of near station structures can be extracted by performing deconvolution in frequency [
6] or time [
7] domains to eliminate the source function from the radial or tangential component. This result is the so-called RF. By applying post-processing techniques to the RFs, deep structures below the station(s) can be obtained. The H-kappa Stacking (H-k stacking; [
8]) and Common Converted Point Stacking (CCP Stacking; [
9]) are used to calculate the Moho depth, average crustal V
P/V
S ratio and main discontinuities of Earth’s interior. Inversion techniques (e.g., linear inversion approach, genetic algorithm and simulated annealing; [
10,
11,
12]) are utilized to derive one-dimensional (1-D) S-wave velocity (V
S) structure.
Even though the RF method is widely applied to data from land stations, it is still hard to use it in marine seismic observations. Firstly, OBS is deployed on the seafloor, so oceanic currents and marine ambient noise reduce the waveform quality recorded by OBS. Secondly, when tele-seismic waves arrive at the seafloor, the wave propagation behaviors generate transmissions and reflections. The up and down multiple reflections in the seawater layer are recorded by OBS mixed with converted waves of direct P-wave. Thirdly, when deploying OBS, it is free-falling through seawater and then landing on the seafloor, which leads to insufficient contact and poor coupling between OBS and the seabed. According to the above-mentioned issues, deriving effective RFs from OBS passive seismic data is still a great challenge. Even data recorded by the same seismic station, SNRs change with time periods. [
2] proposed that suppressing non-stationary noise is critical for extracting RFs from OBS recordings by analyzing huge amounts of data. Previous study on data recorded by seven OBSs deployed at ultra-spreading Southwest Indian Ridge shows that only one OBS successfully extracted three RFs from a month of recordings [
5]. Comparing the results of high-quality RFs of [
2] and [
5] with active sources inverted results [
13,
14], the Moho depth determined by the RF method is 2-3 km deeper than that of active source inversion. The differences are interpreted as the Moho discontinuity is a transition zone with certain thickness [
15,
16,
17]. When Moho reflected waves of an active source reach the upper interface of this transition zone, they will return immediately. However, plane waves of tele-seismic incidence piercing the upper mantle reach the lower interface of Moho, generating the converted waves at once. The above interpretation is a reliable case for the different Moho depths of RF and active source inversions. Alternatively, different seismic inversion algorithms have different parameterization schemes and constraints, which may also lead to slight variabilities in the final results. For example, when using OBS RFs to obtain the lithosphere structures in the South China Sea Basin, the Moho depths estimated by the H-k stacking method and the Neighborhood Algorithm (NA; [
18,
19,
20] were quite similar beneath some stations, but there are a few difference below other stations [
2].
Previous studies have been carried out to try to solve parts of the above-mentioned issues. [
21] used a series of geological models to compute their seismic responses and RFs, then analyzed which factors affect the OBS RFs, such as the noise of seawater and the reflections from the seawater or sedimentary layer. The results found that the sedimentary layer leads to unstable OBS RFs. [
22] used an advanced non-linear waveform analysis technique accompanied by the Simulated Annealing algorithm to analyze OBS array recordings from water layer response. [
23] determined the influence of the sedimentary layer on OBS RFs through numerical modelling to constrain gravity inversion. However, these studies have not completely resolved the challenges associated with OBS RFs. Here, we perform some numerical modelling focusing on the seawater layer with different thicknesses and the sedimentary layer with both different thicknesses and Vs that affect the inversion results of the widely used H-k stacking method and the NA. Because the models are composed of horizontally stratified medium, we compute synthetic seismograms by using the Thomson-Haskell matrix propagation method [
24,
25,
26,
27,
28]. To enhance the SNRs of RFs, we use the time domain iterative deconvolution method [
7] to extract RFs. Finally, we use the H-k stacking method to estimate the Moho depth and average crustal V
P/V
S ratio and use the non-linear NA to invert the V
S structure beneath the station.
2. RF-Related Methods
2.1. Receiver Function
For a distant earthquake, incident angle near the station is approximately vertical. Due to the close ray path at the source side, the influence of the source side on different components of one seismograph could be ignored. Therefore, the recorded three-component waveforms can be treated as the convolution of the instrument response, the source function and the medium response beneath the station, which can be expressed in the time domain:
where
represents the effective source time function of the incident plane wave;
represents the instrument response;
,
and
represent the medium structure responses in the vertical, radial and tangential components, respectively. Under the equivalent source assumption of the vertical component [
29],
is suggested to be an impulse function. Therefore, the two horizontal components perform deconvolutions with the vertical component in the frequency domain:
and
can be obtained by the inverse Fourier transform of
and
, respectively. These are so-called radial and tangential RFs. Different from the deconvolution algorithm in the frequency domain, the time domain iterative deconvolution method based on the assumption of the equivalent source, minimizes the difference between the observed horizontal component and a predicted signal generated by convolution of the iteratively predicted pulse time series with the vertical component, to obtain the final RF. As depicted in
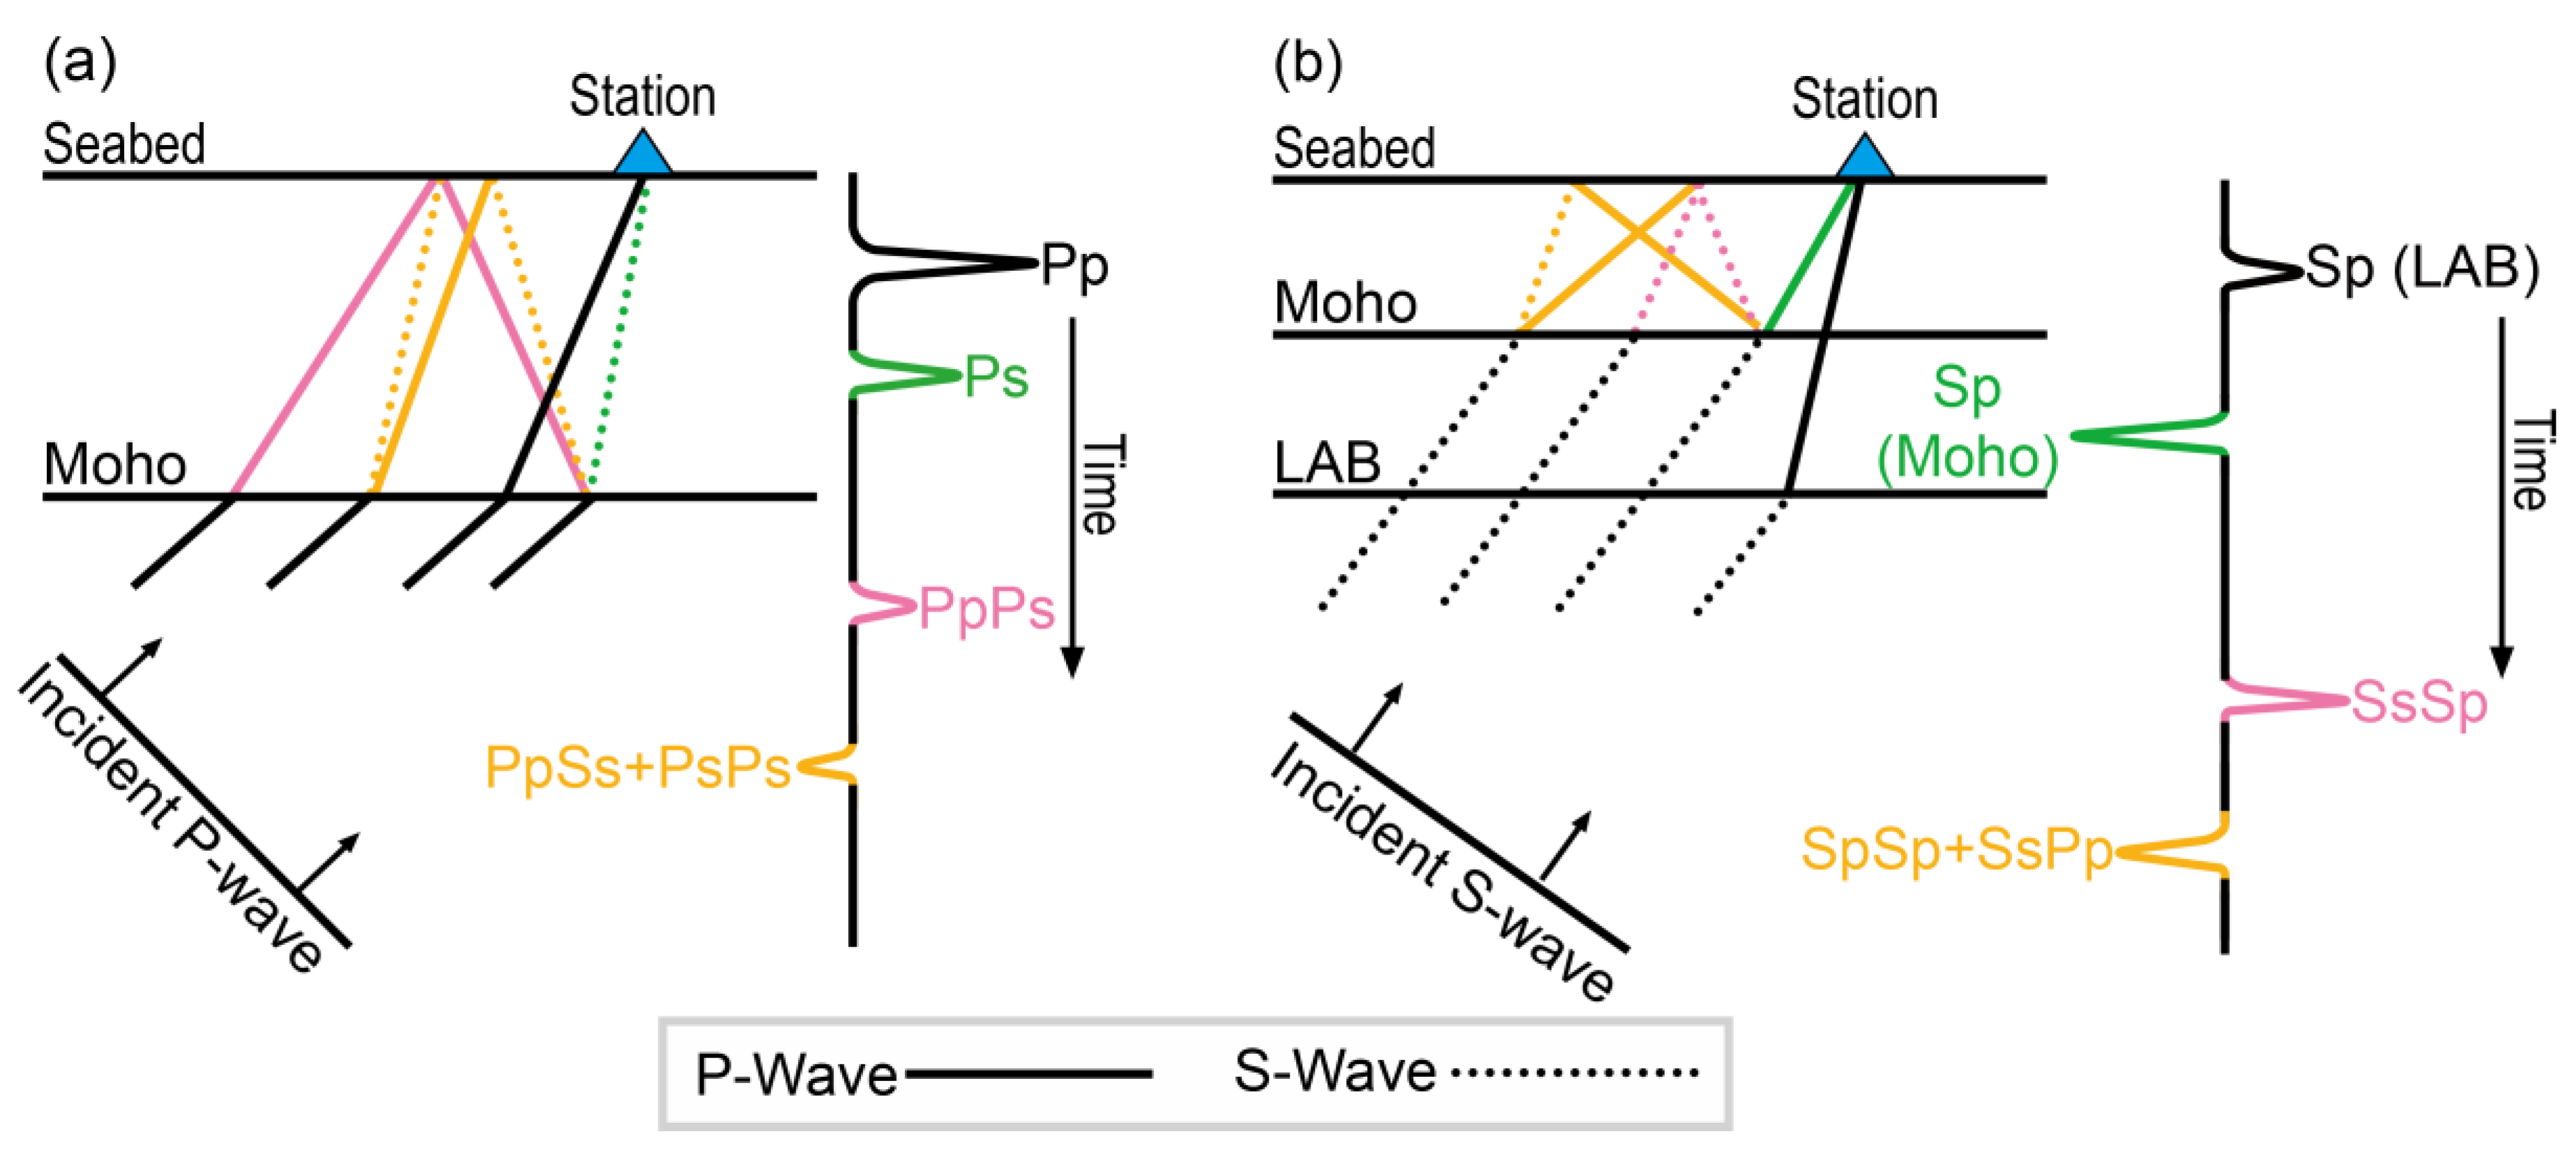
Figure 1, two kinds of RFs (P- and S-wave RFs) are based on their incident wave type. Using their post-processing, the Moho depth, average crustal V
P/V
S ratio, and Vs structure of the medium beneath the station can be estimated.
2.2. H-k Stacking
The H-k stacking method is widely used to determine the Moho depth (H) and the average crustal V
P/V
S ratio (k) [
8]. When a certain average crustal P-wave velocity (V
P) beneath the station is given, the travel-time differences between multiple phases (i.e., Ps, PpPs and PpSs+PsPs) and the direct P-wave can be calculated. For example, the relationship of the Ps phase between travel time, velocity and thickness is expressed by the following equation (3).
where H represents the Moho depth;
is the travel-time difference between the Ps phase and the direct P-wave; V
S is the average crustal S-wave velocity (can be represented by
);
is the ray parameter. According to the estimation of [
8], H is much more sensitive to the variation of k than to that of V
P. By grid searching of H and k in regular grids, calculating the travel times of Ps, PpPs and PsPs+PpSs, and stacking the corresponding amplitudes on RFs, the optimal value of H and k can be determined according to the maximum stacked amplitude:
where represents the stacked amplitude with the specific H and k; , and are the stack weights for the different multiple phases (The weights used in this study are 0.6, 0.3 and 0.1, respectively); is the amplitude of the RF waveform corresponding to the travel times.
2.3. Neighborhood Algorithm
With the development of computer techniques, non-linear methods have been rapidly used in geophysical inversions, such as Genetic Algorithm [
12], Simulated Annealing [
11] and Neural Network [
30]. These non-linear inversion algorithms can search model parameters globally to overcome the inherent limitations of linear approximation, avoid solutions falling into local extremum and significantly reduce the reliance on the initial model. However, these algorithms contain a lot of empirical and random parameters, which lead to complicated inversion processes and huge computation costs. Here we use the NA proposed by [
18,
19,
20] for the inversion of RFs. This algorithm parameterizes the model randomly. The best velocity model can be obtained by minimizing the synthetic and observed RFs, which is able to infer the geological information beneath the station. Similar to the Genetic Algorithm, the NA can search the whole model space globally. However, the NA incorporates the geometric concept of the “Voronoi diagram”, which offers robust and adaptive searching capabilities. Initially, the model space is partitioned into numbers of Voronoi cells by randomly sampled points. Subsequently, mismatch functions are constructed within each Voronoi cell to find a series of cells with acceptable mismatch values. The reliable model is inverted by sparsely and densely resample cells with relatively higher and lower mismatches.
3. Seismic Responses of Seawater Multiple Reflections
Differing from land stations, OBSs are deployed on the seafloor. Due to strong reflection boundaries of the free surface and seafloor, incident P-waves from distant events generate multiple reflections in the seawater layer. Because the incident waves are not extremely perpendicular to horizontal components, when the vertical component records these multiples, their polarized waves are recorded by horizontal components simultaneously. Therefore, although these added multiples destroy the assumption of the equivalent source of the vertical component, the highly correlated polarized waves on horizontal components can mitigate these influences on RFs. The following numerical modellings are conducted to identify seawater multiple reflections and analyze their influences to verify the above inference.
3.1. Half-Space Model with Overlying a Seawater Layer
The average thickness of the oceanic crust is approximately 6 km (hereafter, it is referred to as the normal oceanic crust [
31,
32,
33], but an extremely thick oceanic crust is found at the Southwest Indian Ridge, where crust thickness reaches 10 km (we call it thick oceanic crust hereafter; [
34]. Therefore, two models with thicknesses of 6 km and 10 km, respectively, are considered in the synthetic modelling. The thickness of the seawater layer varies from 0 to 5 km with a step of 1 km. Parameters of each layer of the 1-D stratified model are listed in
Table S1, and the velocity structures are illustrated in
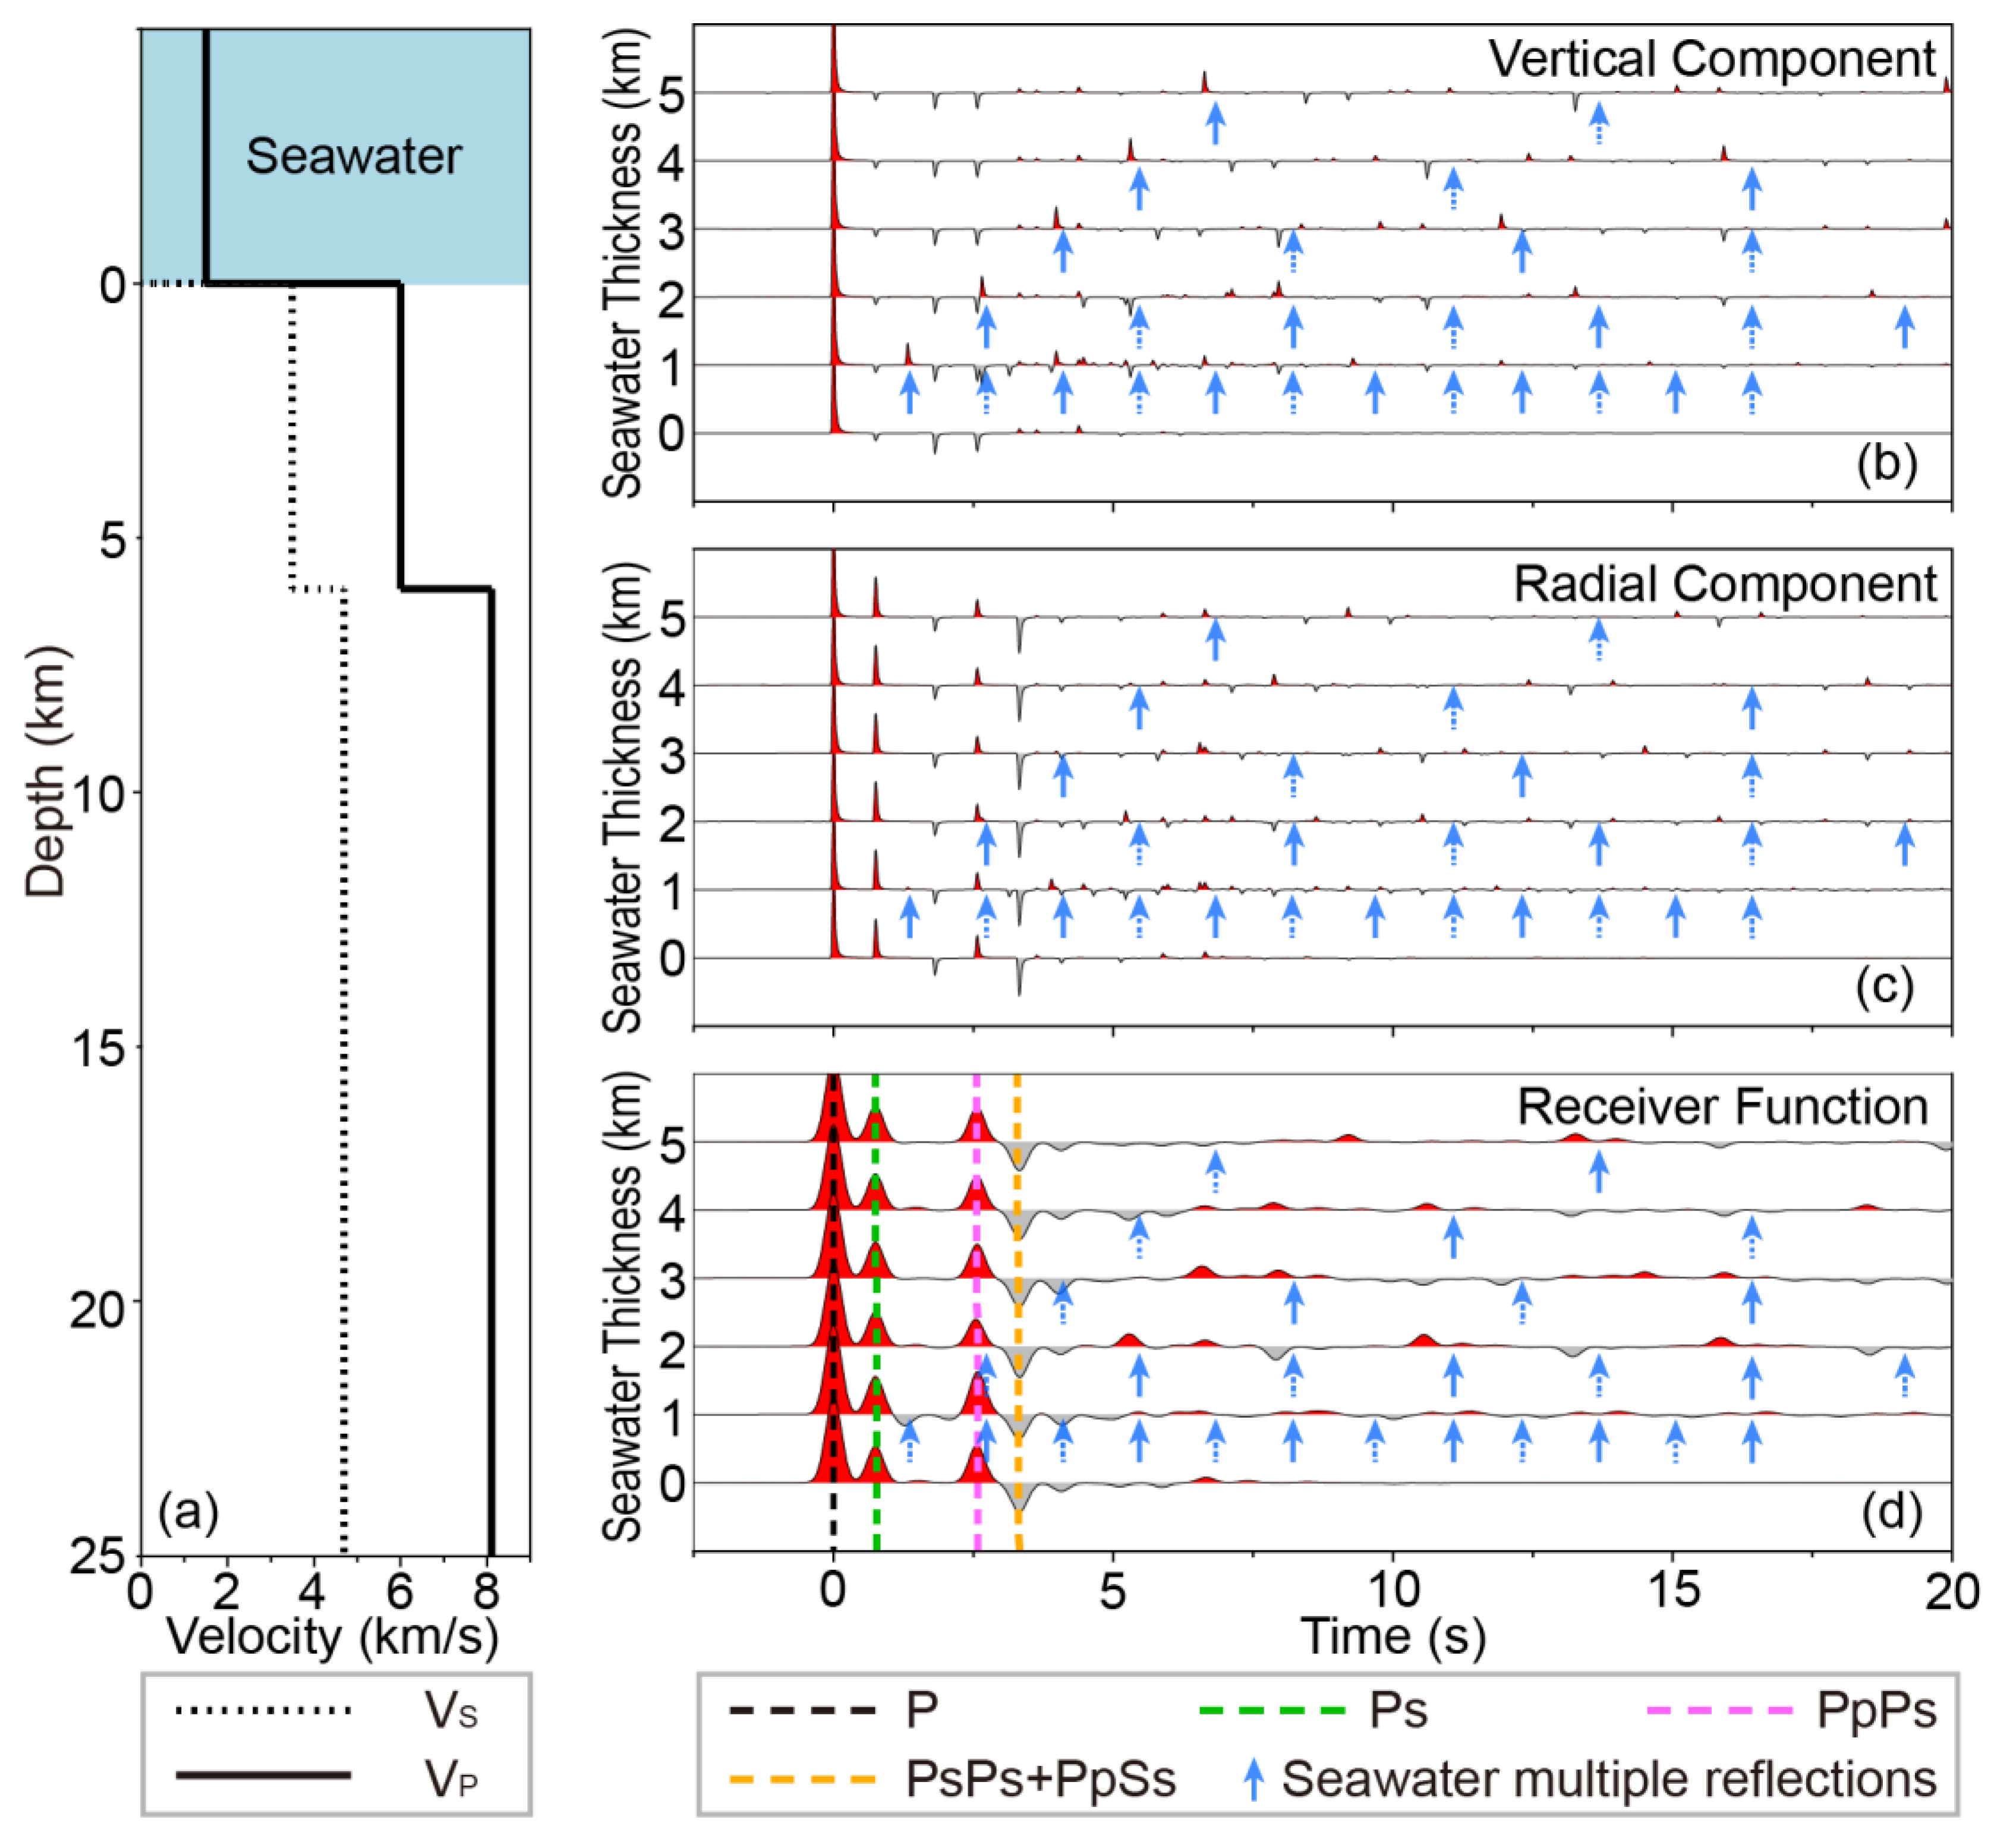
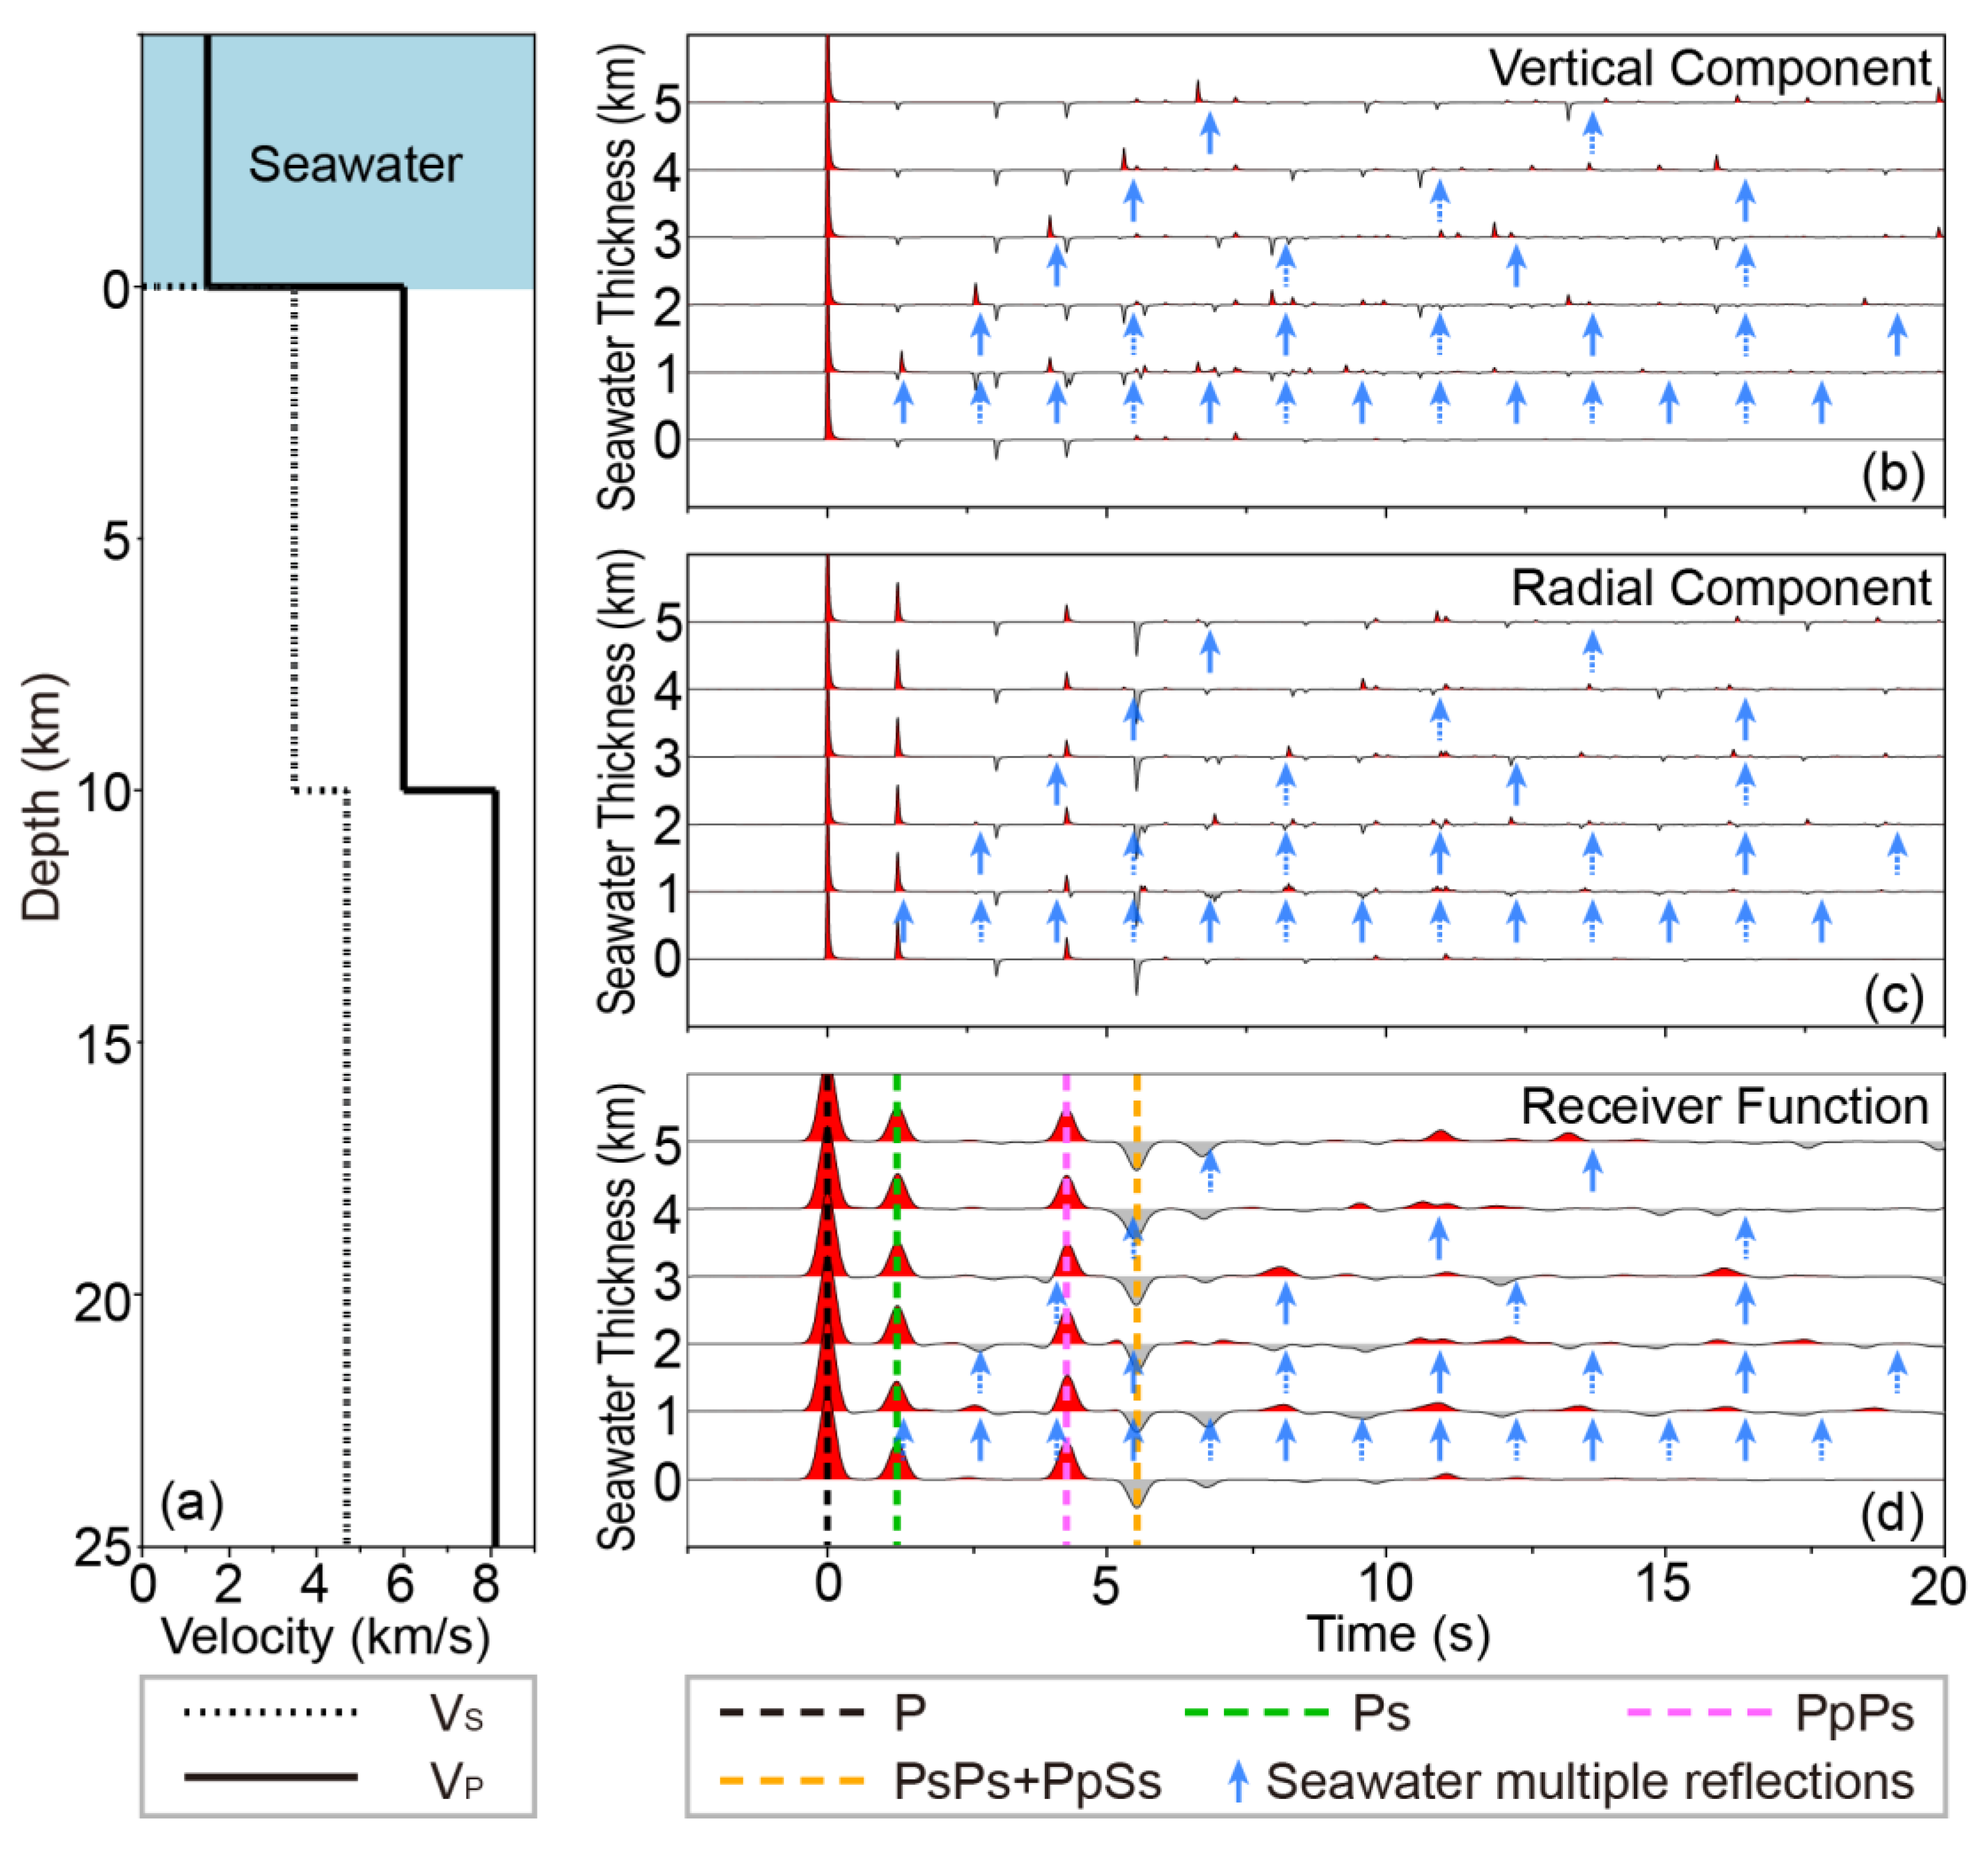
Figure 2a and 4a.
3.2. Synthetic Results of Normal Oceanic Crust Models
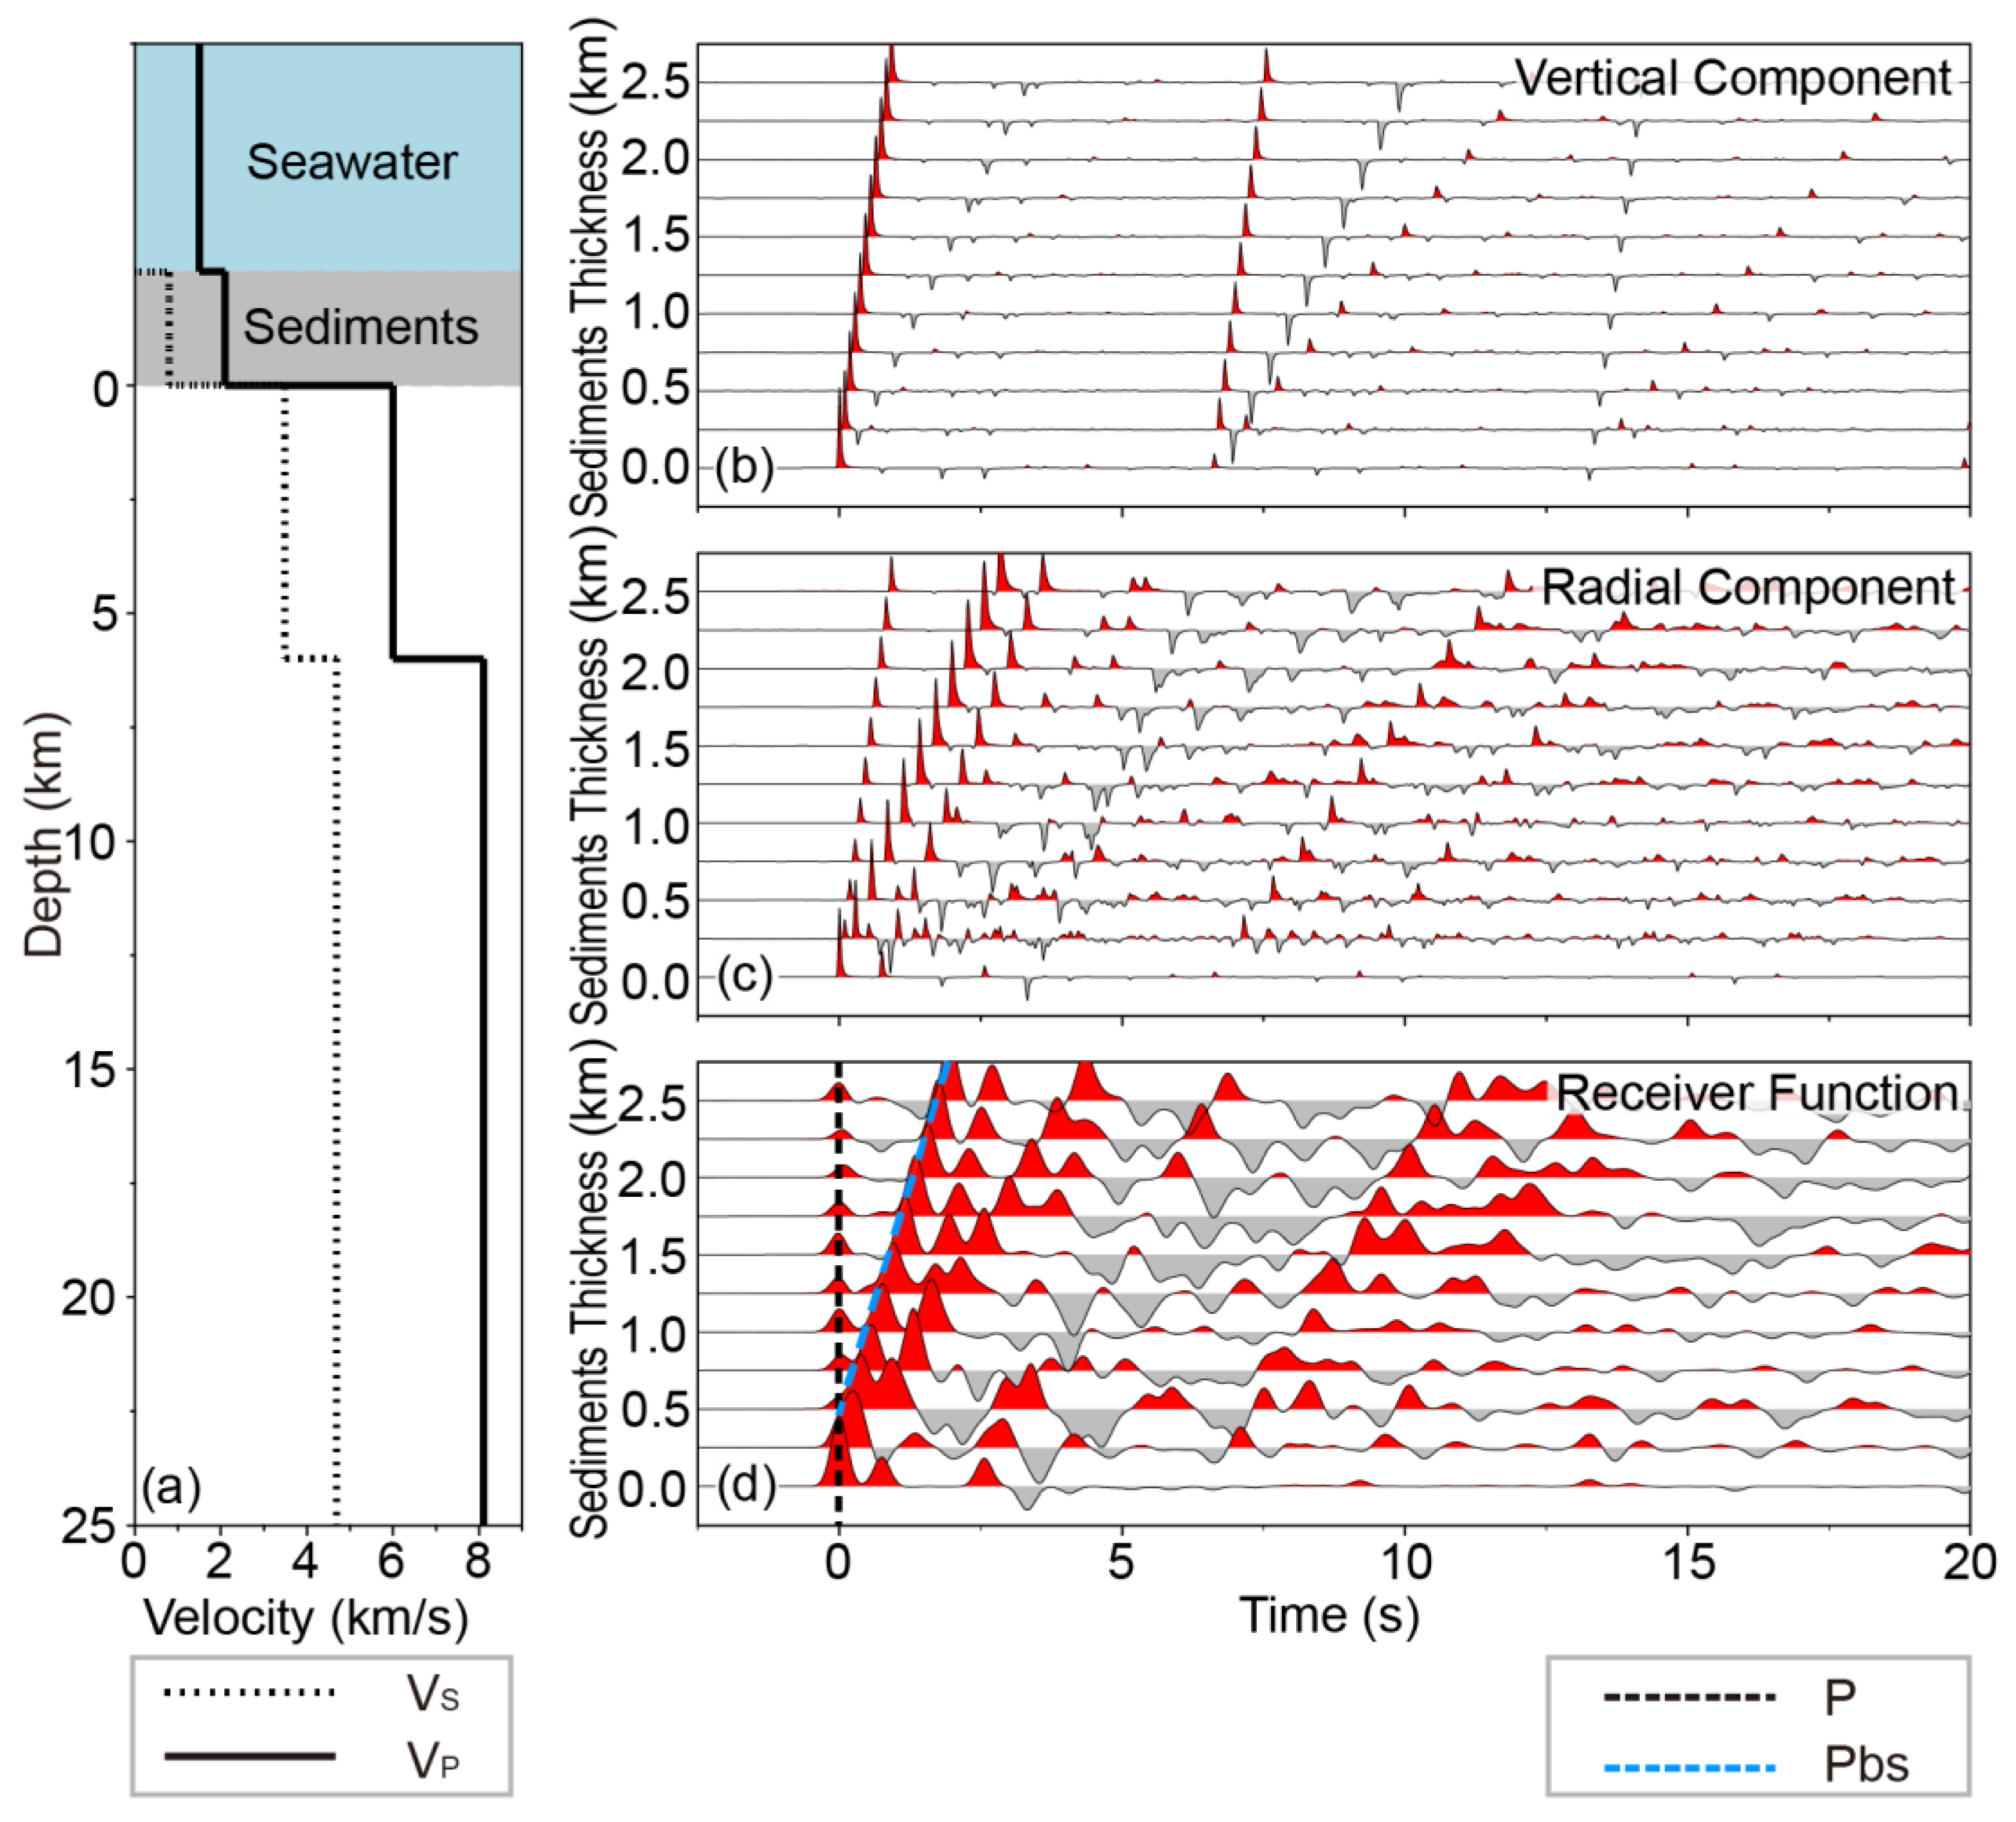
Figure 2b to
Figure 2d illustrate the synthetic three-component seismograms and their corresponding RFs for different seawater layer thicknesses. Notably, seismic phases of P, Ps, PpPs and PsPs+PpSs can be clearly identified in the RF waveforms (
Figure 2d), which are almost not affected by the thickness of the seawater layer. In terms of the vertical (
Figure 2b) and radial (
Figure 2c) seismograms and RFs (
Figure 2d), waveforms within 0-5 s have very high consistency. In the absence of a seawater layer, the RF waveforms after 5 seconds are nearly zero without other phases. However, when the models have a seawater layer, some seawater multiple reflections are contained in the RF waveforms after 5 seconds and result in alternating positive and negative waveforms, respectively. Fortunately, their amplitudes are significantly lower than those of the Moho reflections. Furthermore, three obvious anomalies are found in
Figure 2d: (1) when the thickness of the seawater layer is 1 km, RF has a negative peak around 1 s, and the amplitude of the PpPs phase is relatively stronger than that of the seawater layer thickness equals 0 km; (2) when the seawater layer thickness is 2 km, the amplitude of the PpPs phase is comparatively smallest; (3) when the seawater layer thickness is 3 km, there is a negative peak following the PsPs+PpSs phases, which is considerably stronger than no seawater layer. These three anomalies are obviously resulted from seawater multiples.
3.3. Analysis of Abnormal Characteristics of Synthetic Results
To interpret the above-mentioned anomalies of RFs, we analyze the travel-time characteristics of seawater multiple reflections on horizontal and vertical components. The vertical component shows that the odd-numbered waveforms have positive peaks (see blue solid arrows in
Figure 2b). In contrast, even-numbered waveforms have negative peaks consistent with theoretical predictions of seawater multiple reflections (see blue dashed arrows in
Figure 2b). At the same time, corresponding positive and negative peaks can be found on the radial component at many places. However, most places are hard to identify visually because polarized waves are too weak and mixed with other seismic waves (
Figure 2c). Compared to synthetic RF calculated from the model without a seawater layer, the places differing from those of models with seawater layers are consistent with predicted reflections. Therefore, we conclude that the seawater layer has certain influences on OBS RFs, but the influences are quite slight. Generally, for a thin seawater layer (e.g., 1 km), the travel times of multiple reflections are relatively short, thus they appear within 2.5-10 s. However, when the seawater layer is thick (e.g., 5 km), multiple reflections are not visible before 5 s, and the RF is the same as RF calculated from the model without a seawater layer in this period. After 5 s, there are alternatively positive and negative phases. Whatever the thickness variation of the seawater layer, the influences are reduced with time. Their impacts on RFs can be ignored after 20 s.
3.4. Influence of Seawater Multiple Reflections on H-k Stacking Inversion
Theoretically, the travel times of the reflected seismic waves from Moho discontinuity are less than 5 s on the synthetic RFs, and seawater multiple reflections would affect the application of the H-k stacking method to the inversion of the Moho depth and average crustal V
P/V
S ratio when the seawater layer is thin. However, the phases of Ps, PpPs, and PsPs+PpSs dominate the main waveforms of RFs, thus the disturbances induced by seawater multiple reflections are quite slight. According to
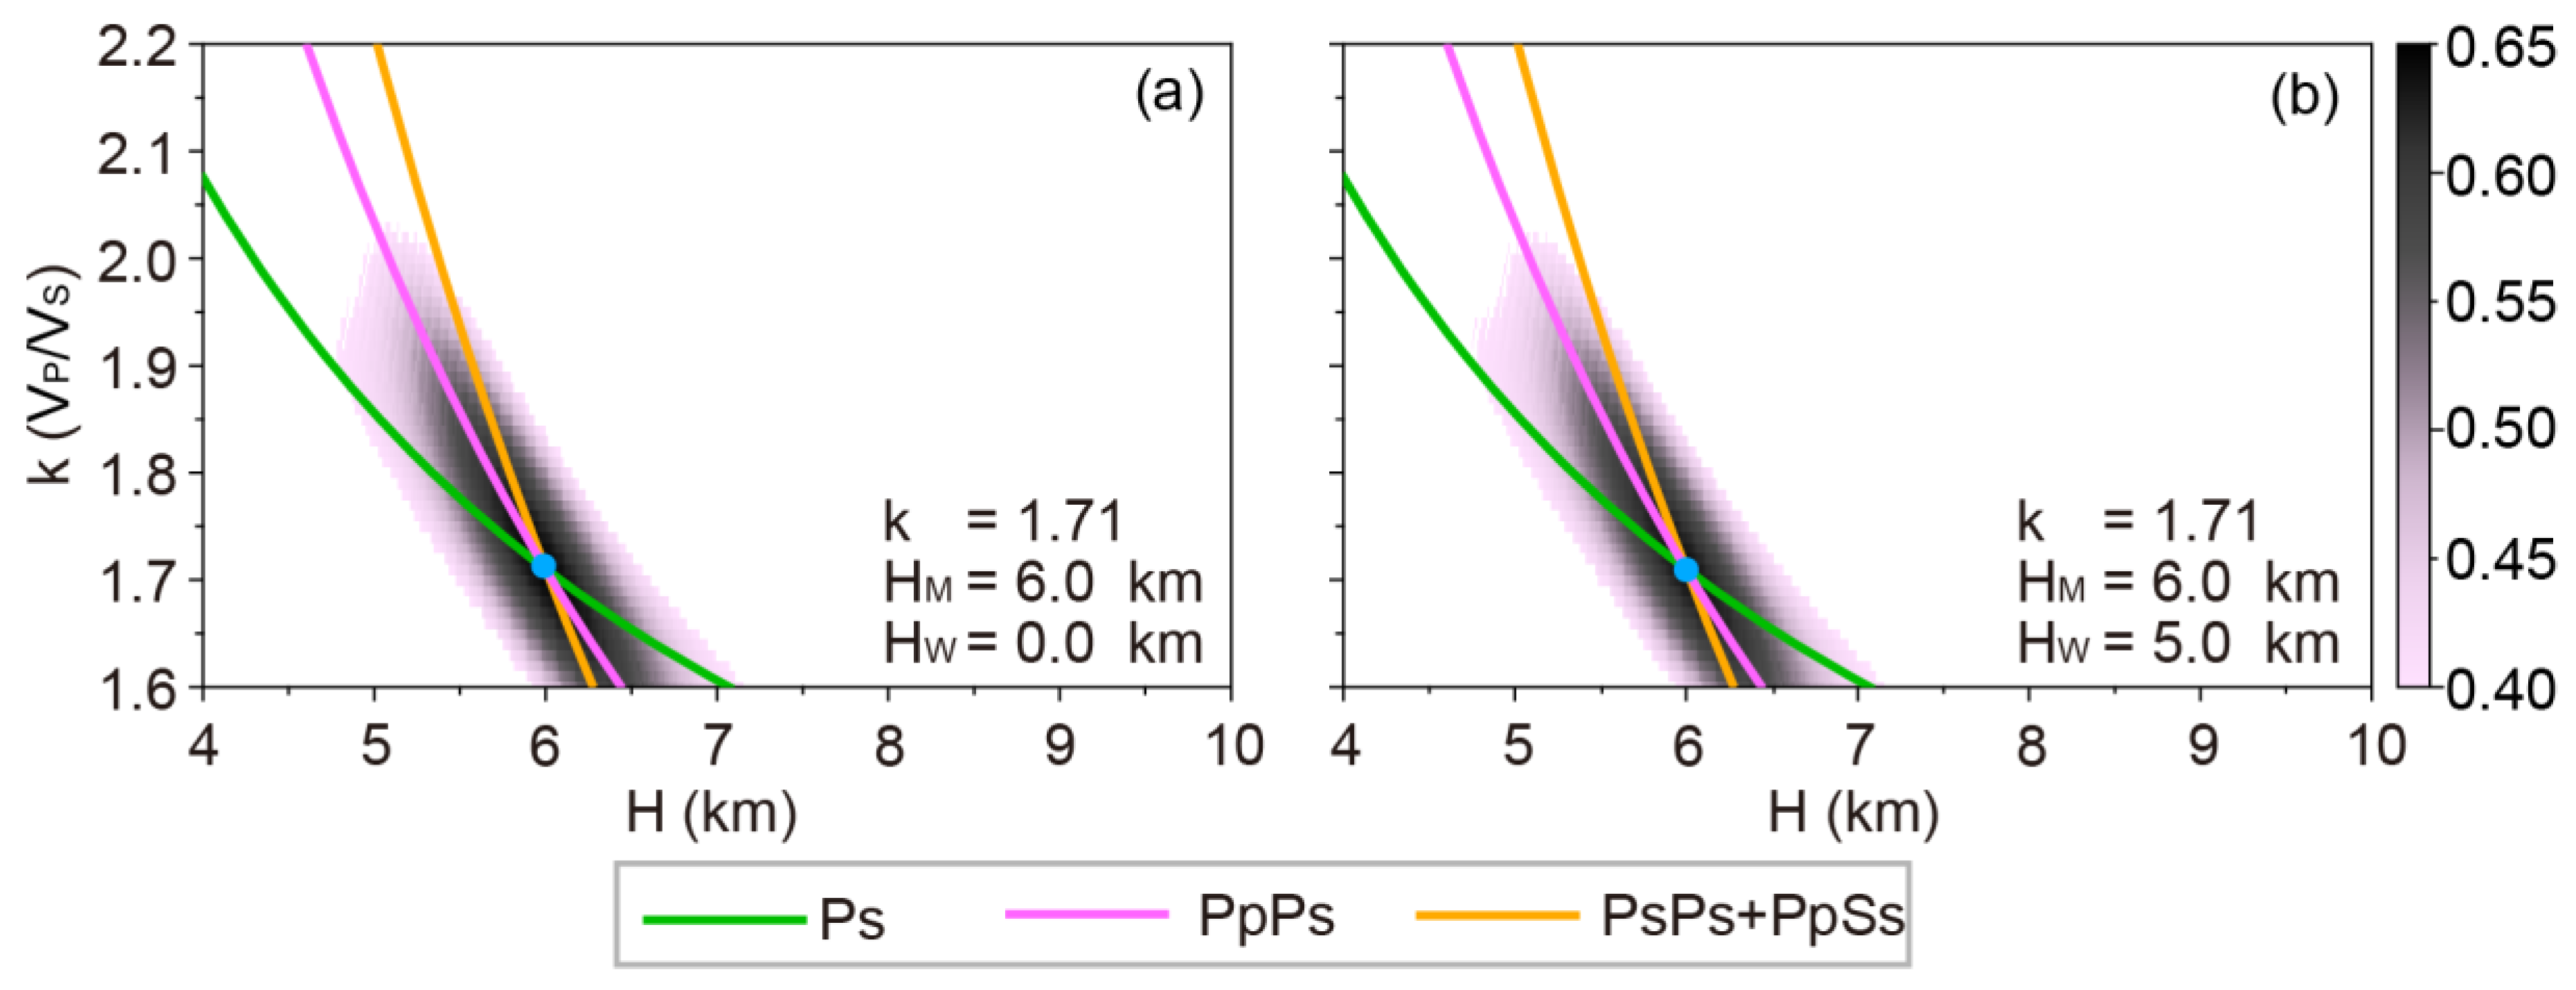
Figure 2, it is reasonable to deduce that the influence of seawater multiple reflections on H-k stacking inversion could be ignored, and the corresponding results are shown in
Figure 3. Based on the RFs calculated from normal oceanic crust model (the oceanic crust thickness and the average crustal V
P/V
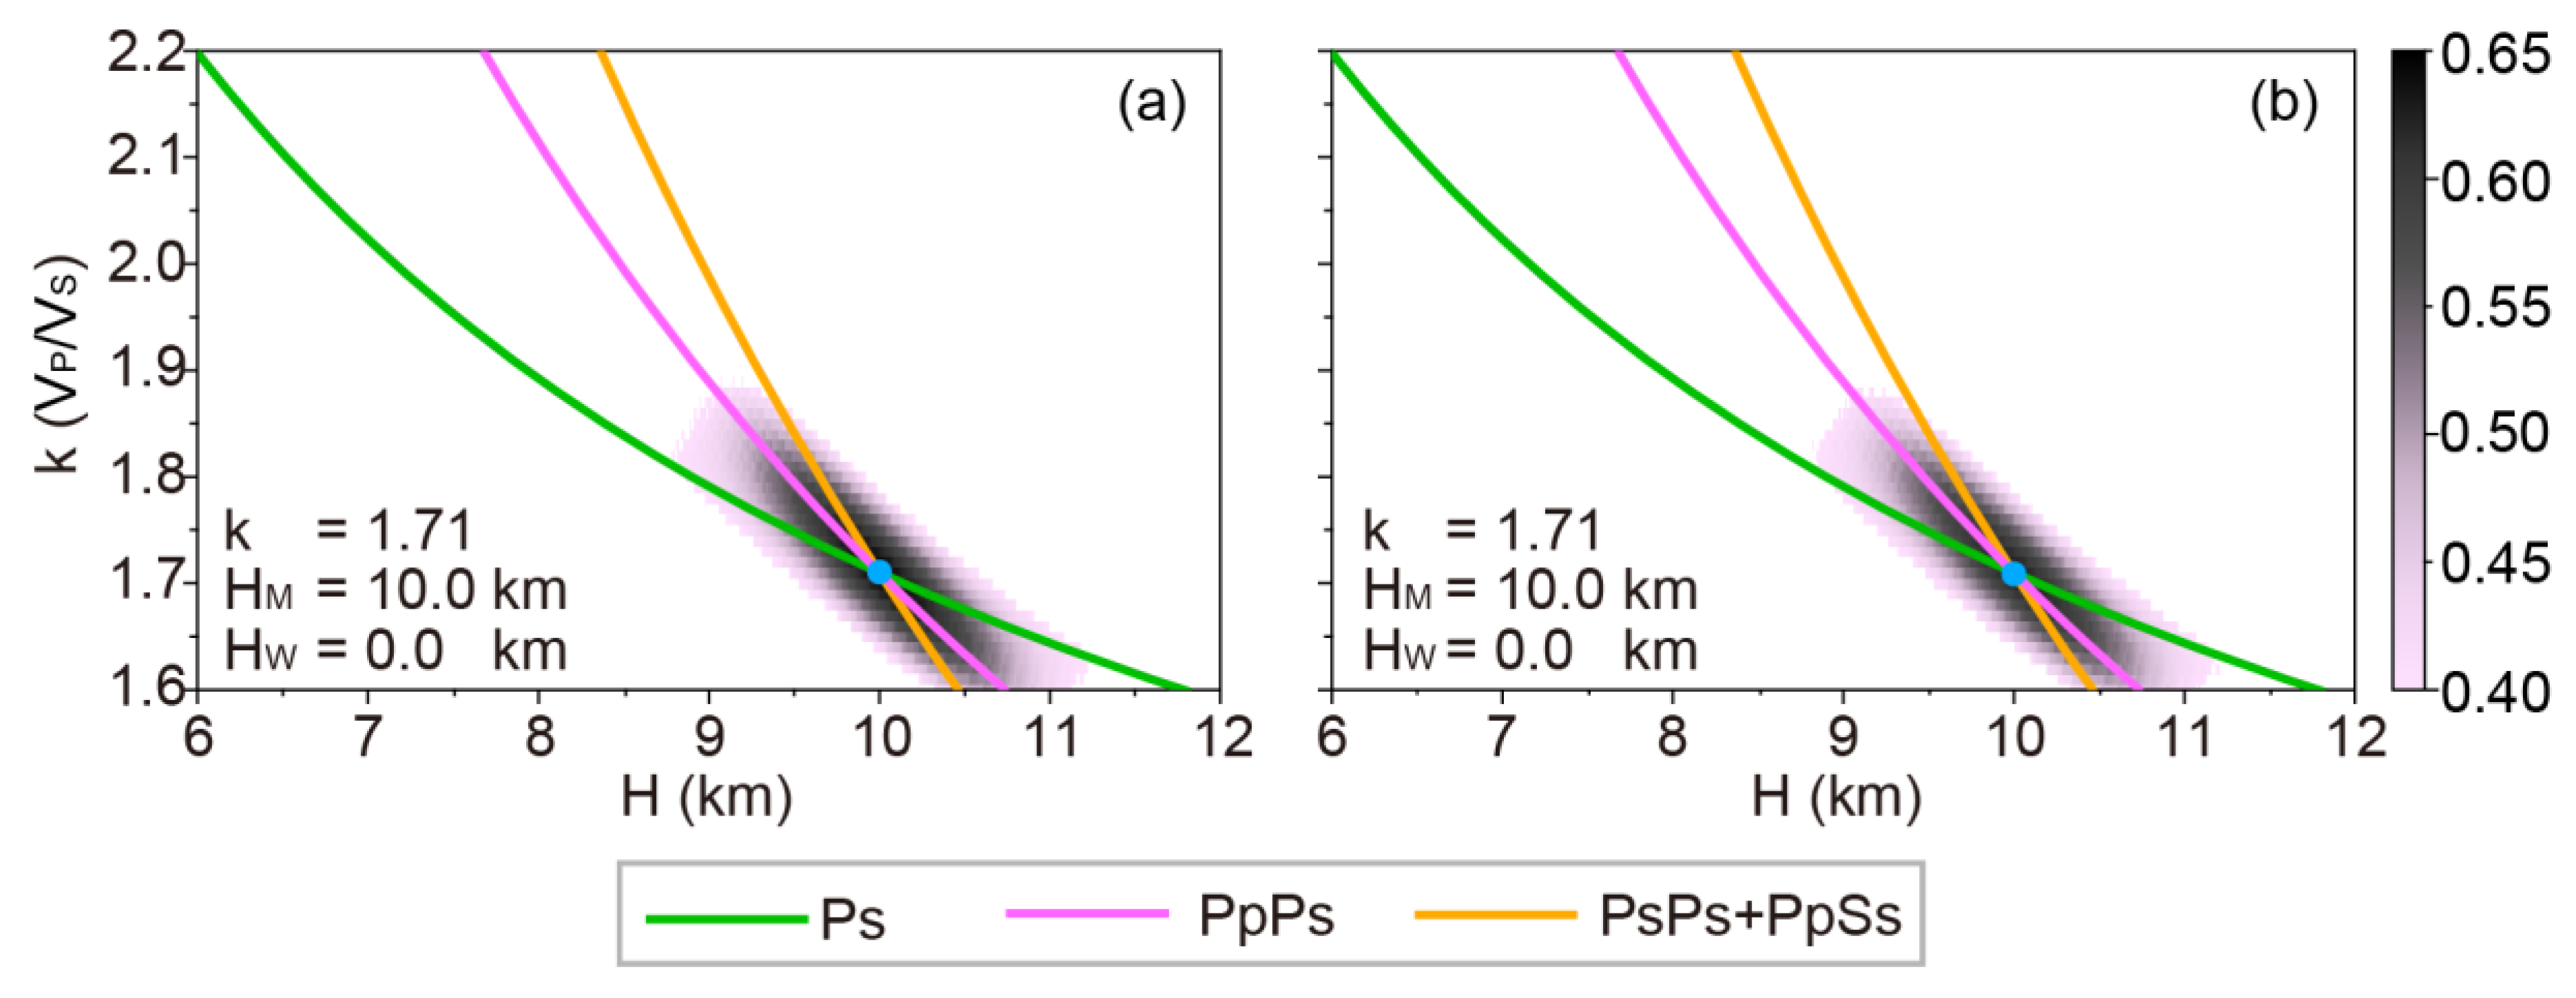
S ratio are 6 km and 1.714, respectively), applying the H-k stacking method to these RFs to achieve the results. Comparing
Figure 3a with 3b, the calculated crust thickness equals the presupposed thickness (6 km), and the computed V
P/V
S ratio (1.71) is close to the presupposed value (1.714). The calculated crust thicknesses are the same whether the seawater thickness is 0 km or 5 km. In addition, because the grid searching step of the V
P/V
S ratio is 0.01, so this tiny difference has no significance in synthetic tests and practices of real data. It is worth noticing that the grid searching of the H-k stacking method should select a suitable time range to avoid the strong amplitude of the direct P-wave, which is not used in stacking. We have to adjust the search range, especially when the optimal point is close to the grid edge.
3.5. Synthetic Results of Thick Oceanic Crust Models
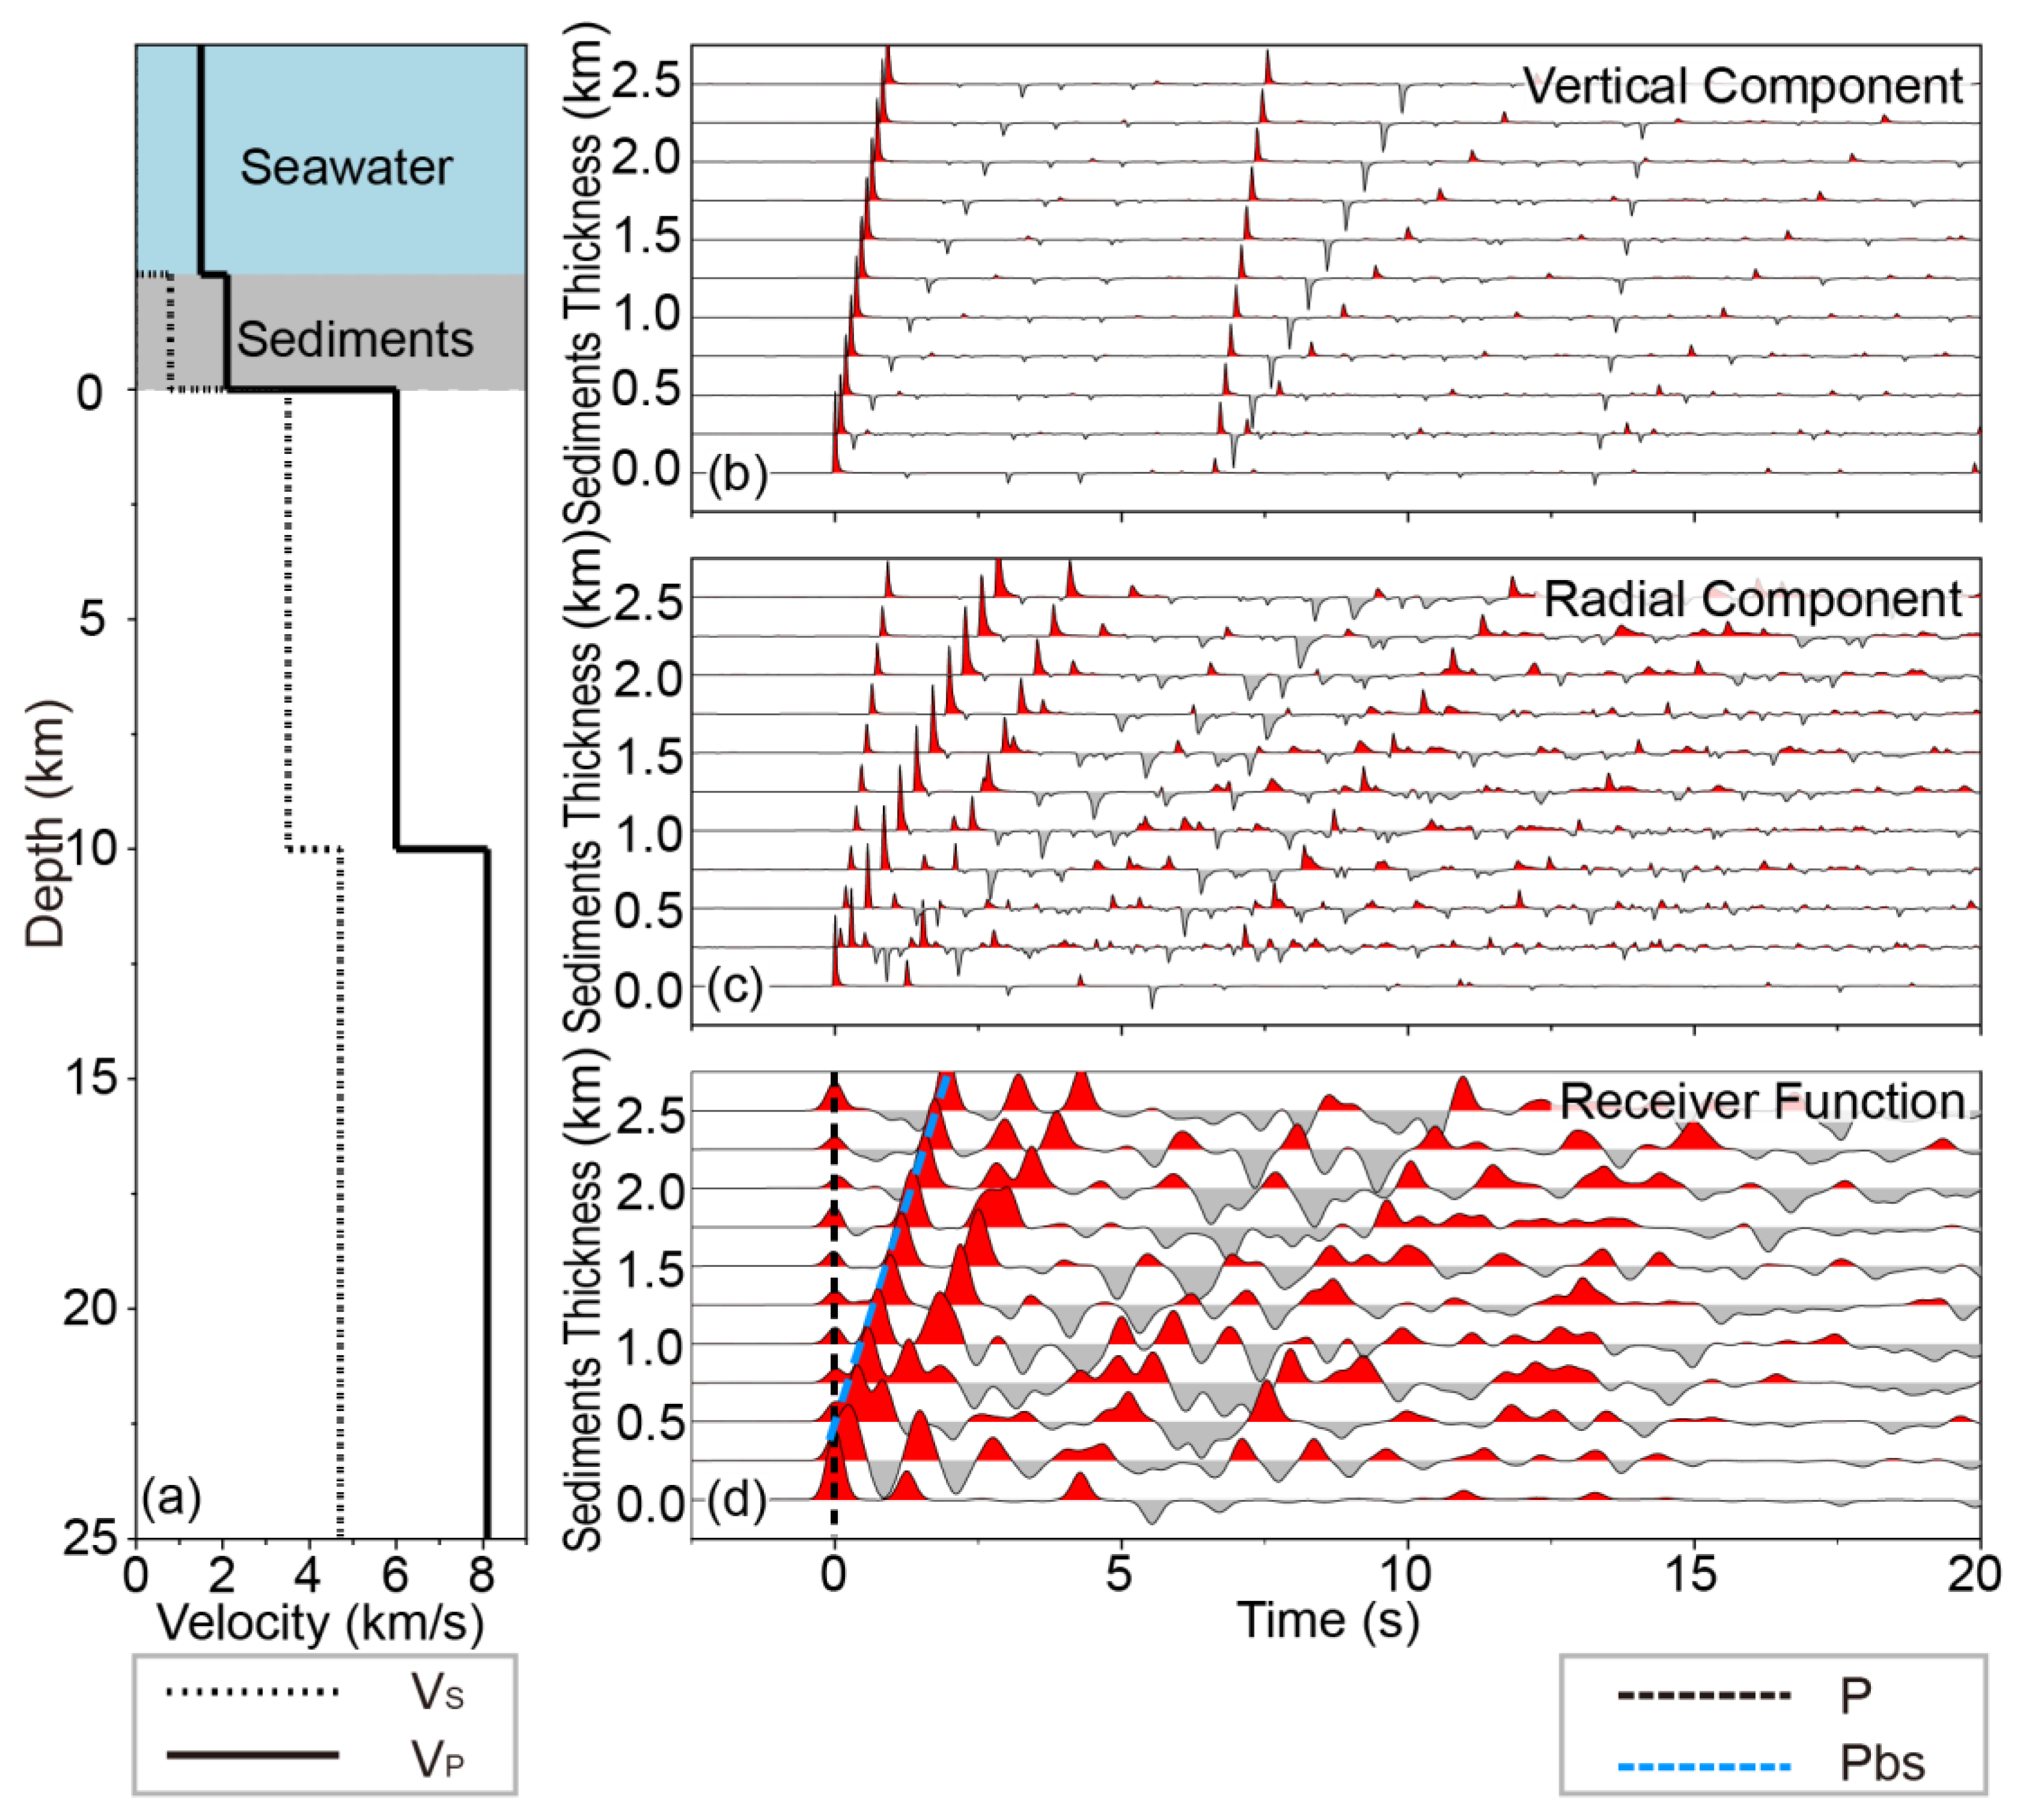
To analyze the impact of seawater multiple reflections on the RF in the case of a thick oceanic crust model (10 km), we also calculated the corresponding RFs (
Figure 4) and analyzed the influence of seawater multiple reflections on the application of the H-k stacking method (
Figure 5). They are extremely similar to those of normal oceanic crust models (
Figure 2 and
Figure 3). The waveforms of vertical, radial and RF components are close to those of the normal oceanic crust models. Because of the thicker oceanic crust, the longer travel times of the Moho reflected waves extend the time window of seawater multiple reflections up to ~10 s (
Figure 4d). In which, the Ps, PpPs, and PsPs+PpSs phases are affected by seawater multiple reflections. However, the P, Ps, PpPs, and PsPs+PpSs phases dominate the main waveforms (
Figure 4d), which are consistent with the results of the normal oceanic crust models. Although seawater multiple reflections still have impacts on the RFs of the thick oceanic crust models, they do not affect the application of H-k stacking method (see
Figure 5). Compared with
Figure 2d, due to the thicker oceanic crust, the converted phases of the Moho are distributed sparsely on waveforms, leading simple selection of H-k stacking parameters.
4. Influences of Sedimentary Layer Thickness on OBS RFs
Except for the influence of the seawater layer, oceanic basins are covered by marine sediments, especially in marginal seas. The seismic wave propagation and dissipation in sedimentary layers may directly affect the quality of the RFs extracted from the observed seismic data. Therefore, it is necessary to evaluate the impact of sedimentary layers for most oceanic basins, except for regions of newly formed oceanic crust or seamounts.
4.1. Half-Space Model with Seawater and Sedimentary Layers
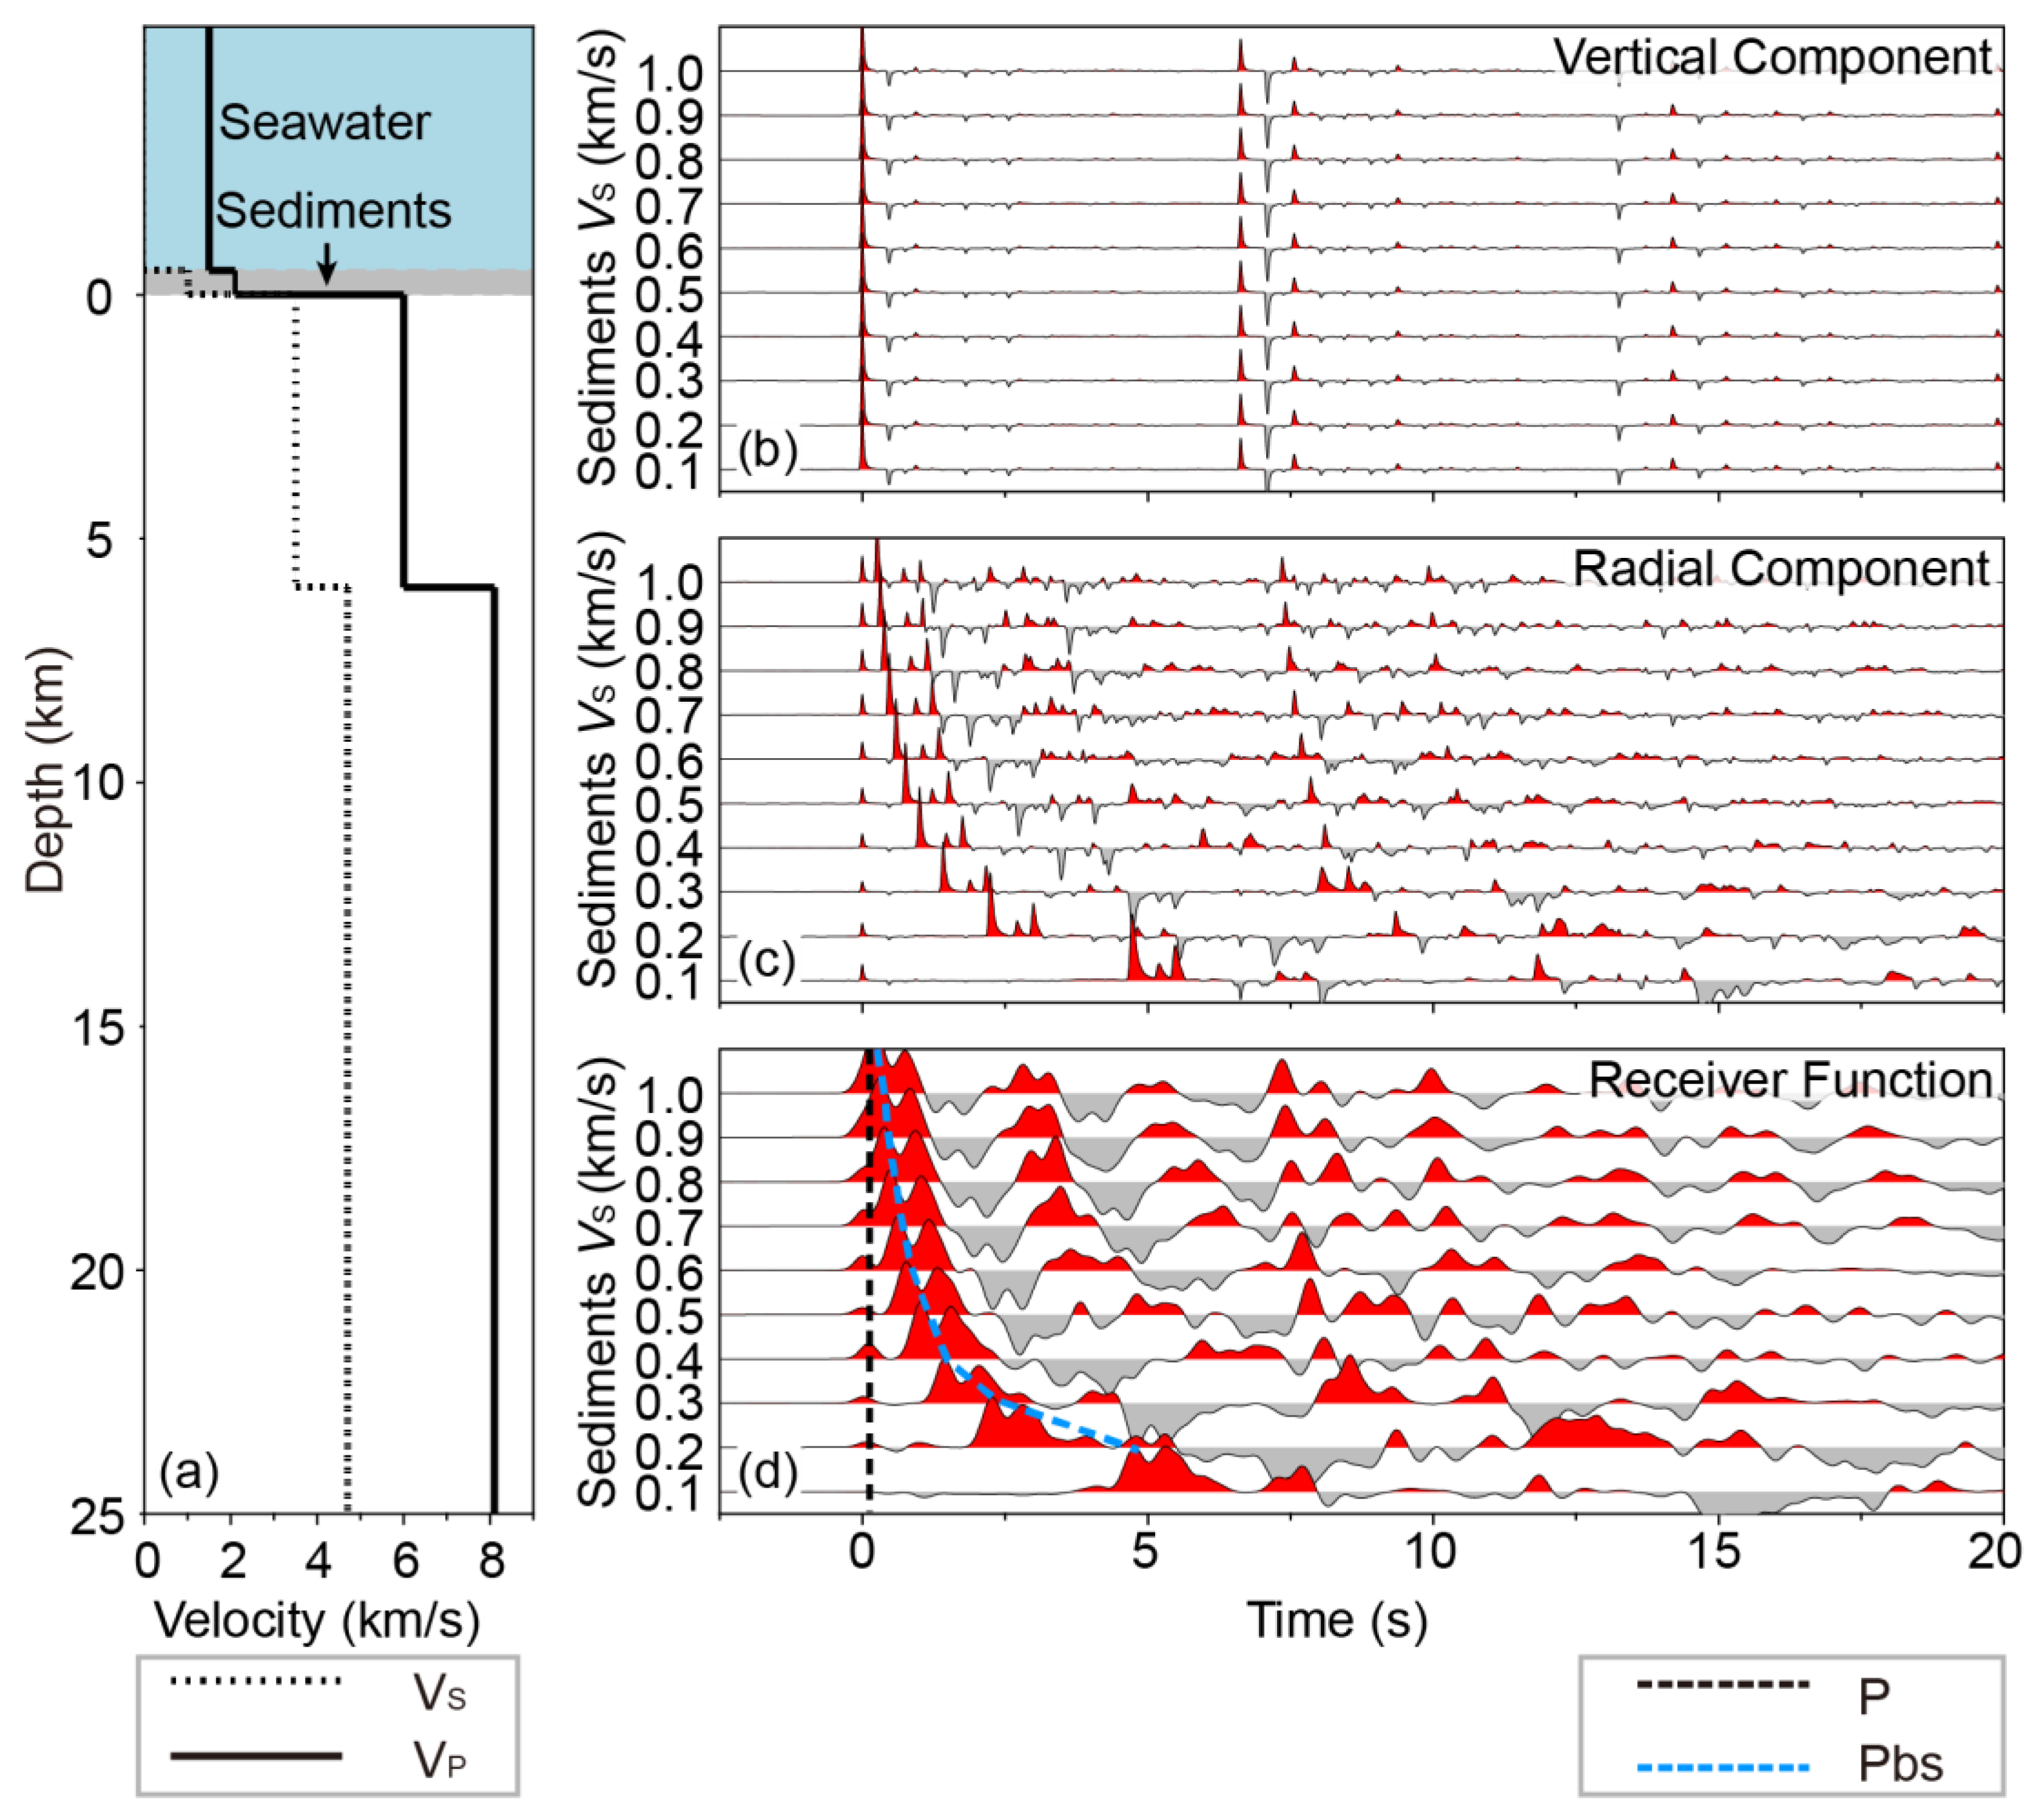
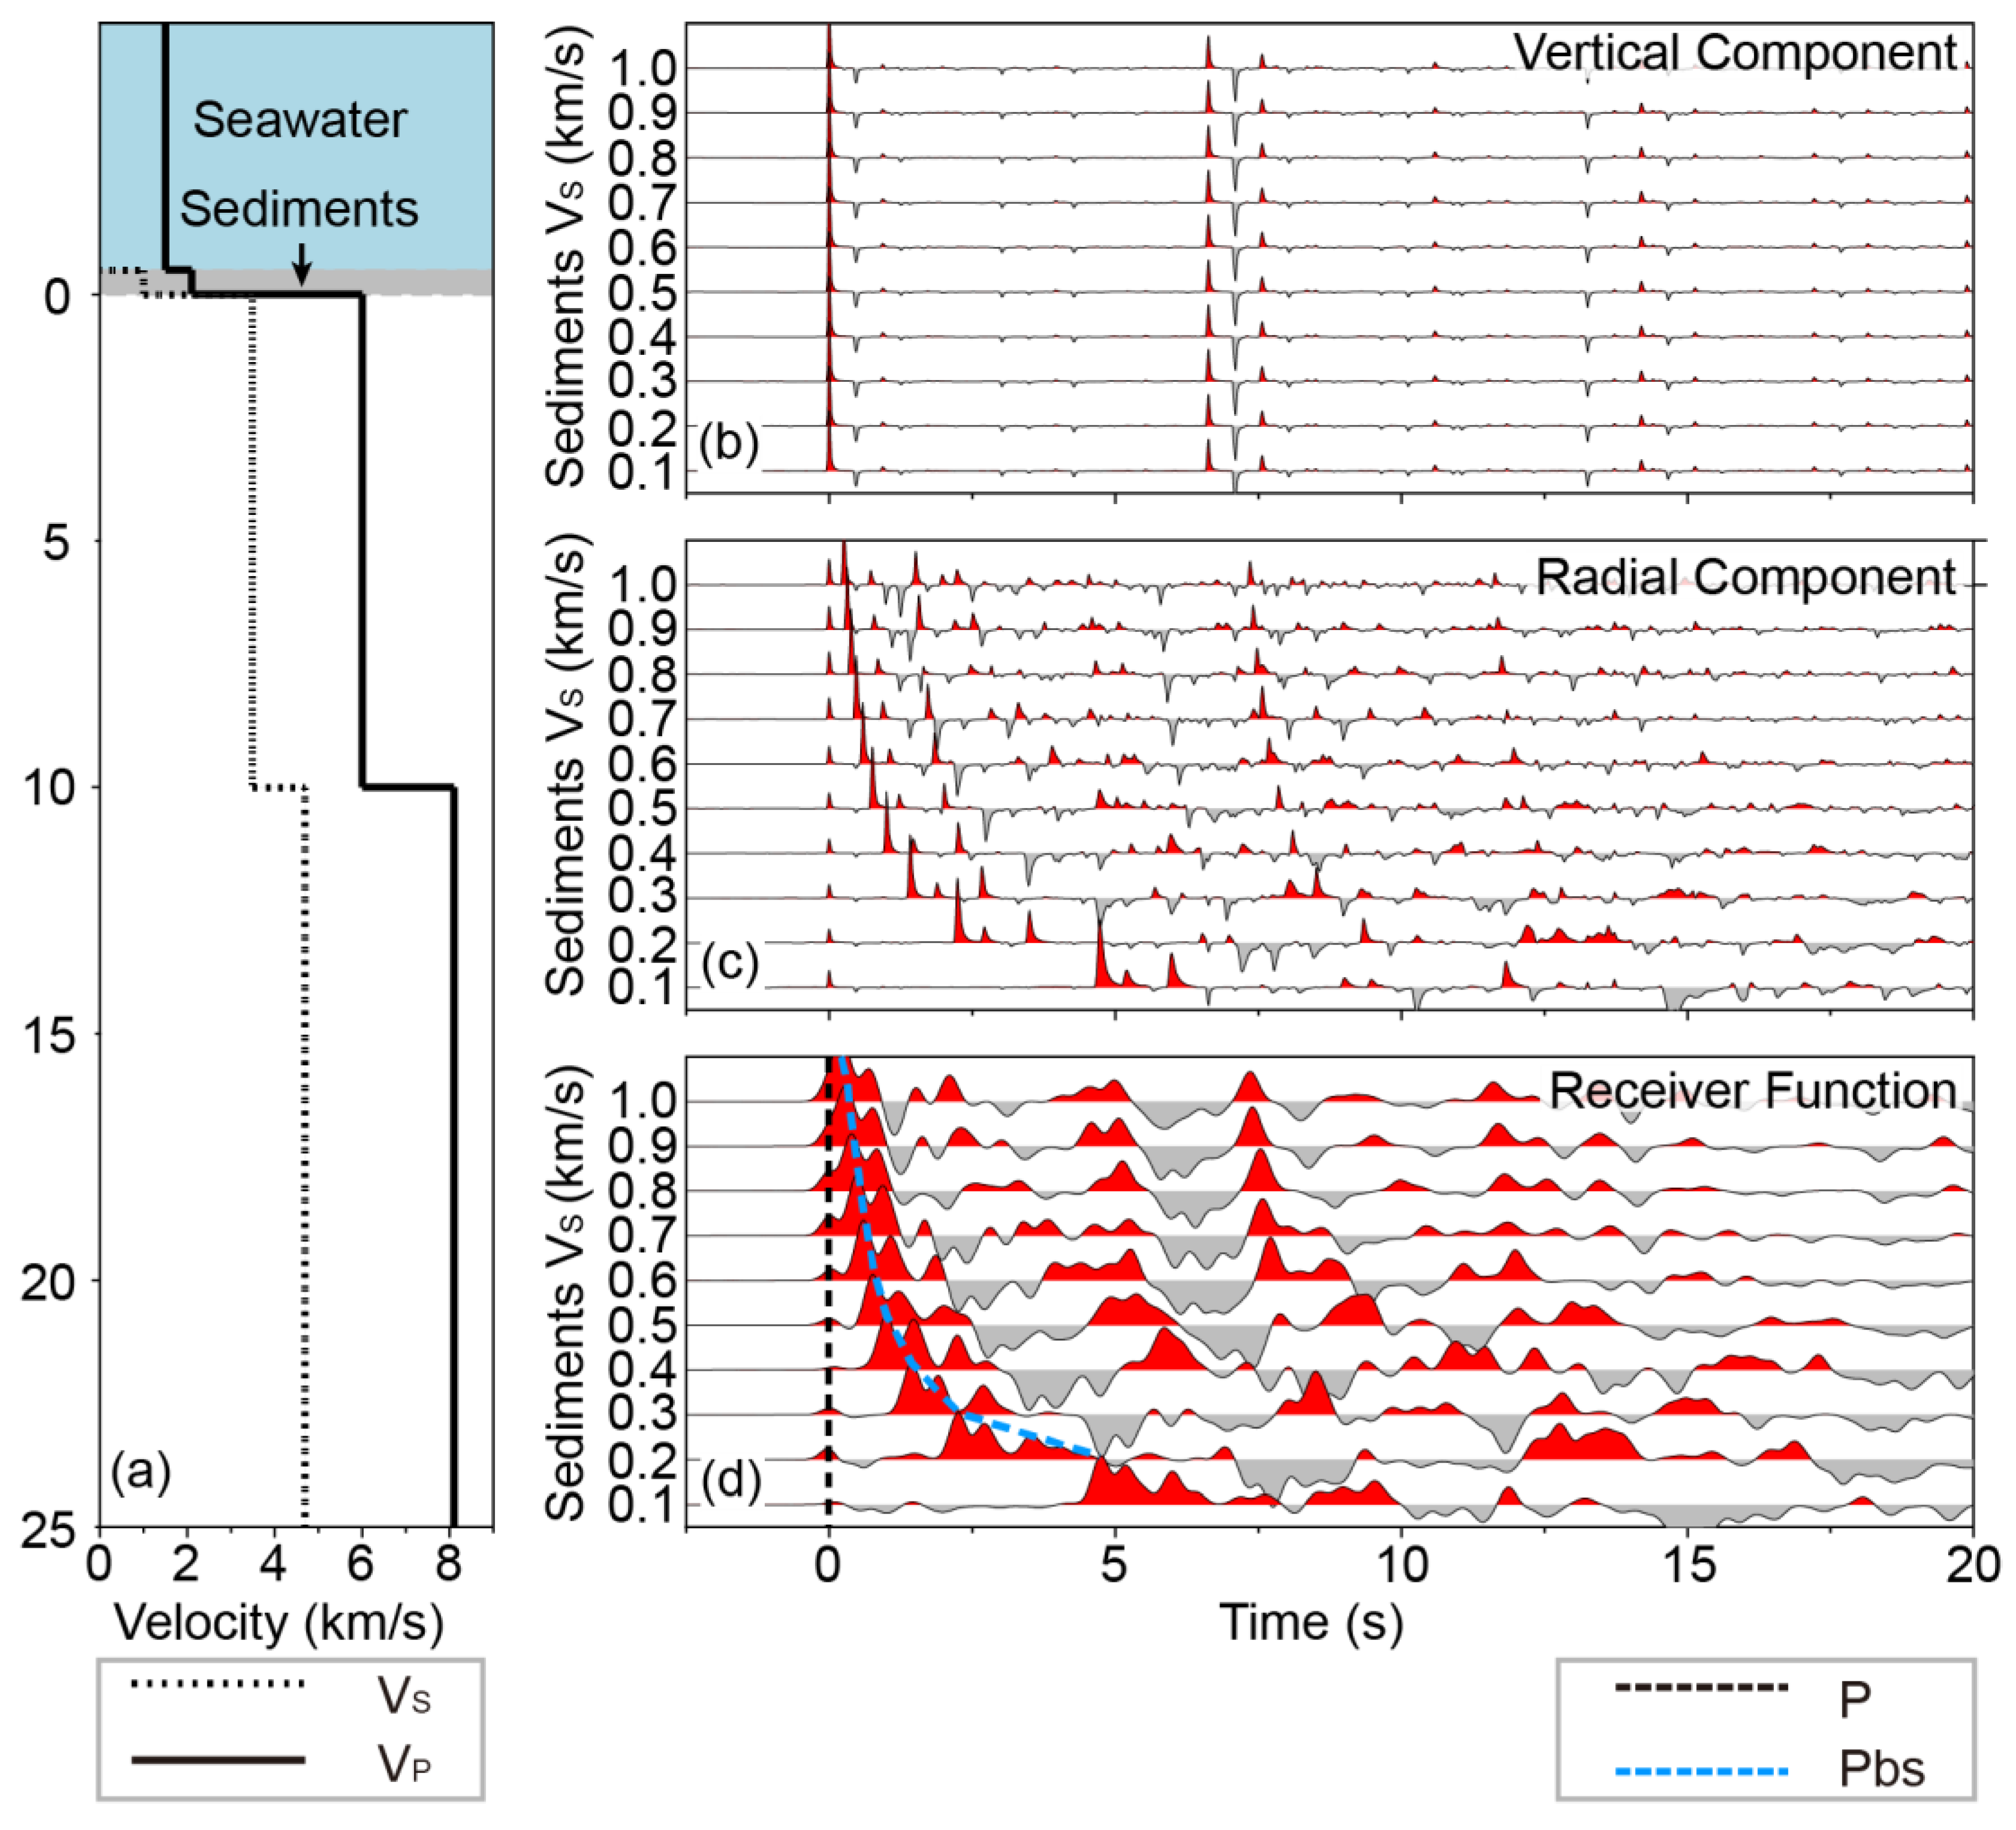
To estimate the detailed impact of a sedimentary layer on OBS RFs, the model parameters of synthetic tests are configured in
Table S2. The velocity structures of normal and thick oceanic crust are shown in
Figure 6a and
Figure 7a, respectively. According to
Table S2, these models fix the seawater thickness of 5 km. Normal and thick oceanic crust thicknesses are 6 km and 10 km, respectively. The thickness of the sedimentary layer varies from 0 to 2.5 km with a step of 0.25 km. V
P and V
S of the sediments are 2.1 km/s and 0.8 km/s, respectively. The density of the sedimentary layer is 2.0 g/cm3.
4.2. Influences of Sedimentary Layers on OBS RFs
Synthetic seismograms and their RFs are shown in
Figure 6b–d and
Figure 7b–d, respectively. Figures show that the thickness variation of the sedimentary layer would drastically affect the waveform of the RFs. When the sedimentary layer is thin, converted waves (Pbs;
Figure 6d and
Figure 7d blue dashed line) of the layer have a larger amplitude than that of the direct P-wave (
Figure 6d and
Figure 7d black dashed line), and their arrival times are close. The thin sedimentary layer with relatively lower speed causes delayed arrival of direct P-wave and results in the overlap of their waveforms on RFs. When the thickness of the sedimentary layer increases, the amplitude of the direct P-wave becomes weaker, and the phases of Ps, PpPs, and PsPs+PpSs are difficult to discriminate distinctly. Multiple reflected phases overlap with each other, leading to Ps, PpPs, and PsPs+PpSs phases not occupying a significant dominant position on RFs. These phenomena indicate that submarine sediments significantly influence the effective information of RFs, which correspond to the geological structures below the seismic station array.
4.3. Influences of Sedimentary Layers on H-k Stacking Inversion
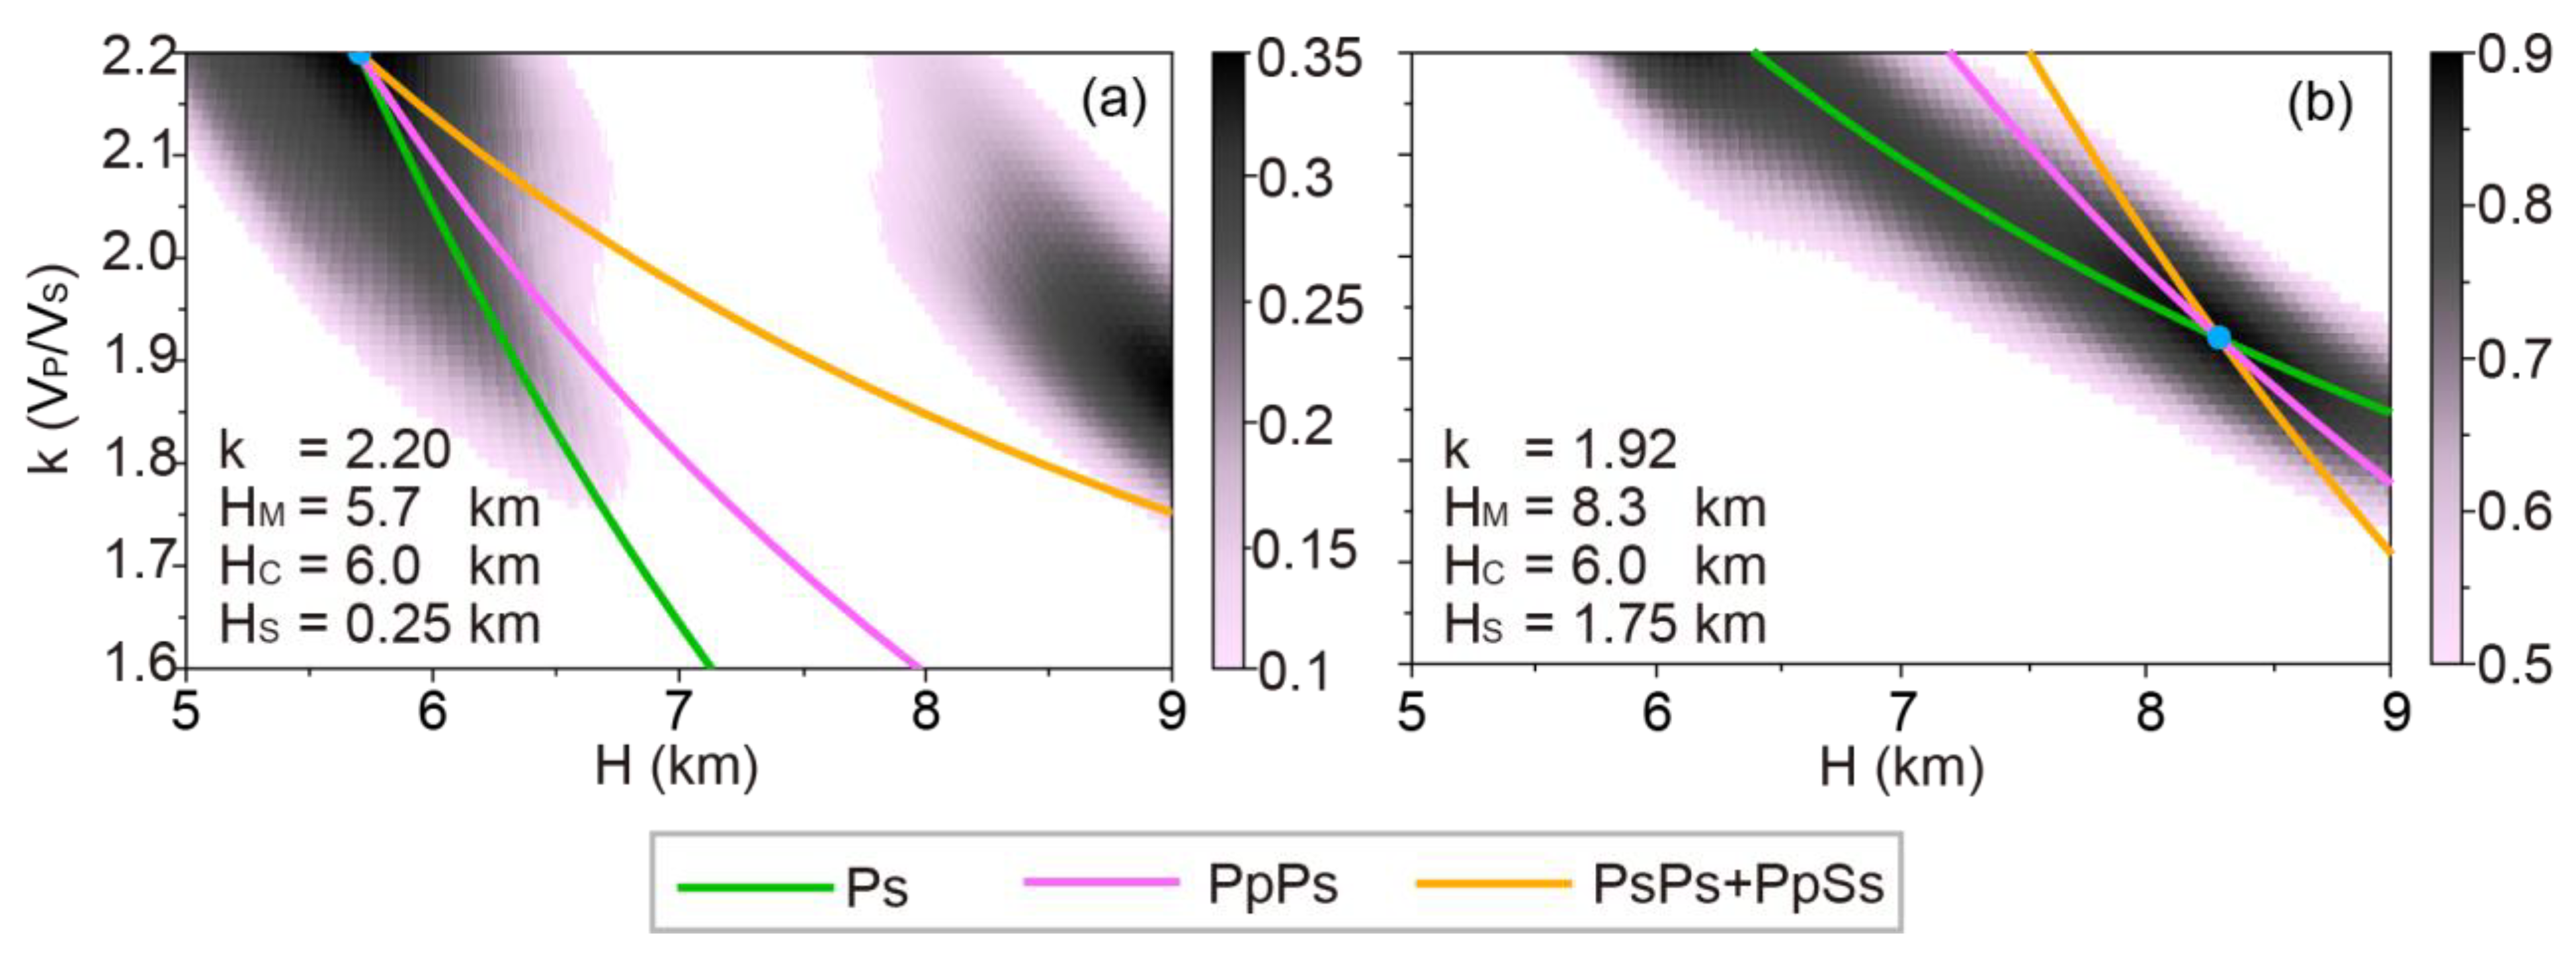
Synthetic results of models with sediments indicate that the seismic responses are quite complicated than models without sedimentary layers. Waveform overlap of multiple converted phases reduces or even destroys convergence of the H-k stacking results, which leads to difficulty in determining the oceanic crust thickness and average crustal V
P/V
S ratio accurately (see
Figure 8 and
Figure 9). When the oceanic crust is 6 km thick, thickness variations of sedimentary layer leads to the estimated oceanic crust too thick or too thin. Most of them are thicker than synthetic models. Similarly, thickness variations of the sedimentary layer also result in lower or higher V
P/V
S ratios (see
Table 1 for more details). When the oceanic crust is 10 km thick, the thickness variations of the sedimentary layer cause the same results (
Table 1). These tests suggest that the existence of a sedimentary layer causes a significant difference in structures between H-k stacking results and the presupposed model, and the variation of the sedimentary layer leads to a much more complicated situation.
4.4. Influences of Sedimentary Layers on rfs Waveform Inversion
The above numerical tests show that the sedimentary layer (regardless of its thickness) will lead to significant uncertainties in the estimated structures by the H-k stacking method due to the overlap and disordered waveform of multiple reflected phases. Therefore, the effectiveness of the inversion using RF waveforms to obtain the Vs structure beneath the station through non-linear inversion algorithms becomes very important, because the Vs structure can serve as an alternative to the H-k stacking results.
This study adopts the NA in RF waveform inversions for different models, including thickness variations of the oceanic crust, seawater, and sedimentary layer (see
Table 1 for details).
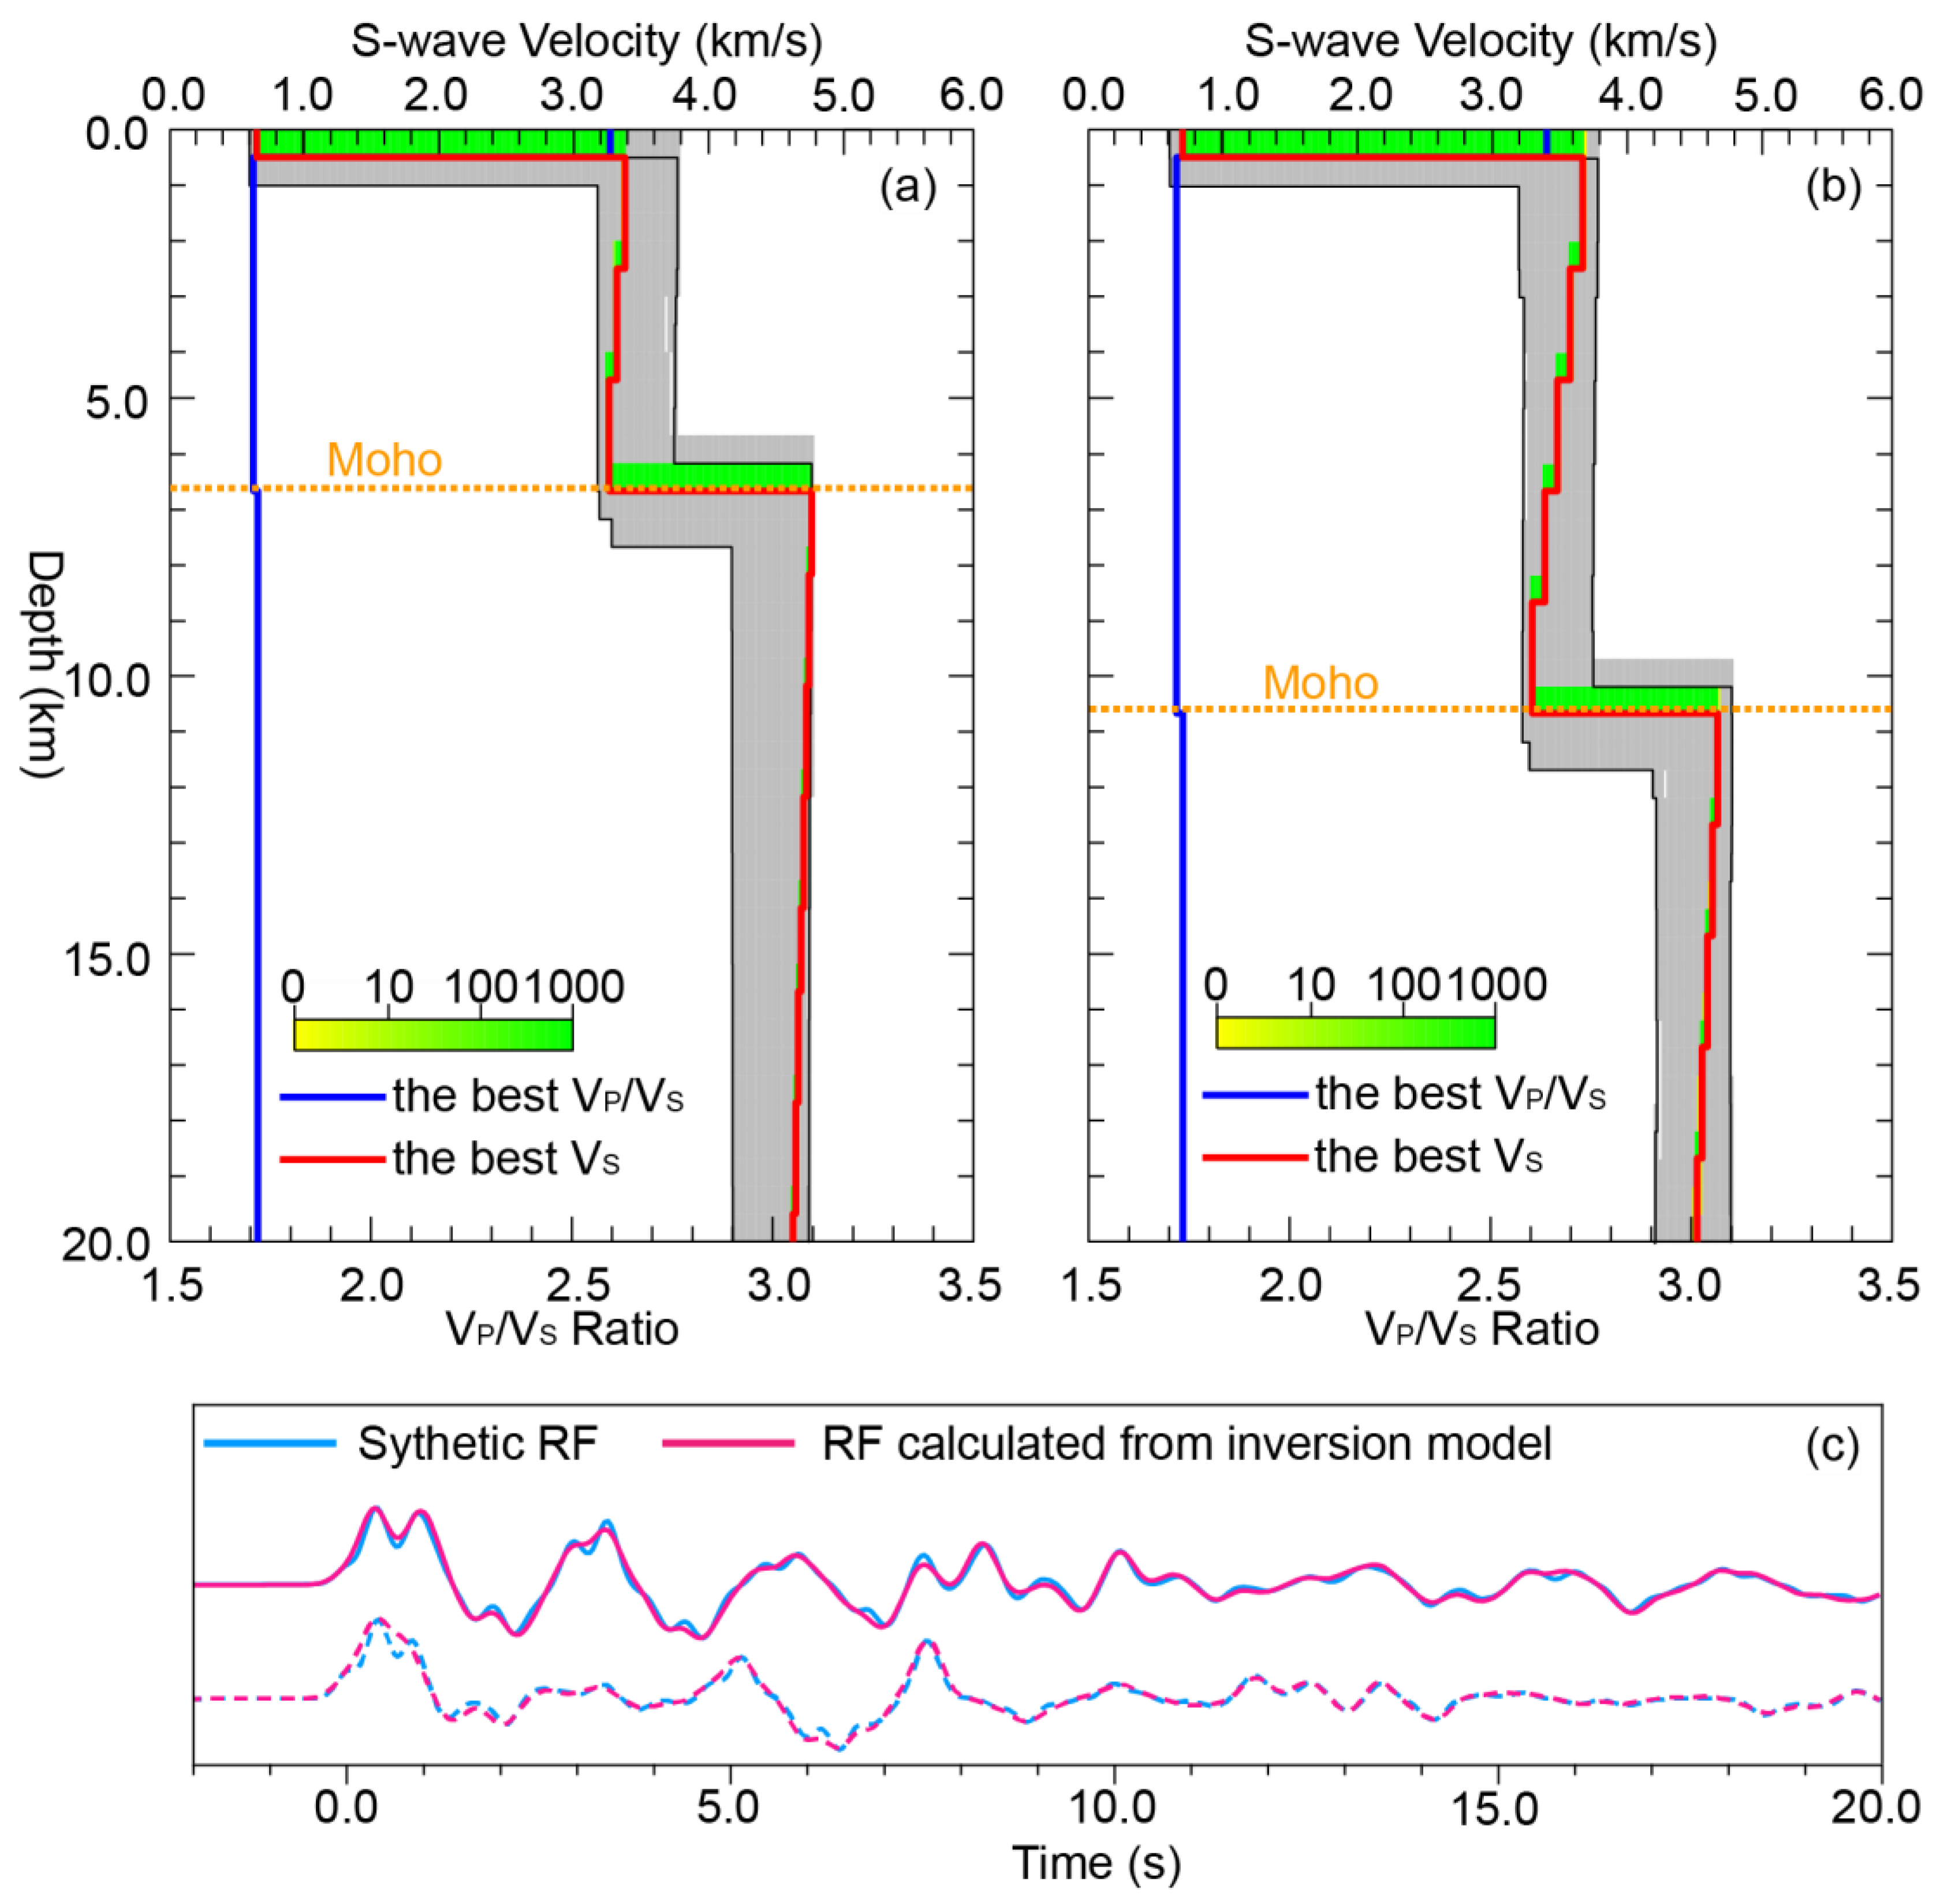
Figure 10 illustrates two results obtained from NA inversion for 6 and 10 km thick crust with overlying 0.5 km thick sediments, respectively. The left panel (
Figure 10a) shows the results of the normal oceanic crust (6 km) with a sedimentary layer of 0.5 km (i.e., Moho depth is 6.5 km). The inverted optimal V
S and V
P/V
S ratio are very close to the with very slight differences. In contrast, when the oceanic crust thickness is 10 km with a sediment layer of 0.5 km thick (i.e., Moho depth of 10.5 km), the results of NA inversion are approximately the same as the presupposed model. Besides, the other inversion results based on the parameters listed in
Table 1 are also perfect. In practical work, the seawater depth can be obtained using acoustic techniques (e.g., multi-beam systems), and the VP of seawater can be taken as a constant of 1500 m/s. Therefore, the synthetic tests mentioned above suggest that the influence of the seawater layer on the inversion results is almost negligible. Furthermore, the RF waveform inversion (such as NA used in this study) can effectively overcome the disadvantaged effects caused by the sedimentary layer. Thus, the reliable structures below stations are available by using the post-processing of RF mentioned above.
5. Influences of VS variation of the Sedimentary Layer on OBS RFs
5.1. Half-Space Model with Varied VS of the Sedimentary Layer
Different from the almost constant seismic velocity values of seawater, both seismic velocity and thickness of the sedimentary layer should be considered in RF waveform inversion. Following, we simulate the influence of V
S variations of the sedimentary layer on OBS RFs. According to
Table S3, these models fix the seawater and sediments thickness of 5 km and 0.5 km respectively. The sediments V
S varies from 0.1 to 1.0 km/s with a step of 0.1 km/s, V
P is always setting to 2.1 km/s and the density is 2.0 g/cm3.
Table S3 presents the parameters for each layer of the presupposed models, and the velocity structures are illustrated in
Figure 11a and
Figure 12a.
5.2. Influences of the Sedimentary layer with different VS on RFs and H-k Stacking Inversion
Using the same routines of synthetic tests in sections 3.2 and 3.3, we employ models with parameters shown in
Table S3 to calculate the synthetic seismograms for extracting theoretical RFs. Then, these RFs will be used to test H-k stacking method and RF waveform inversion.
Figure 11 and
Figure 12 show the theoretical seismogram and RFs computed from models with different V
S of the sedimentary layer for both normal and thick oceanic crust thicknesses (6 km and 10 km thick, respectively). Similar to
Figure 6 and
Figure 7, the sedimentary layer leads to the waveform overlap among converted multiple phases. When the V
S decreases, arrival times of the main converted phases of RFs are delayed, causing a significant deviation between the H-k stacking results and the presupposed models (see detailed information in
Table 2). In general, no matter how the V
S changes, the H-k stacking results of Moho depth and crustal V
P/V
S ratio are not ideal, which are quite different from presupposed values.
5.3. Influence of the Sedimentary Layer Different Vs on RF Waveform Inversion
To further analyze the impact of V
S variations of the sedimentary layer on RF waveform inversion and to verify the effectiveness of waveform inversion, we adopted the NA to estimate the model parameters by using the RFs obtained under different V
S of the sedimentary layer. In presupposed models, the thicknesses of the oceanic crust are 6 km and 10 km, the seawater layer is 5 km thick, and the sedimentary layer is 0.5 km thick, with its V
S varying from 0.1 km/s to 1.0 km/s.
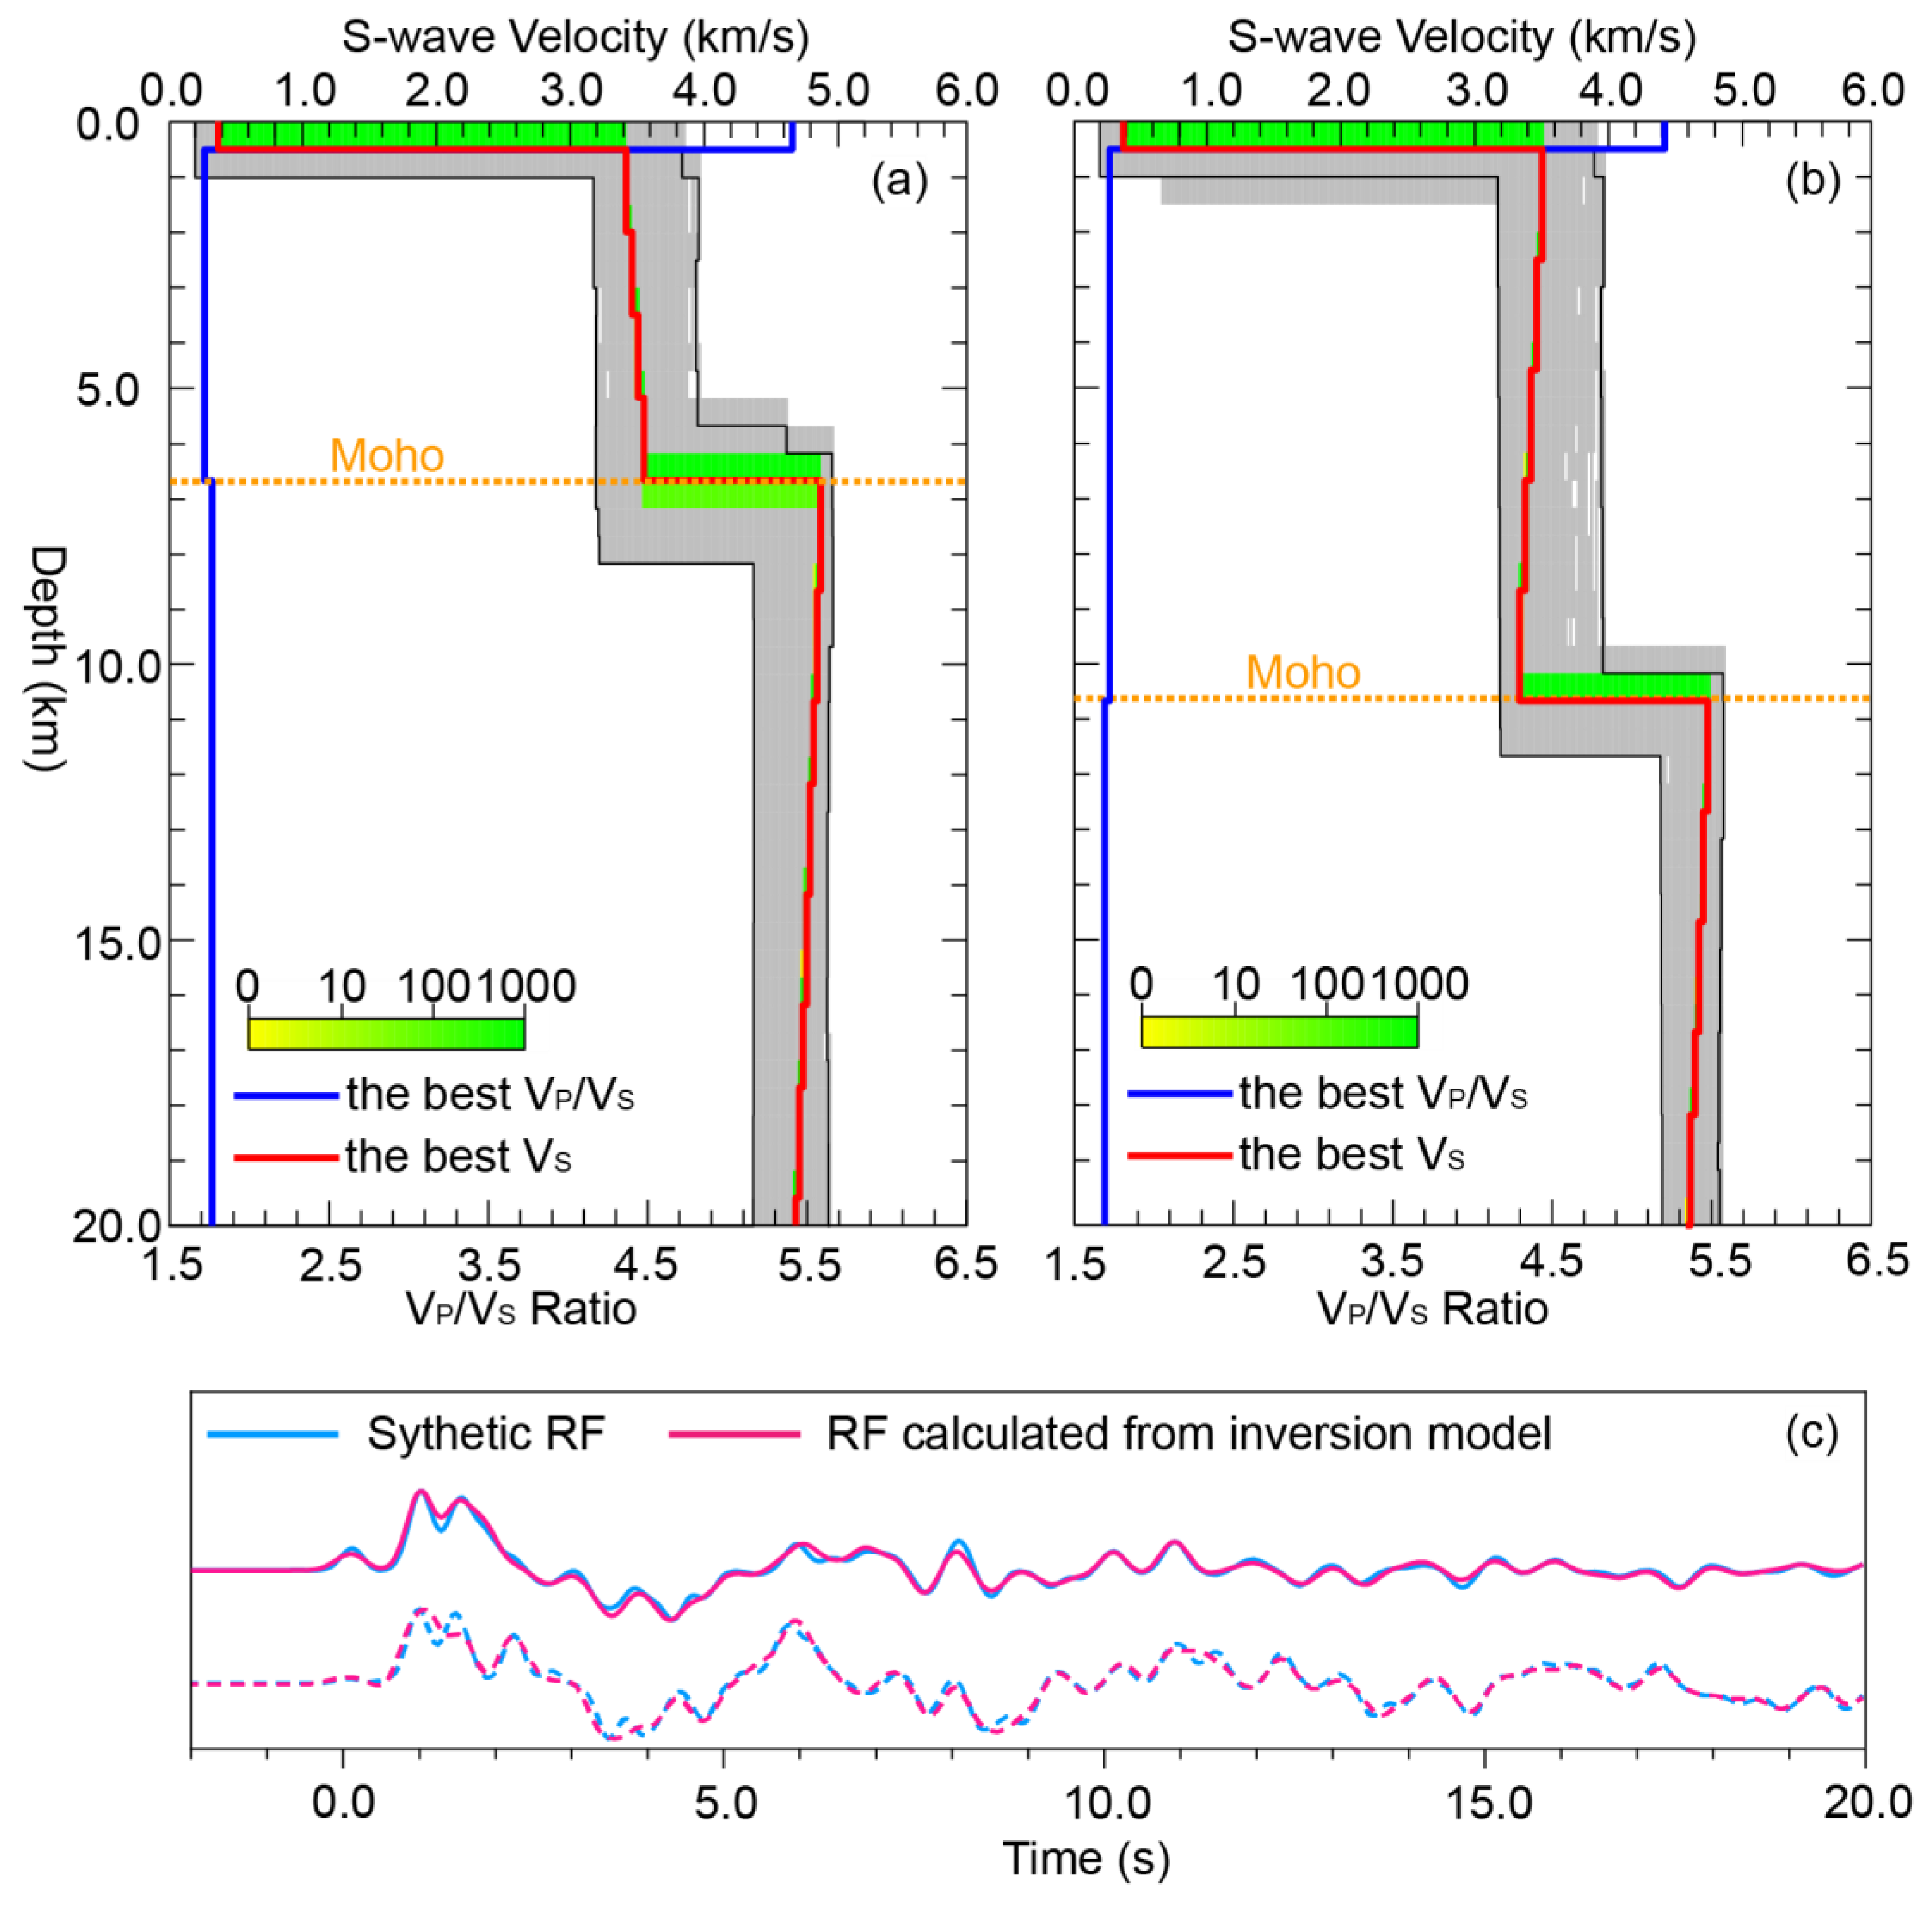
Figure 13 shows the inversion results of normal and thick oceanic crust models (6 km and 10 km, respectively), in which the V
S of the sedimentary layer is 0.6 km/s. It is shown that the inversion results are aligned with that of the presupposed models, and the RF waveform fittings are also acceptable. These simulations indicate that changes in the V
S of the sedimentary layer have no significant impact on the RFs inversion when the NA algorithm is used.
6. Conclusions
This paper focuses on some issues in applying the RF method to passive seismic observation data of OBS. Numerical tests are performed to estimate the influences of seawater multiple reflections and the sedimentary layer on the RFs. Two post-processing methods (H-k stacking and the NA) are used to invert the Moho depth, average crustal VP/VS ratio and VS structure beneath the station. The main conclusions are as following:
(1) Seawater multiple reflections would break the equivalent source assumption of the vertical component, but the deconvolution of the radial and vertical components helps to reduce the influences caused by seawater multiples. This is because the polarization waves on the radial component are closely correlated with multiple reflections on the vertical component. As a result, the negative effect of seawater multiple reflections on RFs can be significantly eliminated or almost negligible through deconvolution. Consequently, the H-k stacking method and the non-linear algorithm (e.g., NA) can be adopted to estimate accurate Moho depth, average crustal VP/VS ratio and VS of crust-upper mantle structure.
(2) The sedimentary layer significantly impacts synthetic seismograms, and the dispersion effects of seismic wave propagation in sediments would cause challenges in extracting RFs from OBS recordings. The first arrival and multiple reflections of Moho are weakened, and it is difficult to identify them with vast variations of their waveforms. These changes lead to significant uncertainties in estimating the Moho depth and the crustal average VP/VS ratio when using the H-k stacking method.
(3) The waveform-related inversion methods (e.g., NA) can be effectively applied to OBS RFs to obtain the VS structures from crust to upper mantle beneath the station whenever the sedimentary layer varies in thickness and velocity.
Supplementary Materials
The following supporting information can be downloaded at the website of this paper posted on Preprints.org, Table S1: Parameters of seawater-crust-mantle models for synthetic OBS RFs; Table S2: Parameters of seawater-sediments-crust-mantle models for synthetic OBS RFs; Table S3: Parameters of seawater-sediments-crust-mantle models with different Vs for synthetic OBS RFs.
Author Contributions
Conceptualization, W.G., A.G., X.W.; methodology, W.G. and H.H.; validation, W.G.; formal analysis, W.G., H.H., investigation, W.G.; writing—original draft preparation, W.G. and H.H.; writing—review and editing, W.G., A.G., H.H., X.N., X.W., W.W. and Y.T.; visualization, W.G.; supervision, A.G., H.H., and Y.T. All authors have read and agreed to the published version of the manuscript.
Funding
This work was supported by the National Key R&D Program of China (2023YFC2808803, 2023YFE0126100) and the National Natural Science Foundation of China (42076047, 42376052 and 42106068).
Institutional Review Board Statement
Not applicable.
Data Availability Statement
Data will be made available on request.
Acknowledgments
Forward modelling and calculating the receiver functions use the Computer Programs in Seismology (CPS330; [
35]). Performing H-k stacking uses the codes provided by Lupei Zhu [
8]. NA sampler program [
18,
19,
20] is used to invert the 1-D Vs structure. Some figures in this study were plotted by Generic Mapping Tools (GMT; [
36]).
Conflicts of Interest
The authors declare no conflicts of interest.
References
- Ruan, A. Ocean Bottom Seismic Theory and Application; Science Press: Beijing, 2020. [Google Scholar]
- Hu, H.; Ruan, A.G.; You, Q.Y.; Li, J.B. Using OBS teleseismic receiver funtions to invert lithospheric structure——A case study of the southwestern subbasin in the South China Sea. Chinese Journal of Geophysics 2016, 59, 1426–1434. [Google Scholar]
- Huang, H.; Qiu, X.; Zhang, J.; Hao, T. Low-velocity layers in the northwestern margin of the South China Sea: Evidence from receiver functions of ocean-bottom seismometer data. J. Asian Earth Sci. 2019, 186, 104090. [Google Scholar] [CrossRef]
- Hung, T.D.; Yang, T.; Le, B.M.; Yu, Y.; Xue, M.; Liu, B.; Liu, C.; Wang, J.; Pan, M.; et al. Crustal Structure Across the Extinct Mid-Ocean Ridge in South China Sea from OBS Receiver Functions: Insights Into the Spreading Rate and Magma Supply Prior to the Ridge Cessation. Geophys. Res. Lett. 2021, 48, 10–1029. [Google Scholar] [CrossRef]
- Ruan, A.; Hu, H.; Li, J.; Niu, X.; Wei, X.; Zhang, J.; Wang, A. Crustal structure and mantle transition zone thickness beneath a hydrothermal vent at the ultra-slow spreading Southwest Indian Ridge (49°39′E): a supplementary study based on passive seismic receiver functions. Mar. Geophys. Res. 2017, 38, 39–46. [Google Scholar] [CrossRef]
- Clayton, R.W.; Wiggins, R.A. Source shape estimation and deconvolution of teleseismic bodywaves. Geophysical Journal of the Royal Astronomical Society 1976, 47, 151–177. [Google Scholar] [CrossRef]
- Ligorría, J.P.; Ammon, C.J. Iterative deconvolution and receiver-function estimation. Bull. Seismol. Soc. Amer. 1999, 89, 1395–1400. [Google Scholar] [CrossRef]
- Zhu, L.P.; Kanamori, H. Moho depth variation in southern California. Journal of Geophysical Research 2000, 105, 2969–2980. [Google Scholar] [CrossRef]
- Zhu, L.P. Crustal structure across the San Andreas Fault, southern California from teleseismic converted waves. Earth Planet. Sci. Lett. 2000, 179, 183–190. [Google Scholar] [CrossRef]
- Ammon, C.J.; Randall, G.E.; Zandt, G. On the nonuniqueness of receiver function inversions. Journal of Geophysical Research: Solid Earth 1990, 95, 15303–15318. [Google Scholar] [CrossRef]
- Bertsimas, D.; Tsitsiklis, J. Simulated Annealing. Stat. Sci. 1993, 8, 10–15. [Google Scholar] [CrossRef]
- Holland, J.H. Genetic algorithms. Scholarpedia 2012, 7, 1482. [Google Scholar] [CrossRef]
- Zhang, J.; Li, J.; Ruan, A.; Ding, W.; Niu, X.; Wang, W.; Tan, P.; Wu, Z.; Yu, Z.; et al. Seismic Structure of a Postspreading Seamount Emplaced on the Fossil Spreading Center in the Southwest Subbasin of the South China Sea. JGR Solid Earth 2020, 125, 10–1029. [Google Scholar] [CrossRef]
- Zhao, M.; Qiu, X.; Li, J.; Sauter, D.; Ruan, A.; Chen, J.; Cannat, M.; Singh, S.; Zhang, J.; et al. Three-dimensional seismic structure of the Dragon Flag oceanic core complex at the ultraslow spreading Southwest Indian Ridge (49°39′E). Geochemistry, Geophysics, Geosystems 2013, 14, 4544–4563. [Google Scholar] [CrossRef]
- Ciazela, J.; Koepke, J.; Dick, H.J.B.; Botcharnikov, R.; Muszynski, A.; Lazarov, M.; Schuth, S.; Pieterek, B.; Kuhn, T. Sulfide enrichment at an oceanic crust-mantle transition zone: Kane Megamullion (23°N, MAR). Geochim. Cosmochim. Acta 2018, 230, 155–189. [Google Scholar] [CrossRef]
- Herman, J.; Muentener, O.; Guenther, D. ; Anonymous Differentiation of mafic magma in a continental crust-to-mantle transition zone. J. Petrol. 2001, 42, 189–206. [Google Scholar] [CrossRef]
- Zanon, V.; Silva, R.; Goulart, C. The crust-mantle transition beneath the Azores region (central-north Atlantic Ocean). Contrib. Mineral. Petrol. 2023, 178, 50–10. [Google Scholar] [CrossRef]
- Sambridge, M. Geophysical inversion with a neighborhood algorithm—I, Searching a parameter space. Geophys. J. Int. 1999, 138, 479–494. [Google Scholar] [CrossRef]
- Sambridge, M. Geophysical inversion with a neighbourhood algorithmö—II. Appraising the ensemble. Geophys. J. Int. 1999, 138, 727–746. [Google Scholar] [CrossRef]
- Sambridge, M. Finding acceptable models in nonlinear inverse problems using a neighbourhood algorithm. Inverse Probl. 2001, 17, 387–403. [Google Scholar] [CrossRef]
- Audet, P. Receiver functions using OBS data: promises and limitations from numerical modelling and examples from the Cascadia Initiative. Geophys. J. Int. 2016, 205, 1740–1755. [Google Scholar] [CrossRef]
- Akuhara, T.; Mochizuki, K.; Kawakatsu, H.; Takeuchi, N. Non-linear waveform analysis for water-layer response and its application to high-frequency receiver function analysis using OBS array. Geophys. J. Int. 2016, 206, 1914–1920. [Google Scholar] [CrossRef]
- Yang, T.; Xu, Y.; Du, N.; Xu, T.; Cao, D.; Nan, F.; Chu, W.; Liang, C.; Hao, T. Gravity inversion constrained by OBS receiver function reveals crustal structure in Ryukyu Trench. Front. Earth Sci. 2023, 11, 10–3389. [Google Scholar] [CrossRef]
- Haskell, N.A. The dispersion of surface waves on multilayered media*. Bull. Seismol. Soc. Amer. 1953, 43, 17–34. [Google Scholar] [CrossRef]
- Herrmann, R.B. SH-wave generation by dislocation sources—A numerical study. Bull. Seismol. Soc. Amer. 1979, 69, 1–15. [Google Scholar] [CrossRef]
- Wang, C.Y.; Herrmann, R.B. A numerical study of P-, SV-, and SH-wave generation in a plane layered medium. Bull. Seismol. Soc. Amer. 1980, 70, 1015–1036. [Google Scholar] [CrossRef]
- Aki, K.; Richards, P.G. Quantitative seismology., 2nd ed.; University Science Books: New York, 2009. [Google Scholar]
- Kennet, B.L.N. Seismic wave propagation in stratified media; ANU Press: Canberra, 2009. [Google Scholar]
- Langston, C.A. Structure under Mount Rainier, Washington, inferred from teleseismic body waves. Journal of Geophysical Research: Solid Earth 1979, 84, 4749–4762. [Google Scholar] [CrossRef]
- Bishop, C.M. Neural networks and their applications. Rev. Sci. Instrum. 1994, 65, 1803–1832. [Google Scholar] [CrossRef]
- Chen, Y.J. Oceanic crustal thickness versus spreading rate. Geophys. Res. Lett. 1992, 19, 753–756. [Google Scholar] [CrossRef]
- Christeson, G.L.; Goff, J.A.; Reece, R.S. Synthesis of Oceanic Crustal Structure From Two-Dimensional Seismic Profiles. Rev. Geophys. 2019, 57, 504–529. [Google Scholar] [CrossRef]
- Hu, H.; Zhao, D.; Lin, J.; Pilia, S. A Slab Window Beneath North Sumatra Revealed by P-Wave Mantle Tomography. JGR Solid Earth 2023, 128, 10–1029. [Google Scholar] [CrossRef]
- Niu, X.; Ruan, A.; Li, J.; Minshull, T.A.; Sauter, D.; Wu, Z.; Qiu, X.; Zhao, M.; Chen, Y.J.; et al. Along-axis variation in crustal thickness at the ultraslow spreading Southwest Indian Ridge (50°E) from a wide-angle seismic experiment. Geochem. Geophys. Geosyst. 2015, 16, 468–485. [Google Scholar] [CrossRef]
- Herrmann, R.B. Computer Programs in Seismology: An Evolving Tool for Instruction and Research. Seismol. Res. Lett. 2013, 84, 1081–1088. [Google Scholar] [CrossRef]
- Wessel, P.; Luis, J.F.; Uieda, L.; Scharroo, R.; Wobbe, F.; Smith, W.H.F.; Tian, D. The Generic Mapping Tools Version 6. Geochem. Geophys. Geosyst. 2019, 20, 5556–5564. [Google Scholar] [CrossRef]
|
Disclaimer/Publisher’s Note: The statements, opinions and data contained in all publications are solely those of the individual author(s) and contributor(s) and not of MDPI and/or the editor(s). MDPI and/or the editor(s) disclaim responsibility for any injury to people or property resulting from any ideas, methods, instructions or products referred to in the content. |
© 2024 by the authors. Licensee MDPI, Basel, Switzerland. This article is an open access article distributed under the terms and conditions of the Creative Commons Attribution (CC BY) license (http://creativecommons.org/licenses/by/4.0/).
