Submitted:
30 September 2024
Posted:
01 October 2024
You are already at the latest version
Abstract
Keywords:
1. Introduction
2. Materials and Methods
2.1. Dataset Description


2.2. Signal Preprocessing
2.2.1. Standardization for Signal Normalization
2.2.2. Noise Reduction Using Moving Average Filters
2.3. Feature Extraction and Windowing Techniques
- is the Fourier Transform of ,
- f is the frequency in hertz,
- t is time,
- j is the imaginary unit.
- N is the total number of samples,
- is the signal value at sample n,
- represents the frequency component at frequency k.
2.4. 1D-CNN Model Architecture
- Three convolutional layers with filter sizes of 32, 64, and 64 respectively, and a kernel size of 3. Each convolutional layer is followed by a max pooling layer with a pool size of 2 to reduce the spatial dimensions of the data.
- Flattening layer, which transforms the 1D convoluted data into a flat vector for the fully connected layers.
- Two dense layers: the first dense layer has 64 units, followed by another dense layer with 32 units, both using the ReLU activation function.
- Dropout layer (with a dropout rate of 0.5) is added after the first dense layer to prevent overfitting by randomly deactivating neurons during training.
- The final output layer uses a softmax activation function to predict the probability of each class, with 5 output units corresponding to the five heartbeat categories.
| Parameter | Value |
|---|---|
| Pooling Type | Max Pooling |
| Pooling Size | 2 |
| Units in First Dense Layer | 64 |
| Units in Second Dense Layer | 32 |
| Activation Function | ReLU |
| Dropout Rate | 0.5 |
| Output Layer Activation | Softmax |
| Number of Output Units | 5 |
| Optimizer | Adam |
3. Results
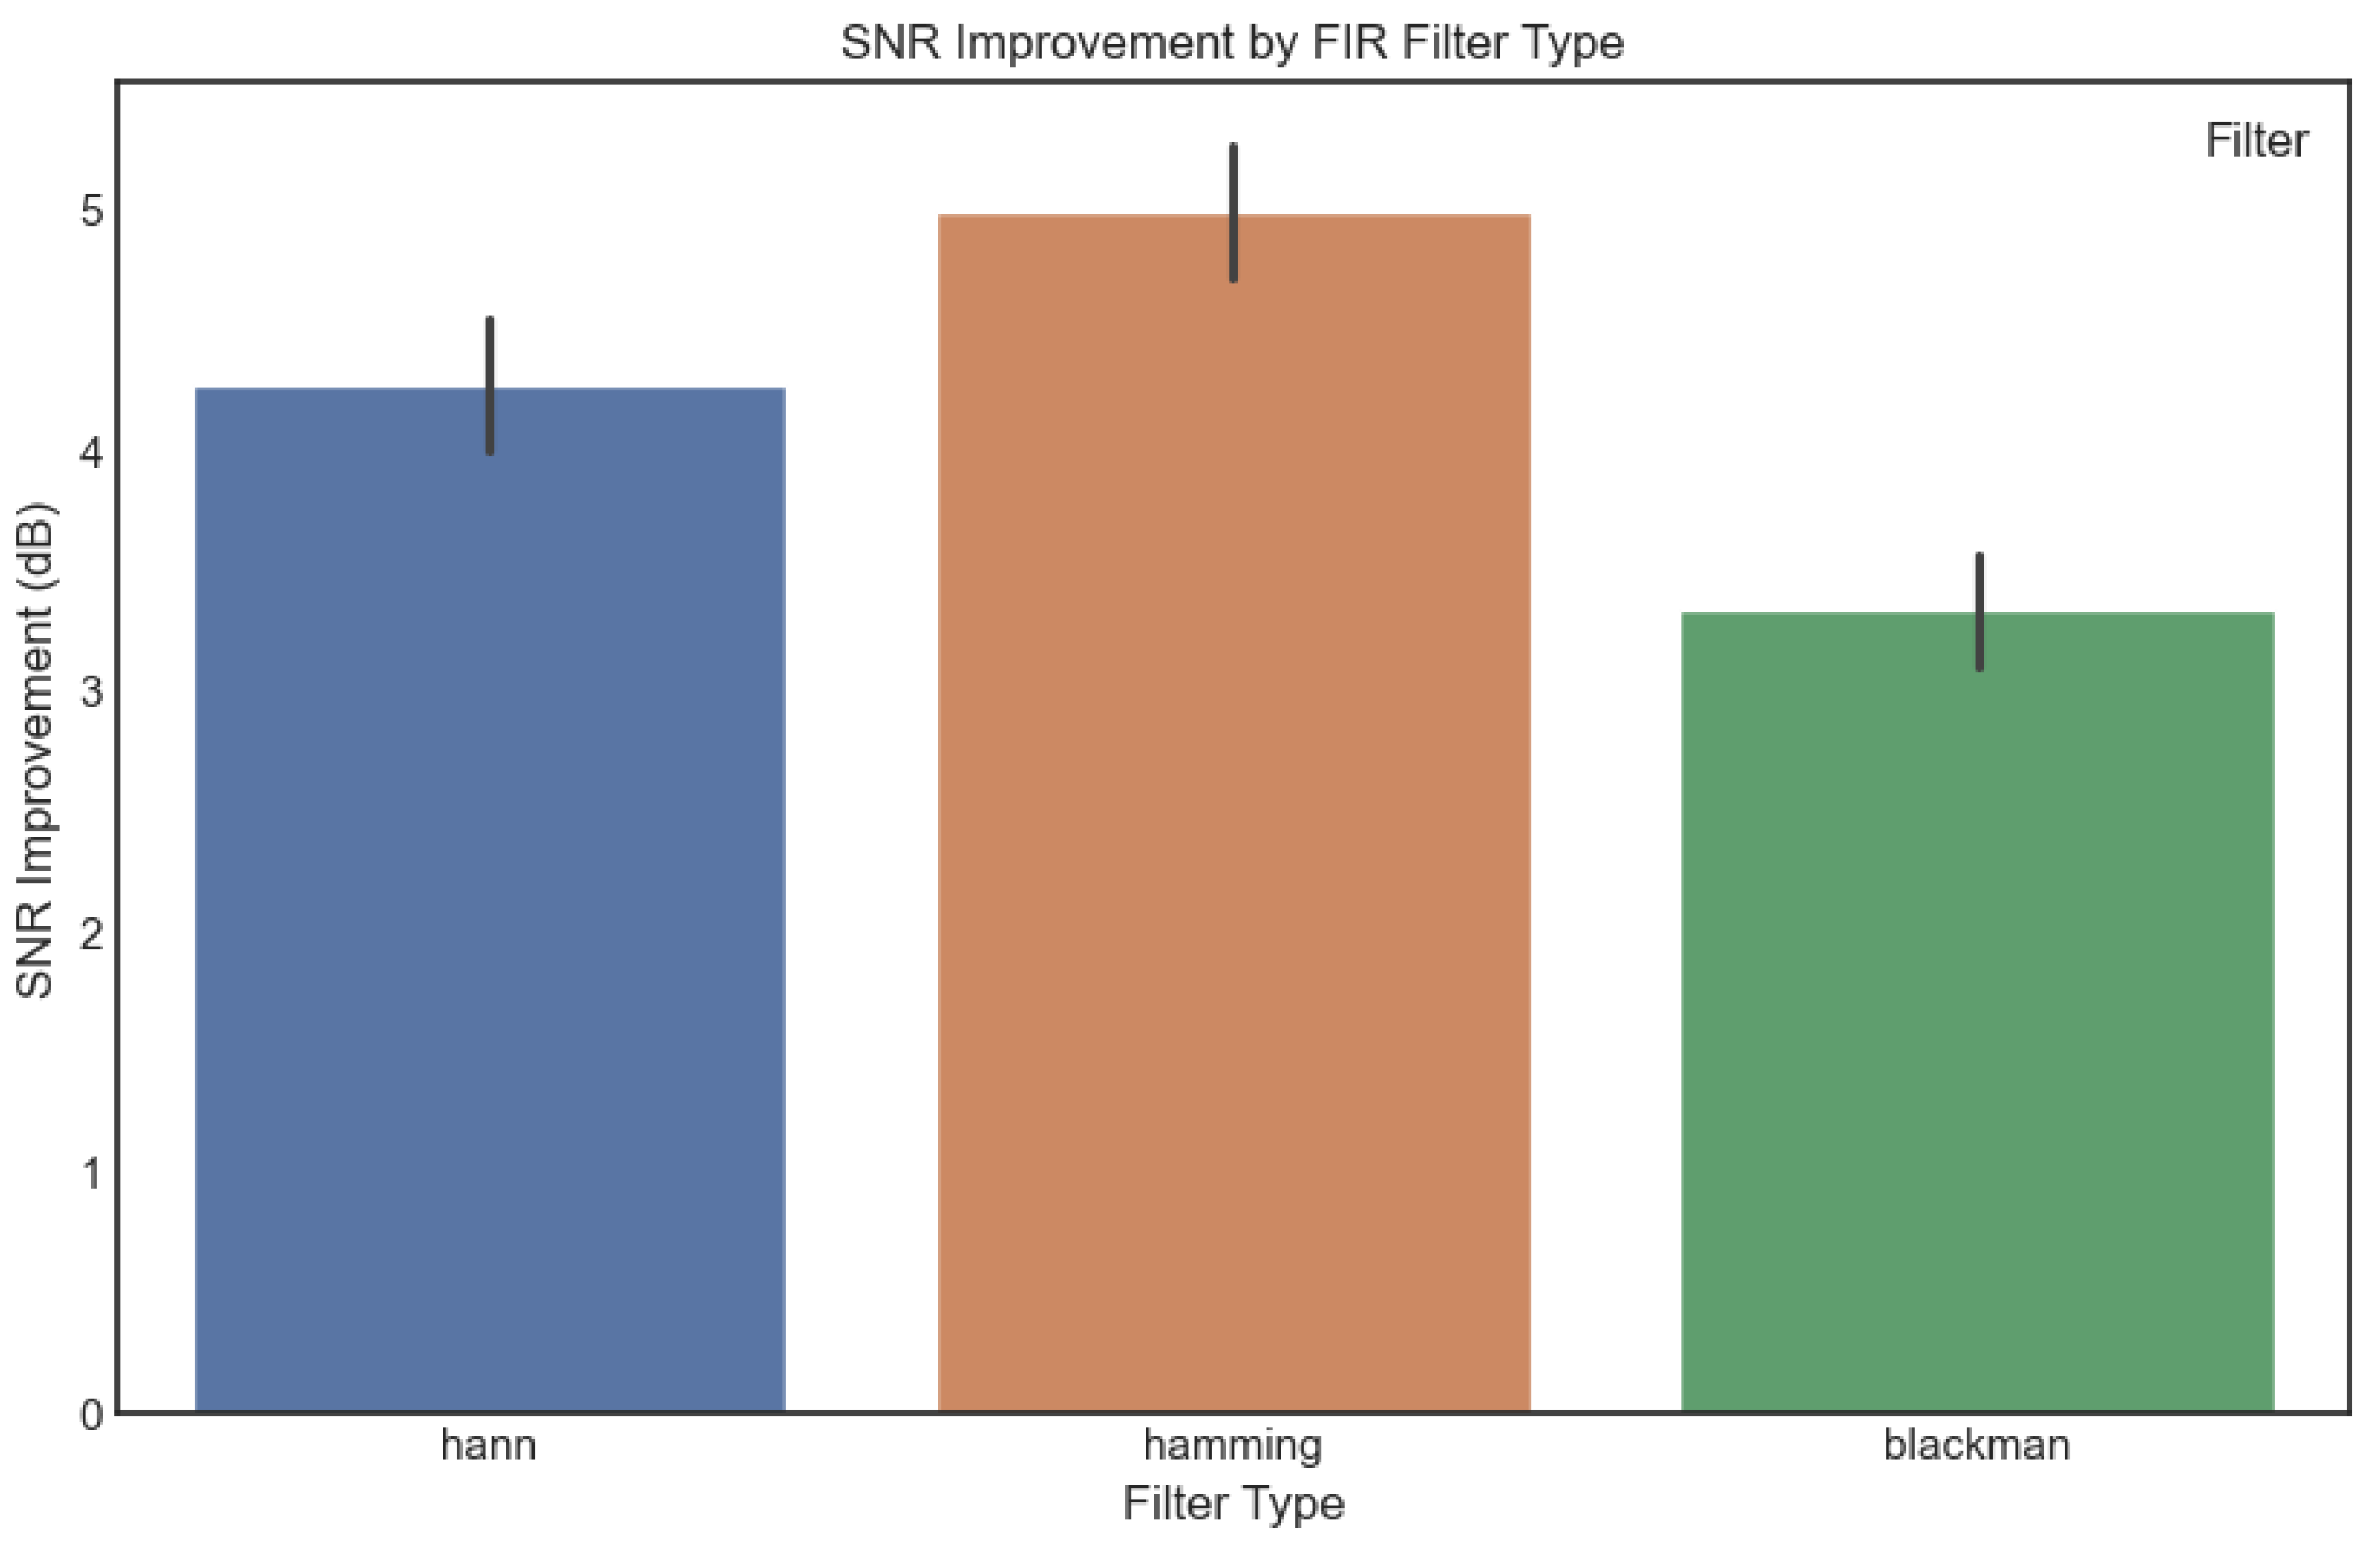
3.1. Effectiveness of FIR Window Functions in Signal Preprocessing
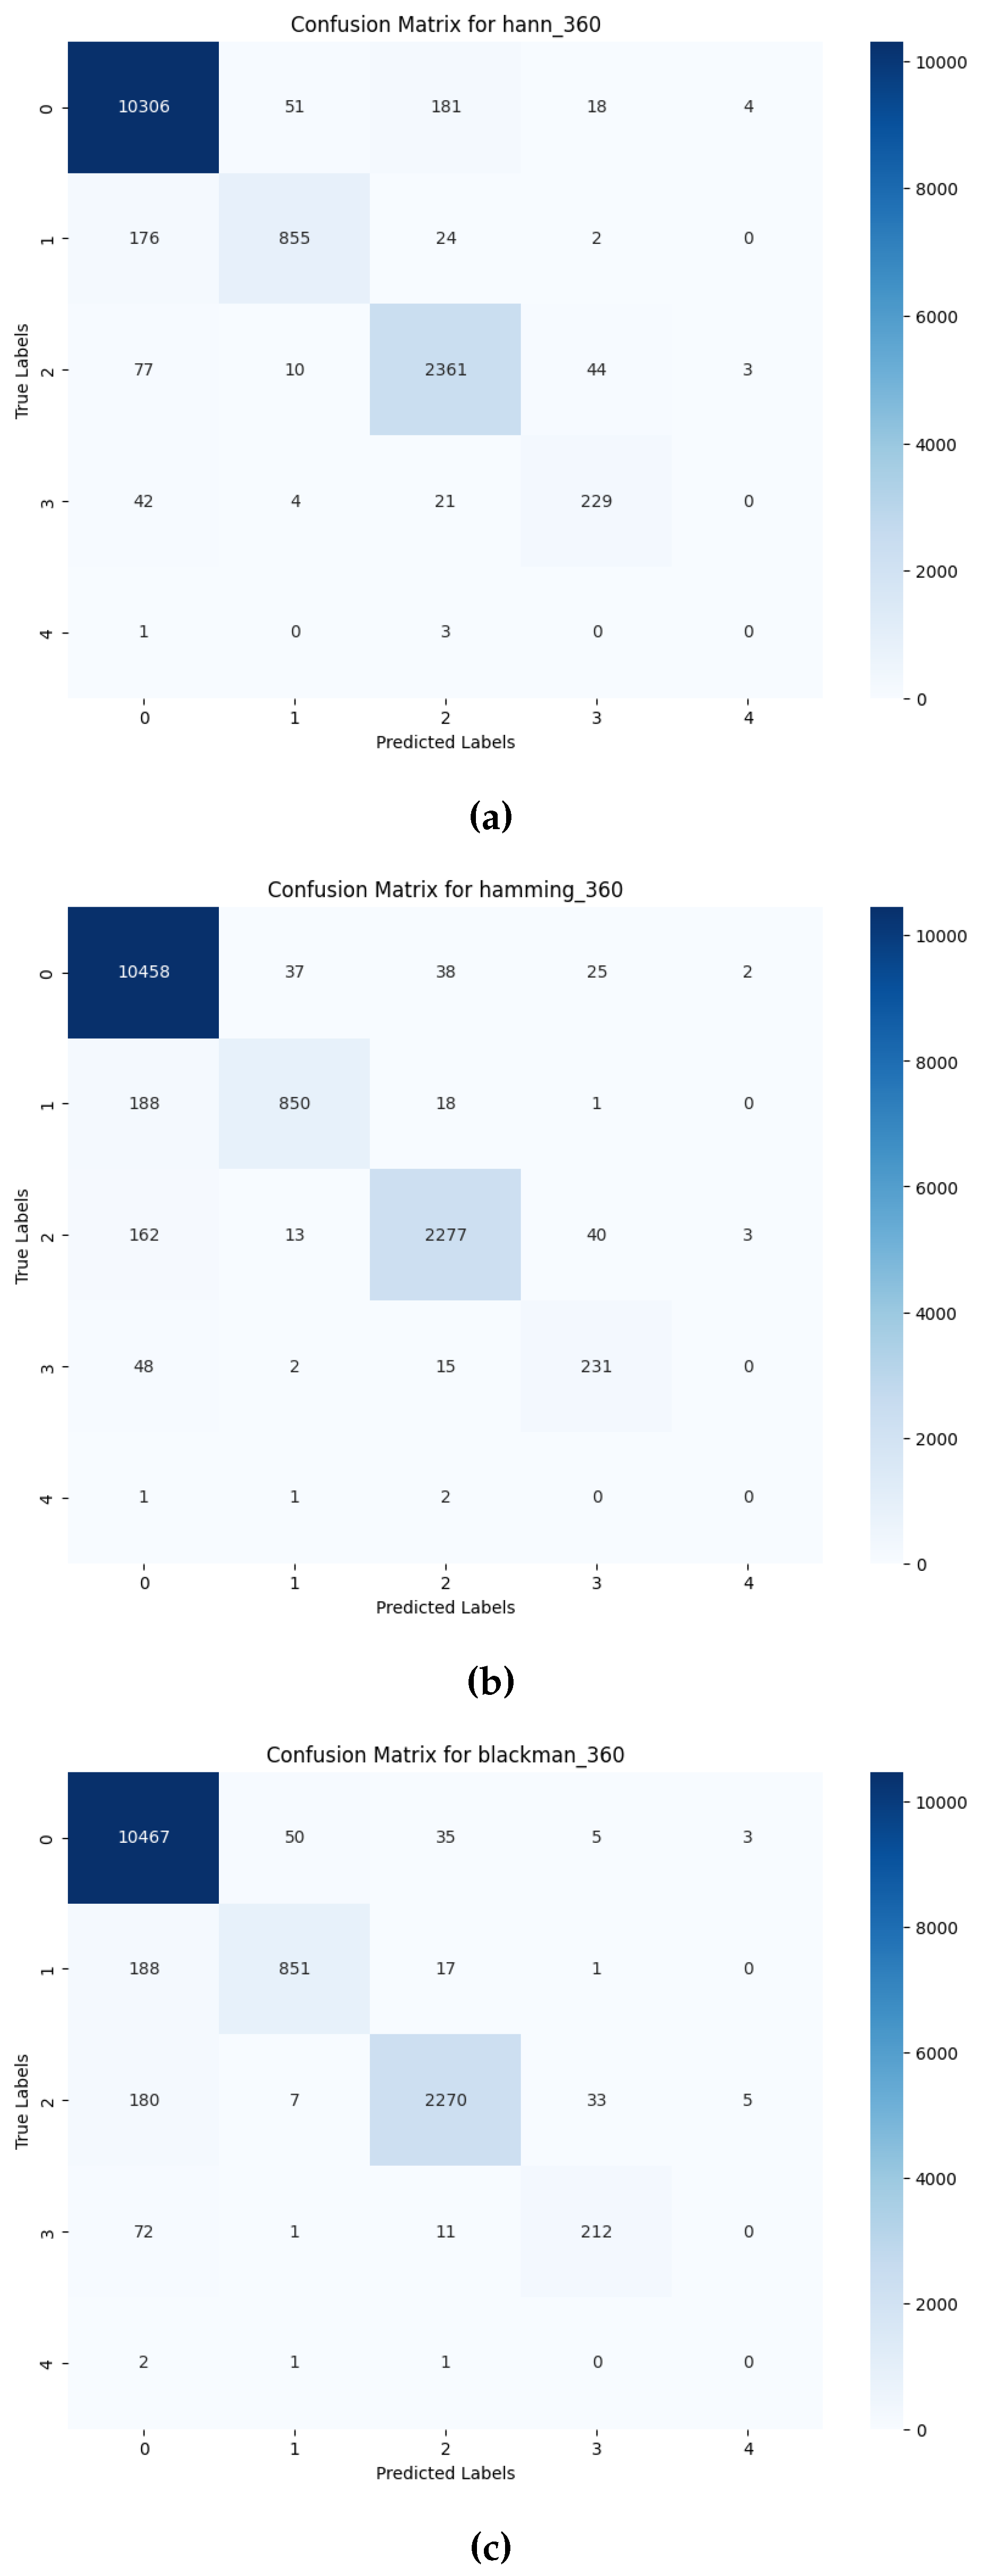
3.2. Performance of Deep Learning Models on Preprocessed Signals
- Precision: The ratio of correctly predicted positive observations to the total predicted positive observations.where is the number of true positives, and is the number of false positives.
- Recall: The ratio of correctly predicted positive observations to all observations in the actual class.where is the number of false negatives.
- F1-Score: The harmonic mean of Precision and Recall, providing a balance between the two.

4. Conclusion
4.1. Deep Learning Enhancements
4.2. Implications
4.3. Limitations and Future Work
Author Contributions
Funding
Informed Consent Statement
Conflicts of Interest
References
- Antzelevitch, C.; Burashnikov, A. Overview of Basic Mechanisms of Cardiac Arrhythmia, 2011. [CrossRef]
- Varalakshmi, P.; Sankaran, A.P. An improved hybrid AI model for prediction of arrhythmia using ECG signals. Biomedical Signal Processing and Control 2023, 80. [Google Scholar] [CrossRef]
- Xiao, Q.; Lee, K.; Mokhtar, S.A.; Ismail, I.; bin Md Pauzi, A.L.; Zhang, Q.; Lim, P.Y. Deep Learning-Based ECG Arrhythmia Classification: A Systematic Review, 2023. [CrossRef]
- Ahmed, A.A.; Ali, W.; Abdullah, T.A.; Malebary, S.J. Classifying Cardiac Arrhythmia from ECG Signal Using 1D CNN Deep Learning Model. Mathematics 2023, 11. [Google Scholar] [CrossRef]
- Eleyan, A.; Alboghbaish, E. Multi-Classifier Deep Learning based System for ECG Classification Using Fourier Transform. Institute of Electrical and Electronics Engineers Inc., 2023. [CrossRef]
- Ullah, H.; Heyat, M.B.B.; Akhtar, F.; Sumbul.; Muaad, A.Y.; Islam, M.S.; Abbas, Z.; Pan, T.; Gao, M.; Lin, Y.; Lai, D. An End-to-End Cardiac Arrhythmia Recognition Method with an Effective DenseNet Model on Imbalanced Datasets Using ECG Signal. Computational Intelligence and Neuroscience 2022, 2022. [CrossRef]
- Zhang, H.; Liu, C.; Zhang, Z.; Xing, Y.; Liu, X.; Dong, R.; He, Y.; Xia, L.; Liu, F. Recurrence Plot-Based Approach for Cardiac Arrhythmia Classification Using Inception-ResNet-v2. Frontiers in Physiology 2021, 12. [Google Scholar] [CrossRef] [PubMed]
- Yeh, Y.C.; Chiou, C.W.; Lin, H.J. Analyzing ECG for cardiac arrhythmia using cluster analysis. Expert Systems with Applications 2012, 39, 1000–1010. [Google Scholar] [CrossRef]
- Dhyani, S.; Kumar, A.; Choudhury, S. Analysis of ECG-based arrhythmia detection system using machine learning. MethodsX 2023, 10. [Google Scholar] [CrossRef] [PubMed]
- Śmigiel, S.; Pałczyński, K.; Ledziński, D. ECG signal classification using deep learning techniques based on the PTB-XL dataset. Entropy 2021, 23. [Google Scholar] [CrossRef] [PubMed]
- Ansari, Y.; Mourad, O.; Qaraqe, K.; Serpedin, E. Deep learning for ECG Arrhythmia detection and classification: an overview of progress for period 2017–2023, 2023. [CrossRef]
- Aziz, S.; Ahmed, S.; Alouini, M.S. ECG-based machine-learning algorithms for heartbeat classification. Scientific Reports 2021, 11. [Google Scholar] [CrossRef] [PubMed]
- Biran, A.; Jeremic, A. ECG based Human Identification using Short Time Fourier Transform and Histograms of Fiducial QRS Features. SciTePress, 2020, pp. 324–329. [CrossRef]
- Kumar, M.A.; Chakrapani, A. Classification of ECG signal using FFT based improved Alexnet classifier. PLoS ONE 2022, 17. [Google Scholar] [CrossRef] [PubMed]
- Moody, G.B.; Mark, R.G. MIT-BIH Arrhythmia Database, 1992. [CrossRef]
- Yang, M.; Liu, W.; Zhang, H. A robust multiple heartbeats classification with weight-based loss based on convolutional neural network and bidirectional long short-term memory. Frontiers in Physiology 2022, 13. [Google Scholar] [CrossRef] [PubMed]
- Bracewell, R.N.; Bracewell, R.N. The Fourier transform and its applications; Vol. 31999, McGraw-Hill New York, 1986.
- Oppenheim, A.V. Discrete-time signal processing; Pearson Education India, 1999.
- Podder, P.; Khan, T.Z.; Khan, M.H.; Rahman, M.M. Comparative Performance Analysis of Hamming, Hanning and Blackman Window, 2014.
- Kaur, M.; Kaur, S.P. High Frequency Noise Removal From Electrocardiogram Using Fir Low Pass Filter Bassed On Window Technique 2018. 8, 27–32.
- Kiranyaz, S.; Avci, O.; Abdeljaber, O.; Ince, T.; Gabbouj, M.; Inman, D.J. 1D convolutional neural networks and applications: A survey. Mechanical Systems and Signal Processing 2021, 151, 107398. [Google Scholar] [CrossRef]
- Czanner, G.; Sarma, S.V.; Ba, D.; Eden, U.T.; Wu, W.; Eskandar, E.; Lim, H.H.; Temereanca, S.; Suzuki, W.A.; Brown, E.N. Measuring the signal-to-noise ratio of a neuron. Proceedings of the National Academy of Sciences of the United States of America 2015, 112, 7141–7146. [Google Scholar] [CrossRef] [PubMed]

| Model | Class | Precision | Recall | F1-Score |
| Hamming | F | 0.963 | 0.990 | 0.977 |
| N | 0.941 | 0.804 | 0.867 | |
| S | 0.969 | 0.913 | 0.940 | |
| V | 0.778 | 0.780 | 0.779 | |
| Q | 0.000 | 0.000 | 0.000 | |
| Hann | F | 0.972 | 0.976 | 0.974 |
| N | 0.929 | 0.809 | 0.865 | |
| S | 0.912 | 0.946 | 0.929 | |
| V | 0.782 | 0.774 | 0.778 | |
| Q | 0.000 | 0.000 | 0.000 | |
| Blackman | F | 0.959 | 0.991 | 0.975 |
| N | 0.935 | 0.805 | 0.865 | |
| S | 0.973 | 0.910 | 0.940 | |
| V | 0.845 | 0.716 | 0.775 | |
| Q | 0.000 | 0.000 | 0.000 | |
| No FIR applied | F | 0.945 | 0.944 | 0.920 |
| N | 0.922 | 0.802 | 0.830 | |
| S | 0.953 | 0.897 | 0.933 | |
| V | 0.785 | 0.710 | 0.725 | |
| Q | 0.000 | 0.000 | 0.000 |
Disclaimer/Publisher’s Note: The statements, opinions and data contained in all publications are solely those of the individual author(s) and contributor(s) and not of MDPI and/or the editor(s). MDPI and/or the editor(s) disclaim responsibility for any injury to people or property resulting from any ideas, methods, instructions or products referred to in the content. |
© 2024 by the authors. Licensee MDPI, Basel, Switzerland. This article is an open access article distributed under the terms and conditions of the Creative Commons Attribution (CC BY) license (http://creativecommons.org/licenses/by/4.0/).


