1. Introduction
Strawberry tree (
Arbutus unedo) is one of 122 different species from the genus Arbutus, most common in America continent and in the Mediterranean region [
1]. In the Americas, species include
Arbutus arizonica,
A. madrensis,
A. menziesii,
A. occidentalis,
A. tessellata, and
A. xalapensis. Mediterranean species include
A. unedo, A. andrachne, A. pavarii, and
A. canariensis, along with two hybrids:
Arbutus × andrachnoides (
A. unedo × A. andrachne) and
Arbutus × androsterilis (
A. unedo × A. canariensis)[
1]. Strawberry tree is distributed around the Mediterranean, found in western, central, and southern Europe, northeastern Africa, the Canary Islands, and western Asia particularly in Portugal, Spain, France, Italy, Albania, Greece, and parts of the former Yugoslavia, as well as some Mediterranean islands [
1]. In Portugal these species has a significant importance since the country is the largest world producer of this fruit [
2]. With the increased production of these fruits, several wastes are available, one of which is bark. The bark of this tree is grey or red-brownish and it fissures and peels off in small flakes [
3]. It was formerly used in tanning due to the high amount of tannins [
4] but it is not used anymore.
There is not much information about the chemical composition of
Arbutus unedo bark, but it is probably similar to the bark of other species of the same genus. In accordance to Dönmez [
5] the bark of
Arbutus andrachne, tree from the same genus as
Arbutus unedo, yielded 0.3% hexane extract, 10.1% acetone/water, and 22.4% water extractives. Fatty acids and sterols were the primary components in the lipophilic extractive samples, fatty acids made up 32.03%, with palmitic acid being the most abundant. Sitosterol was the only phytosterol detected. Two phenolic compounds, 3,4-dihydroxybenzoic acid and catechin, were also identified. Additionally, some mono- and disaccharide sugars, along with their alcohol derivatives, were detected [
5] In this study the total amount of suberin monomers was 11.36 mg/g in
A. andrachne which corresponds to about 1.1 % [
5]. Another study with
Arbutus xalapensis determined the water extract (10.7%) of which 5.7% were condensed tannins [
6]
Bark liquefaction using polyalcohols is an emerging process in the valorization of biomass, specifically woody by-products, such as tree bark [
7,
8,
9]. As a renewable and underutilized resource, bark contains a variety of organic compounds, including lignin, cellulose, hemicellulose and in some cases suberin which can be chemically transformed into valuable products. Liquefaction is a thermochemical process that involves breaking down the complex structures of lignocellulosic materials under moderate heat and pressure conditions, using polyalcohols (e.g., glycerol, ethylene glycol) as solvents or reagents. These polyalcohols act as reactive agents that promote depolymerization and facilitate the conversion of lignocellulosic biopolymers into liquid intermediates. The resulting bio-based liquids have applications in multiple industries, including adhesives [
10,
11] resins [
12], and polyurethane foams [
13,
14], replacing or complementing petroleum-derived chemicals. This approach supports sustainability goals by converting lignocellulosic waste into high-value products, reducing dependency on fossil fuels, and enhancing the economic potential of forest-based industries. Mainly two types of catalysts are used, acid and basic. Acid catalysts are the most used because they help in the hydrolysis of the complex structures of lignin, cellulose, and hemicellulose in bark or other lignocellulosic materials. Sulfuric acid is probably the most used acid catalyst, but different acids have been used as for instance p-Toluenesulfonic acid for the liquefaction of
E. globulus bark [
7] or acetic, lactic and citric acids to liquefy Kraft lignin [
15]. Basic catalysts like sodium hydroxide have also been used, especially in cork rich barks like
Quercus suber [
16,
17] or
Pseudotsuga menziesii [
18].
Foams produced from liquefied wood and bark represent an innovative and sustainable alternative to conventional petroleum-based foams, such as polyurethane. By combining these liquefied components with isocyanate and suitable catalysts and blowing agents, lightweight foams can be produced for applications in packaging, insulation, and cushioning [
19,
20,
21]. Liquefied lignocellulosic materials only substitute the petroleum-based polyol but some attempts have been made in order to substitute isocyanate by a less toxic chemical in the so called non-isocyanate polyurethanes (NIPUs) [
22,
23,
24].
In this work the chemical composition of the internal and external barks of A. Unedo was determined and its influence on the liquefaction process and on the resulting polyurethane foams was studied.
2. Materials and Methods
The reagents used for polyol synthesis included glycerol (Sigma-Aldrich, USA, ≥99.5%), ethylene glycol (≥99.8%, Sigma-Aldrich, USA), sulfuric acid (analytical grade), methanol (A.C.S. grade, ≥99.8%), ethanol (analytical grade, absolute, Fisher Chemical >99.8%), and ultrapure water. For foam production, di-n-butyltin dilaurate (95%) was used as catalysts, along with the surfactant Tegostab B8404®, isocyanate MDI Voranate M229® (average functionality of 2.7, %NCO 31.1%), and ultrapure water.
2.1. Chemical Composition
The chemical composition of IB and EB was analyzed by determining their ash content, extractives (in dichloromethane, ethanol, and hot water), cellulose, lignin and hemicelluloses. The average composition of both samples was assessed, using a particle size fraction between 0.420 mm and 0.250 mm.
The ash content was determined by calcination the material at 525°C, following the standardized method outlined in Tappi T 211 om-93.
Extractives were quantified through Soxhlet extraction, using 3 g of each sample and 200 mL of solvent. The extraction was carried out sequentially, starting with dichloromethane (DCM), followed by ethanol and hot water, progressing from less to more polar solvents. The procedure adhered to Tappi T 204 standards for wood and pulp extractives. The extraction times were 6 hours for DCM and 16 hours for both ethanol and hot water. The content of extractives was expressed relative to the dry mass of the samples.
The determination of insoluble lignin was performed using a modified Klason method, according to TAPPI T 222 om-02. In this procedure, 350 mg of sample was treated with 3 mL of 72% sulfuric acid at 30°C for 1 hour, with stirring every 10 minutes. Subsequently, 84 mL of distilled water was added, and the mixture was transferred to 100 mL thermal glass bottles and autoclaved at 120°C for 1 hour. After cooling in an ice bath, the samples were filtered using crucibles with pore sizes of 5–15 μm, dried, and weighed. The lignin content was expressed as a percentage of the dry wood.
Cellulose content was measured following the Kürschner and Höffer procedure [
25] involving four sequential reflux treatments of grape stalks using a nitric acid and ethanol mixture (1:4, v/v) for 1 hour per treatment.
Hemicellulose content was calculated by difference.
2.2. Sample Liquefaction
Arbutus unedo L. (Strawberry Tree) Internal bark (IB) and External bark (EB) samples were oven-dried at 100 °C and finely ground to increase surface area. A 10 g portion of the dried sample was weighed and placed into a reactor. A 50:50 mixture of glycerol and ethylene glycol, along with 3% sulfuric acid (based on sample weight), was then added. The mixture completely submerged the wood sample, and the reactor was sealed to prevent leakage. Stirring at 75 rpm was initiated to ensure homogeneous mixing. The temperature was gradually raised to 180 °C and maintained for 60 minutes. Afterward, the reactor was allowed to cool to room temperature, and the liquefied product was recovered. The resulting material was dissolved in 100 mL of methanol and filtered for further use.
2.3. Foam Preparation
To prepare the foam, 4 g of neutralized and dried polyol was placed in a polypropylene container. Isocyanate was added in measured amounts using a syringe into a cylindrical container (dimensions: 60 × 120 mm). The surfactant was then introduced to control the foam bubble size and distribution. Water was added as a blowing agent to react with the isocyanate, generating carbon dioxide for foam expansion. The mixture was mixed at 2000 rpm for 1–2 minutes, ensuring uniformity. Subsequently, the catalyst (DBTDL) was introduced to speed up the reaction between polyol and isocyanate, promoting foam formation. Additional mixing followed at 2000 rpm for another 1–2 minutes, during which foam began to rise. It was allowed to expand freely under ambient conditions. Standard proportions used included 4 g polyol, 0.4 g water (10%), 0.28 g surfactant (7%), 0.24 g catalyst (6%), and 10.5 g isocyanate, with variations in water (5-20%), catalyst (3-10%), and isocyanate index (0.6-1).
2.4. Foam Testing
The prepared polyurethane foam was shaped into a cylindrical sample (approximately 60 mm in diameter and 30 mm in height) for compression testing. The sample was placed between the compression plates, and the testing parameters were configured, including a compression speed of 5 mm/min. The Universal Test Machine applied a gradual and consistent compression force to the foam, while the applied force and corresponding deformation were recorded in real-time. Compression continued until the foam underwent significant deformation, stabilizing when most of the foam was compressed.
2.5. FTIR Analysis
The foam samples were dried in an oven at 102 ± 2 °C overnight, followed by grinding in a mortar. The FTIR spectra were collected using a Perkin Elmer UATR Two FT-IR Spectrometer (Beaconsfield, UK) with a resolution of 4.0 cm⁻¹ and 72 scans recorded over the range of 4000–400 cm⁻¹. Powder samples were placed directly onto the crystal to fully cover its surface, with three spectra taken for each sample.
3. Results and Discussion
The strawberry tree bark was divided into IB and EB. Their chemical composition was determined and is presented in
Table 1. Extractives were determined sequentially by extraction with dichloromethane, ethanol and water. Dichloromethane extractives are mainly various lipophilic compounds such as terpenes, resins, fatty acids, sterols, waxes, and certain essential oils. A study made with
Arbutus andrachne bark found out that the lipophilic extractives were mainly composed of fatty acids and sterols being palmitic acid the most prevalent, therefore it is expected that
Arbutus unedo bark also has mainly fatty acids. There is a higher content of lipophilic extractives in EB with around 4.3% against the 2.4%, both higher than hexane extract from
Arbutus andrachne bark [
5]. Ethanol extractives represent the second most important extractives in strawberry tree IB with approximately 8.6% for each bark. Water extracts represent the major extract in both barks, just slightly higher than ethanol extractives, nevertheless some of the extractives that could be removed by water are already removed with ethanol, therefore if the water extraction was made first would probably have a higher content. Overall, EB has a higher percentage of extractives (22.9%) than the IB (20.2%). The main difference between EB and IB lies in their lignin content, with EB containing a significantly higher proportion (44%) compared to IB, which has 32%. On the contrary polysaccharides have a higher content in IB with about 26% cellulose and 22% hemicelluloses. EB might have a small amount of suberin of about 1% as determined for
Arbutus andrachne [
5].
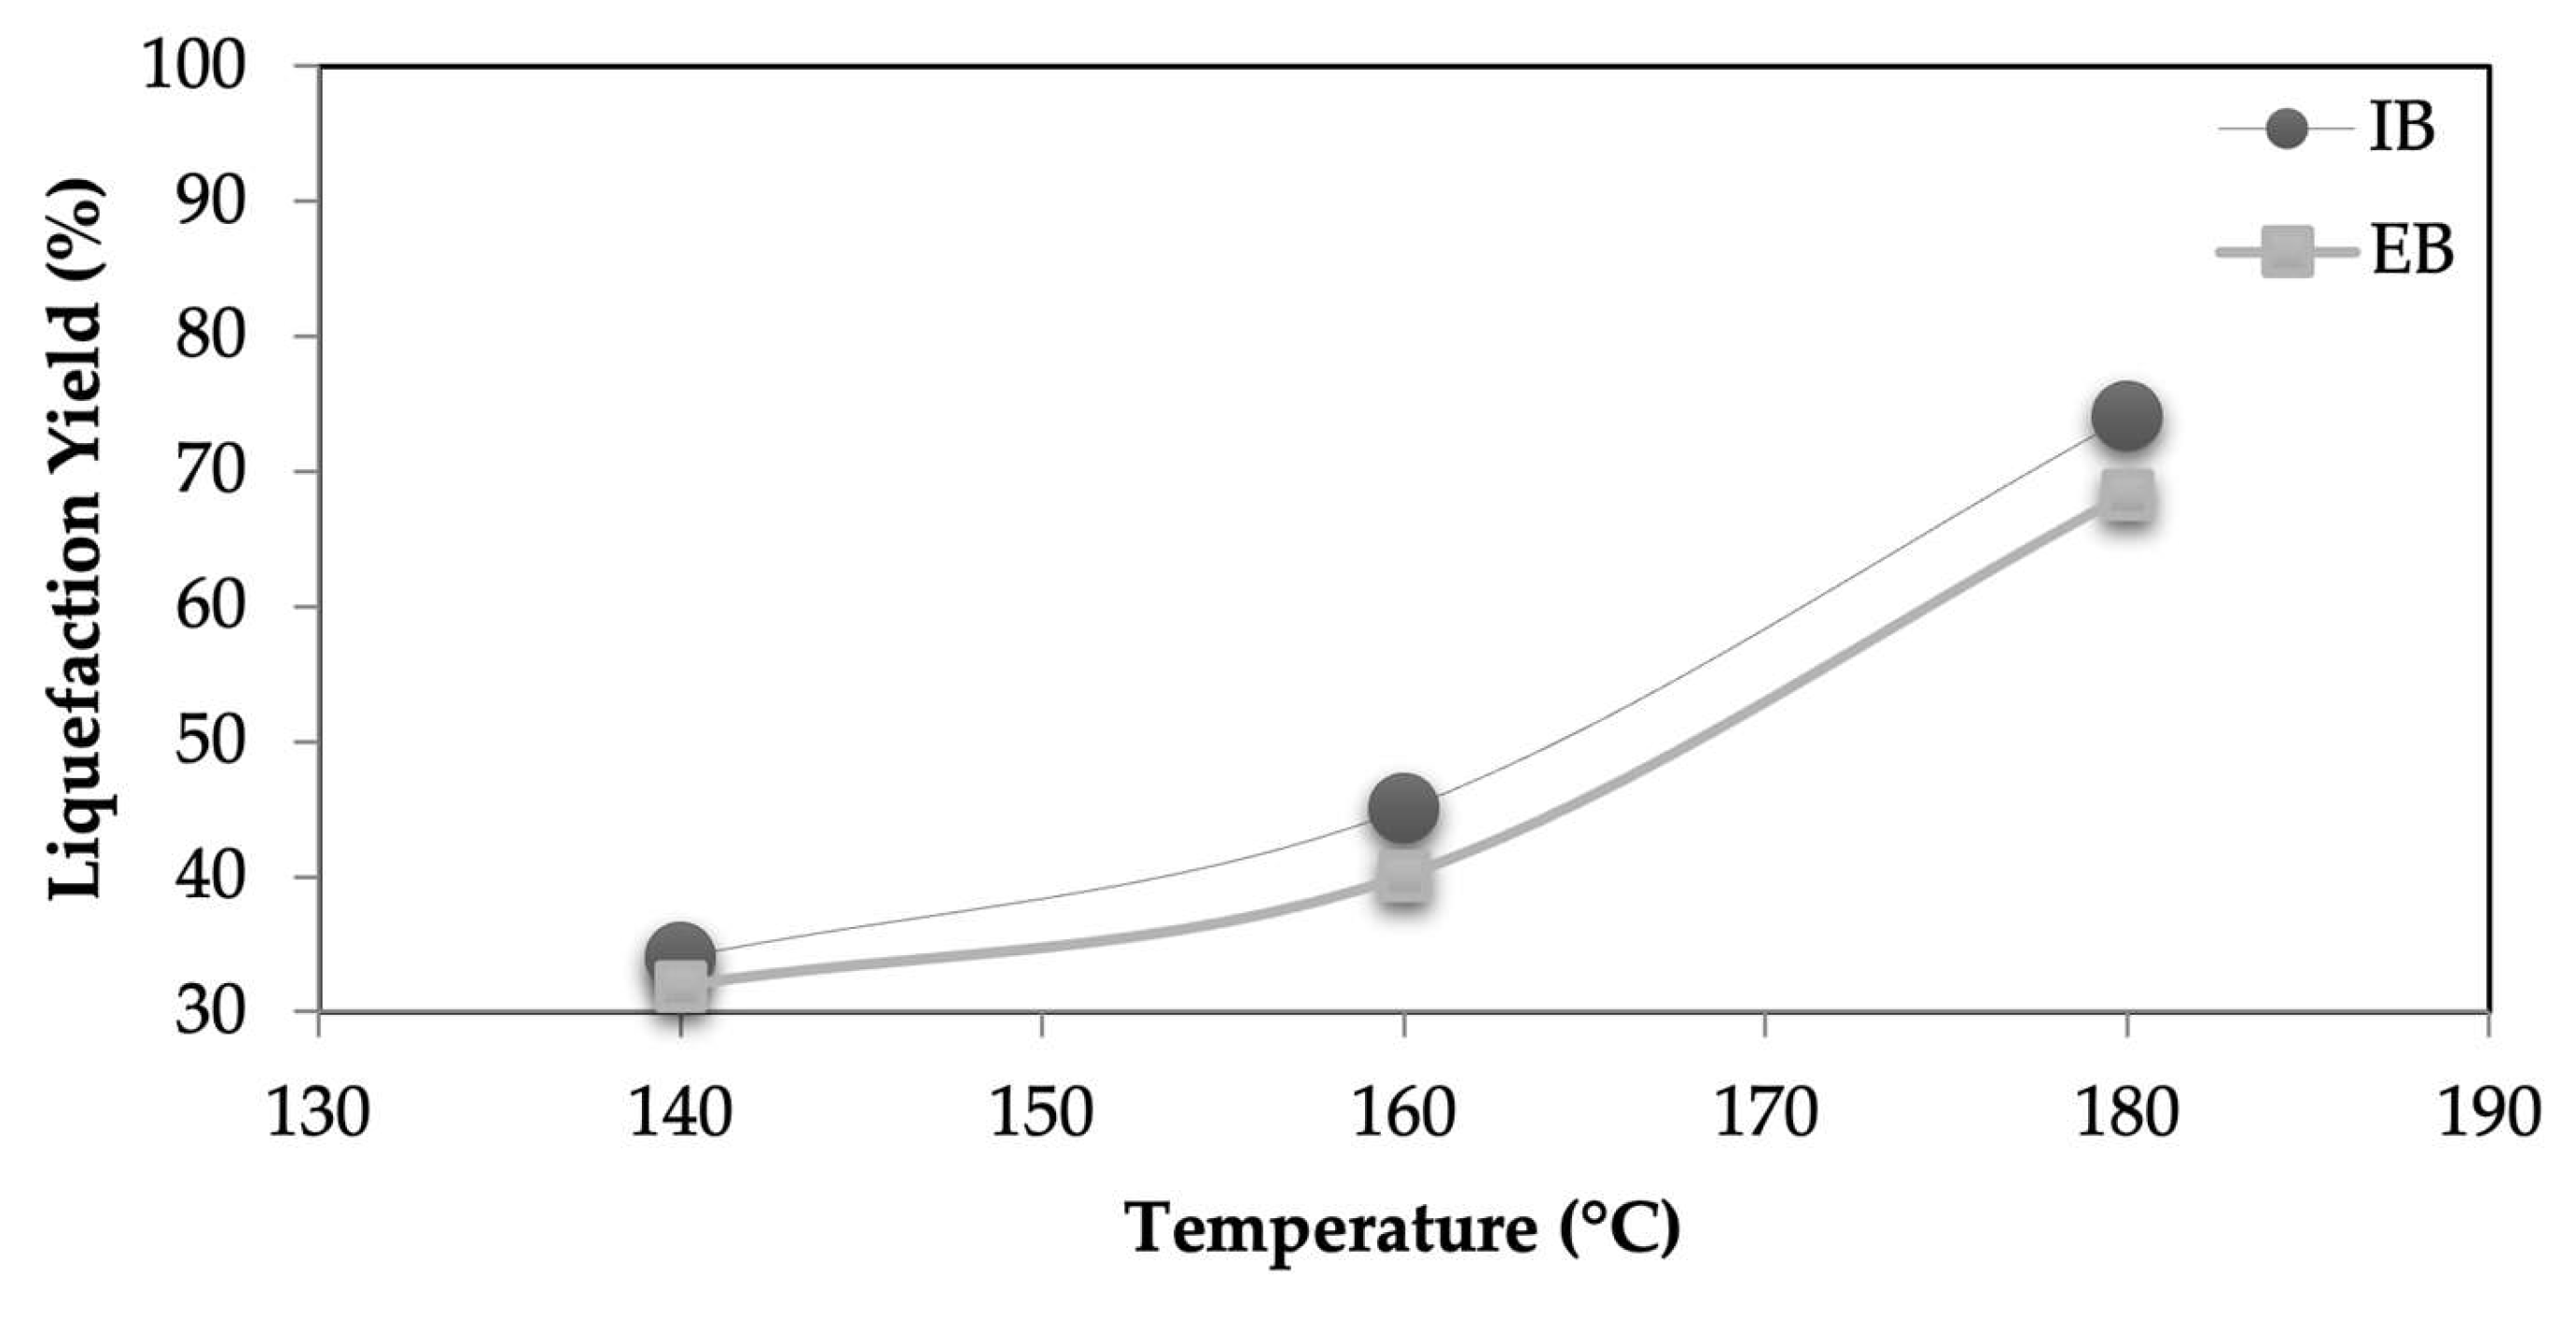
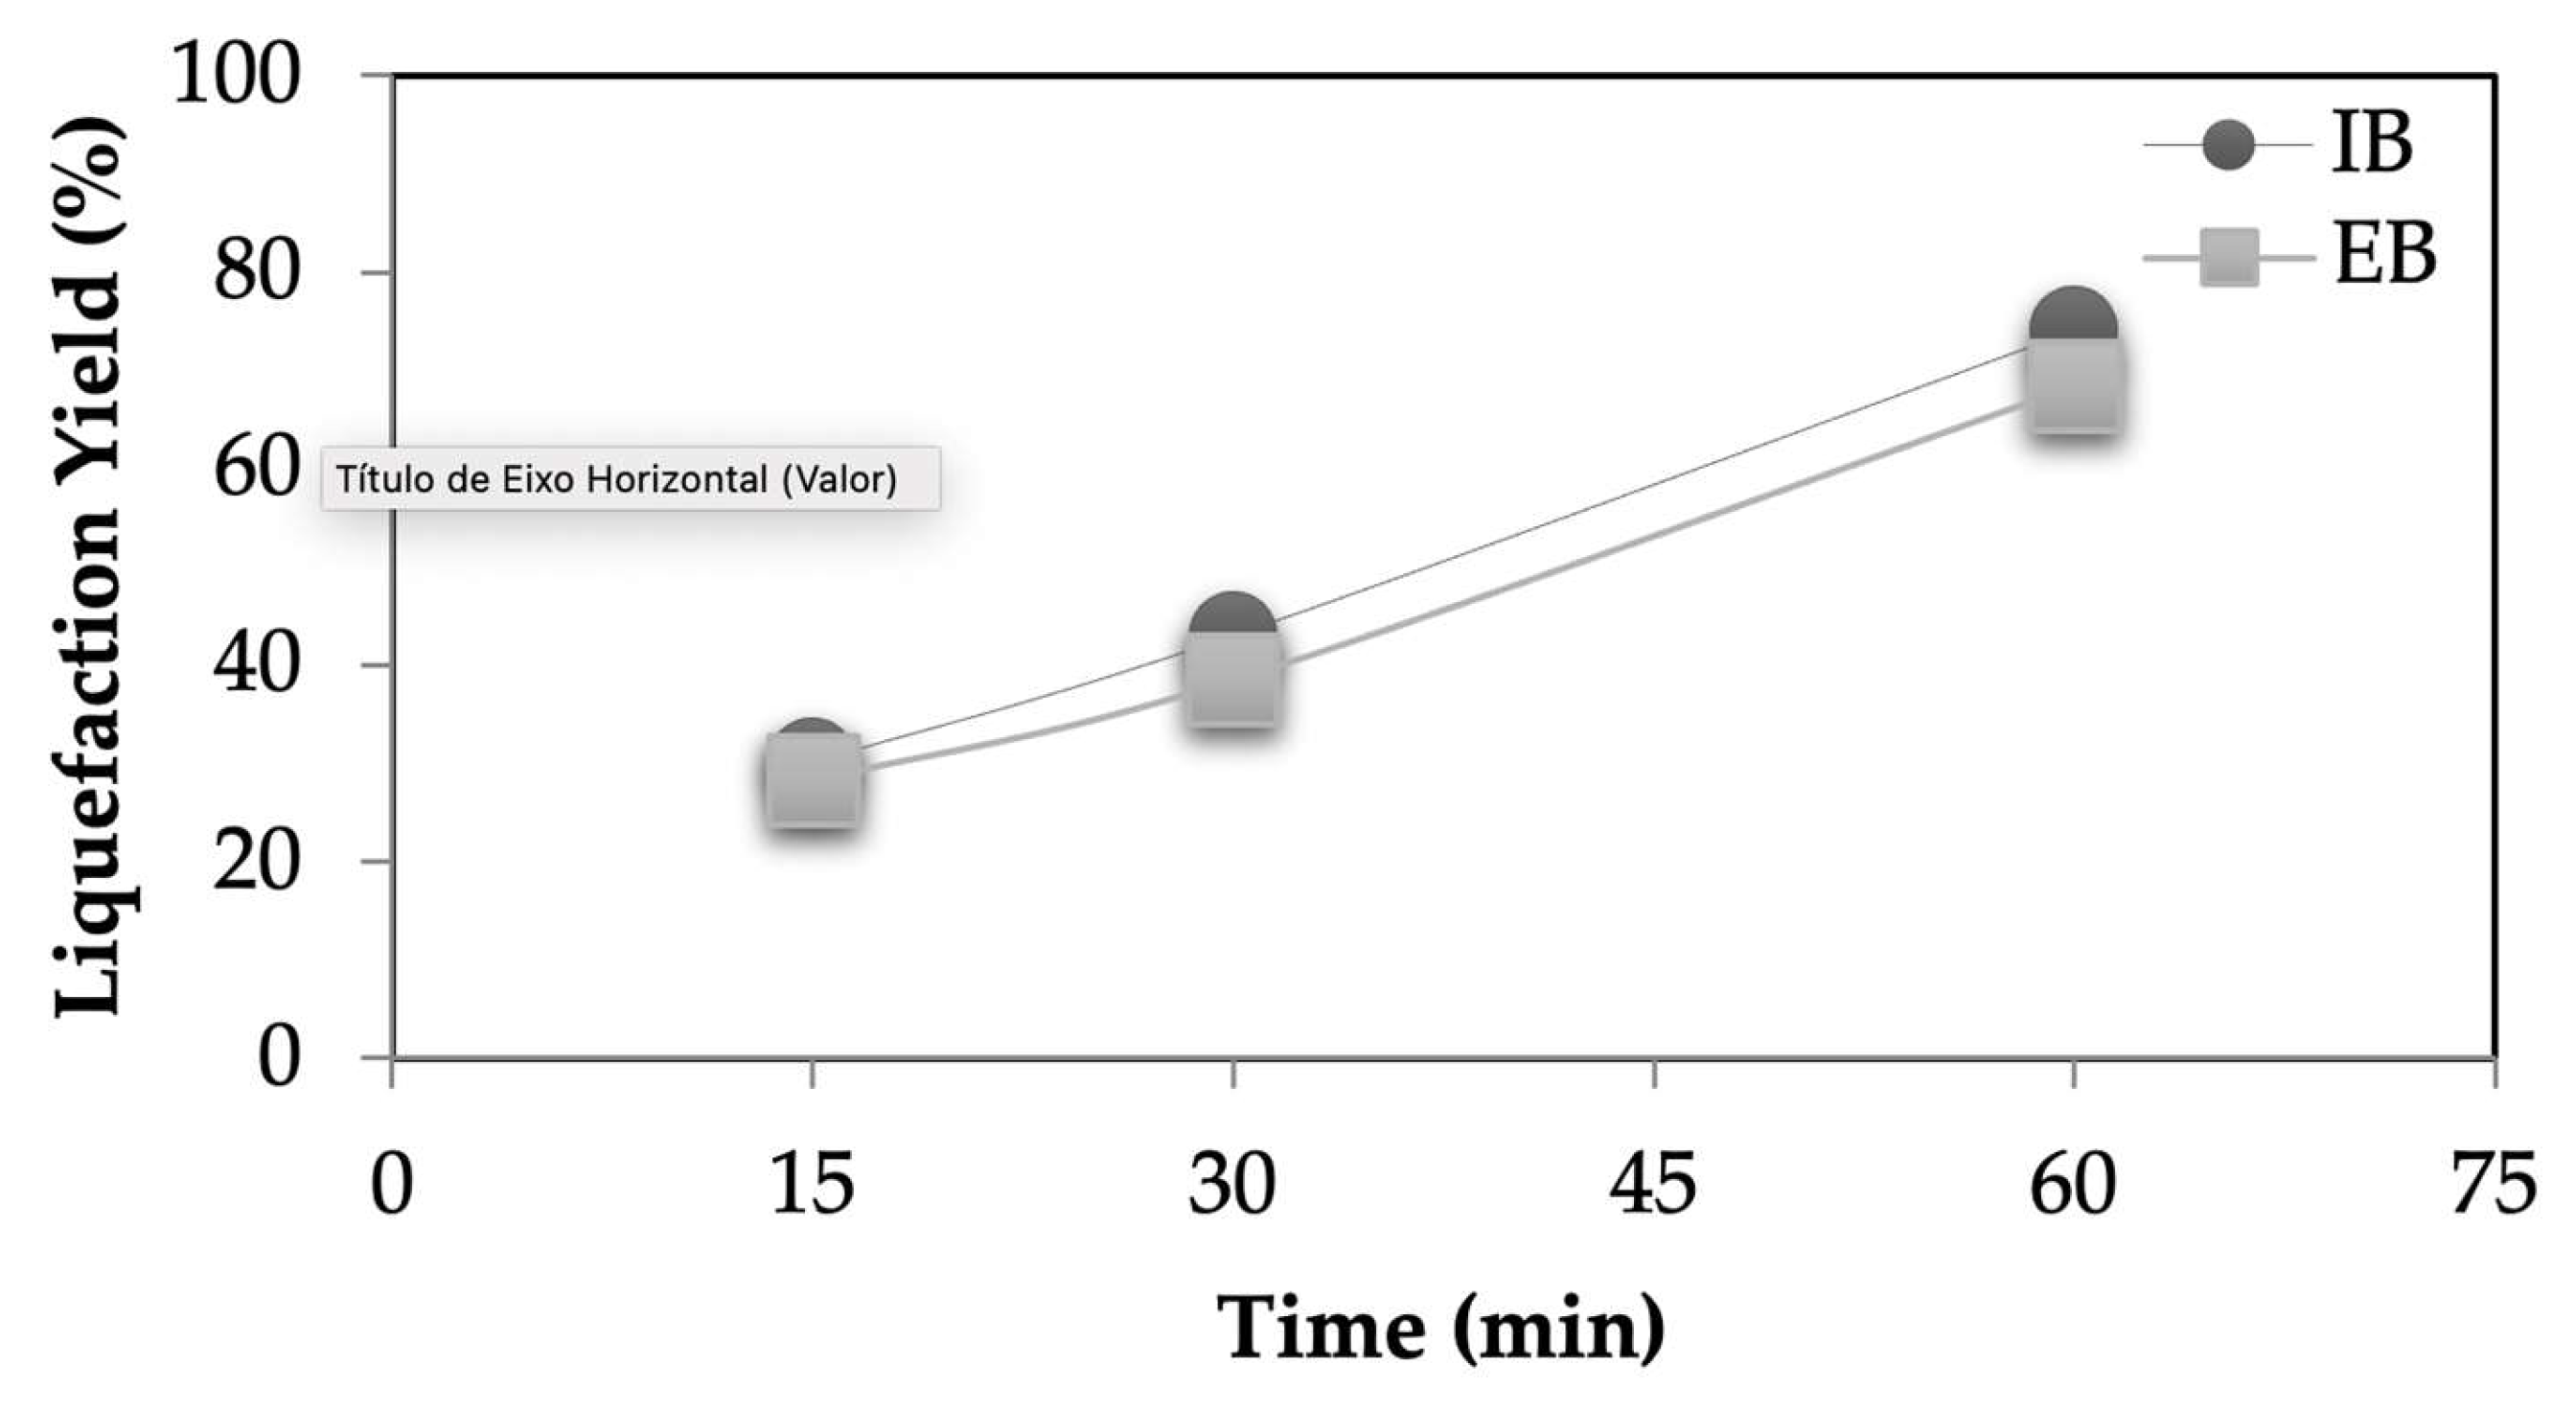
Figure 1 shows the liquefaction yield of both IB and EB at three different temperatures. As expected, higher temperatures lead to higher liquefaction yields for both barks from around 30 % for 140 °C to around 70-80 % at 180 °C. At the same conditions, IB has a slightly higher liquefaction yield, probably due to the less condensed structure that is easier to liquefy. Similar variation is seen for different liquefaction times with liquefaction yield increasing from around 30 % at 15 min until 80 % for 60 min liquefaction time. Similar results were obtained before by several other lignocellulosic materials as for example wood [
26], fruit shells [
27,
28,
29] or barks [
16,
18], although for cork rich barks with higher suberin content the liquefaction was made with a basic catalyst. In some cases, a decrease in liquefaction yield is observed for higher temperatures and liquefaction times due to polycondensation reactions which was not the case here. Generally, polycondensation reactions are due to the reactions between polysaccharides and lignin derivatives and usually happen when using higher weight polyols such as PEG are used [
30]. The use of low weight polyols can significantly reduce polycondensation reactions which has been attributed to highly polar hydroxyl groups with shot chains creating highly protic solvent [
8]. In this process a mixture of ethylene glycol and glycerol were used since they have a synergistic effect in liquefaction. Ethylene glycol can accelerate the breakdown process since it is less viscous than glycerol, while glycerol can stabilize the resulting liquefied wood. Together, they create a more balanced reaction environment, resulting in faster liquefaction and better-quality products.
Figure 1.
Liquefaction yields different temperatures for the IB and EB (constant parameters: time 60 min and ratio bark:solvent of 1:10).
Figure 1.
Liquefaction yields different temperatures for the IB and EB (constant parameters: time 60 min and ratio bark:solvent of 1:10).
Figure 2.
Liquefaction yields different times for the IB and EB (constant parameters: temperature 180 °C and ratio bark:solvent of 1:10).
Figure 2.
Liquefaction yields different times for the IB and EB (constant parameters: temperature 180 °C and ratio bark:solvent of 1:10).
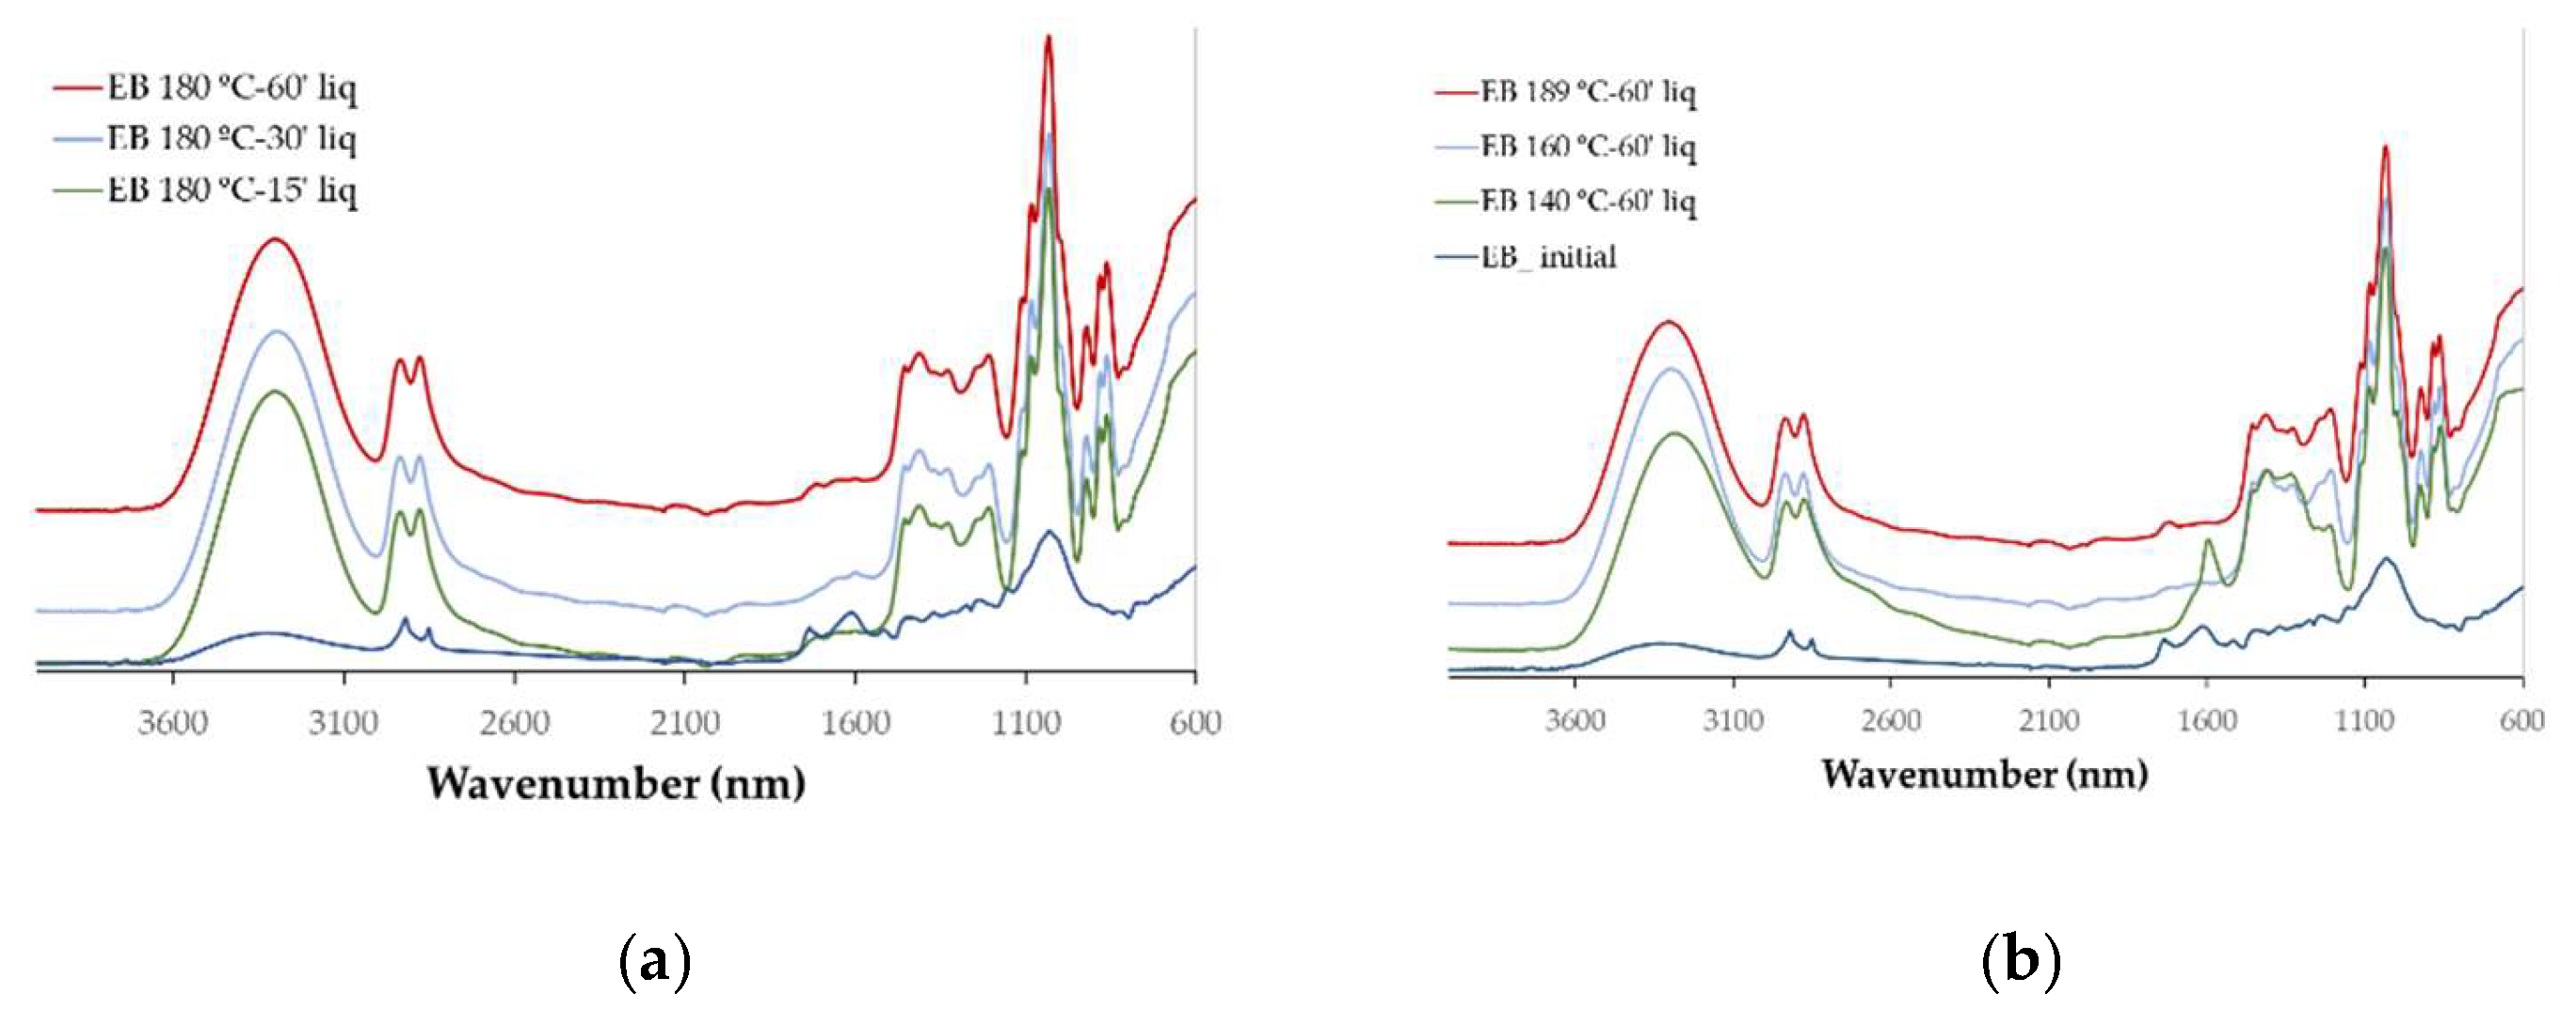
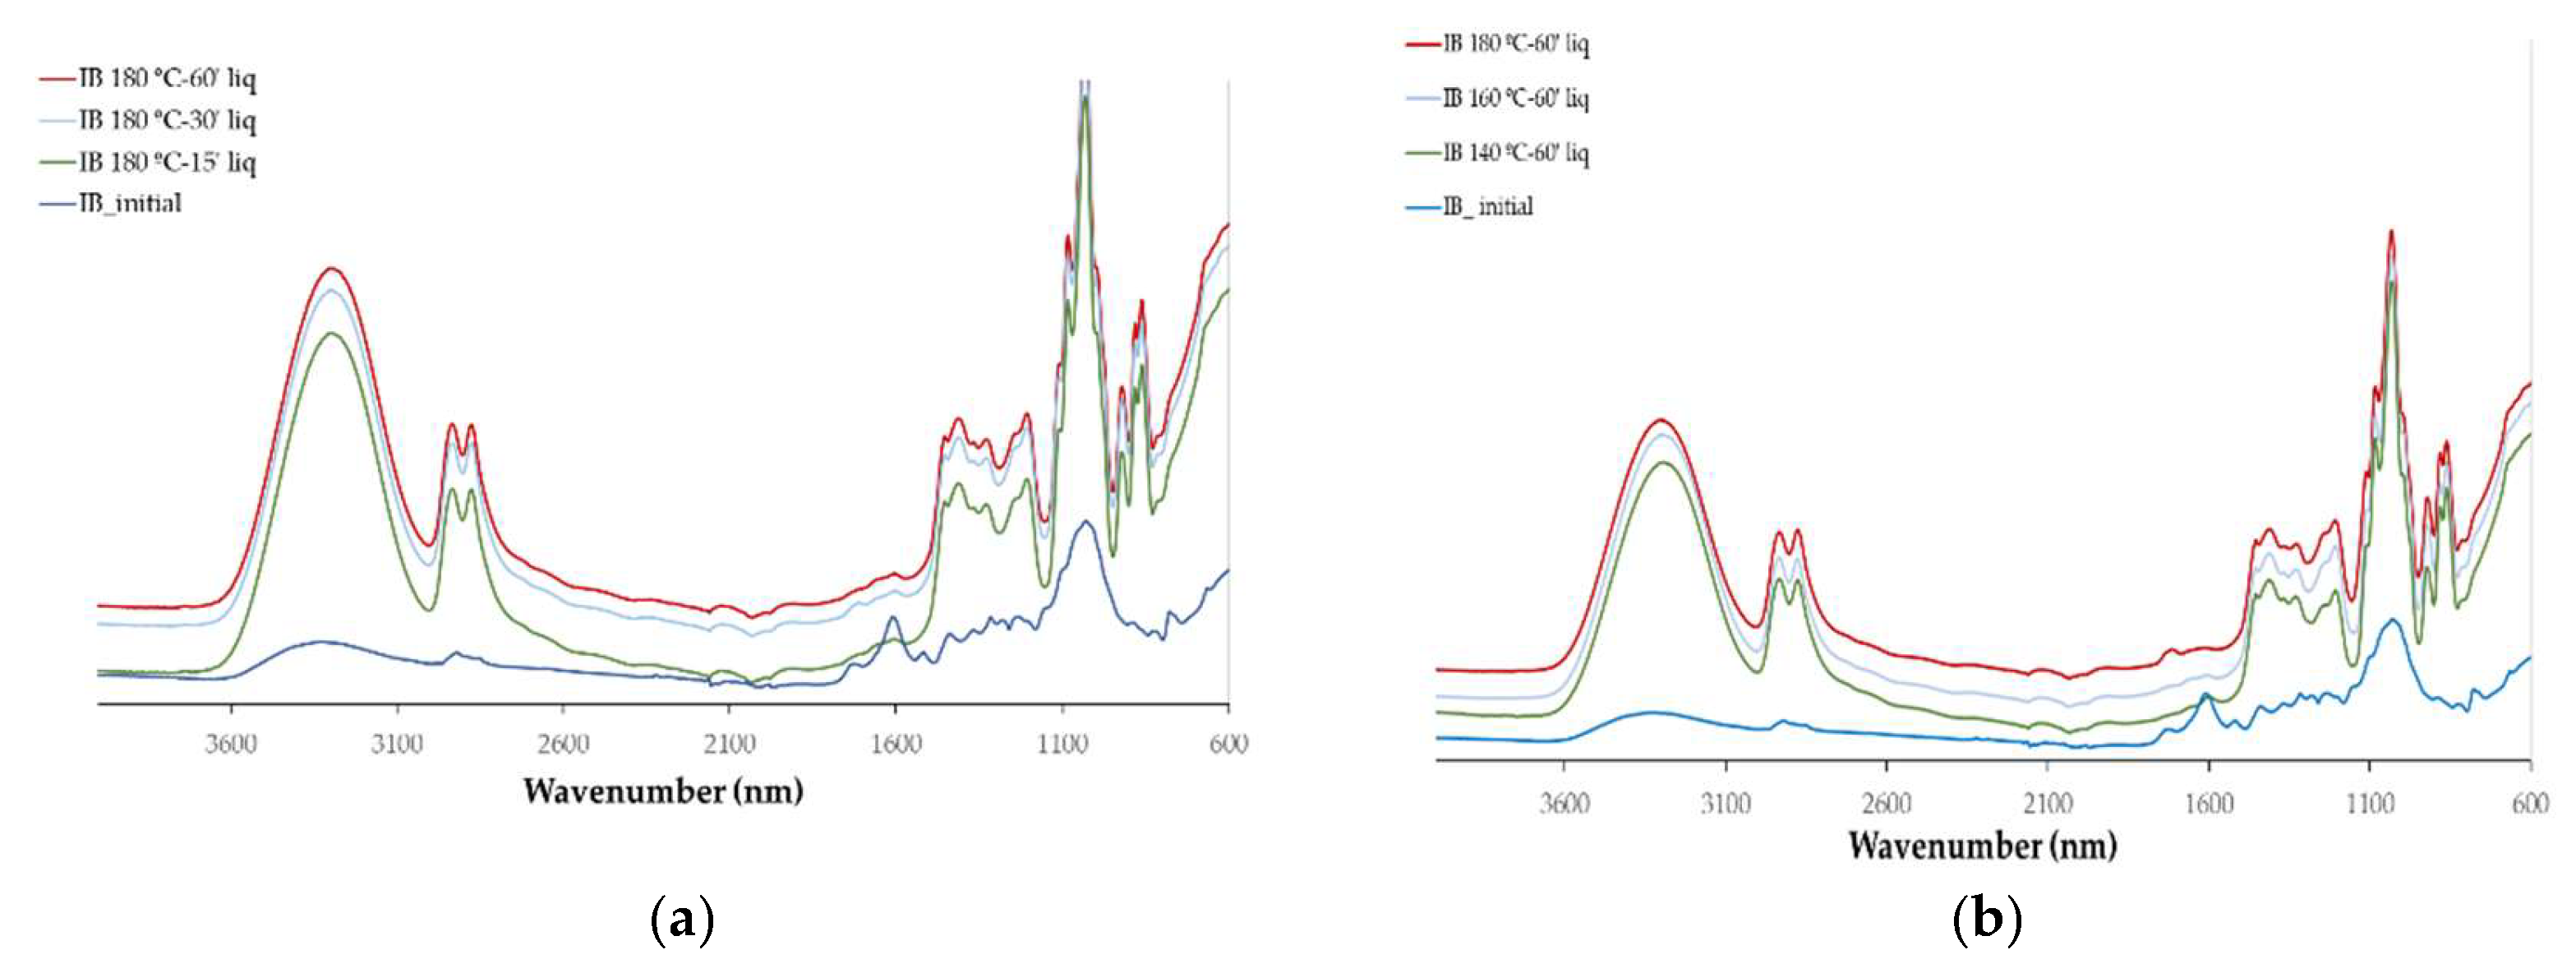
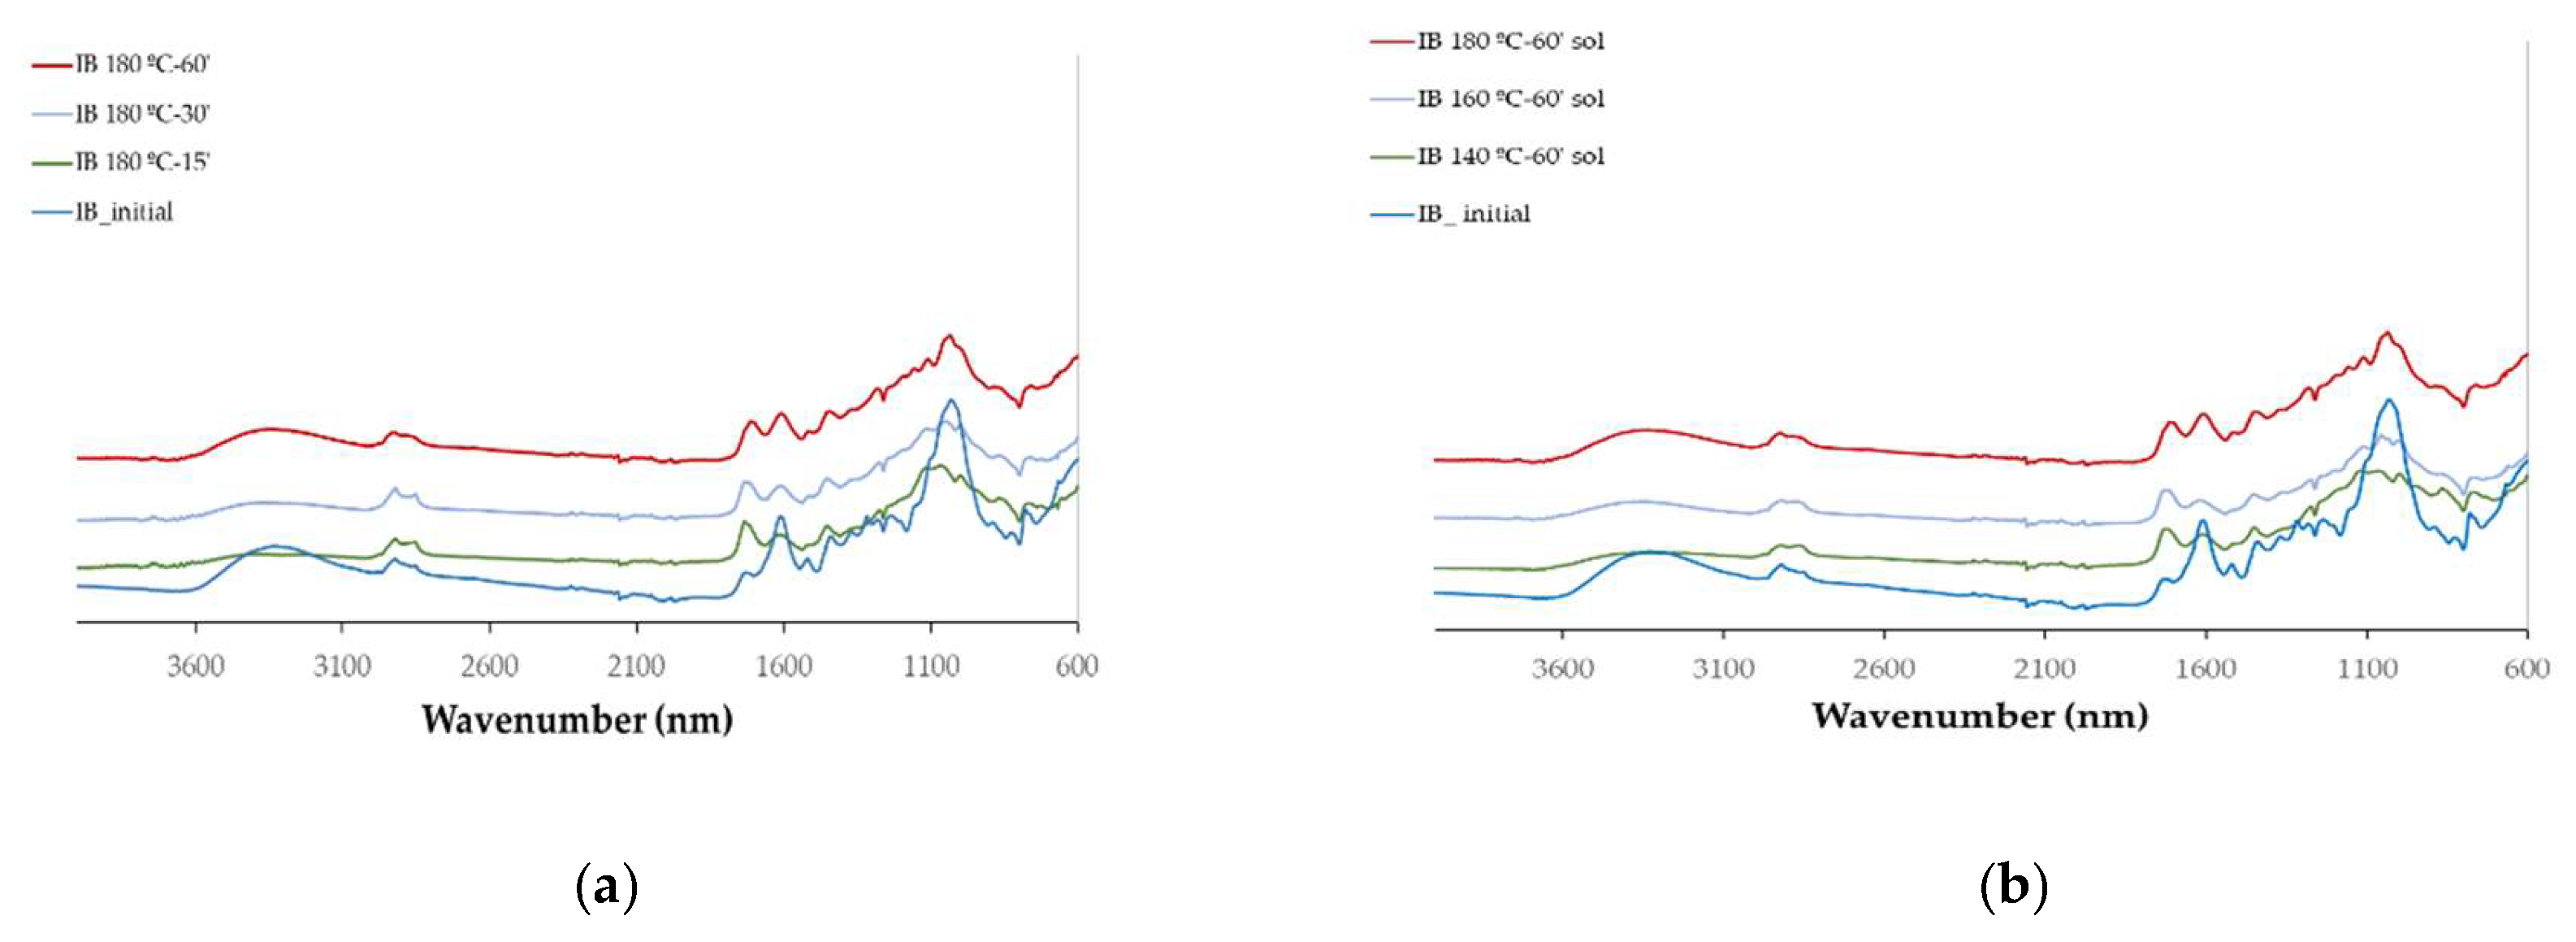
The chemical changes with the liquefaction were monitored by FTIR analysis that was done on both the liquefied materials (
Figure 3 and
Figure 4) and the solid residues after liquefaction (
Figure 5 and
Figure 6).
The main difference observed between the initial IB and EB spectra is the high absorption observed at 1600 cm
-1 in the IB (
Figure 4 and
Figure 6). This high absorption is usually attributed to higher lignin content that has a strong absorption at 1600 cm⁻¹ due to the abundance of aromatic C=C bonds. Nevertheless, in this case it is probably due to the overall higher absorption in IB since there is also a higher absorption around 3330 cm
-1 and 1030 cm
-1 in initial IB.
All liquefied materials exhibit a broader and intense OH stretching peak around 3400 cm⁻¹ much higher than for the initial material, even though it is known that the penetration depth of the IR light into a liquid is typically greater than in solids due to its lower refractive index and density compared to solids resulting in stronger absorption bands in liquids. This peak is due not only from the liquefied material but has also a significative contribution from the polyalcohols (glycerol and ethylene glycol) used in the liquefaction process as stated before [
31]. The CH stretching peaks at 2915 cm⁻¹ and 2850 cm⁻¹, corresponding to asymmetric and symmetric vibrations [
32], increased significantly in relation to the original internal and EB, with their maxima shifting slightly to 2927 cm⁻¹ and 2870 cm⁻¹. The highest peak for the liquefied barks is the one at 2870 cm⁻¹ contrary to the initial solid material where the 2927 cm
-1 is higher. This behavior has been observed before for other liquefied materials such as for instance cherry seeds [
33] or Scotch Broom [
34]. The peak at 1730 cm⁻¹ (non-conjugated C=O linkages) and the band at 1600 cm⁻¹ (conjugated C=O linkages and aromatic C=C-C ring stretch) are significantly reduced and narrowed. This is probably due to the breakdown and transformation of carbonyl-containing compounds that result in the reduction or disappearance of carbonyl-related absorption bands in the FTIR spectrum. The exception is observed at 140°C, where a pronounced peak appears at 1600 cm⁻¹. This peak may be attributed to the increased presence of phenolic extractives, which are more readily released into the liquid phase under these conditions.
There is a high increase in the fingerprint region (1500 cm⁻¹ to 600 cm⁻¹) in relation to the initial material which can also be due to the stronger absorption bands in liquids, nevertheless, there is a clear increase in the C-O stretching band with maximum at around 1030 cm-1 and with a shoulder at around 1090 cm-1 which shows the increase in carbohydrates in the liquid fraction. Noticeably, there isn’t a significant difference between different temperatures (except 140 °C) and different liquefaction times which shows that there are no big differences between the FTIR spectra of the polyols obtained at different liquefaction conditions.
The spectra obtained with the solid residues after liquefaction are relatively similar with the initial solid material, especially for external bark. The main changes observed in these spectra is the increase in 1730 cm-1 peak, in relation to 1600 cm-1 that is observed progressively as the temperature increases. This might correspond to an increase in non-conjugated C=O in relation to conjugated. Since conjugated carbonyl linkage is directly adjacent to a double bond, often involving alternating single and double bonds conjugated compounds are more stable than non-conjugated ones. More condensed or cross-linked lignin structures can increase the aromatic character and thus contribute to higher absorption at this frequency therefore lignin in the solid residue seems to be less cross linked and to have a less condensed structure than the initial material. Another reason might be that a higher percentage of lignin has been liquefied or also the decrease of extractable phenolic compounds that are released to the liquid fraction. For internal bark there is a significant decrease in the 1600 cm-1 peak followed by an increase in the band with the increase in temperature or liquefaction time. This initial decrease might be due to the solubilization of phenolic compounds such as tannins as mentioned before.
For the highest temperature tested there is an increase in the 1445 cm
-1 peak which is generally attributed to aliphatic CH
2 groups [
26]. An increase at 1187 cm
-1 is also observed. The peak at around 1030 cm
-1 decreases but broadens making a shoulder visible at 1086 cm
-1. This shoulder can be due to sulphate ion that absorbs in this range [
35] and is present in sulfuric acid used in the liquefaction. Overall results seem to indicate that the solid residue has a lower lignin content than the initial material.
Polyurethane foams were made using the liquefied IB and EB polyols combined with isocyanate and using water as blowing agent and DBTDL as catalyst.
Figure 7 illustrates the variation in compressive strength, compressive modulus and density of foams with increasing water content for both EB and IB derived polyols. Higher amounts of water content (blowing agent) led to lower mechanical properties decreasing compressive strength from about 100 kPa to less than 20 kPa for IB polyol. Compressive modulus also decreased for higher amounts of water producing softer, more flexible polyurethane foams that are easier to compress. The reason for this decreases might be explained by the decrease in foam density since higher amounts of blowing agent made the foam grow higher and with lower density. Overall IB polyurethane foams are more resistant than EB foams and this is seen by the significantly lower compressive strength and compressive modulus of the foams. On the contrary, no significant differences are observed between the density of IB and EB foams although IB foams have generally a higher density. Similar results on the variation of the mechanical strength of polyurethane foams produced with liquefied material were presented before. For instance, foams produced from liquefied
Cytisus scoparius also showed a decrease in both compressive strength and modulus for foams made with DBTDL catalyst, observed for both acid- and base-derived polyols [
36]. The obtained values for IB polyol were in the same range as those obtained for
Cytisus scoparius although a little higher. The results found for IB polyol are not much different from the reported before by Li et al. [
37], who reported compressive strengths of 147 kPa for 7% water content. However, most values were lower than the compressive strength of 80–150 kPa reported for PU foams produced with polyols containing approximately 50% biomass by Yao et al. [
38], or the 68–195 kPa obtained for foams made from polyols derived from various waste papers by Hu et al.[
39]. Compressive strength of foams made with EB polyol with different amounts of water were all under 20 kPa even though density is not that much small than the observed for IB foams.
Figure 8 illustrates compressive strength and modulus for different NCO/OH ratios (isocyanate index). For an index of 0.6, compressive strength was around 45 kPa for IB polyol and about 32 kPa for EB polyol. As the NCO/OH ratio increased, compressive strength also increased for the IB polyol, reaching a maximum of around 60 kPa. For EB based polyol, compressive strength decreased. Higher isocyanate content typically improves mechanical properties due to increased hard segment content and crosslinking in the polymer network [
40,
41]. Nevertheless, the effect of decreasing density due to the higher expansion of the foam might overlap the increase in hard segments. Once more the compressive strength and compressive modulus of foams made with IB polyol presented better mechanical resistance.
Figure 9 presents the effect of varying catalyst amounts on mechanical properties of IB and EB foams. For IB foams the results on compressive strength seem to increase and decrease afterwards but the results on compressive modulus decrease with the amount of catalyst. For EB foams increasing the catalyst led to a decrease in compressive strength and compressive modulus. The decrease of mechanical properties for higher amounts of catalyst might be due to an increased rate of gas formation (blowing reaction) that can result in larger cell sizes and less uniformity in the foam structure, therefore reducing the foam’s compressive strength. It is also seen that density decreases possibly due to the faster reaction trapping more gas within the foam, leading to lower overall density. Excessive catalyst has also been mentioned to increase the amount of side reactions [
42]
5. Conclusions
The results obtained show that EB has a higher overall extractive content than IB and a higher amount of lipophilic extractives. Polysaccharides are more abundant in IB, which has higher amounts of cellulose than hemicelluloses. EB also contains more lignin compared to internal bark.
Both barks show higher liquefaction yields at increased temperatures, with internal bark liquefying slightly more efficiently due to its less condensed structure. FTIR spectra reveal significant changes post-liquefaction, such as reduced peaks for carbonyl compounds, indicating the breakdown of lignin and polysaccharides. Both IB and EB exhibit a notable increase in OH stretching peaks, attributed to the polyalcohols used in the liquefaction process.
Polyols derived from IB yielded stronger and more resilient foams compared to those from EB. Higher water content led to a decrease in both compressive strength and modulus, likely due to lower foam density. The mechanical properties of foams were sensitive to the NCO/OH ratio and catalyst amounts, with IB-based foams showing better compressive strength and modulus than EB-based foams, despite similar densities.
In summary, the internal bark of the strawberry tree offers superior mechanical properties for polyurethane foam production compared to external bark. The study provides insights into optimizing the liquefaction process and foam characteristics by controlling variables such as temperature, time, and catalyst content.
