
Submitted:
30 September 2024
Posted:
01 October 2024
You are already at the latest version
Abstract
Optical communication systems pose significant challenges, including the effects of nonlinear noises. The nonlinearities, including Kerr-induced phase noise, become more problematic in m-QAM as the orden of the format increases becoming a highly densed set of data-symbols and therefore, requiring advanced signal processing for successful separation of symbols at the demodulation stage. Machine learning techniques have recently been applied to improve signal integrity in such scenarios. This paper explores the application of a spectral clustering algorithm adapted to deal with data streaming to mitigate nonlinear noise in long-haul optical channels dominated by nonlinear phase noise, offering a promising solution to a pressing issue. We demonstrate that the spectral clustering algorithm outperforms the k-means algorithm in the face of nonlinear phase noise in -90, -100, and -110 dBc/Hz scenarios at 1 MHz in a simulated 10 GHz symbol rate channel.
Keywords:
Spectral Clustering
; Data Streaming
; Optical Communications
; Nonlinear Phase Noise
1. Introduction
Optical channels in long-haul communications introduce a range of nonlinear effects that can severely degrade signal integrity [1]. Nonlinearities become more problematic in m-QAM as the orden of the format increases. This leads to a highly dense set of data symbols, requiring advanced signal processing techniques for successful symbol separation at the demodulation stage. Some well-known phenomena include Kerr-induced phase noise, four-wave mixing (FWM), and cross-phase modulation (XPM) [2,3]. Numerous studies have explored traditional approaches that often rely on deterministic models and signal-processing techniques for mitigating nonlinear noise in optical communications [4,5]. Recently, the state of the art shows advanced correction and demodulation strategies to maintain signal integrity. For example, there is a growing interest in machine learning techniques, which have the potential to adaptively model and mitigate nonlinearities without requiring explicit knowledge of the underlying physical processes [6,7,8,9]. Representing the symbols of a transmission in a two-dimensional diagram where we can represent the power and phase, known as a constellation diagram, is a widely used approach for coherent optical communication systems. The constellation allows us to see the transmitted symbols as a snapshot of the moment that shows the phenomena affecting the channel and the distortions suffered by the grouping of symbols passing through the channel, enabling the possibility of applying machine learning techniques to the constellation.
In machine learning approaches, clustering techniques have demonstrated exceptional promise for nonlinear noise mitigation [10]. Clustering is a form of unsupervised learning involving grouping similar data points based on specific criteria, such as distance metrics or density estimates [11]. Applying clustering algorithms to the data streams received by optical systems represented in a constellation diagram makes it possible to segment signal distortions’ symbols effectively. Clustering can be particularly advantageous in dealing with constellation working and discovering complex relationships that might not be apparent through linear analysis methods.
Data streams have become pervasive across various domains, including data mining, cybersecurity, the Internet of Things (IoT), and medicine. Formally, a data stream is defined as an unbounded sequence of multidimensional, sporadic, and transient observations available over time [12]. Data streams are characterized by inherent properties such as constant evolution, rapid transmission, and high volume, which present significant challenges for processing and analysis. These characteristics make data flows dynamic and complex, requiring advanced systems for their efficient management. Identifying the characteristics and challenges of handling data streams is essential for developing effective real-time processing tools. In this context, both supervised and unsupervised algorithms have been proposed to meet the specific demands of data stream processing. Unsupervised algorithms are widely favored due to their ability to operate without the need for training, thereby simplifying the process and reducing associated complexities.
Clustering algorithms employ various approaches to handle constant evolution, high throughput, efficient memory usage and high dimensionality of data. The review paper "data stream clustering: a review" [13] makes a classification of data stream clustering algorithms. It divides them into: Hierarchical algorithms, partitioning algorithms, grid-based algorithms, density-based algorithms and model-based algorithms.
Partitioning algorithms divide data into a fixed number of clusters based on centroid similarity. While relatively straightforward to implement, these algorithms can only form hyperspherical clusters as is the case with K-means, limiting their applicability in some contexts [13]. However, this is not the case for all partitioning algorithms by implementing other strategies to address such shortcomings. An example of this is Kernel-kmeans. Other techniques such as spectral clustering make use of eigenvectors obtained from a kernel. This technique changes the constellation domain by applying a transformation to the eigenvector space, where the separation of the clusters can be evident; this opens the possibility of working in a new domain different from the power and phase diagram representing the constellation. Using eigenvectors to initialize kernel k-means gives better initial and final objective function values and better clustering results [14].
To our knowledge, X. Liu et al. [15] presented the first implementation of the spectral clustering algorithm to compensate for nonlinear phase noise in 16-QAM modulation. We extend the work mentioned above by performing a study on the response of the spectral clustering algorithm to the variation of nonlinear phase noise and Signal-to-noise ratio (SNR). The study deals with the simulation of 10 GHz transmissions with 1 MHz frequency offset and larger modulation formats with 16-QAM, 32-QAM, and 64-QAM constellations. The contributions of this work can be summarized as:
- Presentation of a modified spectral clustering algorithm to work with data streams for future real-time implementations and integration with a demapping stage for m-QAM.
- The methodology involves simulating scenarios that approximate real-world conditions using widely accepted transmission values and large transmission formats.
- The comprehensive approach allows us to explore the response of the spectral clustering algorithm in three scenarios of nonlinear phase noise and SNR variation.
The paper is organized as follows: introduction, a mathematical and conceptual background of the spectral clustering algorithm, results, discussion, and conclusions.
2. Spectral Clustering Algorithm
K-means machine learning algorithm is widely implemented to cluster time-varying information in optical communications. However, this is limited when the obtained constellations present nonlinear phase noise due to elonged clusters confusing the algorithm based on Euclidian distance. The spectral clustering algorithm proposed in [16] is an alternative to the classical K-means for elonged cluster shapes.
The spectral clustering algorithm selects the number of eigenvectors of a matrix according to the number of groups required to partition the original data set. Subsequently, k-means clustering is applied to the normalized eigenvectors, thereby achieving data grouping. The description above provides a brief overview of the algorithm, but a formal description will be provided, and a visual example will illustrate the behavior of the data when applying this algorithm.
2.1. Spectral Clustering Algorithm Description
Let in be a data set that will be partitioned into k groups, applying a radial basis function (RBF) kernel to build a symmetric matrix known as the affinity matrix , as defined in Equation (1). The RBF kernel includes a parameter –referred to as kernel bandwidth– that must be adjusted to achieve appropriate data clustering.
Given the computed affinity matrix A, a diagonal matrix D is defined, where their represent the sum of the elements of the row of matrix A, as delineated in Equation (2). Subsequently, the diagonal elements of matrix D are normalized, as specified in Equation (3).
The Laplacian matrix L is constructed from the matrices A and , and is denoted by . The first k eigenvectors of the matrix L will be used to partition the data set S into k mutually exclusive clusters. This process results in the building of the matrix . Subsequently, the matrix X is renormalized following Equation (4).
Figure 1b shows the effect of constructing the Y matrix from the synthetic data set shown in Figure 1a whose data is in space. Although the data in Figure 1b is still in space (this will not always be the case as the Y matrix will be in ), the distribution has transformed, thus allowing us to proceed with the final step of the algorithm.
The rows of matrix Y are considered points in , and the data set is partitioned into k clusters via the K-means algorithm. Accordingly, the initial point designated as is assigned to cluster j strictly when the row i of the matrix Y has been allocated to cluster j.
Figure 2a shows the effect when we apply k-means directly on the synthetic dataset, obtaining an unsuitable clustering of the synthetic data. However, if we follow the spectral clustering algorithm and apply k-means in the space described by the Y matrix shown in Figure 1b, we obtain two clusters, as shown in Figure 2b. Subsequently, by assigning the memberships of these clusters to the synthetic dataset in Figure 1a, we achieve a proper clustering of the synthetic dataset, as illustrated in Figure 2c.
2.2. Data Streaming and Spectral Clustering Implementation
The primary objective of this work is to apply the spectral clustering algorithm to data streams characterized by "an unlimited sequence of multidimensional, sporadic, and transient observations available over time" [12]. Processing large amounts of information in a single step necessitates excessive memory usage, and unlimited data streaming is practically impossible using the default definition of the spectral clustering algorithm. Consequently, in real-time applications, we must implement a model that allows us to process data dynamically while simultaneously serving as input in an iterative form. For this reason, we defined the data samples denoted as , each containing the same number of symbols, avoiding the excessive memory consumption as previously mentioned. In practice, data transmission change over time can present a challenge of label inconsistency causing a wrong demapping, as illustrated in Figure 3a,b, which show a switch in the label assigned to the data across different algorithm iterations. A relabeling step has been added to the algorithm to correct the demapping at the output of the algorithm.
2.3. Demapping Strategy Correcting the Label Inconsistency
Figure 4 shows the different stages of the spectral clustering algorithm. In real-time data stream processing, the stages that process matrices consume memory and can generate bottlenecks. Our proposal involves processing data samples that are buffers to store a portion of the data stream. As mentioned above, the algorithm has a final demapping stage that relabels the symbols with the correct value of the ideal constellation.
The process for addressing the potential labeling inconsistency or the correct mapping of symbols is explained as follows:
- The first step involves selecting the mapping for the ideal constellation, which will be the reference points for the correct labeling of the symbols, as shown in Figure 5a.
- A specified quantity of data is received as illustrated in Figure 5b.
- The data stored in the window is clustered using the spectral clustering algorithm.
- Independently of the memberships returned by the spectral clustering algorithm, the demapping step calculate the average of the coordinates value within each identified cluster.
- The demapping algorithm calculates the distance between the coordinates of the reference points assigned in step 1 and the averages of cluster coordinates obtained in step 4.
- The labels from step 1 are assigned to the coordinates identified in step 4 closest to the reference points of ideal constellation assigned in step 1.
- Assign the labels specified in step 6 to the symbols from which the average coordinates were obtained in step 4.
Upon completing these seven steps, a data clustering is achieved (as depicted in Figure 5c) that maintains consistent labels regardless of the number of algorithm runs. The removal of label inconsistencies constitutes the final phase of the algorithm.
3. Simulation Setup
The simulation was performed using the Matlab Communications Toolbox, which is a standard and widely used tool in the communications community. The simulation’s focus is evaluating the spectral clustering algorithm against nonlinear phase noise, so a sweep was performed using -90, -100, -110 dBc/Hz at 1 MHz offset, simulating a 10 GHz transmission. The measurements were selected from the state of the art, and the justification is given in the Discussion section of this paper below. The phase noise scenarios were applied to three modulations, 16 QAM, 32 QAM, and 64 QAM, to appreciate the effect as the constellation size increases.
The nonlinear phase noise is accompanied by additive white Gaussian noise (AWGN) to vary the signal-to-noise ratio in the range of 5 dB to 20 dB by observing the behavior in scenarios where the channel is dominated by noise. The data generated in Matlab were exported as files and fed as inputs to the k-means and spectral clustering algorithms that were developed in Python language.
The application of the algorithm is assumed to be downstream of the ADC in the receiver of a real system, so the result of the noise application includes all the previous optical stages and the inclusion of electrical noise, therefore, the plots used as the basis of the analysis will be the SNR vs BER (bit error rate) generated in Python as output. The approach presented in this paper will allow us to move towards the real-time implementation of the algorithm on FPGA-based heterogeneous architectures in future work.
4. Results
The proposed spectral clustering algorithm applies the data streaming processing explained above with a window of 2048 points, which will allow us to design a hardware architecture for processing large volumes of data in future work. The total number of symbols sent for testing was 100,000 randomly generated symbols, keeping the exact data for both k-means and spectral clustering, with an oversampling rate of 2 for 16 QAM, 4 for 32 QAM, and 8 for 64 QAM.
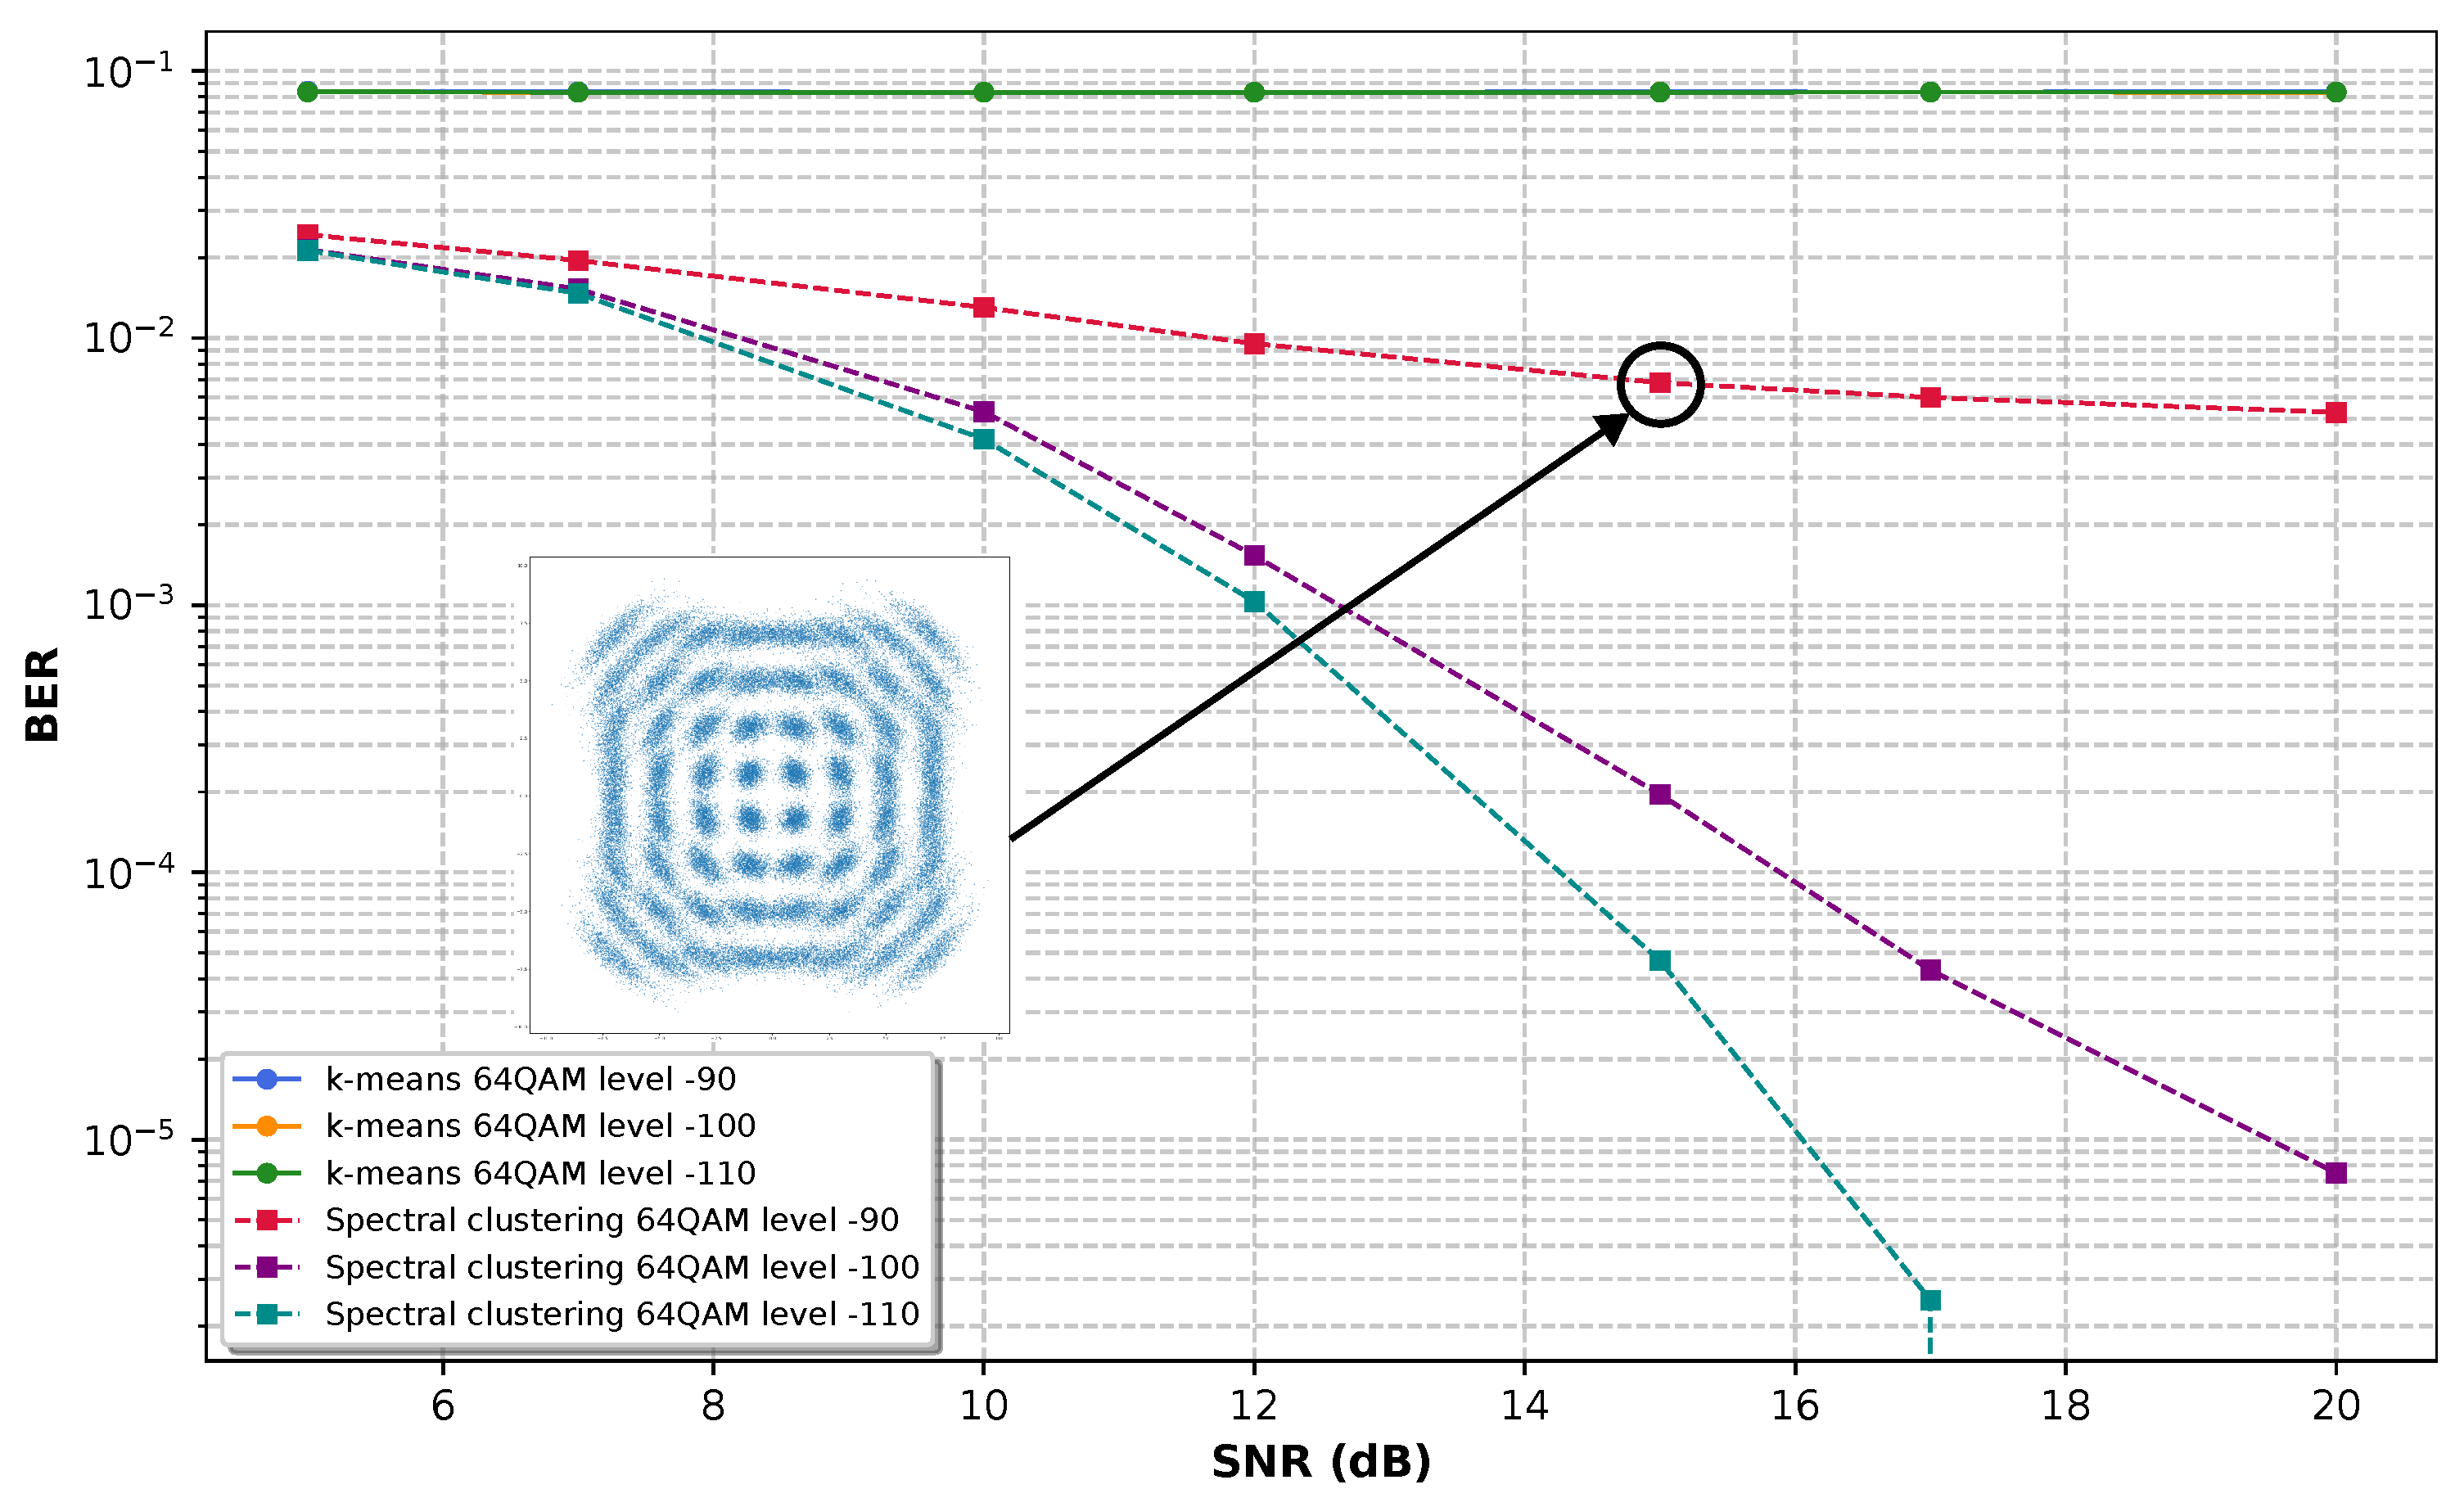
Figure 6, Figure 7 and Figure 8 show the results obtained for 16 QAM, 32 QAM, and 64 QAM modulation, respectively, when applying different levels of nonlinear phase noise of -90, -100, and -110 dBc/Hz at 1 MHz offset. The plots are constructed on a semi-logarithmic scale, with the x-axis representing the SNR in dB and the y-axis representing the BER on a logarithmic scale. An inset shows the labels for the result curves for k-means in solid lines and spectral clustering represented by dotted lines.
Figure 6 shows a better performance of the spectral clustering algorithm for dealing with nonlinear phase noise than the results obtained by k-means. Especially at noise levels below -100 dBc/Hz, we observe that the result for values greater than 17 dB SNR is zero for BER, as represented in the graph with the curves going downwards. The behavior of k-means for all cases is close to that of spectral clustering for -90 dBc/Hz, which is the worst-case scenario.
In Figure 7, the nonlinear noise punishes the k-means behavior more strongly, and it does not go below a BER of for any of the SNR values. On the contrary, the spectral clustering algorithm performs well at phase noise levels of -100 and -110 dBc/Hz, even achieving zero BER at values greater than 17 dB SNR for -110 phase noise. However, its performance is affected by -90 dBc/Hz noise, and it does not manage to decrease the BER more than , which is a challenging scenario for a 32 QAM modulation due to the fact that the distance between symbols is smaller than in 16 QAM.
Figure 8 is the scenario for 64 QAM, in which k-means cannot decrease the noise to values less than . Spectral clustering achieves a BER of at 20 dB SNR for -100 dBc/Hz and zero BER for values greater than 17 dB SNR for a phase noise of -110 dBc/Hz. As expected, the BER for -90 dBc/Hz worsens compared to that of 32 QAM, achieving BER values around for values above 10 dB SNR.
5. Discussion
Some papers mention the possible use of spectral clustering as a coherent receiver when reviewing the different non-supervised learning techniques but without addressing its behavior in the presence of nonlinear phase noise [17]. In [18], we find the most recent work at the time of writing. The authors formally present the spectral clustering algorithm as a coherent receiver with no data preamble. However, the behavior of the spectral clustering algorithm is not explored for different levels of nonlinear phase noise, and tests have been performed for the 16 QAM modulation format.
In this paper, we expand the work presented in [15] to evaluate the spectral clustering algorithm in a channel dominated by nonlinear phase noise and AWGN. The expansion of the work focuses on covering larger modulations, so we add 32 QAM and 64 QAM to observe the effect of nonlinear noise as the format increases. The nonlinear noise characteristics used in this paper were extracted from work such as [19], where it mentions the development of optical oscillators with phase noise of -100 dBc/Hz at a frequency offset of 1 MHz and other experimental references such as “phase noise of -90 dBc/Hz at 1-10 MHz frequency offset will be low enough for transmission with 16-ary QAM”. Also, the paper [20] mentions characteristics such as “the minimum requirement for the carrier phase noise is -96 dBc/Hz at 1 MHz offset for 64 QAM”. The mentioned characteristics were used as a guide to define the ranges used in the simulation. Our goal for future work is to implement the algorithm in real-time on an FPGA-based architecture.
6. Conclusions
This paper presents a study on the response of the spectral clustering algorithm to the variation of nonlinear phase noise and signal-to-noise ratio (SNR). The study deals with the simulation of transmissions at a 10 GHz symbol rate for different phase noise with levels of -90, -100, and -110 dBc/Hz at a frequency offset of 1 MHz, mimicking the simulation real scenarios found in the literature. The algorithm was tested with different modulation formats of 16-QAM, 32-QAM and 64-QAM, exceeding in size those found in the literature for the use of spectral clustering.
The spectral clustering algorithm was modified to work with data streams for future real-time implementations. It was also integrated with a demapping stage for m-QAM to correct labeling inconsistencies when working with windowed data in the demapping stage.
The spectral clustering algorithm outperforms k-means in the presence of nonlinear phase noise and performs well in a noise-dominated channel, as shown in the SNR vs BER plots presented in this paper. In future work, we will explore the design of a heterogeneous FPGA-based architecture for real-time implementation of the spectral clustering algorithm as a coherent receiver in an optical communication system.
Author Contributions
Conceptualization, D.M. and A.C.; methodology, M.S., D.M., and A.C.; software, M.S.; validation, M.S, D.M., A.C., E.R., N.G., and J.B.; formal analysis, M.S., D.M., A.C., E.R., N.G., and J.B.; investigation, M.S., D.M., and A.C. ; resources, N.G., J.B.; data curation, M.S.; writing—original draft preparation, M.S., D.M., and A.C.; writing—review and editing, M.S., D.M., A.C., E.R., N.G., and J.B.; visualization, M.S., D.M., and A.C.; supervision, D.M., A.C., N.G., and J.B. All authors have read and agreed to the published version of the manuscript.
Funding
This research was funded by the Office of Naval Research Global (ONRG) and the Air Force Office of Scientific Research/Southern Office of Aerospace Research and Development (AFOSR/SOARD) grant number N62909-24-1-2088 and the project PF24211 “Fortalecimiento de Capacidad Técnico-Científica del Grupo Sistemas de Control y Robótica 2024”.
Institutional Review Board Statement
Not applicable.
Informed Consent Statement
Not applicable.
Data Availability Statement
The raw data supporting the conclusions of this article will be made available by the authors on request.
Conflicts of Interest
The authors declare no conflicts of interest.
Abbreviations
The following abbreviations are used in this manuscript:
| SNR | Signal-to-noise ratio |
| BER | Bit error rate |
| QAM | Quadrature amplitude modulation |
| AWGN | Additive white Gaussian noise |
| FWM | Four-wave mixing |
| XPM | Cross-phase modulatio |
| RBF | Radial basis function |
References
- Ali, F.; Shakeel, M.; Ali, A.; Shah, W.; Qamar, M.S.; Ahmad, S.; Ali, U.; Waqas, M. Probing of nonlinear impairments in long range optical transmission systems. Journal of Optical Communications 2023, 44. [Google Scholar] [CrossRef]
- Jin, C.; Shevchenko, N.A.; Li, Z.; Popov, S.; Chen, Y.; Xu, T. Nonlinear Coherent Optical Systems in the Presence of Equalization Enhanced Phase Noise. Journal of Lightwave Technology 2021, 39. [Google Scholar] [CrossRef]
- Yang, S.; Yang, L.; Luo, F.; Li, B.; Wang, X.; Du, Y.; Liu, D. Joint fiber nonlinear noise estimation, osnr estimation and modulation format identification based on asynchronous complex histograms and deep learning for digital coherent receivers. Sensors (Switzerland) 2021, 21. [Google Scholar] [CrossRef] [PubMed]
- Demir, A. Nonlinear phase noise in optical-fiber-communication systems. Journal of Lightwave Technology 2007, 25. [Google Scholar] [CrossRef]
- Tao, Z.; Zhang, K.; Su, X.; Nakashima, H.; Hoshida, T. Nonlinear Noise Measurement for Optical Communication. 2021 Opto-Electronics and Communications Conference, OECC 2021, 2021. [CrossRef]
- Melek, M.M.; Yevick, D. Machine learning compensation of fiber nonlinear noise. Optical and Quantum Electronics 2022, 54. [Google Scholar] [CrossRef]
- Musumeci, F.; Rottondi, C.; Nag, A.; Macaluso, I.; Zibar, D.; Ruffini, M.; Tornatore, M. An Overview on Application of Machine Learning Techniques in Optical Networks. IEEE Communications Surveys and Tutorials 2019, 21. [Google Scholar] [CrossRef]
- Jain, V.; Bhatia, R. A survey on machine learning schemes for fiber nonlinearity mitigation in radio over fiber system. Journal of Optical Communications 2023. [Google Scholar] [CrossRef]
- Pan, X.; Wang, X.; Tian, B.; Wang, C.; Zhang, H.; Guizani, M. Machine-Learning-Aided Optical Fiber Communication System. IEEE Network 2021, 35. [Google Scholar] [CrossRef]
- Giacoumidis, E.; Lin, Y.; Jarajreh, M.; O’Duill, S.; McGuinness, K.; Whelan, P.F.; Barry, L.P. A blind nonlinearity compensator using DBSCAN clustering for coherent optical transmission systems. Applied Sciences (Switzerland) 2019, 9. [Google Scholar] [CrossRef]
- Huang, X.; Wang, Y.; Li, C.; Xu, H.; Zhang, Q.; Yang, L.; Xin, X. Improved DBSCAN algorithm based signal recovery technology in coherent optical communication systems. Optics Communications 2022, 521. [Google Scholar] [CrossRef]
- Bahri, M. Improving IoT data stream analytics using summarization techniques. PhD thesis, Institut Polytechnique de Paris, 2020.
- Zubaroğlu, A.; Atalay, V. Data stream clustering: a review. Artificial Intelligence Review 2021, 54, 1201–1236. [Google Scholar] [CrossRef]
- Dhillon, I.S.; Guan, Y.; Kulis, B. Kernel k-means: spectral clustering and normalized cuts. Proceedings of the tenth ACM SIGKDD international conference on Knowledge discovery and data mining, 2004, pp. 551–556.
- Liu, X.; Wang, Y.; Xu, H. Nonlinearity compensation technique by spectral clustering for coherent optical communication system. Optics InfoBase Conference Papers, 2020. [CrossRef]
- Ng, A.; Jordan, M.; Weiss, Y. On spectral clustering: Analysis and an algorithm. Advances in neural information processing systems 2001, 14. [Google Scholar]
- Saif, W.S.; Esmail, M.A.; Ragheb, A.M.; Alshawi, T.A.; Alshebeili, S.A. Machine Learning Techniques for Optical Performance Monitoring and Modulation Format Identification: A Survey. IEEE Communications Surveys & Tutorials 2020, 22, 2839–2882. [Google Scholar] [CrossRef]
- He, J.; Zhan, Y.; Pan, H.; Peng, H. An unsupervised coherent receiver digital signal processing algorithm based on spectral clustering with no data preamble. IET Optoelectronics 2024. Available online: http://ietresearch.onlinelibrary.wiley.com/doi/pdf/10.1049/ote2.12124. [CrossRef]
- Kanno, A. Seamless Convergence Between Terahertz Radios and Optical Fiber Communication Toward 7G Systems. IEEE Journal of Selected Topics in Quantum Electronics 2023, 29, 1–9. [Google Scholar] [CrossRef]
- Hasanuzzaman, G.K.M.; Iezekiel, S.; Kanno, A. W-Band Optoelectronic Oscillator. IEEE Photonics Technology Letters 2020, 32, 771–774. [Google Scholar] [CrossRef]
Figure 1.
Effect of spectral clustering algorithm on a synthetic dataset.
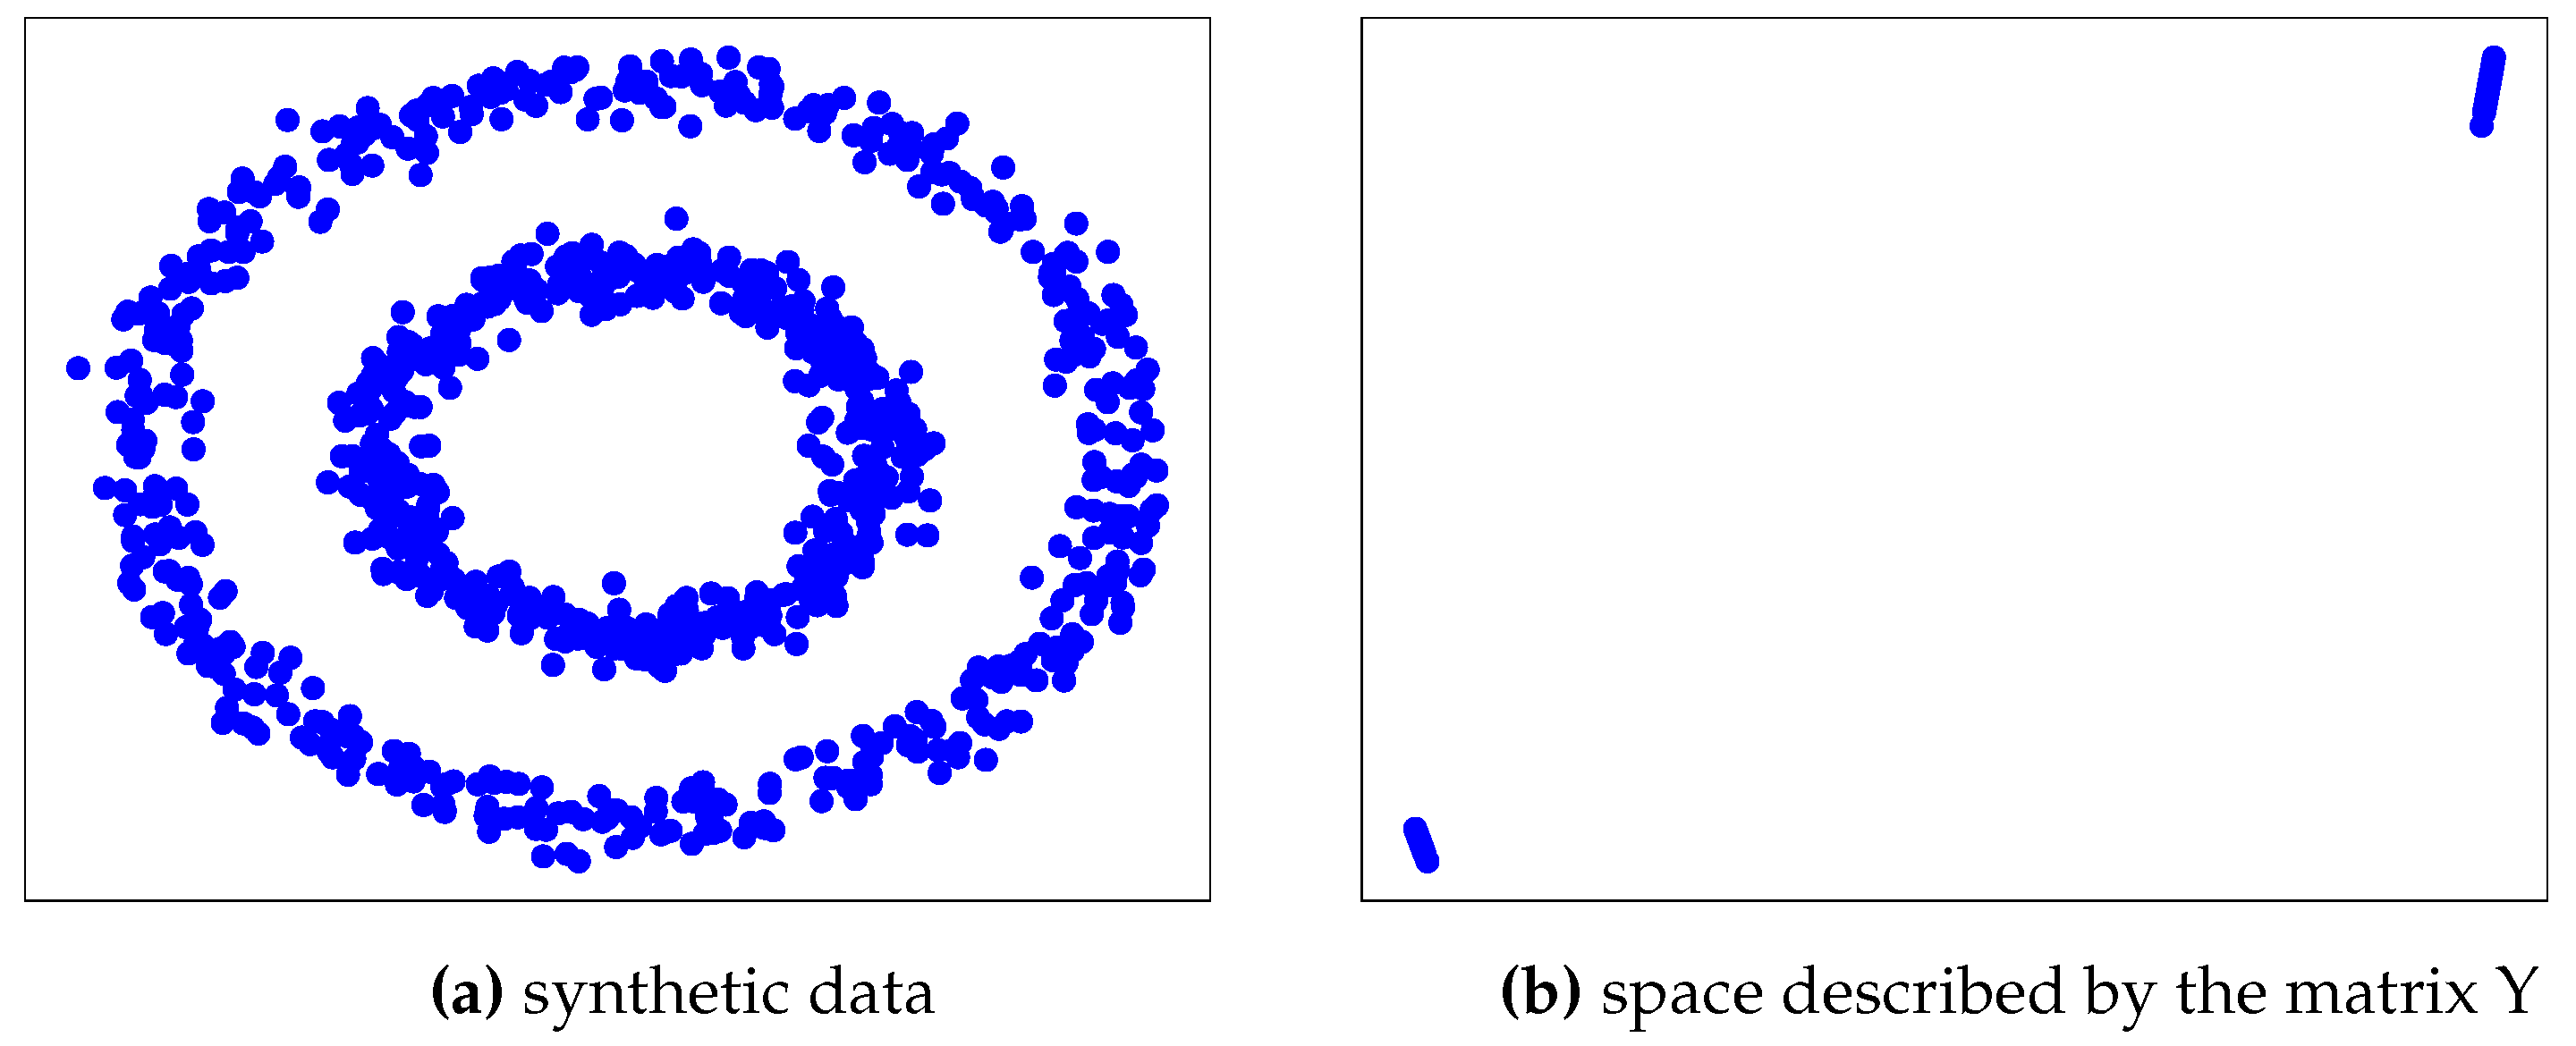
Figure 2.
Effect of K-means and spectral clustering algorithm on a synthetic dataset. (a) Clustering synthetic data by directly applying K-means.(b) Clustering of the data by applying K-means on the space described by the matrix Y. (c) Clustering of the original synthetic dataset.
Figure 2.
Effect of K-means and spectral clustering algorithm on a synthetic dataset. (a) Clustering synthetic data by directly applying K-means.(b) Clustering of the data by applying K-means on the space described by the matrix Y. (c) Clustering of the original synthetic dataset.
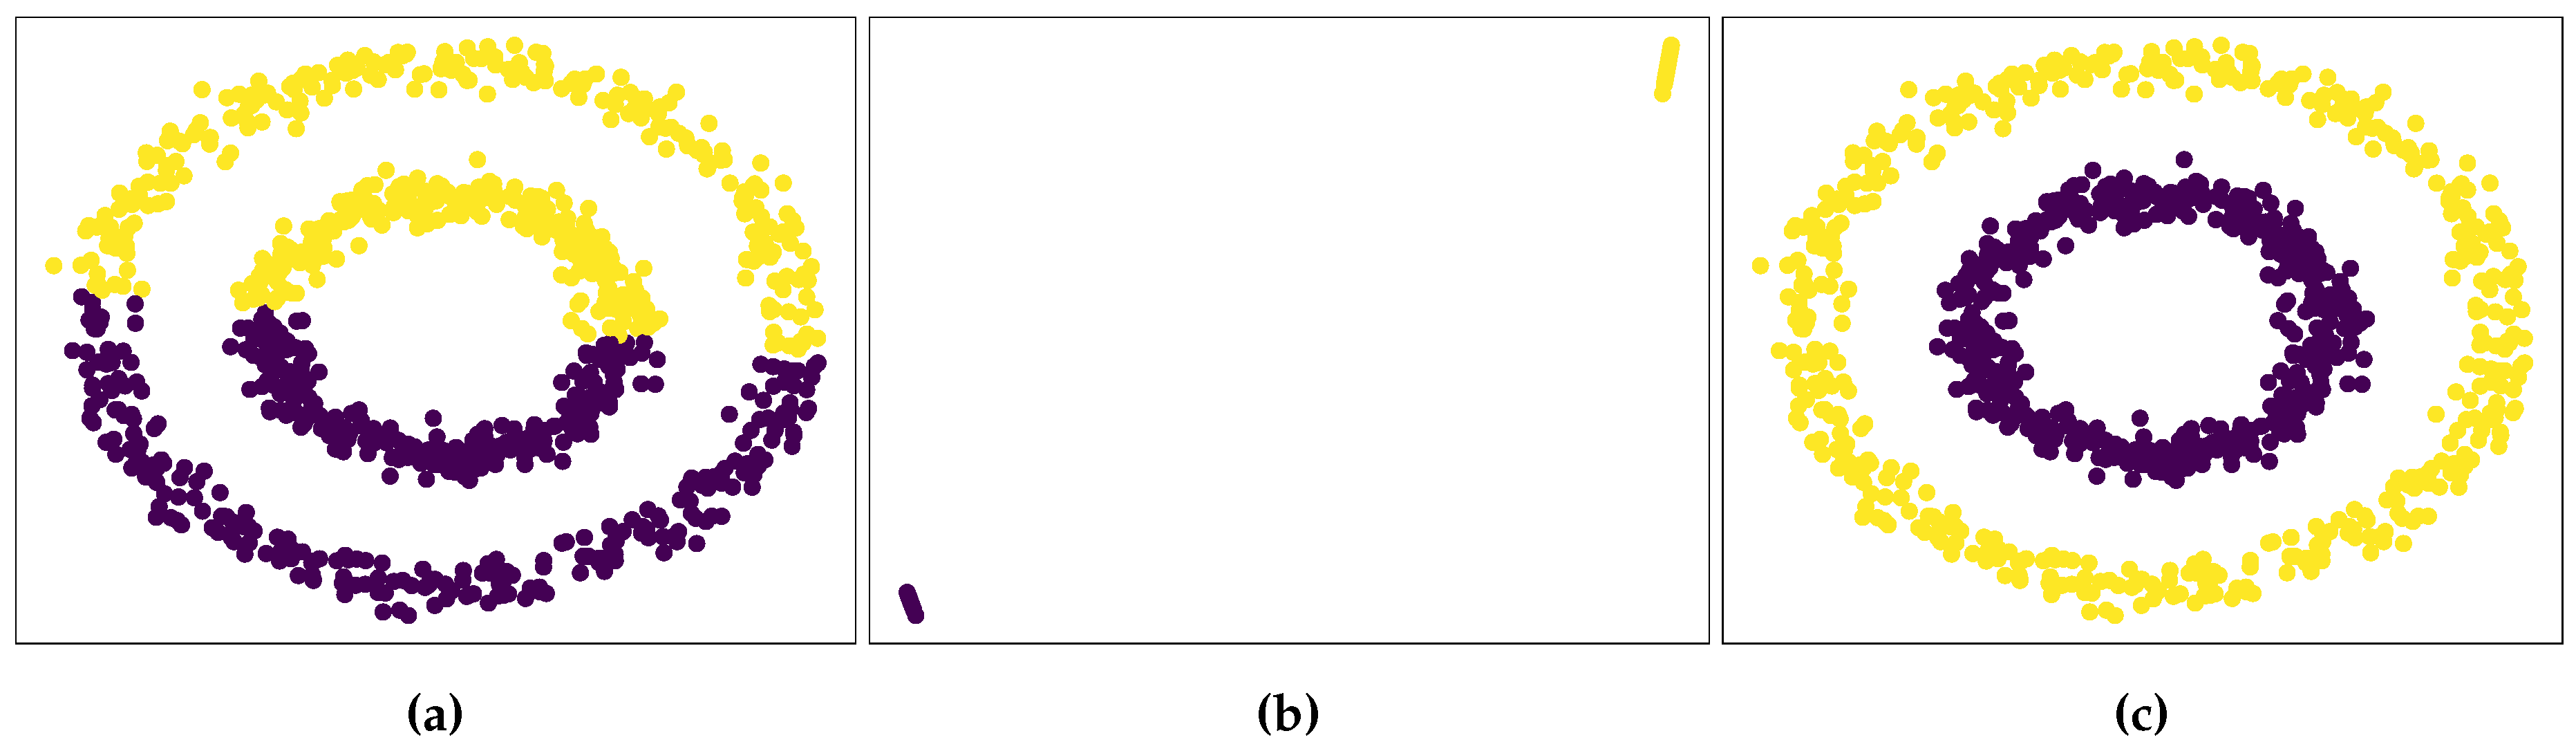
Figure 3.
Label inconsistency.
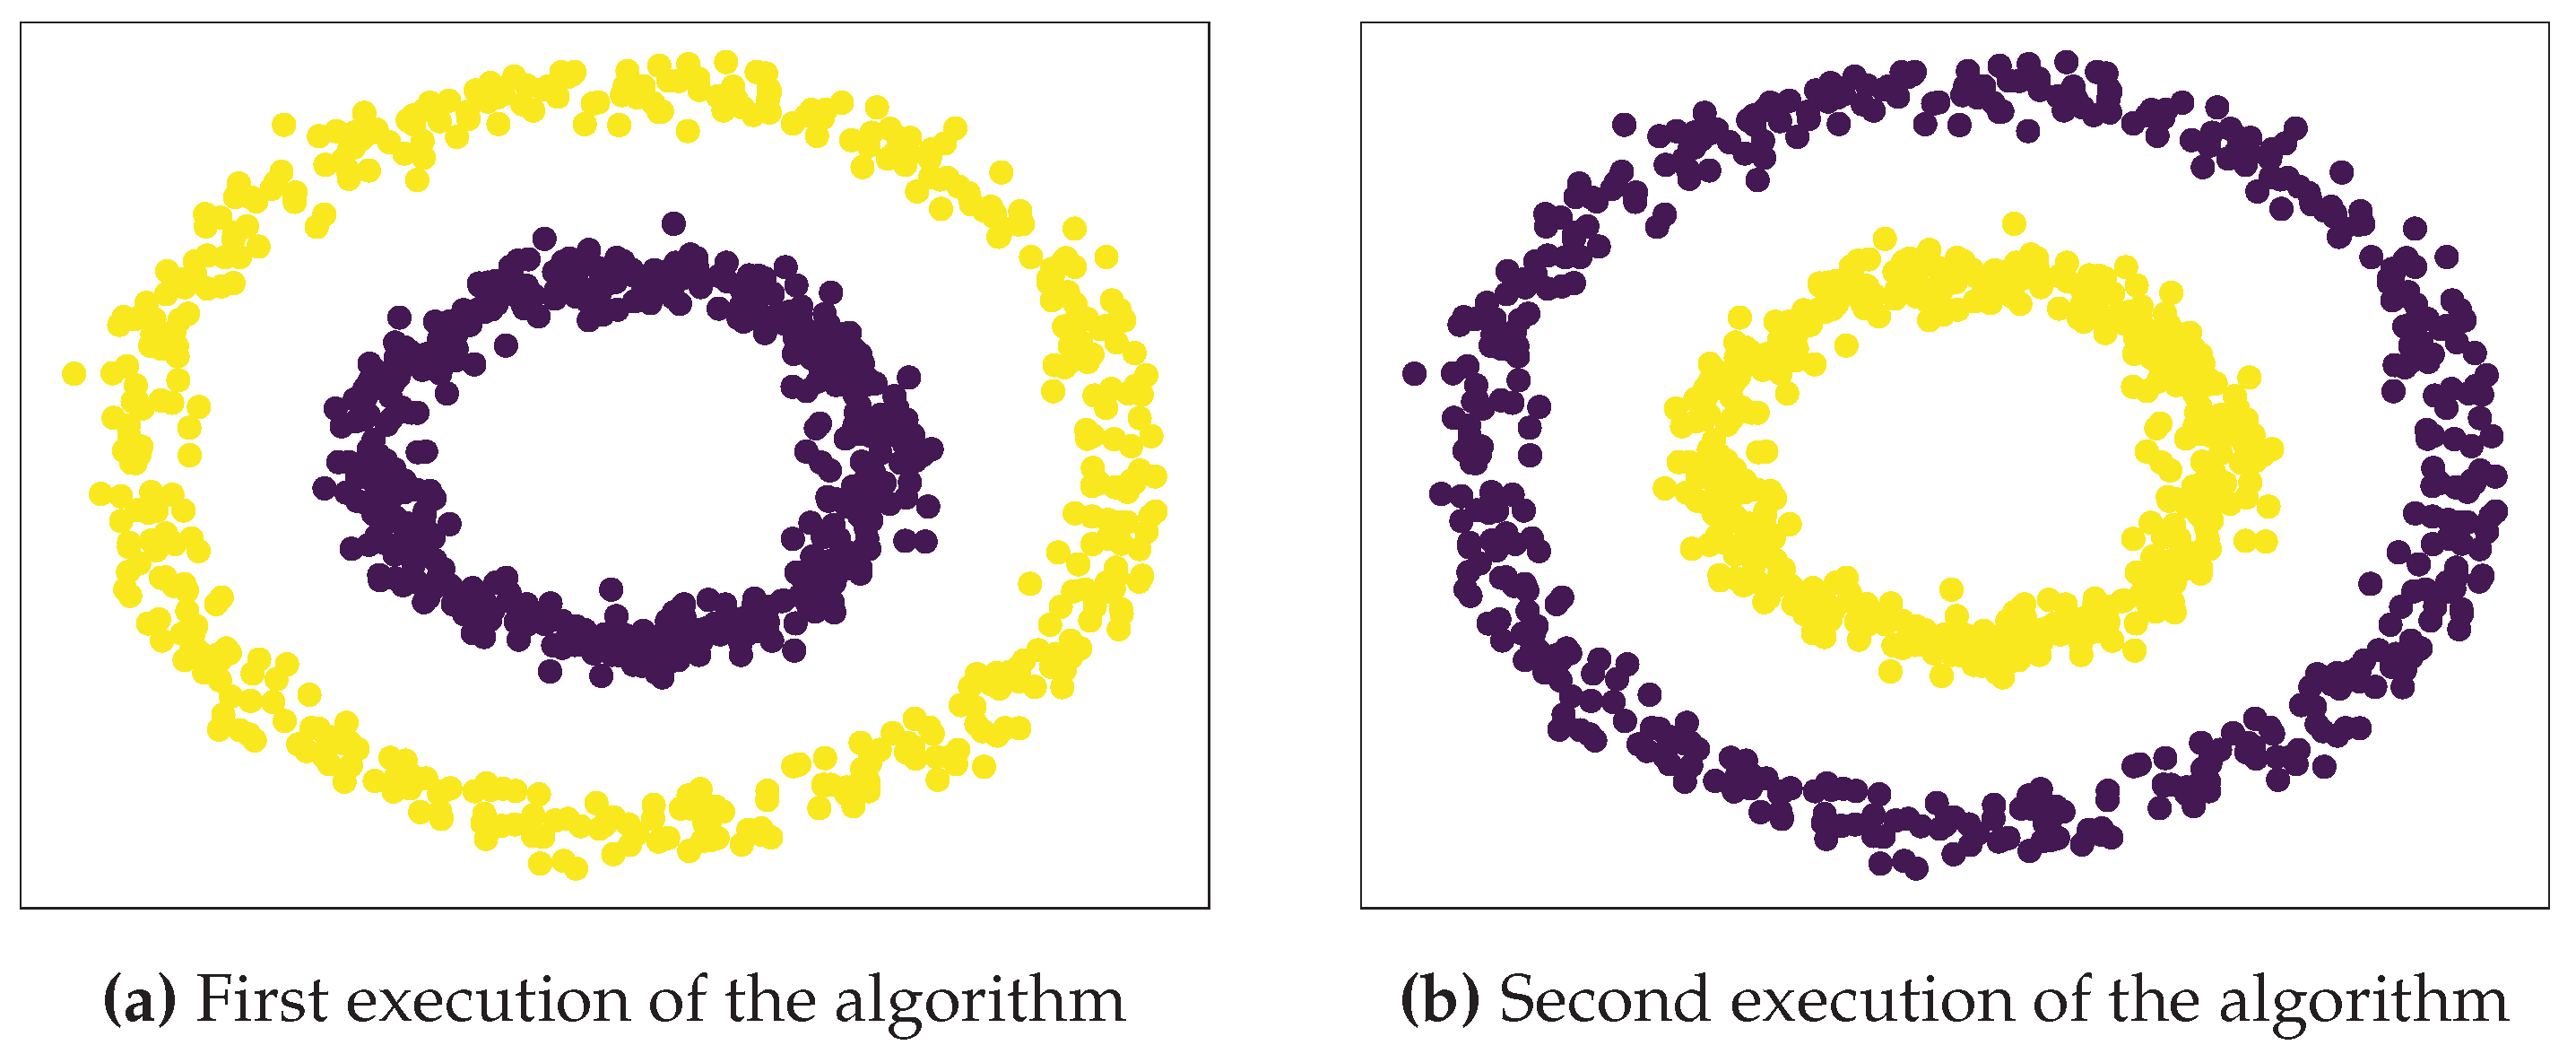
Figure 4.
Spectral clustering algorithm with demapping step.
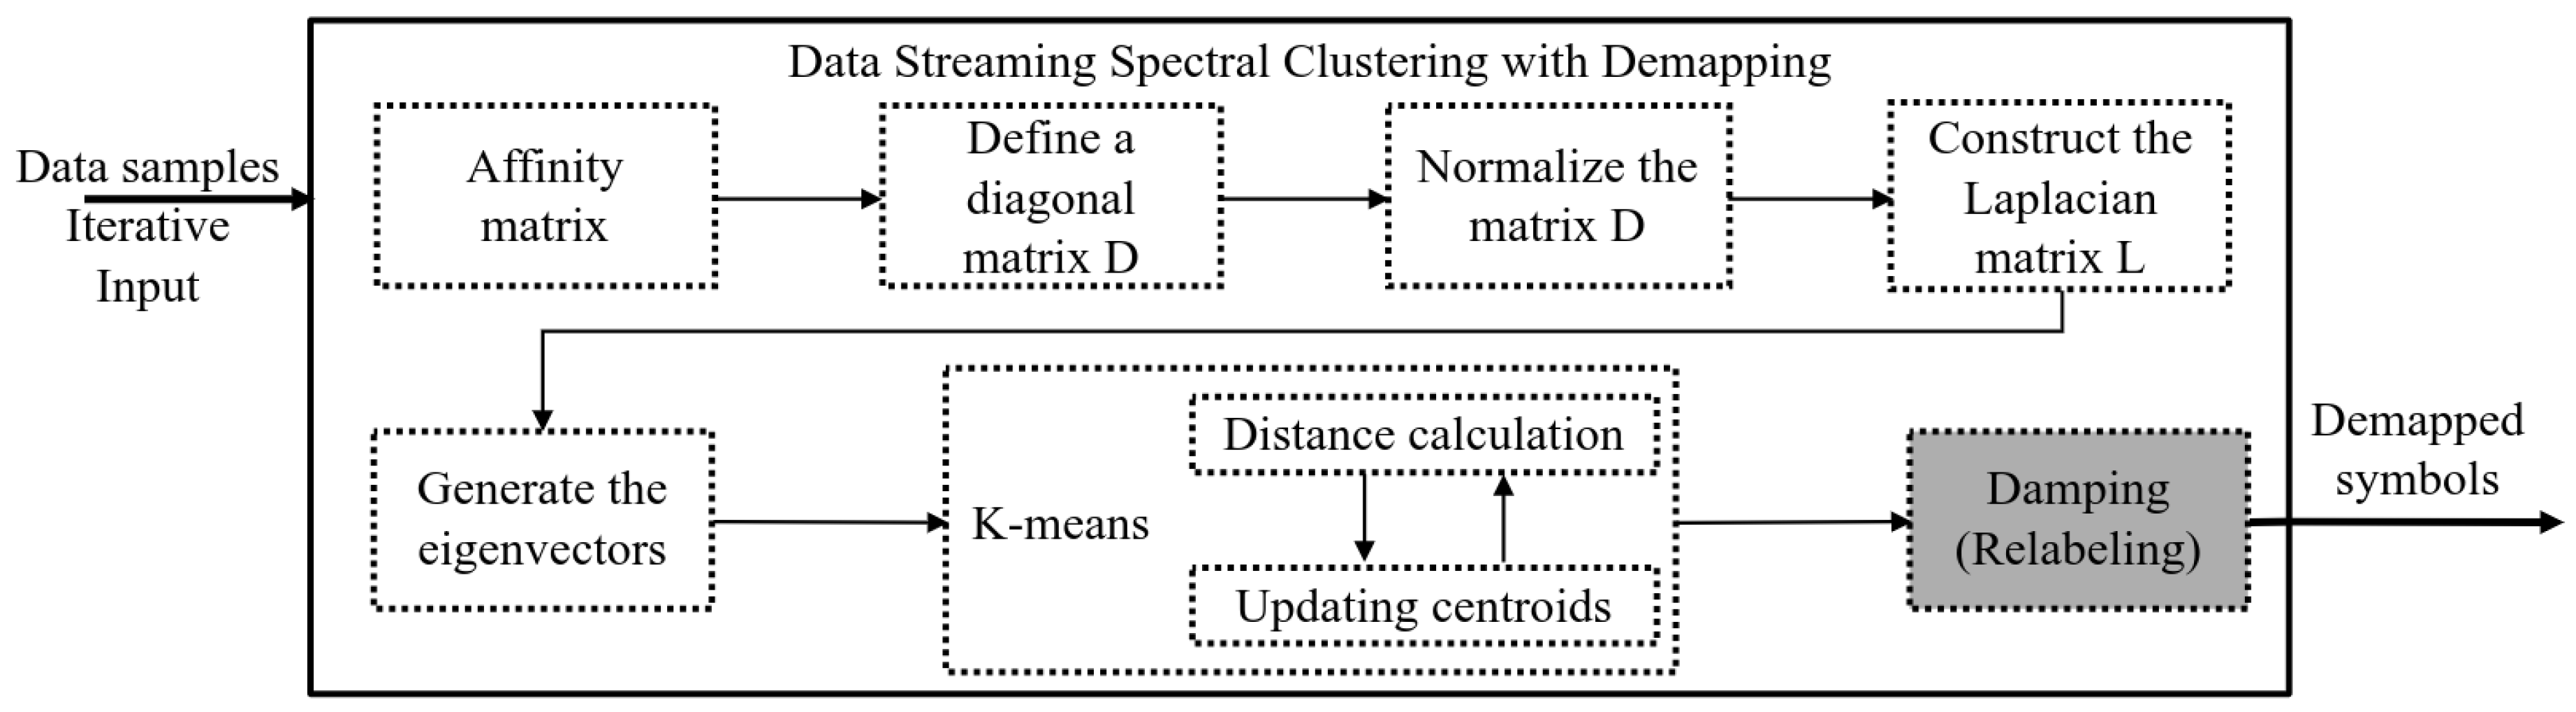
Figure 5.
Relabelling data for demapping. (a) Mapping for 16QAM constellation. (b) Constellation 16QAM with noise. (c) Demapping of 16QAM constellation.
Figure 5.
Relabelling data for demapping. (a) Mapping for 16QAM constellation. (b) Constellation 16QAM with noise. (c) Demapping of 16QAM constellation.
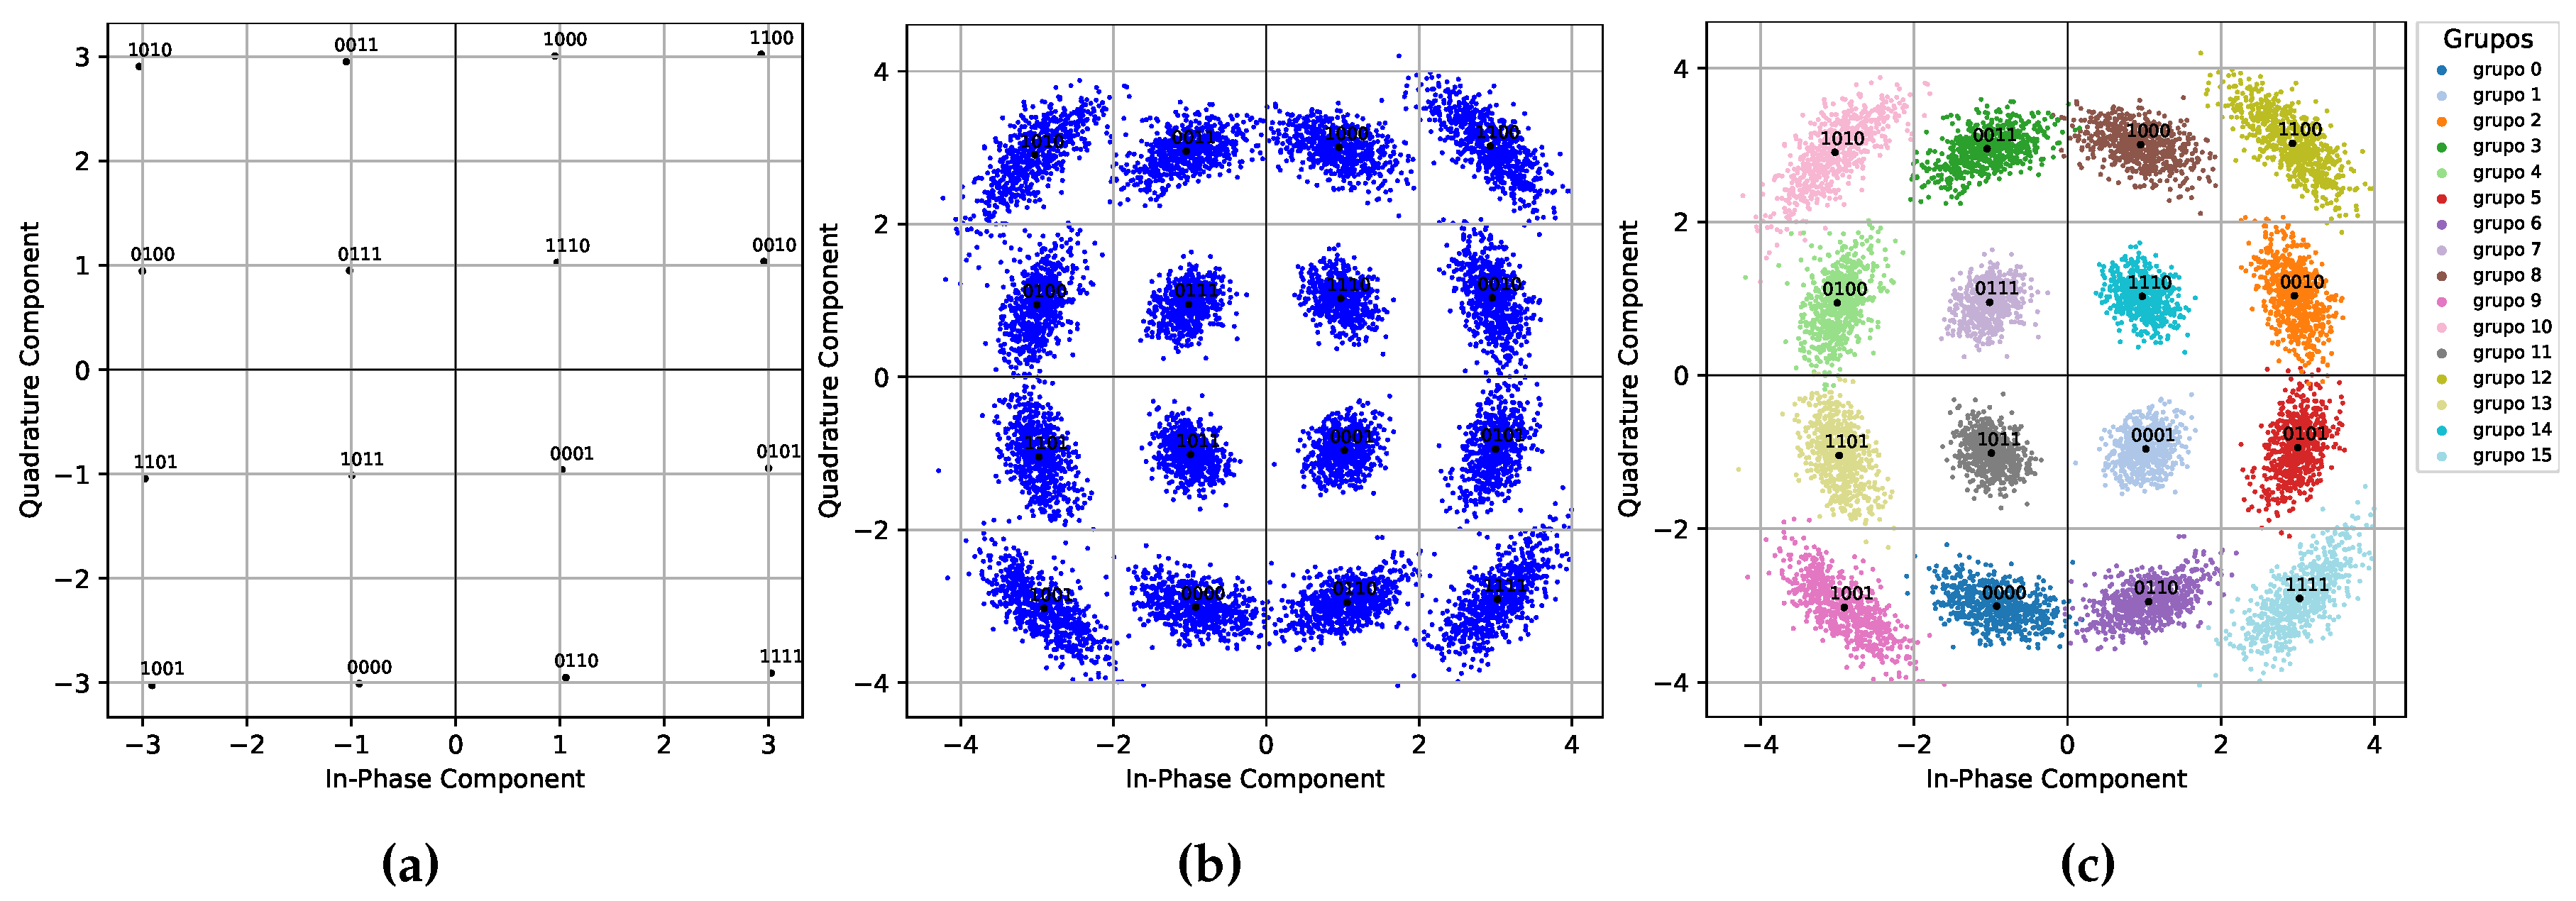
Figure 6.
SNR vs BER performance of spectral clustering and k-means algorithms for 16 QAM.
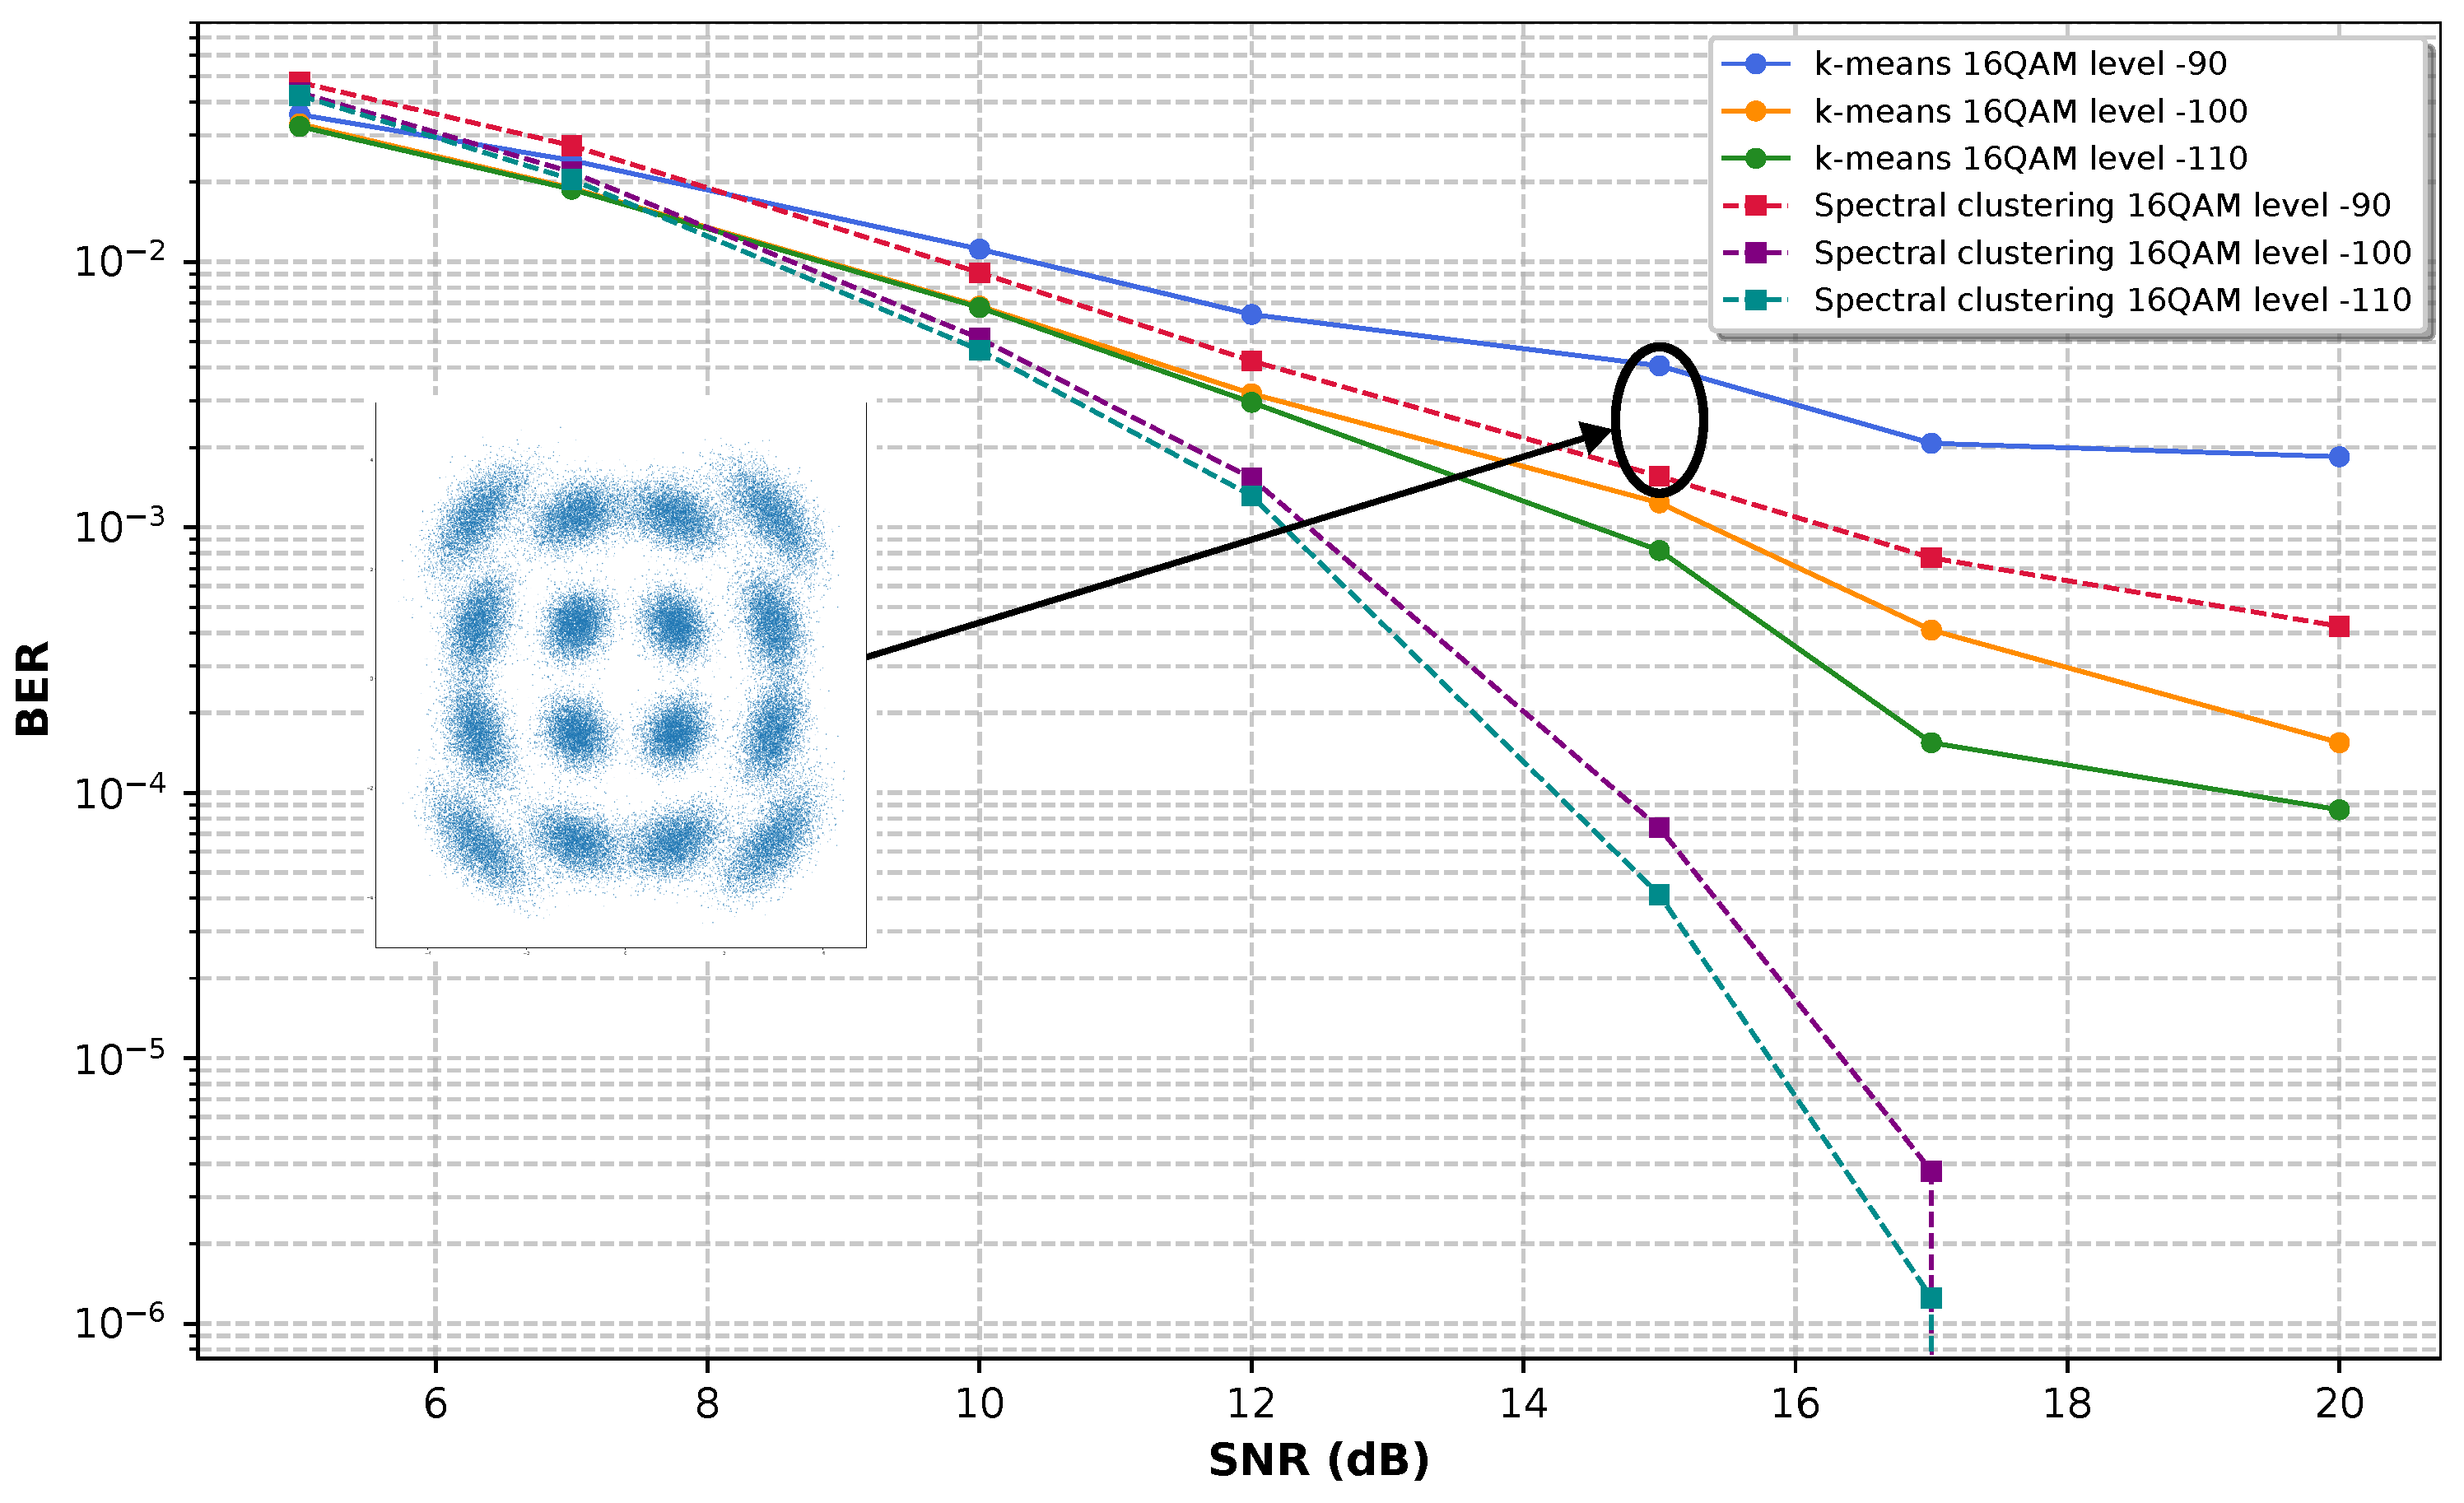
Figure 7.
SNR vs BER performance of spectral clustering and k-means algorithms for 32 QAM.
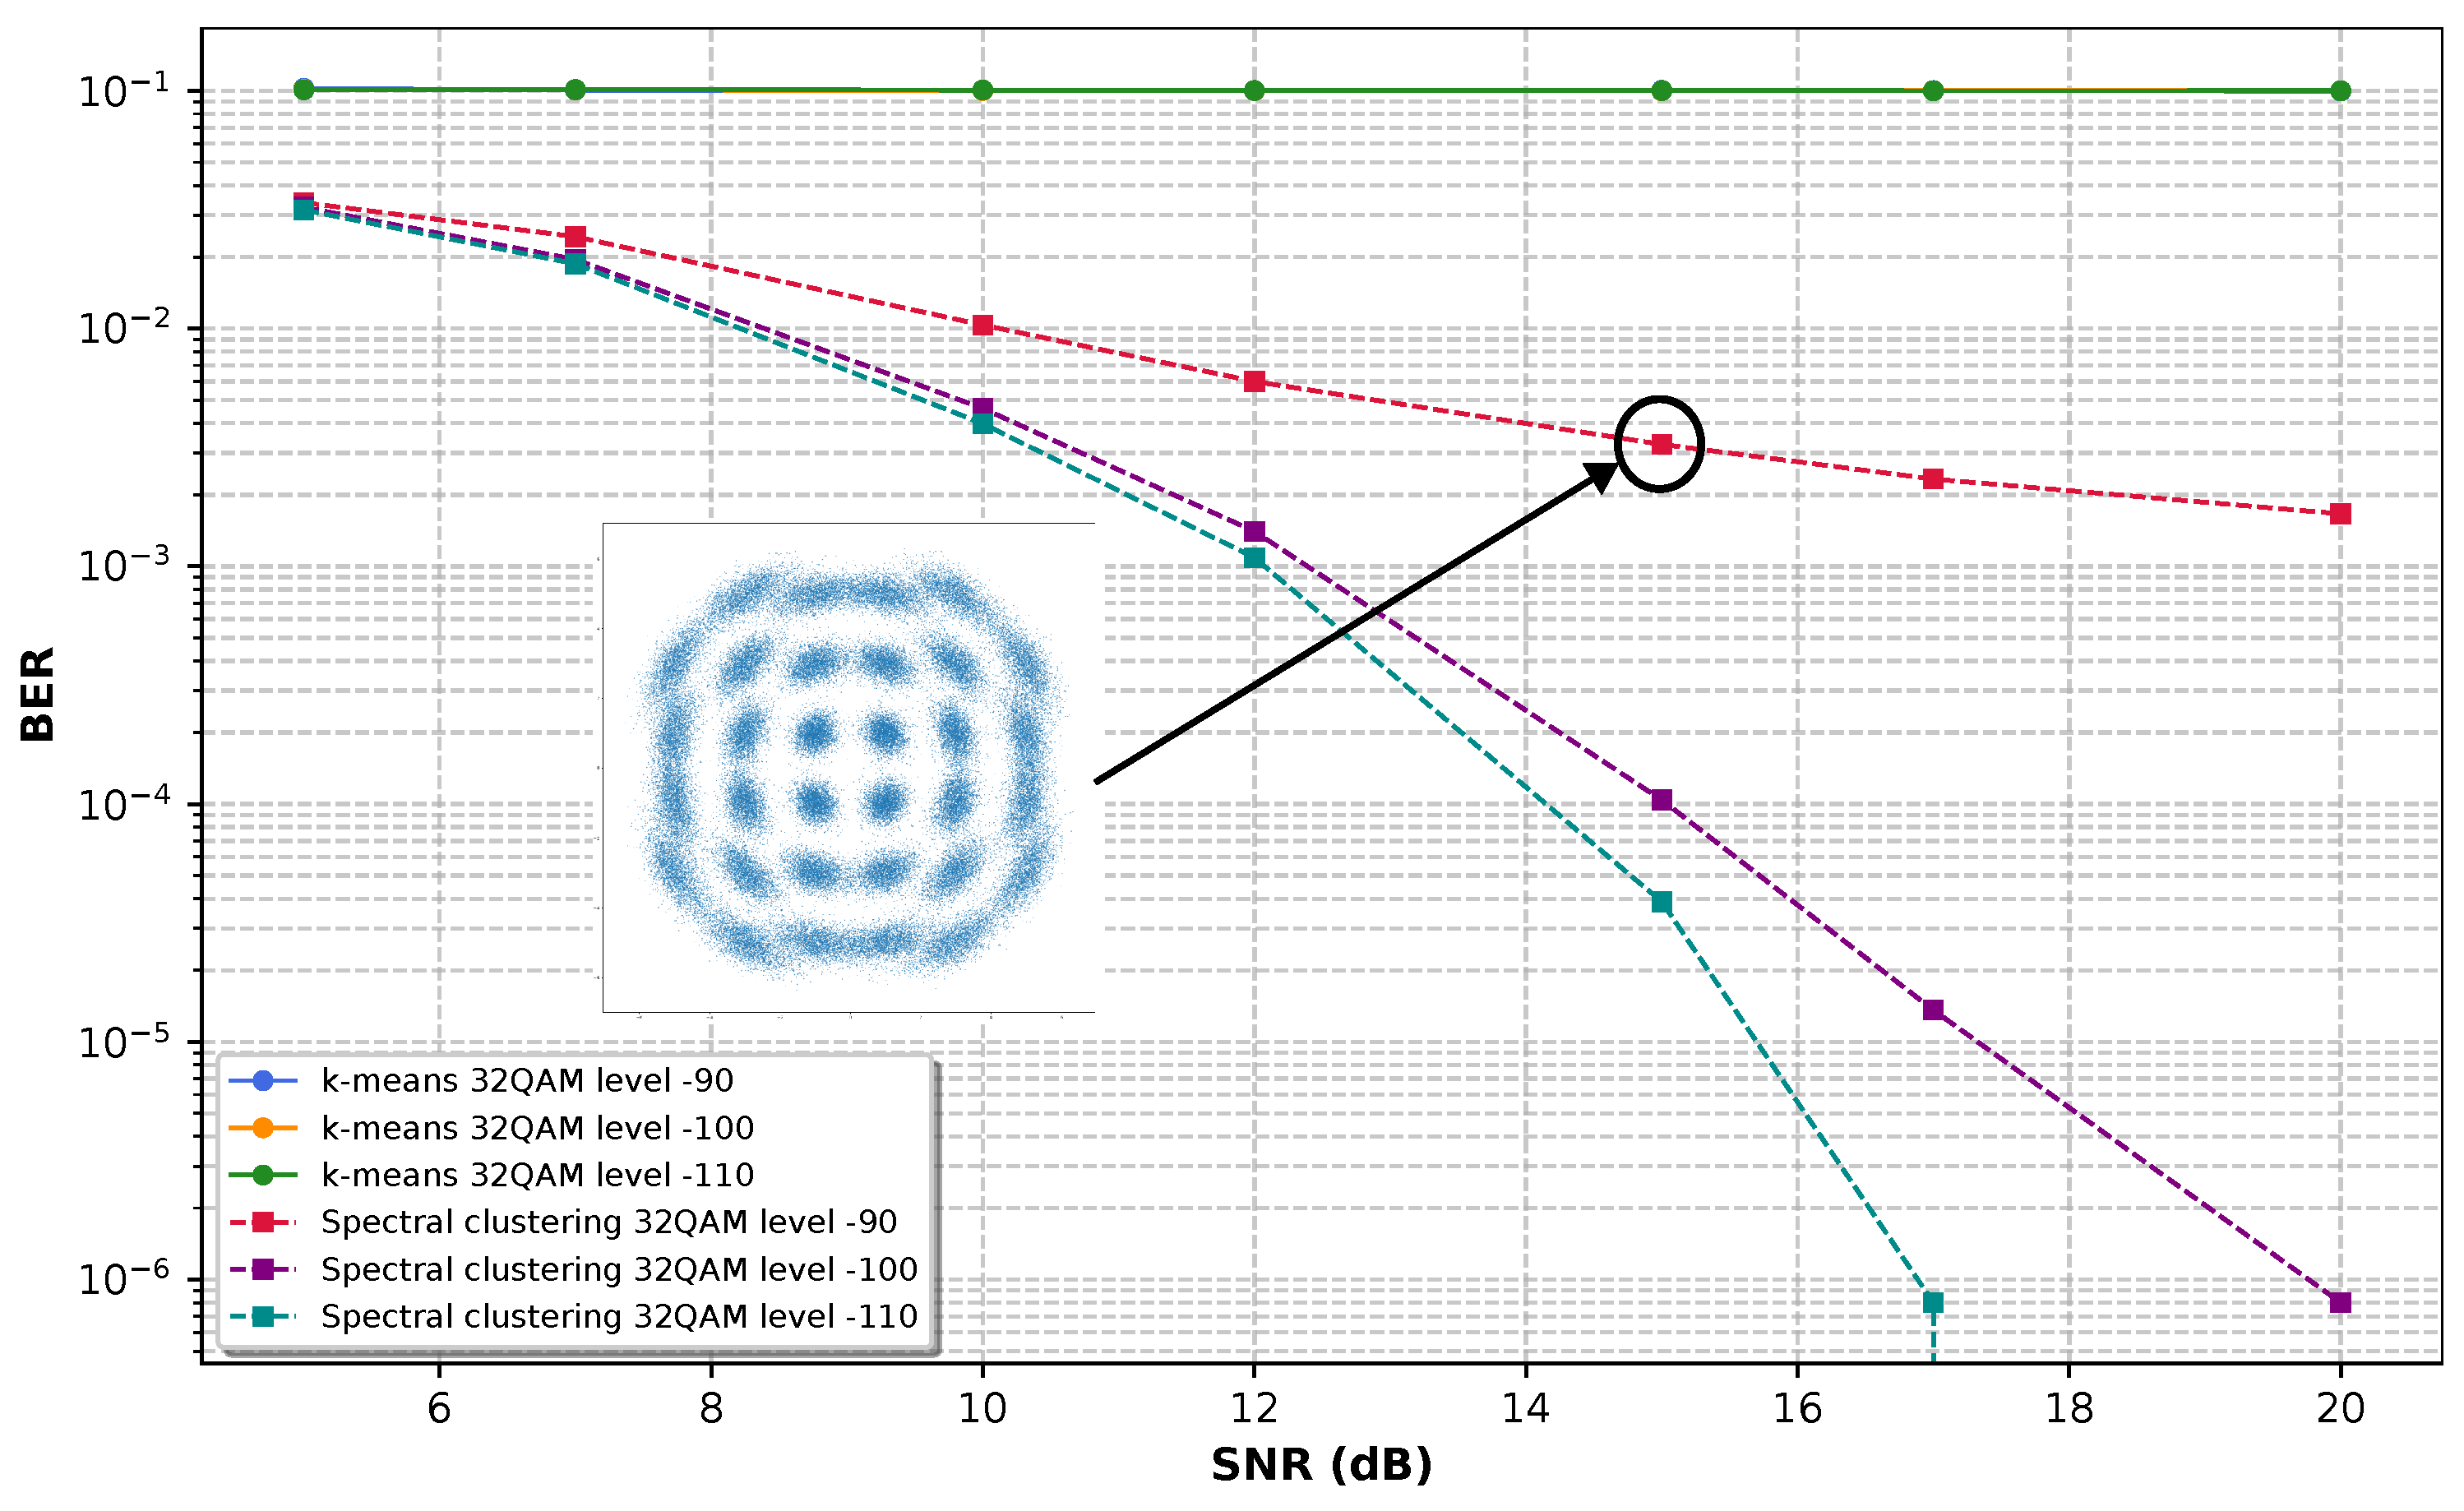
Figure 8.
SNR vs BER performance of spectral clustering and k-means algorithms for 64 QAM.
Disclaimer/Publisher’s Note: The statements, opinions and data contained in all publications are solely those of the individual author(s) and contributor(s) and not of MDPI and/or the editor(s). MDPI and/or the editor(s) disclaim responsibility for any injury to people or property resulting from any ideas, methods, instructions or products referred to in the content. |
© 2024 by the authors. Licensee MDPI, Basel, Switzerland. This article is an open access article distributed under the terms and conditions of the Creative Commons Attribution (CC BY) license (http://creativecommons.org/licenses/by/4.0/).
Copyright: This open access article is published under a Creative Commons CC BY 4.0 license, which permit the free download, distribution, and reuse, provided that the author and preprint are cited in any reuse.


