Preprint
Article

EcoFloras Elucidate Insights from Biodiversity Data: Evaluating the Strengths and Limitations of iNaturalist Observations and Herbarium Specimens

Altmetrics

Downloads

87

Views

55

Comments

0

Submitted:

30 September 2024

Posted:

01 October 2024

You are already at the latest version

Alerts
Abstract
The EcoFlora Project was launched at the New York Botanical Garden and expanded to other botanical gardens across the United States to enhance our understanding of urban plant biodiversity through community science iNaturalist observations. This study evaluates the strengths and limitations of using iNaturalist observations and herbarium specimen records in biodiversity research, demonstrating their complementary roles. iNaturalist engages community scientists and provides real-time data but may suffer from biases and inconsistent identification accuracy. Conversely, herbarium specimens offer verified, historical records but require significant resources for collection and upkeep. Through case studies in five U.S. metro areas, EcoFloras highlight the effectiveness of combining these data sources for comprehensive biodiversity assessments. The project reveals how leveraging both digital tools and traditional specimen collections can provide a more complete picture of biodiversity, informing conservation strategies and biodiversity management. Integrating community science with established scientific methods fosters greater public involvement in conservation and offers a robust framework for addressing biodiversity challenges. Rigorous data cleaning is essential, and future efforts should focus on linking both data sources to enhance plant conservation strategies. By leveraging the strengths of both iNaturalist and herbarium data, researchers can greatly enhance the effectiveness of conservation strategies.
Keywords: 
Subject: Biology and Life Sciences  -   Ecology, Evolution, Behavior and Systematics

1. Introduction

In a time of unprecedented global biodiversity crisis, it is critical now more than ever to understand which species are most at risk of extirpation or extinction and which areas are of highest conservation priority [1,2,3,4,5]. To conduct an objective assessment of this information, it is essential to establish a baseline of biodiversity, defined as the inventory of species present within a specific area. This baseline then serves as a reference point, enabling the monitoring and analysis of changes in landscape composition or species populations over time [6,7,8]. Two types of data can be used to assess biodiversity: 1) observational (e.g., a photograph with accompanying geolocation information), or 2) a physical specimen collected and stored in a museum or herbarium. Locality and collection/observation date information add value to specimens or observations by placing them at a specific locality at a specific moment in time. In this way, both physical specimens and photographic observations are in essence snapshots in time, representing what organisms were at a specific place on a specific date.
It has become easy to create observational data thanks to the easy-to-use app, iNaturalist, and the prevalence of smartphone devices with location enabled. iNaturalist provides a platform for anyone, including community scientists, to record observations of any species anywhere on the globe [9,10,11]. Users download the iNaturalist app onto a smartphone device, with location enabled so that accurate latitude and longitude is captured with the metadata of the photograph, and then simply photograph any species. This photograph, along with the accompanying geodata embedded in the picture and user contributed information, is then uploaded to iNaturalist via the app by the user. Observations uploaded to the iNaturalist platform are community curated, with identifications made by other observers and taxonomic experts. Once two users agree on the identification to species level, the observation is classified as “Research Grade” and the observation along with corresponding metadata are made available on the Global Biodiversity Information Facility (GBIF; http://www.gbif.org) portal for any user to access.
Herbarium specimens are pressed, dried plants that are mounted on paper, and then preserved and stored in herbaria or museums [12]. These libraries of curated, preserved plants and their associated data serve as repositories of plant occurrence records. Herbarium specimens are invaluable as taxonomic references, tangible documentation of plant occurrence and distribution, records of plant habitats and growth habits, and materials for analytical study [13,14]. Unlike a photographic observation, these physical specimens can also be used for a variety of studies including DNA sequencing, closer inspection via microscopy, phenological changes and isotopic analysis to elucidate historical environmental conditions over time [6,15,16,17,18,19,20,21,22]. The label on an herbarium specimen provides valuable information such as the date and location of each collection. Thus, each herbarium specimen with this information can be georeferenced to a specific locality, although sometimes with a high level of uncertainty if the location information is vague [23,24,25].
Despite the value of herbarium specimens, there are limitations to collecting them, in particular by community scientists. Collections of physical specimens require special equipment (e.g., press, archival mounting paper and glue), permits for each collection area which can be difficult to obtain, and a secure place to house specimens to prevent damage. Alternatively, iNaturalist observations are easy for community scientists to make. The observation of a plant does not require any special equipment other than a smartphone device or digital camera, and no permits are required to take photographs. Therefore, iNaturalist observations are a much easier way for community scientists to contribute biodiversity data. With over 83 million observations as of August 2024, plants are the most commonly observed groups of organisms on iNaturalist, making up approximately 40% of all observations on the platform. Herbarium specimens are also one of the most prolific types of preserved collection, with an estimated 397.6 million plant specimens worldwide [26]. Therefore, a wealth of observational and herbarium specimen data exists for plant biodiversity analyses.
Urban areas face several biodiversity challenges, including rapid development, invasive species, heavy use of outdoor spaces, and compounded climate change impacts [27,28,29]. In addition, urban biodiversity is often understudied, especially when it comes to plant life. The EcoFlora Project originated at New York Botanical Garden. After funding from the Institute of Museum and Library Services was secured, the project expanded to four other gardens across the United States: Chicago Botanic Garden (Chicago, IL), Desert Botanical Garden (Phoenix, AZ), Denver Botanic Gardens (Denver, CO), and Marie Selby Botanical Gardens (Sarasota, FL; Figure 1). The EcoFloras of North America Project recruited, engaged, and supported community scientists, encouraging them to discover and document urban biodiversity in their respective metro areas using the iNaturalist app [30]. Another goal of the EcoFlora Project was to create a checklist of floral biodiversity for each Gardens’ metro area. These checklists, created using thousands of iNaturalist observations coupled with herbarium specimen records, are available through a Symbiota portal designed specifically for the EcoFlora Project (http://www.ecofloras.com).
In the process of building the Symbiota portal and implementing the EcoFlora Project in each metro area, we identified several advantages and pitfalls to using community scientist-gathered observational data versus herbarium specimen data. Examination of iNaturalist project and herbarium specimen data revealed several interesting trends, which we distilled to the following categories: 1) Rare plant wrangling, 2) Finding hay in a haystack, 3) Pokey plant problems, 4) Emerging invasives, 5) Cultivated curation, and 6) Tiny feature phenomenon. By sharing these examples, we hope to provide valuable insight for anyone seeking to use either herbarium specimen or observational data in their own research or project.
Objectives:
(1)
Investigate the impact of various iNaturalist user types on the quality and distribution of observations.
(2)
Evaluate the effectiveness of integrating iNaturalist observations and herbarium specimen data in biodiversity research.
(3)
Identify the challenges and limitations associated with both data sources, including issues of data quality and identification accuracy.

2. Materials and Methods

2.1. EcoFlora iNaturalist Projects

Each Garden was empowered to create an iNaturalist project in a way that aligned with the goals of their institution. Therefore, collection projects were created on iNaturalist for each metro area for this manuscript if the iNaturalist project for the respective Garden was a traditional project requiring users to upload their observations. A collection project will automatically include observations that fit certain criteria, as they are uploaded to the site. For each EcoFlora collection project, the following criteria were specified: 1) observed within the given boundary and 2) a member of the plant kingdom. EcoFlora Project personnel from each respective metro area selected taxa which were representative of each of the five selected categories.

2.2. Herbarium Specimen Data

Herbarium specimen data was obtained from the Southwest Environmental Information Network (SEINet; http://swbiodiversity.org) using the “Map Search” feature. Under the “Map Search” feature, a polygon representing the boundary of each EcoFlora project was drawn around each metro area. Specimens of each taxon from each metro area for each of the five categories were then downloaded as a csv file. The resulting specimen data was then cleaned to remove: 1) duplicate specimens and 2) specimens with ambiguous or vague localities. Herbarium specimen data were then divided into collections made pre-2000 and those made post-2000.
For the tiny feature phenomenon, we determined the number of unique taxa for each respective flowering plant family also by using the “Map Search” feature on SEINet. Within the boundary of each EcoFlora Project, we searched for all Cyperaceae or Poaceae collections. In the search results, we then clicked on the “Species List” tab and selected “ITIS thesaurus” from the dropdown taxonomic filter. We then removed taxa that were only identified to genus or taxa that were essentially duplicates (e.g., Eleocharis compressa and Eleocharis compressa var. compressa reference the same taxa and thus one was removed). We repeated this process for each respective EcoFlora project’s boundary.

2.3. iNaturalist Data

For each EcoFlora Project, iNaturalist observations of all representative taxa for analysis were downloaded on February 28, 2023 from the iNaturalist online platform. This date also coincided with the conclusion of the joint Ecoflora Project effort. As personnel from each respective garden were not actively curating observations on the iNaturalist platform after the conclusion of the project, we did not include observations uploaded after this date.
Observations of species used for each category were examined by curators of all projects to make as many of the observations as possible “Research Grade.” iNaturalist observations have three categories: 1) “Casual,” 2) “Needs ID,” and 3) “Research Grade.” “Casual” observations are those of cultivated, or not wild, organisms. These observations will never be “Research Grade.” “Needs ID” observations are those which require further identifications to species to make them “Research Grade.” For an iNaturalist observation to become “Research Grade,” it must be verified by ⅔ majority of users. Observations downloaded from iNaturalist for the examples presented here were of “Research Grade” quality. Some observations could not be made “Research Grade” because of blurry photos or a lack of morphological features necessary to achieve an accurate identification. Additionally, rare plant species that were determined to be part of cultivation (e.g., grown at Denver Botanic Gardens) were marked as non-wild, thus labeling these observations as “Casual.” Casual observations were not included in any statistical analyses except for the cultivated curation example.
For the tiny feature phenomenon example, we determined the number of unique taxa for each respective flowering plant family by searching for all Cyperaceae or Poaceae on the iNaturalist project for each respective EcoFlora. Then, we clicked on the “Species” tab to see the number of unique taxa. We then filtered the results for “Research Grade” observations. These observations were then downloaded as csv files. iNaturalist and herbarium specimen data were plotted using ArcGIS online. Statistical analyses and corresponding charts were created in Microsoft Excel. All photographs of plant species were obtained from iNaturalist with permission from the photographer to use them in this publication.

2.4. Rare and Introduced Statuses

Plant species were determined to be rare if they were: 1) listed as Threatened or Endangered by the U.S. Fish and Wildlife Service or 2) had a state imperilment rank of Critically Imperiled (S1), Imperiled (S2), or Vulnerable (S3) on NatureServe (https://explorer.natureserve.org/). Plant species were determined to be introduced if they were designated as such by Plants of the World Online (https://powo.science.kew.org/). For the cultivated curation example, observations were closely examined for habitat and location to determine if they were planted. If an observation was made in a garden, landscape planting, or park, it was determined to be not wild. We marked all iNaturalist observations that were planted as not wild so that they became “Casual.”

3. Results

3.1. iNaturalist Observations - “Research Grade” Insights

While curating iNaturalist observations for the EcoFlora Project, we noticed some disconcerting trends that should be taken into account when using “Research Grade” observations. First, just because an observation is “Research Grade” does not necessarily mean that it is identified correctly [31]. Observations may be designated as “Research Grade" by users that are not familiar with the taxonomy or identification of the species in question [9]. These observations may become “Research Grade” but be misidentified. Second, some users are over-eager to make observations “Research Grade” without making sure that the identification suggested is correct. If an identification is suggested by the app or another user and simply agreed with without verifying the ID, then these observations are more difficult to identify later to the correct species. New York Botanical Garden noted that one user in particular was so eager to make observations “Research Grade” that many observations became misidentified in the process.
Second, misidentifications leading to “Research Grade” status can cause significant downstream issues. For example, once an observation has become “Research Grade,” it is more difficult to overturn the identification. “Research Grade” requires that an observation have a ⅔ majority of identifiers in agreement. One extreme example of this phenomenon is an observation of Felis catus named Gerald the cat. Although not part of the EcoFlora Project, this observation has a good lesson that can be applied to all iNaturalist data. The Felis catus iNaturalist observation was made as part of a class project during the 2020 COVID-19 pandemic (https://www.inaturalist.org/observations/43603445). This class project assigned students to not only take observations but also to verify other student’s observations, thus making them “Research Grade.” Unfortunately, one student posted an observation of a domestic cat, Felis catus, but incorrectly identified it as a hybrid of a domestic cat with that of an African wild cat (Felis silvestris). As this was the first observation other students saw when they went to verify observations, an additional 25 students agreed with this identification of Felis catus × silvestris. In the end, it took an additional 81 iNaturalist users to identify it to Felis catus before the correct name was applied to the observation.
Third, look-alike species can confound iNaturalist “Research Grade” identifications. To the untrained eye, these look-alike species can be difficult to distinguish, and difficult for the iNaturalist app to tell apart as well. For example, observations of Ericameria nauseosa (Pursh) G.L.Nesom & G.I.Baird from the Denver metro area are often misidentified as Chrysothamnus viscidiflorus Nutt. on iNaturalist as both are yellow-flowered members of the Asteraceae family with a shrub-like habit. Recognition of any potential look-alikes and thorough vetting of these identifications as well would thus be useful for obtaining the most thorough set of observations for targeted species.
Therefore, when using iNaturalist observations in data analyses, it is important to examine the “Research Grade” observations closely, in particular to look for any outliers to the main range of the species. These could be misidentifications which could skew downstream results. Closely examining individual observations that fall outside of the primary range distribution of a taxon is therefore recommended prior to blindly using all “Research Grade” observations. In addition, it is beneficial to be familiar with the taxonomic and regional experts that are likely to be submitting identifications on iNaturalist as these can be relied on for a higher level of accuracy.

3.2. iNaturalist User Types

On the iNaturalist platform, there are a variety of different users contributing to observations. As curators of EcoFlora iNaturalist Projects, we noticed that users typically fell into one of four categories: 1) Influencer, 2) Collector, 3) Professional, and 4) Casual, with some crossover between collector, professional, and influencer (Table 1).
Understanding iNaturalist user types is important when evaluating iNaturalist observations for several reasons. First, different users contribute to iNaturalist with varying levels of expertise and interest. Knowing the type of user (e.g., influencer, casual observer, or professional) can help assess the reliability of the data they contribute. For example, professional users often provide more accurate identifications and higher-quality observations. Second, different user types contribute to iNaturalist observations in different ways. For example, professionals might focus on rare or difficult-to-identify species, while casual users might document only a few common species. Third, users such as professionals or collectors might introduce bias in observations by focusing on particular taxa or regions. Recognizing this can help in identifying gaps in data coverage and addressing potential biases in the data.
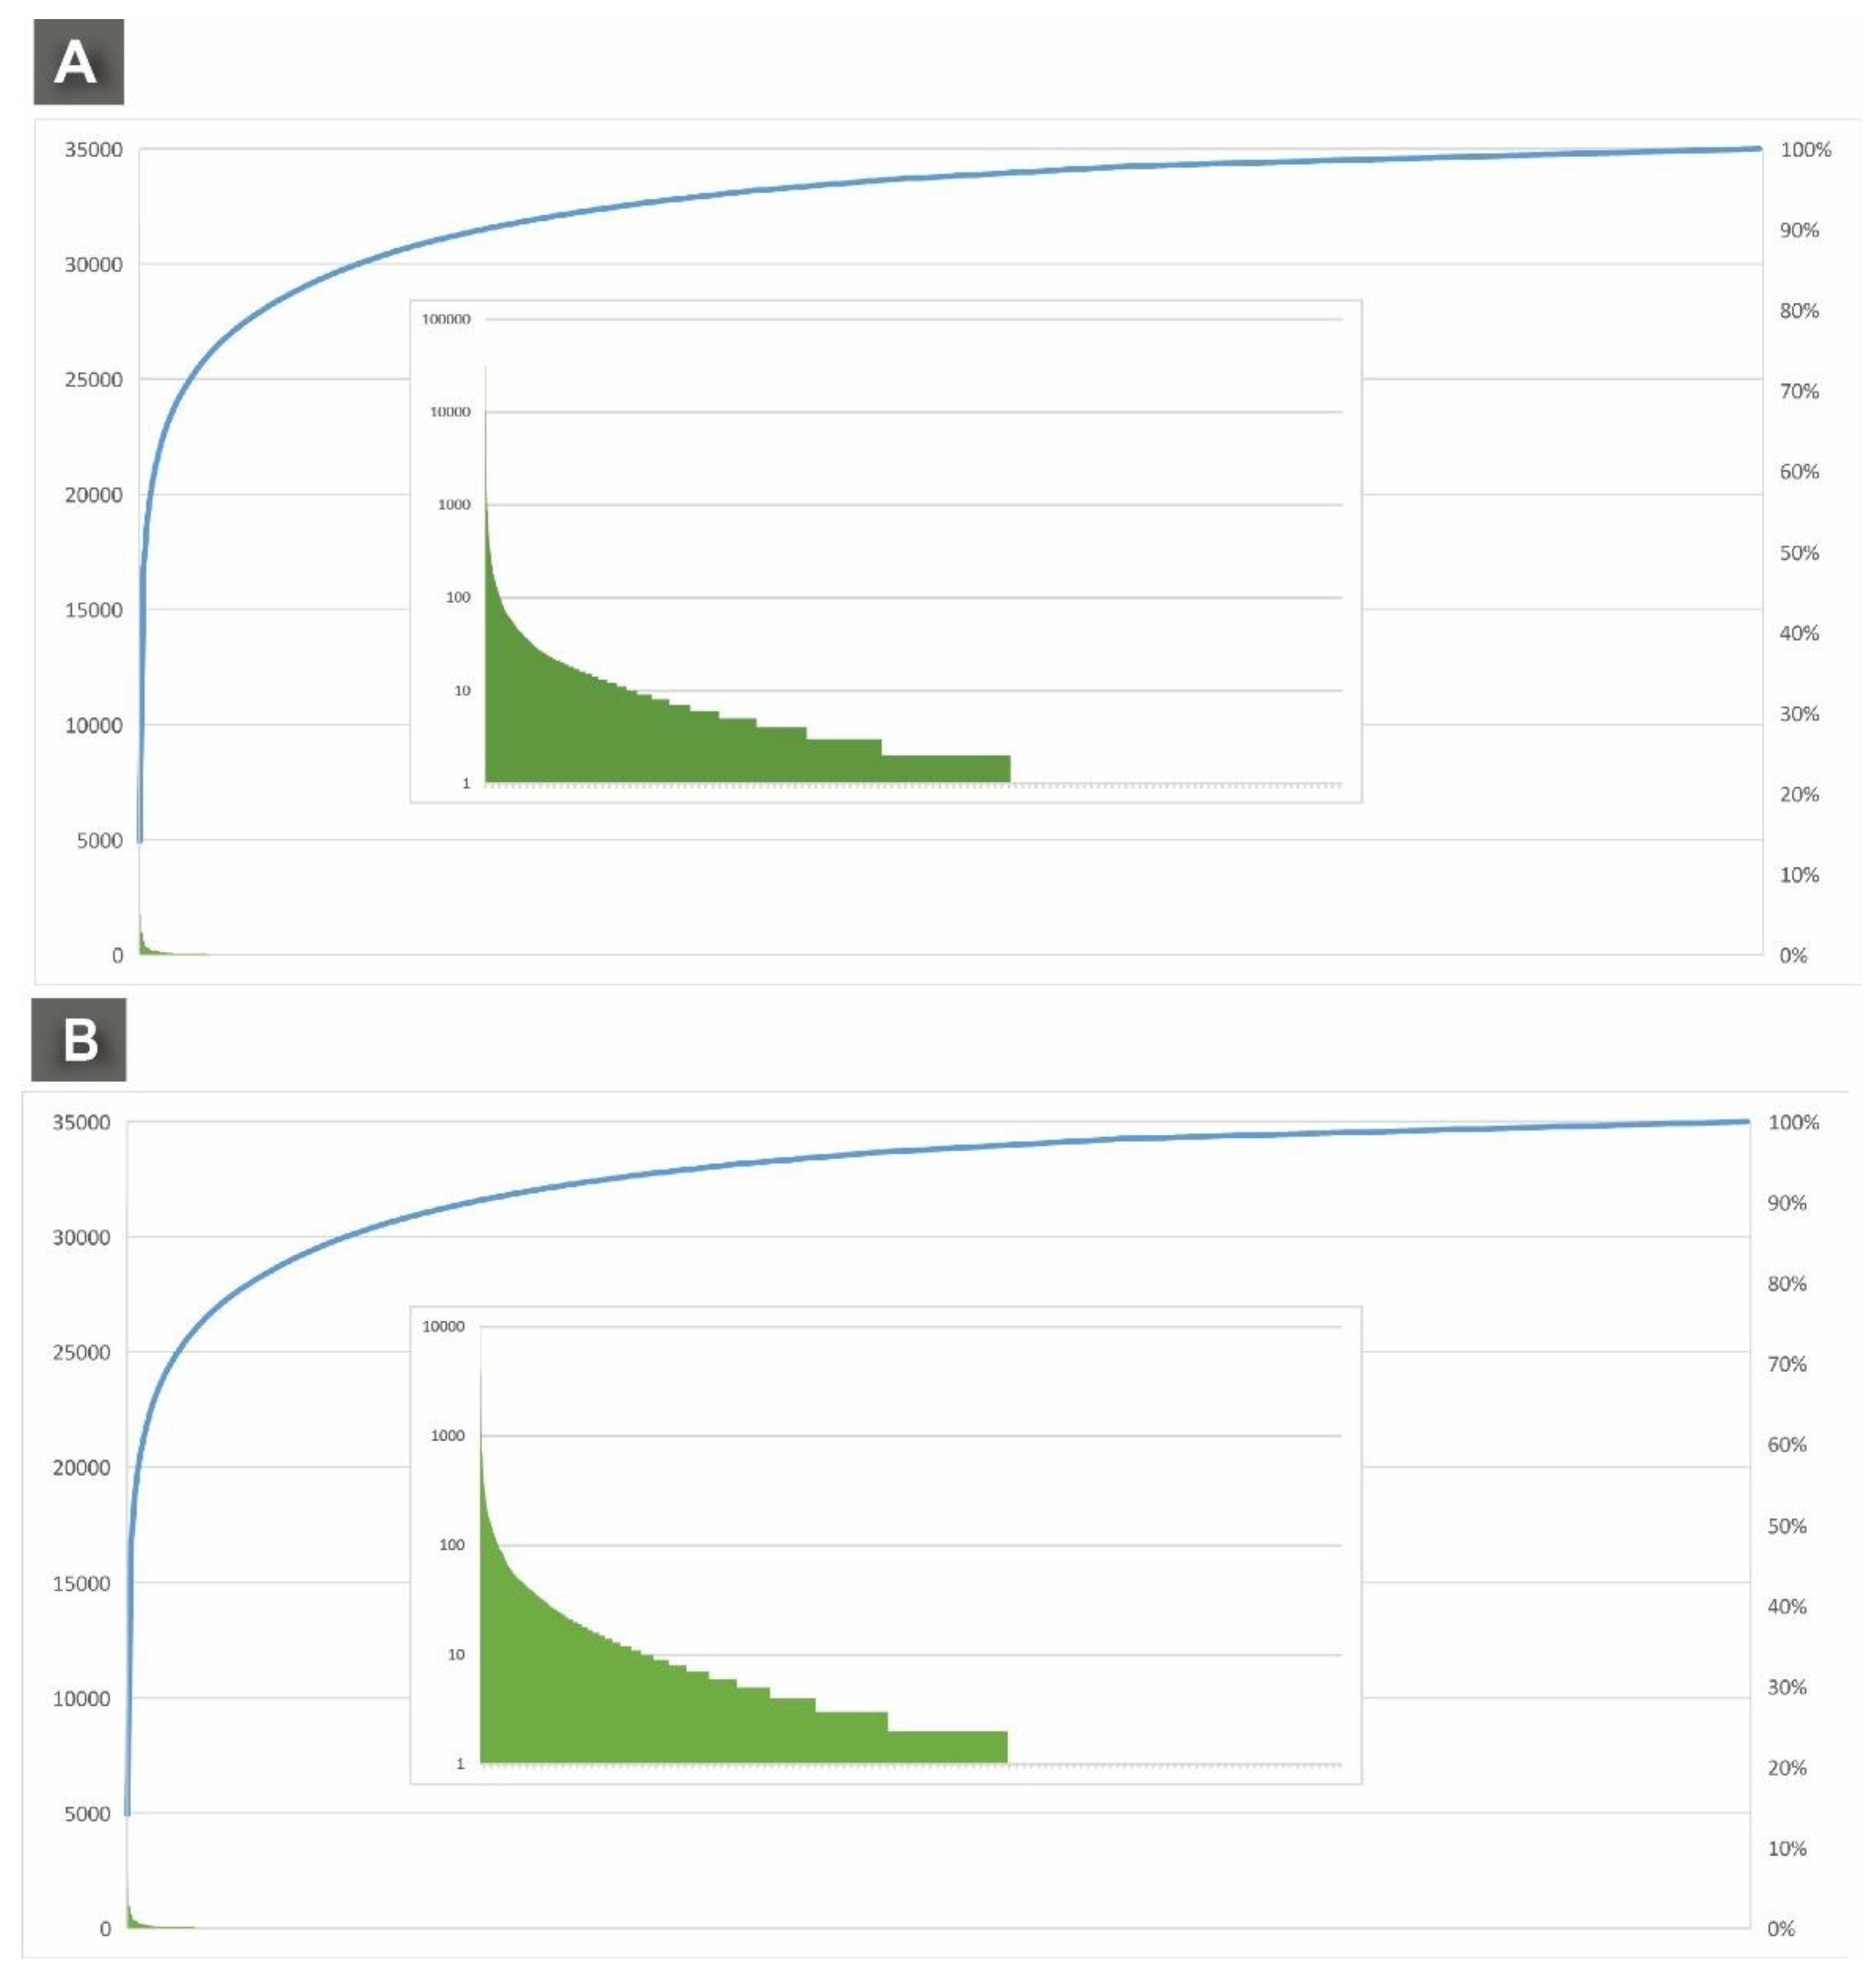
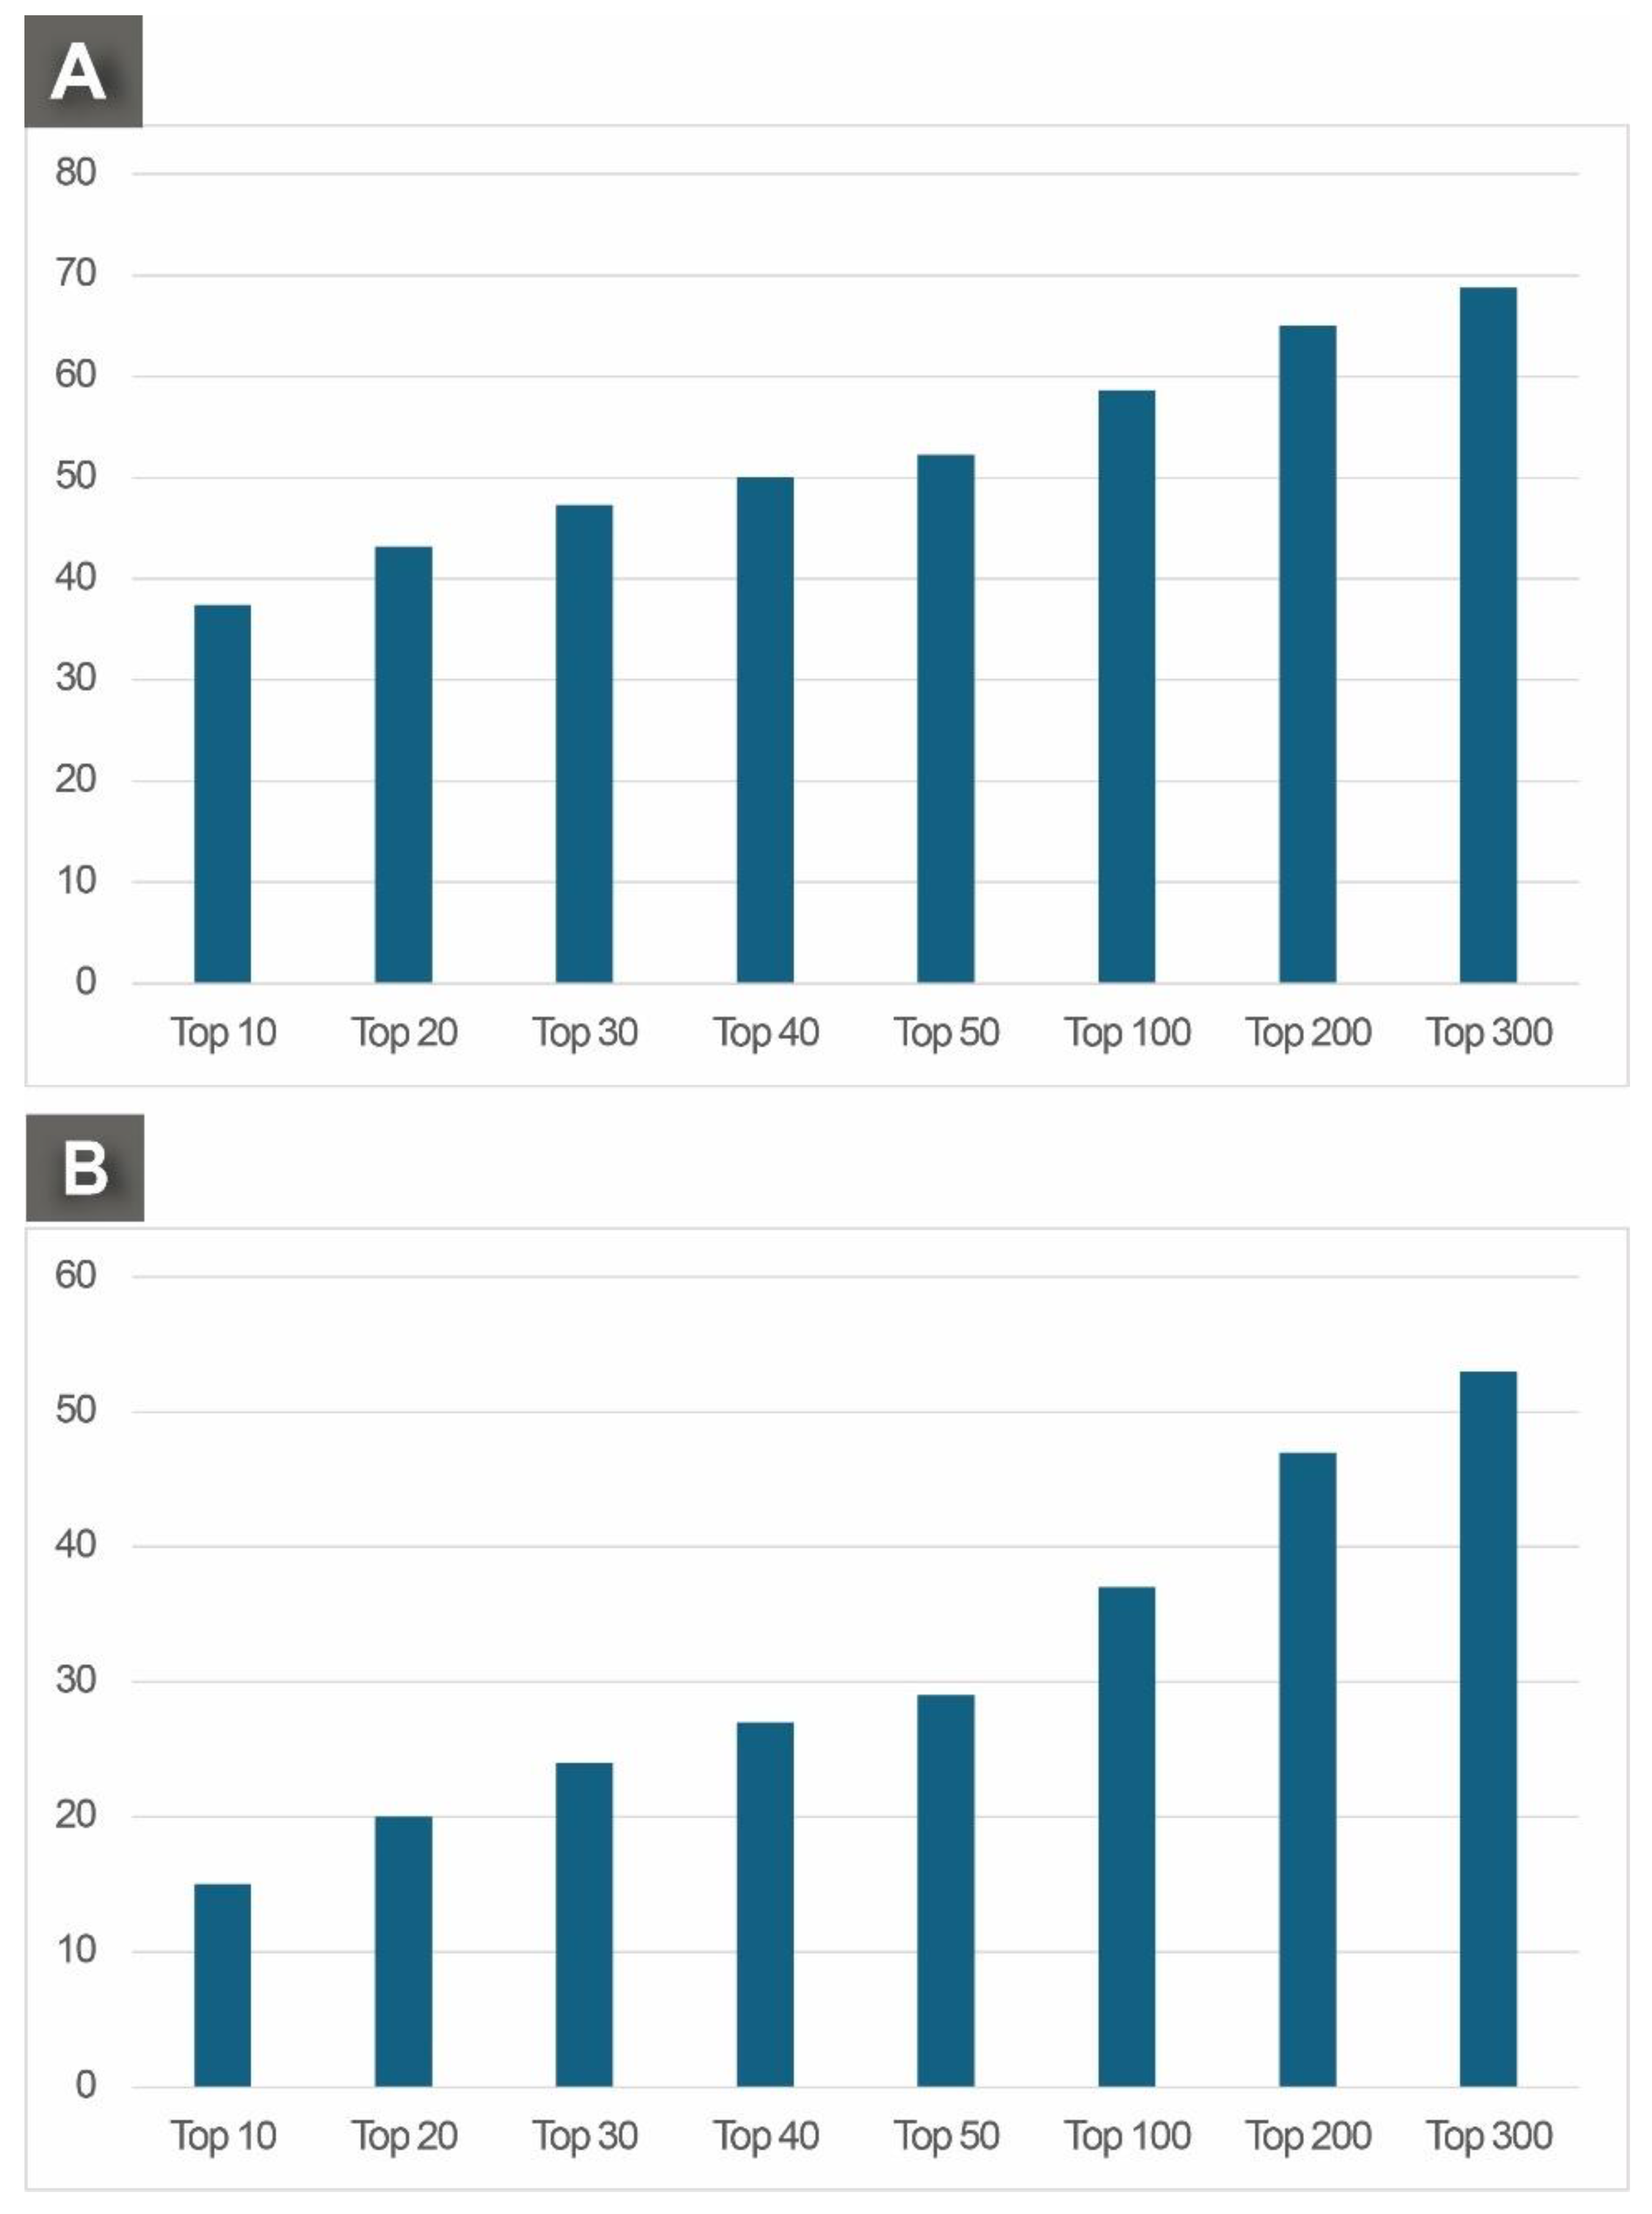
Using the New York and Denver EcoFlora Projects as examples, we explored how these iNaturalist observer types influenced total observations. Overall, both projects showed similar results. First, the majority (89-91%) of users in both projects were classified as casual observers (Table 2; Figure 2). However, while casual observers comprised the majority of users, they contributed less than 25% of all observations for both projects (Table 2). Additionally, the majority of casual observers contributed 10 or fewer observations and 39% of casual users for both projects had only a single observation.
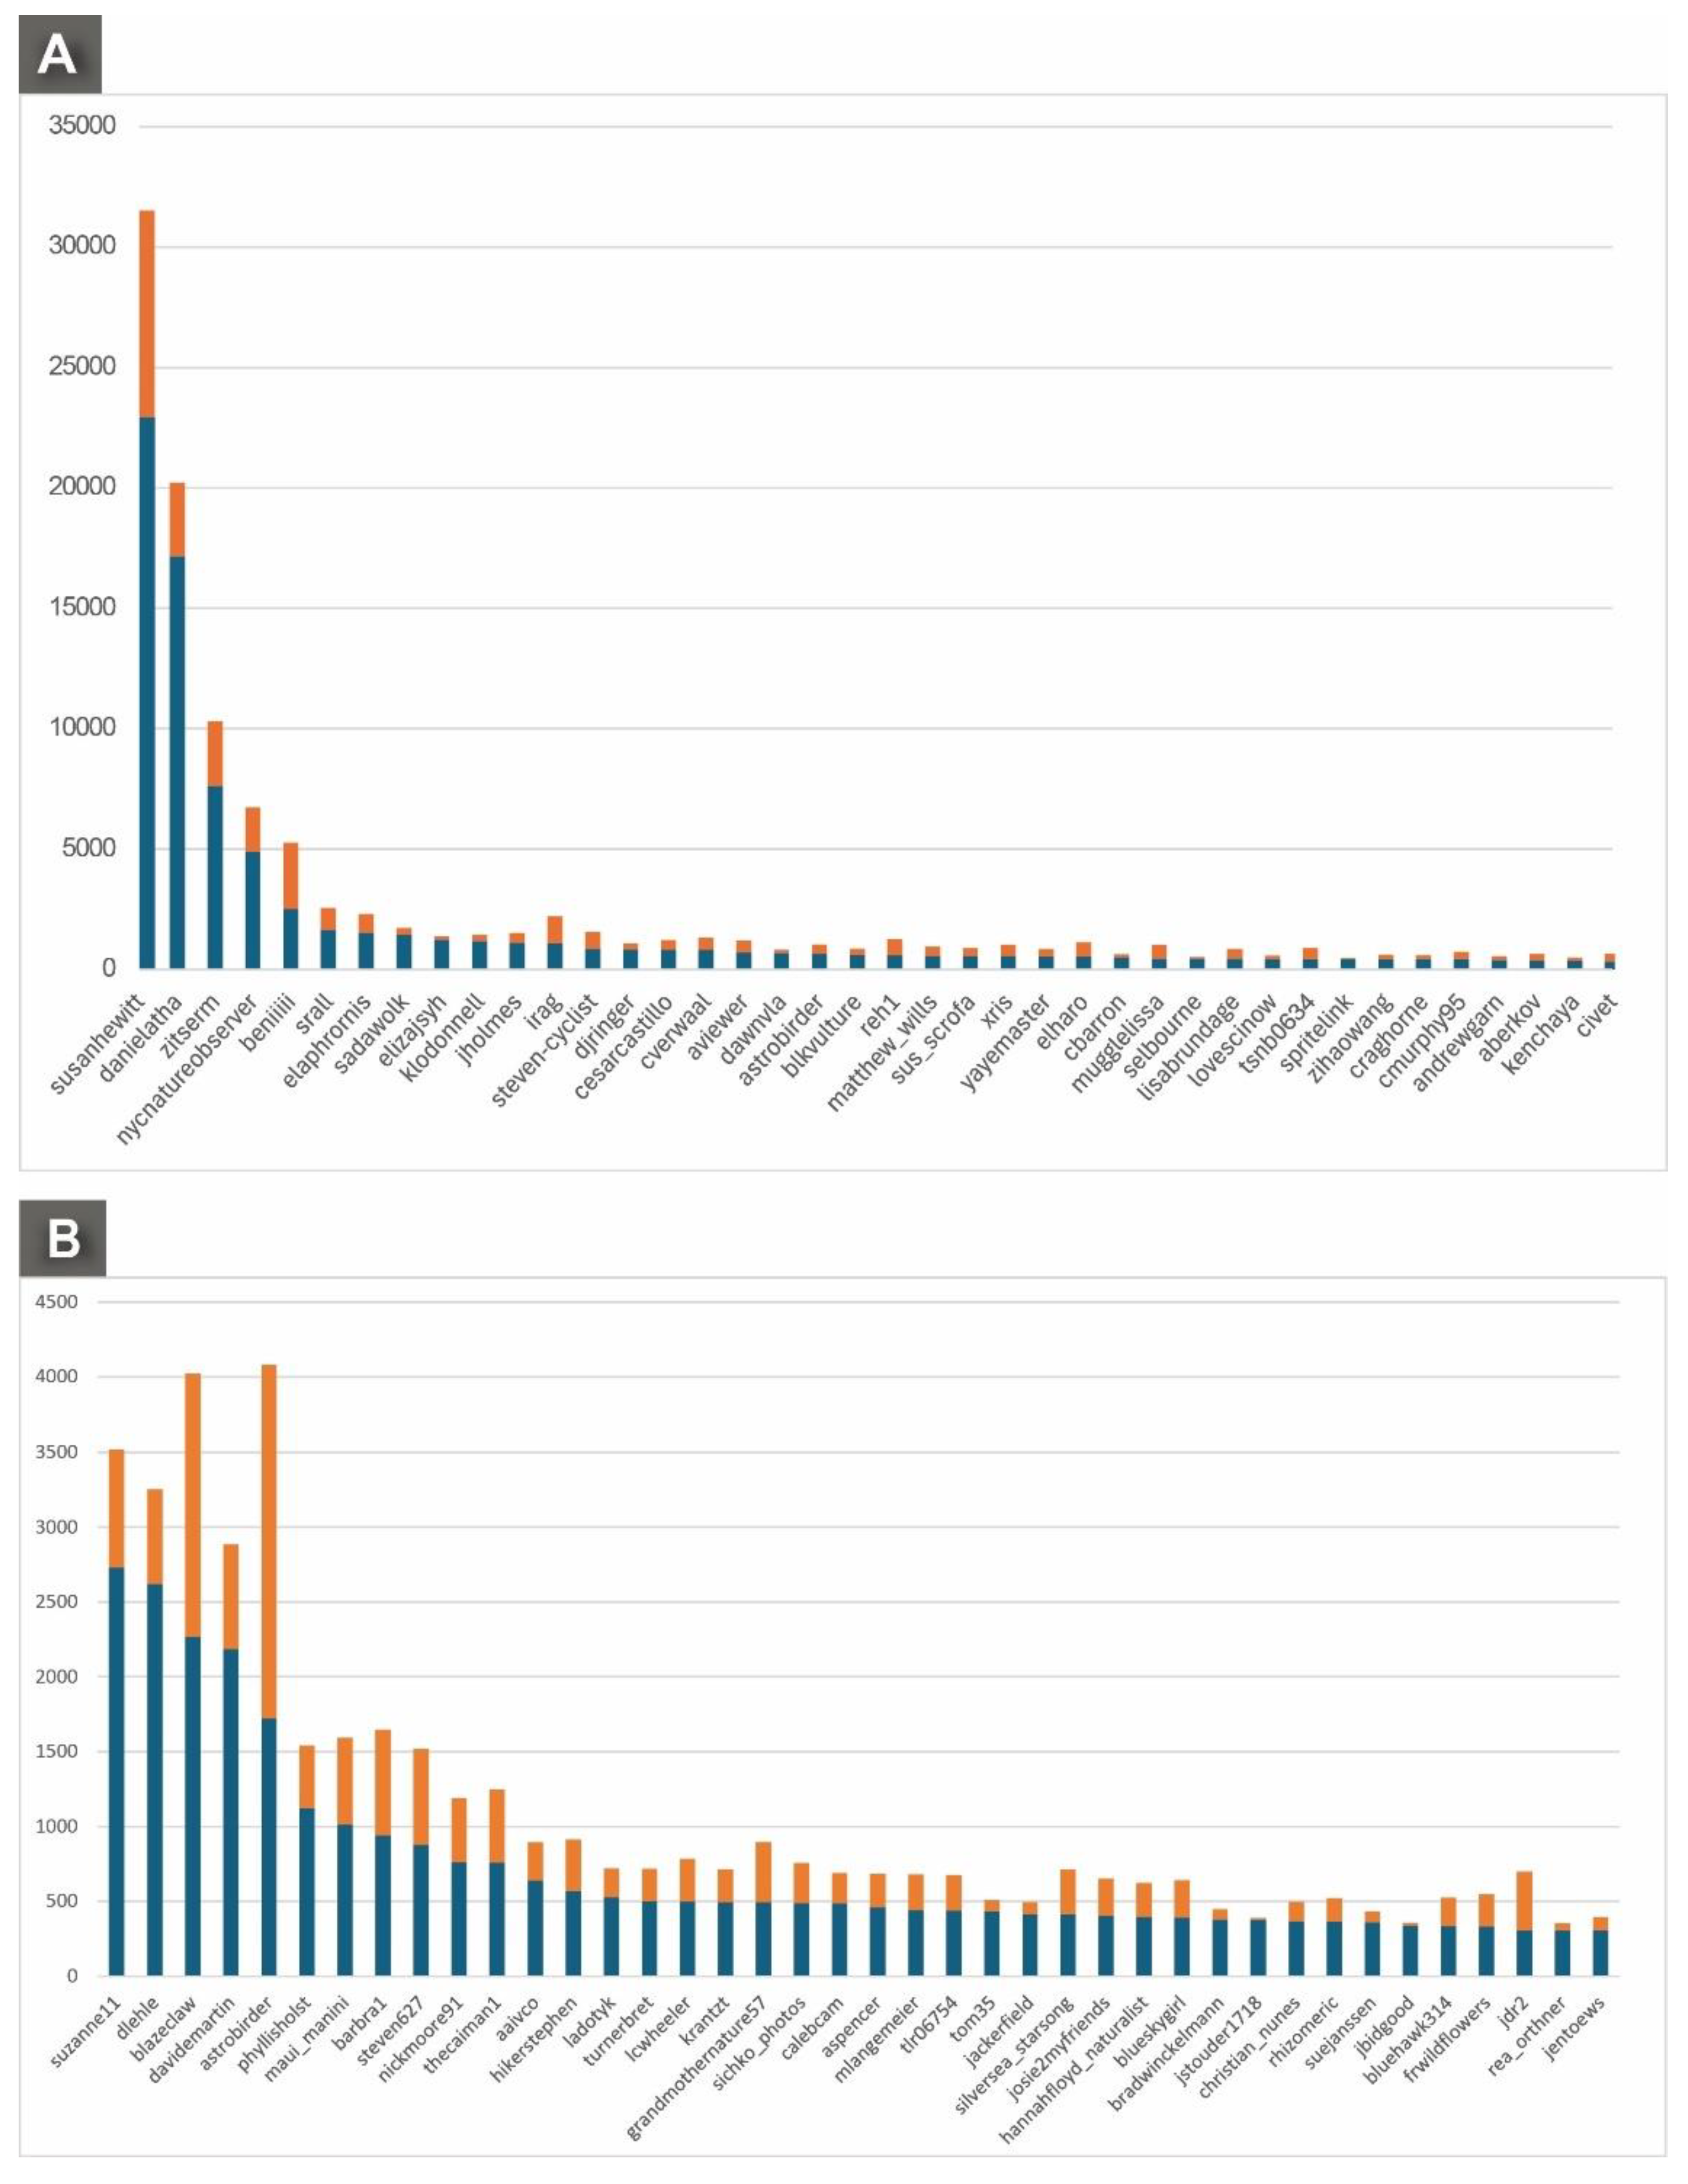
Our results also highlight the incredible impact that iNaturalist influencers and collectors have on total observations. For example, the top 10 observers for the Denver EcoFlora Project made 15% of the total observations for the Denver EcoFlora Project, while the top 20 observers made 20%, or 1 in 5, of the total observations (Figure 2). Nearly one in three observations for the Denver EcoFlora Project were made by the top 50 observers (Figure 2) and the top 300 users contributed just over half of the total observations (Figure 3). For the New York EcoFlora Project, the top 10 observers made nearly 40% of the total observations (Figure 3). This was largely driven by one “super-influencer” (user susanhewitt) who made 14% of all observations in the New York metro area with 31,515 total observations (Figure 2). For New York, the top 300 users contributed nearly 70% of the total observations (Figure 3).
Collectors focusing on observing rare or uncommon species, or areas with few observations provide valuable data for biodiversity documentation. For example, in the Denver EcoFlora Project, user hikerstephen had only 892 total observations total, but 79% of these observations represented 706 unique species (Figure 4). Another user, frwildflowers, had 414 observations total, but 82% of these observations represented 341 unique species (Figure 4). Additionally, several of the observations hikerstephen and frwildflowers took were of rare plants or were the only observation of the species in Colorado on iNaturalist. In contrast, while iNaturalist influencer user astrobirder had 3586 observations total, only 16% of the observations represented unique species (Figure 4).
Professionals usually make numerous identifications and observations within their area(s) of expertise. These professionals can drive the total number of “Research Grade” observations through identification efforts [9]. For example, user jackerfield (author J. Ackerfield and expert on the flora of Colorado) had only 494 total observations, but made 30,176 total identifications, or in other words identified approximately 1 in 5 observations for the Denver EcoFlora Project.
By understanding iNaturalist user types, iNaturalist project administrators, researchers, and conservationists can better interpret the data collected, improve the quality and utility of observations, and enhance the overall effectiveness of the iNaturalist platform in biodiversity monitoring and conservation efforts. It is important to also note that the iNaturalist community thrives on interactions between users, such as identification suggestions and comments by professionals. Understanding user types by project administrators can help facilitate better community engagement and foster positive interactions, leading to more accurate identifications on iNaturalist. Additionally, understanding user motivations can help project administrators in designing features and strategies to increase user engagement. Some users may be motivated by community science, while others may participate for personal interest or educational purposes.

3.3. Case Studies

3.3.1. Rare Plant Wrangling

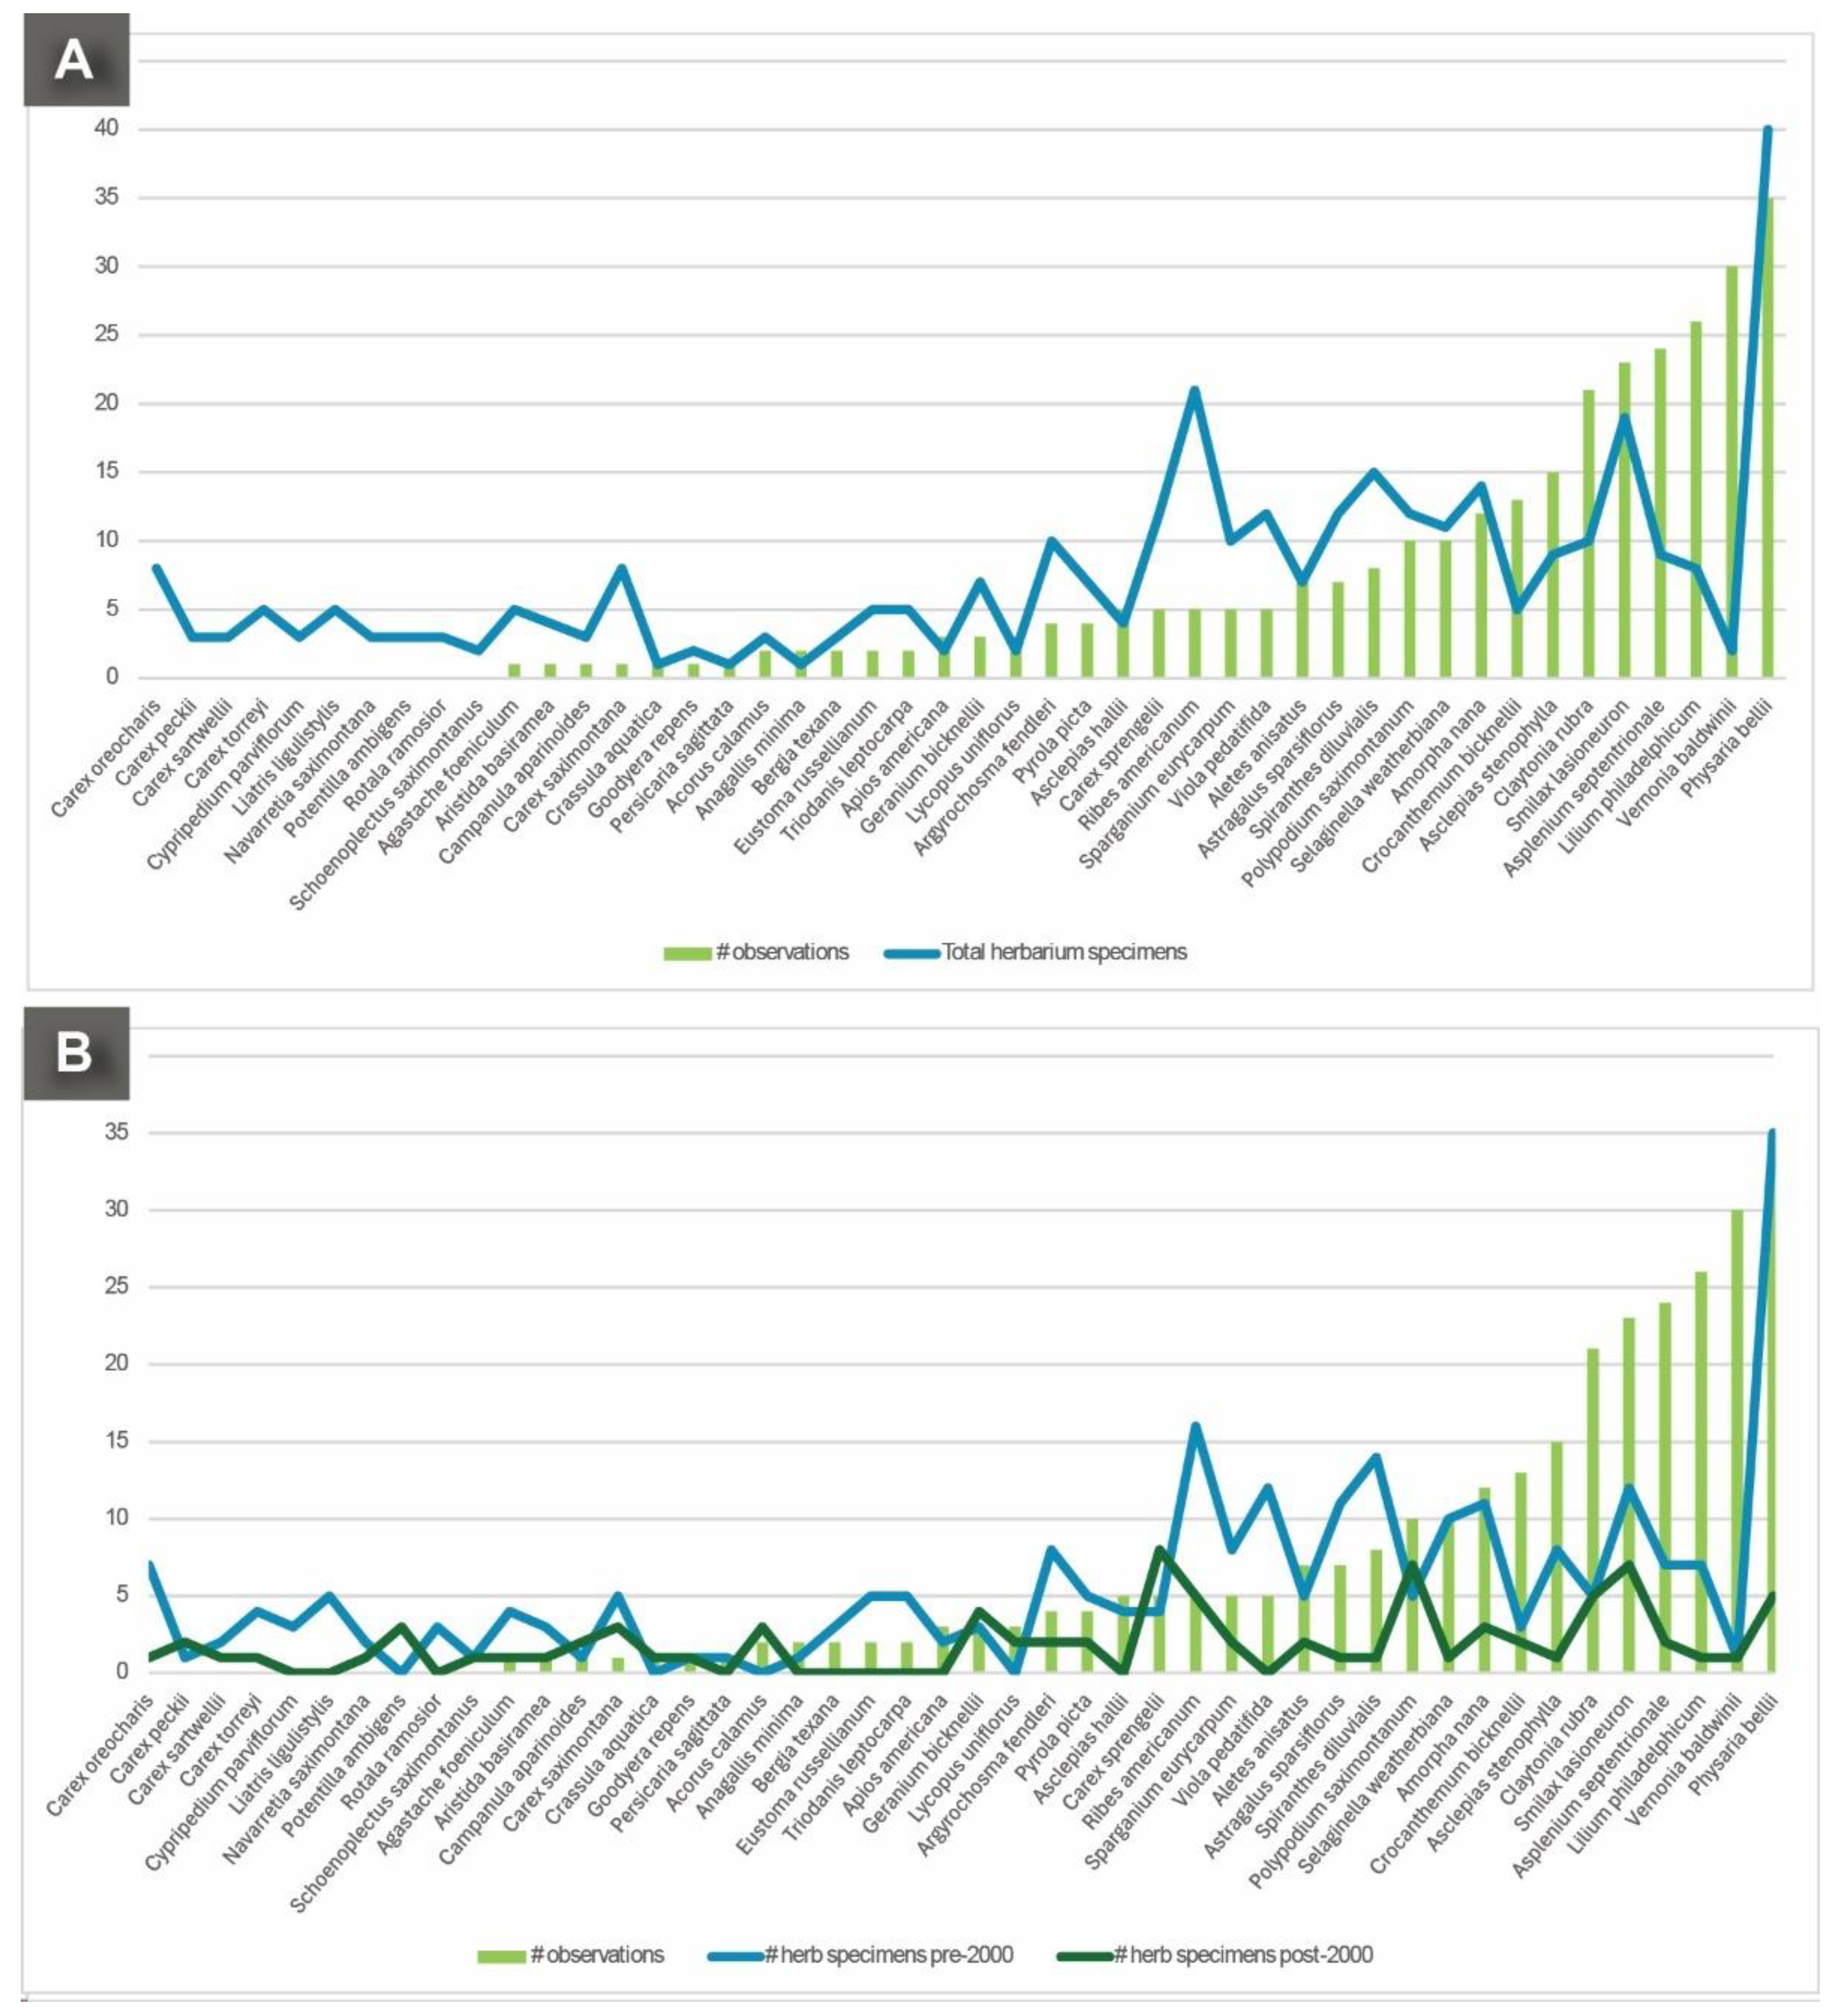
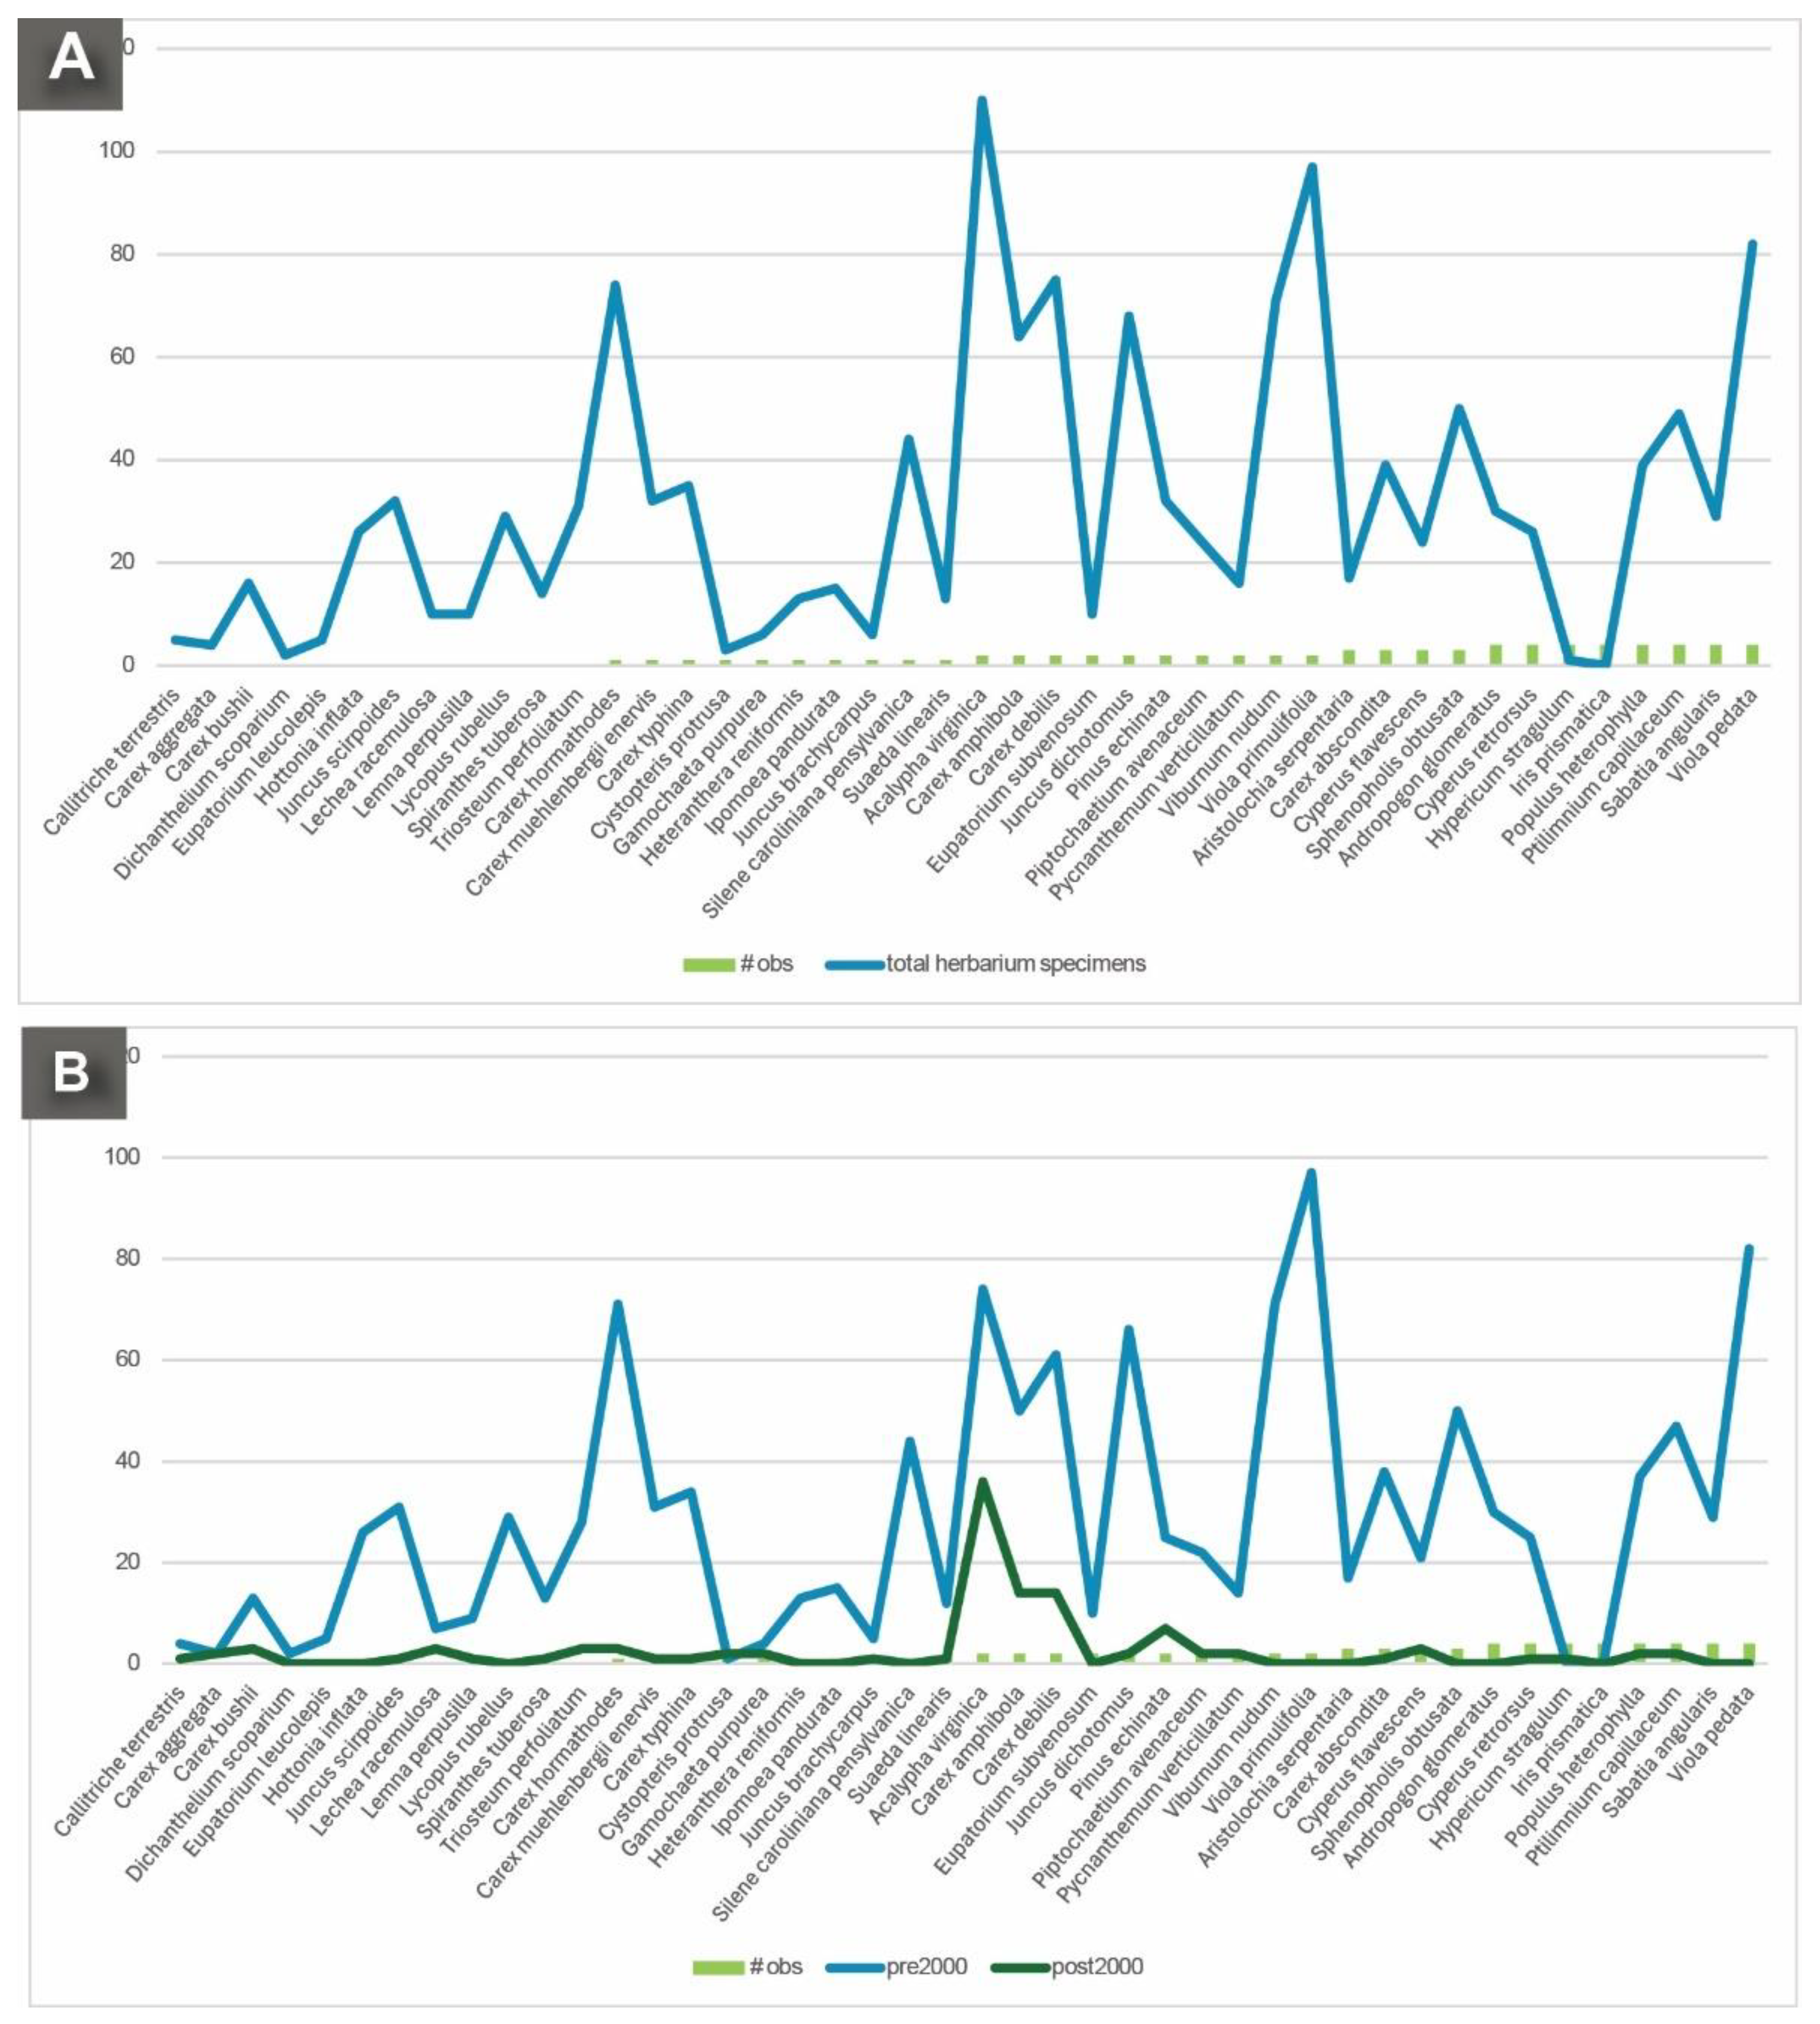
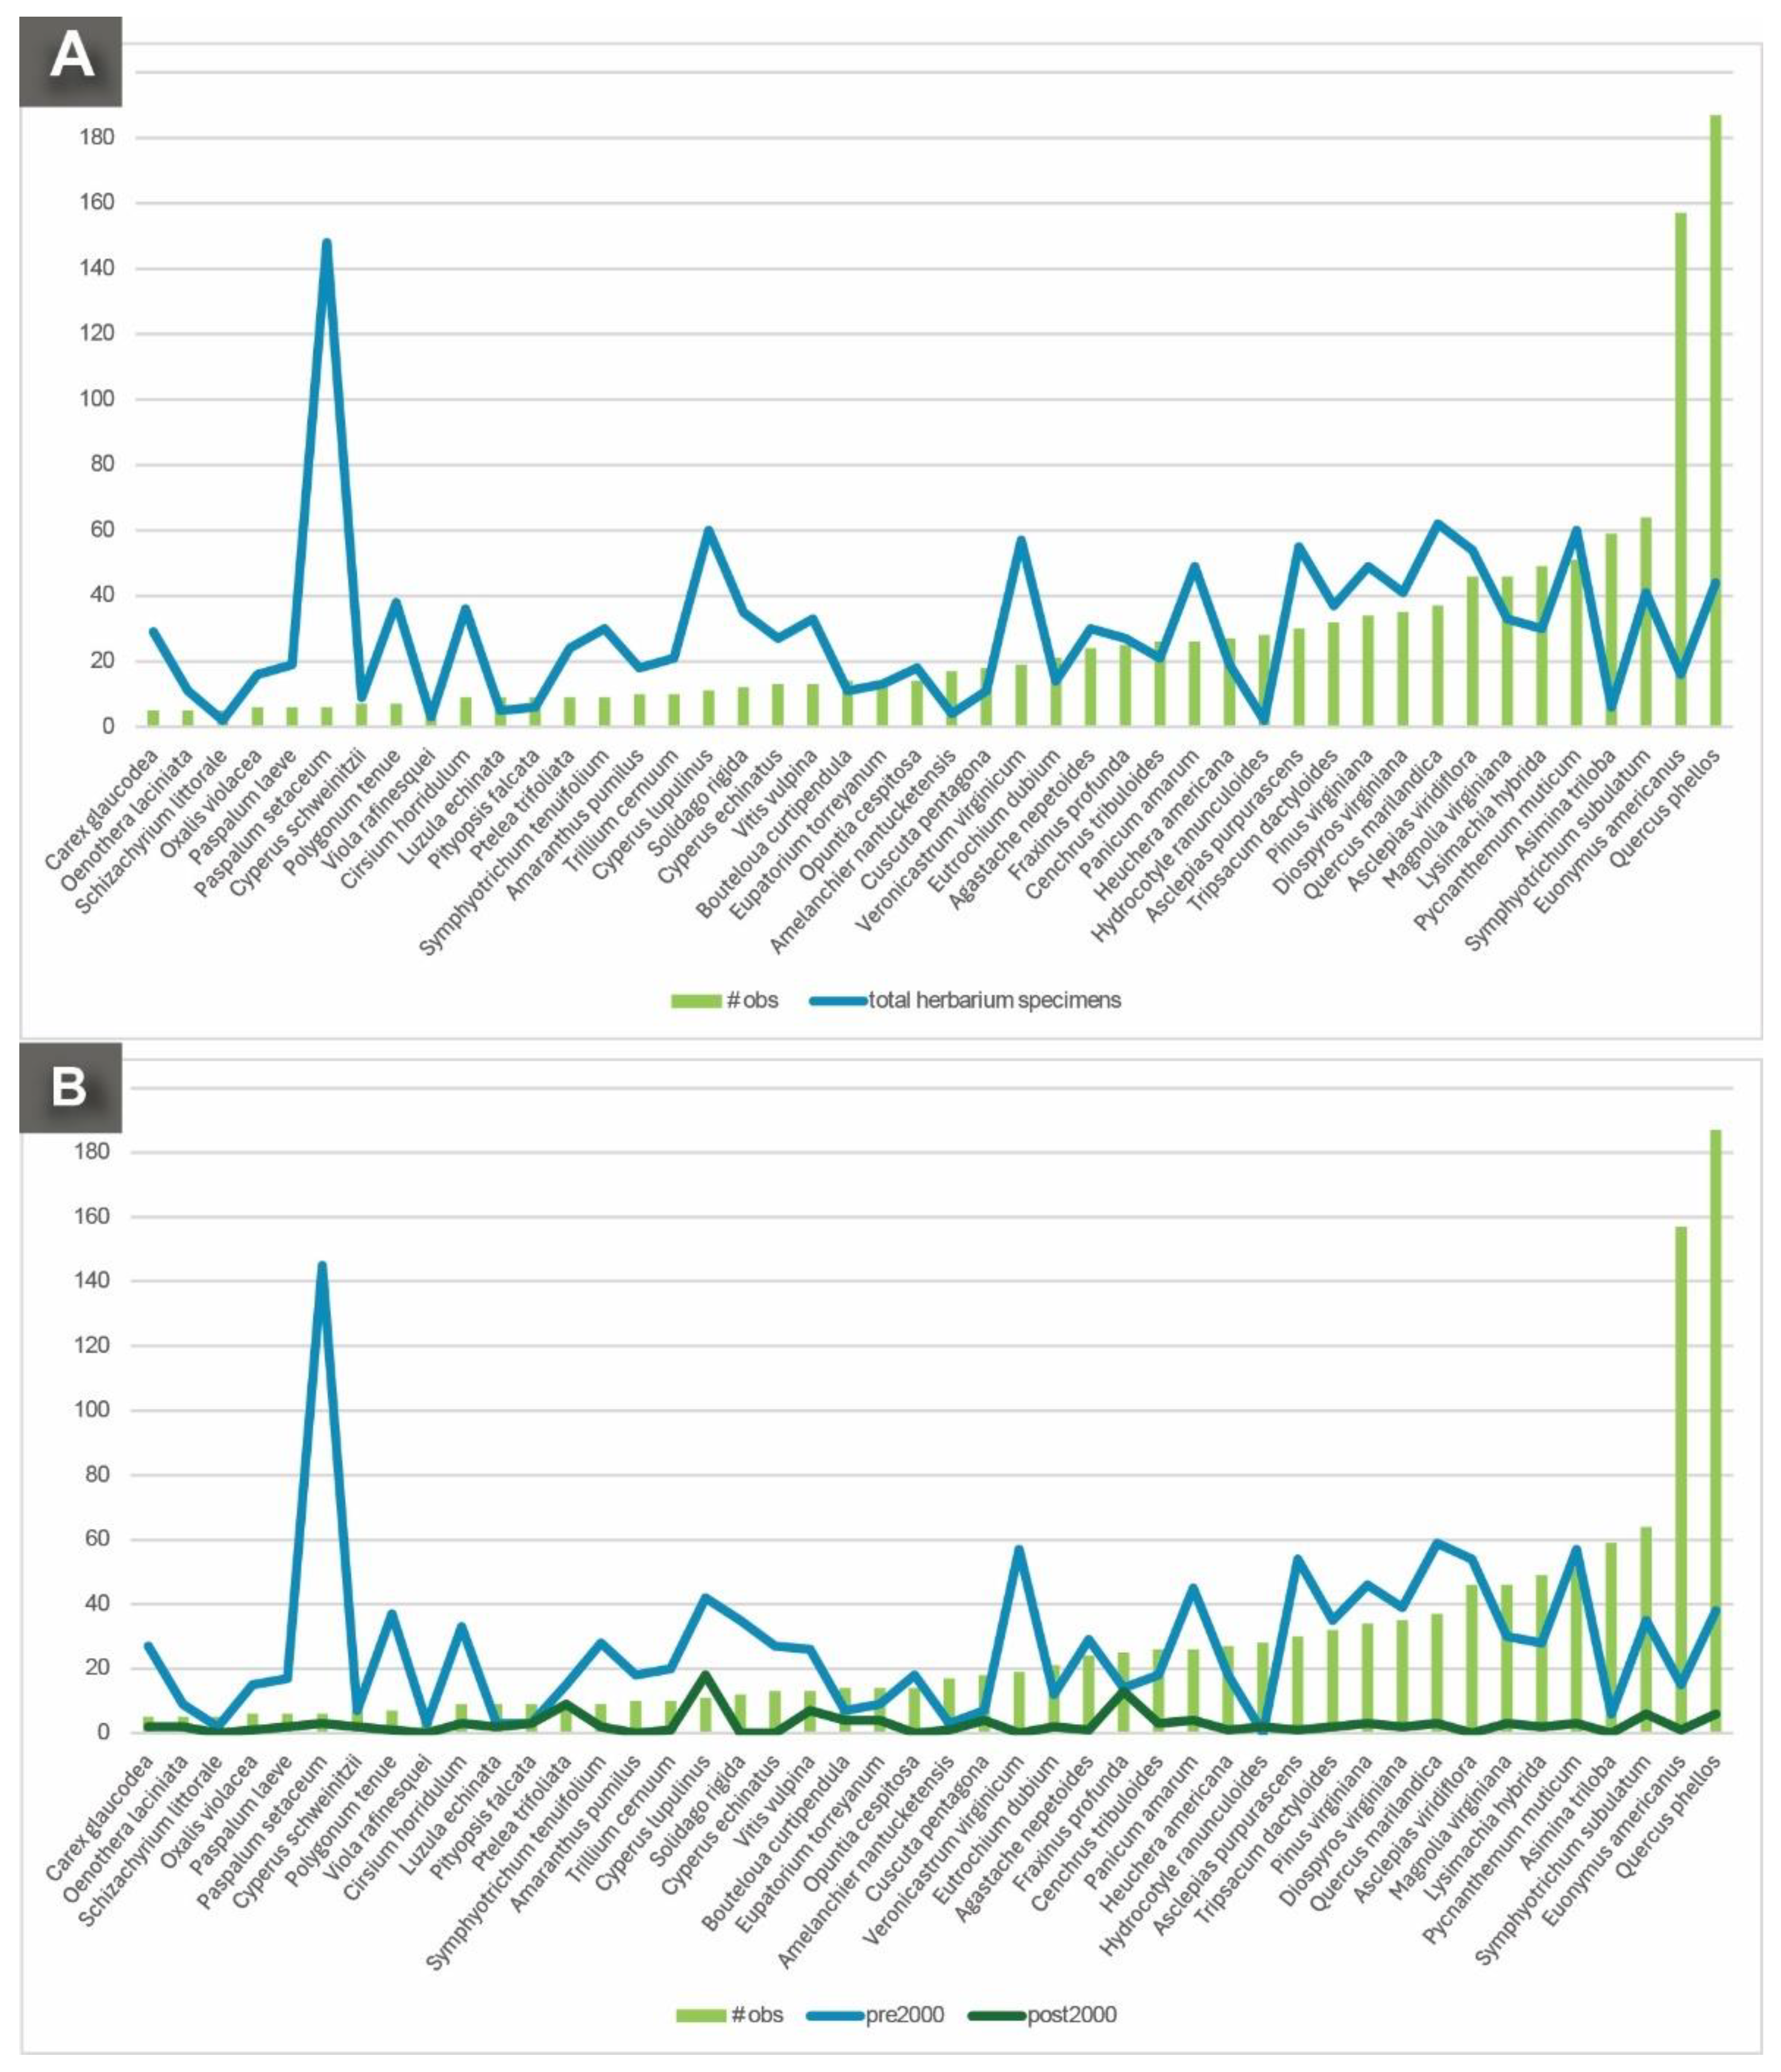
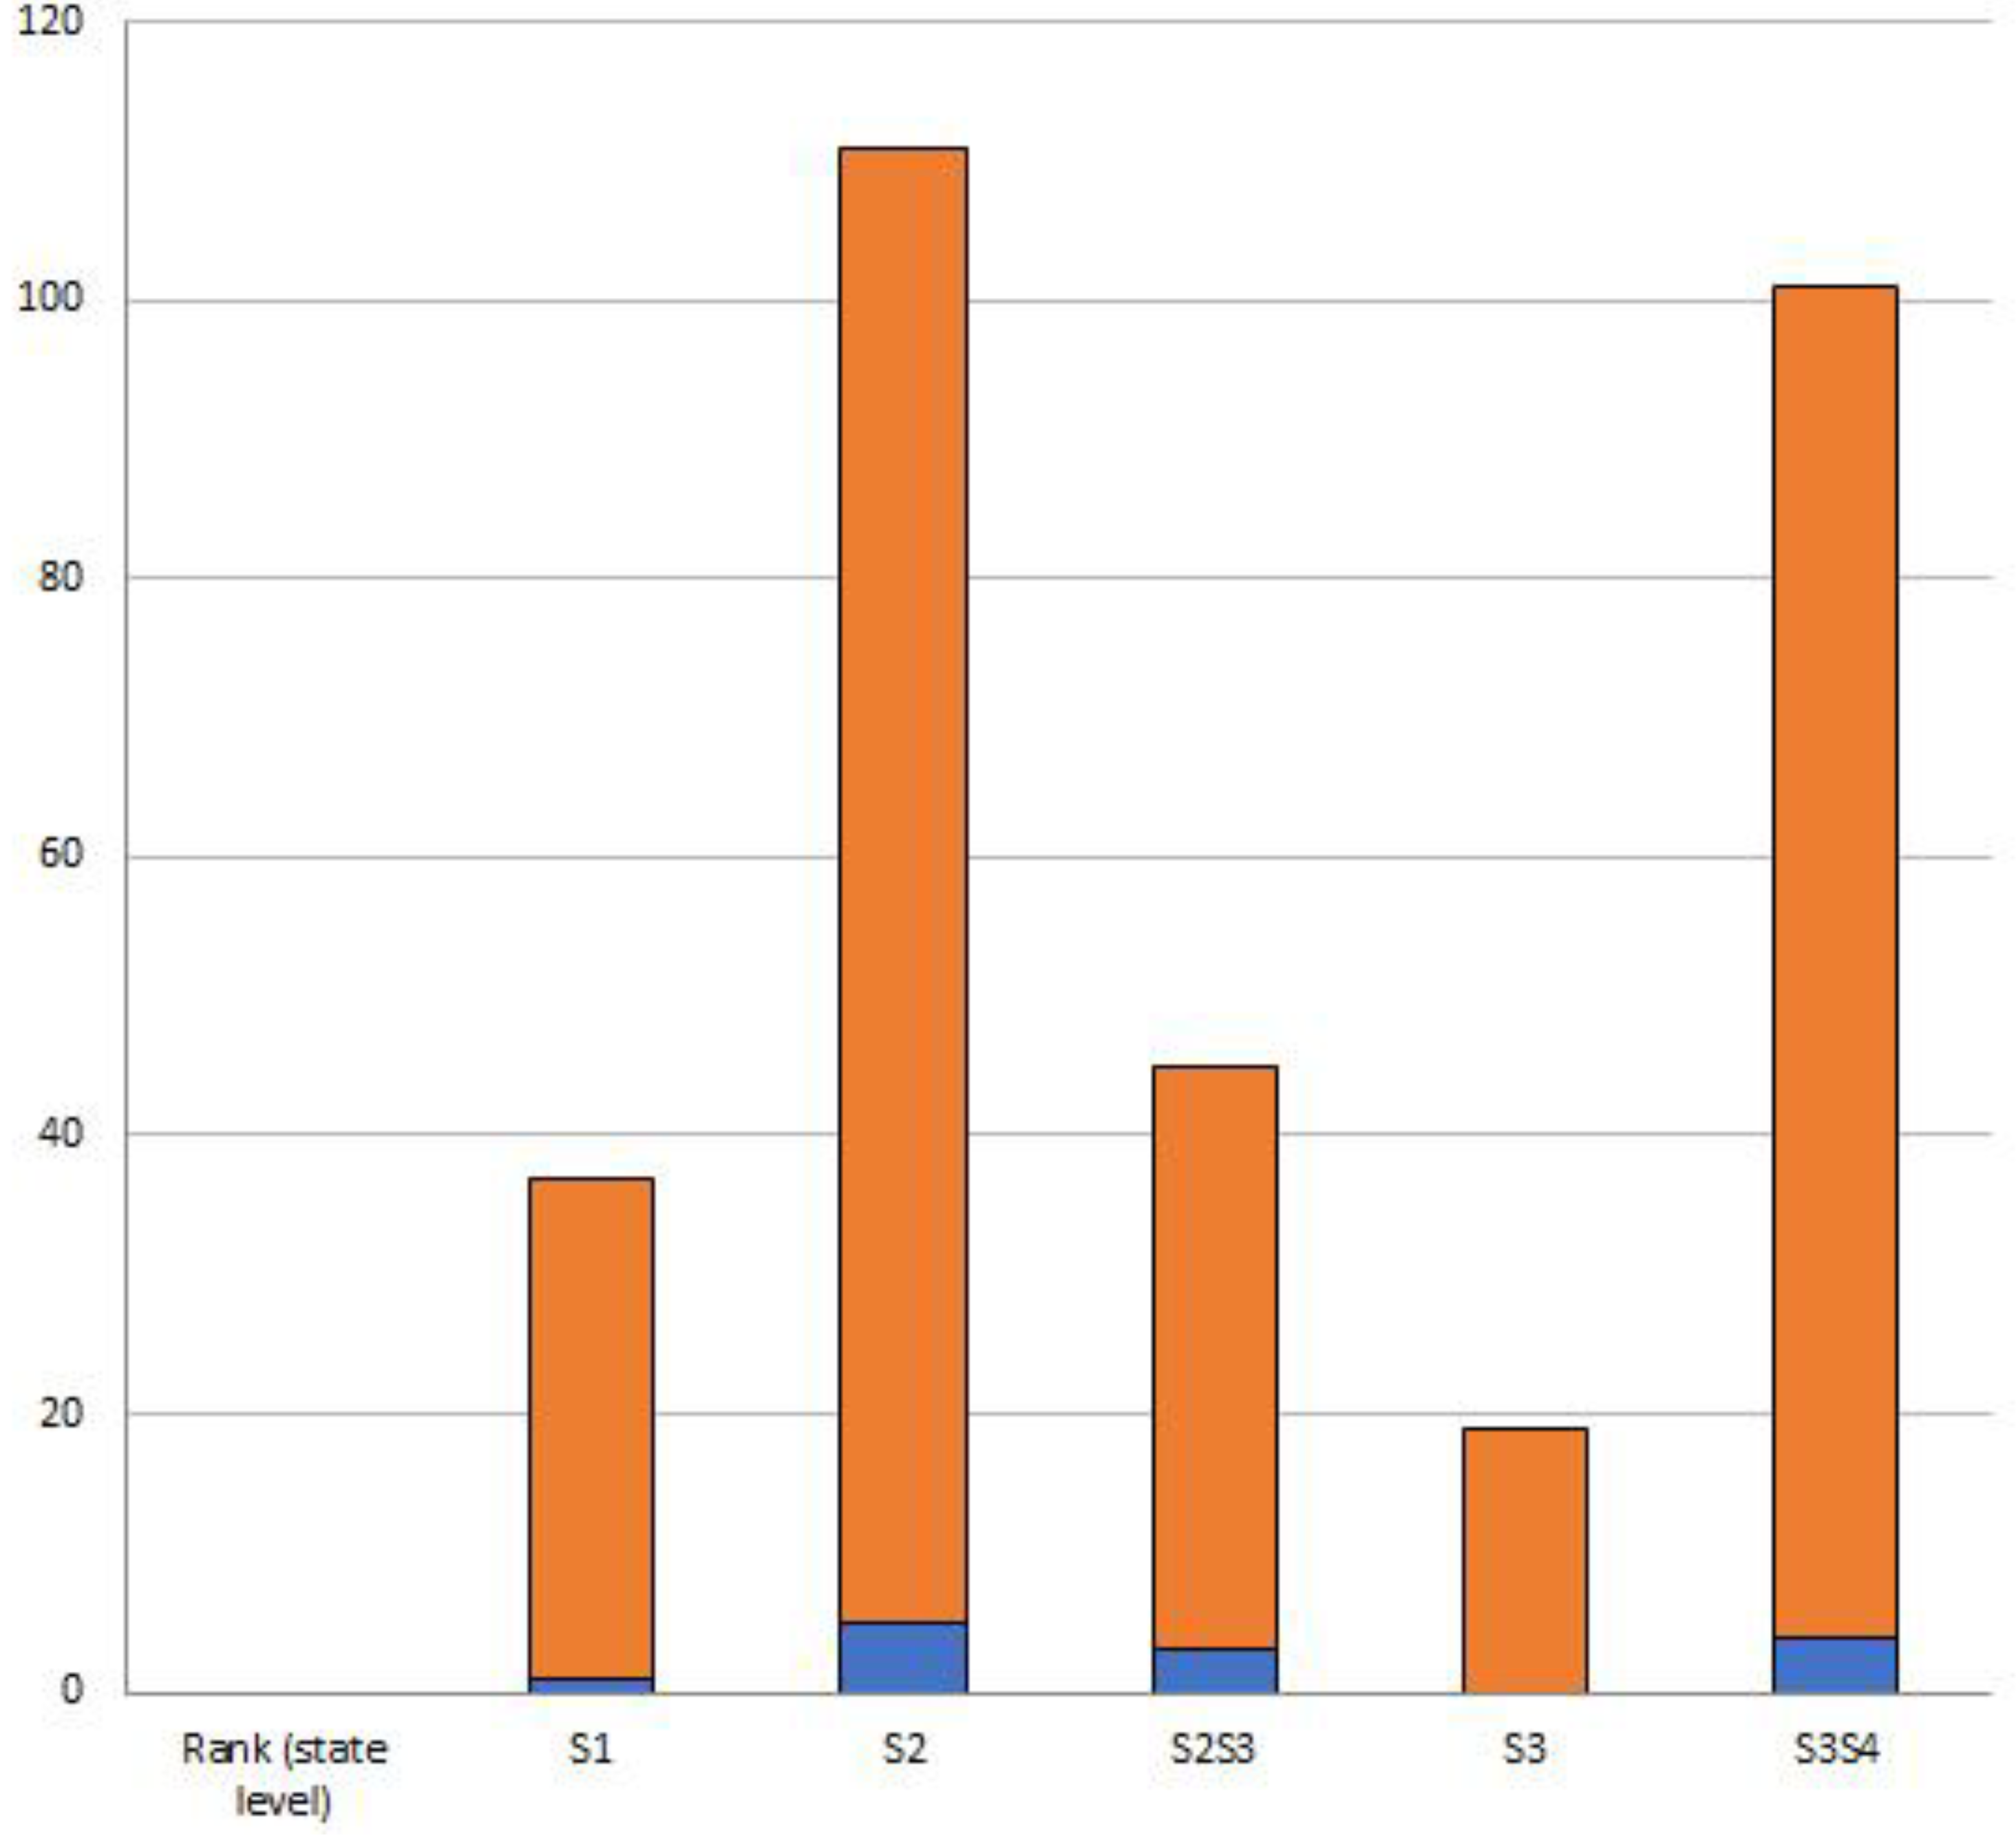
Rare species are either represented by few individuals or populations, or are distributed over a narrow geographic range [32,33,34]. Documentation and mapping of rare species is essential for effective land management, conservation planning, extinction risk assessments, and biodiversity estimates [35,36,37,38,39]. Using the Denver and New York EcoFlora Projects as examples, we explored: 1) the contribution of iNaturalist observations versus herbarium specimen records for documentation of rare plant species, and 2) the contributions of user types to rare plant iNaturalist observations. For the Denver and New York metro areas, we found that approximately 75% of rare species had a wider breadth of coverage from herbarium specimens than iNaturalist observations (Figure 5, Figure 6 and Figure 7). Thus, while iNaturalist observations contributed some information to rare species’ distributions, the majority of the information came from herbarium specimens. Additionally, approximately 25% of rare plant species in Denver and 6% in New York had no representative iNaturalist observation (Figure 5, Figure 6 and Figure 7). However, approximately 25% of rare species had more iNaturalist observations than herbarium specimens for both the Denver and New York EcoFlora Projects (Figure 5, Figure 6 and Figure 7).
Thus, while iNaturalist observations contributed some information to rare species’ distributions, the majority came from herbarium specimens. Additionally, approximately 25% of rare plant species in Denver and 6% in New York had no representative iNaturalist observation (Figure 5, Figure 6 and Figure 7). However, approximately 25% of rare species had more iNaturalist observations than herbarium specimens for both the Denver and New York EcoFlora Projects (Figure 5, Figure 6 and Figure 7).
Knowledge of the history of collection objectives of institutions and urbanization is important when analyzing these results. For example, the majority (90%) of collections made in the New York metro area were done prior to 2000 (Figure 6 and Figure 7). In the late 1800’s and early 1900’s there was a push to make numerous collections from the local area for deposition at the New York Botanical Garden herbarium. However, as time went on, collection objectives shifted to other geographic regions beyond New York. Additionally, increased urbanization of the New York metro area meant that for many of these collections, returning to collect additional specimens was not even possible. These early herbarium specimens are thus of vital importance, providing crucial glimpses into the past landscape of the New York metro area, while iNaturalist observations provide a snapshot of the present. In contrast, approximately 25% of the total collections of rare plants in the Denver metro area were made after 2000 (Figure 5). In the greater Denver metro area, there are numerous open spaces, parks, and natural areas preserved from urbanization. A focus by land managers and the Colorado Natural Heritage Program to document the biodiversity of these areas within the last 20 years could account for many of these specimens.
We decided to further explore the underlying causes of the discrepancies between numbers of herbarium specimens and iNaturalist observations for the rare plants by examining specific rare species. We hypothesize that some of the undocumented rare species on iNaturalist are the result of identification difficulties. For example, of the 10 species of rare plants not observed on iNaturalist for the Denver metro area, half belong to the Cyperaceae (sedge) family. Species in the Cyperaceae family are difficult to identify from an herbarium specimen, much less a photograph, as many require microscopic examination of characteristics at specific times of the year.
Most rare plant observations were made by either professionals, collectors, or influencers in the Denver metro area (Figure 8). The very nature of being restricted in geographic range, difficult to access, and hard to find lends rare species to fewer opportunistic observations by casual observers. Collectors and professionals also often seek out rare plant species to document on iNaturalist, while influencers observe rare species opportunistically through the sheer number of observations they make. In the Denver metro area, casual observers contributed 15 observations, or only 5% of the total observations of all rare plant species (Figure 8).
We also hypothesize that illegal collecting creates hesitance to post observations of plants prone to poaching on iNaturalist. In particular, plants such as cacti, succulents, cycads, and orchids are often targeted for illegal collections [40,41,42,43,44,45]. For example, another undocumented rare species on iNaturalist in the Denver metro area is that of Cypripedium parviflorum Salisb. or yellow lady’s slipper orchid. However, this species does occur in the area, as documented by herbarium specimen collections (Figure 5). Populations of Cypripedium parviflorum that are known to the public can be discovered by poachers, and plants from these populations have been known to disappear (author J. Ackerfield, personal observations). Thus, users may be hesitant to post observations on iNaturalist of this species. For species such as these, obscuring the locality or only allowing trusted projects access to hidden coordinates can help prevent illegal collections. However, skilled iNaturalist users can also use the timestamp of observations made on the same day to track down the approximate location of obscured observations. In instances such as this, users may need to obscure the coordinates of more common species they observe nearby at approximately the same time to protect species’ locations.
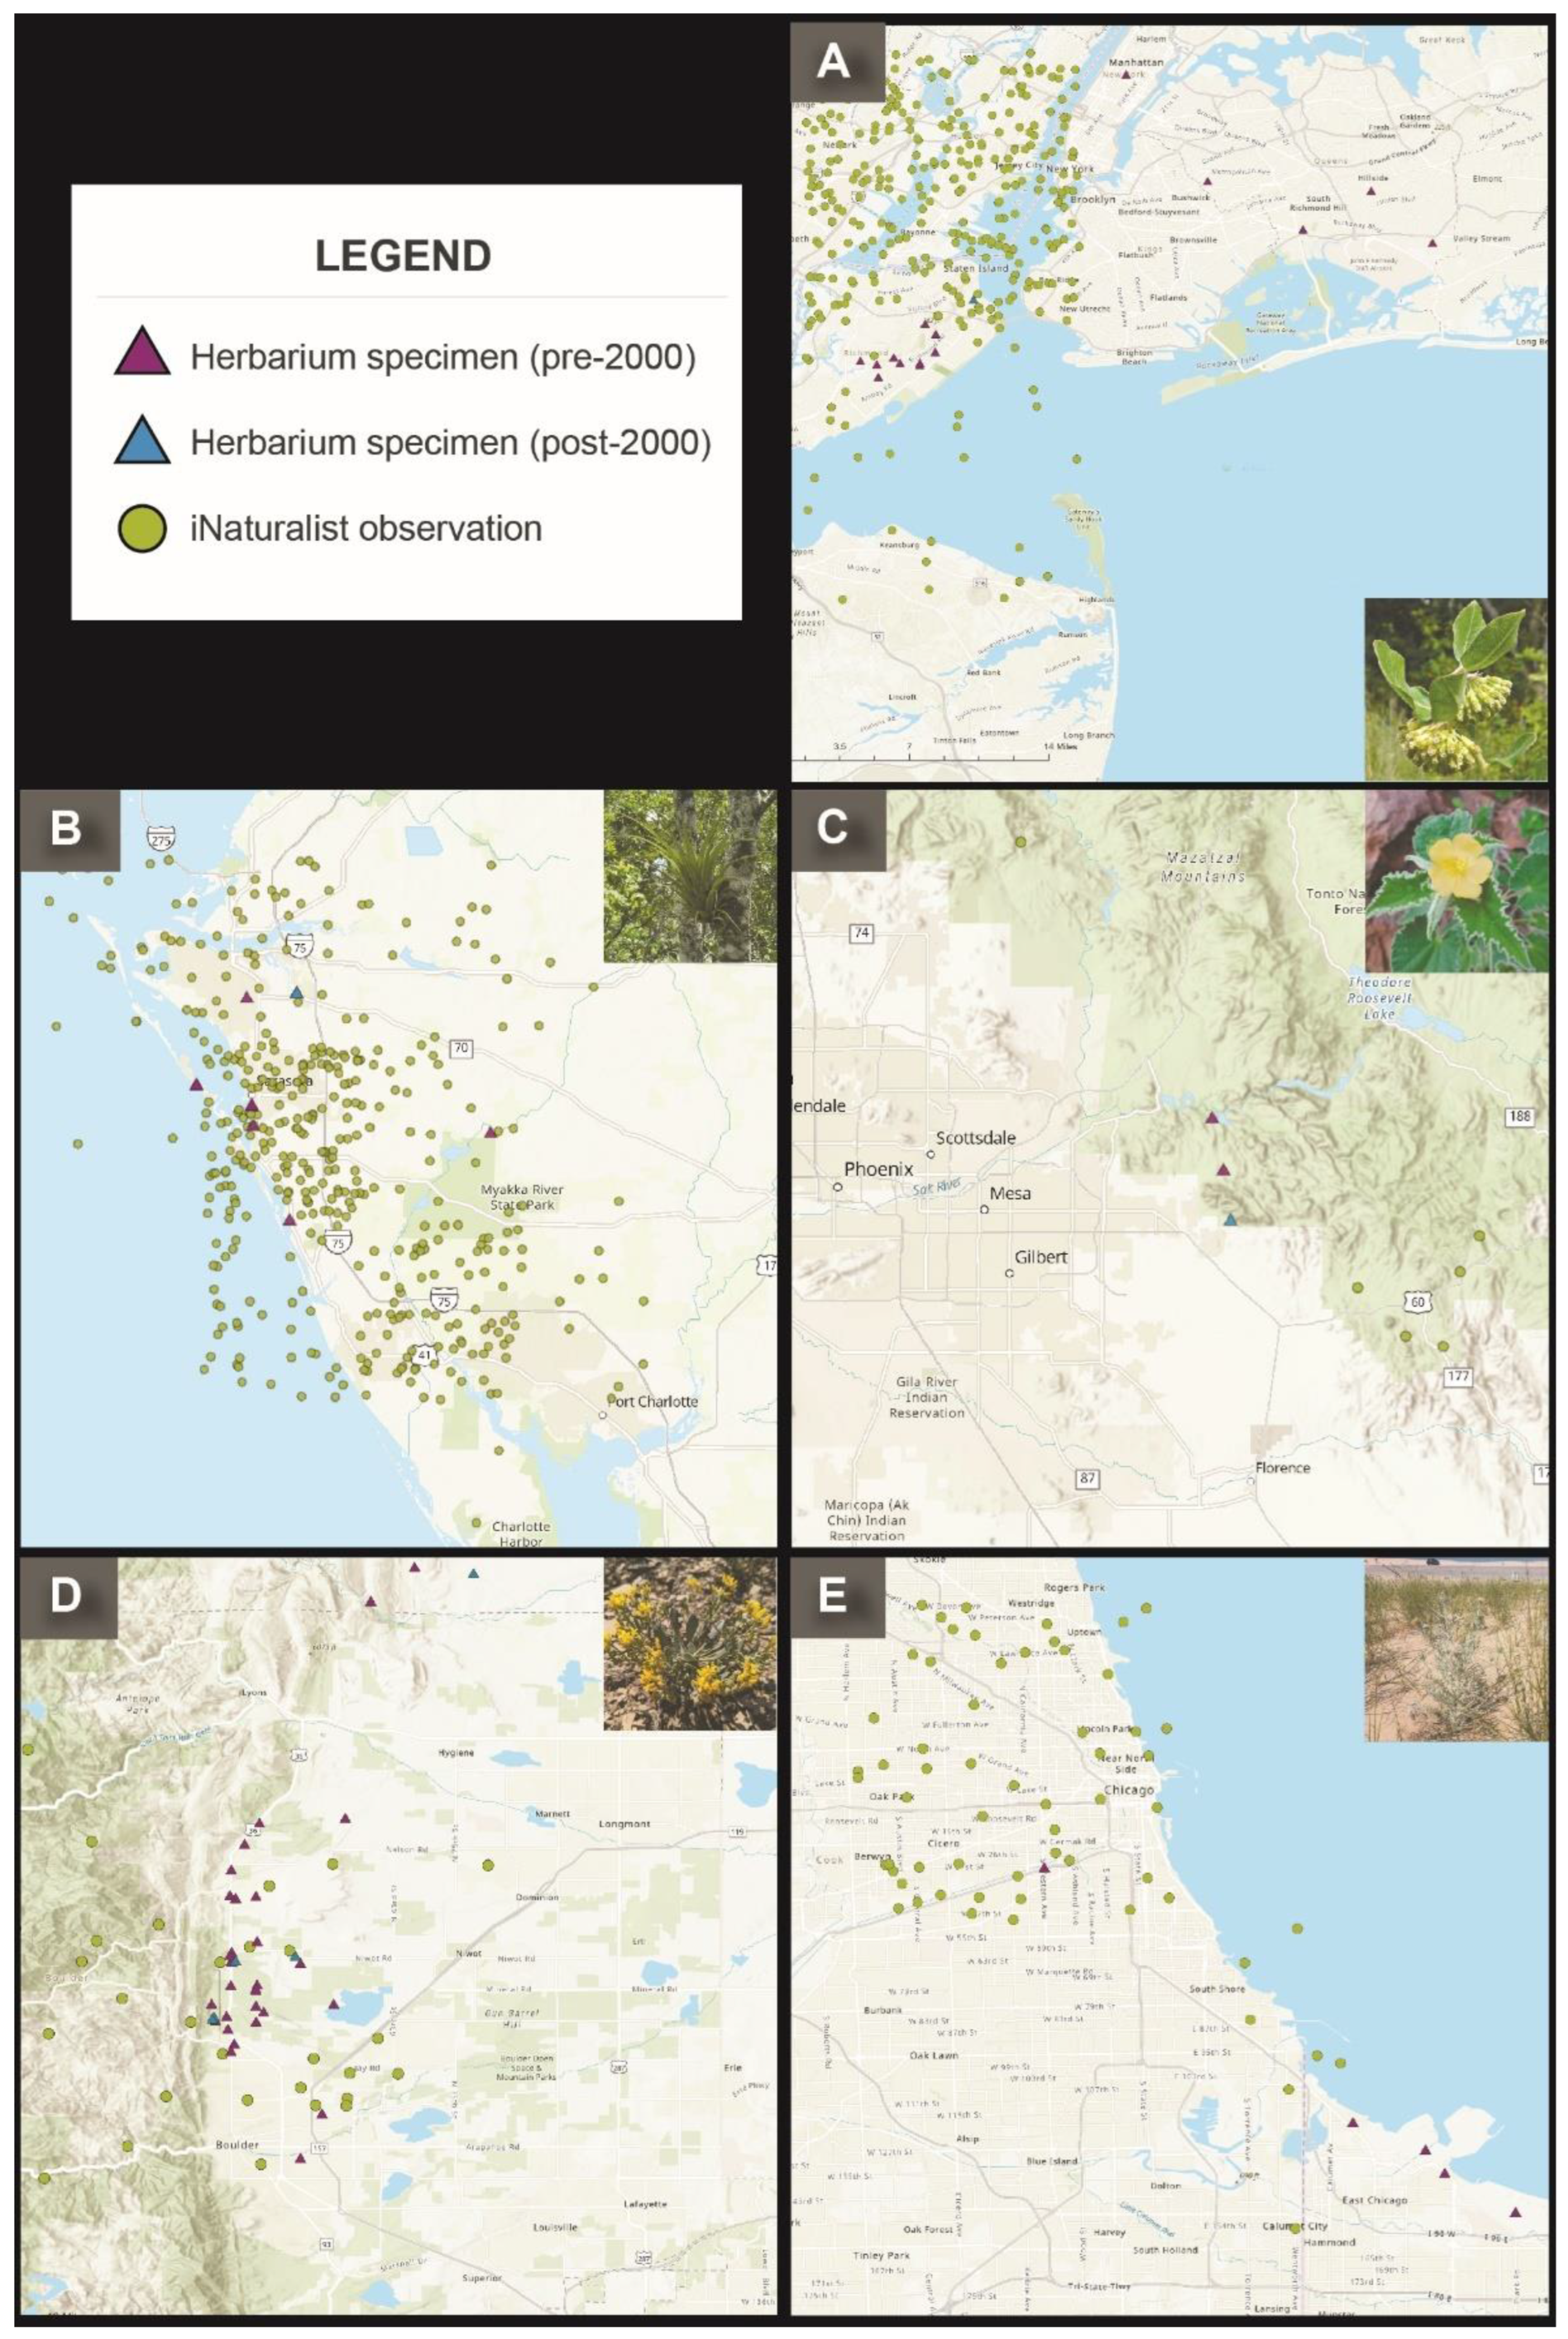
However, there are some rare plants that are opportunistically observed by casual users because their habitat is next to trails, roads, or other areas frequented by the public, or they are charismatic [46]. For example, in the Chicago area, Cirsium pitcheri Torr. & A. Gray is an Endangered species growing on sand dunes along the shore of Lake Michigan [32]. Although it is Endangered, there are 65 observations of the species on iNaturalist because this species is also highly charismatic and prevalent, with some observations taken next to parking lots (Figure 9). In the Denver metro area, Physaria bellii G.A.Mulligan is Imperiled/Vulnerable (S2S3) because it is narrowly restricted in range, only growing on shale ridges along the northern Front Range [34,47]. Despite this narrow range, however, there are 123 observations of this species on iNaturalist because it also happens to grow right next to popular hiking trails (Figure 9). In the greater Phoenix metro area, Abutilon parishii S.Watson is a Vulnerable (S3) species that grows on rocky hillsides and canyon slopes that just happen to be located near two major roads (Figure 9).
Harnessing the power of community scientists can be a great tool for extensive documentation of rare plant occurrences (Figure 9). Unlike herbarium specimens, which require permits and special equipment to obtain, anyone can make an iNaturalist observation with their smartphone device. For example, in the New York metro area, Asclepias viridiflora Raf. is limited to calcareous soil and serpentine rocks and is designated as Imperiled (S2) with less than 20 known populations in the city [32]. However, due to the charismatic nature of milkweeds as well as New York Botanical Garden’s annual Monarchs & Milkweeds EcoQuest (a targeted quest asking project members to document specific species), there are now over 300 observations of the species in the greater New York City area on iNaturalist (Figure 9). We found that for most plant species, observations of rare plants were made by collectors and influencers. However, this example highlights the importance of educating the public and harnessing the power of community scientists to make observations of rare species. These observations can greatly enhance knowledge about rare species’ distributions.
In another example, the charismatic giant airplant or Tillandsia utriculata L., Florida’s largest native bromeliad, was targeted by Marie Selby Gardens EcoFlora Project for iNaturalist observations. Once considered a weed in the canopy, wild populations were decimated over the last few decades by an introduced herbivorous insect, the Mexican bromeliad weevil (Metamasius callizona J.H. Frank). This species is now listed as Endangered in Florida [32]. At the start of the Ecoflora Project, only 30 observations of this bromeliad had been posted in the project area. During the Ecoflora Project period, bioblitzes targeting local epiphytes and educating the public about the impacts of the weevil helped to raise awareness of the importance of this epiphyte and boost observations both in Sarasota and Manatee Counties and across its range in Florida. Now, Tillandisia utriculata is the most observed plant in the Marie Selby project area with 407 observations (Figure 9).
When using iNaturalist observations of rare species it is important to know that to protect their localities, the coordinates are automatically obscured to within a one square mile of the actual observation on iNaturalist if the species has been designated as organisms with at-risk conservation statuses. The outline of this zone of obscurity can be seen for the rare plants mapped in Figure 9. In some instances, observations were even plotted in bodies of water. In these examples, herbarium specimens more accurately show the distribution of rare species than iNaturalist observations. Researchers needing access to hidden coordinates could utilize one of two options to access this information: 1) reach out to the user via a message to ask for the specific coordinates, or 2) create a collection project and ask users to become a member and grant access to hidden coordinates.
Although most rare species had greater coverage with herbarium specimens, approximately 25% of the rare plants in the Denver metro area had nearly equal to or greater numbers of iNaturalist observations than herbarium vouchers. For example, Vernonia baldwinii Torr. (Imperiled, S2), was observed 31 times by 30 unique observers, and was the most observed rare species by casual observers. However, the data presented here also highlights the importance of local botanical knowledge when evaluating the results. Vernonia baldwinii occurs in a very limited geographic range [34,47], but this area just happens to be frequented by numerous visitors to the Rocky Mountain Arsenal National Wildlife Refuge. Vernonia baldwinii is a showy, charismatic plant that grows right next to trails, allowing multiple people to opportunistically observe this rare plant. Thus, despite being a rare species in Colorado and the Denver metro area, Vernonia baldwinii was the most observed rare species by the most unique users. There are also a disproportionate number of herbarium specimens to iNaturalist observations for Vernonia baldwinii, with only two herbarium specimens versus 31 observations. In this instance, because Vernonia is found within a very small geographic range, two herbarium specimens suffice for documentation of its occurrence.
For agencies, iNaturalist observations in conjunction with herbarium specimens could be used to evaluate species’ state imperilment rankings by providing additional occurrence records. For example, Claytonia rubra (Howell) Tidestr. is categorized as S1 (Critically Imperiled) in Colorado [34], but has 21 iNaturalist observations, a magnitude greater than the other S1 species present (Figure 5). Conversely, Goodyera repens (L.) R.Br. is categorized as S3S4 (Vulnerable-Apparently Secure) but has only one iNaturalist observation and two herbarium vouchers [34]. These results indicate that these species could need reevaluation of their state imperilment ranking.
Lastly, herbaria personnel and researchers can use iNaturalist observations to target rare species that have not been previously documented from an area for long-term preservation as voucher specimens or to obtain leaf material for DNA extraction. Examining iNaturalist observations to find locations in which vouchers have not previously been taken also ensures that a record of species’ occurrences is documented with a physical specimen preserved in perpetuity in a museum or herbarium. For example, Acorus calamus L. is listed as presumed extinct in Colorado on NatureServe [32]. However, we found two observations of this species on iNaturalist. Using this information, herbarium staff and volunteers went to these locations to document its occurrence with preserved herbarium specimens. This information can now be used to update the state imperilment ranking of this species for Colorado.

3.3.2. Finding Hay in a Haystack

In this case study, we explored the relative contribution of iNaturalist observations and herbarium specimen records to widespread, common species found in each greater metro area. Tracking the distributions of common plant species is important for several reasons. First, common species often play crucial roles in ecosystems, and changes in their distributions can inform shifts in ecosystem health or function [48,49,50]. Second, monitoring common species helps establish baseline data, helping land managers to better detect trends from climate change, introduced species, or land-use change [51]. Declines in common species can serve as early warning signs for potential ecosystem degradation [52,53].
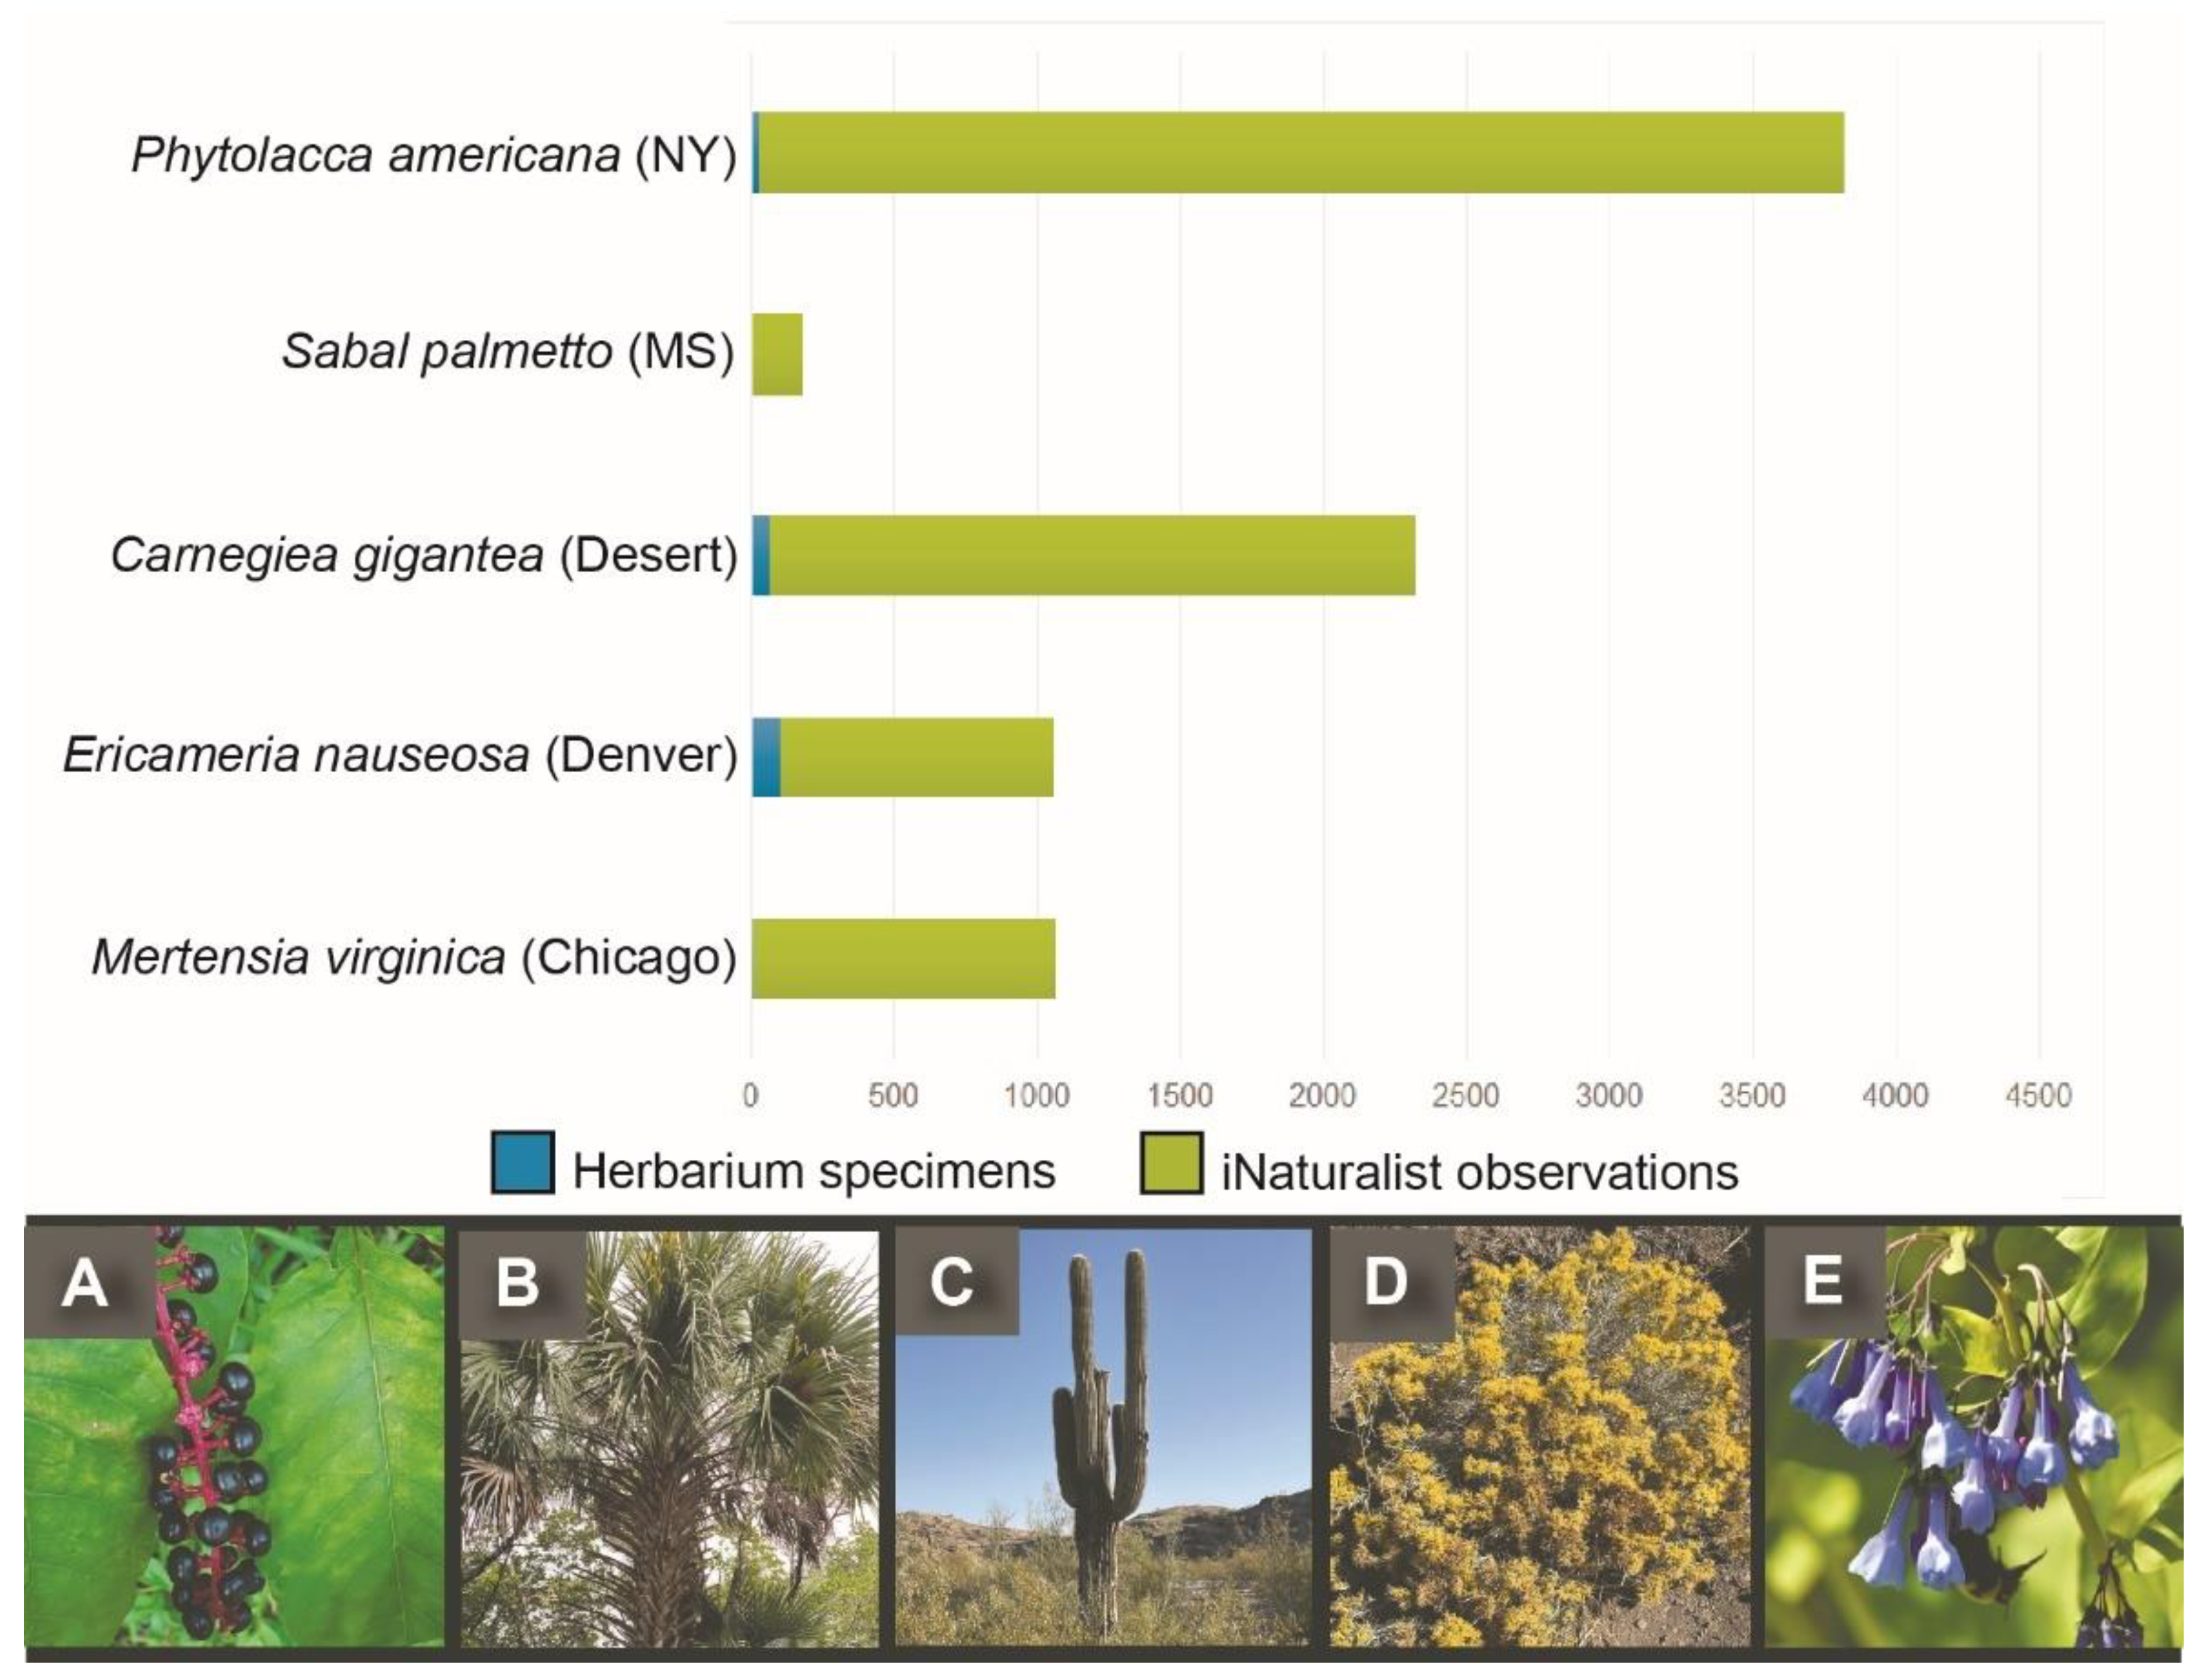
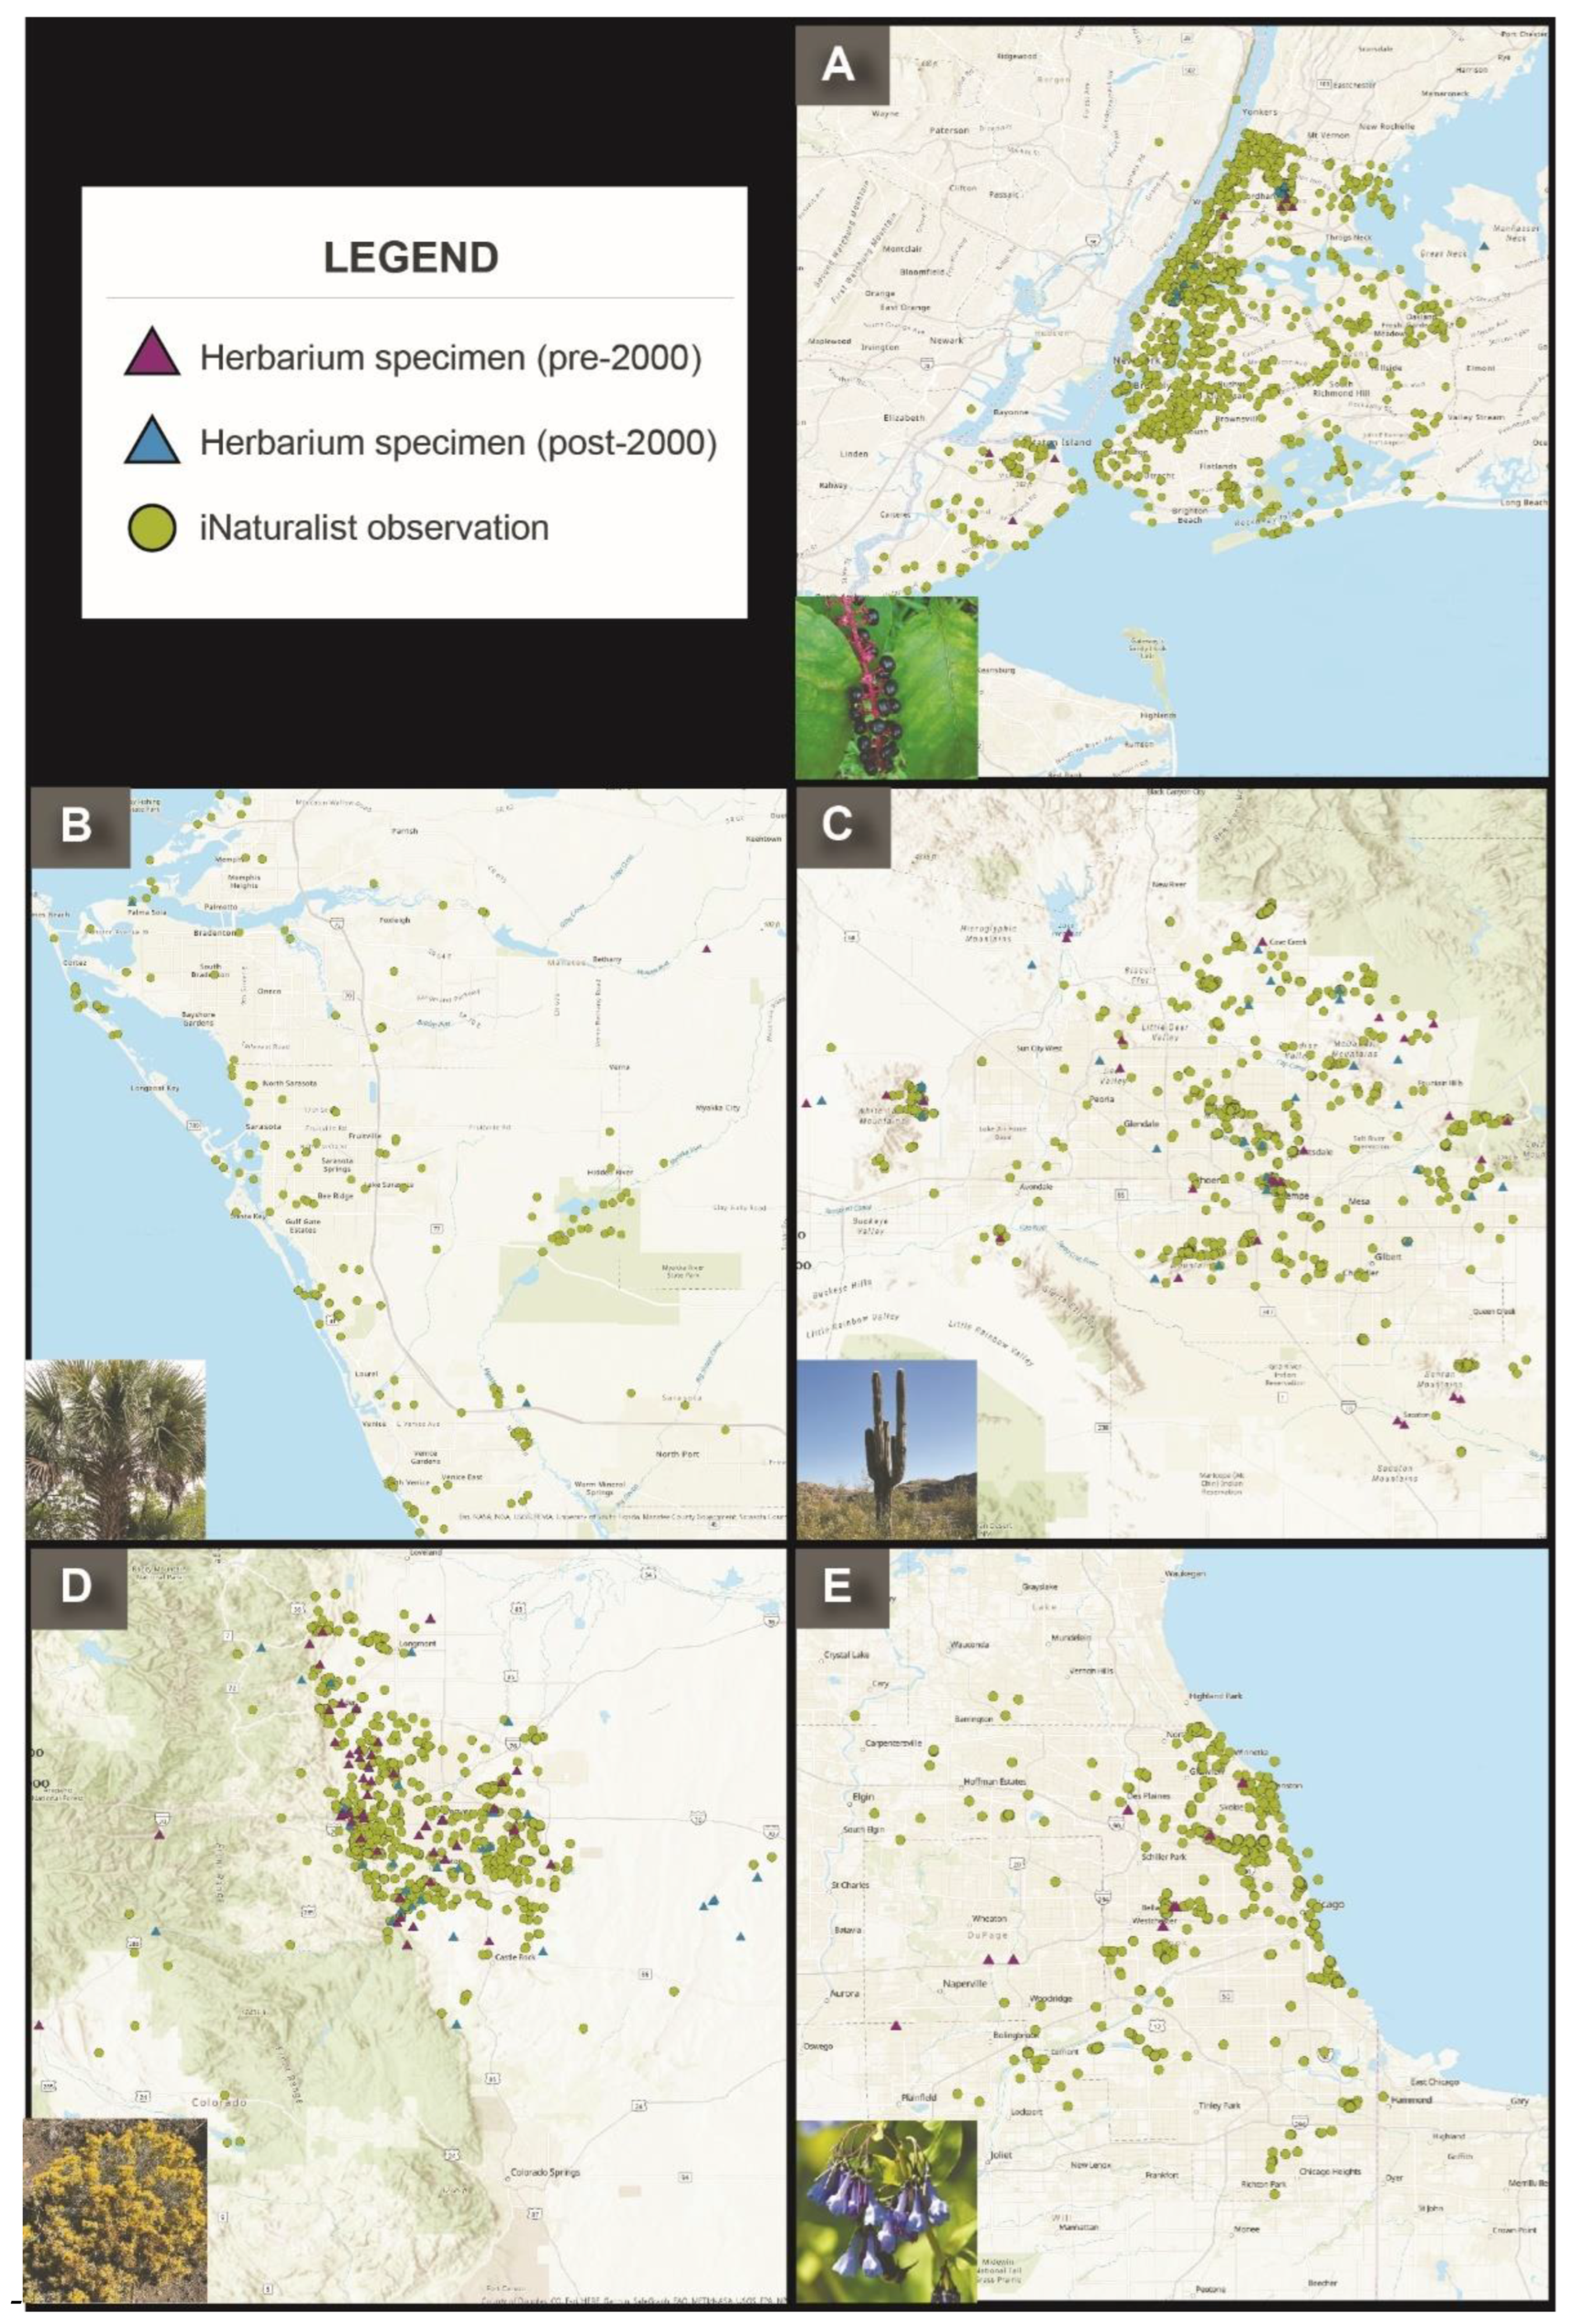
Each EcoFlora Project chose the following species to represent examples of common, widespread species (Figure 10; Supplemental Table 1): 1) Chicago: Mertensia virginica (L.) Pers. ex Link, 2) Denver: Ericameria nauseosa (Pursh) G.L.Nesom & G.I.Baird, 3) Desert: Carnegiea gigantea (Engelm.) Britton & Rose, 4) Marie Selby: Sabal palmetto (Walter) Lodd. ex Schult. & Schult.f., and 5) New York: Phytolacca americana L.
It is not unexpected that common and widespread species are more frequently recorded on iNaturalist compared to their representation in herbarium collections (Figure 10 and Figure 11). Although herbarium specimens generally cover a broad geographic range, integrating iNaturalist observations can significantly enhance the spatial resolution of species distribution (Figure 11). Consequently, for research objectives focused on common and widespread species, incorporating iNaturalist observations is highly recommended to achieve a more comprehensive and detailed coverage.
Additionally, some species might be common but just do not lend themselves well to preservation as an herbarium specimen because they are large and bulky, making them difficult to fit onto an herbarium sheet. If only using herbarium specimens, the distribution of these species may not be well-represented. For example, cabbage palm (Sabal palmetto) is not only the state tree of Florida, but also one of the most common plants in the state. These palms can grow to over 30 feet tall and live for hundreds of years. They are spread readily by birds, resulting in them being found in almost every type of natural community in the state, including as volunteers in landscaped and disturbed areas. However, there are very few herbarium vouchers for this palm in the Sarasota-Manatee area, presumably due to the height of the palms and the size of the fronds which make it challenging to press. In the New York metro area, pokeweed (Phytolacca americana), readily identifiable by its dark purple berries and bright pink stem, was the seventh most observed plant species in the New York City EcoFlora Project. The plant, which can grow up to 3 meters tall, also makes it more difficult to preserve as an herbarium specimen. Despite their prevalence in the landscape, the actual distribution of these common, widespread species can be misrepresented by examining only herbarium specimens.
Engaging the community in monitoring common plants raises awareness of their importance in biodiversity and ecosystem services. For example, Carnegiea gigantea (giant saguaro cactus) is widespread through the Phoenix metro area, but difficult to preserve as an herbarium specimen due to its sheer size as well as succulence. Therefore, Desert Botanical Garden engaged the public in observing saguaro cactus across the metro Phoenix area as part of their Saguaro Census. This census reported 19,057 saguaro observations in the Phoenix area. These observations were used as part of a bigger project, Saguaros Under Stress, led by the Garden’s New World Succulents Specialist, Dr. Tania Hernandez, to better understand the stress effects that extreme heat can have at the molecular level. Phoenix has been experiencing extreme heat. As a result, many saguaros are yellowing and wilting or have fallen and are dying. The Saguaro Census helps Garden’s researchers understand the impacts of extreme heat on one of the most charismatic plants in the Phoenix metro area. By monitoring common species such as the saguaro cactus, land managers can implement proactive management strategies to prevent them from becoming rare or threatened.

3.3.3. Pokey Plant Problems

We further explored the discrepancies between iNaturalist observations and herbarium specimen vouchers of species with spines, thorns, or prickles, otherwise known as the pokey plants. These species do not lend themselves well to collection for herbarium specimens due to their sharp, prickly nature and are often avoided by collectors [54]. Additionally, succulent plants such as cacti require additional processing time and equipment [55]. Therefore, pokey plants are often under-represented within herbarium collections. We focused on two taxonomic groups, thistles and cacti, for our case study examples. Both are heavily armed with spines, making them an undesirable plant to collect for most and difficult to wrestle into an herbarium press.
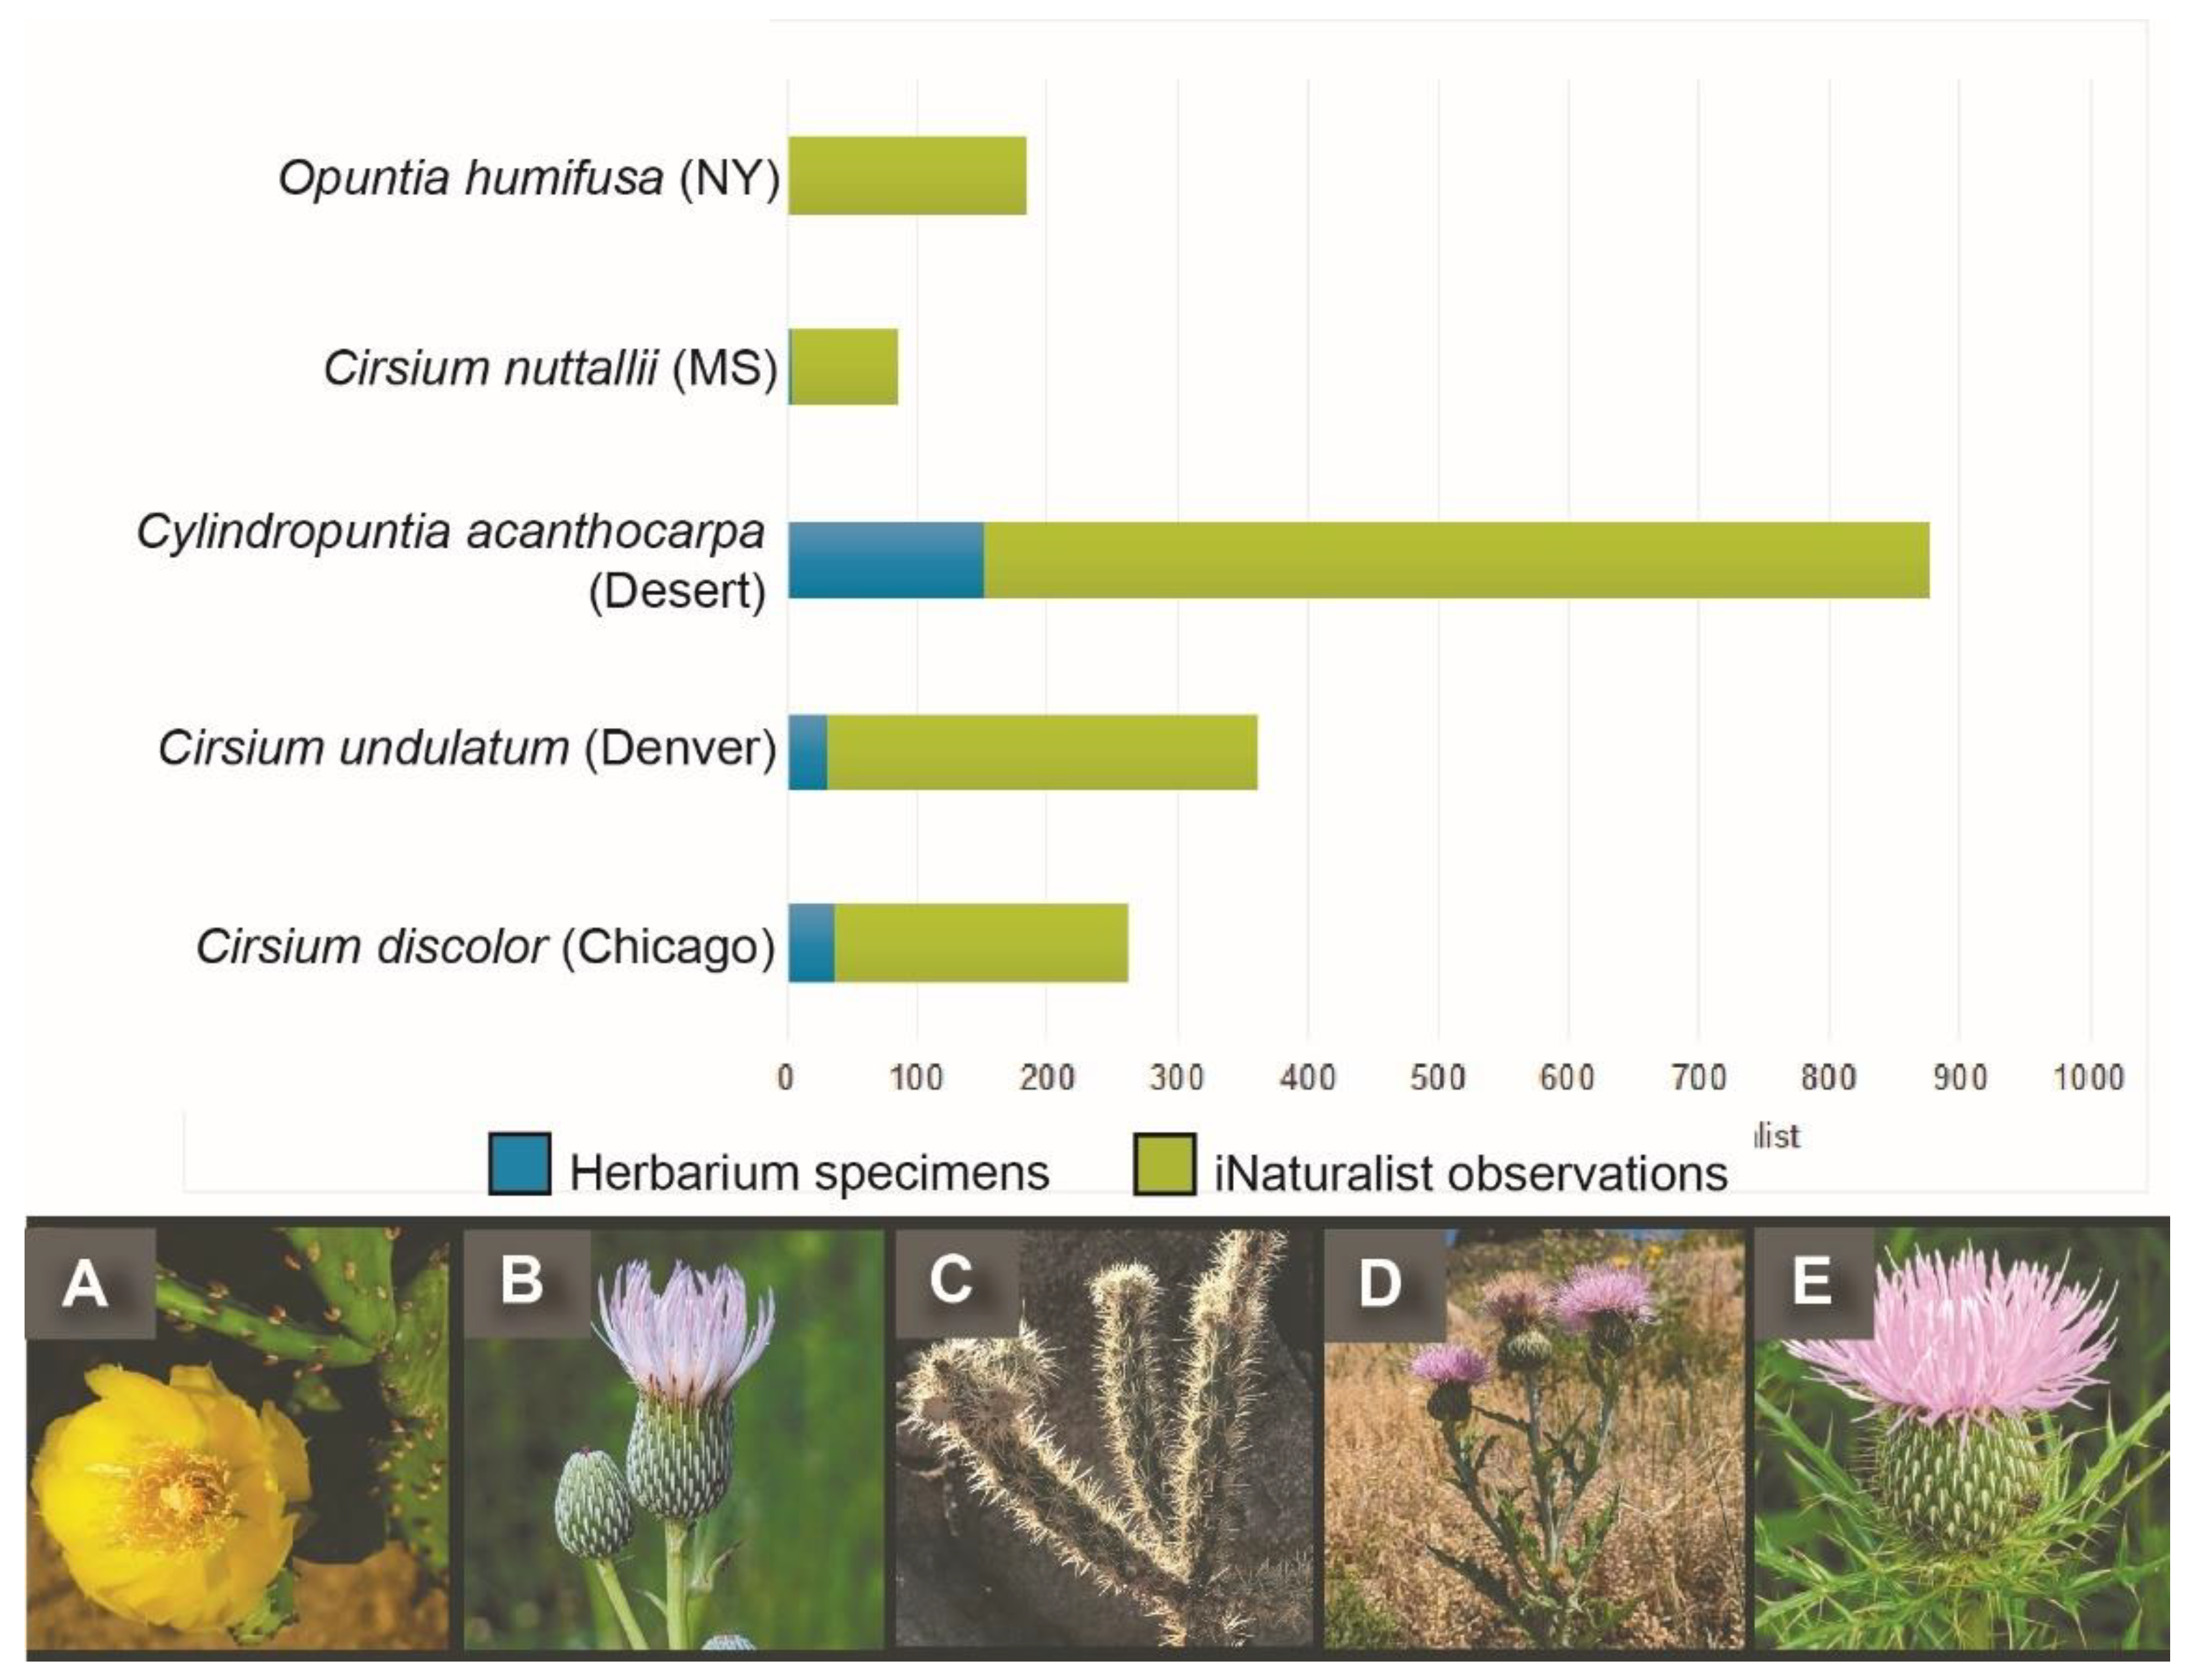
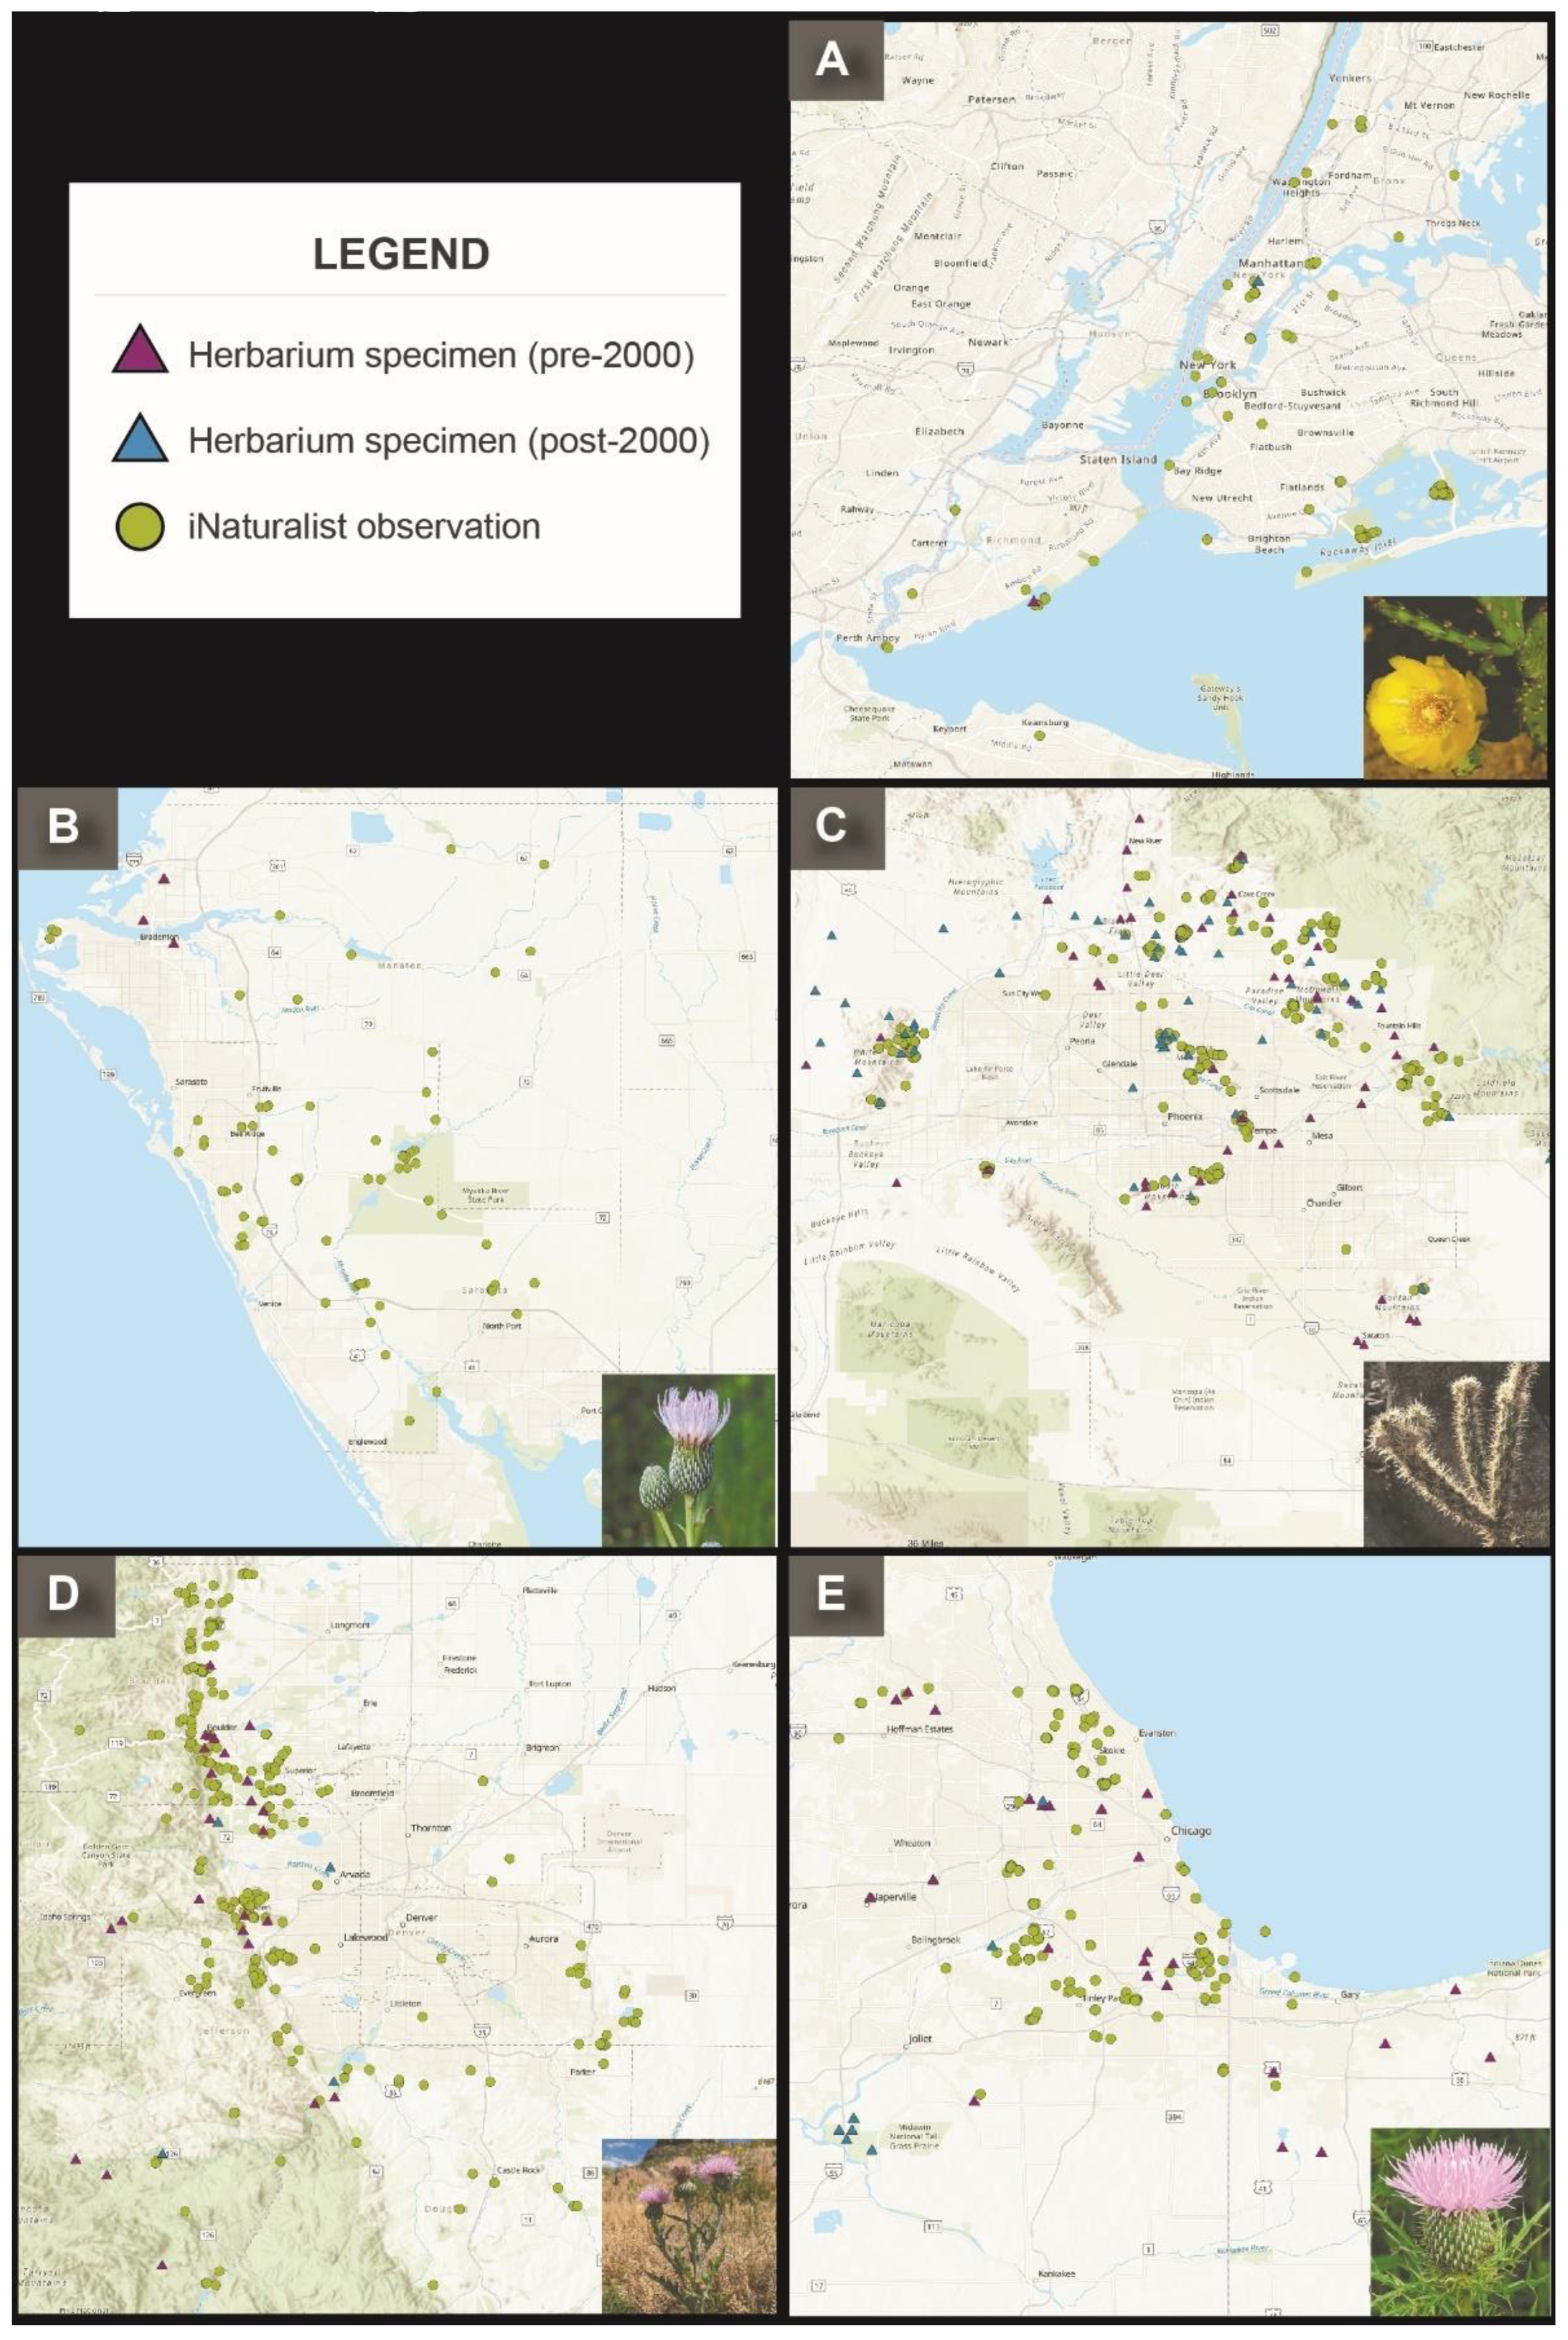
Each EcoFlora Project chose the following species to represent examples of pokey plants from their respective metro areas (Figure 12; Supplemental Table 1): 1) Chicago: Cirsium discolor (Muhl. ex Willd.) Spreng., 2) Denver: Cirsium undulatum Spreng., 3) Desert: Cylindropuntia acanthocarpa (Engelm. & J.M.Bigelow) F.M.Knuth, 4) Marie Selby: Cirsium nuttallii DC., and 5) New York: Opuntia humifusa (Raf.) Raf.
As expected, there are significantly more iNaturalist observations of these pokey plants than herbarium specimens (Figure 12 and Figure 13). While pokey plants are difficult to collect and preserve as herbarium specimens, they lend themselves well to photographic observation (Figure 12 and Figure 13). Photographs do not require touching these plants, and thus the observer is spared the sharp pain of processing them as herbarium specimens. Additionally, some pokey plants are federally Threatened or Endangered species. Collecting specimens of these species is restricted due to legal protections and conservation concerns. Therefore, photographing species such as these circumvents these issues.
Despite the challenges associated with preserving Cylindropuntia acanthocarpa, a substantial number of herbarium specimens (150) have been made. This is largely attributed to curatorial priorities and research-driven vouchering. Curators at some herbaria have a specific collection objective to document pokey plants. For example, Wendy Hodgson, curator at the Desert Botanical Garden and an expert in Agavaceae and Cactaceae, specifically targets these taxa for collection, despite the additional processing time and effort required due to their spines. Additionally, nearly 50% of the Cylindropuntia specimens were collected by Dr. Marc Baker. These collections were part of Dr.
Baker’s research on chromosome ploidy and the evolution and distribution of the Cactaceae, particularly in Cylindropuntia [56]. Thus, understanding the goals of specific collectors is essential for interpreting herbarium data.

3.3.4. Emerging Invasives (Early Detection/Rapid Response)

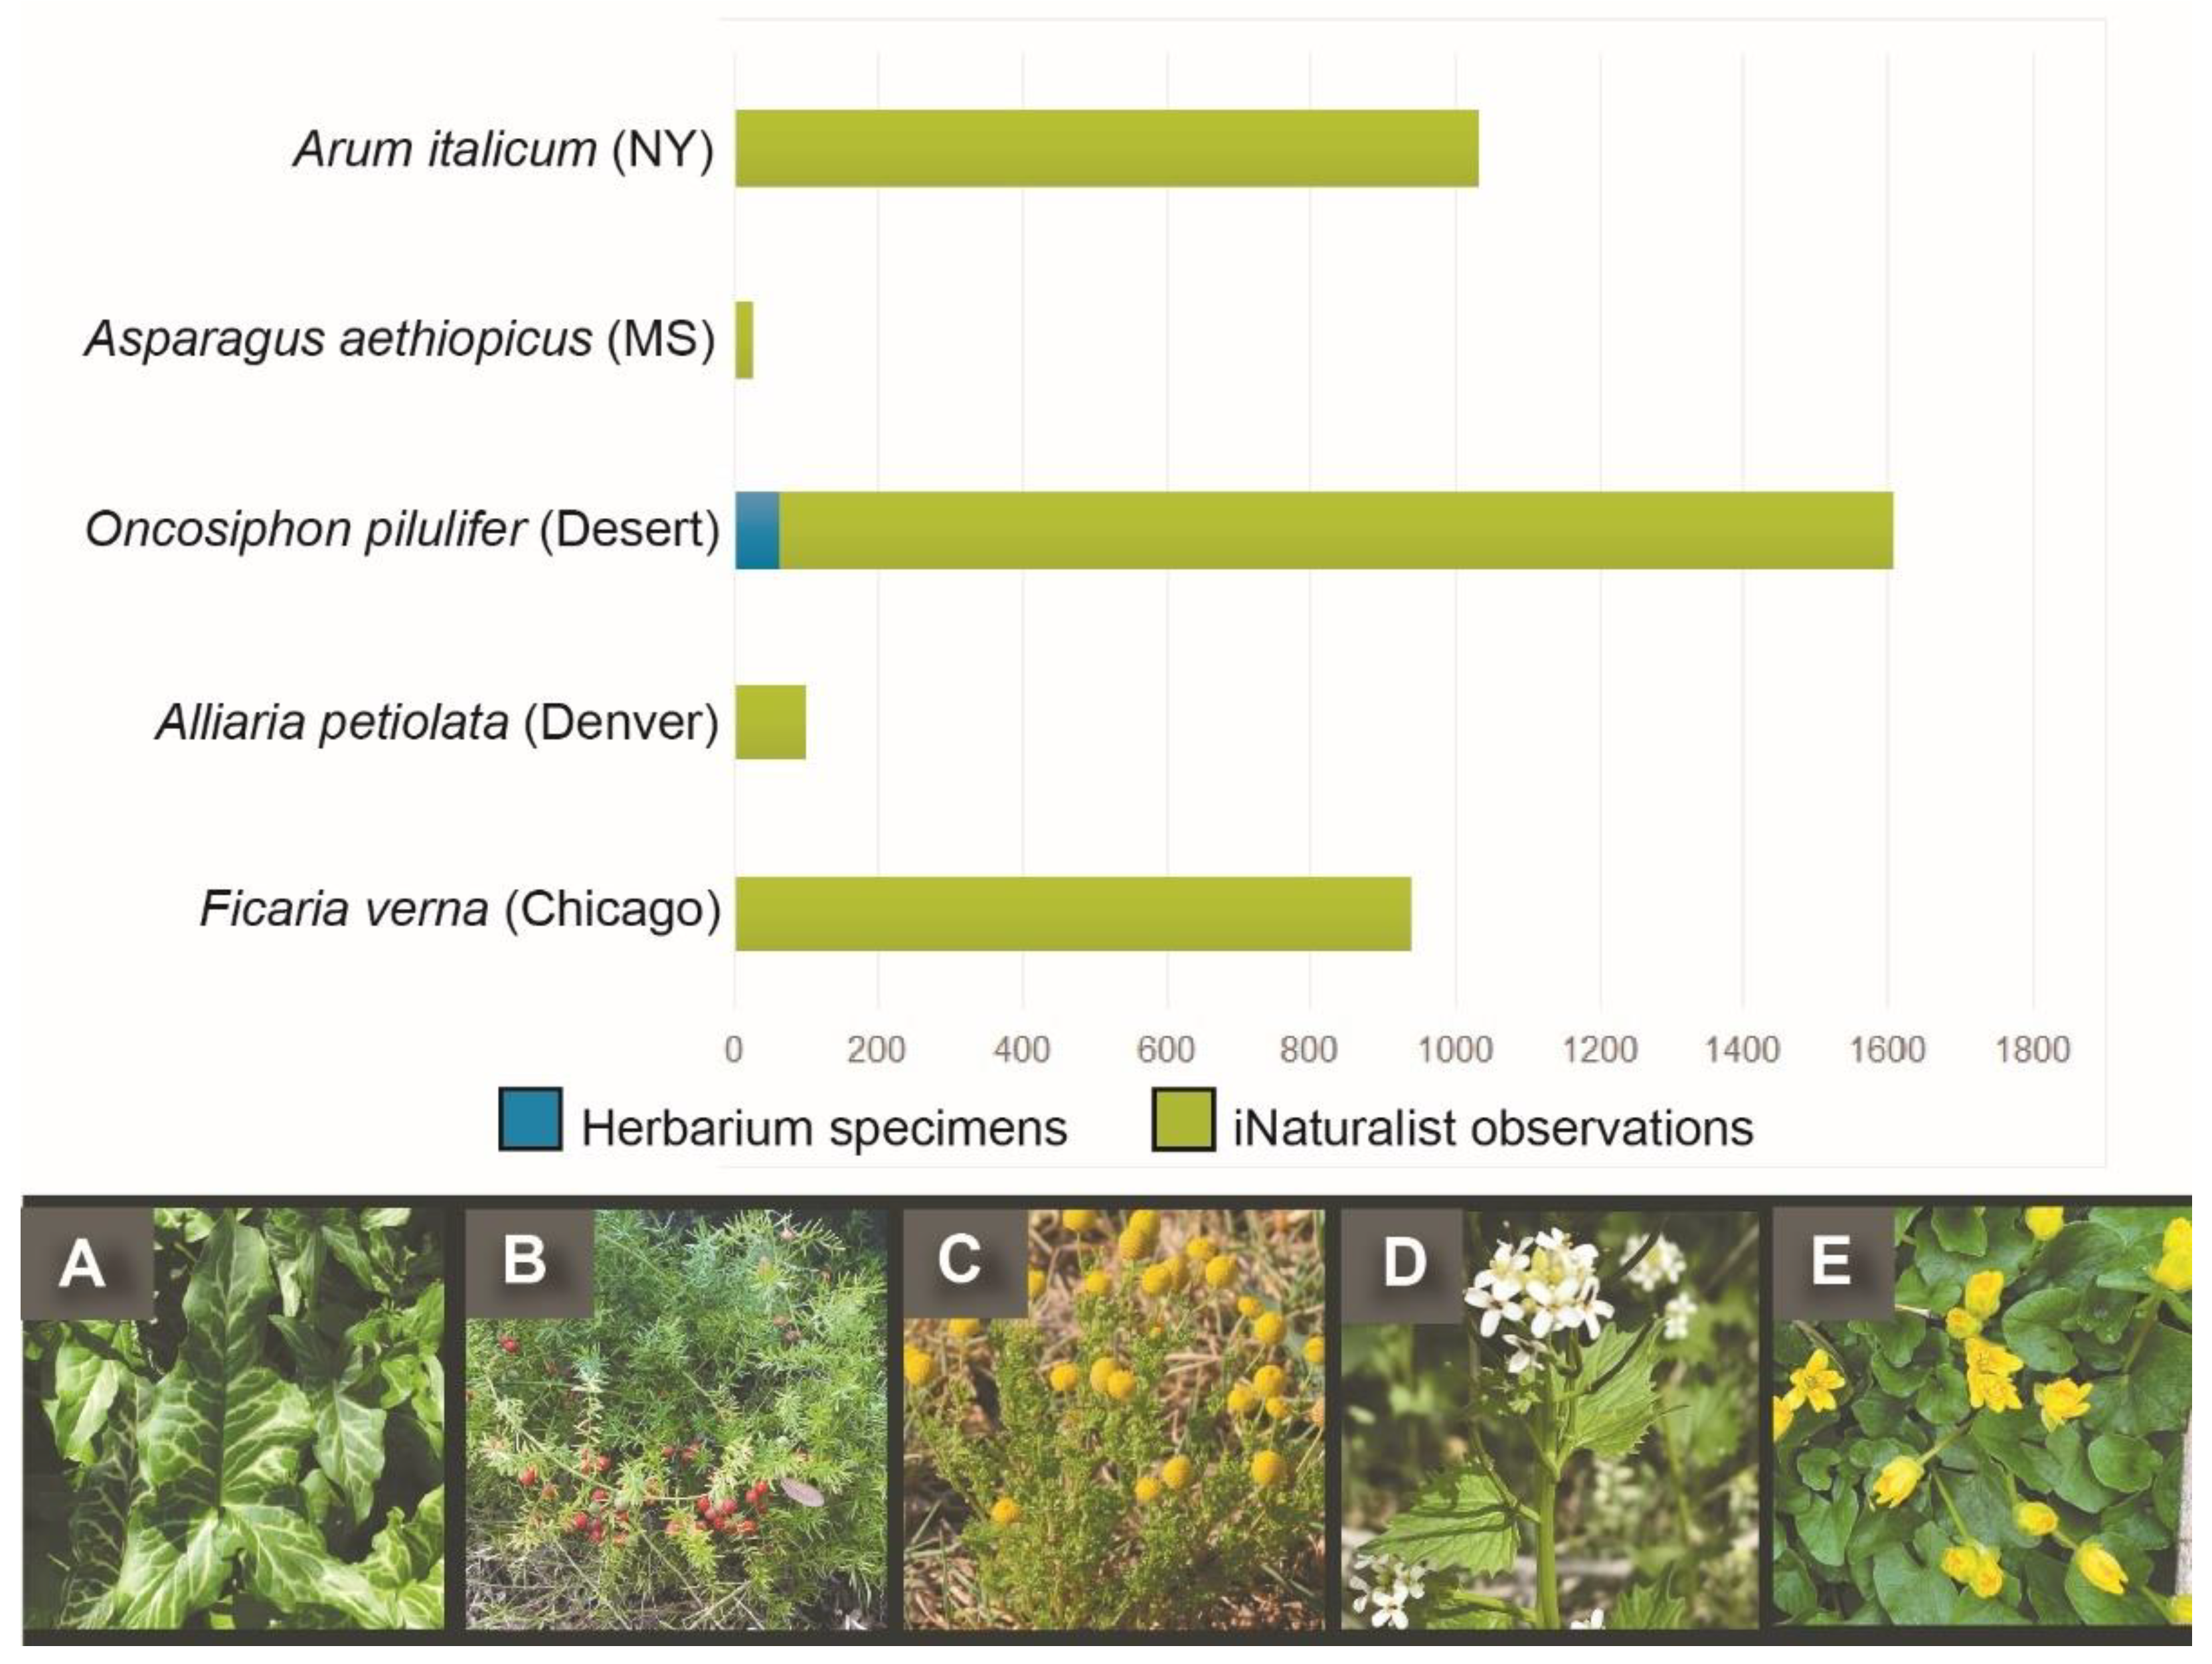
Invasive plants are non-native to the ecosystem under consideration, and once introduced, have the ability to become established and potentially cause harm to the environment, economy, or human health [57,58,59]. These species can also grow and reproduce rapidly [60,61]. One of the most effective management tools for invasive species is Early Detection and Rapid Response (EDRR) [62,63]. EDRR is a coordinated set of actions to find and eradicate new and emerging invasive species before they can spread and cause harm. Early interventions are more likely to be successful and are also more cost-effective than long-term management [64,65]. Each EcoFlora Project chose the following species to represent examples of newly invasive plants from each metro area and compare the contributions from herbarium specimens and iNaturalist observations (Figure 14; Supplemental Table 1): 1) Chicago: Ranunculus ficaria L., 2) Denver: Alliaria petiolata (M.Bieb.) Cavara & Grande, 3) Desert: Oncosiphon pilulifer (L.f.) Källersjö, 4) Marie Selby: Asparagus aethiopicus L., and 5) New York: Arum italicum Mill.
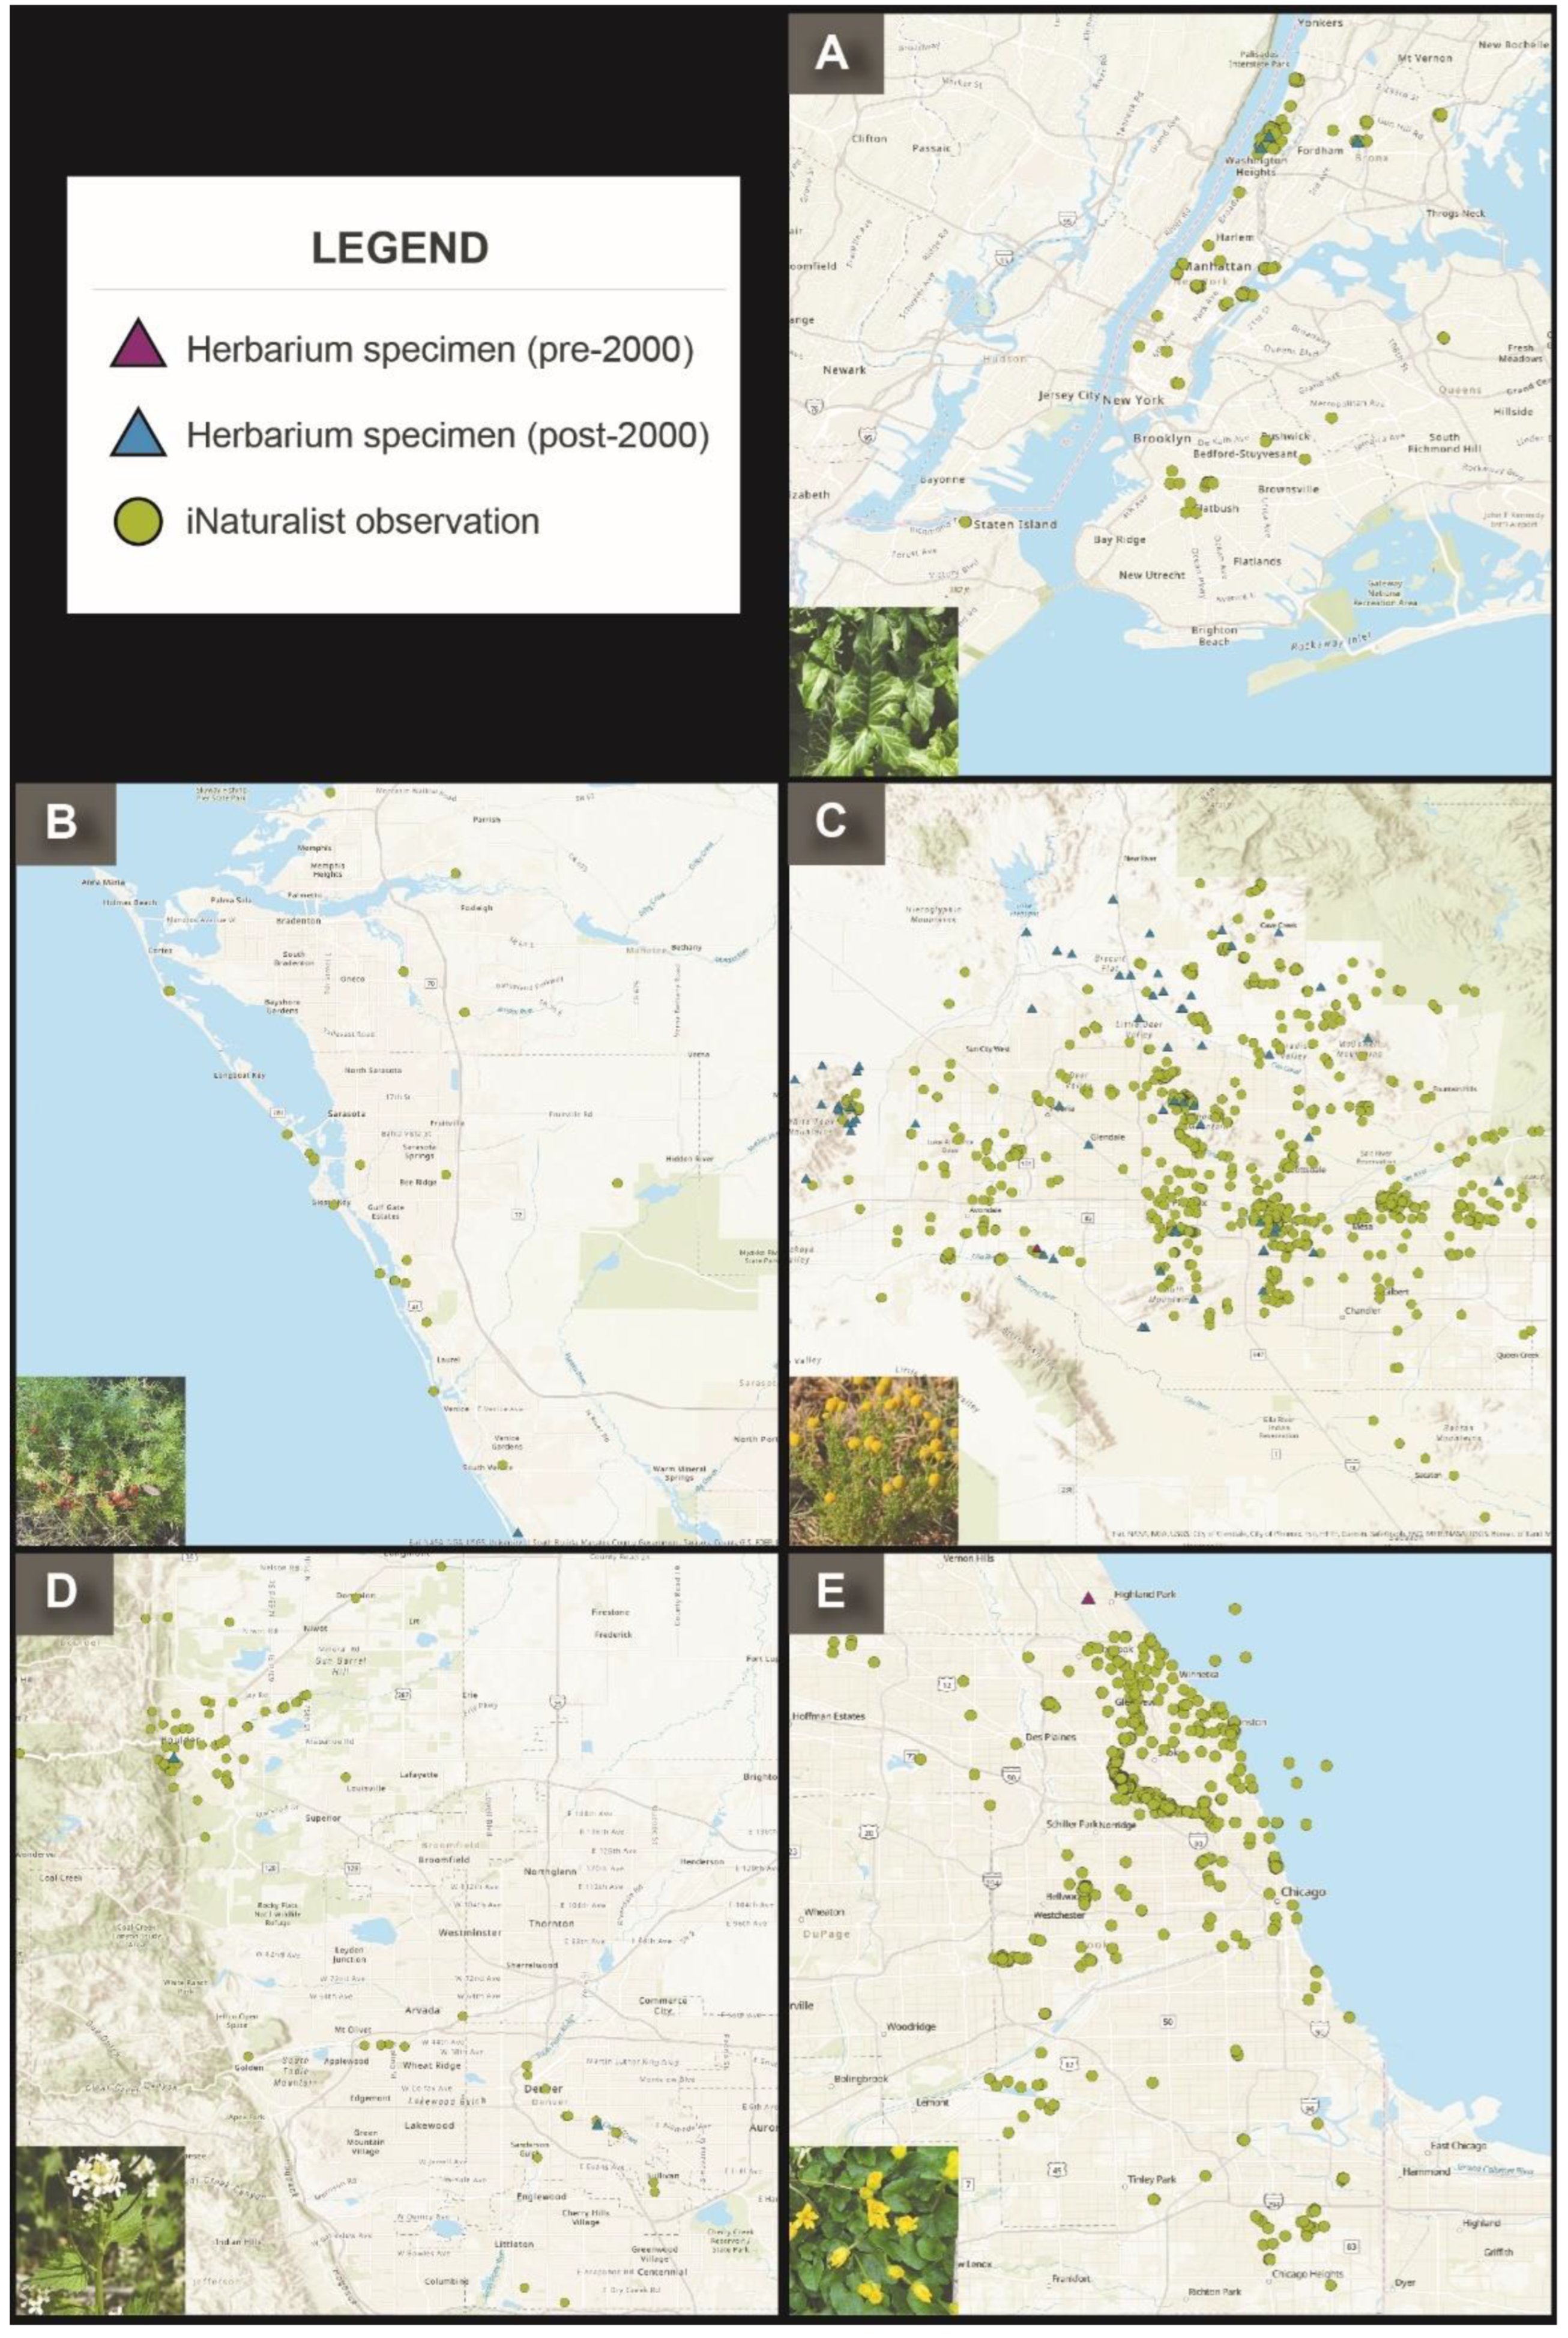
For each of these example species, their distribution is more comprehensively represented by iNaturalist observations compared to herbarium specimens (Figure 15). One of the most effective methods to control invasive species is to report occurrences to land managers or extension agents for rapid removal. However, newly emerging or recently spreading invasive species can be difficult to find and isolate in time to prevent widespread ecological damage to natural areas. Thus, iNaturalist can be a powerful tool for land managers to rapidly respond to the early detection of invasive plants [66]. Land managers can encourage staff, volunteers, and the public to use iNaturalist to report any sightings of potentially invasive plants they come across, enabling early detection of invasive species before they become widespread and established.
For instance, Asparagus aethiopicus, designated as a Category I invasive exotic by the Florida Invasive Species Council, is known for its ability to spread through bird-dispersed fruit and vegetative propagation via underground tubers, potentially displacing native species. In Sarasota and Manatee Counties, only one herbarium record exists for this species, while iNaturalist has documented 25 observations, suggesting a broader distribution than previously recorded. iNaturalist observations have provided critical data, allowing botanists and conservation land managers to substantiate what was previously only anecdotal evidence regarding the spread of this plant. Given its prevalence in the horticultural trade, even casual or cultivated observations are valuable for mapping the potential spread of this invasive species by identifying point source locations.
In the New York metro area, Italian arum (Arum italicum) was identified from several spontaneous populations in Bronx and New York counties by New York Botanical Garden staff and community scientists using iNaturalist. These were new state records. This distributional information was then shared with the Lower Hudson PRISM (Partnership for Regional Invasive Species Management) and rapid assessment following the EDRR framework was carried out [67]. Land managers can use iNaturalist observations of Ranunculus ficaria (fig buttercup) in the Chicago metro area to effectively locate and remove plants. Fig buttercup was only very recently reported from the area in 2016 but is incredibly damaging to native ecosystems because of its vigorous growth and formation of a groundcover that forms large, dense patches on the forest floor, thus displacing and preventing native plants from emerging. In the Denver metro area, Alliara petiolata (garlic mustard) is a newly emerging invasive species first reported from the Boulder-Denver area in 2005. Staff worked with invasive species managers in Jefferson County to create an EcoQuest targeting garlic mustard observations. This information was then used by county agents to locate and remove these plants.
Land managers can also use iNaturalist observations to monitor the spread of invasive plants over time [68,69,70]. By tracking changes in the distribution of invasive species, land managers can identify areas where intervention may be needed to prevent further spread. iNaturalist also allows land managers to collaborate on invasive species monitoring and management, enabling information exchange and allowing for coordinated efforts to control invasive plants across multiple jurisdictions. For example, in the Phoenix metro area, Oncosiphon pilulifer is not a “new” invasive plant to the area, as documented by an herbarium specimen from the late 1990s (Figure 15). However, the population of this species has exploded in recent years. The Metro Phoenix EcoFlora Project thus collaborated with a group called the Desert Defenders on EcoQuests designed to find and map it for removal efforts.

3.3.5. Cultivated Curation

Native, wild plants are sometimes also cultivated and grown in home landscapes. Residents can find native plants at local nurseries, through native plant societies, or as part of special programs such as Plant Select®, which distributes plants designed to thrive in high plains and intermountain regions. Native plants are ideal to use in home landscaping because they are well-adapted to local environmental conditions and are generally more resilient to pests, diseases, and extreme weather events compared to non-native species [71,72]. Therefore, the use of native plants in home landscaping has become increasingly more common.
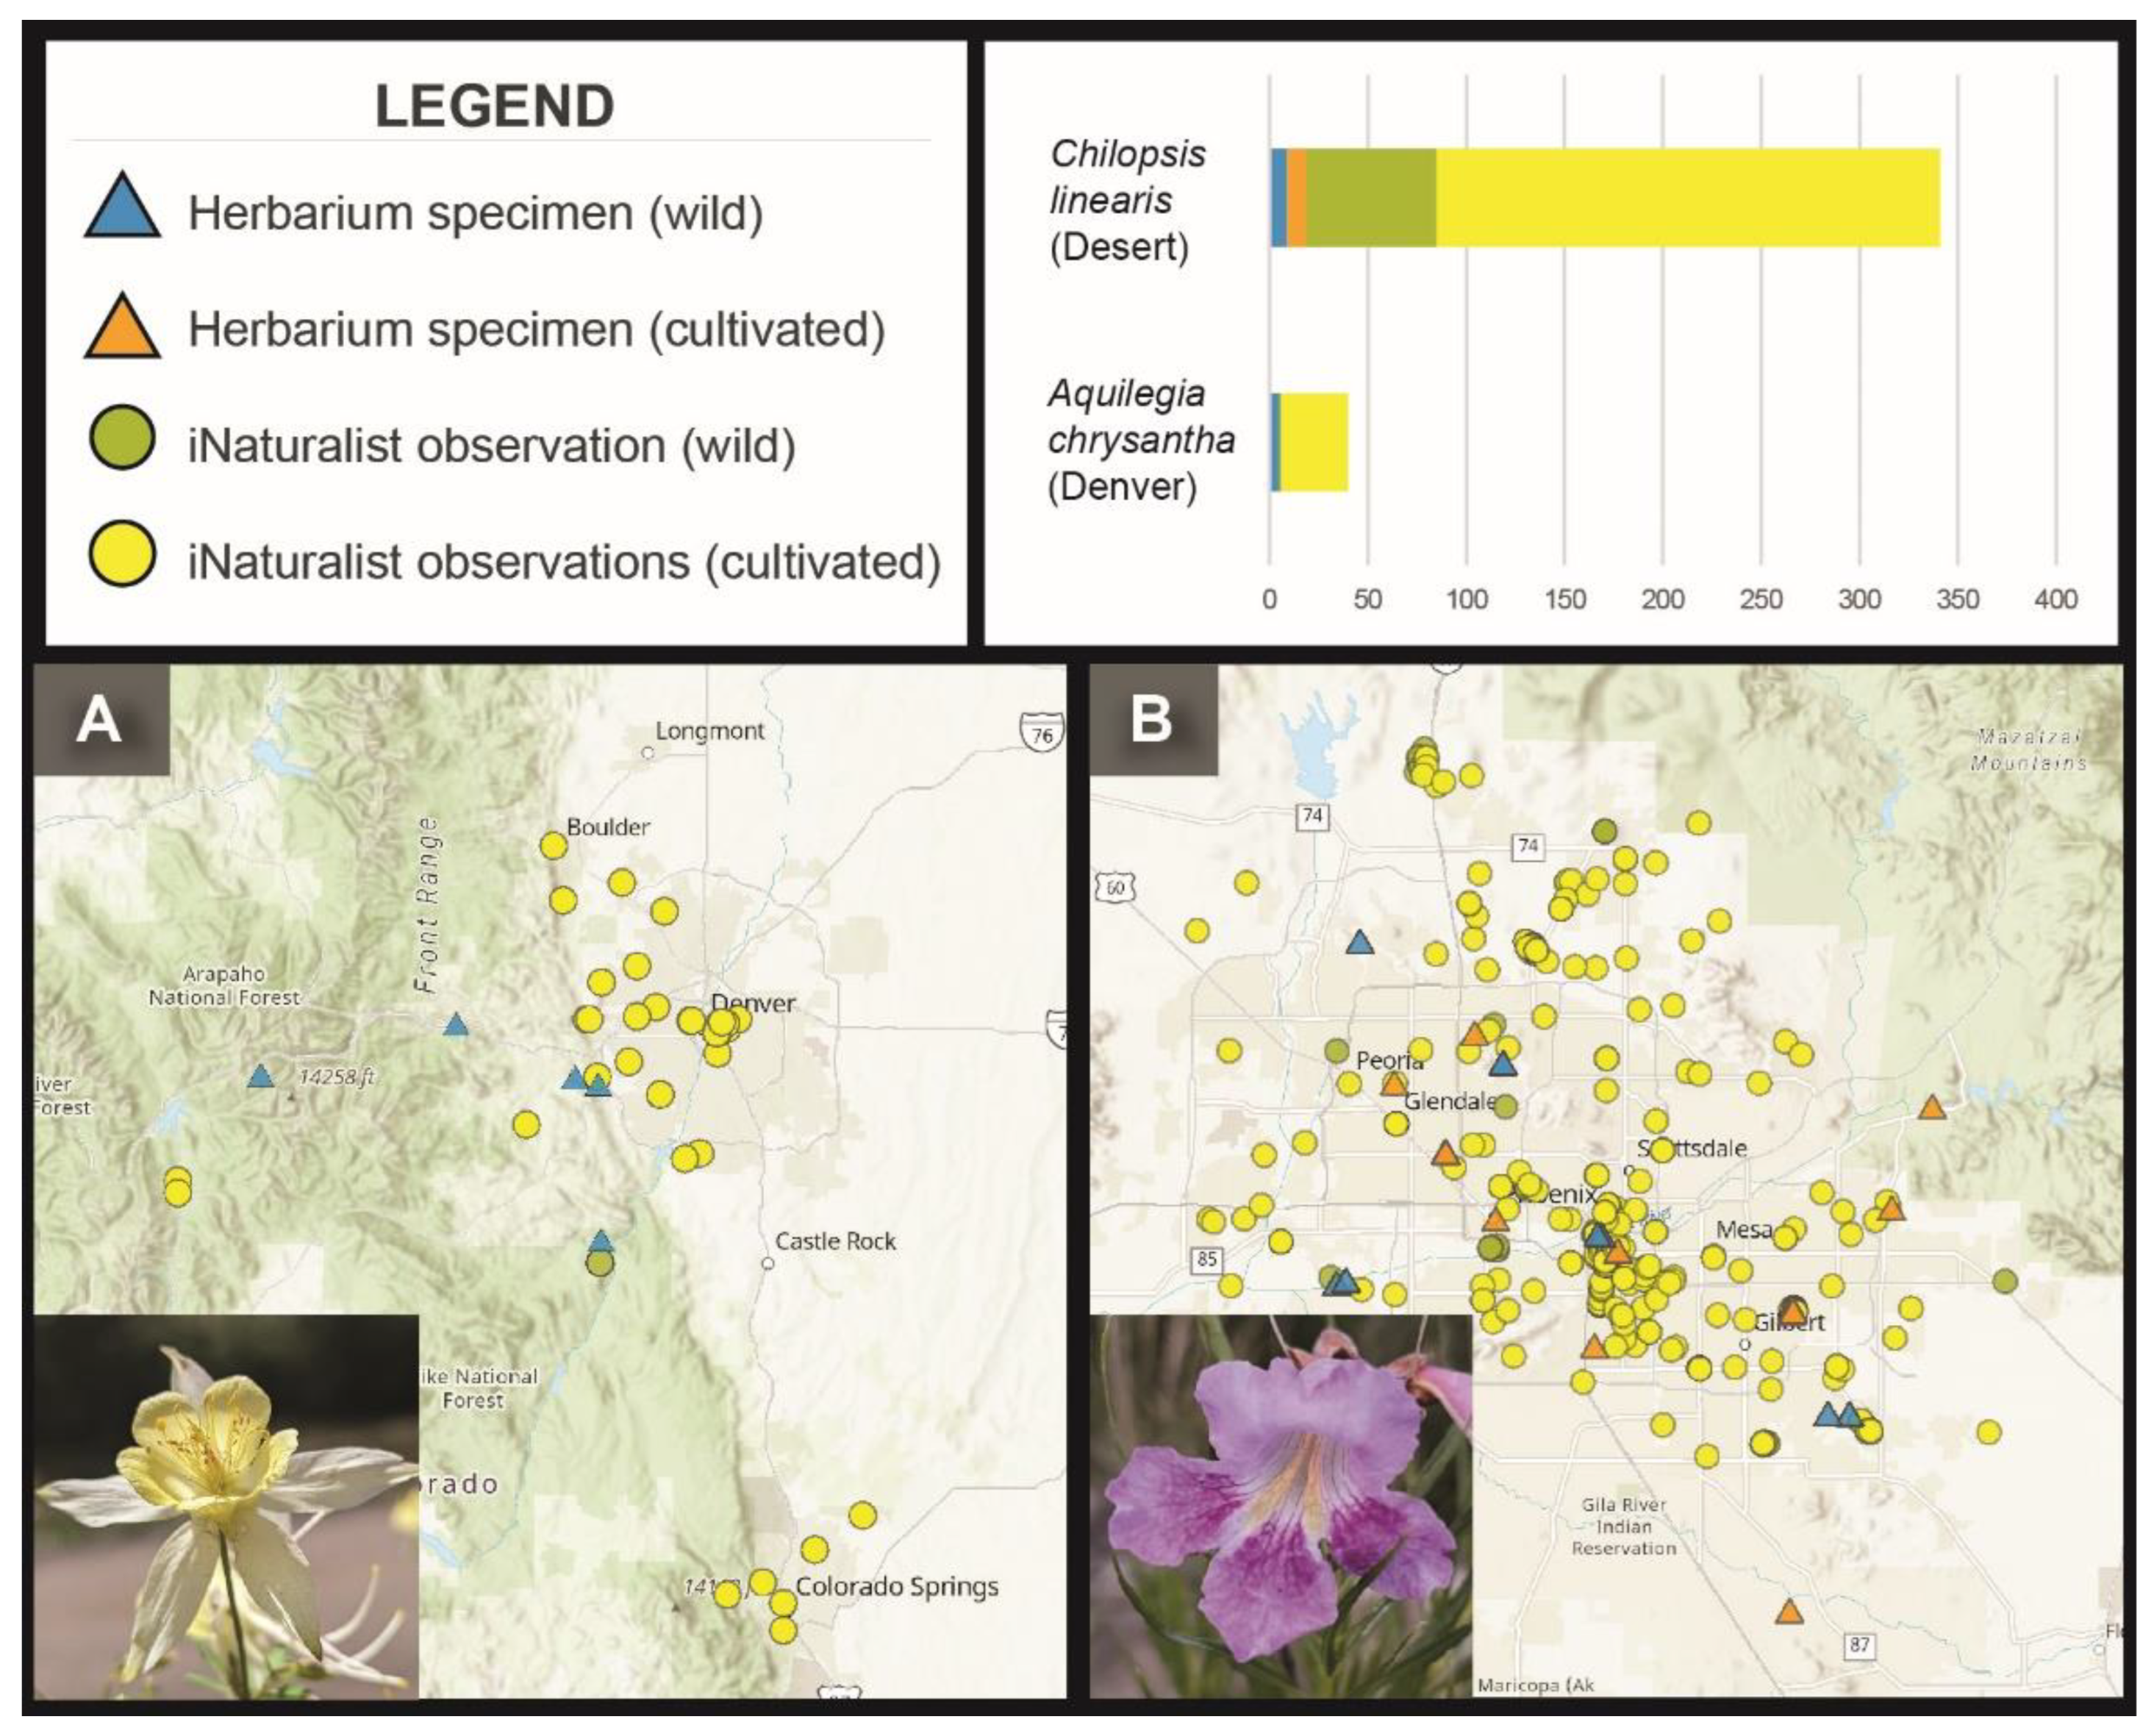
However, distributions of native plants in their natural habitats can be inflated by iNaturalist observations of cultivated material. For this case study, we selected two species for which we could clearly determine whether the iNaturalist observations were cultivated or wild. In Colorado, Aquilegia chrysantha A. Gray (golden columbine) is an Imperiled (S2) species that is uncommon in canyons and ravines in the greater Denver metro area. A particularly showy Aquilegia chrysantha was discovered and brought into the Plant Select® program and is now one of the most cultivated plants in the greater Denver metro area (Figure 16). In the greater Phoenix area, Chilopsis linearis (Cav.) Sweet (desert willow) is found in its native habitat in ravines, ditches, and seasonal streams. However, desert willow is prolific in the landscaping of the greater Phoenix area as well, where it is common in yards and other ornamental plantings (Figure 16).
The native distributions of Aquilegia chrysantha and Chilopsis linearis were initially obscured by observations of cultivated plants prior to their designation as "not wild" in iNaturalist (Figure 16; Supplemental Table 1). Additionally, some herbarium specimens of cultivated Chilopsis linearis were identified. Therefore, it is crucial to examine the provenance of both iNaturalist observations and herbarium specimens when assessing the distributions of plants commonly used in horticulture. For rare species like Aquilegia chrysantha, inaccurate distribution records could lead to an overestimation of the species' abundance, potentially affecting conservation efforts. Consequently, when documenting plants that are both native and used in landscaping, it is essential for observers to mark such observations as cultivated. Once marked as cultivated, these records are classified as "Casual" and are excluded from achieving "Research Grade" status.
Marking observations as cultivated is also important for introduced species. A commonly cultivated fern in Sarasota and Manatee Counties is the introduced staghorn fern, Playtycerium bifurcatum (Cav.) C.Chr. Even though there is only one herbarium voucher of a naturalized plant from Sarasota County, there are anecdotal reports of more frequent “wild” occurrences, and the species is considered a Category II invasive exotic by The Florida Invasive Species Council. Some iNaturalist project participants marked their observations as cultivated where appropriate and this has been helpful in distinguishing these from the naturalized observations. More effort is needed to document postings as cultivated if appropriate to help us better understand the frequency of occurrence of escaped staghorn ferns. Marking observations of naturalized occurrences is important for eradication of this invasive species by allowing land managers to discern observations that are truly invasive versus merely cultivated. Incorporating training on how to appropriately mark observations as cultivated should be a key component of iNaturalist educational programs.

3.3.6. Tiny Feature Phenomenon

There are limitations to the identifications that can be made for some observations on iNaturalist. For example, some photographs are too blurry or too far away to see details clearly. For others, specific parts of the plant are not visible for accurate identification. Lastly, some groups require microscopic examination to identify the observation to species or even genus. These tiny features simply are not visible in a regular photograph. Therefore, some observations may never attain “Research Grade” status.
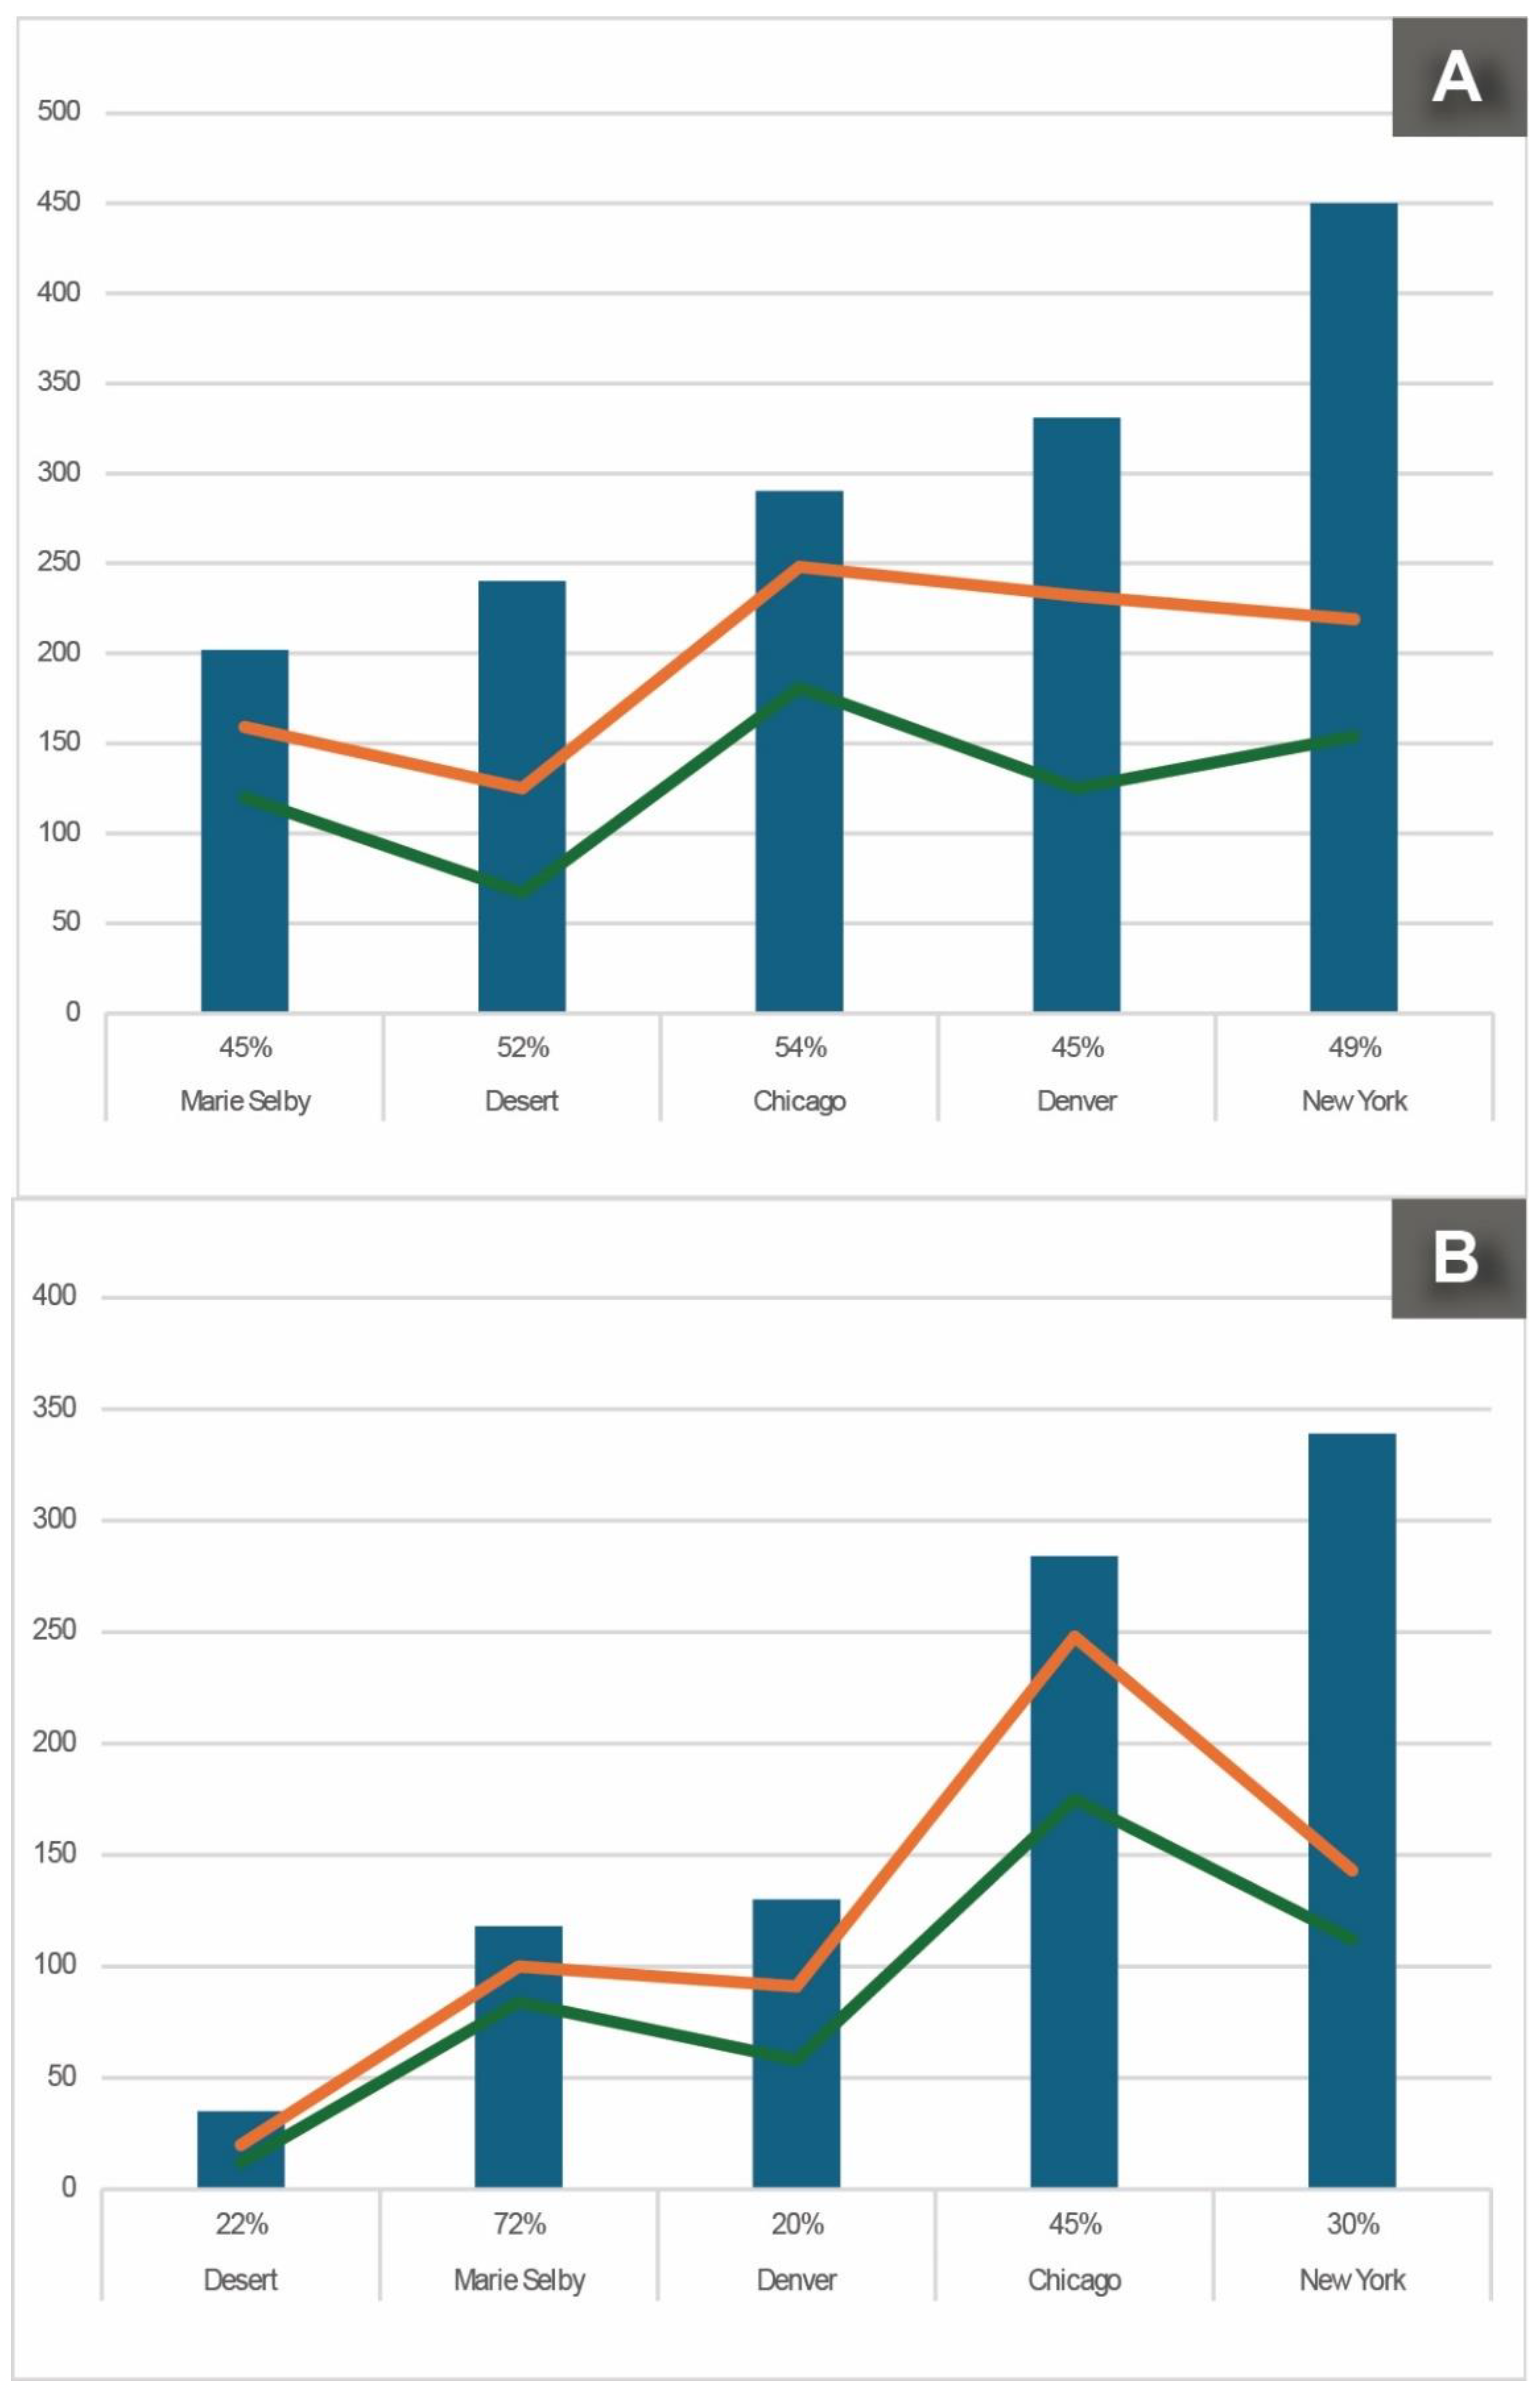
Members of the Poaceae (grass family) and Cyperaceae (sedge family) are among the most challenging groups to identify to the species level, even with herbarium specimens, as accurate identification often requires microscopic examination of key morphological features. These families are also widely distributed across all respective metro areas. Therefore, to understand how the tiny feature phenomenon impacts the total number of “Research Grade” iNaturalist observations, we explored the number of unique taxa of grasses and sedges represented by herbarium specimens and iNaturalist observations for each respective metro area (Figure 17).
iNaturalist observations captured 30-62% of the total sedge and grass diversity across the metro areas relative to herbarium specimens for metro regions (Figure 17). Herbarium specimens were overwhelmingly more likely to be identified to species versus iNaturalist observations. The percentage of iNaturalist observations of grasses and sedges verified to species that were “Research Grade” ranged from 45-54% and 20-72% respectively among the metro areas (Figure 17). Conversely, herbarium specimens were verified to species level for 99% of specimens across all metro areas.
Several underlying factors contributed to the discrepancy between iNaturalist observations and herbarium specimen identifications. Our analysis revealed that the number of taxa reported in the "Needs ID" category on iNaturalist was inflated due to misidentifications. For instance, grass and sedge species that are not native to or present in the respective metro areas were incorrectly identified by users on the platform. Another factor influencing the attainment of "Research Grade" status for observations is the presence of an expert in a specific genus or family actively verifying identifications on iNaturalist. For example, 72% of the Cyperaceae observations from Marie Selby achieved "Research Grade" status, primarily due to the involvement of a local expert who contributed thousands of identifications.
Although we provided examples from Poaceae and Cyperaceae, there are other groups of plants that require microscopic examination for accurate identification. For example, ferns can also be challenging to identify if the necessary characteristics are not present or photographed by the observer. This has been particularly true for the Boston ferns (Nephrolepis spp.). For example, there are currently over 150 observations of Boston ferns posted in the Sarasota-Manatee Ecoflora project that have not been identified to species or elevated to “Research Grade” status because the posts lack images of the rachis scales that are important to confirm identification. These scales are small and often require some magnification to be clearly visible. Fine details such as these are usually not visible in a photograph unless the user has access to a macro lens attachment or microscope.
If examination of microscopic characters for these difficult groups was possible, the number of “Research Grade” observations and taxa represented would undoubtedly increase. There is one potential solution to the tiny feature phenomenon problem. Observers can use a macro photography clip-on accessory for smartphone devices to try to capture microscopic details. However, this takes additional time for photographs as well as beforehand knowledge of which parts of the plant are necessary to view close-up.

4. Discussion

Management of the EcoFlora Projects on iNaturalist by each botanic garden provided valuable insight into the advantages and disadvantages of using iNaturalist data versus herbarium specimen data. Both iNaturalist observations and herbarium specimens have distinct advantages and limitations, but together, they provide a more comprehensive understanding of past and present biodiversity. iNaturalist observational data is inherently more opportunistic in its collection [73]. However, some users are more methodological in their observations, targeting specific taxonomic groups or rare species that have not been documented on iNaturalist. It is important to note that collection bias exists in herbarium specimen collections as well as iNaturalist observations [74,75,76]. Therefore, it would be beneficial to combine both observational and specimen datasets to overcome as many biases as possible.
The case studies presented here highlight the importance of incorporating iNaturalist observations for studying species’ distributions. First, iNaturalist data can significantly increase the number of data points available for analysis, thereby enhancing the robustness and accuracy of distribution or ecological niche models. Second, iNaturalist observations can reveal previously undocumented populations of plant species, which is essential for effective conservation planning and timely interventions, especially if the species is rare. Third, public participation in data collection promotes stewardship and raises awareness about the importance of monitoring and conserving plants. In this regard, iNaturalist functions as an educational platform, increasing public understanding of biodiversity and the conservation challenges faced by rare species. Furthermore, using iNaturalist for monitoring and tracking plant species can be a cost-effective strategy for land managers and conservationists, requiring fewer resources and financial investment compared to traditional field surveys. However, it is important to note that the coordinates of vulnerable plant species on iNaturalist are automatically obscured to protect the species, unless access to the exact coordinates is granted to the user.
Below, we list pros and cons of iNaturalist observations and herbarium specimens:
iNaturalist Observations
Pros:
  • Real-Time Observations: Provides up-to-date information about species occurrences and distribution patterns.
  • Public Engagement: Involves the public in scientific research, increasing awareness and appreciation of biodiversity.
  • Large Dataset: Millions of observations provide a robust dataset for ecological studies.
  • Geographical Coverage: Observations from all over the world, including underexplored regions, enhance geographical data diversity. Users do not need a permit to make an observation unlike for an herbarium specimen collection, thus increasing usability.
  • Image Documentation: Photographs help understand species’ morphology across a geographic range. Users can upload multiple photographs to a single observation to aid in documenting morphology. Users can tag other organisms so that observations document species’ interactions.
  • Accessibility: The platform is freely accessible to anyone with internet access, encouraging widespread use.
  • Interactive Community: Provides a community-driven platform for users to discuss and validate observations.
  • Educational Tool: Easy to use in educational settings to teach about biodiversity, ecology, taxonomy, and conservation.
  • Financial: Less cost intensive to make observations than to house physical specimens.
  • Data quality: More precise locations (unless coordinates are obscured). Because of their pinpointed geographic locality, iNaturalist observations are useful to track down specific plants or populations to add value to herbarium collections or for researchers looking for a specific species to voucher. These observations can be used to document new county records, fill in distribution gaps, make a collection of a distinctive phenotype, or as tissue vouchers for DNA extraction.
Cons:
  • Data Quality: Identification accuracy can vary due to non-expert contributors and community curation. Misidentifications can be difficult to overturn.
  • Temporal Bias: More observations during certain times, like weekends or favorable weather conditions, can skew data.
  • Spatial Bias: Overrepresentation in easily accessible areas may lead to uneven geographical data.
  • Limited Historical Data: As a recent platform, it lacks long-term historical data compared to herbarium specimen data.
  • Species Coverage Bias: More popular or charismatic species might be overrepresented in observations.
  • Identification Challenges: Despite community validation, some observations may remain unverified because photographs lack visible characters needed to identify to species.
  • Limited Environmental Context: Observations might lack detailed environmental or ecological context because users concentrate on providing detailed photographs instead of habitat information.
  • Privacy Concerns: Users may choose not to share exact location data due to privacy concerns, resulting in imprecise locations. Vulnerable species that have locations automatically obscured on iNaturalist are not precise.
  • Technological Limitations: Requires access to a smartphone or computer with an internet connection, which may not be available to all potential contributors.
  • Non-physical Limitations: Photographs cannot be used for genetic research or examined closely for morphology.
  • Scientific Reference: The longevity of photographs online is unknown. Digital assets could become lost if not properly backed up.
Herbarium Specimens
Pros:
  • Historical Data: Provides long-term records of species distributions and changes over centuries. Provides a baseline for studying changes in plant populations and distributions over time.
  • Accurate Identifications: Physical specimens allow for thorough verification and taxonomic study. Many specimens have been examined/annotated by experts.
  • Scientific Reference: Serve as a “permanent” scientific reference for future studies and species descriptions.
  • Broad Range of Data: Each specimen can include detailed metadata, such as location, date, and habitat information.
  • Genetic Studies: Specimens can be used for genetic analyses to understand evolutionary relationships.
  • Physical Specimen: Allows for examination of plant morphology and anatomy over time. Preserved specimens allow users to dissect and examine parts under a microscope. Other features such as endophytic fungi, microbes, etc. may be specimens or attached to roots.
  • Integration with Digital Tools: Digitization improves accessibility and data sharing. Photographs provide quick access to specimens without having to acquire specimens via a loan.
  • Contributions to Conservation: Historical records aid in assessing species’ conservation status and habitat/landscape changes.
  • Collaborative Research: Supports collaborative research through specimen loans and exchanges between institutions.
Cons:
  • Limited Temporal Coverage: May not represent current populations or distributions accurately because of lack of active collecting. May have underrepresented collections of common, widespread species.
  • Taxonomic Bias: Specimens may have a taxonomic bias depending on the purpose of the collections and the collector.
  • Resource Intensive: Collecting, storing, and maintaining specimens requires significant resources, finances, and expertise.
  • Access: Physical access can be limited, although digitization efforts are improving.
  • Geographical Bias: Collections may be biased towards regions with more historical collecting activity.
  • Collection Bias: Historical collecting practices may have focused on certain species or habitats, leading to gaps in data.
  • Physical Degradation: Specimens can degrade over time, especially regarding DNA quality, making them less useful for genetic studies. Pressed and dried specimens can lose some morphological features.
  • Data Quality: Locations, particularly from older specimens, can be imprecise and vague. Prior to widespread GPS use, locality data relied on verbal descriptions or at best township, range, and section which plotted specimens to a one-mile square radius.
  • Storage Challenges: Requires significant space and appropriate environmental conditions for storage. Can be difficult to acquire new collections if space is limited.
  • Limited Public Engagement: Primarily used by researchers, with less direct public and student involvement compared to community science platforms.

5. Conclusions

The integration of iNaturalist observations and herbarium specimen data is becoming increasingly vital in botanical research and conservation efforts. Both sources of data provide unique strengths—iNaturalist offers extensive observational data, often contributed by community scientists, while herbarium specimens provide a historical and verifiable record of plant distributions. However, to maximize the utility of these data sources, it is essential to implement rigorous data cleaning processes to eliminate errors such as duplicates and misidentifications. iNaturalist also serves as a powerful educational tool, fostering public engagement and awareness in biodiversity and conservation efforts. However, challenges remain, such as ensuring that cultivated plants are accurately marked and addressing the need for more expert identifiers to verify observations, especially in taxonomically complex groups.
Despite the convenience offered by iNaturalist, it is essential that herbaria continue to actively collect specimens. This will ensure that herbaria remain a vital resource for botanical research and conservation by serving as long-term repositories of plant specimens and their accompanying data. Continuing to collect specimens ensures that herbaria remain relevant for tracking changes in plant distribution, supporting taxonomic research, and guiding conservation efforts. These specimens also enhance the educational and research value of herbaria, providing essential resources for scientific studies and training.
Looking to the future, a key development will be linking herbarium specimens with corresponding iNaturalist observations on biodiversity portals such as GBIF. This approach will allow researchers to view photographs of plants before pressing, providing a more complete understanding of the species’ morphology, particularly for those that are difficult to preserve as specimens. By combining the real-time power of iNaturalist with the historical depth of herbarium specimens, researchers and land managers can create a robust and dynamic approach to plant conservation that not only enriches scientific understanding but also empowers global stewardship of our planet's biodiversity.

Supplementary Materials

The following supporting information can be downloaded at the website of this paper posted on Preprints.org, Supplemental Table 1.

Author Contributions

Conceptualization, J.A. and B.B.; Methodology, J.A..; Validation, J.A., E.G., and L.P.; Formal Analysis, J.A. and L.P.; Investigation, J.A.; Resources, J.A.; Data Curation, J.A., E.G., and L.P.; Writing – Original Draft Preparation, J.A.; Writing – Review & Editing, J.A., B.B., and E.G.; Visualization, J.A.; Supervision, B.B.; Project Administration, J.A., B.B.; Funding Acquisition, B.B.

Funding

This project was made possible, in part, by generous funding from the Institute of Museum and Library Services (IMLS) grant number MG-70-19-0057-19. Additional funding was provided by the five public gardens that were recipients of this IMLS grant: The New York Botanical Garden, Chicago Botanic Garden, Denver Botanic Gardens, Desert Botanical Garden, and Marie Selby Botanical Gardens.

Institutional Review Board Statement

Not applicable.

Data Availability Statement

The data that support the findings of this study are openly available in Science Data Bank at http://doi.org/10.57760/sciencedb.13376. These data were derived from the following resources available in the public domain: SEINet (http://swbiodiversity.org) and iNaturalist (http://inaturalist.org).

Acknowledgments

The authors are grateful for the vision of the funders of this project, referenced above, that enabled the creation of five urban EcoFlora Projects at public gardens in the United States: New York City EcoFlora in 2017, and then the Chicago EcoFlora, Denver EcoFlora, Metro Phoenix EcoFlora, and the Sarasota-Manatee EcoFlora in 2020. Likewise, they are grateful to their scientific and administrative colleagues at their respective institutions for their support of this project and of the EcoFlora concept more broadly.
The authors also want to acknowledge the generations of botanists that have collected the millions of specimens of the plant species documented for the five EcoFlora Project boundaries, and to the many herbaria that have been, and continue to be, vital custodians of the specimens and the data associated with them. The transformational role of Symbiota, as a content management system and a tool for specimen-based biodiversity data, cannot be overestimated in the EcoFlora Project; the Southwest Environmental Information Network (SEINet), a data portal of Symbiota, was especially valuable for the specimen analyses conducted in this paper.
Equally, the authors acknowledge the thousands of dedicated community scientists who have made original observations of plant species on iNaturalist contributing to the five EcoFlora Projects, capturing images of the plants, often with associated organisms, and very importantly the precise geolocations for each observation. The authors are grateful to the visionary and talented developers of iNaturalist for enabling a seamless, accessible means for the acquisition of research grade biodiversity data that get uploaded to the Global Biodiversity Information Facility (GBIF), where these observational data reside alongside specimen-based data to create a robust dataset for a wide range of biodiversity applications.

Conflicts of Interest

The authors declare no conflicts of interest.

References

  1. Kerr, J.T.; Currie, D.J. Effects of Human Activity on Global Extinction Risk. Conserv. Biol. 1995, 9, 1528–1538. [Google Scholar] [CrossRef]
  2. The Apocalypse of Global Extinction of Species. In Species Conservation in Managed Habitats; 2016; pp. 227–248, ISBN 978-3-527-68884-5.
  3. Dielenberg, J.; Bekessy, S.; Cumming, G.S.; Dean, A.J.; Fitzsimons, J.A.; Garnett, S.; Goolmeer, T.; Hughes, L.; Kingsford, R.T.; Legge, S.; et al. Australia’s Biodiversity Crisis and the Need for the Biodiversity Council. Ecol. Manag. Restor. 2023, 24, 69–74. [Google Scholar] [CrossRef]
  4. Westwood, M.; Cavender, N.; Meyer, A.; Smith, P. Botanic Garden Solutions to the Plant Extinction Crisis. PLANTS PEOPLE PLANET 2021, 3, 22–32. [Google Scholar] [CrossRef]
  5. Gerber, L.R.; Barton, C.J.; Anderson, D.M. Aligning the Logics of Inquiry and Action to Address the Biodiversity Crisis. Conserv. Biol. 2023, 37, e14128. [Google Scholar] [CrossRef]
  6. Davis, C.C.; Willis, C.G.; Connolly, B.; Kelly, C.; Ellison, A.M. Herbarium Records Are Reliable Sources of Phenological Change Driven by Climate and Provide Novel Insights into Species’ Phenological Cueing Mechanisms. Am. J. Bot. 2015, 102, 1599–1609. [Google Scholar] [CrossRef] [PubMed]
  7. Miller-Rushing, A.J.; Primack, R.B.; Primack, D.; Mukunda, S. Photographs and Herbarium Specimens as Tools to Document Phenological Changes in Response to Global Warming. Am. J. Bot. 2006, 93, 1667–1674. [Google Scholar] [CrossRef] [PubMed]
  8. James, S.A.; Soltis, P.S.; Belbin, L.; Chapman, A.D.; Nelson, G.; Paul, D.L.; Collins, M. Herbarium Data: Global Biodiversity and Societal Botanical Needs for Novel Research. Appl. Plant Sci. 2018, 6, e1024. [Google Scholar] [CrossRef]
  9. Campbell, C.J.; Barve, V.; Belitz, M.W.; Doby, J.R.; White, E.; Seltzer, C.; Di Cecco, G.; Hurlbert, A.H.; Guralnick, R. Identifying the Identifiers: How iNaturalist Facilitates Collaborative, Research-Relevant Data Generation and Why It Matters for Biodiversity Science. BioScience 2023, 73, 533–541. [Google Scholar] [CrossRef]
  10. Heberling, J.M.; Isaac, B.L. iNaturalist as a Tool to Expand the Research Value of Museum Specimens. Appl. Plant Sci. 2018, 6, e01193. [Google Scholar] [CrossRef]
  11. Pereira, F.W.; Zamoner, M.; Gonçalves, R.B. The Potential of iNaturalist for Bee Conservation Research—A Study Case in a Southern Brazilian Metropolis. Insect Conserv. Divers. 2024, 17, 386–395. [Google Scholar] [CrossRef]
  12. Paton, A.; Antonelli, A.; Carine, M.; Forzza, R.C.; Davies, N.; Demissew, S.; Dröge, G.; Fulcher, T.; Grall, A.; Holstein, N.; et al. Plant and Fungal Collections: Current Status, Future Perspectives. PLANTS PEOPLE PLANET 2020, 2, 499–514. [Google Scholar] [CrossRef]
  13. Figueiredo, E.; Smith, G.F. Types to the Rescue as Technology Taxes Taxonomists, or The New Disappearance. TAXON 2015, 64, 1017–1020. [Google Scholar] [CrossRef]
  14. Duan, Y.-W.; Ren, H.; Li, T.; Wang, L.-L.; Zhang, Z.-Q.; Tu, Y.-L.; Yang, Y.-P. A Century of Pollination Success Revealed by Herbarium Specimens of Seed Pods. New Phytol. 2019, 224, 1512–1517. [Google Scholar] [CrossRef]
  15. Bakker, F.T.; Lei, D.; Yu, J.; Mohammadin, S.; Wei, Z.; van de Kerke, S.; Gravendeel, B.; Nieuwenhuis, M.; Staats, M.; Alquezar-Planas, D.E.; et al. Herbarium Genomics: Plastome Sequence Assembly from a Range of Herbarium Specimens Using an Iterative Organelle Genome Assembly Pipeline. Biol. J. Linn. Soc. 2016, 117, 33–43. [Google Scholar] [CrossRef]
  16. Beck, J.B.; Semple, J.C. Next-Generation Sampling: Pairing Genomics with Herbarium Specimens Provides Species-Level Signal in Solidago (Asteraceae). Appl. Plant Sci. 2015, 3, 1500014. [Google Scholar] [CrossRef] [PubMed]
  17. Brenskelle, L.; Stucky, B.J.; Deck, J.; Walls, R.; Guralnick, R.P. Integrating Herbarium Specimen Observations into Global Phenology Data Systems. Appl. Plant Sci. 2019, 7, e01231. [Google Scholar] [CrossRef]
  18. Jenny, L.A.; Shapiro, L.R.; Davis, C.C.; Jonathan Davies, T.; Pierce, N.E.; Meineke, E. Herbarium Specimens Reveal Herbivory Patterns across the Genus Cucurbita. Am. J. Bot. 2023, 110, e16126. [Google Scholar] [CrossRef]
  19. Meineke, E.K.; Classen, A.T.; Sanders, N.J.; Jonathan Davies, T. Herbarium Specimens Reveal Increasing Herbivory over the Past Century. J. Ecol. 2019, 107, 105–117. [Google Scholar] [CrossRef]
  20. Primack, R.B.; Gallinat, A.S. Insights into Grass Phenology from Herbarium Specimens. New Phytol. 2017, 213, 1567–1568. [Google Scholar] [CrossRef]
  21. Rudin, S.M.; Murray, D.W.; Whitfeld, T.J.S. Retrospective Analysis of Heavy Metal Contamination in Rhode Island Based on Old and New Herbarium Specimens. Appl. Plant Sci. 2017, 5, 1600108. [Google Scholar] [CrossRef]
  22. Munson, S.M.; Sher, A.A. Long-Term Shifts in the Phenology of Rare and Endemic Rocky Mountain Plants. Am. J. Bot. 2015, 102, 1268–1276. [Google Scholar] [CrossRef]
  23. Bloom, T.D.S.; Flower, A.; DeChaine, E.G. Why Georeferencing Matters: Introducing a Practical Protocol to Prepare Species Occurrence Records for Spatial Analysis. Ecol. Evol. 2018, 8, 765–777. [Google Scholar] [CrossRef] [PubMed]
  24. Marcer, A.; Haston, E.; Groom, Q.; Ariño, A.H.; Chapman, A.D.; Bakken, T.; Braun, P.; Dillen, M.; Ernst, M.; Escobar, A.; et al. Quality Issues in Georeferencing: From Physical Collections to Digital Data Repositories for Ecological Research. Divers. Distrib. 2021, 27, 564–567. [Google Scholar] [CrossRef]
  25. Gamble, D.E.; Mazer, S.J. Spatial Uncertainty in Herbarium Data: Simulated Displacement but Not Error Distance Alters Estimates of Phenological Sensitivity to Climate in a Widespread California Wildflower. Ecography 2022, 2022, e06107. [Google Scholar] [CrossRef]
  26. Thiers, B.M. Herbarium: The Quest to Preserve and Classify the World’s Plants; Timber Press: 2020; ISBN 978-1-60469-930-2.
  27. Faeth, S.H.; Saari, S.; Bang, C. Urban Biodiversity: Patterns, Processes and Implications for Conservation. In eLS; 2012, ISBN 978-0-470-01590-2.
  28. Nowak, D.J. Urban Biodiversity and Climate Change. In Urban Biodiversity and Design; 2010; pp. 101–117 ISBN 978-1-4443-1865-4.
  29. Soanes, K.; Taylor, L.; Ramalho, C.E.; Maller, C.; Parris, K.; Bush, J.; Mata, L.; Williams, N.S.G.; Threlfall, C.G. Conserving Urban Biodiversity: Current Practice, Barriers, and Enablers. Conserv. Lett. 2023, 16, e12946. [Google Scholar] [CrossRef]
  30. Meluso, A.; Neale, J.; Boom, B. EcoFloras: Fostering Community and Biodiversity Discovery. Public Gard. Mag. 2022, 37, 8–11. [Google Scholar]
  31. López-Guillén, E.; Herrera, I.; Bensid, B.; Gómez-Bellver, C.; Ibáñez, N.; Jiménez-Mejías, P.; Mairal, M.; Mena-García, L.; Nualart, N.; Utjés-Mascó, M.; et al. Strengths and Challenges of Using iNaturalist in Plant Research with Focus on Data Quality. Diversity 2024, 16, 42. [Google Scholar] [CrossRef]
  32. NatureServe NatureServe Network Biodiversity Location Data 2024.
  33. Wamelink, G.W.; Goedhart, P.W.; Frissel, J.Y. Why Some Plant Species Are Rare. PLoS One 2014, 9, e102674. [Google Scholar] [CrossRef]
  34. Colorado Rare Plant Field Guide. Available online: Https://Cnhp.Colostate.Edu/Rareplant 2023.
  35. Cerrejón, C.; Valeria, O.; Marchand, P.; Caners, R.T.; Fenton, N.J. No Place to Hide: Rare Plant Detection through Remote Sensing. Divers. Distrib. 2021, 27, 948–961. [Google Scholar] [CrossRef]
  36. Schemske, D.W.; Husband, B.C.; Ruckelshaus, M.H.; Goodwillie, C.; Parker, I.M.; Bishop, J.G. Evaluating Approaches to the Conservation of Rare and Endangered Plants. Ecology 1994, 585–606. [Google Scholar] [CrossRef]
  37. Pavlik, B.M. Perspectives, Tools, and Institutions for Conserving Rare Plants. Southwest. Nat. 1997, 375–383. [Google Scholar]
  38. Ong, T.W.; Lin, B.B.; Lucatero, A.; Cohen, H.; Bichier, P.; Egerer, M.H.; Danieu, A.; Jha, S.; Philpott, S.M.; Liere, H. Rarity Begets Rarity: Social and Environmental Drivers of Rare Organisms in Cities. Ecol. Appl. 2022, 32, e2708. [Google Scholar] [CrossRef] [PubMed]
  39. Molano-Flores, B.; Johnson, S.A.; Marcum, P.B.; Feist, M.A. Utilizing Herbarium Specimens to Assist with the Listing of Rare Plants. Front. Conserv. Sci. 2023, 4, 1144593. [Google Scholar] [CrossRef]
  40. Tretyakov, I.L.; Shubnikov, Y.B.; Guseinova, E.D.; Agayev, G.A. Theoretical Foundations of the Poaching Study: Problems of Legal Regulation. In Proceedings of the IOP Conference Series: Earth and Environmental Science; IOP Publishing, 2021; Vol. 937, p. 022031.
  41. Janse van Rensburg, P.D.; Bezuidenhout, H.; Van den Berg, J. Impact of Poaching on the Population Structure and Insect Associates of the Endangered Encephalartos Eugene-Maraisiifrom South Africa. Bothalia-Afr. Biodivers. Conserv. 2023, 53, 1–33. [Google Scholar]
  42. Margulies, J.D.; Moorman, F.R.; Goettsch, B.; Axmacher, J.C.; Hinsley, A. Prevalence and Perspectives of Illegal Trade in Cacti and Succulent Plants in the Collector Community. Conserv. Biol. 2023, 37, e14030. [Google Scholar] [CrossRef] [PubMed]
  43. Trenchard, T. In South Africa, Poachers Now Traffic in Tiny Succulent Plants. Int. N. Y. Times 2021, NA–NA. [Google Scholar]
  44. Nuwer, R. Global Cactus Traffickers Are Cleaning Out the Deserts. Int. N. Y. Times 2021, NA–NA. [Google Scholar]
  45. Hinsley, A.; De Boer, H.J.; Fay, M.F.; Gale, S.W.; Gardiner, L.M.; Gunasekara, R.S.; Kumar, P.; Masters, S.; Metusala, D.; Roberts, D.L. A Review of the Trade in Orchids and Its Implications for Conservation. Bot. J. Linn. Soc. 2018, 186, 435–455. [Google Scholar] [CrossRef]
  46. Roberts, C.J.; Vergés, A.; Callaghan, C.T.; Poore, A.G.B. Many Cameras Make Light Work: Opportunistic Photographs of Rare Species in iNaturalist Complement Structured Surveys of Reef Fish to Better Understand Species Richness. Biodivers. Conserv. 2022, 31, 1407–1425. [Google Scholar] [CrossRef]
  47. Ackerfield, J. Flora of Colorado; Second.; Botanical Research Institute of Texas: Fort Worth, TX, 2022.
  48. Gaston, K.J. Valuing Common Species. Science 2010, 327, 154–155. [Google Scholar] [CrossRef]
  49. Winfree, R.; W. Fox, J.; Williams, N.M.; Reilly, J.R.; Cariveau, D.P. Abundance of Common Species, Not Species Richness, Drives Delivery of a Real-world Ecosystem Service. Ecol. Lett. 2015, 18, 626–635. [CrossRef]
  50. Schaeffer, D.J.; Herricks, E.E.; Kerster, H.W. Ecosystem Health: I. Measuring Ecosystem Health. Environ. Manage. 1988, 12, 445–455. [Google Scholar] [CrossRef]
  51. Marjakangas, E.; Santangeli, A.; Kujala, H.; Mammola, S.; Lehikoinen, A. Identifying ‘Climate Keystone Species’ as a Tool for Conserving Ecological Communities under Climate Change. Divers. Distrib. 2023, 29, 1341–1354. [Google Scholar] [CrossRef]
  52. Ogilvy, S.; Burritt, R.; Walsh, D.; Obst, C.; Meadows, P.; Muradzikwa, P.; Eigenraam, M. Accounting for Liabilities Related to Ecosystem Degradation. Ecosyst. Health Sustain. 2018, 4, 261–276. [Google Scholar] [CrossRef]
  53. Yando, E.S.; Sloey, T.M.; Dahdouh-Guebas, F.; Rogers, K.; Abuchahla, G.M.; Cannicci, S.; Canty, S.W.; Jennerjahn, T.C.; Ogurcak, D.E.; Adams, J.B. Conceptualizing Ecosystem Degradation Using Mangrove Forests as a Model System. Biol. Conserv. 2021, 263, 109355. [Google Scholar] [CrossRef]
  54. Calvente, A.; da Silva, A.P.A.; Edler, D.; Carvalho, F.A.; Fantinati, M.R.; Zizka, A.; Antonelli, A. Spiny but Photogenic: Amateur Sightings Complement Herbarium Specimens to Reveal the Bioregions of Cacti. Am. J. Bot. 2023, 110, e16235. [Google Scholar] [CrossRef]
  55. De Groot, S.J. Collecting and Processing Cacti into Herbarium Specimens, Using Ethanol and Other Methods. Syst. Bot. 2011, 36, 981–989. [Google Scholar] [CrossRef]
  56. Baker, M.A. Morphological and Cytological Analyses in Cylindropuntia (Cactaceae): The Taxonomic Circumscription of C. Echinocarpa, C. Multigeniculata, and C. Whipplei. J. Bot. Res. Inst. Tex. 2016, 325–343. [Google Scholar]
  57. Thompson, J.D. The Biology of an Invasive Plant. Bioscience 1991, 41, 393–401. [Google Scholar] [CrossRef]
  58. Holzmueller, E.J.; Jose, S. Invasive Plant Conundrum: What Makes the Aliens so Successful? J. Trop. Agric. 2009, 47, 18–29. [Google Scholar]
  59. Ricciardi, A. Invasive Species. In Ecological Systems; Leemans, R., Ed.; Springer New York: New York, NY, 2013; pp. 161–178. ISBN 978-1-4614-5754-1. [Google Scholar]
  60. Sakai, A.K.; Allendorf, F.W.; Holt, J.S.; Lodge, D.M.; Molofsky, J.; With, K.A.; Baughman, S.; Cabin, R.J.; Cohen, J.E.; Ellstrand, N.C.; et al. The Population Biology of Invasive Species. Annu. Rev. Ecol. Syst. 2001, 32, 305–332. [Google Scholar] [CrossRef]
  61. Graebner, R.C.; Callaway, R.M.; Montesinos, D. Invasive Species Grows Faster, Competes Better, and Shows Greater Evolution toward Increased Seed Size and Growth than Exotic Non-Invasive Congeners. Plant Ecol. 2012, 213, 545–553. [Google Scholar] [CrossRef]
  62. Westbrooks, R.G.; Eplee, R.E. Early Detection and Rapid Response. In Encyclopedia of Biological Invasions; Simberloff, D., Rejmanek, M., Eds.; University of California Press, 2019; pp. 169–177 ISBN 978-0-520-94843-3.
  63. Reaser, J.K.; Burgiel, S.W.; Kirkey, J.; Brantley, K.A.; Veatch, S.D.; Burgos-Rodríguez, J. The Early Detection of and Rapid Response (EDRR) to Invasive Species: A Conceptual Framework and Federal Capacities Assessment. Biol. Invasions 2020, 22, 1–19. [Google Scholar] [CrossRef]
  64. De Groot, M.; O’Hanlon, R.; Bullas-Appleton, E.; Csóka, G.; Csiszár, Á.; Faccoli, M.; Gervasini, E.; Kirichenko, N.; Korda, M.; Marinšek, A. Challenges and Solutions in Early Detection, Rapid Response and Communication about Potential Invasive Alien Species in Forests. Manag. Biol. Invasions 2020, 11, 637–660. [Google Scholar] [CrossRef]
  65. Martinez, B.; Reaser, J.K.; Dehgan, A.; Zamft, B.; Baisch, D.; McCormick, C.; Giordano, A.J.; Aicher, R.; Selbe, S. Technology Innovation: Advancing Capacities for the Early Detection of and Rapid Response to Invasive Species. Biol. Invasions 2020, 22, 75–100. [Google Scholar] [CrossRef]
  66. Herrando-Moraira, S.; Vitales, D.; Nualart, N.; Gómez-Bellver, C.; Ibáñez, N.; Massó, S.; Cachón-Ferrero, P.; González-Gutiérrez, P.A.; Guillot, D.; Herrera, I.; et al. Global Distribution Patterns and Niche Modelling of the Invasive Kalanchoe × Houghtonii (Crassulaceae). Sci. Rep. 2020, 10, 3143. [Google Scholar] [CrossRef]
  67. Atha, D.; Boom, B.; Thornbrough, A.; Kurtz, J.; Mcintyre, L.; Hagen, M.; Schuler, J.A.; Rohleder, L.; Hewitt, S.J.; Kelly, J. Arum Italicum (Araceae) Is Invasive in New York. Phytoneuron 2017, 31, 1–18. [Google Scholar]
  68. Dimson, M.; Berio Fortini, L.; Tingley, M.W.; Gillespie, T.W. Citizen Science Can Complement Professional Invasive Plant Surveys and Improve Estimates of Suitable Habitat. Divers. Distrib. 2023, 29, 1141–1156. [Google Scholar] [CrossRef]
  69. Hopkins, P. Using Citizen Science to Approach Invasive Species: A Case Study of an Early Detection and Rapid Response Invasion Program in the National Park Service. 2019.
  70. Wallace, R.D.; Bargeron, C.T.; LaForest, J.H.; Carroll, R.L. Citizen Scientists’ Role in Invasive Alien Species Mapping and Management. In Invasive Alien Species; Pullaiah, T., Ielmini, M.R., Eds.; Wiley, 2021; pp. 325–338 ISBN 978-1-119-60702-1.
  71. Burghardt, K.T.; Tallamy, D.W.; Gregory Shriver, W. Impact of Native Plants on Bird and Butterfly Biodiversity in Suburban Landscapes. Conserv. Biol. 2009, 23, 219–224. [Google Scholar] [CrossRef]
  72. Helfand, G.E.; Park, J.S.; Nassauer, J.I.; Kosek, S. The Economics of Native Plants in Residential Landscape Designs. Landsc. Urban Plan. 2006, 78, 229–240. [Google Scholar] [CrossRef]
  73. Di Cecco, G.J.; Barve, V.; Belitz, M.W.; Stucky, B.J.; Guralnick, R.P.; Hurlbert, A.H. Observing the Observers: How Participants Contribute Data to iNaturalist and Implications for Biodiversity Science. BioScience 2021, 71, 1179–1188. [Google Scholar] [CrossRef]
  74. Geurts, E.M.; Reynolds, J.D.; Starzomski, B.M. Turning Observations into Biodiversity Data: Broadscale Spatial Biases in Community Science. Ecosphere 2023, 14, e4582. [Google Scholar] [CrossRef]
  75. Shirey, V.; Belitz, M.W.; Barve, V.; Guralnick, R. A Complete Inventory of North American Butterfly Occurrence Data: Narrowing Data Gaps, but Increasing Bias. Ecography 2021, 44, 537–547. [Google Scholar] [CrossRef]
  76. Delisle, F.; Lavoie, C.; Jean, M.; Lachance, D. Reconstructing the Spread of Invasive Plants: Taking into Account Biases Associated with Herbarium Specimens. J. Biogeogr. 2003, 30, 1033–1042. [Google Scholar] [CrossRef]
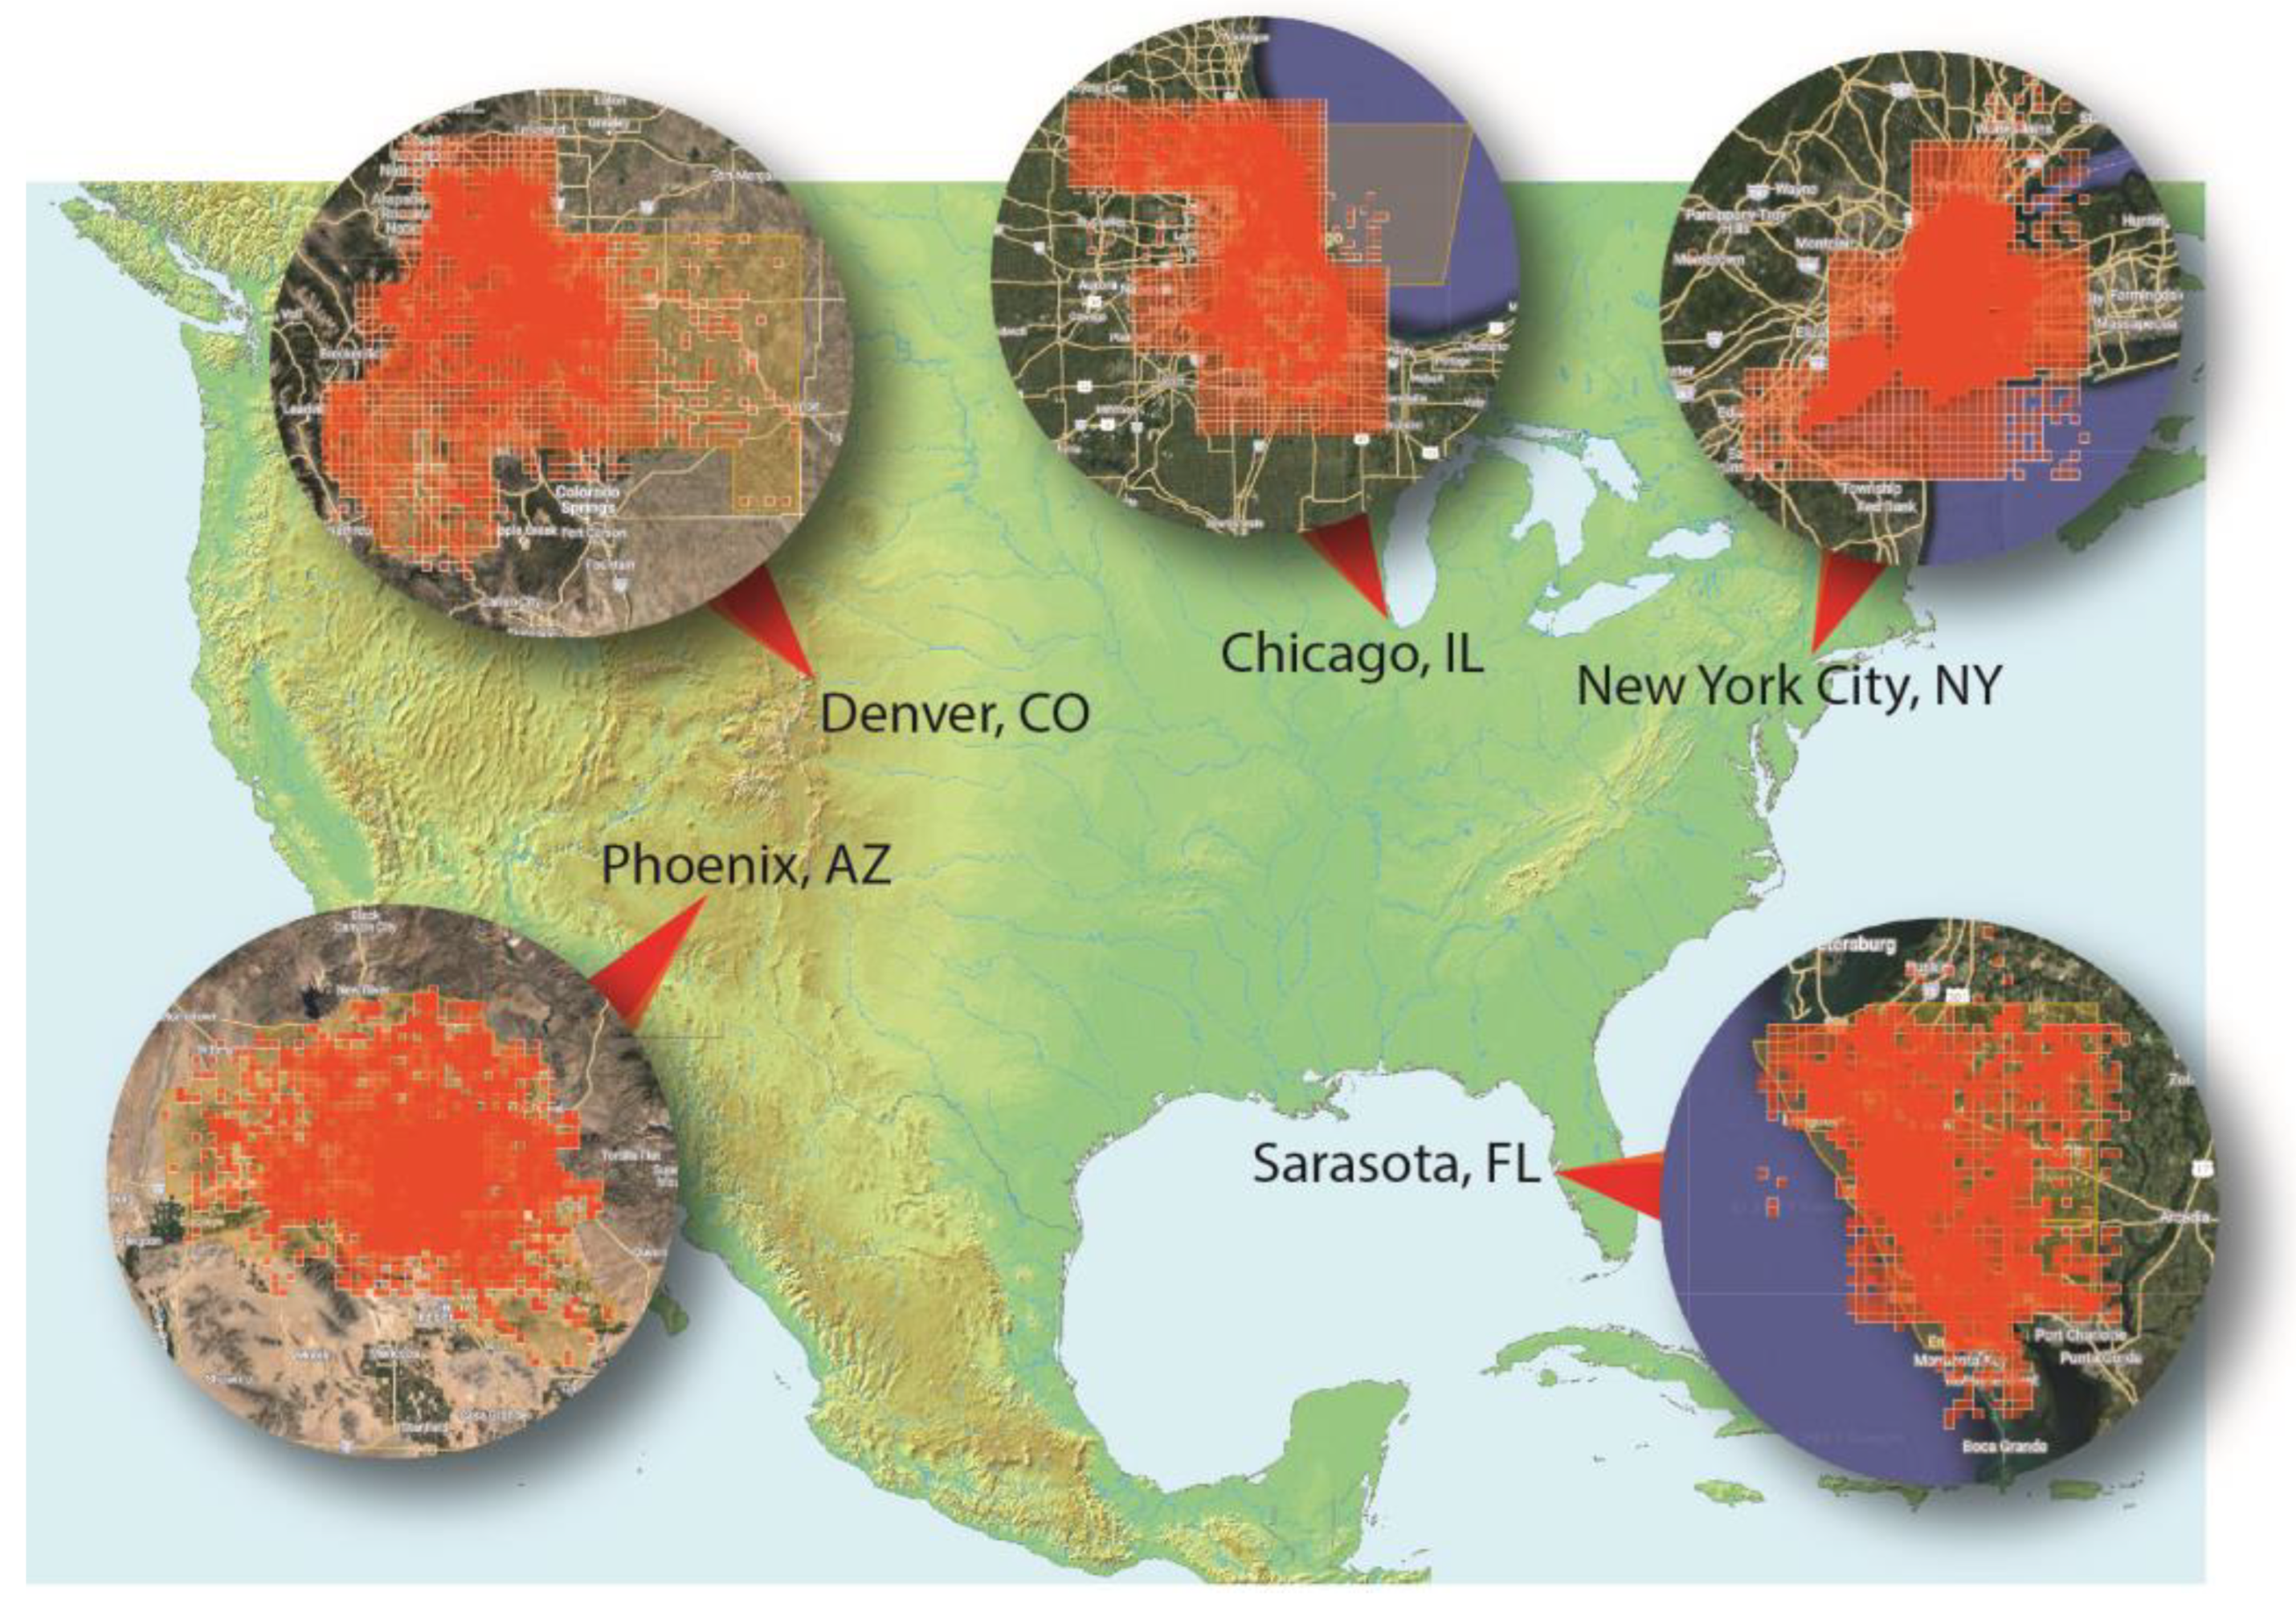
Figure 1. Map of the location of each botanic garden’s respective metro area and distribution of iNaturalist observations within the metro boundary.
Preprints 119862 g001
Figure 2. Pareto chart of total iNaturalist observations by user for the (a) New York and (b) Denver EcoFlora Projects. Total observations are in descending order of frequency, with a cumulative line on the secondary axis as a percentage of the total. Insent shows the transformed histogram in a log base 10.
Preprints 119862 g002
Figure 3. Percentage of total iNaturalist observations by top users for the (a) New York and (b) Denver EcoFlora Projects.
Preprints 119862 g003
Figure 4. Distribution of total iNaturalist observations by the top 40 users for the (a) New York EcoFlora Project and (b) Denver EcoFlora Project. Blue segments indicate the total number of “Research Grade” observations and orange segments indicate the total number of observations that need identified per user. Users are ordered by decreasing number of total “Research Grade” observations.
Preprints 119862 g004
Figure 5. (a) Total observations and herbarium specimens for all rare plant species found in the greater Denver metro area. Species are arranged in order of increasing iNaturalist observations (green bar) with the total number of herbarium specimens for each species indicated by the blue line. (b) Total observations and herbarium specimens for all rare plant species in the greater Denver metro area with herbarium specimens divided into pre-2000 and post-2000 collection dates. Dark green line indicates herbarium specimens collected post-2000.
Preprints 119862 g005
Figure 6. (a) Total observations and herbarium specimens for the first half of the rare plant species found in the greater New York metro area. Species are arranged in order of increasing iNaturalist observations (green bar) with the total number of herbarium specimens for each species indicated by the blue line. (b) Total observations and herbarium specimens for all rare plant species in the greater New York metro area with herbarium specimens divided into pre-2000 and post-2000 collection dates. Dark green line indicates herbarium specimens collected post-2000.
Preprints 119862 g006
Figure 7. (a) Total observations and herbarium specimens for the second half of the rare plant species found in the greater New York metro area. Species are arranged in order of increasing iNaturalist observations (green bar) with the total number of herbarium specimens for each species indicated by the blue line. (b) Total observations and herbarium specimens for all rare plant species in the greater New York metro area with herbarium specimens divided into pre-2000 and post-2000 collection dates. Dark green line indicates herbarium specimens collected post-2000.
Preprints 119862 g007
Figure 8. Contributions of casual observers to total rare plant observations for the Denver EcoFlora Project, categorized by NatureServe state ranking. Blue portion of total observations indicates the number of observations made by casual users. Orange portion of total observations indicates the number of observations made by influencers, professionals, and collectors.
Preprints 119862 g008
Figure 9. Distribution maps of rare species that are readily observed on iNaturalist. Green circles indicate iNaturalist observations, purple triangles indicate herbarium specimens collected before 2000, and blue triangles indicate herbarium specimens collected after 2000. (a) Distribution of Asclepias viridiflora in the New York metro area. Photo taken by Ansel Oommen, (b) Distribution of Tillandsia utriculata in the Sarasota metro area. Photo taken by Cas Alexander, (c) Distribution of Abutilon parishii in the Phoenix metro area. Photo taken by Usvaldo GC, (d) Distribution of Physaria bellii in the Denver metro area. Photo taken by Jennifer Ackerfield, and (e) Distribution of Cirsium pitcheri in the Chicago metro area. Photo taken by Angie Bouma.
Preprints 119862 g009
Figure 10. Chart of herbarium specimens versus iNaturalist observation totals for each metro area’s representative common species. Blue indicates number of herbarium specimens and green indicates number of iNaturalist observations. (a) Phytolacca americana photo taken by Craig Martin, (b) Sabal palmetto photo taken by Amy Kane, (c) Carnegiea gigantea photo taken by iNaturalist user @dap624, (d) Ericameria nauseosa photo taken by Loraine Yeatts, and (e) Mertensia virginica photo taken by Shier Andrulist.
Preprints 119862 g010
Figure 11. Distribution maps of common species. Green circles indicate iNaturalist observations, purple triangles indicate herbarium specimens collected before 2000, and blue triangles indicate herbarium specimens collected after 2000. (a) Phytolacca americana (New York), (b) Sabal palmetto (Marie Selby), (c) Carnegiea gigantea (Desert), (d) Ericameria nauseosa (Denver), and (e) Mertensia virginica (Chicago).
Preprints 119862 g011
Figure 12. Chart of herbarium specimens versus iNaturalist observation totals for each metro area’s representative pokey plant species. Blue indicates number of herbarium specimens and green indicates number of iNaturalist observations. (a) Opuntia humifusa photo taken by Brenda Bull, (b) Cirsium nuttallii photo taken by Mary Lusk, (c) Cylindropuntia acanthocarpa photo by Al Kordesch, (d) Cirsium undulatum photo taken by Jennifer Ackerfield, and (e) Cirsium discolor photo taken by Craig Martin.
Preprints 119862 g012
Figure 13. Distribution maps of pokey plant species. Green circles indicate iNaturalist observations, purple triangles indicate herbarium specimens collected before 2000, and blue triangles indicate herbarium specimens collected after 2000. (a) Opuntia humifusa (New York), (b) Cirsium nuttallii (Marie Selby), (c) Cylindropuntia acanthocarpa (Desert), (d) Cirsium undulatum (Denver), and (e) Cirsium discolor (Chicago).
Preprints 119862 g013
Figure 14. Chart of herbarium specimens versus iNaturalist observation totals for each metro area’s representative emerging invasives. Blue indicates number of herbarium specimens and green indicates number of iNaturalist observations. (a) Arum italicum photo taken by Zoya Baker, (b) Asparagus aethiopicus photo taken by Macray Simmers, (c) Oncosiphon pilulifer photo taken by Elena Palka Flores, (d) Alliaria petiolata photo taken by Kelly Nicole Kirk, and (e) Ranunculus ficaria photo taken by Irmela Levin.
Preprints 119862 g014
Figure 15. Distribution maps of emerging invasive species. Green circles indicate iNaturalist observations, purple triangles indicate herbarium specimens collected before 2000, and blue triangles indicate herbarium specimens collected after 2000. (a) Arum italicum (New York), (b) Asparagus aethiopicus (Marie Selby), (c) Oncosiphon pilulifer (Desert), (d) Alliaria petiolata (Denver), and (e) Ranunculus ficaria (Chicago).
Preprints 119862 g015
Figure 16. Chart of herbarium specimens versus iNaturalist observation totals for the cultivated curation examples. Blue indicates number of herbarium specimens (wild), orange indicates number of herbarium specimens (cultivated), green indicates number of iNaturalist observations (wild), and yellow indicates number of iNaturalist observations (cultivated). Distribution maps (a) & (b) of cultivated curation examples. (a) Aquilegia chrysantha photo taken by Jennifer Ackerfield, and (b) Chilopsis linearis photo taken by Nick Loveland.
Preprints 119862 g016
Figure 17. Unique taxa represented by herbarium specimens versus iNaturalist observations for grasses (a) and sedges (b) separated by metro area. Below each metro area is the percentage of total observations that are “Research Grade.” Blue bars indicate the total number of unique taxa represented by herbarium specimens for each metro area. The orange line indicates the number of unique taxa on iNaturalist (both “Needs ID” and “Research Grade”). The green line indicates the number of unique taxa on iNaturalist that are “Research Grade.”.
Preprints 119862 g017
Table 1. iNaturalist user types.
iNaturalist user type Description
Influencer Users that try to make as many observations as possible, often across multiple organismic groups.
Collector Users that aim to collect as many unique species as possible. These observers also track down rare or uncommon taxa, or taxa with no previous photographs on iNaturalist.
Professional Users that are professionals in the field, including herbarium/museum curators, botanists, or natural resource managers. Professionals often take and/or identify observations of specific organismal groups.
Casual Users typically with 20 or fewer observations total, mostly of common taxa. These observations are often taken as part of class project or group outing.
Table 2. Total observers and observations for the New York and Denver EcoFlora Projects.
New York Denver
Total observers 12,447 11,962
Total observations 223,028 166,426
Percent casual observers 91% 89%
Percent of observations from casual observers 19% 24%
Percent of observers with 10 or fewer observations 84% 81%
Percent of observers with a single observation ("supercasual") 39% 39%
Disclaimer/Publisher’s Note: The statements, opinions and data contained in all publications are solely those of the individual author(s) and contributor(s) and not of MDPI and/or the editor(s). MDPI and/or the editor(s) disclaim responsibility for any injury to people or property resulting from any ideas, methods, instructions or products referred to in the content.
Copyright: This open access article is published under a Creative Commons CC BY 4.0 license, which permit the free download, distribution, and reuse, provided that the author and preprint are cited in any reuse.
Prerpints.org logo

Preprints.org is a free preprint server supported by MDPI in Basel, Switzerland.

Subscribe

© 2024 MDPI (Basel, Switzerland) unless otherwise stated