Preprint
Article

Exploring the Therapeutic Potential of Nicotinamide‐N‐Methyltransferase in Clear Cell Renal Cell Carcinoma

Altmetrics

Downloads

52

Views

38

Comments

0

Submitted:

01 October 2024

Posted:

01 October 2024

You are already at the latest version

Alerts
Abstract
Clear cell renal cell carcinoma (ccRCC) is a highly aggressive subtype of renal cancer, often associated with poor prognosis and high mortality rates. In this study, we identified Nicotinamide N-methyltransferase (NNMT) as a key gene involved in the pathogenesis of ccRCC through RNA sequencing analysis of tumor and normal tissues from 14 patients. NNMT was among the top five upregulated genes, and its high expression was significantly correlated with reduced overall, progression-free, and disease-specific survival in patients, as well as advanced pathological stages and higher histologic grades. Gene ontology (GO) enrichment analysis revealed NNMT's role in biological processes such as signal transduction and immune response. Immune cell infiltration analysis indicated that high NNMT expression was associated with increased infiltration of activated NK cells and macrophages, while low expression correlated with a higher presence of regulatory T cells. Functional studies using siRNA-mediated NNMT knockdown in ccRCC cell lines demonstrated a significant reduction in cell proliferation, with further analysis revealing altered gene expression profiles related to cell adhesion and calcium ion binding. These findings suggest that NNMT not only plays a pivotal role in ccRCC aggressiveness but also may serve as a valuable prognostic biomarker and a potential therapeutic target for improving clinical outcomes in patients with this malignancy.
Keywords: 
Subject: Biology and Life Sciences  -   Biochemistry and Molecular Biology

Introduction

Renal cell carcinoma (RCC) represents a significant form of kidney cancer, accounting for approximately 90% of adult kidney malignancies. Upon diagnosis, the majority of patients present with symptoms indicative of locally advanced or metastatic renal cell carcinoma [1,2,3,4,5]. Some patients who have undergone surgical intervention remain at risk of developing fatal metachronous distant metastases [6,7,8]. The most common and aggressive subtype is clear cell renal cell carcinoma (ccRCC), which is often associated with a poor prognosis and high mortality [9,10,11,12,13]. Despite advances in treatment, the outlook for advanced RCC remains bleak, underscoring the need for novel biomarkers and therapeutic targets. Metabolic alterations play a crucial role in cancer progression, with enzymes involved in cellular metabolism being key players [14,15,16,17,18,19]. Nicotinamide N-methyltransferase (NNMT) has emerged as a significant regulator in various cancers, including RCC [20,21,22,23]. Elevated NNMT expression has been demonstrated to promote cancer cell proliferation, invasion, and metastasis, thereby establishing it as a potential therapeutic target. NNMT exerts influence over pivotal metabolic pathways, affects cellular energy homeostasis, and modifies the tumor microenvironment (TME), thereby facilitating tumor formation [24,25,26]. In renal cell carcinoma (RCC), NNMT is markedly overexpressed in cancerous tissues in comparison to normal renal tissues [26,27,28]. This upregulation is correlated with advanced disease stages and poorer prognoses, indicating that NNMT may be a valuable biomarker. Elevated NNMT levels are associated with enhanced tumor aggressiveness and resistance to conventional therapies, emphasizing the necessity for innovative therapeutic strategies. Although NNMT’s role in RCC is well established, its specific correlation with the main RCC subtypes – ccRCC, papillary RCC (pRCC), and chromophobe RCC (chRCC) – remains under-researched. It is therefore of great importance to gain a deeper understanding of NNMT’s expression across these subtypes if we are to develop targeted therapies [29,30,31]. Advancements in genomics and bioinformatics, exemplified by The Cancer Genome Atlas (TCGA), have facilitated a deeper understanding of the molecular mechanisms underlying ccRCC [30,31,32]. Analyses have demonstrated a significant correlation between NNMT expression and clinical outcomes, including survival rates. Furthermore, NNMT modulates the infiltration of immune cells within the tumor microenvironment (TME), influencing immune evasion mechanisms. This makes it a potential immunotherapy target. Experimental studies have validated NNMT’s oncogenic role in ccRCC. siRNA-mediated NNMT knockdown in ccRCC cell lines has been observed to reduce proliferation and alter gene expression related to cell growth and adhesion, which highlights its potential as a therapeutic target. The prognostic significance of NNMT in ccRCC suggests that targeting this enzyme could hinder tumor growth and improve treatment efficacy, which paves the way for personalized cancer therapies.

Material and Methods

Medical Samples

Following the acquisition of written informed consent from each participant and approval from the Institutional Review Board (IRB no. NCC2021-0147) of the National Cancer Center, we obtained tissue samples from both normal and cancerous tissues in 14 patients who had been diagnosed with clear cell renal cell carcinoma (ccRCC). The demographic and clinical characteristics of the patients are detailed in Table 1.

RNA Transcriptome Sequencing

The total RNA concentration was calculated using the Quant-IT RiboGreen (Invitrogen, #R11490) method. To assess the integrity of the total RNA, samples were run on the TapeStation RNA screen tape (Agilent, #5067-5576). Only high-quality RNA preparations with an RIN greater than 7.0 were used for RNA library construction. An independent library was constructed for each sample using 1 µg of total RNA with the Illumina TruSeq Stranded mRNA Sample Prep Kit (Illumina, Inc., San Diego, CA, USA, #RS-122-2101). The initial step in the workflow involves the purification of poly-A containing mRNA molecules using poly-T attached magnetic beads. Following purification, the mRNA is fragmented into small pieces using divalent cations under elevated temperature. The cleaved RNA fragments are copied into first strand cDNA using SuperScript II reverse transcriptase (Invitrogen, #18064014) and random primers. This is followed by second strand cDNA synthesis using DNA Polymerase I, RNase H and dUTP. The resulting cDNA fragments are then subjected to an end repair process, the addition of a single ‘A’ base, and ligation of the adapters. Subsequently, the products are purified and enriched with PCR to create the final cDNA library. The libraries are quantified using KAPA Library Quantification kits for Illumina sequencing platforms, in accordance with the qPCR Quantification Protocol Guide (KAPA BIOSYSTEMS, #KK4854), and qualified using the TapeStation D1000 ScreenTape (Agilent Technologies, #5067-5582). Subsequently, the indexed libraries were submitted to an Illumina NovaSeq (Illumina, Inc., San Diego, CA, USA) for paired-end (2×100 bp) sequencing, which was performed by Macrogen Incorporated.

GO Enrichment Analysis

Differentially expressed genes (DEGs) were analyzed and interpreted using the Database for Annotation, Visualization, and Integrated Discovery (DAVID) [33]. Pathway analysis and gene ontology (GO) analysis were conducted using DAVID. Biological pathways with a p-value below 0.05 were considered significant. The results of DAVID were subsequently imported into the GO plot in R Studio. The GO Bubble plot was employed to demonstrate the functional richness of the differentially expressed genes (DEGs), facilitating the integration of expression data with functional assessment results.

Analysis of CIBERSORT Deconvolution

The relative proportions of various cell types within the tumor microenvironment were inferred using CIBERSORT, a computational method that employs a deconvolution algorithm. The fractions of 22 human hematopoietic cell phenotypes were estimated using a leukocyte gene signature matrix (LM22) [34].

Renal Cell Carcinoma Tissue Reverse Transcription PCR

The mRNA expression levels of HILPDA, NNMT, ENPP6, and SLC13A3 were confirmed in both ccRCC and normal kidney tissues using RT-PCR. Total RNA was extracted from human kidney tissue using TRIzol Reagent (Invitrogen, Waltham, MA, USA), followed by reverse transcription using PrimeScript RT Master Mix (Takara Bio Inc, Kusatsu, Shiga, Japan). A total of 1 μg of RNA was added and heated at 37°C for 15 minutes in accordance with the manufacturer’s instructions. The sequences utilized in RT-PCR can be referenced in the related materials (Table 2).

Real-Time Quantitative Reverse Transcription PCR

Total RNA was extracted from human kidney tissue and cell samples using TRIzol Reagent (Invitrogen, Waltham, MA, USA), following the manufacturer’s instructions. Reverse transcription was performed to analyze mRNA expression levels of HILPLDA, NNMT, ENPP6 and SLC13A3 using a total of 1 μg of RNA and Prime Script RT Master Mix (Takara Bio Inc, Kusatsu, Shiga, Japan) according to the manufacturer’s protocol. Quantitative real-time PCR (Q-PCR) was carried out using the GoTaq 1-Step RT-qPCR kit (Promega, Madison, WI, USA), where the 20 μl mixture contained 10 μl SYBR Green Master Mix, 1 μl forward primer, 1 μl reverse primer, and cDNA. The amplification conditions for polymerase chain reaction (PCR) were set as follows: 95°C for 10 min, followed by 40 cycles of 95°C for 15 sec, 58°C for 1 min, and 72°C for 15 sec. The housekeeping gene 18S was used, and each sample was run in triplicate. Real-time reactions were detected using the Light Cycler® 96 Instrument.

Cell Culture

The ccRCC cell lines Caki-1 and SNU1272 were obtained from the Korea Cell Line Bank. The cell lines were cultured in RPMI (HyClone, Logan, UT, USA) supplemented with 10% fetal bovine serum (FBS) and 1% penicillin/streptomycin (HyClone, Logan, UT, USA) at 37 °C in a humidified atmosphere with 5% CO2. Subculture was performed once daily, with a maximum interval of 2-3 days.

siRNA Transfection

Bionics (South Korea) synthesized specific siRNAs targeting NNMT, while the negative control siRNA was purchased from the same company. The final concentration of siRNAs was set at 20 nM. For siRNA transfections, Opti-MEM (Gibco BRL Inc., USA) and RNAimax Transfection Kits (Invitrogen, Waltham, MA, USA) were used. The cells were initially plated at a density of 3.9 × 10⁵ cells per well in 60 mm dishes and allowed to grow overnight. The following day, the cells were transfected with siRNA. The siRNAs were mixed with 7.5 µL of RNAimax, respectively, in 500 µL of Opti-MEM for 20 minutes. The cell culture medium was then removed and replaced with 5.5 ml of fresh culture medium and 500 μl of the siRNA mixture in a 60mm dish. The cells were then incubated for 48-72 hours.

CCK-8 Assay

The cells were initially plated at a density of 2 × 10⁴ cells/well in a 48-well plate and incubated for 18 hours in an incubator. Following this incubation period, the cells were transfected with siRNAs and further incubated for 72 hours. Following the removal of the medium, a fresh medium, mixed with CCK8 at a ratio of 9:1, was added to each well of a 48-well plate at a volume of 400 µL per well. The plate was then incubated at 37 °C for 90 minutes, after which the absorbance was measured at 450 nm.

Protein Extraction and Western Blot

The cell samples were homogenized in 100 µL of RIPA buffer and a Halt™ Protease and Phosphatase Inhibitor Cocktail mixture (Thermo Fisher Scientific, Waltham, MA, USA). The homogenized samples were then subjected to centrifugation at 22000× g for 15 minutes, after which the supernatants were collected in new tubes. A total of 30 µg of extracted proteins were separated by 12% NuPAGE gel and transferred onto a PVDF membrane (Millipore, Burlington, MA, USA). The membranes were then blocked with 5% skim milk in TBS-T for 60 minutes. Following the blocking step, the membranes were incubated with primary antibodies against NNMT (1:1000; ABcam, USA), HILPDA (1:500; Gene Tex, USA) and β-Actin (1:2000; The membranes were incubated with the primary antibody (Santa Cruz, USA) overnight and washed three times with TBS-T. They were then incubated with the secondary antibodies, mouse anti-rabbit IgG-HRP and m-IgGκ BP-HRP (Santa Cruz, USA), for 1.5 hours at room temperature. Subsequently, the membranes were washed three times with TBS-T, and the protein bands were detected using enhanced chemiluminescence (ECL) reagent (Invitrogen, Waltham, MA, USA).

Statistical Analysis

All experimental results were subjected to statistical analysis, expressed as mean ± standard deviation (mean ± SD). To verify the significance of differences between groups, a t-test was performed using GraphPad Prism 10.1.0 software (GraphPad Software, USA). Statistical significance was accepted only when p < 0.05, p < 0.01, and p < 0.001 compared to Tukey’s Multiple Comparison Test. To reduce systematic bias that could affect the biological meaning of sample comparisons, size factors were estimated using read count data, and statistical analysis was performed after normalizing the Trimmed Mean of M values (TMM) using the edgeR R library’s calcNormFactors. To facilitate visualization of the results, log2-transformed values of Counts per Million (CPM) reads + 1 and TMM-normalized count + 1 were employed. The raw read count values are distributed over a wide range, particularly given the inherent bias towards relatively low values. The application of logarithms serves to reduce the range of the read count values while simultaneously equalizing the variance of the data, thereby facilitating enhanced visualization and analysis. The addition of 1 to the read count value ensures that values between 0 and 1 are not converted to negative values when calculating CPM or logarithms of normalized count values. The logarithms are employed solely for the purpose of visualization. For the purposes of statistical analysis using the edge R software, an exact test was performed utilizing TMM-normalized count values.

Ethical Approval

Ethical approval to report this data was obtained from the Institutional Review Board of the National Cancer Center (IRB no. NCC2021-0147). It was confirmed that informed consent was obtained from all subjects, and all research was performed in accordance with the Declaration of Helsinki and relevant guidelines and regulations.

Results

Identification of Common Differentially Expressed Genes

A comprehensive analysis of RNA was conducted to ascertain the comparative gene expression profiles of tumor and normal tissue from a cohort of 14 patients diagnosed with clear cell renal cell carcinoma (ccRCC). The application of hierarchical clustering revealed the existence of distinct gene expression patterns, which demonstrated a pronounced divergence between normal and tumor tissues (Figure 1A). To quantify these differences, we calculated the log2-fold change (log2FC) in gene expression levels. The volcano plot illustrates the disparate gene expression landscape. Genes exhibiting a significant increase in expression in tumor tissues are indicated by red, while genes displaying a significant decrease in expression are indicated by blue. A rigorous cutoff was applied at a log2FC of ±2 and a corresponding -log10 raw p-value for statistical significance. It is notable that the genes labelled on the plot represent the top five upregulated and downregulated genes, underscoring the most substantial variations in gene expression between the two tissue types (Figure 1B). These pivotal findings highlight potential molecular targets for further investigation into the pathogenesis and treatment of ccRCC.

DAVID Enrichment Analysis for Common Differentially Expressed Genes

To elucidate the functions and biological significance of the shared DEGs, we conducted an enrichment analysis in terms of biological process (BP), molecular function (MF), and cellular component (CC) using the DAVID bioinformatics resources. This targeted analysis of selected genes from the volcano plot identified the top 20 terms for each category. Within the realm of BP, terms such as signal transduction, immune response, and adaptive immune response were prominently enriched. In the CC category, ‘plasma membrane’ emerged as a recurrently enriched term. For MF, ‘protein binding’ was identified as the predominant enriched term, suggesting critical roles in cellular interactions and signaling pathways (Figure 1C).

Gene Expression Alterations in Renal Carcinoma: A qPCR Validation Study

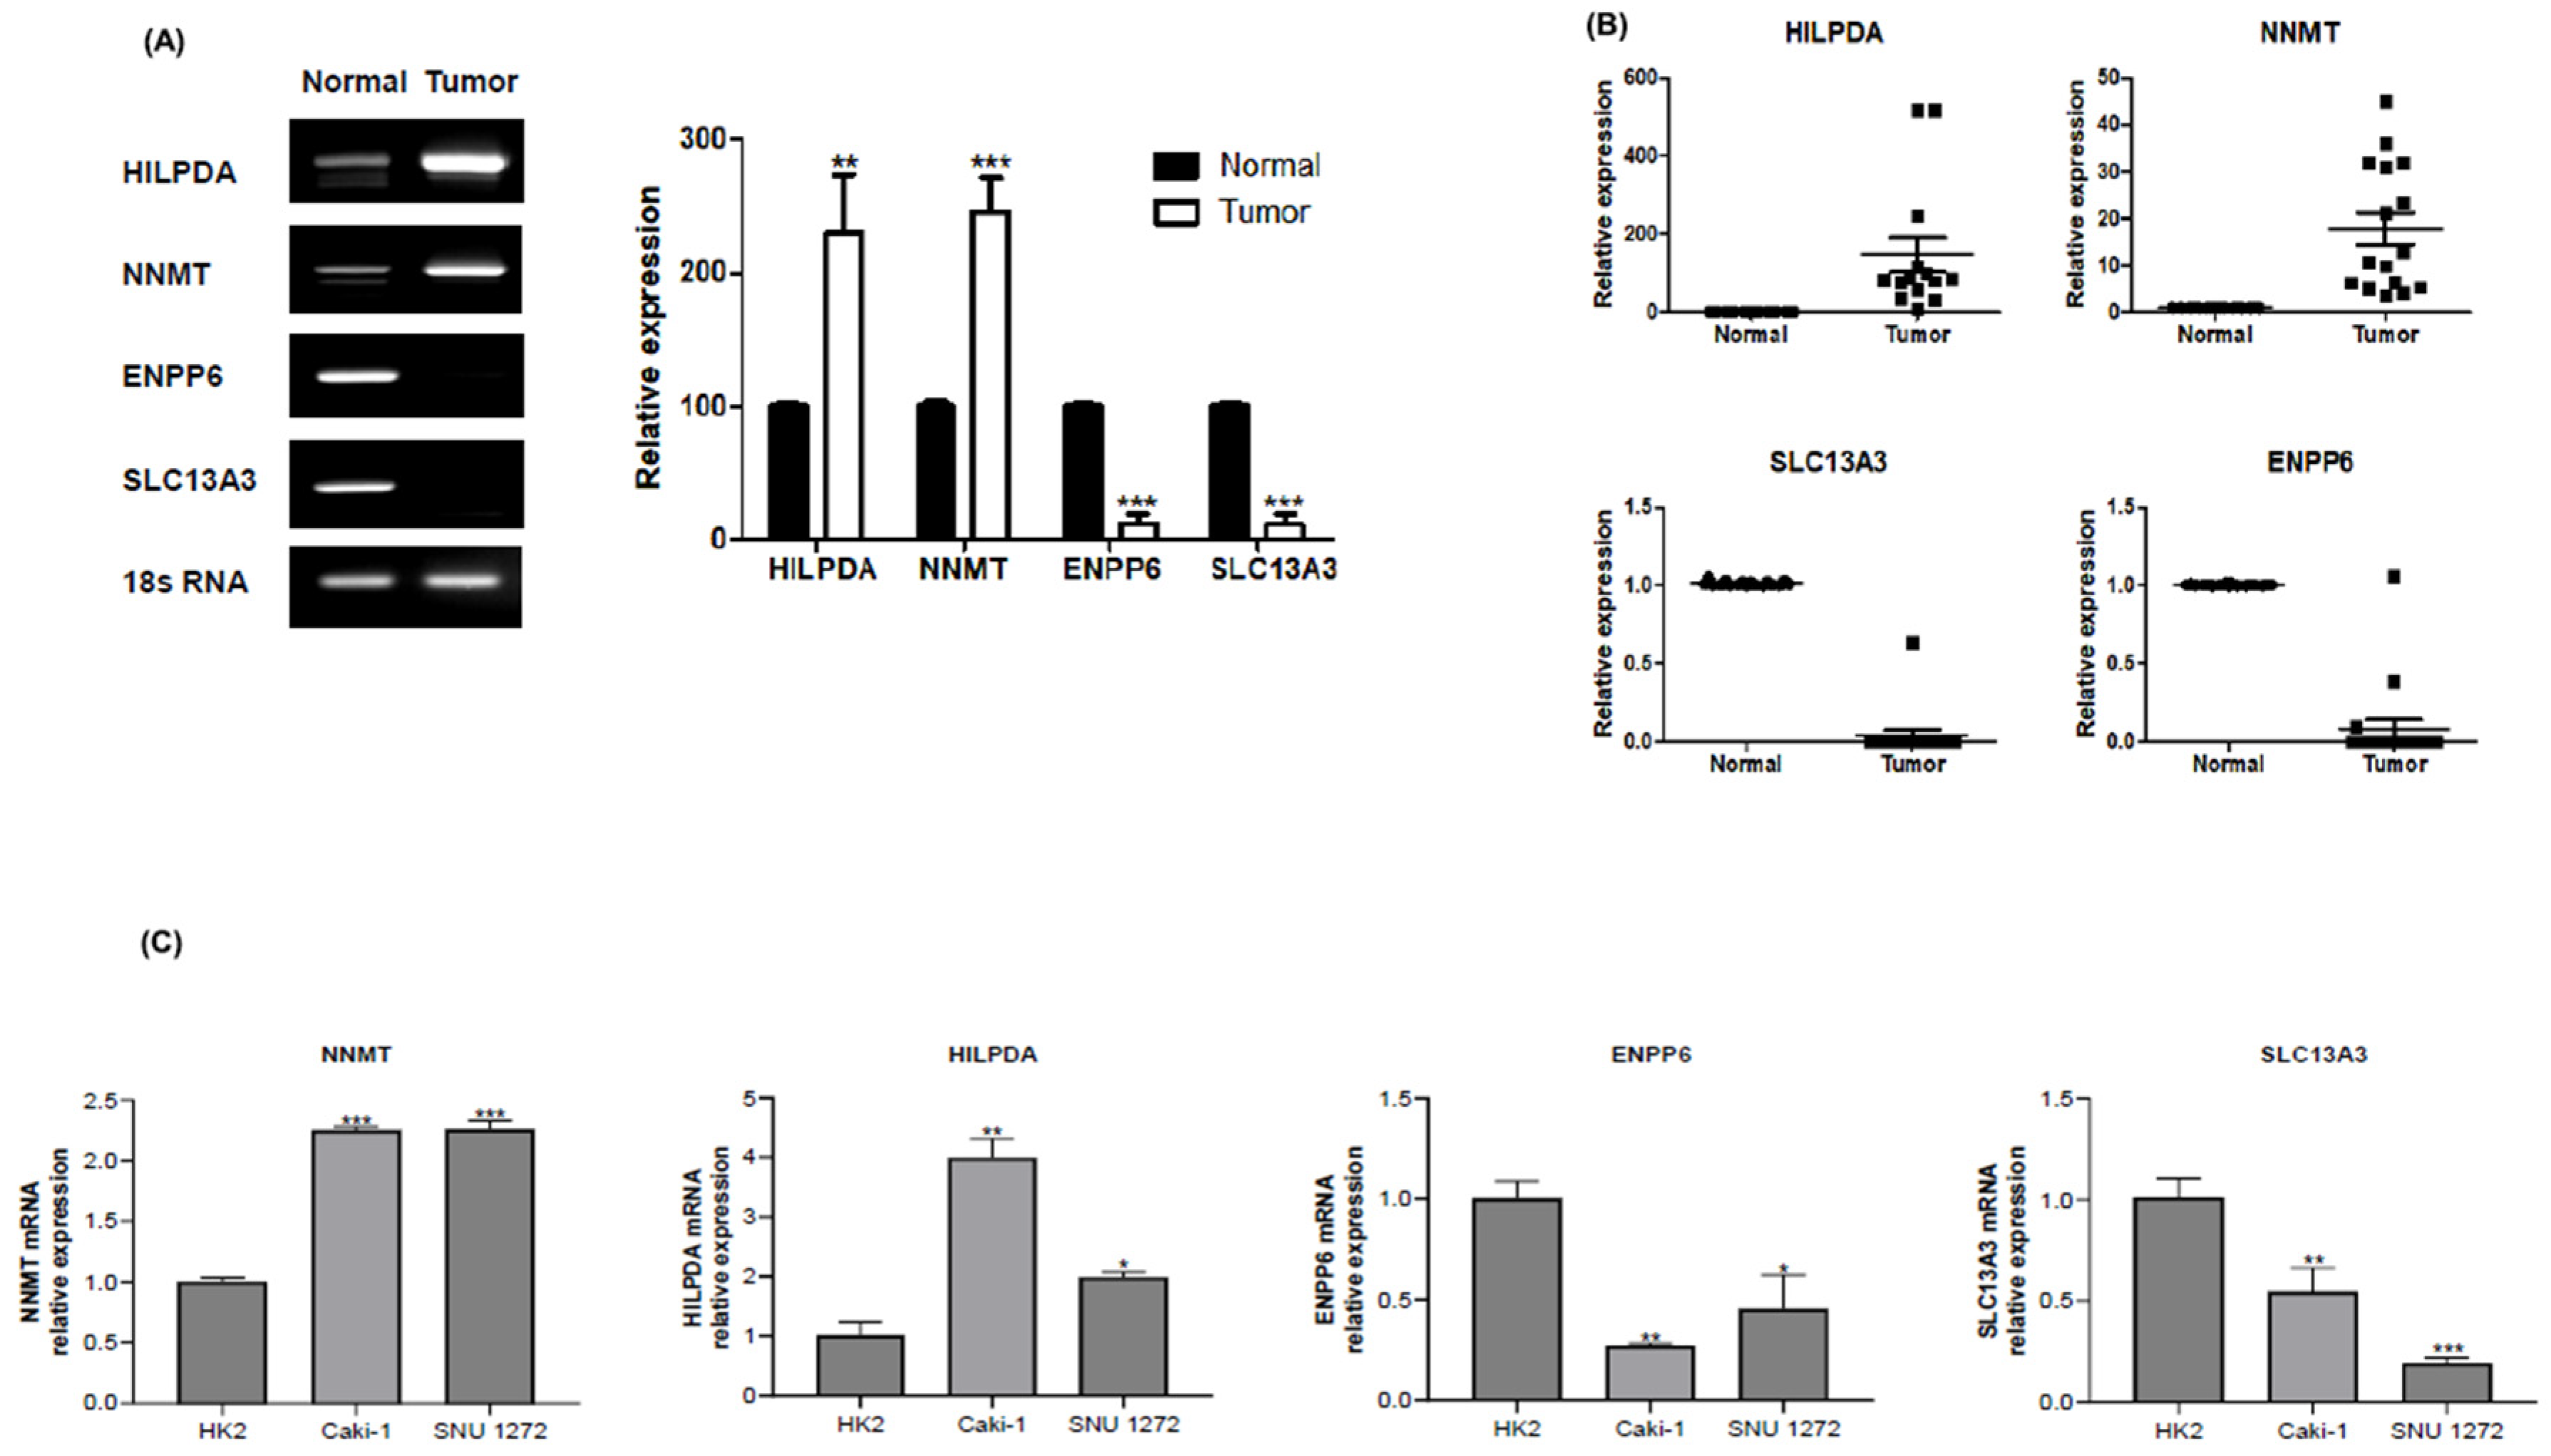
In order to elucidate the molecular basis of renal carcinoma pathophysiology, our study undertook a comprehensive analysis of RNA sequencing data, identifying a set of genes with critical roles in kidney function. Our investigation, informed by the extensive repository of The Human Protein Atlas, led us to focus on four genes of particular interest: NNMT, HILPDA, ENPP6, and SLC13A3 [35,36,37]. To corroborate the findings of the RNA sequencing, we employed a series of quantitative and qualitative molecular biology techniques, specifically RT-PCR and qPCR. The data confirmed the initial sequencing results, revealing a marked upregulation of NNMT and HILPDA, juxtaposed with the downregulation of ENPP6 and SLC13A3 in renal carcinoma samples as opposed to normal kidney tissue (Figure 2A,B). Further validation in ccRCC cell lines provided additional evidence, confirming the altered expression patterns of these genes (Figure 2C). These findings not only reinforce the RNA sequencing data but also suggest that these genes may serve as potential biomarkers or therapeutic targets in renal carcinoma.

NNMT Expression and Its Correlation with Patient Survival in Renal Cell Carcinoma

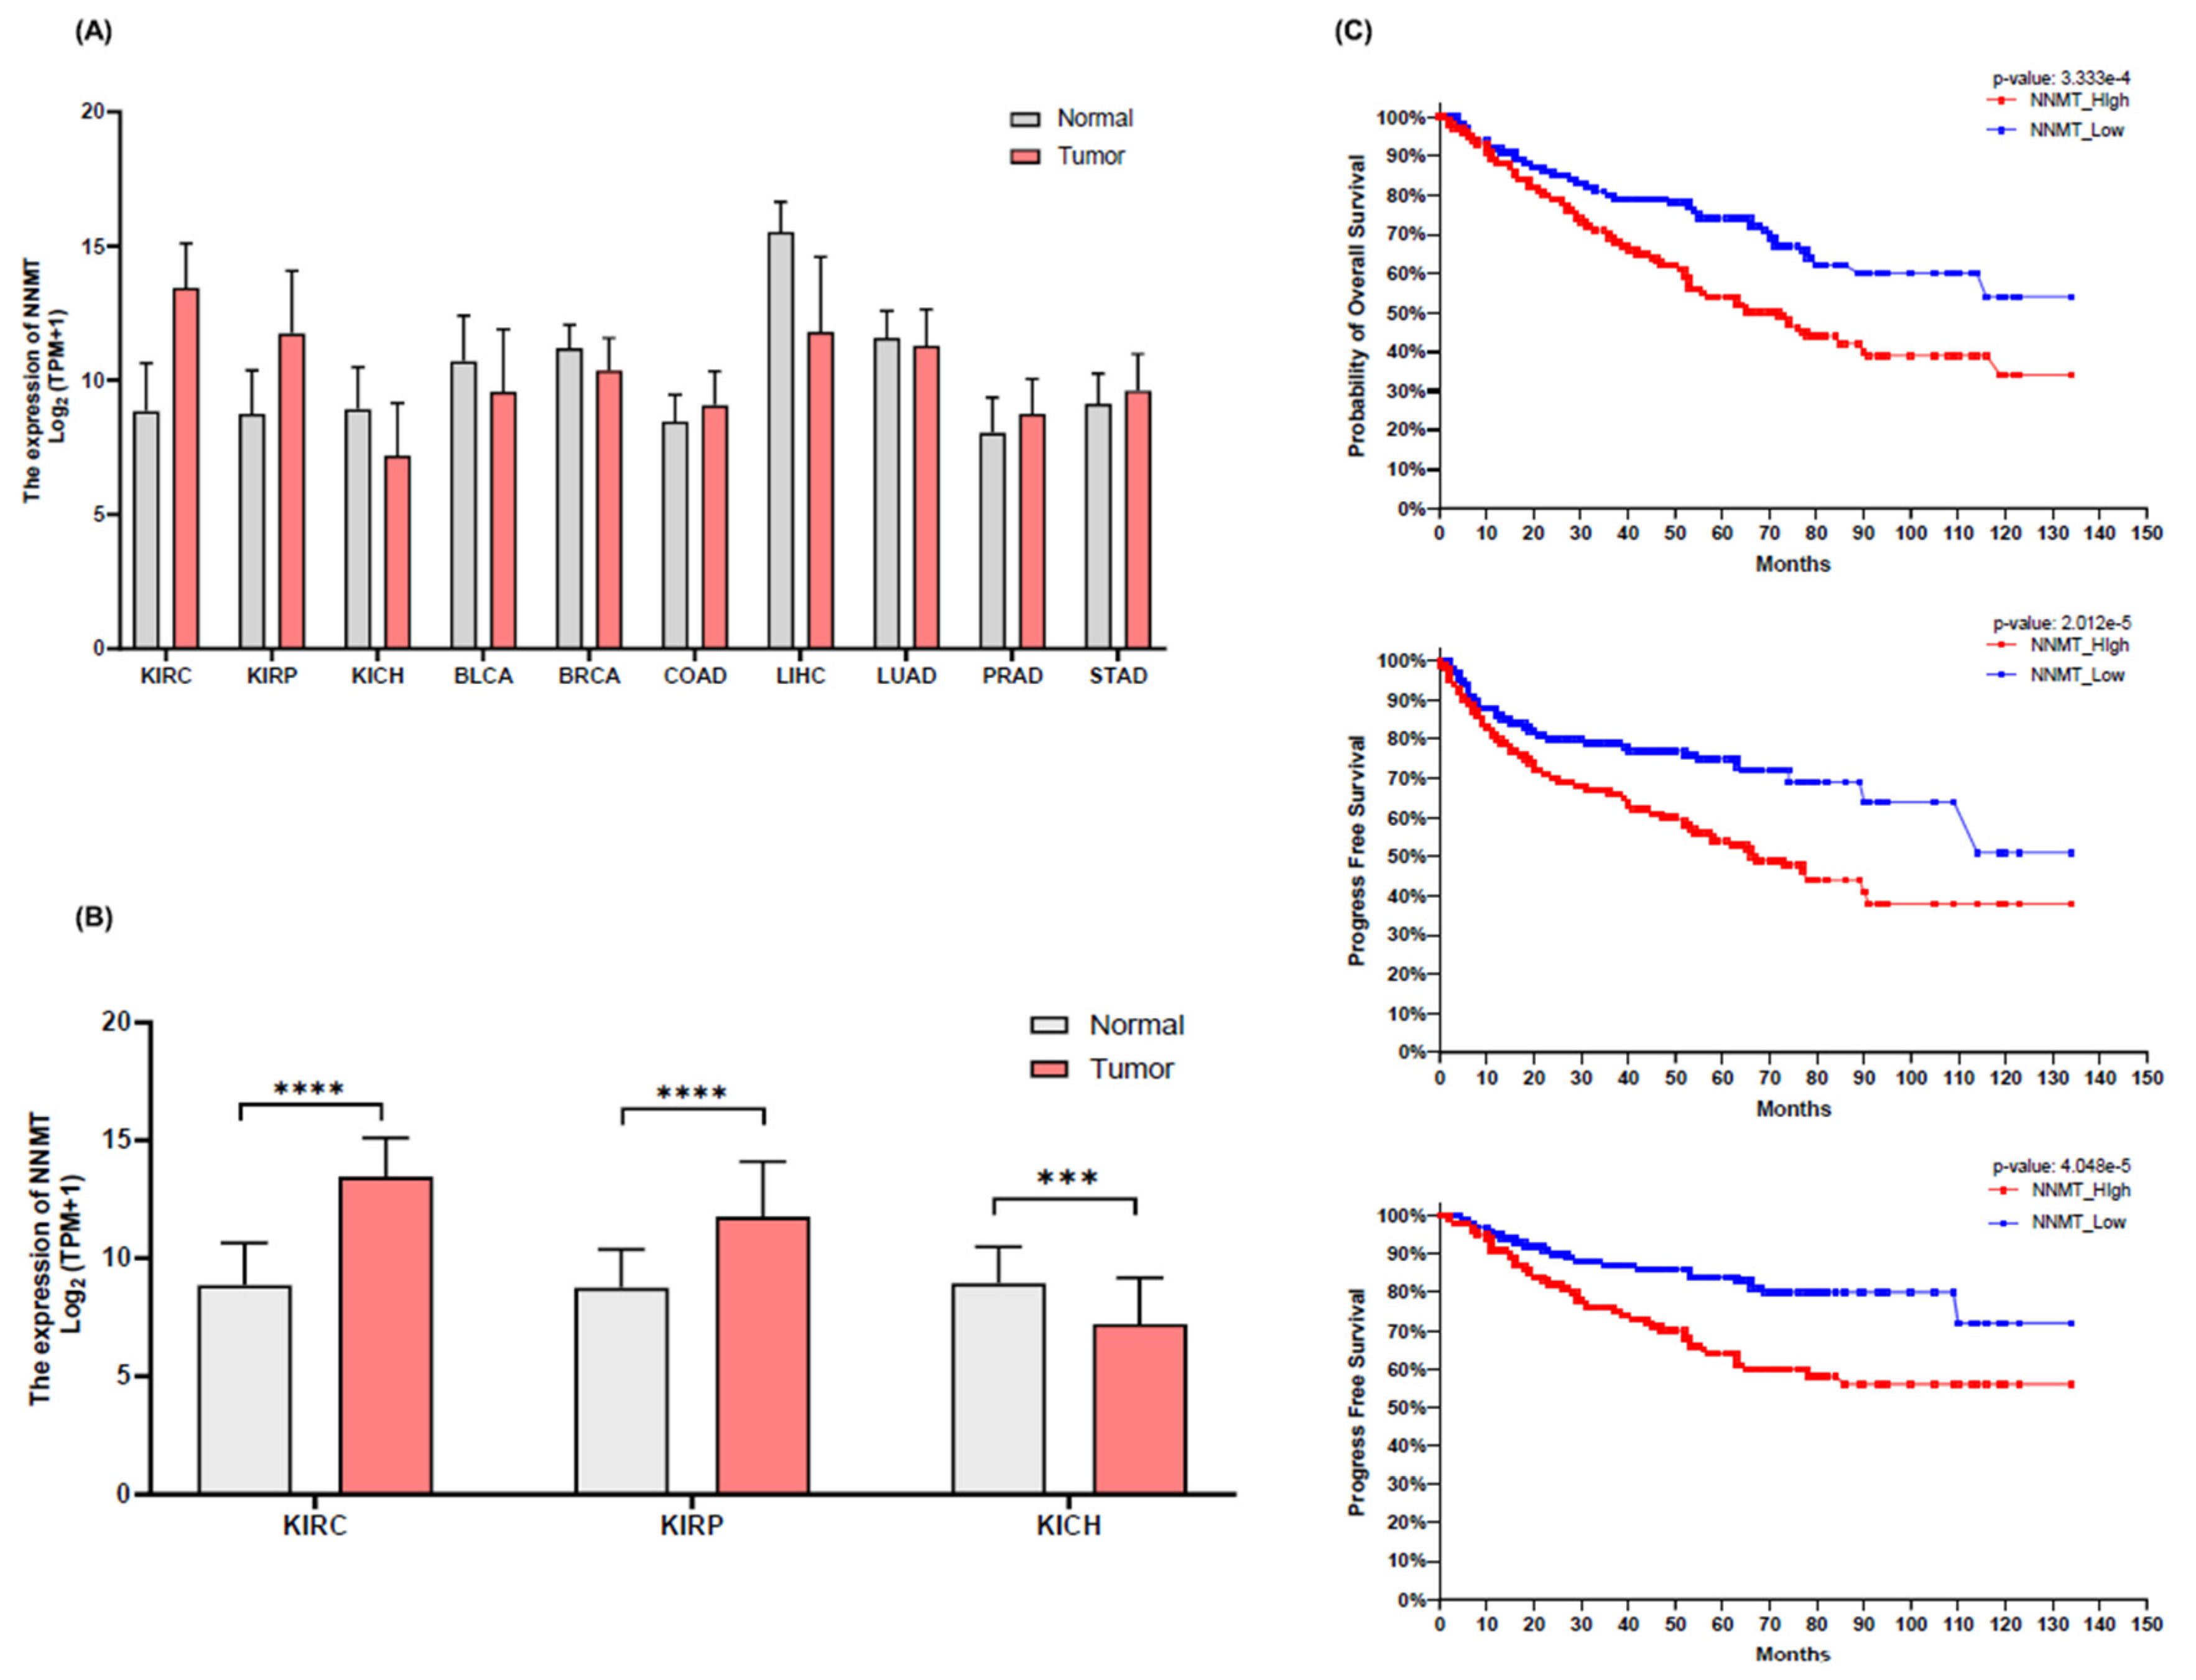
The expression levels of NNMT were analyzed across 10 different cancer types, including KIRC, KIRP, and KICH, in the TCGA database to investigate the differences between normal and patient groups (Figure 3A). Of these, the three cancer types corresponding to renal cell carcinoma (KIRC, KIRP, and KICH) exhibited a statistically significant difference in NNMT expression levels between the normal and patient groups (Figure 3B). The correlation between NNMT expression and patient survival rates was subsequently investigated. For KIRC patients, high NNMT expression was found to be significantly associated with reduced survival rates in terms of overall survival (OS), progression-free survival (PFS), and disease-specific survival (DSS) (Figure 3C). In contrast, other genes previously investigated, including HILPDA, ENPP6, and SLC13A3, demonstrated no significant correlation between their expression levels and patient survival rates. Similarly, KIRP and KICH also exhibited no significant correlation between NNMT expression and patient survival rates. The results were confirmed by Kaplan-Meier analysis (Figure S1).

NNMT Expression and Its Impact on Clinical Pathological Factors in KIRC

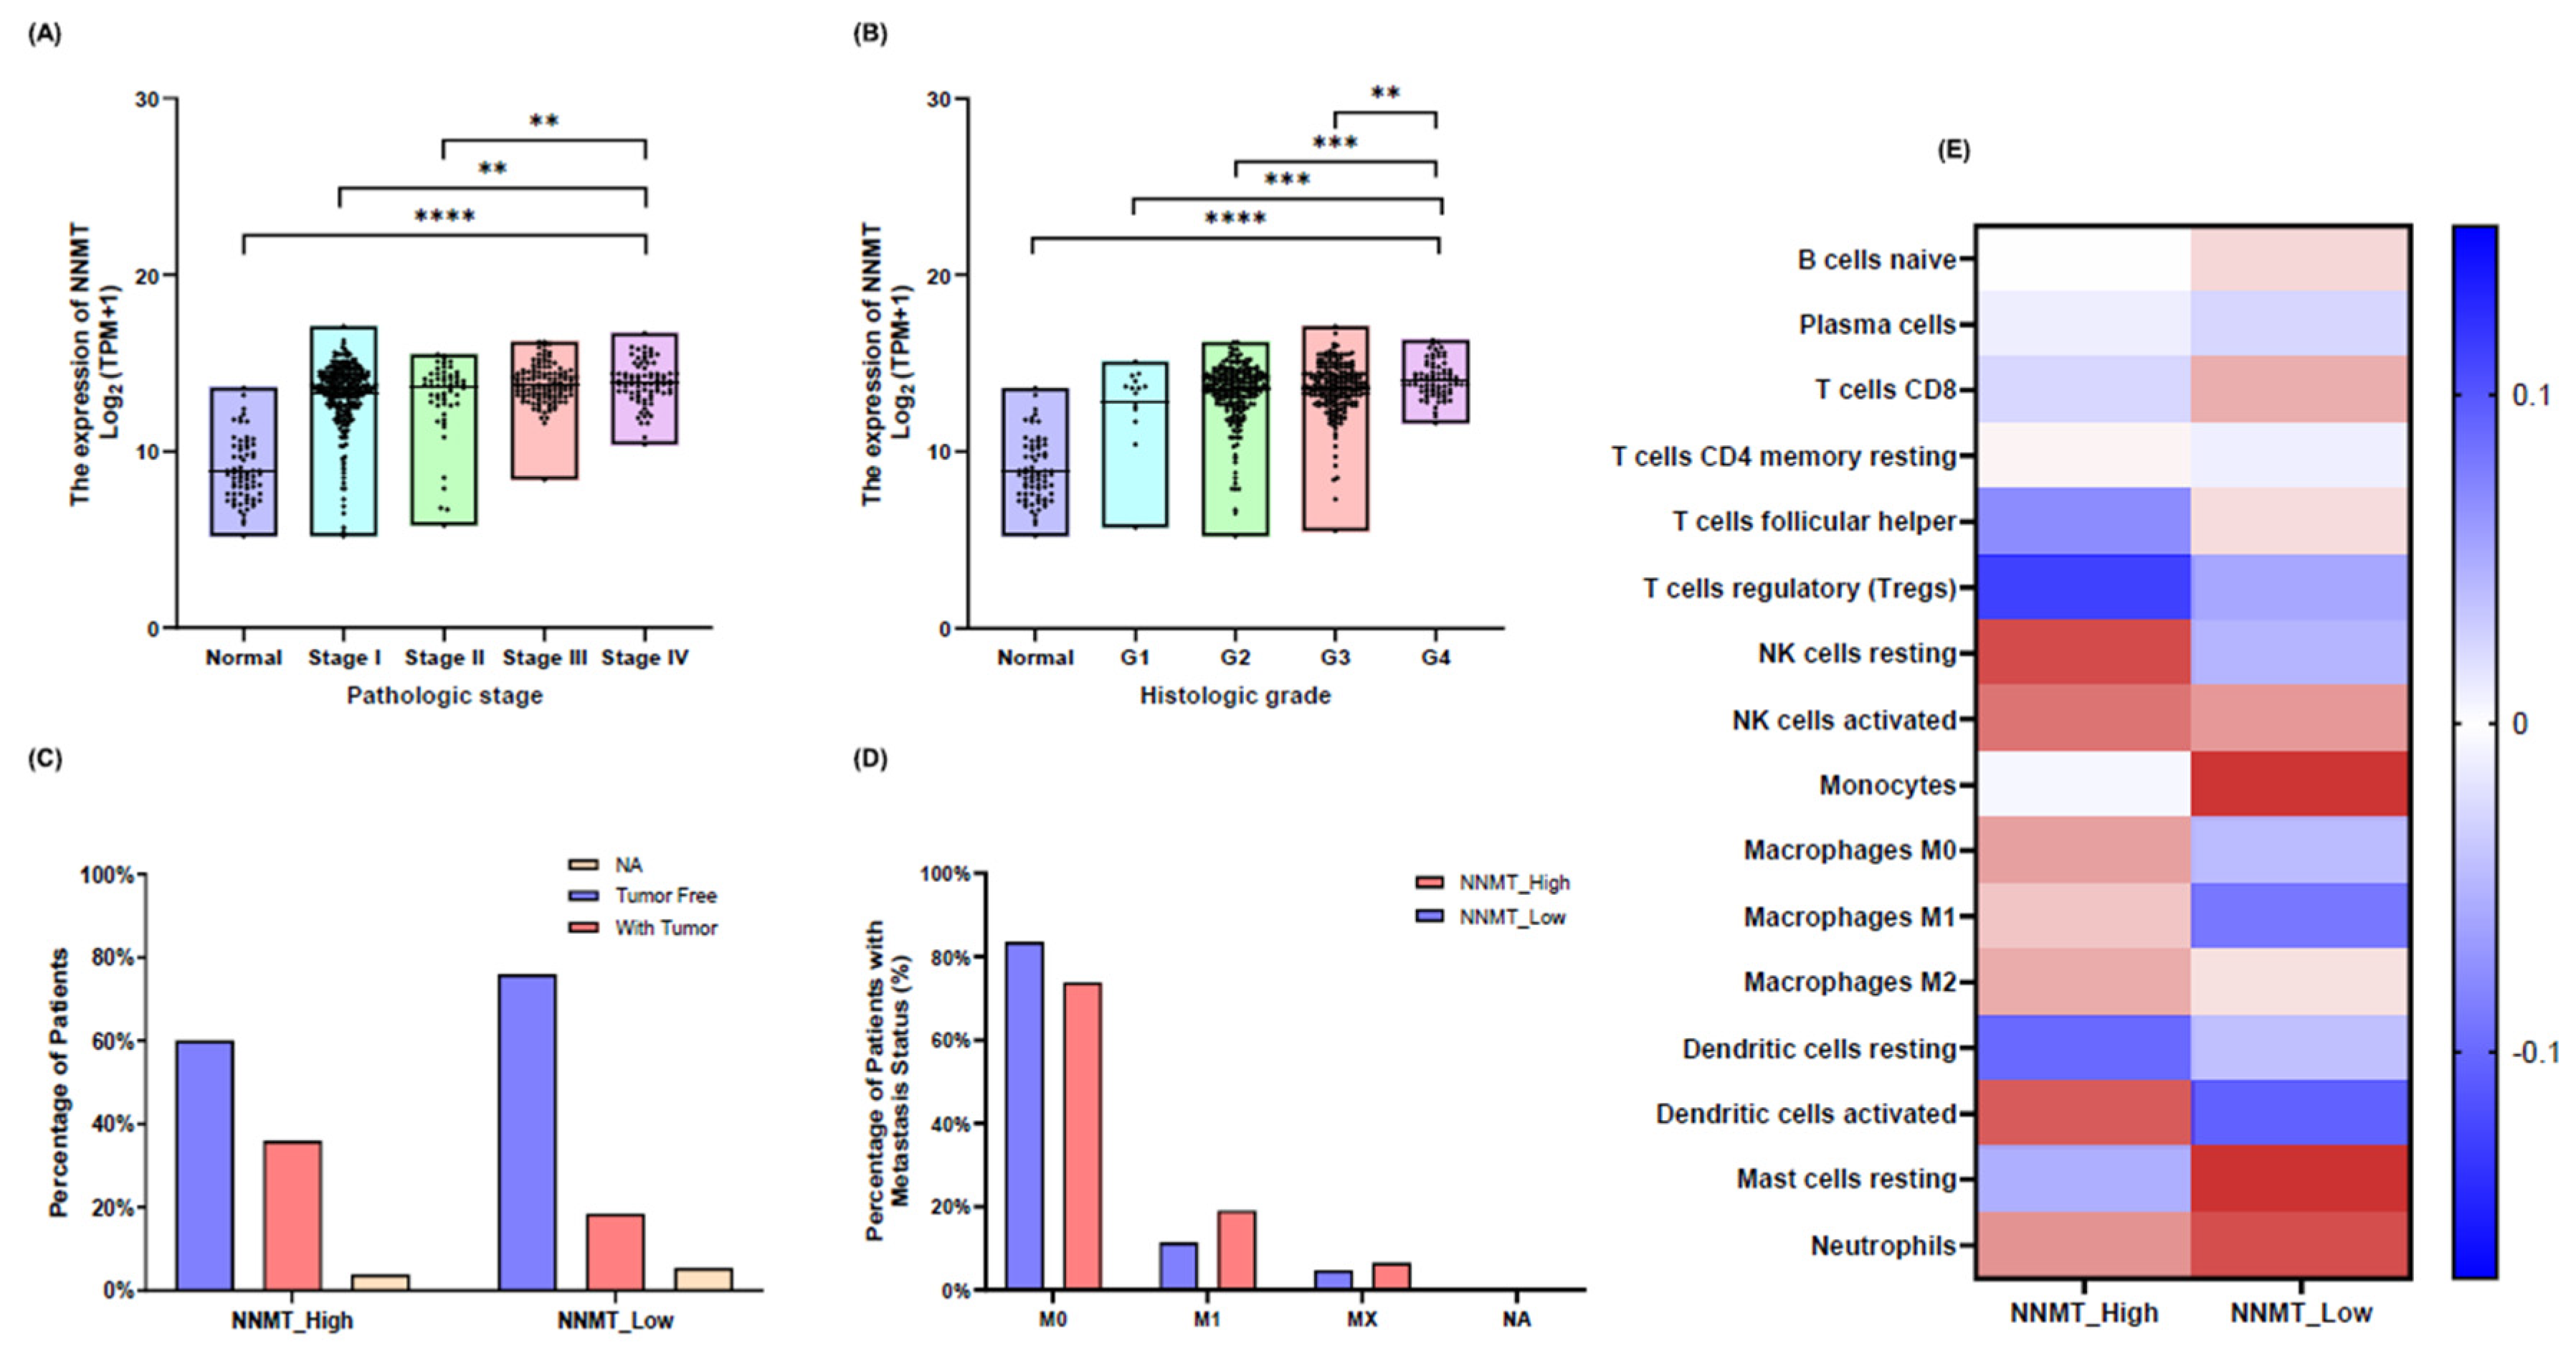
The TCGA-KIRC database was analyzed in order to determine the changes in clinical pathological factors according to NNMT expression. The data demonstrated that patients exhibited higher NNMT expression levels compared to the normal group across various pathological stages and histologic grades. With regard to pathological stage, patients exhibited higher NNMT expression levels than the normal group. Furthermore, higher stages were associated with higher NNMT expression values, and significant variation was observed between different stages. Although the significant difference between Stage 3 and Stage 4 was not conclusively identified, a notable significant difference was observed between the other stages and Stage 4 (Figure 4A). With regard to histologic grade, the patient group exhibited a higher NNMT expression value compared to the normal group. Notably, NNMT expression was significantly higher in Grade 4 (G4) patients than in the normal group and other grades (Figure 4B). For patients exhibiting high NNMT expression (NNMT_HIGH), approximately 36% of carcinoma cases were identified post-surgery and treatment, whereas the low NNMT expression group (NNMT_LOW) demonstrated a relatively lower rate of 18.5% (Figure 4C). Furthermore, approximately 20% of patients with high NNMT expression (NNMT_HIGH) were classified as M1 (metastatic stage), whereas the low NNMT expression group (NNMT_LOW) exhibited a relatively lower M1 rate (Figure 4D).

Immune Cell Infiltration and NNMT Expression in KIRC

CIBERSORTx was used to investigate the correlation between the expression level of NNMT and the proportion of immune cells in KIRC. The NNMT_HIGH group showed higher levels of infiltration of activated NK cells, macrophages (M0, M1, M2), and resting dendritic cells compared to the NNMT_LOW group. Conversely, the NNMT_LOW group showed higher infiltration of monocytes and activated dendritic cells. Notably, T regulatory cells (Tregs) were significantly more abundant in the NNMT_LOW group, whereas the NNMT_HIGH group had a higher presence of activated NK cells (Figure 4E). These findings suggest that NNMT expression levels may influence the immune microenvironment of KIRC, potentially impacting tumor immune evasion and patient response to immunotherapy.

NNMT Knockdown Suppresses ccRCC Cell Proliferation

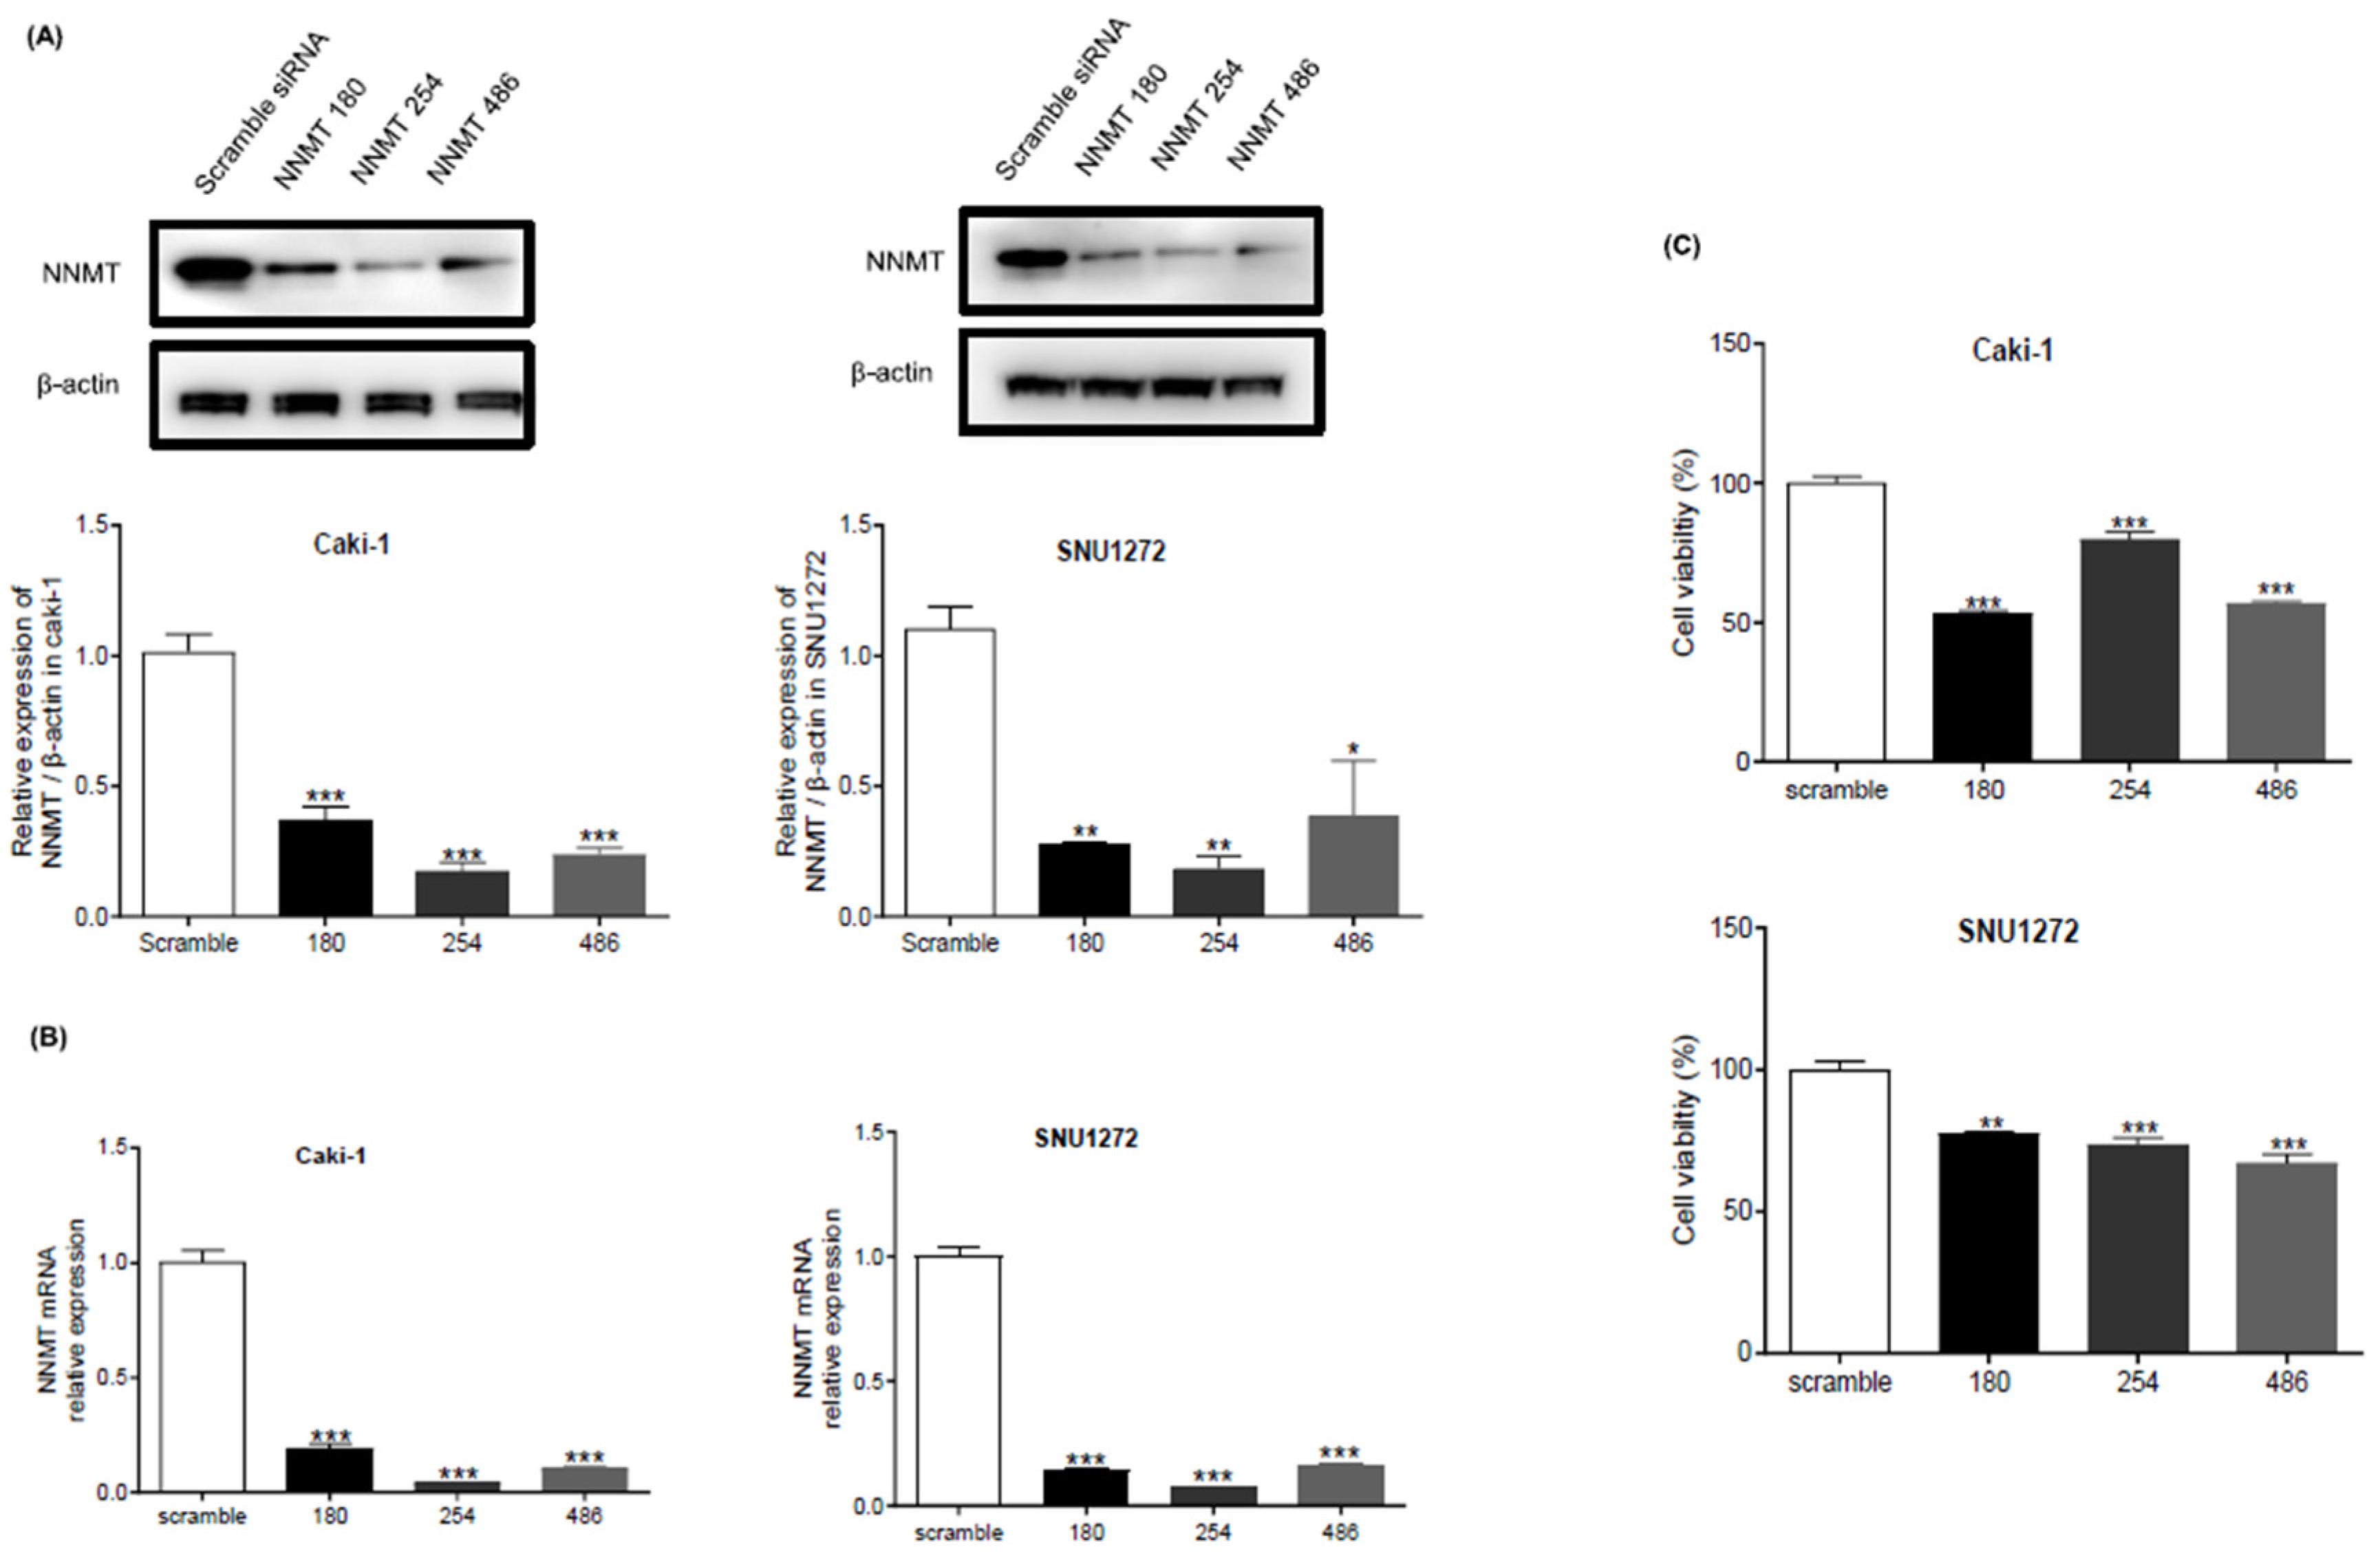
In light of the observed negative correlation between NNMT expression and patient survival rates, we sought to determine if NNMT plays a direct role in modulating the proliferation of clear cell renal cell carcinoma (ccRCC) cells at the in vitro level. siRNA-mediated knockdown was utilized to reduce NNMT expression in two distinct ccRCC cell lines. The suppression of NNMT was validated by western blot analysis and qPCR (Figure 5A,B). Both assays confirmed a marked reduction in NNMT levels post-transfection across the cell lines. Alongside, the proliferation assays demonstrated a significant decrease in cell growth following NNMT knockdown (Figure 5C).

NNMT Knockdown in ccRCC Cells Alters Gene Expression Profiles

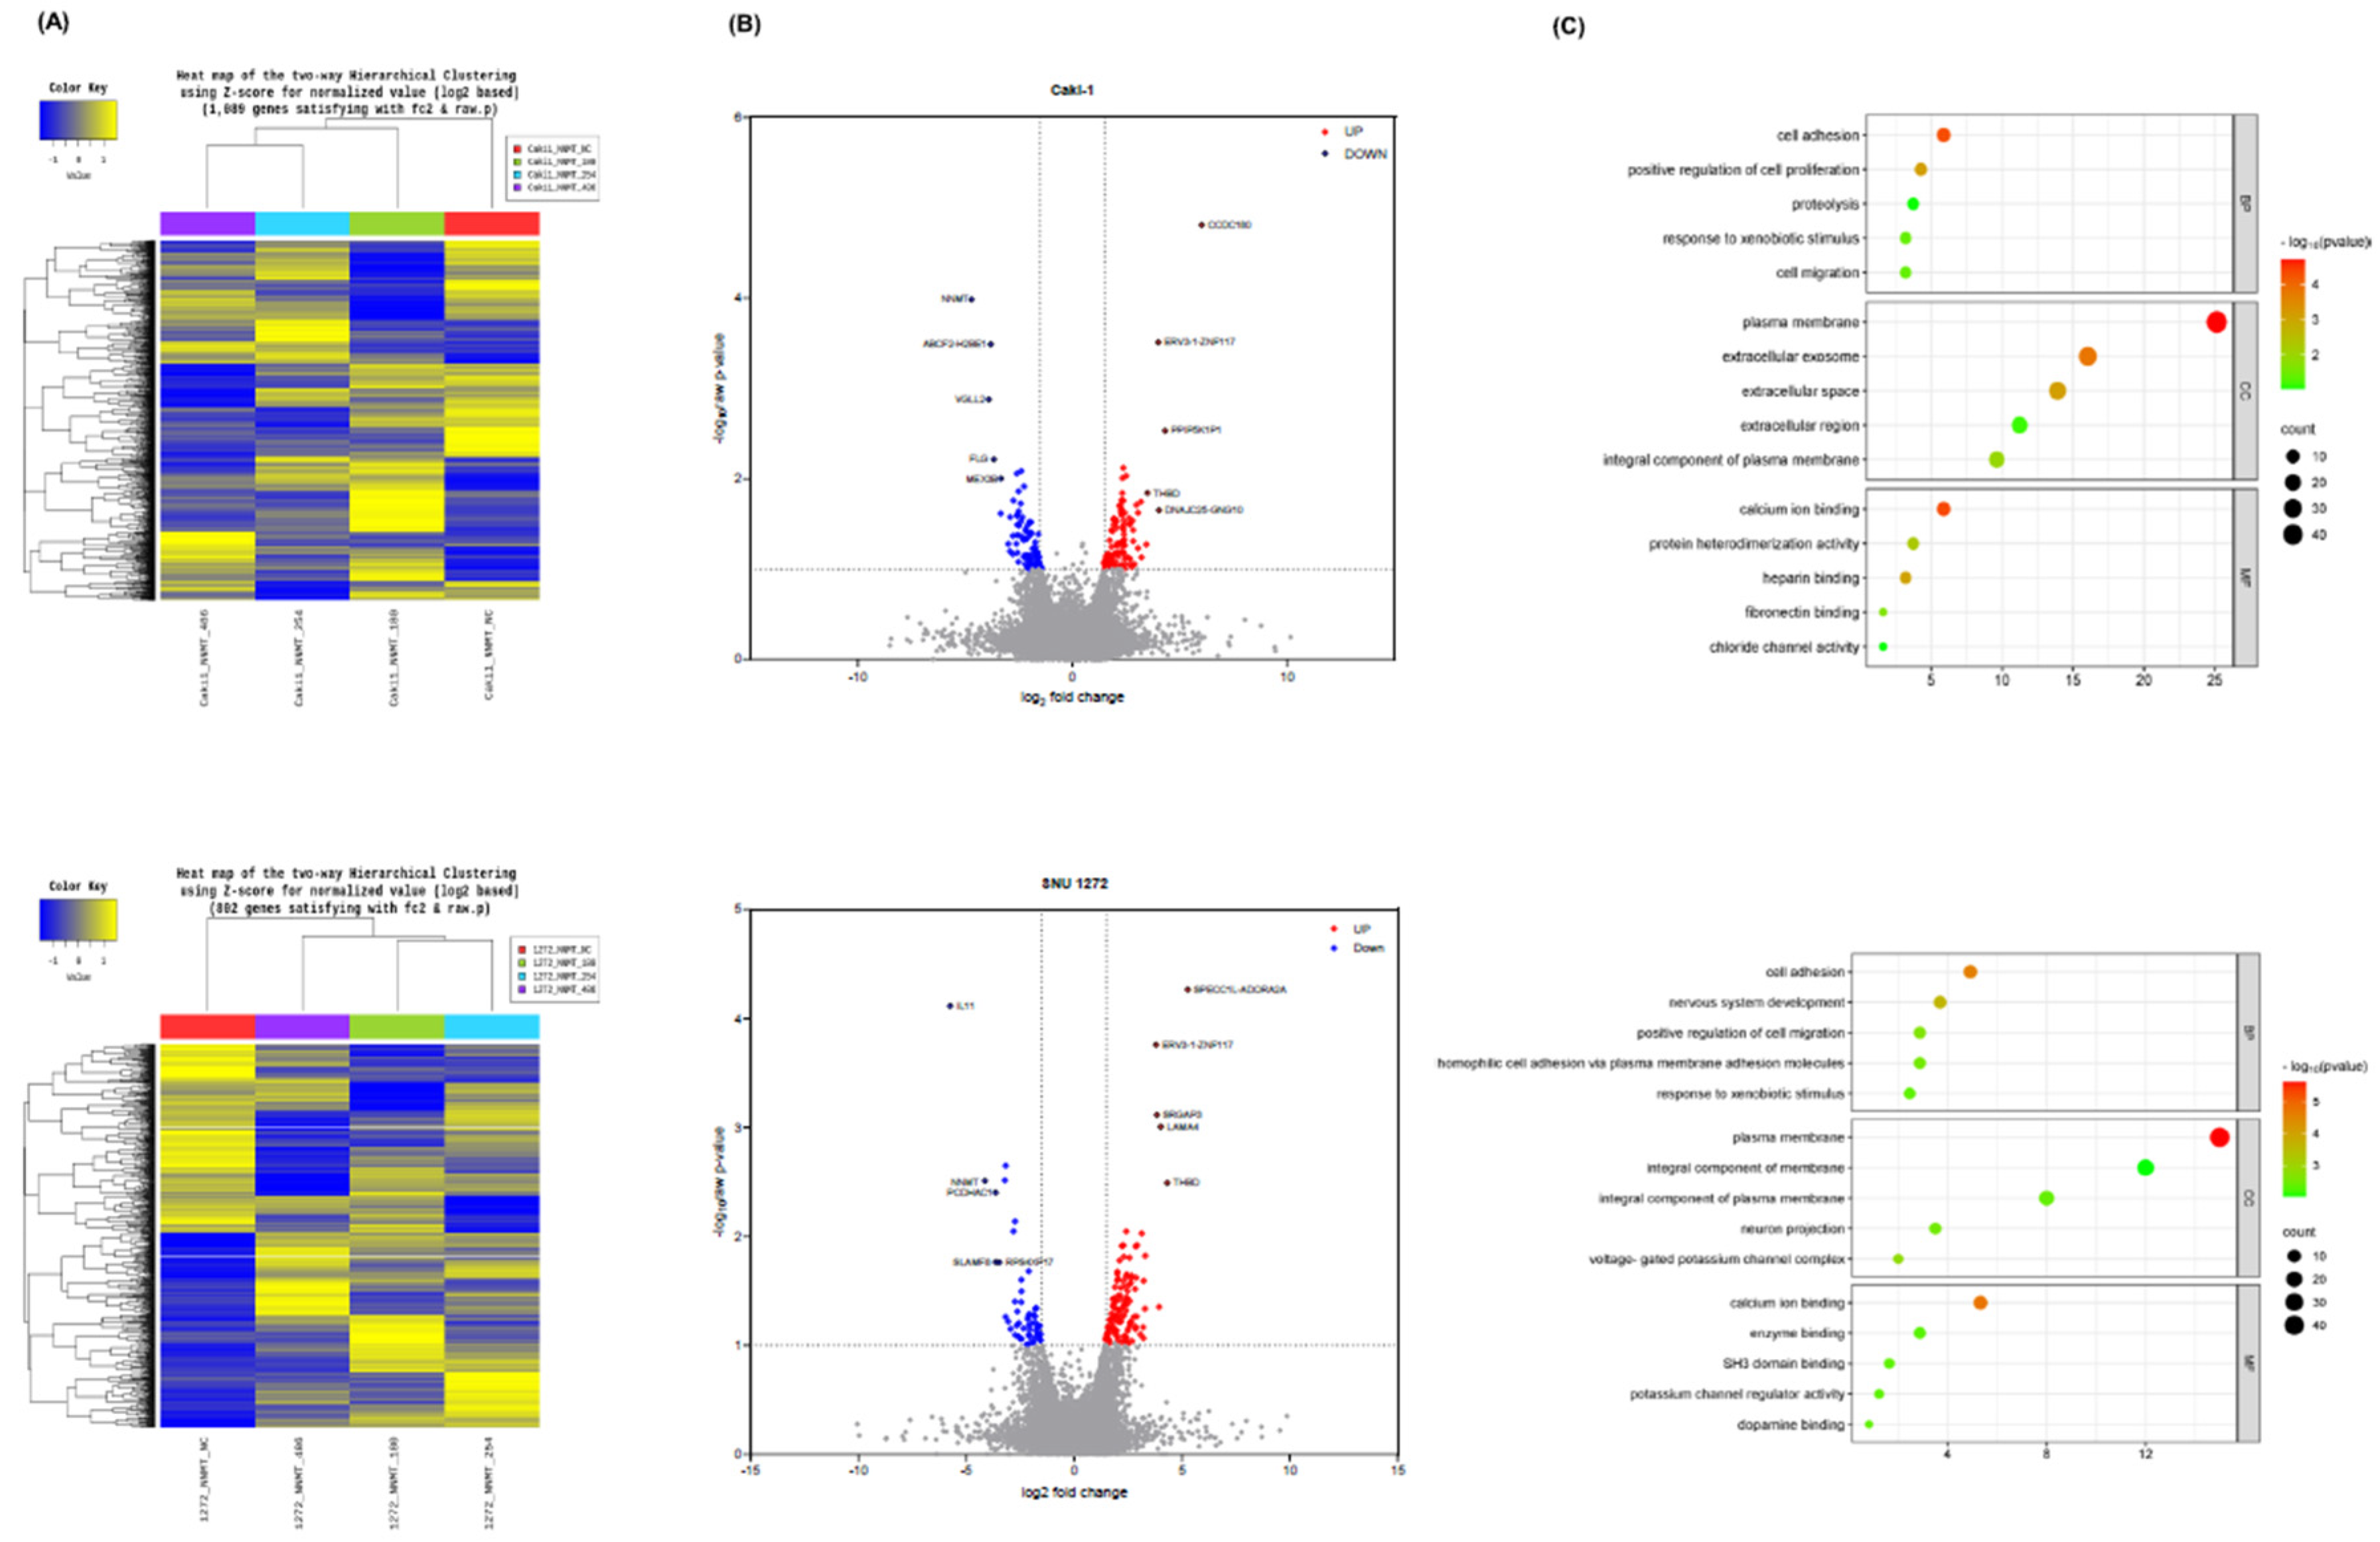
The expression profiles of NNMT-normal and NNMT-knockdown cells were clearly distinguished by hierarchical clustering, indicating a significant divergence between the two conditions. The heatmap illustrates this differentiation, with genes that are upregulated depicted in yellow and genes that are downregulated depicted in blue (Figure 6A). The volcano plot provides a clear visual representation of the differentially expressed genes (DEGs) between NNMT-normal and NNMT-knockdown cells. The x-axis represents the log2-fold change (log2FC) in gene expression, which illustrates the magnitude of upregulation (positive values) or downregulation (negative values). The y-axis depicts the -log10 p-value, which reflects the statistical significance of these changes. Genes exhibiting a significant increase in expression are indicated in red, whereas those displaying a decrease are shown in blue. This selection is based on rigorous criteria, requiring a log2FC of ±2 and a p-value below 0.1 (log10 p-value > 1) to ensure statistical robustness. The upregulated genes may be involved in processes such as cell proliferation and adhesion, while the downregulated genes could be linked to pathways that suppress tumor growth (Figure 6B). These differentially expressed genes (DEGs) represent key points of focus for further functional analysis. A subsequent GO enrichment analysis, utilizing the DAVID bioinformatics resources, distilled these expression changes into functional implications. Among the differentially expressed genes (DEGs), it was found that important biological processes such as cell adhesion and the positive regulation of cell proliferation were greatly enhanced. The analysis of cellular components revealed that the plasma membrane was a prominent area of perturbation. Furthermore, the analysis of molecular functions indicated that calcium ion binding was a highly active process, suggesting its potential role in regulating cellular communication and signal transduction. The enrichment analysis highlights the potential roles of these differentially expressed genes (DEGs) in critical cellular functions and their contributions to the observed alterations. The enrichment analysis highlights the potential roles these differentially expressed genes (DEGs) play in critical cellular functions and their contributions to the altered phenotype observed in NNMT-knockdown cells (Figure 6C). When comparing these findings to those presented in Figure 1, where gene expression profiles were analyzed in tumor versus normal tissues, it is evident that while the genes regulated by NNMT knockdown at the cellular level vary between cell types, the functional implications revealed through GO enrichment are similar to those observed in clinical samples.

Discussion

Previous studies by our research team have established NNMT as a valuable biomarker for the early detection of RCC [20,21]. However, research on the correlation between NNMT and the three RCC subtypes remains insufficient. In this study, we utilized the TCGA Database to investigate this correlation across the RCC subtypes and further evaluated NNMT’s value as a biomarker specifically for clear cell renal cell carcinoma (ccRCC), the most common form of RCC [38,39,40]. Our comprehensive analysis of differentially expressed genes (DEGs) in ccRCC reveals significant alterations in gene expression between tumor and normal tissues. These findings highlight key molecular targets for therapeutic intervention and emphasize the impact of NNMT expression on patient prognosis and tumor biology. RNA analysis and hierarchical clustering revealed distinct gene expression patterns between ccRCC and normal tissues, underscoring the profound molecular changes associated with tumor development. The top five upregulated genes (e.g., NNMT and HILPDA) and downregulated genes (e.g., ENPP6 and SLC13A3) were identified, providing valuable insights into the molecular landscape of ccRCC. These genes, characterized by substantial log2-fold changes and significant p-values, represent promising candidates for further functional studies and therapeutic targeting. The DAVID enrichment analysis of differentially expressed genes (DEGs) revealed the biological processes, cellular components, and molecular functions that were affected in ccRCC. Terms related to signal transduction, immune response, and protein binding were found to be significantly enriched, indicating the complexity of the tumor microenvironment and the potential involvement of these genes in critical signaling pathways and cellular interactions. The marked upregulation of NNMT and HILPDA, alongside the downregulation of ENPP6 and SLC13A3, suggests that these genes could serve as biomarkers or therapeutic targets in ccRCC. Functional validation in ccRCC cell lines further substantiated these expression patterns, providing a solid foundation for future mechanistic studies. Our analysis of NNMT expression across various cancer types, including RCC subtypes (KIRC, KIRP, KICH), revealed a significant correlation between high NNMT expression and reduced patient survival in KIRC. This finding aligns with those of previous studies indicating NNMT’s crucial role in tumor progression and aggressiveness. Kaplan-Meier analysis confirmed that high NNMT expression is associated with poor overall survival (OS), progression-free survival (PFS), and disease-specific survival (DSS) in KIRC patients, thus highlighting NNMT as a potential prognostic biomarker. Further investigation into the relationship between NNMT expression and clinical pathological factors in KIRC demonstrated that higher NNMT levels are associated with advanced pathological stages and higher histologic grades. This correlation indicates that NNMT expression may be indicative of tumor burden and aggressiveness, rendering it a valuable marker for disease stratification. The analysis of immune cell infiltration using CIBERSORTx revealed distinct differences between the NNMT_HIGH and NNMT_LOW groups, with implications for tumor immune evasion and response to immunotherapy. The higher infiltration of activated NK cells and macrophages in the NNMT_HIGH group suggests a complex interplay between NNMT expression and the immune microenvironment, which may impact therapeutic outcomes. siRNA-mediated knockdown of NNMT in ccRCC cell lines resulted in a significant reduction in cell proliferation, confirming the functional importance of NNMT in tumor growth. Subsequent gene expression profiling and GO enrichment analysis of NNMT-knockdown cells revealed critical biological processes and molecular functions, such as cell adhesion and calcium ion binding, that were influenced by NNMT expression. Overall, our study highlights the significant role of NNMT in ccRCC and suggests its potential as a biomarker and therapeutic target. These findings pave the way for further research into NNMT’s mechanisms and its application in clinical settings.

Conclusion

This study offers valuable insights into the molecular mechanisms driving ccRCC, identifies key molecular targets, and elucidates the functional and clinical significance of NNMT expression. The findings pave the way for the development of targeted therapies and prognostic biomarkers in renal cell carcinoma. While some aspects of NNMT’s role in the tumor microenvironment and its interaction with other molecular pathways require further investigation, the potential impact of these findings is significant. By elucidating the intricate role of NNMT in tumor progression and immune modulation, this research underscores the potential for novel therapeutic approaches. These findings provide a strong foundation for future research, which could further elucidate the roles of identified DEGs, particularly NNMT, and aid in the development of innovative treatments for renal cell carcinoma.

Author Contributions

All authors of this paper have read and approved the final version submitted, and have directly participated in the planning or analysis of the study. The experiment was designed by Hyung Ho Lee, Hyun Ho Han, and Jin Soo Chung, and the data was analyzed by Hyung Ho Lee and So Dam Won. The experimental data was analyzed by Min Gyu Kim and the manuscript was written by Kim. Advice on the experimental design was provided by Yeonsue Jang, Baek Gil Kim, Nam Hoon Cho, and Young Deuk Choi.

Funding Information

This research was supported by the Basic Science Research Program through the National Research Foundation of Korea (NRF), which was funded by the Ministry of Education (2022R1I1A1A0107306512). Furthermore, this study was supported by the National Cancer Center Grant (NCC-2110281/NCC-2110282) and a faculty research grant from Yonsei University College of Medicine (6-2021-0116).

Data availability

All TCGA datasets utilized in the study are publicly accessible. These include TCGA-KIRC (https://portal.gdc.cancer.gov/projects/TCGA-KIRC), TCGA-KIRP (https://portal.gdc.cancer.gov/projects/TCGA-KIRP), and TCGA-KICH (https://portal.gdc.cancer.gov/projects/TCGA-KICH). The remaining data are available within the article and supplementary information data file.

Acknowledgments

Not applicable.

Competing interests

The authors declare no competing interests.

References

  1. Padala, S.A., et al. Epidemiology of renal cell carcinoma. World J. Oncol. 2020, 11, 79. [CrossRef] [PubMed]
  2. Hsieh, J.J., et al. Renal cell carcinoma. Nat. Rev. Dis. Primers 2017, 3, 1–19.
  3. Bahadoram, S., et al. Renal cell carcinoma: an overview of the epidemiology, diagnosis, and treatment. G Ital. Nefrol. 2022, 39, 1.
  4. Cairns, P. Renal cell carcinoma. Cancer Biomark. 2011, 9, 461–473. [Google Scholar] [CrossRef]
  5. Cohen, H.T.; McGovern, F.J. Renal-cell carcinoma. New Engl. J. Med. 2005, 353, 2477–2490. [Google Scholar] [CrossRef]
  6. Porta, C., et al. The adjuvant treatment of kidney cancer: a multidisciplinary outlook. Nat. Rev. Nephrol. 2019, 15, 423–433. [CrossRef]
  7. Krabbe, L.-M., et al. Surgical management of renal cell carcinoma. In Seminars in Interventional Radiology 2014.
  8. Antonelli, A., et al. Surgical treatment of atypical metastasis from renal cell carcinoma (RCC). BJU Int. 2012, 110, E559–E563.
  9. Linehan, W.M. Genetic basis of kidney cancer: role of genomics for the development of disease-based therapeutics. Genome Res. 2012, 22, 2089–2100. [Google Scholar] [CrossRef]
  10. Frew, I.J.; Moch, H. A clearer view of the molecular complexity of clear cell renal cell carcinoma. Annu. Rev. Pathol. : Mech. Dis. 2015, 10, 263–289. [Google Scholar] [CrossRef]
  11. The Cancer Genome Atlas Research Network. et al. Comprehensive molecular characterization of clear cell renal cell carcinoma. Nature 2013, 499, 43–49. [Google Scholar] [CrossRef] [PubMed]
  12. Sato, Y., et al., Integrated molecular analysis of clear-cell renal cell carcinoma. Nat. Genet. 2013, 45, 860–867. [CrossRef] [PubMed]
  13. Grignon, D.J.; Che, M. Clear cell renal cell carcinoma. Clin. Lab. Med. 2005, 25, 305–316. [Google Scholar] [CrossRef]
  14. Schiliro, C.; Firestein, B.L. Mechanisms of metabolic reprogramming in cancer cells supporting enhanced growth and proliferation. Cells 2021, 10, 1056. [Google Scholar] [CrossRef]
  15. Wei, Q., et al. Metabolic rewiring in the promotion of cancer metastasis: mechanisms and therapeutic implications. Oncogene 2020, 39, 6139–6156. [CrossRef]
  16. Bergers, G.; Fendt, S.-M. The metabolism of cancer cells during metastasis. Nat. Rev. Cancer 2021, 21, 162–180. [Google Scholar] [CrossRef] [PubMed]
  17. Jang, M.; Kim, S.S.; Lee, J. Cancer cell metabolism: implications for therapeutic targets. Exp. Mol. Med. 2013, 45, e45–e45. [Google Scholar] [CrossRef]
  18. Martínez-Reyes, I.; Chandel, N.S. Cancer metabolism: looking forward. Nat. Rev. Cancer 2021, 21, 669–680. [Google Scholar] [CrossRef]
  19. Furuta, E., et al. Metabolic genes in cancer: their roles in tumor progression and clinical implications. Biochim. Et Biophys. Acta (BBA)-Rev. Cancer 2010, 1805, 141–152. [CrossRef]
  20. Kim, D.S., et al. Scale-up evaluation of a composite tumor marker assay for the early detection of renal cell carcinoma. Diagnostics 2020, 10, 750. [CrossRef]
  21. Kim, D.S., et al. Panel of candidate biomarkers for renal cell carcinoma. J. Proteome Res. 2010, 9, 3710–3719. [CrossRef] [PubMed]
  22. Shin, J.H., et al. NNMT depletion contributes to liver cancer cell survival by enhancing autophagy under nutrient starvation. Oncogenesis 2018, 7, 58. [CrossRef]
  23. Eckert, M.A., et al. Proteomics reveals NNMT as a master metabolic regulator of cancer-associated fibroblasts. Nature 2019, 569, 723–728. [CrossRef] [PubMed]
  24. Ramsden, D.B., et al. Nicotinamide N-methyltransferase in health and cancer. Int. J. Tryptophan Res. 2017, 10, 1178646917691739. [CrossRef] [PubMed]
  25. Roberti, A.; Fernández, A.F.; Fraga, M.F. Nicotinamide N-methyltransferase: At the crossroads between cellular metabolism and epigenetic regulation. Mol. Metab. 2021, 45, 101165. [Google Scholar] [CrossRef] [PubMed]
  26. Zhang, J., et al. Nicotinamide N-methyltransferase protein expression in renal cell cancer. J. Zhejiang Univ. Sci. B 2010, 11, 136–143. [CrossRef]
  27. Holstein, S., et al. Nicotinamide N-methyltransferase and its precursor substrate methionine directly and indirectly control malignant metabolism during progression of renal cell carcinoma. Anticancer. Res. 2019, 39, 5427–5436. [CrossRef] [PubMed]
  28. Campagna, R., et al. The Utility of Nicotinamide N-methyltransferase as a potential biomarker to predict the oncological outcomes for urological cancers: an update. Biomolecules 2021, 11, 1214.
  29. Gupta, S.; Kanwar, S.S. Biomarkers in renal cell carcinoma and their targeted therapies: a review. Explor. Target. Anti-Tumor Ther. 2023, 4, 941. [Google Scholar] [CrossRef]
  30. Ricketts, C.J., et al. The cancer genome atlas comprehensive molecular characterization of renal cell carcinoma. Cell Rep. 2018, 23, 313–326. [CrossRef]
  31. Linehan, W.M.; Ricketts, C.J. The Cancer Genome Atlas of renal cell carcinoma: findings and clinical implications. Nat. Rev. Urol. 2019, 16, 539–552. [Google Scholar] [CrossRef] [PubMed]
  32. Tomczak, K.; Czerwińska, P.; Wiznerowicz, M. Review The Cancer Genome Atlas (TCGA): an immeasurable source of knowledge. Contemp. Oncol./Współczesna Onkol. 2015, 2015, 68–77. [Google Scholar] [CrossRef]
  33. Dennis, G., et al. DAVID: database for annotation, visualization, and integrated discovery. Genome Biol. 2003, 4, 1–11. [CrossRef]
  34. Steen, C.B., et al. Profiling cell type abundance and expression in bulk tissues with CIBERSORTx. Stem Cell Transcr. Netw. Methods Protoc. 2020, 135–157.
  35. Pontén, F., et al. The Human Protein Atlas as a proteomic resource for biomarker discovery. J. Intern. Med. 2011, 270, 428–446. [CrossRef]
  36. Pontén, F.; Jirström, K.; Uhlen, M. The Human Protein Atlas—a tool for pathology. J. Pathol. A J. Pathol. Soc. Great Br. Irel. 2008, 216, 387–393. [Google Scholar] [CrossRef] [PubMed]
  37. Thul, P.J.; Lindskog, C. The human protein atlas: a spatial map of the human proteome. Protein Sci. 2018, 27, 233–244. [Google Scholar] [CrossRef] [PubMed]
  38. Olshan, A.F., et al. Racial difference in histologic subtype of renal cell carcinoma. Cancer Med. 2013, 2, 744–749. [CrossRef]
  39. Muglia, V.F.; Prando, A. , Renal cell carcinoma: histological classification and correlation with imaging findings. Radiol. Bras. 2015, 48, 166–174. [Google Scholar] [CrossRef]
  40. Low, G., et al. Review of renal cell carcinoma and its common subtypes in radiology. World J. Radiol. 2016, 8, 484. [CrossRef]
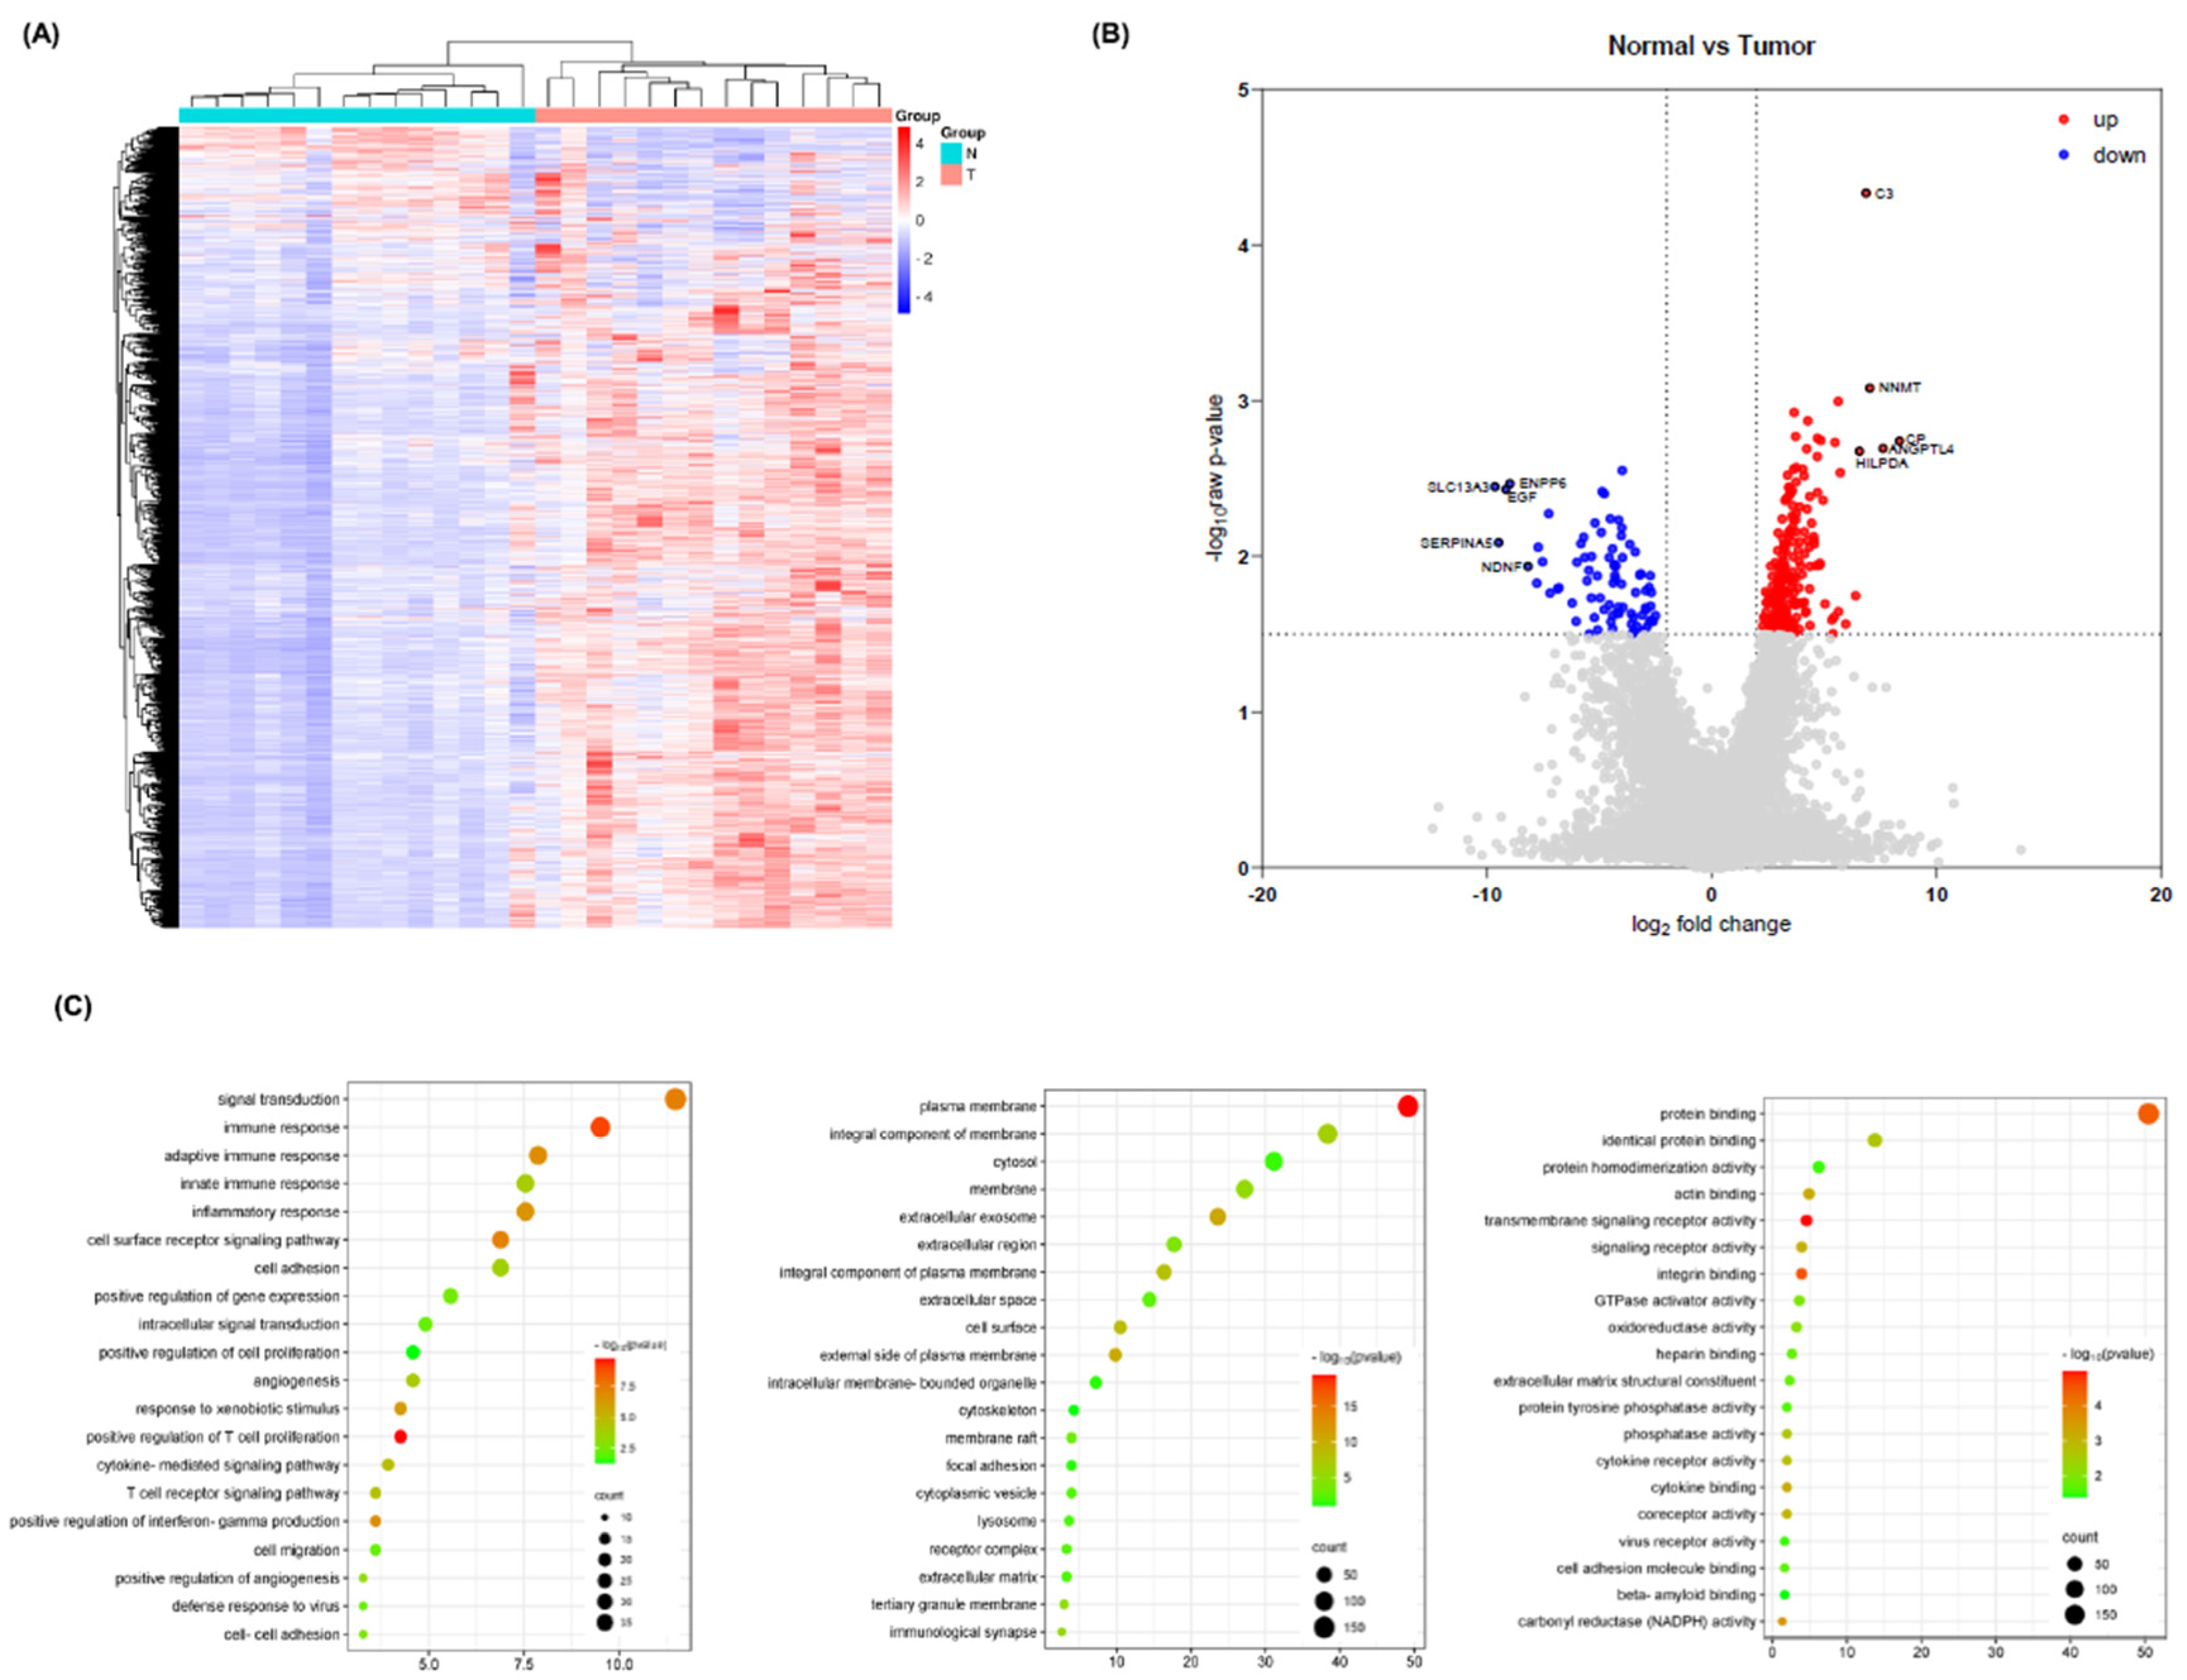
Figure 1. Differential gene expression between tumor and adjacent normal tissues in ccRCC patients. (A) Hierarchical clustering of gene expression data from 14 ccRCC patients revealed distinct patterns between tumor (T) and normal (N) tissues. Upregulated genes in tumor tissues are shown in red, while downregulated genes are shown in blue. (B) A volcano plot illustrating the log2-fold change (log2FC) versus -log10 p-value of gene expression differences. Red dots represent significantly upregulated genes, and blue dots represent significantly downregulated genes, with a stringent cutoff of log2FC ±2 and p<0.05. The top five upregulated and downregulated genes are labeled. (C) Gene Ontology (GO) enrichment analysis for biological process (BP), cellular component (CC), and molecular function (MF) categories. Top 20 enriched terms are shown for each category, highlighting significant involvement in signal transduction, immune response, and protein binding activities.
Preprints 119888 g001
Figure 2. Gene expression alterations in renal carcinoma: A qPCR validation study. (A) RT-PCR results showing the expression levels of HILPDA, NNMT, ENPP6, and SLC13A3 in renal carcinoma tissues compared to adjacent normal tissues. (B) Quantitative PCR (qPCR) analysis confirmed significant upregulation of HILPDA and NNMT and downregulation of ENPP6 and SLC13A3 in renal carcinoma tissues. Relative expression levels were normalized to GAPDH expression. Statistical significance was determined using a t-test, with **p<0.01 and ***p<0.001. (C) Box plots demonstrating the relative expression levels of HILPDA, NNMT, ENPP6, and SLC13A3 in normal and tumor tissues. These results validate the RNA sequencing data and highlight these genes as potential biomarkers or therapeutic targets in renal carcinoma.
Preprints 119888 g002
Figure 3. NNMT expression and its correlation with patient survival in renal cell carcinoma. (A) Expression levels of NNMT were analyzed across 10 different cancer types, including KIRC, KIRP, and KICH, using data from the TCGA database. The bar graph represents the relative expression levels of NNMT in normal (gray) and tumor (red) tissues. (B) Detailed comparison of NNMT expression levels in renal cell carcinoma subtypes (KIRC, KIRP, and KICH) between normal and patient groups. (C) Kaplan-Meier survival curves illustrating the correlation between high NNMT expression and reduced overall survival (OS), progression-free survival (PFS), and disease-specific survival (DSS) in KIRC patients. High NNMT expression is associated with a significantly lower survival rate compared to low NNMT expression groups.
Preprints 119888 g003
Figure 4. NNMT expression and its impact on clinical pathological factors in KIRC. (A) Analysis of TCGA-KIRC data showing NNMT expression levels across different pathological stages. Higher NNMT expression was observed in advanced stages, with a significant difference noted between Stage 4 and other stages. (B) NNMT expression levels across histologic grades, with Grade 4 (G4) showing significantly higher NNMT expression compared to normal tissue and other grades. (C) Distribution of carcinoma cases post-surgery and treatment in patients with high NNMT expression (NNMT_HIGH) and low NNMT expression (NNMT_LOW). Higher NNMT expression was associated with a greater percentage of post-treatment carcinoma cases. (D) Comparison of metastatic stage (M1) between NNMT_HIGH and NNMT_LOW groups, indicating a higher rate of M1 in the NNMT_HIGH group. (E) Correlation between NNMT expression levels and immune cell infiltration in KIRC, analyzed using CIBERSORTx. NNMT_HIGH group exhibited higher levels of activated NK cells, macrophages (M0, M1, M2), and resting dendritic cells, while the NNMT_LOW group showed higher levels of monocytes, activated dendritic cells, and T regulatory cells (Tregs).
Preprints 119888 g004
Figure 5. NNMT knockdown suppresses ccRCC cell proliferation. (A) Western blot analysis showing the reduction of NNMT protein levels in two ccRCC cell lines following siRNA-mediated knockdown. β-actin was used as a loading control. (B) Quantitative PCR (qPCR) confirming the significant reduction of NNMT mRNA levels post-transfection with siRNA in the same cell lines. (C) Proliferation assays demonstrating a significant decrease in cell growth following NNMT knockdown in both ccRCC cell lines. Cell proliferation was measured at different time points post-transfection. Results are presented as mean ± SD, with statistical significance indicated by **p<0.01 and ***p<0.001.
Preprints 119888 g005
Figure 6. NNMT knockdown in ccRCC cells alters gene expression profiles. (A) Hierarchical clustering heatmap showing distinct separation of gene expression profiles between NNMT-normal and NNMT-knockdown cells. Upregulated genes are depicted in yellow, and downregulated genes are in blue. (B) Volcano plot highlighting significantly upregulated (red) and downregulated (blue) genes in NNMT-knockdown cells. A stringent cutoff of log2-fold change (log2FC) of ±2 and p-value < 0.1 (log10 p-value > 1) was used. The most significant genes are labeled. (C) Gene Ontology (GO) enrichment analysis of differentially expressed genes (DEGs) showing significant changes in biological processes, cellular components, and molecular functions. Key enriched terms include cell adhesion, positive regulation of cell proliferation, plasma membrane, and calcium ion binding.
Preprints 119888 g006
Table 1. Patients’ clinical characteristics.
NO. Patient ID Histologic Subtype Tumor
Size
Nucleolar grade (WHO/ISUP) Tumor Necrosis Pathologic stage
(AJCC 2017):
#1 KC-90 clear cell type 3.5x3.0x3.0cm 3/4 0% pT1aNx
#2 KC-91 clear cell type 3.2x2.4x2.2cm 2/4 10% pT1aN0
#3 KC-92 clear cell type 1.8x1.6x1.5cm 3/4 0% pT1aNx
#4 KC-93 clear cell type 1.6x1.5x1.2cm 2/4 10% pT1aN0
#5 KC-96 clear cell type 3.5x2.5x2.4cm 3/4 20% pT1aNx
#6 KC-97 clear cell type 2.5x1.7x1.5cm 2/4 40% pT1aNx
#7 KC-99 clear cell type 3.6x2.8x2.5cm 3/4 30% pT1aNx
#8 KC-100 clear cell type 1.7x1.7x0.8cm 2/4 0% pT1aNx
#9 KC-102 clear cell type 1.8x1.6x1.6cm 2/4 0% pT1aNx
#10 KC-104 clear cell type 3.2x2.7x2.4cm 3/4 5% pT1aNx
#11 KC-105 clear cell type 2.0x1.8x1.5cm 3/4 20% pT1aNx
#12 KC-106 clear cell type 1.6x1.5x1.0cm 2/4 0% pT1aNx
#13 KC-109 clear cell type 4.2x3.3x2.0cm 3/4 10% pT1bNx
#14 KC-110 clear cell type 2.2x1.2x1.2cm 2/4 20% pT1aNx
Table 2. PCR primer sequences.
Genes Sequence (5′-3′) Annealing Temperature (°C)
18 S ForwardReverse 5′-CTGCCCTATCAACTTTCGATGGTA-3′
5′- CCGTTTCTCAGGCTCCCTCTC-3′
54 °C
NNMT ForwardReverse 5′-CCATCTGTTCTAAAAGAAGGGC -3′
5′-GGAGGTGAAGCCTGATTCCA -3′
58 °C
HILPDA ForwardReverse 5′-ACCGACTTTCCTCCGGACTC -3′
5′-TGCAGAGAAACAGAGCTGCC -3′
58 °C
ENPP6 ForwardReverse 5′-GTGGGTCACTCTGACCAAGG -3′
5′-GAGCATCGCTGACTGCATTG -3′
57 °C
SLC13A3 ForwardReverse 5′-CTGCTGGTGCTGCTGTTCAC -3′
5′-CTGGGGTCCTTTCGAACCTC -3′
56 °C
Disclaimer/Publisher’s Note: The statements, opinions and data contained in all publications are solely those of the individual author(s) and contributor(s) and not of MDPI and/or the editor(s). MDPI and/or the editor(s) disclaim responsibility for any injury to people or property resulting from any ideas, methods, instructions or products referred to in the content.
Copyright: This open access article is published under a Creative Commons CC BY 4.0 license, which permit the free download, distribution, and reuse, provided that the author and preprint are cited in any reuse.
Prerpints.org logo

Preprints.org is a free preprint server supported by MDPI in Basel, Switzerland.

Subscribe

© 2024 MDPI (Basel, Switzerland) unless otherwise stated