
Submitted:
30 September 2024
Posted:
01 October 2024
You are already at the latest version
Abstract
(1)Background: Evidence on the association between air pollution and the risk of exacerbations of chronic obstructive pulmonary disease (COPD) is scarce and inconsistent. We aimed to analyze the association between long-term exposure to particulate matter with a diameter of less than 2.5 µm (PM2.5) and nitrogen dioxide (NO2) and exacerbation of COPD (COPD-E) in Bogotá, Colombia; (2) Methods: Retrospective cohort study of 722 COPD patients in the AIREPOC program of the Colombian Pneumological Foundation between 2018 and 2021. Exposure to PM2.5 and NO2 was estimated for residential locations using the inverse squared distance weighted regression (IDWR) method. Hazard Ratios (HR) were calculated for the first COPD-E during follow-up using Cox models, adjusted for meteorological, demographic, and clinical variables; (3) Results: COPD-E was associated with long-term exposure to PM2.5 (HR:1.03, 95%CI: 1.02-1.05) and NO2 (HR:1.05, 95%CI: 1.03-1.07) controlling for the effect of quality of life, history of COPD-E, Forced Expiratory Volume in One Second (FEV1) pre-bronchodilator and exposure to solar radiation. An association was found between COPD-E and concentrations ≥ 25µg/m3 of NO2 (HR:1.49, 95%CI: 1.12-1.98) but not with concentrations ≥15 µg/m3 of PM2.5; (4) Conclusions: This study suggests that people with COPD exposed to higher concentrations of PM2.5 and NO2 had an increased risk of COPD-E. Solar radiation was also associated with an increased risk of COPD-E. The results highlight the importance of continuing efforts to reduce air pollution.
Keywords:
survival analysis
; air pollution
; long-term effect
1. Introduction
Chronic obstructive pulmonary disease (COPD) is the result of a complex interaction between genes and environment, and heterogeneous in its form of presentation and evolution. It remains a significant global health burden, contributing to 3.23 million deaths in 2019 [1]. The burden of disease due to COPD in the world highlights a decrease of 0.46% in Disability Adjusted Life Years (DALYs) between 1990 and 2019 [2]. In Colombia, however, there has been a 62.45% increase in age-standardized DALY rates over the same period (from 366.98 in 1990 to 596.18 per 100,000 population in 2019) [2].
In middle- and high-income countries, there has been a decrease in COPD deaths to 1.3 million [3]. However, an increase by 5.4 million annual COPD deaths is projected by 2060 as a consequence of population aging [4], changes in the prevalence of non-communicable diseases, and increased air pollution in low- and middle-income countries [5]. Furthermore, there has been an increase in the global prevalence of COPD from 3.71% to 3.92% between 1990 and 2017 [6]. In Latin America and the Caribbean, the increase has been from 2.67% to 3.33% in the same period from 1990 to 2017, and in Colombia 3.13% in 2017 [6,7].
It is now believed that there are other risk factors for COPD in addition to smoking and alpha-antitrypsin deficiency, and it is recognized that air pollution can exacerbate the disease and induce respiratory damage that predisposes to the development of the disease [8,9]. Increased air pollution has been documented to contribute to the incidence and prevalence of COPD [5,10], as exposure to air pollutants can lead to cellular damage mediated by oxidative processes and systemic inflammation [11]. Exposure to pollutants over a lifetime adds up to irreversible damage to the airways, resulting in different expressible phenotypes of COPD. In addition, exposure is heterogeneous, probably because geographical variations in pollutant composition generate different exposure profiles and health risks.
Air pollution is increasingly recognized as a risk factor for exacerbation of COPD (COPD-E). COPD exacerbations are events that alter the course of the disease by accelerating the decline in lung function [12,13], which negatively affects quality of life [14], increases mortality [15,16] and increases financial burden. Although there is ample evidence of the effects of air pollution on respiratory disease, the impact of air pollution on COPD-E, particularly the evidence supporting that air pollutants increase the risk of disease exacerbation, is controversial [17].
Recent advances in the use of real-world data, a term that refers to data related to patient health or healthcare delivery obtained from routinely collected sources rather than clinical trials, may be an opportunity to comprehensively capture longitudinal care across all healthcare settings for COPD patients (i.e., inpatient, outpatient, and ED) [18]. There is previous experience using single-exposure (Inverse Distance Squared Weighted regression, IDWR) to examine the effect of prolonged exposure of air pollutants on COPD-E in China, but there is uncertainty about their availability and use in other settings [19]. The objective of this study was to determine the association between long-term exposure to particles with an aerodynamic diameter smaller than 2.5 µm (PM2.5), as well as nitrogen dioxide (NO2), and the risk of incident COPD-E in persons with COPD residing in Bogotá, Colombia.
2. Materials and Methods
2.1. Study Site and Design
A retrospective dynamic cohort study was conducted in the AIREPOC program of the Colombian Pneumological Foundation (FNC) in Bogotá, Colombia.
2.2. Patient Cohort Assembly
The cohort was assembled from AIREPOC patients who met the eligibility criteria: people aged 40 years or older, residents of Bogotá, with a clinical diagnosis of COPD receiving heath care at the institution between 2018 and 2021. From 1,884 patients registered in AIREPOC from 2004 to 2022, 722 (38.32%) met the eligibility criteria (Figure 1). We used all available data from eligible participants and performed power calculations to select the sample size (Table S1) (Appendix A).
This study was approved by the Ethics Committee of the National School of Public Health of the University of Antioquia (CEI- 21030002-00162). Patients at AIREPOC entry gave written informed consent to use their data in research studies.
2.3. Source of Patient Data
Data for individuals with COPD came from the FNC, a specialized care and research institution in pneumology and respiratory health. The study variables include sociodemographics, clinical, and risk factors and their details are provided in the supplementary material.
2.4. Sources of Air Pollutant and Meteorological Data
Hourly data on the city's daily concentrations of PM2.5 and NO2, as well as the meteorological variables temperature, relative humidity, precipitation, and solar radiation, came from Bogotá’s Air Quality Monitoring Network, which consists of 20 air quality monitoring sites. The analysis period considered was from 2018 to 2021.
2.5. Exposure Estimation
Using the residential addresses of each patient in the cohort and the data from air quality monitoring stations, spatial interpolation of pollutant concentrations was performed with the Inverse Squared-Distance Weighted Regression (IDWR) method [20], using a circular buffer zone of 5 km and 10 km. To estimate long-term exposure, we generated annual averages of PM2.5, NO2, and meteorological variables for each patient in the cohort according to their direction of residence for the four years of follow-up. We then analyzed the estimated concentrations as continuous and categorical variables. For the categories, we used cut-off points at 15 µg/m3 for PM2.5 and 25 µg/m3 for NO2, which correspond to the World Health Organization (WHO) 2021 24 h guidelines [21]. (Appendix A).
2.6. Study Outcome Variable
Time to the event was defined as the difference in days from the last exacerbation in the year immediately before entering the study (2017) to the first COPD-E occurring during follow-up. For patients who did not suffer exacerbations in the immediately preceding year of study start (2017), the measurement started in 2018. Therefore, no patient was excluded from the cohort. Consistent with the above, censored information in this study included patients who did not register COPD-E by December 31, 2021 (administrative censoring) and patients who died of respiratory causes.
2.7. Statistical Analysis
Each participant was followed from January 1, 2018, until the first COPD-E, the death date, or the end of the study, December 31, 2021. The hazard ratio (HR) and its 95% confidence interval (95%CI) were calculated for the first COPD-E associated with continuous values and categories of PM2.5 and NO2 exposure using Cox proportional hazards model. The model was adjusted for demographic, clinical, and meteorological variables. Variables were retained in the models according to Akaike Information Criterion (AIC) value, biological plausibility, and clinical reasoning.
The goodness-of-fit was assessed by martingale analysis, deviance, score, and Schoenfeld residuals. It was unnecessary to evaluate competing events or risks since all deaths were from respiratory causes. The model with the higher Nagelkerke R2 and lower AIC was selected to explain the long-term effect of air pollution on COPD-E. This is an accurate indication of parsimony.
In addition, stratified analyses by gender categorization were performed. The interaction between temperature and PM2.5 as well as between temperature and NO2 was evaluated using the Wald test. Data were processed using R statistical software, version 4.3.1 (R Core Team, 2023).
3. Results
3.1. Characteristics of the Participants in the Cohort
The cohort consisted of 722 patients. 52.90% (n=382) had at least one episode of COPD-E, and 9.56% (n=69) died. The mean age was 75.1 years, 60% were men, 425 (58.90%) had a basic education level with a history of exposure to direct tobacco smoke in 601 (83.30%), and passive or secondhand smokers in 20 (2.80%), 285 (39.50%) patients had GOLD B classification. Mean FEV1 and FVC pre - bronchodilator were 1.30 and 2.66 liters, respectively. According to the Saint George quality of life scale, participants who were more limited in activities of daily living recorded scores of 60.2 for symptoms (including cough, expectoration, dyspnea, wheezing, duration, frequency, and severity) with a score of 41.0 (Table 1) (Table S2).
3.2. Exposure to Air Pollution
The estimated average annual PM2.5 and NO2 concentrations for patients in the cohort were 16.02 ± 4.36 μg/ m3 and 30.34 ± 6.89 μg/ m3, respectively (Table 1). During the study period, the annual air pollution concentrations of PM2.5 and NO2 decreased statistically, which could be explained by the social isolation due to the COVID-19 pandemic (Figure 2).
3.3. Survival
The incidence rate of COPD was 0.73/1,000 patient days, 340 administrative censoring (non-COPD-E cases), and 69 censures for deaths. All deaths had respiratory diseases as the cause of death. Among patients who exacerbated, the median time to first COPD-E was 530 (95%CI: 489 - 570) days. The conditional probability of surviving free of first COPD-E in the first, second, third, and fourth year of follow-up was 76.3%, 57.5%, 46.8%, and 32.0%, respectively.
3.4. Air Pollutants and the Risk of COPD-E
Long-term exposure to PM2.5 was significantly associated with COPD-E (HR= 1.03 CI95% = 1.02 - 1.05). Similarly, the risk of COPD-E increased per unit in the score on the Saint George quality of life symptom item, (HR 1.012 95%CI:1.01 - 1.02). The estimated HR for solar radiation was 1.019 (95%CI: 1.01 - 1.02). The number of COPD-E events increased the risk of COPD-E by 2.18% (HR:1.02, 95%CI:1.02 - 1.024). On the contrary, for the pre-bronchodilator FEV1, the hazard ratio was 0.810 (95%CI:0.65 - 1.003), which says that regardless of time, for each unit of reduction in FEV1, COPD-E is increased (Table 2).
Long-term NO2 exposure was associated with COPD-E (HR:1.05, 95%CI:1.03-1.07), with patients having lower pre-bronchodilator FEV1 (HR: 0.83, 95%CI: 0.67-1.03), higher quality of life symptom item score (HR: 1.01, 95%CI:1.01- 1.02) precedes the number of COPD-E (HR: 1.02, 95%CI:1.02- 1.03) and solar radiation (HR: 1.02, 95%CI:1.02- 1.03). No statistically significant associations were found between the multiplicative interaction terms of PM2.5 and temperature; and NO2 and temperature. The Nagelkerke R2 coefficient for the PM2.5 and NO2 models was 27.4% and 30.1%, respectively. The model evaluation´s parameters are presented in Table S3.
In the subgroup analysis, prolonged exposure to either pollutant (PM2.5 or NO2) was associated with an increased risk of COPD-E in men with lower quality of life and higher solar radiation (Table S4). This effect was also observed in women with a history of COPD-E and greater exposure to sunlight (Table S4) (Figure S1).
4. Discussion
This study identified associations between chronic exposure to PM2.5 and NO2 and the risk of COPD-E. Exposure to PM2.5 and NO2 was associated with COPD-E to a greater extent in men with a history of COPD exacerbation, with a lower quality of life, and in people more exposed to higher solar radiation. This is known to be the first study in Colombia to examine long-term exposure to air pollution from the institutional source in patients at risk for COPD-E.
Previous epidemiological research has documented the effects of long-term air pollution on COPD respiratory symptoms, COPD incidence [22] and COPD mortality [19,23,24], but few studies have documented the effect on COPD-E. For example, in the Polish study, Dabrowiecki et al in 2023 estimated an increased risk of COPD-E after 21 days of exposure to PM2.5 (RR:1.03, 95%CI:1.01-1.05) and NO2 (RR:1.03, 95%CI:0.98-1.07) [25]. Their results showed that for every 1 µg/m3 increase in PM2.5, the risk of COPD-E increased by 3% (HR:1.03, CI95%:1.02- 1.05). In other research, PM2.5 has been linked to the development of COPD and decreased lung function [26]. In addition, it has been associated with increased COPD-E [27]. However, an increase of more than 15 µg/ m3 of PM2.5 was not statistically associated with COPD-E.
This study found that long-term exposure to PM2.5 and NO2 was associated with greater COPD-E in patients with a larger number of COPD-E cases, with results similar to those reported in the literature [16]. These findings suggest that patients with severe COPD are more susceptible to exposure to these two pollutants. In our cohort, the risk of COPD-E increased with increasing NO2 concentrations. Similarly, in previous studies, long-term NO2 exposure has been associated with the development of COPD [22,28]. In this study, it was associated with an increase in NO2 greater than 25 µg/ m3. There was association adjusting for pre-bronchodilator FEV1 in the association between COPD-E and NO2, a similar finding evidenced by a previous study [13].
The increased risk of COPD-E associated with increased PM2.5 and NO2 levels has been documented in previous studies [29,30]. COPD patients with prolonged exposure to PM2.5 and NO2 have worse lung function and more COPD-E [26]. Our results showed risks (HRs) relatively low compared to other risk factors associated with COPD. The estimates in air pollution studies on health outcomes usually do not exceed a risk value of 1,2 in the measures of association obtained as presented in studies referenced above, however, the impact of air pollution is given by the fact that even with low association measures values pollutant´s concentrations are shared by large populations which make their impact higher than other exposures with higher association measures but less frequent exposure.
This study also found new evidence of an association between COPD-E and prolonged exposure to PM2.5 and NO2, as well as greater exposure to solar radiation and poorer quality of life. These variables have not been examined and considered in previous epidemiological studies of short- and long-term effects. Only Ferrari et al. found that short-term exposure was associated with a 1% decrease in daily consultations with 1,453.763 W/m2 of solar radiation [31]. Recently, Zilli et al. provided evidence of the detrimental impact of high solar intensity on melatonin depletion, which may be responsible for adverse health effects in COPD patients by increasing inflammation and oxidative stress activity in the lung [32]. This may be explained because melatonin in the lung modulates proinflammatory cytokines such as interleukin 1β and 6, and tumor necrosis factor-alpha (TNF-α), which reduces oxidative stress [32]. This may be explained because melatonin in the lung modulates proinflammatory cytokines such as interleukin 1β and 6, and tumor necrosis factor-alpha (TNF-α), which reduces oxidative stress [32]. In high-risk COPD patients, it affects disease prognosis and comorbidities [32].
Dąbrowiecki et al. found, that men with COPD were more susceptible to the chronic effects of air pollution, which could be explained by the fact that men smoke more, which leads to less lung functionality, adding to the cumulative effect of air pollution and exacerbating the disease; in addition, men have larger airways and smaller alveoli compared to women [25]. This anatomical difference makes men more susceptible to deposition and the effects of air pollution. However, women are also at risk for COPD exacerbations, as has been documented in research before this study [14]. This gender difference in the risk of COPD-E may be due to biological, hormonal, behavioral, and exposure factors related to the cultural environment [26]
Regarding the history of exacerbations in the previous year, several studies have found that the risk of COPD-E with prolonged exposure increased by 2% for both pollutants. Findings from clinical studies found that previous exacerbations of COPD increased the risk of COPD-E [14]. However, these investigations have not taken air pollution into account. Additionally, this study concurs with Cowan et al. [33], that people residing in areas with high concentrations of air pollutants may be less aware of days of increased long-term exposure, leading to experiencing more chronic inflammation and, therefore, being more likely to be hospitalized when there are short-term increases in air pollution exposure.
Long-term exposure increases oxidative stress due to lung inflammation, induces gene regulation involved in inflammation, such as tumor necrosis factor α and transforming growth factor β, and increases the risk of chronic mortality from lower respiratory tract diseases [16]. In addition to the physical and chemical compositions of pollutants that could, in part, underlie the mechanisms leading to COPD-E, some airborne microorganisms could also play a role in the occurrence of COPD exacerbation [34]. Another effect of short- and long-term exposure to PM2.5 and NO2 is the methylation of global deoxyribonucleic acid (DNA) and specific genes [35] and apoptosis of airway epithelial cells [36]. NO2 exposure can affect lung function through DNA methylation effects [35].
We acknowledge some weaknesses of our study. First, the effects of exposure to other air pollutants on COPD-E, such as ozone, sulfur dioxide, and carbon dioxide, were not assessed, and therefore potential residual confounding by the effect of other pollutants might be still present. Second, there may be measurement errors in the representation of individual exposure as a function of residence as pollutant concentrations may not reflect actual long-term exposure and this could underestimate the association found between exposure and COPD-E [37]. Finally, neither indoor air quality nor hours spent at home were controlled for in this study, however, the AIREPOC cohort population is on average older than 75 years, which would imply that they spend most of their time at home without an expected high variability in this exposure among participants. In addition, indoor air pollution exposure is mainly related to outdoor sources in urban settings as Bogotá where biomass burning is not frequent.
The study's focus on FNC patients which are on average 75 years old with moderate to severe disease and therefore our results might not be generalizable to other populations. The characteristic of this cohort should be considered when compared to other COPD younger populations with milder disease severity. Real-world data, however, allow for external validity and generalizability due to the volume of data with longer follow-up and reduced clinical uncertainty [18]. Missing data were less than 15%. In addition to having a spatial and temporal resolution, the ensemble model used to estimate NO2 and PM2.5 concentrations has complete coverage for the study area and period. By having 20 air quality monitoring stations, we consider the spatial interpolation errors to be low.
Bogota is a megacity with higher average levels of pollutants (13,4 ug/m3) than other cities in the region such as Brasilia (6,8 ug/m3), Quito (7,4 ug/m3), Buenos Aires (9,6 ug/m3), Panama (9,6 ug/m3) and Montevideo (11,7 ug/m3) [38], making it useful for analyzing the effect of PM2.5 and NO2 on COPD-E. Furthermore, this research has the advantage of using real-life data, which allows external validity and generalization of the results, in addition, it comprehensively captures longitudinal care in all care settings with continuous follow-up of patients, the occurrence of COPD-E was diagnosed by pneumologists, as well as the diagnosis of COPD and the classification of the severity of the disease. In addition, this study had the advantage of having the characteristics of the patients not included in the study were not different from those who made up the cohort.
Evidence linking COPD exacerbation to air pollution calls for measures to counteract this effect. A controlled trial showed how reviewing air quality forecasts, refraining from going outdoors on days with poor air quality, practicing regular ventilation of the home by opening windows, using air purifiers, and complying with treatment with inhalers reduced exposure to PM2.5 in COPD patients and improved quality of life [39]. The reduction of air pollutant concentrations has been associated with a reduction in COPD care and improved lung function [36]. It is crucial to achieve very low concentrations of air pollutants. However, even low concentrations affect COPD, as evidenced by the ELAPSE study [23,40]. Also, the adverse effects of air pollution affect older people more. Despite the WHO air quality guidelines for 2021 and national regulations [21], air pollution continues to contribute to the burden of disease due to this risk factor [9].
5. Conclusions
Increased exacerbation of COPD was associated with long-term exposure to higher levels of PM2.5 and NO2. This work provides new evidence that the effect of prolonged exposure to PM2.5 and NO2, together with the effect of high sun intensity and poorer quality of life, increases the risk of COPD exacerbation.
The results of this study highlight the importance of continuing regulatory efforts to reduce air pollution emissions and environmental education for the susceptible population to protect them from the negative impacts of air pollution, as well as for healthcare personnel to be aware of evidence-based recommendations on air pollution.
Supplementary Materials
The following supporting information can be downloaded at the website of this paper posted on Preprints.org. Table S1: Power for each of the endpoints of the Cox models; Table S2: Other baseline characteristics of the participants of the COPD-EC Cohort, in Bogotá D.C.; Table S3: Cox model evaluation of the long-term effect of PM2.5, NO2, and COPD-E-related clinical conditions in Bogotá D.C., between 2018 and 2021; Table S4: Subgroup analysis of the long-term effect of PM2.5, NO2, and COPD-E-related clinical conditions in Bogotá D.C., between 2018 to 2021; Figure S1. Diagrams of distributions of Martingale, Deviance, Schoenfeld partial residuals versus survival time ranges in Cox models of PM2.5 and NO2.
Author Contributions
A.H: contributed to conceptualization; methodology; data curation, statistics analysis; editor; visualization; research and formal analysis. and LR contributed to the conception of the study, supervision; redaction: revision and edition; formal analysis. and J.T and H.R: contributed to supervision; redaction: revision and edition; formal analysis and N.R, A.C, C.T, M.P, V.H had contributed to supervision; redaction: revision and edition. All authors contributed to the writing of the final manuscript and all authors have approved the submitted version of the manuscript.
Funding
This research received no external funding.
Institutional Review Board Statement
This study was approved by the Ethics Committee of the National School of Public Health from the University of Antioquia (approval number 21030002-00155-2022, September 09, 2022) and the Research Committee, and the Ethics Committee of the Colombian Pneumology Foundation (approval number 274 of September 9, 2022). The study did not receive direct funding.
Informed Consent Statement
Patients from AIREPOC provided a written informed consent to use their data in research studies during their first clinical visit.
Data Availability Statement
The data presented in this study are available on request from the corresponding author. The data are not publicly available due to privacy because they are sensitive data of patients.
Acknowledgments
We would like to thank to all patients involved in this study and the staff of the Colombian Pneumological Foundation. Authors also want to thank to Horacio Riojas-Rodríguez and José Luis Texcalac Sangrador for his support in the process of exposure estimation We want to thank the Subdirectorate of Air, Auditory and Visual Quality of the District Secretary of Environment of Bogotá D.C, for providing the data on criteria of air pollutants and meteorological variables.
Conflicts of Interest
The authors declare that they have no competing financial interests or known personal relationships that could have influenced the investigation reported in this paper. The authors are solely responsible for the content and writing in this article.
Appendix A
The appendix, explanations of details on the following points Patient cohort assembly, source of patient data, sources of air pollutant and meteorological data and exposure estimation.
References
- World Health Organization WHO. Chronic Obstructive Pulmonary Disease (COPD).
- Institute for Health Metrics and Evaluation. Global Burden of Disease (GBD). GBD Compare 2019. https://vizhub.healthdata.org/gbd-compare/ (2022, accessed 20 June 2022).
- World Health Organization WHO. WHO The top 10 causes of death.
- Sleeman, K.E.; de Brito, M.; Etkind, S.; et al. The escalating global burden of serious health-related suffering: projections to 2060 by world regions, age groups, and health conditions. Lancet Glob Heal 2019, 7, e883–e892. [Google Scholar] [CrossRef]
- Cohen, A.J.; Brauer, M.; Burnett, R.; et al. Estimates and 25-year trends of the global burden of disease attributable to ambient air pollution: an analysis of data from the Global Burden of Diseases Study 2015. Lancet (London, England) 2017, 389, 1907–1918. [Google Scholar] [CrossRef]
- Soriano, J.B.; Kendrick, P.J.; Paulson, K.R.; et al. Prevalence and attributable health burden of chronic respiratory diseases, 1990–2017: a systematic analysis for the Global Burden of Disease Study 2017. Lancet Respir Med 2020, 8, 585–596. [Google Scholar] [CrossRef]
- Soriano, J.B.; Kendrick, P.J.; Paulson, K.R.; Gupta, V.; Abrams, E.M.; Adedoyin, R.A.; et al. Supplementary appendix 2 of prevalence and attributable health burden of chronic respiratory diseases, 1990–2017: a systematic analysis for the Global Burden of Disease Study 2017. Lancet 8.
- Roque, A.; Taborda-Barata, L.; Cruz, Á.A.; et al. COPD treatment – a conceptual review based on critical endpoints. Pulmonology Epub ahead of print. 2023. [CrossRef]
- Stolz, D.; Mkorombindo, T.; Schumann, D.M.; et al. The Lancet Commissions Towards the elimination of chronic obstructive pulmonary disease : a Lancet Commission. Lancet 2022, 400, 921–972. [Google Scholar] [CrossRef]
- Hendryx, M.; Luo, J.; Chojenta, C.; et al. Air pollution exposures from multiple point sources and risk of incident chronic obstructive pulmonary disease (COPD) and asthma. Environ Res 2019, 179, 108783. [Google Scholar] [CrossRef]
- Lee, Y.-G.; Lee, P.-H.; Choi, S.-M.; et al. Effects of Air Pollutants on Airway Diseases. Int J Environ Res Public Health 18. Epub ahead of print September 2021. [CrossRef]
- Cavailles, A.; Melloni, B.; Motola, S.; et al. Identification of Patient Profiles with High Risk of Hospital Re-Admissions for Acute COPD Exacerbations (AECOPD) in France Using a Machine Learning Model. Int J Chron Obstruct Pulmon Dis 2020, 15, 949–962. [Google Scholar] [CrossRef]
- Kwon, S.O.; Hong, S.H.; Han, Y.-J.; et al. Long-term exposure to PM(10) and NO(2) in relation to lung function and imaging phenotypes in a COPD cohort. Respir Res 2020, 21, 247. [Google Scholar] [CrossRef]
- Hurst, J.R.; Skolnik, N.; Hansen, G.J.; et al. Understanding the impact of chronic obstructive pulmonary disease exacerbations on patient health and quality of life. Eur J Intern Med 2020, 73, 1–6. [Google Scholar] [CrossRef]
- Stanford, R.H.; Engel-Nitz, N.M.; Bancroft, T.; et al. The Identification and Cost of Acute Chronic Obstructive Pulmonary Disease Exacerbations in a United States Population Healthcare Claims Database. COPD 2020, 17, 499–508. [Google Scholar] [CrossRef]
- Kang, S.; Hong, Y.S.; Park, J.; et al. Air pollution and mortality in patients with chronic obstructive pulmonary disease: a cohort study in South Korea. Ther Adv Chronic Dis 2023, 14, 20406223231176176. [Google Scholar] [CrossRef]
- Thurston, G.D.; Balmes, J.R.; Garcia, E.; et al. Outdoor Air Pollution and New-Onset Airway Disease. An Official American Thoracic Society Workshop Report. Ann Am Thorac Soc 2020, 17, 387–398. [Google Scholar] [CrossRef]
- Concato, J.; Stein, P.; Corrigan-curay, J.; et al. Randomized, observational, interventional, and real-world—What’s in a name? 2020, 1514–1517. [Google Scholar]
- Simoni, M.; Baldacci, S.; Maio, S.; et al. Adverse effects of outdoor pollution in the elderly. J Thorac Dis 2015, 7, 34–45. [Google Scholar]
- Emmendorfer, L.R.; Dimuro, G.P. A Novel Formulation for Inverse Distance Weighting from Weighted Linear Regression BT - . In Computational Science – ICCS 2020; Krzhizhanovskaya, V.V., Závodszky, G., Lees, M.H., et al., Eds.; Springer International Publishing: Cham, 2020; pp. 576–589. [Google Scholar]
- World Health Organization WHO. WHO global air quality guidelines Particulate matter (PM2.5 and PM10), ozone, nitrogen dioxide, sulfur dioxide and carbon monoxide; 2021; Epub ahead of print 2021; ISBN 978-92-4-003422-8. [Google Scholar]
- Andersen, Z.J.; Hvidberg, M.; Jensen, S.S.; et al. Chronic obstructive pulmonary disease and long-term exposure to traffic-related air pollution: a cohort study. Am J Respir Crit Care Med 2011, 183, 455–461. [Google Scholar] [CrossRef]
- De Matteis, S.; Forastiere, F.; Baldacci, S.; et al. Issue 1 - ‘Update on adverse respiratory effects of outdoor air pollution’. Part 1): Outdoor air pollution and respiratory diseases: A general update and an Italian perspective. Pulmonology 2022, 28, 284–296. [Google Scholar] [CrossRef]
- Badida, P.; Krishnamurthy, A.; Jayaprakash, J. Meta analysis of health effects of ambient air pollution exposure in low- and middle-income countries. Environ Res 2023, 216, 114604. [Google Scholar] [CrossRef]
- Dąbrowiecki, P.; Chciałowski, A.; Dąbrowiecka, A.; et al. Air pollution and long-term risk of hospital admission due to chronic obstructive pulmonary disease exacerbations in Poland: a time-stratified, case-crossover study. Polish Arch Intern Med. Epub ahead of print February 2023. [CrossRef]
- Guo, C.; Zhang, Z.; Lau, A.K.H.; Lin, C.Q.; Chuang, Y.C.C.J.; et al. Effect of long-term exposure to fine particulate matter on lung function decline and risk of chronic obstructive pulmonary disease in Taiwan: a longitudinal, cohort study. Lancet Planet Heal. [CrossRef]
- Huh, J.-Y.; Hong, J.; Han, D.-W.; et al. The Impact of Air Pollutants and Meteorological Factors on Chronic Obstructive Pulmonary Disease Exacerbations: A Nationwide Study. Ann Am Thorac Soc 2022, 19, 214–226. [Google Scholar] [CrossRef]
- Li, Q.; Yi, Q.; Tang, L.; et al. Influence of Ultrafine Particle Exposure on Asthma Exacerbation in Children: a Meta-Analysis. Curr Drug Targets 2019, 20, 412–420. [Google Scholar] [CrossRef]
- Tran, H.M.; Chen, T.T.L.Y.; et al. Climate-mediated air pollution associated with COPD severity. 2022; 843–156969.
- Doiron, D.; Bourbeau, J.; de Hoogh, K.; et al. Ambient air pollution exposure and chronic bronchitis in the Lifelines cohort. Thorax 2021, 76, 772–779. [Google Scholar] [CrossRef]
- Ferrari, U.; Exner, T.; Wanka, E.R.; et al. Influence of air pressure, humidity, solar radiation, temperature, and wind speed on ambulatory visits due to chronic obstructive pulmonary disease in Bavaria, Germany. Int J Biometeorol 2012, 56, 137–143. [Google Scholar] [CrossRef]
- Zilli Vieira, C.L.; Koutrakis, P.; Liu, M.; et al. Intense solar activity reduces urinary 6-sulfatoxymelatonin in patients with COPD. Respir Res 2023, 24, 91. [Google Scholar] [CrossRef]
- Cowan, K.N.; Wyatt, L.H.; Luben, T.J.; et al. Effect measure modification of the association between short-term exposures to PM(2.5) and hospitalizations by longs-term PM(2.5) exposure among a cohort of people with Chronic Obstructive Pulmonary Disease (COPD) in North Carolina, 2002-2015. Environ Health 2023, 22, 49. [Google Scholar] [CrossRef]
- Liang, L.; Cai, Y.; Barratt, B.; et al. Associations between daily air quality and hospitalisations for acute exacerbation of chronic obstructive pulmonary disease in Beijing, 2013-17: an ecological analysis. Lancet Planet Heal 2019, 3, e270–e279. [Google Scholar] [CrossRef]
- de F C Lichtenfels, A.J.; van der Plaat, D.A.; de Jong, K.; et al. Long-term Air Pollution Exposure, Genome-wide DNA Methylation and Lung Function in the LifeLines Cohort Study. Environ Health Perspect 2018, 126, 27004. [Google Scholar] [CrossRef]
- Yan, P.; Liu, P.; Lin, R.; et al. Effect of ambient air quality on exacerbation of COPD in patients and its potential mechanism. Int J Chron Obstruct Pulmon Dis 2019, 14, 1517–1526. [Google Scholar] [CrossRef]
- Liu, X.; Dong, M.; Wang, J .; et al. A weekly time-weighted method of outdoor and indoor individual exposure to particulate air pollution. Methodsx 2019, 6, 2439–2443. [Google Scholar] [CrossRef]
- IQAir. World Air Quality Report Region and city PM2.5 Ranking 2023. www.iqair.com (2024).
- Kang, J.; Kim, H.-C.; Jang, Y.; et al. Randomised controlled trial of a behavioural intervention to reduce exposure to PM2.5 in patients with COPD. Environ Int 2023, 181, 108286. [Google Scholar] [CrossRef]
- Liu, S.; Jørgensen, J.T.; Ljungman, P.; et al. Long-term exposure to low-level air pollution and incidence ofchronic obstructive pulmonary disease: The ELAPSE project. Env Int 146.
Figure 1.
Patient selection flowchart from the AIREPOC patient cohort, Colombian Pneumological Foundation, 2018 - 2021, Bogotá D.C.
Figure 1.
Patient selection flowchart from the AIREPOC patient cohort, Colombian Pneumological Foundation, 2018 - 2021, Bogotá D.C.
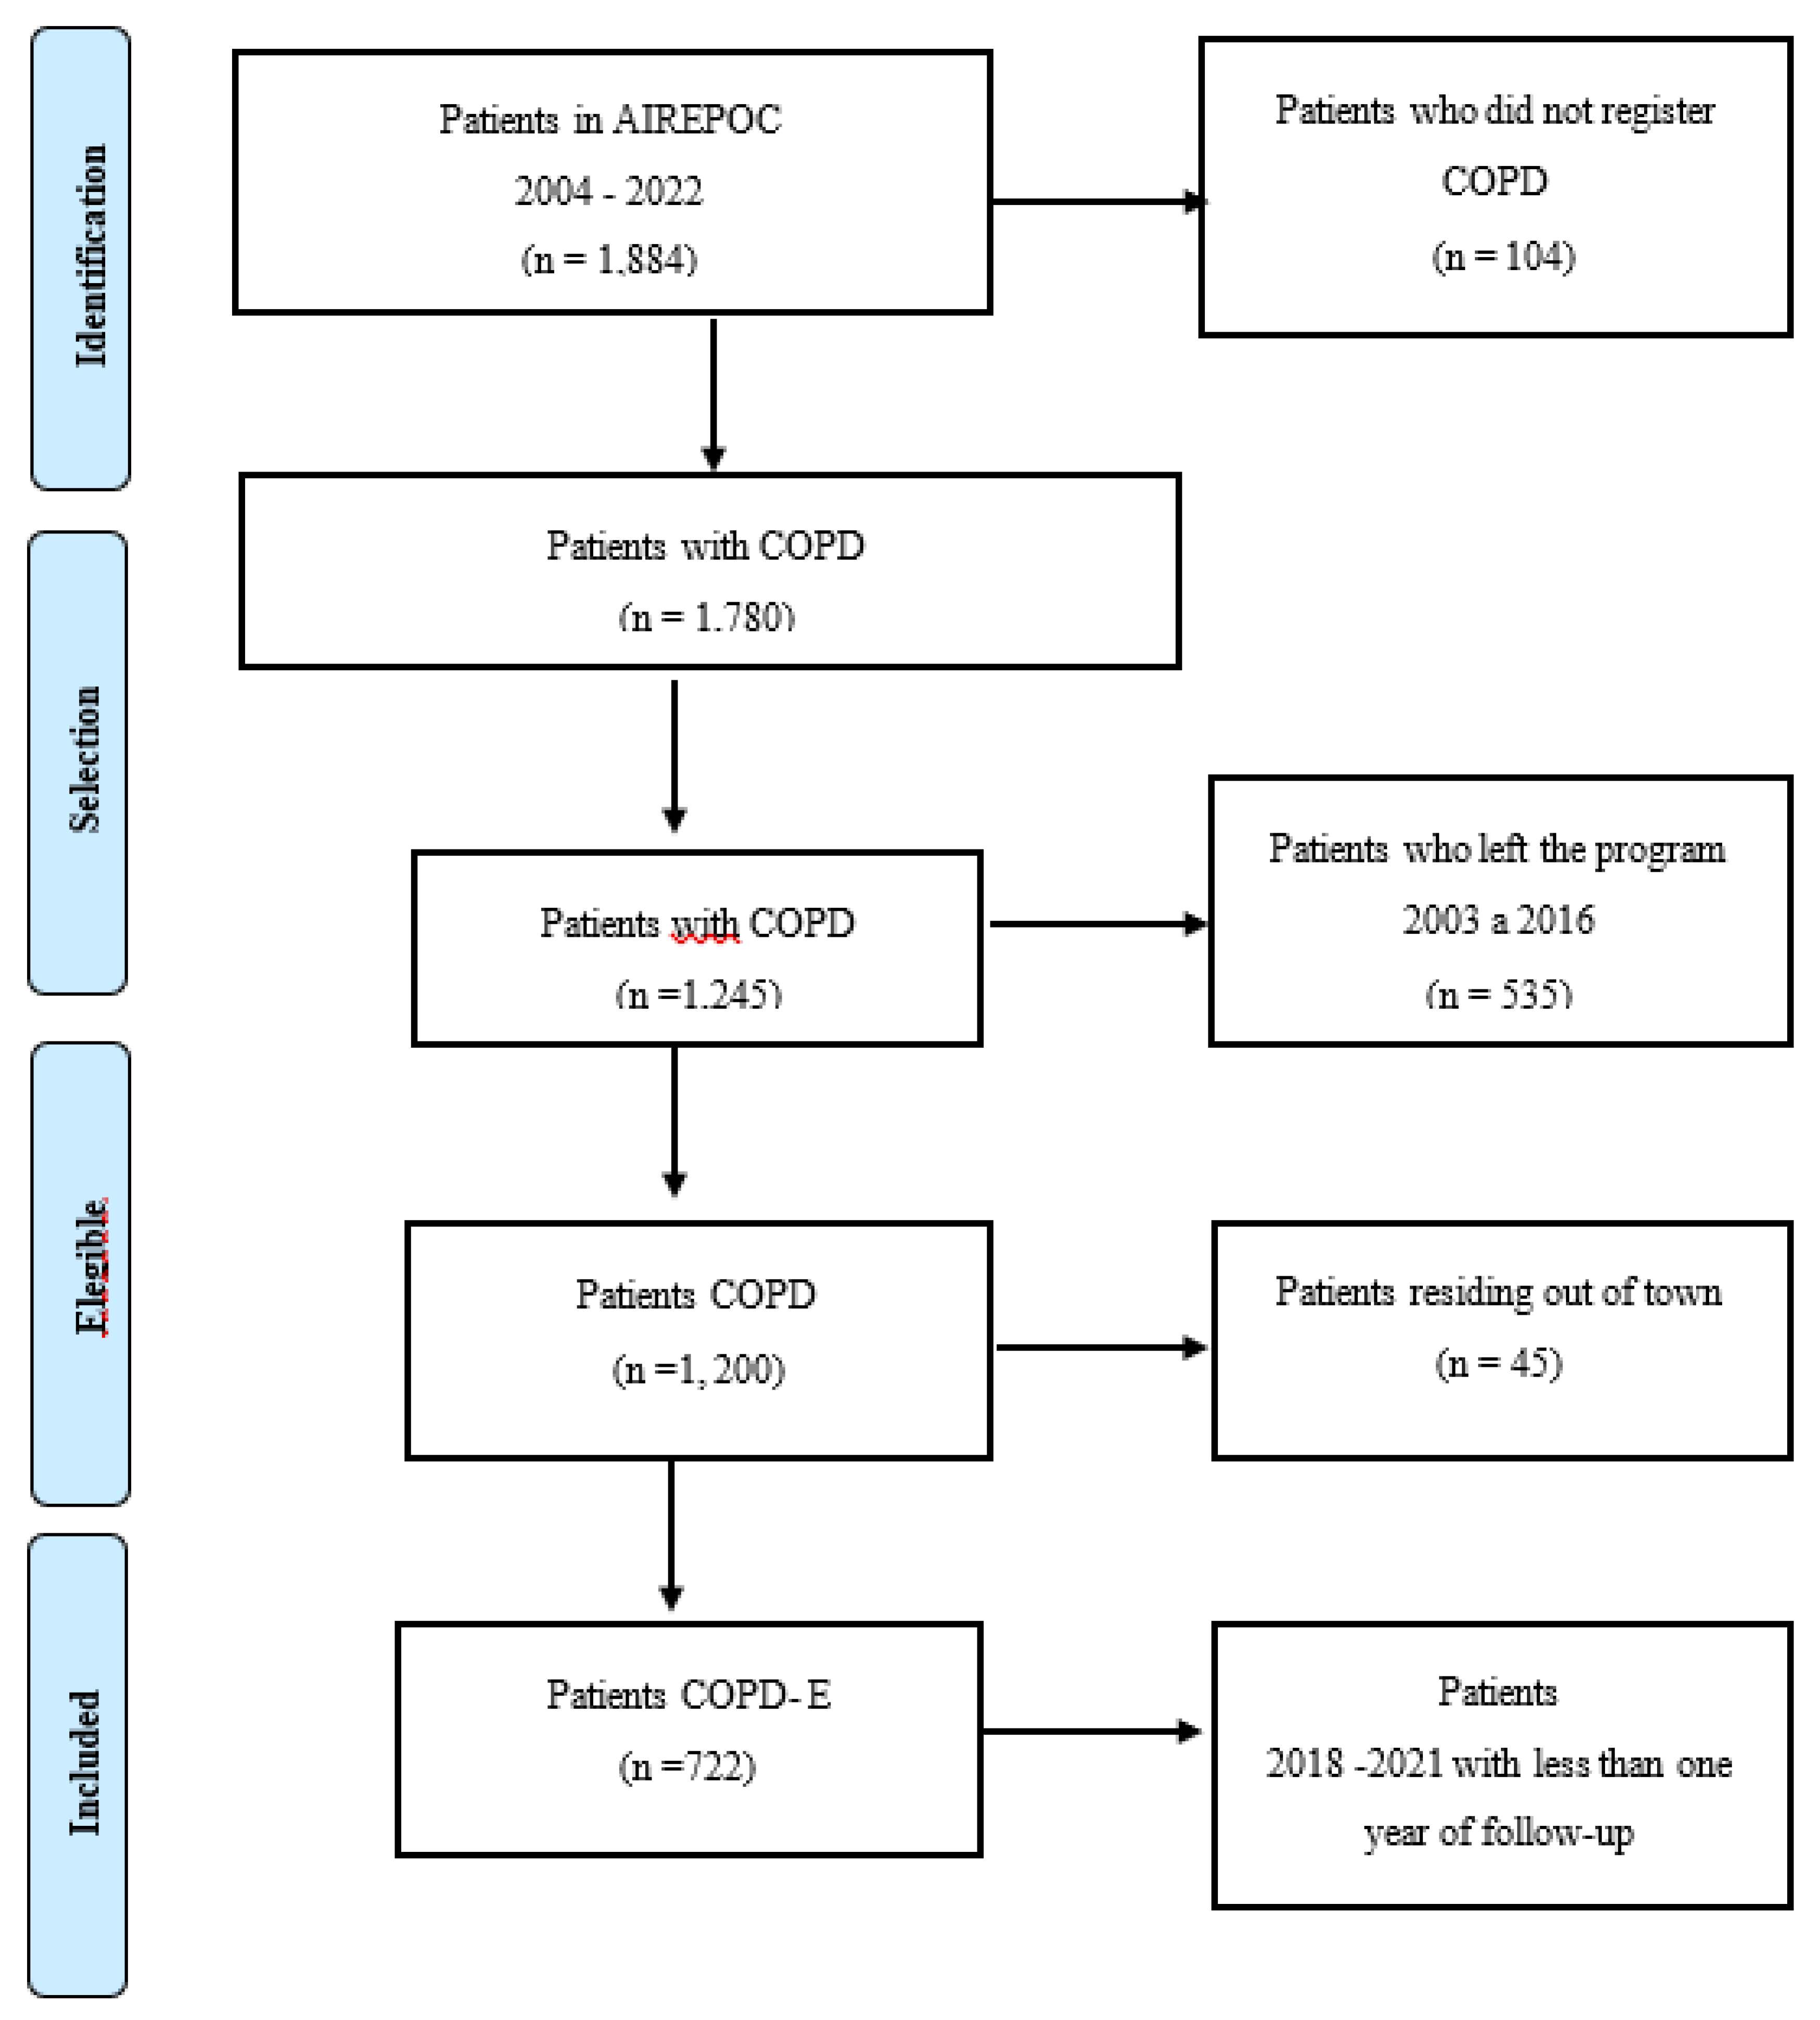
Figure 2.
Distribution of average concentrations of (a) PM2.5, (b) NO2 (c) Temperature, and (d) Solar Radiation for each year of the study. Box plots are based on IDWR air pollutant concentration estimates for 2018-2021. The boxes indicate the interquartile range (IQR), and the black line in the middle indicates the median concentration. Whiskers extend up to 1.5 times the IQR to the furthest observation within that distance (i.e., the biggest or smallest observations within the 3+1.5 × IQR quartile or the 1-1.5 × IQR quartile).
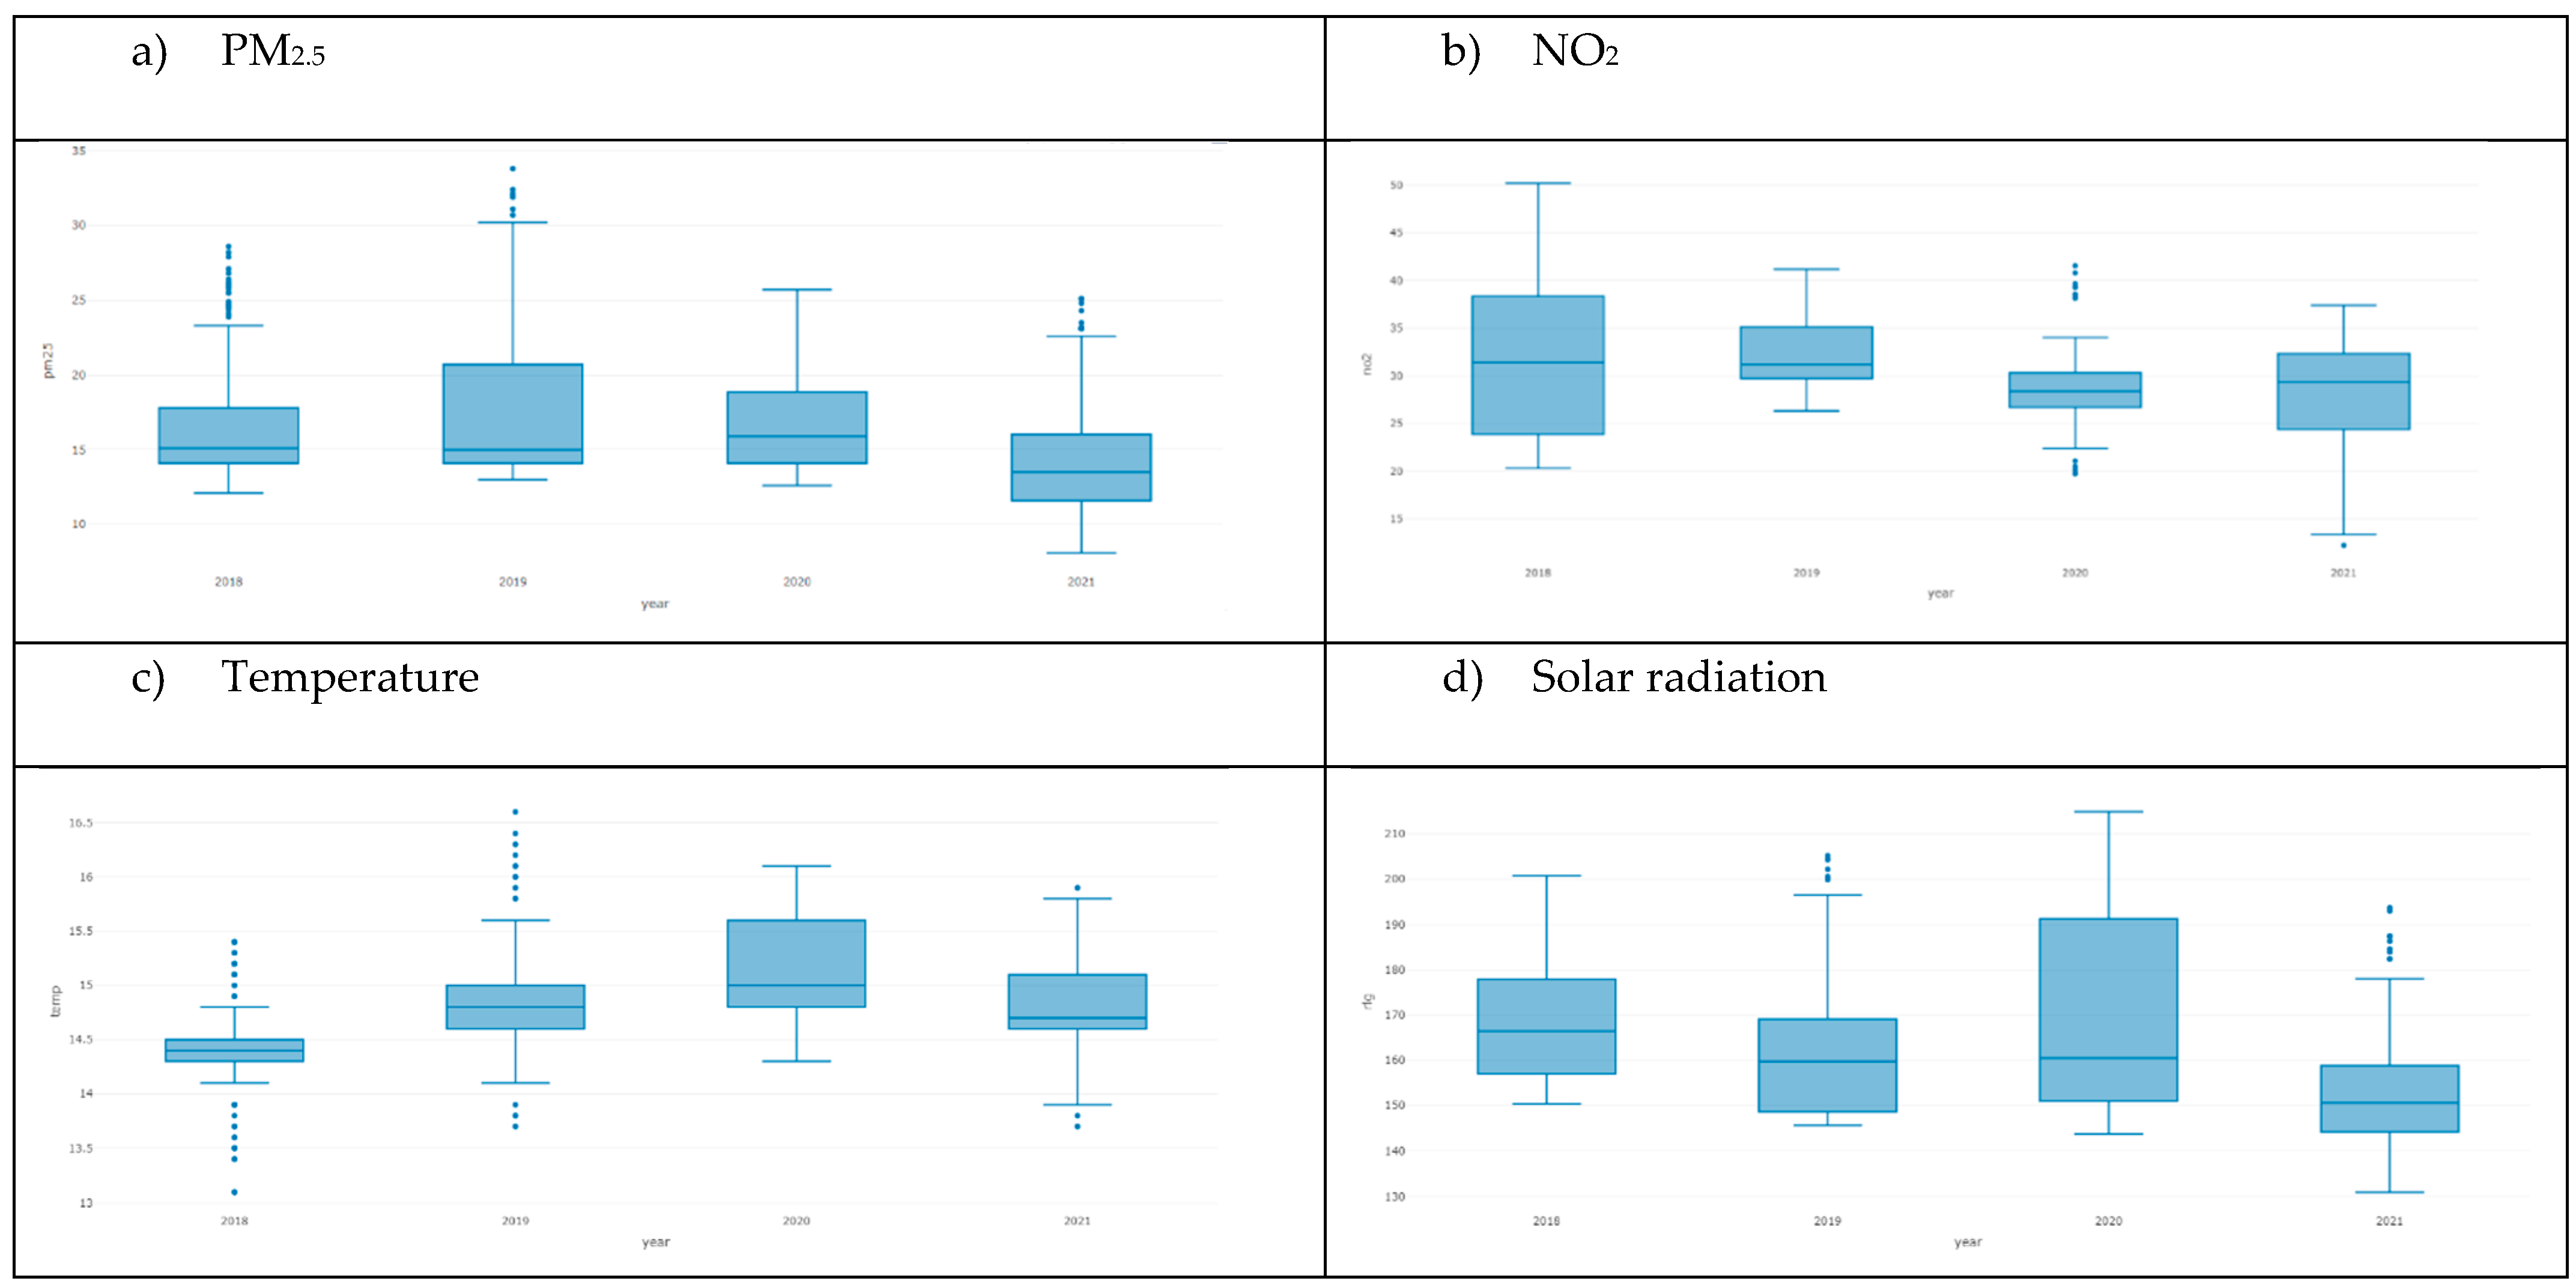

Table 1.
Characteristics of the participants of the AIREPOC Cohort, in Bogotá D.C.
| Characteristics | ALL | No COPD-E | COPD -E | p | N |
|
N=722 (CI95%: LI – LS) |
N=340 (CI95%: LI – LS) |
N=382 (CI95%: LI – LS) |
|||
| Exacerbation of COPD (%) 1 | 53 [50;57] | 0 [0;0] | 100 [96;99.9] | 0.000 | 722 |
| Sex | |||||
| Men | 60 [57;64] | 64 [59;69] | 57 [52;62] | 0.038 | 722 |
| Woman | 39.9 [36.3;43.6] | 35.9 [30.8;41.2] | 43.5 [38.4;48.6] | 0.046 | 722 |
| Current age () | 75.1 [74.4;75.8] | 74.4 [73.4;75.5] | 75.6 [74.7;76.6] | 0.086 | 722 |
| History of COPD-E (%) | |||||
| COPD-E mild | 12 [9; 16] | 8 [4;12] | 16 [10;22] | 0.031 | 722 |
| COPD-E moderate | 39 [32; 45] | 19 [13;25] | 56 [45;66] | <0.001 | 722 |
| COPD-E severe | 40 [0.34;0.45] | 24 [17;30] | 54 [46;62] | <0.001 | 722 |
| COPD classification according to GOLD 2019: (%) | <0.001 | 722 | |||
| Grade A | 28.0 [24.7;31.4] | 30.0 [25.2;35.2] | 26.2 [21.8;30.9] | ||
| Grade B | 39.5 [35.9;43.1] | 51.2 [45.7;56.6] | 29.1 [24.6;33.9] | ||
| Grade C | 10.9 [8.76;13.4] | 5.29 [3.17;8.24] | 16.0 [12.4;20.0] | ||
| Grade D | 21.6 [18.7;24.8] | 13.5 [10.1;17.6] | 28.8 [24.3;33.6] | ||
| Pulmonary function () | |||||
| FVC_PRE 2 | 2.66 [2.46;2.86] | 2.81 [2.39;3.22] | 2.52 [2.43;2.61] | 0.189 | 702 |
| FEV1_PRE 3 | 1.30 [1.26;1.34] | 1.33 [1.27;1.39] | 1.27 [1.21;1.32] | 0.136 | 702 |
| FEV1/FVCPRE 4 | 0.82 [0.46;1.19] | 0.77 [0.27;1.27] | 0.88 [0.36;1.40] | 0.762 | 697 |
| FVC_POS 5 | 3.14 [2.43;3.85] | 3.77 [2.54;5.01] | 2.58 [1.82;3.34] | 0.106 | 702 |
| FEV1POSPRED 6 | 1.81 [1.73;1.88] | 2.00 [1.89;2.11] | 1.64 [1.54;1.74] | <0.001 | 693 |
| VE1/FVCPRED 7 | 44.1 [33.5;54.7] | 51.1 [39.7;62.5] | 37.7 [20.3;55.1] | 0.206 | 699 |
| LIN 8 | 68.8 [68.5;69.1] | 68.9 [68.5;69.4] | 68.7 [68.4;69.0] | 0.443 | 722 |
| FEV1/CV_FCRAPO | 69.5 [69.3;69.7] | 69.6 [69.3;69.9] | 69.5 [69.2;69.7] | 0.443 | 722 |
| FVC_POS0_2 9 | 0.90 [0.84;0.96] | 0.93 [0.80;1.06] | 0.87 [0.85;0.89] | 0.397 | 722 |
| FEV1_POS0 10 | 1.37 [1.34;1.41] | 1.39 [1.34;1.45] | 1.36 [1.30;1.41] | 0.394 | 722 |
| FEV1_POS0_2 11 | 0.58 [0.57;0.60] | 0.58 [0.56;0.60] | 0.58 [0.57;0.60] | 0.863 | 722 |
| FEV1/FVC0 12 | 0.52 [0.51;0.52] | 0.52 [0.50;0.53] | 0.52 [0.50;0.53] | 0.790 | 722 |
| Quality of Life -questionnaire Saint George 13 |
|||||
| Symptoms | 41.0 [39.5;42.5] | 36.0 [33.9;38.1] | 45.8 [43.7;47.9] | <0.001 | |
| Activity | 60.2 [58.3;62.1] | 58.5 [55.9;61.2] | 61.7 [59.0;64.4] | 0.103 | |
| Impact | 32.9 [31.3;34.5] | 31.4 [29.1;33.8] | 34.3 [32.0;36.5] | 0.087 | |
| Total | 42.4 [40.9;43.8] | 40.1 [38.1;42.2] | 44.4 [42.4;46.5] | 0.003 | |
| Used LTOT at admission (%) | 0.349 | ||||
| No | 32.8 [29.4;36.4] | 34.7 [29.7;40.0] | 31.2[26.5;36.1] | ||
| Yes | 67.2 [63.6;70.6] | 65.3 [60.0;70.3] | 68.8 [63.9;73.5] | ||
| Current prescribed hours | 15.3 [14.6;16.0] | 15.4 [14.4;16.4] | 15.3 [14.4;16.2] | 0.893 | 563 |
| Risk factor: (%) | 0.244 | 722 | |||
| Wood smoke | 12.9 [10.5;15.5] | 13.5 [10.1;17.6] | 12.3 [9.18;16.0] | ||
| No risk factor | 1.11 [0.48;2.17] | 0.29 [0.01;1.63] | 1.83 [0.74;3.74] | ||
| Tobacco | 56.5 [52.8;60.2] | 59.4 [54.0;64.7] | 53.9 [48.8;59.0] | ||
| Firewood tobacco | 25.2 [22.1;28.5] | 22.9 [18.6;27.8] | 27.2 [22.8;32.0] | ||
| Passive tobacco | 2.77 [1.70;4.25] | 2.35 [1.02;4.58] | 3.14 [1.63;5.42] | ||
| Tobacco and other fumes | 1.52 [0.76;2.71] | 1.47 [0.48;3.40] | 1.57 [0.58;3.39] | ||
| Current smoking (%) | 0.692 | 709 | |||
| No | 90.8 [88.5;92.9] | 91.0 [87.4;93.9] | 90.7 [87.3;93.4] | ||
| Yes | 9.03 [7.02;11.4] | 8.68 [5.89;12.2] | 9.33 [6.59;12.7] | ||
| NA | 0.14 [0.00;0.78] | 0.30 [0.01;1.66] | 0.00 [0.00;0.98] | ||
| Index Package year (IPA) () | 35.0 [32.8;37.2] | 35.1 [31.9;38.2] | 34.9 [31.8;38.0] | 0.944 | 622 |
| Index Package year (IPA) categorized (%) | 0.979 | 722 | |||
| Mild < 5 | 13.9 [11.4;16.6] | 13.8 [10.3;18.0] | 13.9 [10.6;17.8] | ||
| Moderato 5-15 | 41.1 [37.5;44.8] | 40.6 [35.3;46.0] | 41.6 [36.6;46.7] | ||
| Severe 16-25 | 23.4 [20.4;26.7] | 24.1 [19.7;29.0] | 22.8 [18.7;27.3] | ||
| Very Severe >25 | 21.6 [18.7;24.8] | 21.5 [17.2;26.2] | 21.7 [17.7;26.2] | ||
| Hospitalization (%) | <0.001 | 637 | |||
| Never | 0.16 [0.00;0.87] | 0.00 [0.00;1.41] | 0.27 [0.01;1.47] | ||
| Before de 2018 | 61.4 [57.5;65.2] | 91.2 [87.0;94.3] | 40.8 [35.8;46.0] | ||
| Follow - up (2018-2021) | 38.5 [34.7;42.4] | 8.85 [5.69;13.0] | 58.9 [53.7;63.9] | ||
| Number of patients with COPD-E (%) before follow - up | 31 [27;34] | 14 [10;17] | 46 [41;51] | <0.001 | 722 |
| Hospitalization for respiratory cause | 0.31 [0.28;0.34] | 0.14 [0.10;0.18] | 0.46 [0.41;0.51] | <0.001 | 722 |
| Type of hospitalization (%) | <0.001 | 722 | |||
| No respiratory | 0,14 [0,00;0,77] | 0,29 [0,01;1,63] | 0,00 [0,00;0,96] | ||
| Respiratory | 30,7 [27,4;34,3] | 13,5 [10,1;17,6] | 46,1 [41,0;51,2] | ||
| No hospitalization | 69,1 [65,6;72,5] | 86,2 [82,0;89,7] | 53,9 [48,8;59,0] | ||
| ICU yes | 0,06 [0,03;0,08] | 0,04 [0,01;0,08] | 0,06 [0,03;0,09] | 0,435 | 374 |
| Mean Follow - up time in days | 719 [684;755] | 932 [881;984] | 530 [489;570] | <0,001 | 722 |
| Type de COPD-E (%) | <0,001 | 722 | |||
| No exacerbation | 47.1 [43.4;50.8] | 100 [98.9;100] | 0.00 [0.00;0.96] | ||
| Severe | 4.43 [3.05;6.20] | 0.00 [0.00;1.08] | 8.38 [5.80;11.6] | ||
| Mild | 11.2 [9.01;13.8] | 0.00 [0.00;1.08] | 21.2 [17.2;25.6] | ||
| Moderate | 37.3 [33.7;40.9] | 0.00 [0.00;1.08] | 70.4 [65.6;75.0] | ||
| PM2.5 (ug/m3) () 14 | 16.0 [15.7;16.3] | 15.4 [15.0;15.8] | 16.6 [16.1;17.0] | <0.001 | 722 |
| NO2 (ug/m3) () 15 | 30.3 [29.8;30.8] | 29.6 [28.9;30.3] | 31.0 [30.3;31.7] | 0.005 | 722 |
| Temperature (°C) () | 14.7 [14.7;14.8] | 14.7 [14.7;14.8] | 14.7 [14.7;14.8] | 0.827 | 722 |
| Precipitation (mm) () | 0.11 [0.11;0.12] | 0.13 [0.12;0.13] | 0.10 [0.10;0.11] | <0.001 | 722 |
| Solar Radiation (Wm2) () | 161 [160;162] | 158 [156;159] | 164 [163;166] | <0.001 | 722 |
| Relative Humidity () | 65.4 [65.3;65.6] | 66.0 [65.8;66.3] | 64.9 [64.7;65.1] | <0.001 | 722 |
| COVID19 (%) | 0.870 | 722 | |||
| No | 78.1 [74.9;81.1] | 78.5 [73.8;82.8] | 77.7 [73.2;81.8] | ||
| Yes | 21.9 [18.9;25.1] | 21.5 [17.2;26.2] | 22.3 [18.2;26.8] |
(%): Percentage, (()): Average; FVC: Forced Vital Capacity pre-bronchodilator; FEV1_PRE: Forced Expiratory Volume in the first second pre bronchodilator; FEV1/FVCREV: FEV1/FVC ratio; FVC_POS: Forced Vital Capacity post bronchodilator ; FEV1POSPRED: Forced Expiratory Volume in the first second post bronchodilator; VE1/FVCPRED: Ratio FEV1/FVC pre bronchodilator; LLN: Lower Limit of Normality; FVC_POS0_2: Forced Vital Capacity after bronchodilator; FEV1_POS0: Forced Expiratory Volume in the first second post bronchodilator; FEV1_POS0_2: Forced Expiratory Volume in the first second prost bronchodilator; FEV1/FVC0: Ratio FEV1/FVC post bronchodilator; Saint George: Questionnaire to assess the impact of respiratory diseases on health and well-being.; PM25: Particulate Matter at 2.5 μg/m3, estimated daily average for each patient; NO2: Nitrogen dioxide in μg/m3, estimated daily average for each patient.
Table 2.
Results of multivariable Cox models of the long-term effect of PM2.5, NO2, and COPD-E-related clinical conditions in Bogotá D.C., between 2018 and 2021.
Table 2.
Results of multivariable Cox models of the long-term effect of PM2.5, NO2, and COPD-E-related clinical conditions in Bogotá D.C., between 2018 and 2021.
| Variable | Model with PM2.5 HR (CI95: LI – LS) |
Model with categorical variable for ≥ 15µg/m3 PM2.5 HR (CI 95: LI – LS) |
Model with NO2 HR (CI95: LI – LS) |
Model with categorical variable for ≥ 25µg/m3 NO2 HR (CI95: LI – LS) |
|---|---|---|---|---|
| n: 586 n events: 329 | ||||
| Pollutant | 1.03 (1.02- 1.05) ** | 1.19 (0.95-1.48) | 1.05 (1.03 -1.07) *** | 1.49 (1.12 -1.98) ** |
| FEV1 pre- bronchodilator | 0.81 (0.65- 1.003) | 0.80 (0.64 -0.99) * | 0.83 (0.67 -1.03) | 0.80 (0.64-0.99) * |
| Quality of the questionnaire Saint George (Symptoms) |
1.01 (1.01 - 1.02) *** | 1.01 (1.01 -1.018) *** | 1.01 (1.01 -1.02) *** | 1.01 (1.01-1.02) *** |
| Solar radiation | 1.02 (1.01- 1.03) *** | 1.01 (1.01-1.018) *** | 1.02 (1.02 -1.03) *** | 1.02 (1.01-1.02) *** |
| Number before of COPD-E | 1.02 (1.02- 1.024) *** | 1.02 (1.02 -1.024) *** | 1.02 (1.01 -1.024) *** | 1.02 (1.02-1.024) *** |
*HR: Adjusted hazard or hazard ratios (HR), obtained using an explanatory multiple model including the variables, LI: Lower Interval LS: Upper Interval; p-value of multivariate models: ***:p<0.001. **: p<0.01, *: p<0.05 '.' e: mathematical connotation, RMSE: Root Mean Squared Error, AIC: Akaike information criterion, PM2.5: 2.5-micron particulate matter, NO2: nitrogen dioxide. FEV1_PRE: Forced expiratory volume in the first-second pre-bronchodilator.
Disclaimer/Publisher’s Note: The statements, opinions and data contained in all publications are solely those of the individual author(s) and contributor(s) and not of MDPI and/or the editor(s). MDPI and/or the editor(s) disclaim responsibility for any injury to people or property resulting from any ideas, methods, instructions or products referred to in the content. |
© 2024 by the authors. Licensee MDPI, Basel, Switzerland. This article is an open access article distributed under the terms and conditions of the Creative Commons Attribution (CC BY) license (http://creativecommons.org/licenses/by/4.0/).
Copyright: This open access article is published under a Creative Commons CC BY 4.0 license, which permit the free download, distribution, and reuse, provided that the author and preprint are cited in any reuse.


