Introduction
The MIL-P-19692E standard specification and detailed pump specification establish requirements for variable flow hydraulic pumps for use in aircraft hydraulic systems that conform to and are defined in MIL-H-5440 and MIL-H-8891, as applicable. General requirements for Type I and Type II hydraulic system pumps are specified in MIL-H-8775, and for Type III system pumps in MIL-H-8890.
The paper specifically considers the design of the hydraulic system of the aircraft, [
3,
10,
12] so that the entire system is designed efficiently to minimize pressure losses. Safety mechanisms are built into the hydraulic system to ensure reliable operation, even in the event of pump failure. Test and simulation tools were used to model different operating scenarios and optimize pump parameters [
1,
7]. This can help identify potential problems and improve pump performance under different conditions.
He operation of the pump and the reliability of the aircraft's hydraulic system (
Figure 1) are significantly affected by the following parameters: flow (Q), pressure (p), number of revolutions of the pump drive shaft (n), type of hydraulic oil (viscosity), oil temperature (T). Operating parameters should be adjusted to maximize efficiency while meeting system requirements. The appearance of vibrations and noise during pump operation is particularly noteworthy. It is essential to address any unusual vibrations or noises, as they may indicate mechanical problems that require attention.
Testing of constant-pressure, variable-flow hydraulic pumps typically involves specialized equipment and test setups to accurately assess performance, efficiency, and reliability.
Equipment for testing hydraulic pumps includes the hydraulic test table as the core of the setup, enables pressure and flow control. It contains a hydraulic tank, valves, filters and pressure gauges. A variable speed motor or drive controls the speed of the pump, providing variable flow while maintaining constant pressure.
The flow meter measures the flow delivered by the pump. Often installed downstream of the pump, it provides accurate readings of variable flow rates at constant pressure.
The pressure control valve (overflow valve) maintains a constant pressure in the system, regardless of the flow. Adjustable to set desired test pressure level, ensuring stable conditions. Load simulation includes devices such as orifice plates, restrictors or dynamic actuators that simulate different loads on the pump while keeping the pressure constant. It helps in evaluating the performance of the pump under real operating conditions. Pressure transducers and gauges include high-precision sensors that measure pressure within the system. Real-time data is key to ensuring pump operation under constant pressure.
The temperature control unit ensures that the oil temperature remains stable, as temperature fluctuations can affect both pump efficiency and test results. The data acquisition system collects data from pressure transducers, flow meters and other sensors to monitor pump performance in real time. It enables in-depth analysis of flow, pressure, efficiency and other key performance indicators.
A dynamometer measures the power required by the pump and can also simulate load conditions [
4,
11,
12,
13] . A torque sensor measures the torque produced by the pump to assess mechanical efficiency, especially when changing the flow rate.
Monitoring vibration and noise is an important assessment of mechanical integrity and noise performance, especially in applications where pumps are sensitive to vibration.
2. Mathematical Model
Mathematical modeling of axial piston pumps with constant pressure and variable flow involves the development of equations and simulations to describe the dynamic behavior, flow characteristics and pressure variations within the pump [
8,
14,
15]. Modeling introduced system assumptions and definitions:
•pump type (axial piston pump with fixed displacement along the stroke of the piston),
•working conditions (constant pressure but variable flow),
•components (pistons, cylinder block, valve plate angle, valve plate and hydraulic fluid properties) i
•physical limitations (mechanical limitations of pistons, fluid compressibility, leakage and friction)
Kinematic modeling includes the angle of the flap that regulates the variable flow. The movement along the stroke of the piston is proportional to the angle of the folding plate, and thus the length of the stroke of the piston is determined. The motion of each piston is typically modeled using the angular velocity of the cylinder block and the angle of the swash plate. The volume of liquid displaced by each piston as a function of time also depends on the angular velocity of the rotating block of cylinders [
16,
17,
18].
Fluid dynamics and total flow depend on the number of pistons, the displacement per piston, and the rotational speed of the cylinder block. Variable flow control is performed by the angle of the swash plate which can be adjusted based on the requirement to maintain constant pressure while changing the flow. This is usually achieved by a feedback control mechanism.
The pressure of a variable flow pump is modeled taking into account the compressibility of the hydraulic fluid and the flow in the system. The bulk modulus of the fluid, the effective volume of the fluid in the pump, and leakage or load flow must also be considered.
Leakage flow is typically modeled as a function of differential pressure and can be included to reflect efficiency loss.
The constant pressure control strategy is based on the use of a pressure control valve or an electronic feedback mechanism. The model includes a feedback loop to compare the measured pressure with a reference value and adjust the swash plate angle accordingly.
Flow is modulated based on system demand, and the control system adjusts the angle of the baffle plate to achieve the required flow while maintaining the desired constant pressure [
21,
22,
23,
24].
2.1. Mathematical Model of a Pump Process
The models are combined in a set of differential equations that describe the time-varying behavior of the pump under different operating conditions.
Solving these equations requires numerical methods (eg Runge-Kutta) to simulate the dynamic response of the pump in different scenarios [
17].
mass flow through the opening 1, on the entrance place into the intake space of the pump of fluid,
Figure 1:
where :
σ1=1 for pu ≥ ps , σ1=-1 for pu < ps
- geometrical flow section of the intake pipe
- flow coefficient of the intake pipe
where :
σu=1 for ps ≥ pc , σu = -1 for ps <pc
Au- geometrical flow section of the intake split organ
- flow coefficient of the intake split organ
where :
j=1,2,...,zc, zc - the numbers of cylinders
Differential equation for pressure in the intake pump space:
- modulus of elasticity;
- the driving shaft angle,
Differential equation for pressure in the pump cylinder:
where:
- current volume of the cylinder; the change of the pump cylinder volume caused by piston moving: , - current displacement of the piston.
- •
mass balance of the delivery chamber is:
where :
j=1,2,..., zc - the numbers of cylinders
- •
mass flow out of the delivery chamber into the delivery pipe is:
where:
σ2=1 for
pv ≥pn , σ2 = -1 for
pv < pn
A2- geometrical flow section of the delivery pipe line
Differential equation for pressure in the delivery pump chamber:
- •
mass flow through a concentric clearance between the cylinder and the piston:
where:
- diameter of cylinder,
- radial clearance between the piston and the cylinder,
η- dynamic viscosity,
- current displacement of the piston,
pc - the pressure in the cylinder,
ps - the pressure in the intake space,
- the density of the fluid in the cylinder.
2.2. Modeling the Flow In the Intake and Delivery Pipe Line of the Pump
Modeling efficiency and losses (mechanical and hydraulic) includes friction between moving parts, which can be modeled as a damping force or torque. Losses due to leakage, flow restriction and fluid compressibility can be modeled as pressure-dependent flow loss [
3,
4,
5].
The model is validated by comparing simulation results with experimental data, and parameters are adjusted (such as leakage coefficients or friction terms) to improve accuracy. Analysis of the sensitivity of pump performance to various parameters (eg, swash plate angle, fluid properties, leakage) is a summary of the key equations. Displacement per piston, flow rate, pressure dynamics and leakage flow are working parameters that significantly affect the efficiency of the pump.
This general approach can be applied in various simulation software to study the performance of axial piston pumps under different operating conditions, and further refined to take into account effects from real operating conditions [
10].
Continuity Equations
The equation of continuity of pressed fluid with functions p, v, ρ during the isentropic change[
1] of the state is:
where :
and
v – values of density and velocity of fluid per cross section of the pipe,
, the velocity of sound in the fluid,
where: and are functions of time t and coordinate x.
Momentum Equations
where: – friction force per mass unit.
In the scope of fluid dynamics of one-dimensional flow [
1], such flows are considered as “non stationary flows in a flow fiber”.
3. Results of Measuring of Parameters
Experimental testing of a constant-pressure, variable-displacement hydraulic pump focuses on performance such as efficiency, flow rate, pressure stability, noise levels, and temperature effects.
It was observed how the flow rate responds to changes in system requirements while maintaining a constant pressure. The flow rate decreases as system demand increases, confirming the pump's ability to adjust volume to meet desired conditions.
Maintaining a constant output pressure even with different flow rates.
It was observed that the pressure in the system remains relatively stable, which indicates the correct functioning of the compensation mechanism in the pump.
Pump efficiencies were measured in different operating conditions. A drop in efficiency occurs at higher flow rates or pressure adjustments due to increased friction and fluid leakage. The efficiency curves show the optimum operating point at medium flow rates.
The effects of temperature changes on pump performance showed that as temperature increases, fluid viscosity decreases, leading to low pressure losses and lower efficiency due to internal leakage.
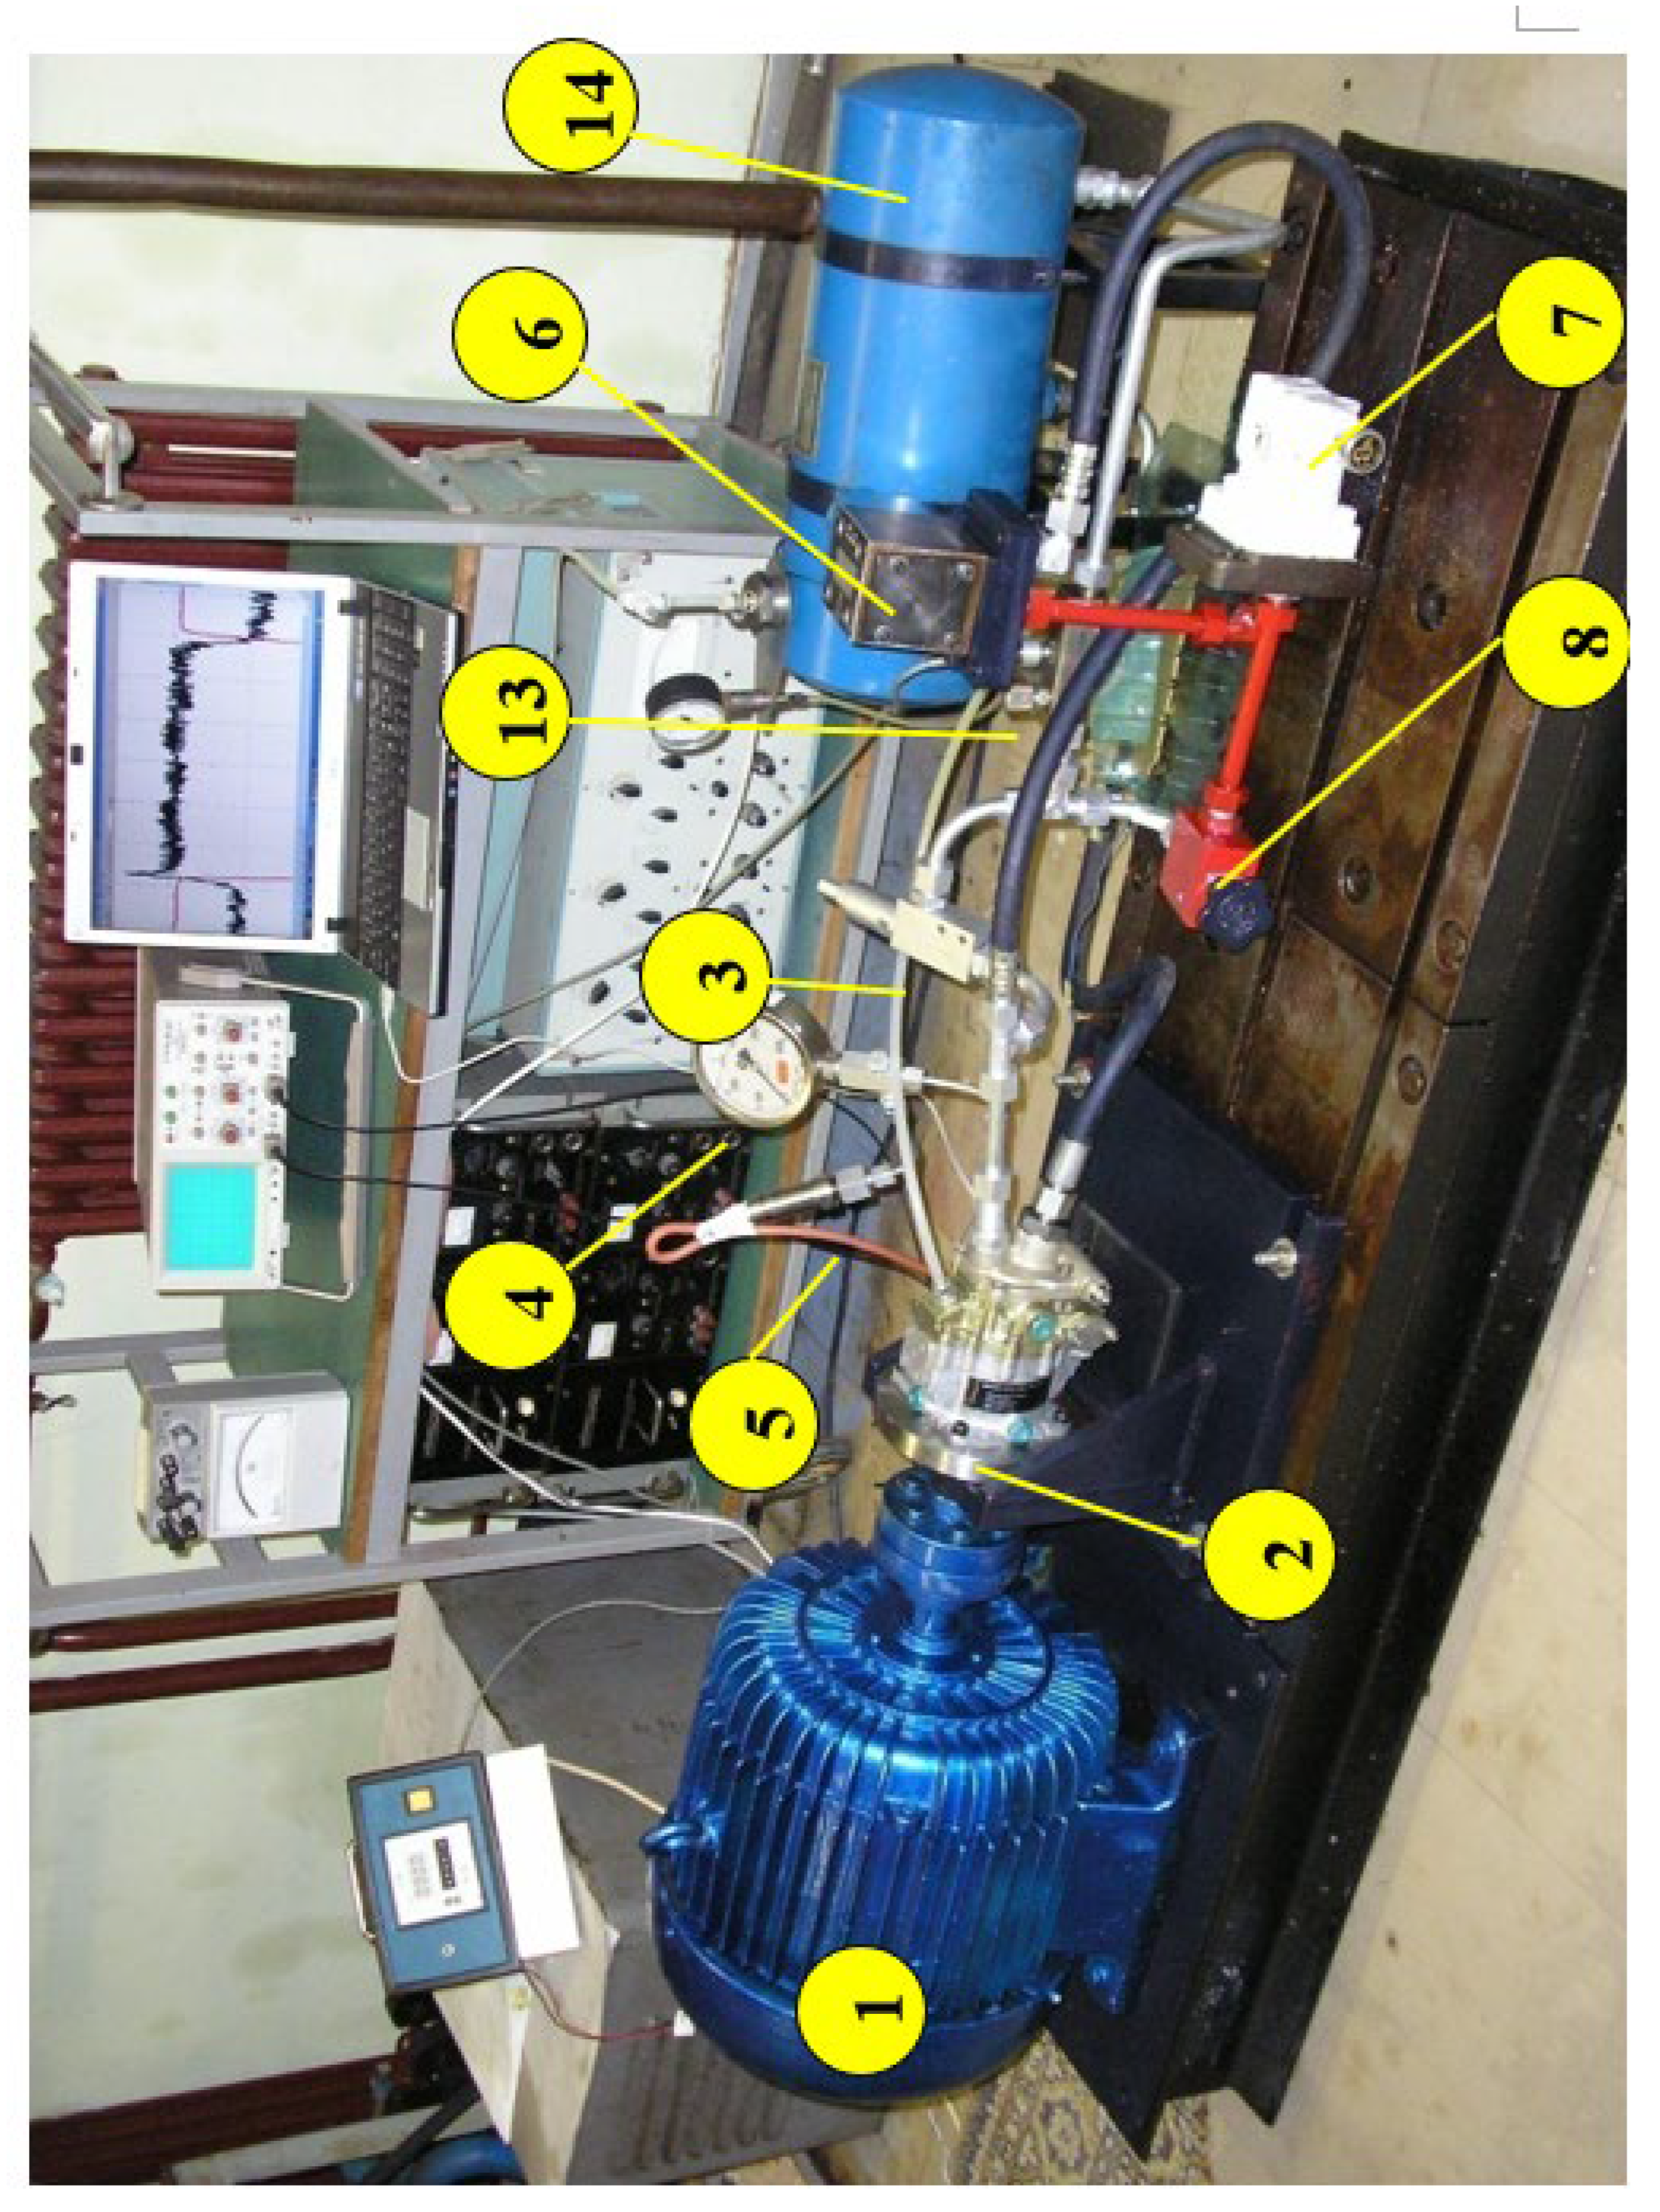
The experimental tests were carried out on a real object that was designed according to the model of a hydraulic system in which the hydropump works in the system under real conditions. The experiments mainly included tests of dynamic characteristics such as dynamic processes of transient phenomena and changes during flow regulation. The mentioned characteristics are extremely important for application on hydro systems of aircraft, considering that these systems have extremely fast processes [
19,
20,
21,
22].
Figure 2.
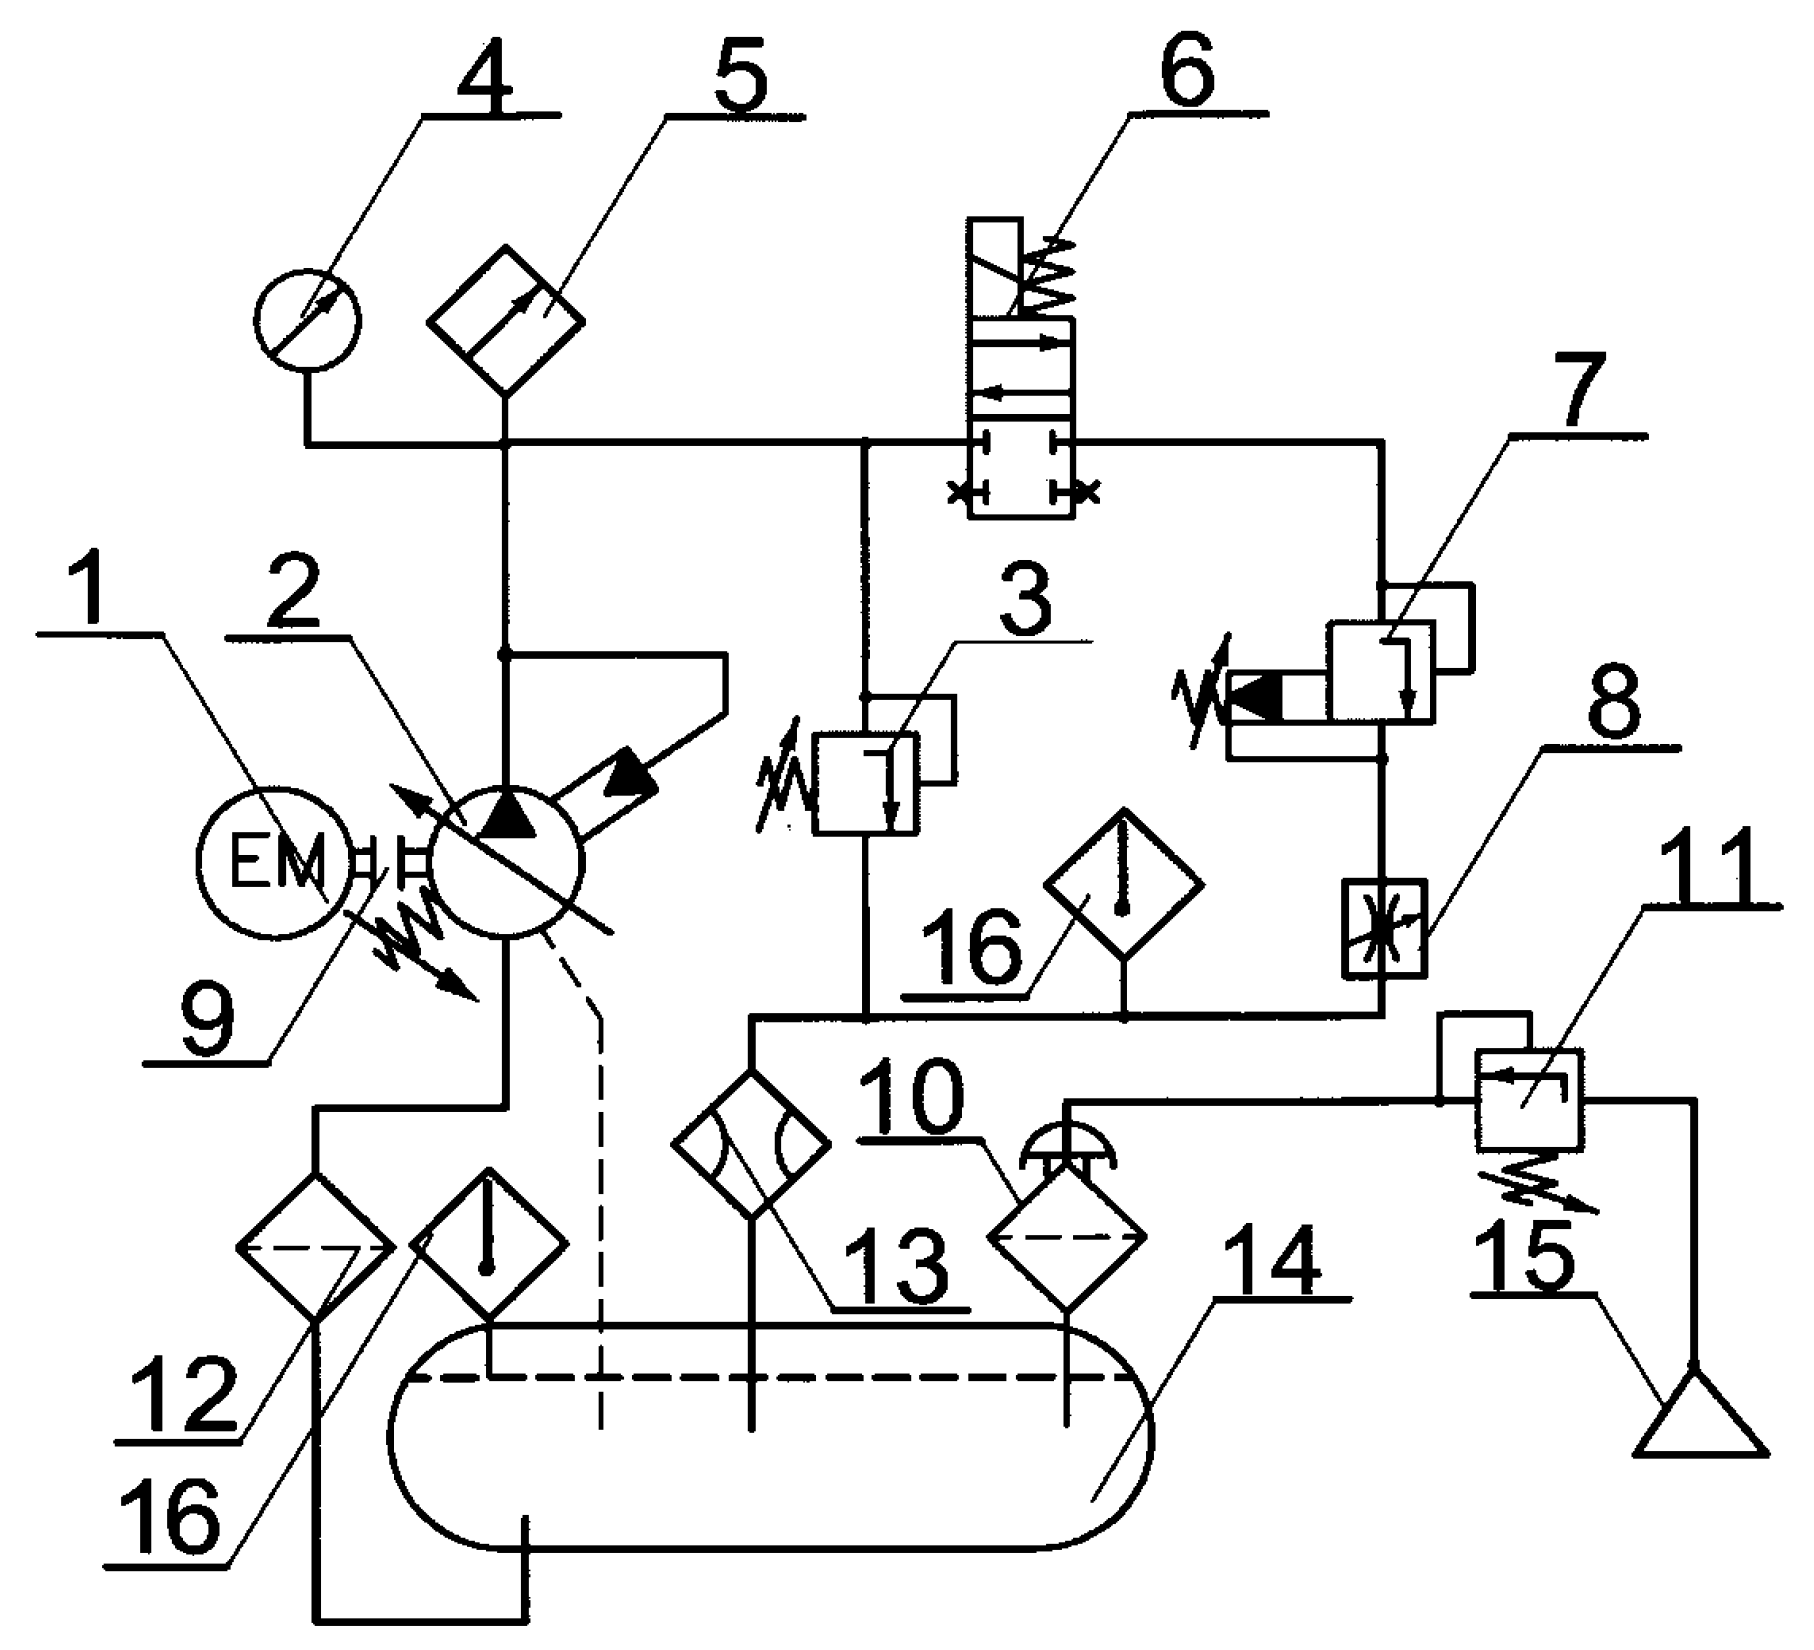
Scheme of the laboratory hydraulic system for testing.1-electric motor, 2-pump PKP, 3-safety valve, 4-manometer, 5-pressure transducer, 6-electromagnetic distributor, 7-pressure regulator of indirect action, 8-damper of variable resistance, 9-elastic coupling, 10- intake filter,11-air pressure regulator, 12-intake filter, 13-flow converter, 14-pressure tank, 15-pressure air source, 16-temperature converter
In the reservoir of the hydraulic system, there is about
m3 a hydraulic fluid, which participates in the transformation and transmission of power, which is approximately 7.4 kW . The hydraulic system contains mineral-based hydraulic fluid, Hidraol 15, with a kinematic viscosity of ν=15⋅10-6 m2/s, , at a temperature of 400 C. Applied Hidraol 15 is similar in characteristics to the hydraulic fluid used in aviation. The pump under test is designed to work with "Aero Shell 40" fluid, which is used for the temperature range from -550C to 1350C. At times when the system does not need hydrostatic energy, the pump reduces the flow to approx. 2
m3/s.Then it absorbs far less power compared to the case when excess fluid is returned to the tank after pressure reduction. In the hydraulic system (
Figure 3) there is an electromagnetic distributor, (pos. 6), with which the flow of the pump can be translated very quickly from the maximum to the minimum value. There is a safety valve in the pressure line (pos. 3), which, if necessary, relieves the system to the set level. The indirect action pressure regulator, (pos. 7), enables precise pressure regulation in the pressure line, while small pressure variations are regulated by means of a variable resistance damper, (pos. 8)
Four parameters were included in the experimental tests:
• pressure in the discharge line,
• pump flow,
• temperature of the working fluid in the tank
• temperature at the outlet of the variable resistance choke.
3.1. Pressure Pulsations
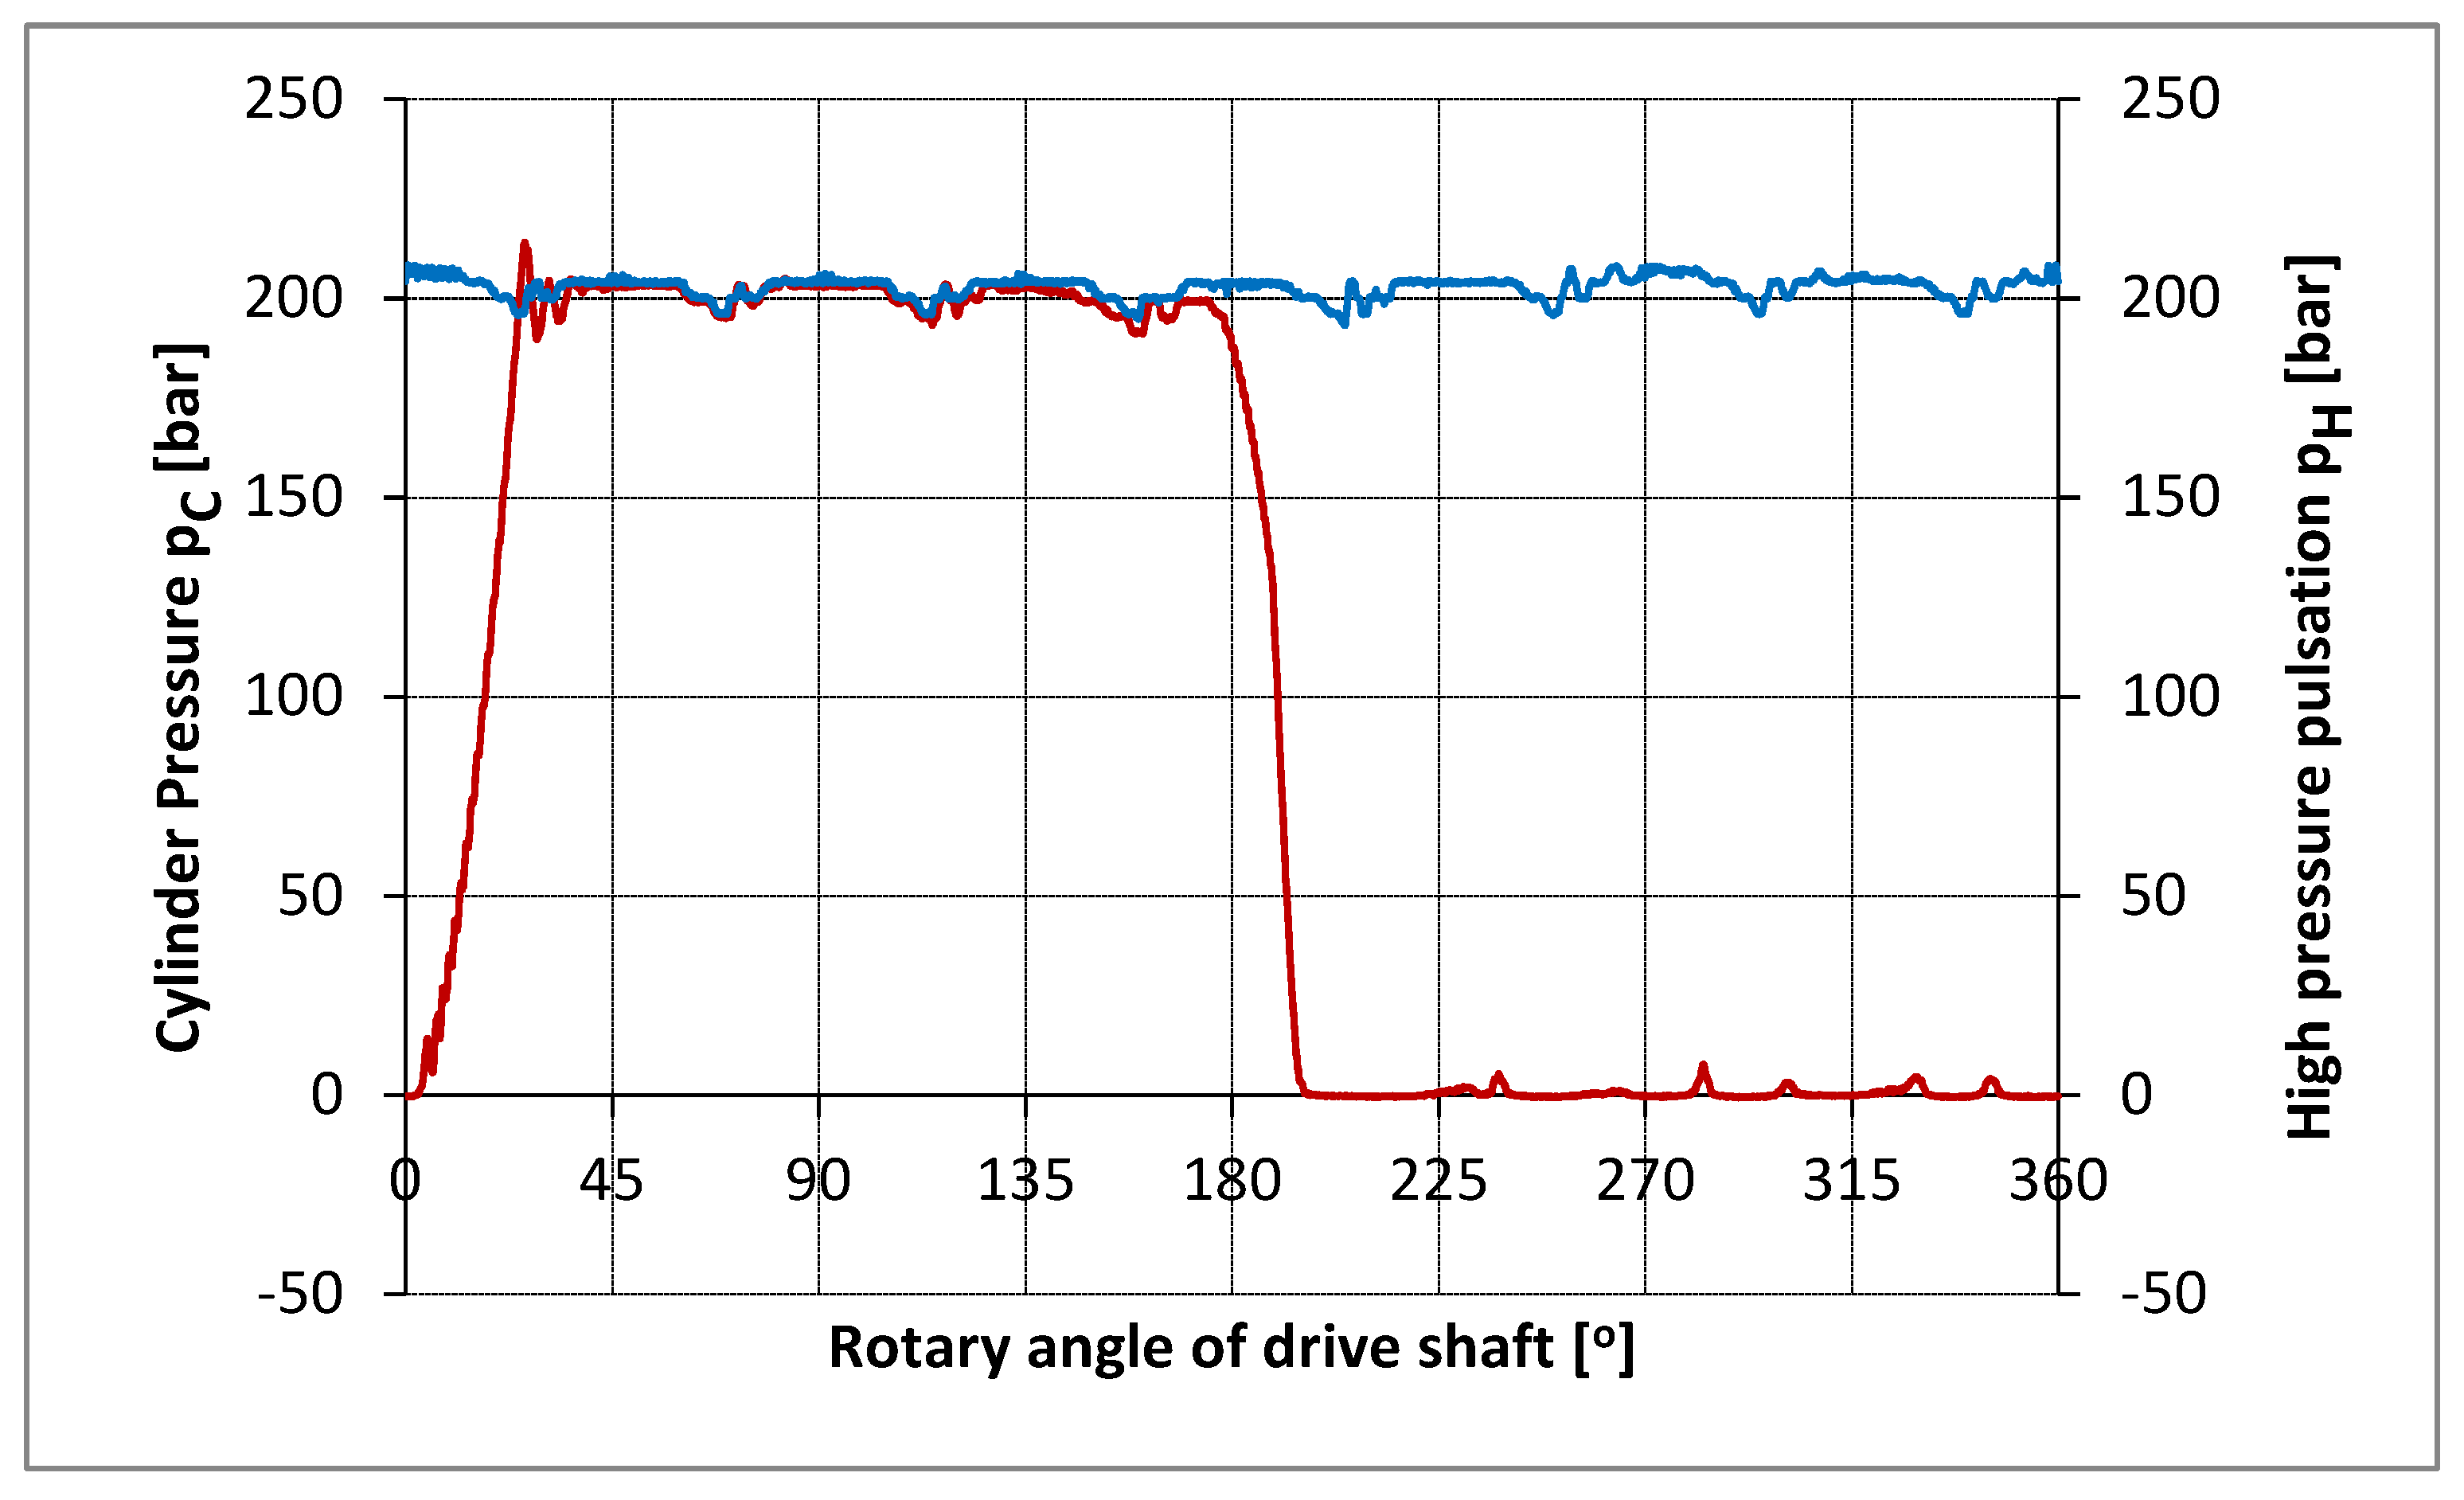
Axial piston pumps are prone to pressure pulsation, which occurs as a result of pump cycling and inherent design features. These pulsations can be categorized into high pressure pulsations and low pressure pulsations, both of which have different causes and effects. Understanding these pulsations is critical to improving pump performance (
Figure 4).
High pressure pulsations generally occur in the discharge line of the pump, where the liquid exits under high pressure.
Low-pressure pulsations occur on the suction side of the pump, where fluid is drawn into the pump chamber. Cavitation occurs when the pressure in the suction line drops below the vapor pressure of the hydraulic fluid, causing vapor bubbles to form. As these bubbles collapse, they create pressure spikes and pulsations on the suction side, which can be transmitted to the discharge side.
The pump is tested in a hydraulic system that simulates the actual system in which the pump will be installed, as defined in the detailed pump specification. The volume of the system is simulated using a pipe of the diameter of the discharge line. The length of the pipeline is chosen so that the natural frequency is resonant with the pulsation frequency.
3.2. Response Time
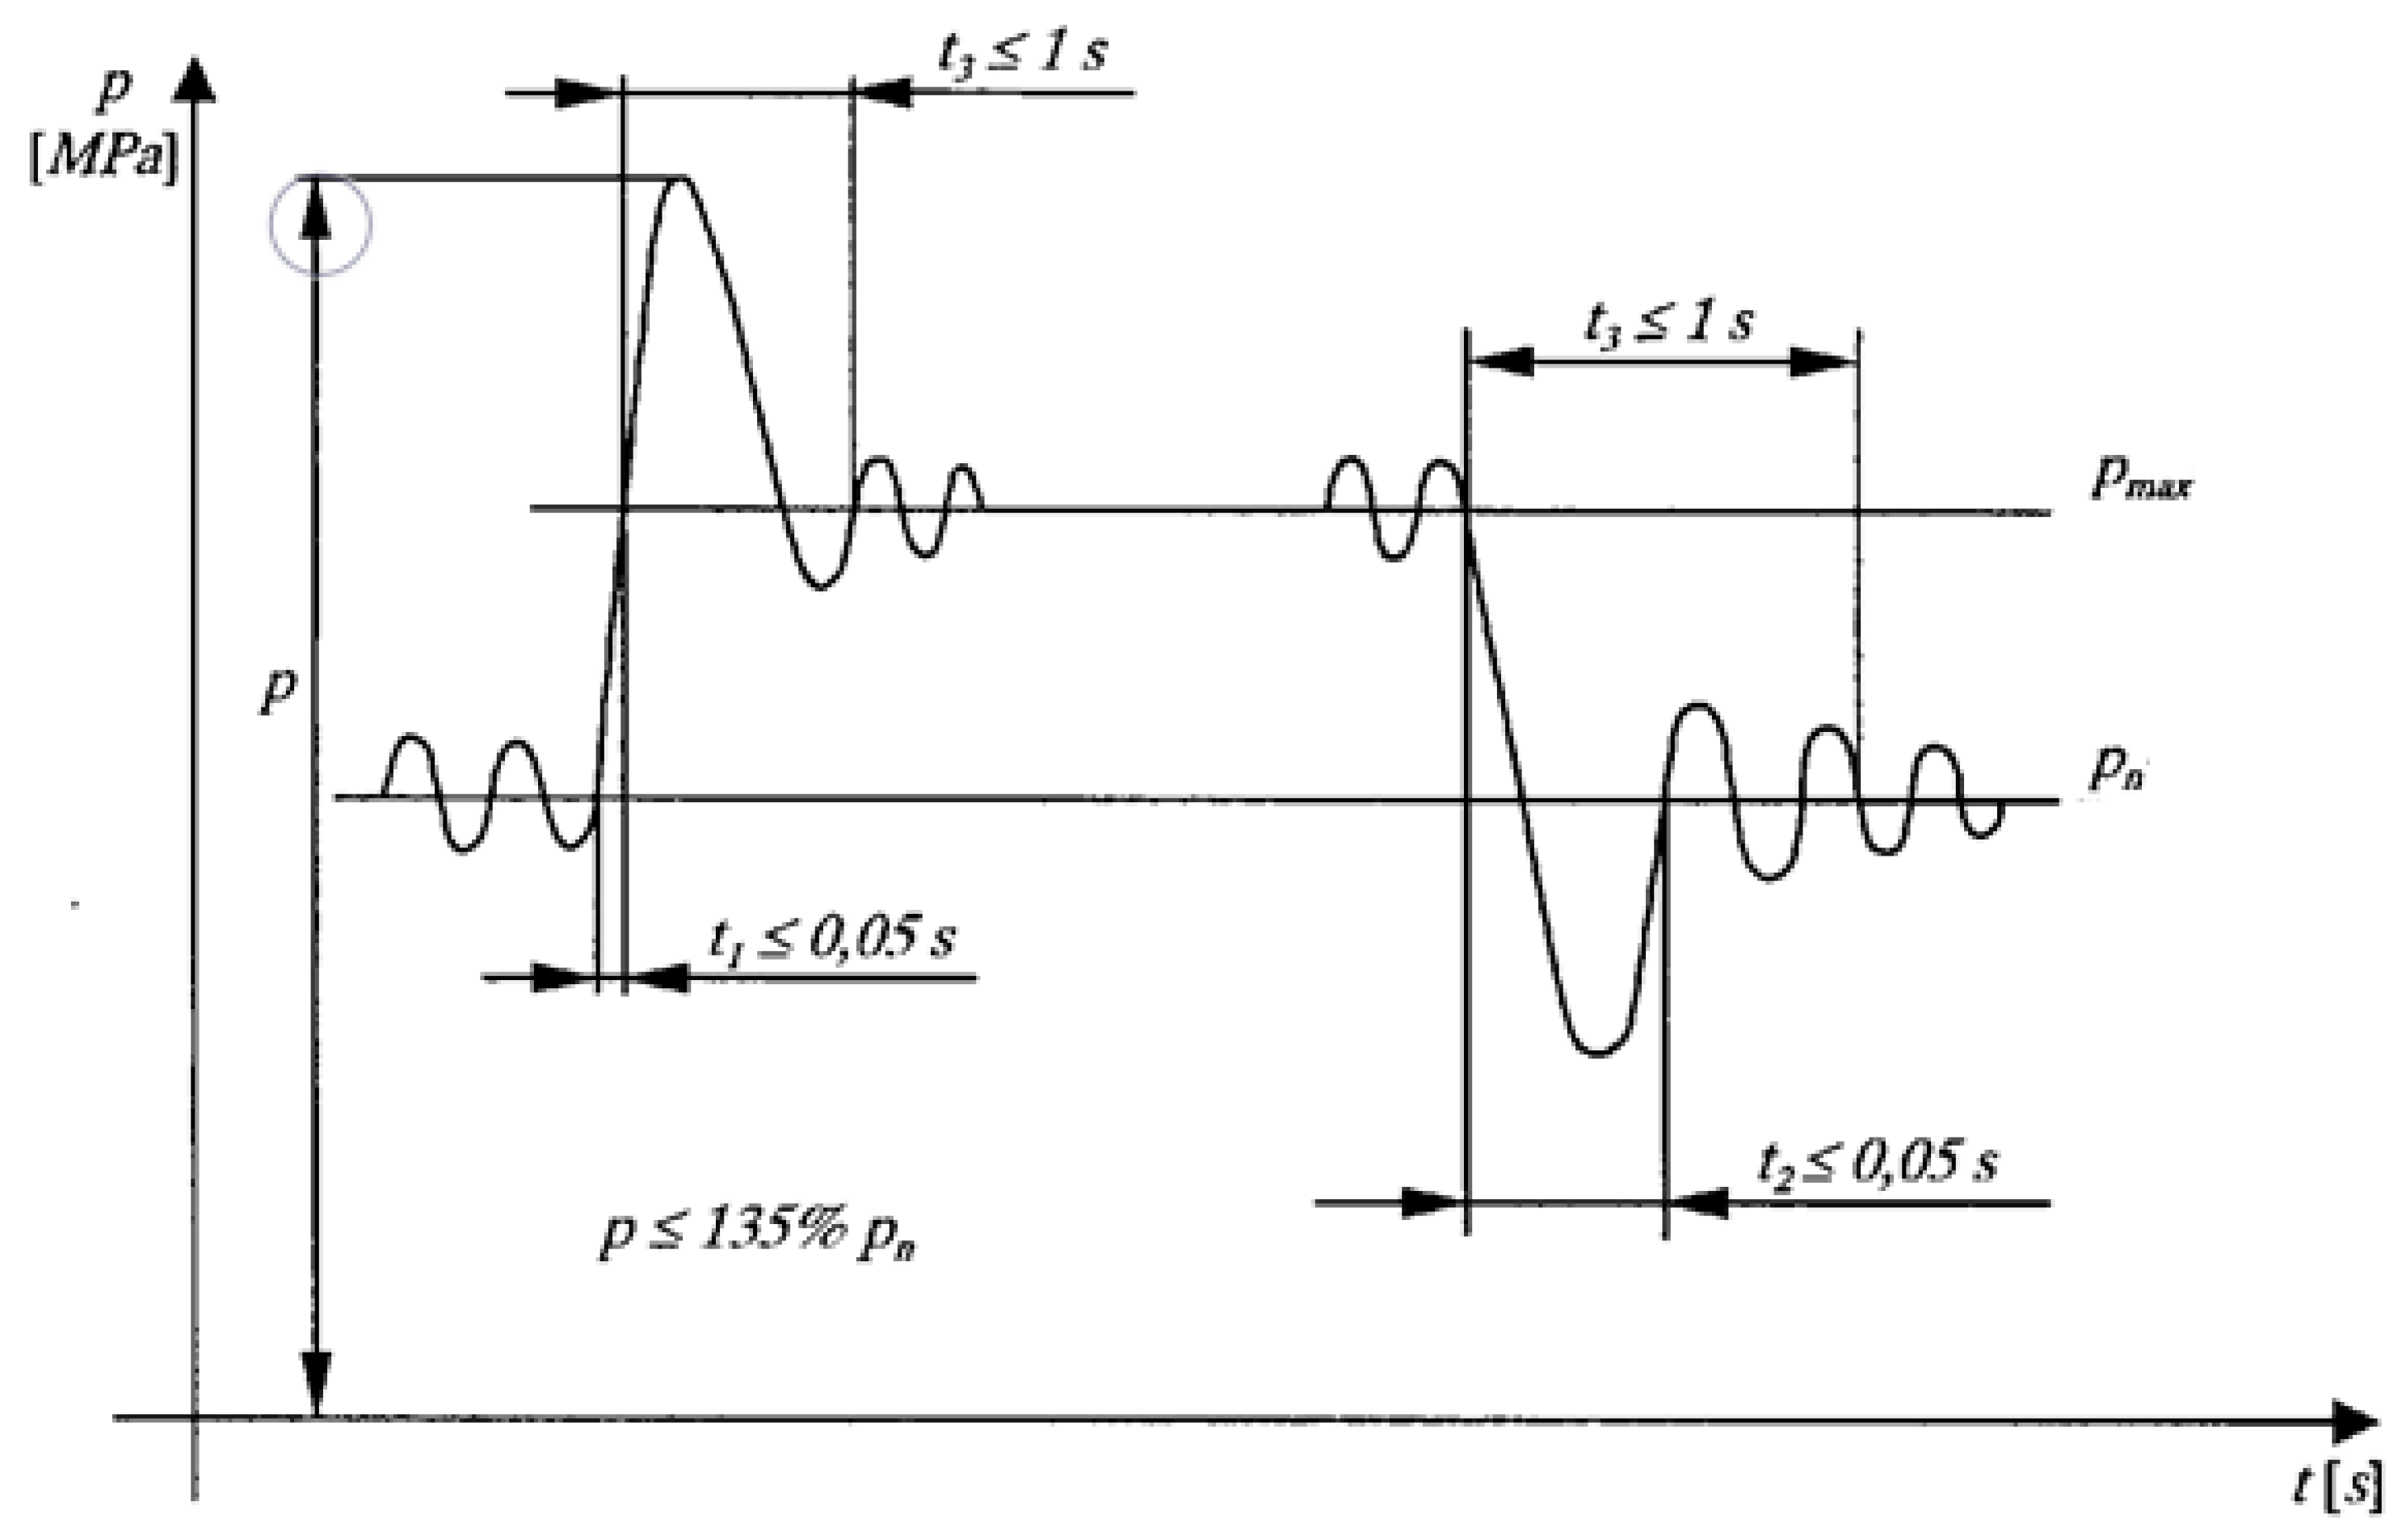
Measuring the response time of a constant-pressure, variable-displacement hydraulic pump involves estimating how quickly the pump adjusts its flow to maintain a desired pressure in response to changing system demands (
Figure 5). Pressure and flow sensors are installed at the pump's inlet and outlet to capture real-time data.
A high speed data acquisition system was used to record pressure, flow rate with high temporal resolution. The pump operates in a steady state (constant pressure and steady flow) until a sudden change (flow demand by opening a valve or activating a downstream actuator followed by closing a valve or reducing the downstream load)
By comparing the response times under different conditions, the dynamic performance of the pump can be evaluated and its suitability for applications that require rapid flow adjustments.
For the tested pump, it took 200 ms to adjust from the initial flow rate of 50 l/min to the new flow rate of 30 l/min. So its response time is 200 ms
When the pump initially drops to 25 L/min before settling to 30 L/min, an overshoot of 5 l/min is noted. Measurement tools and software provide high accuracy and sampling rates, to capture real-time data with millisecond resolution. The pressure transducer is located in the discharge line of the pump towards the outlet connection [
23,
25].
For recording the time constant, the pump is prepared to operate with a nominal pressure of p
n = 20 MPa and a maximum pressure of p
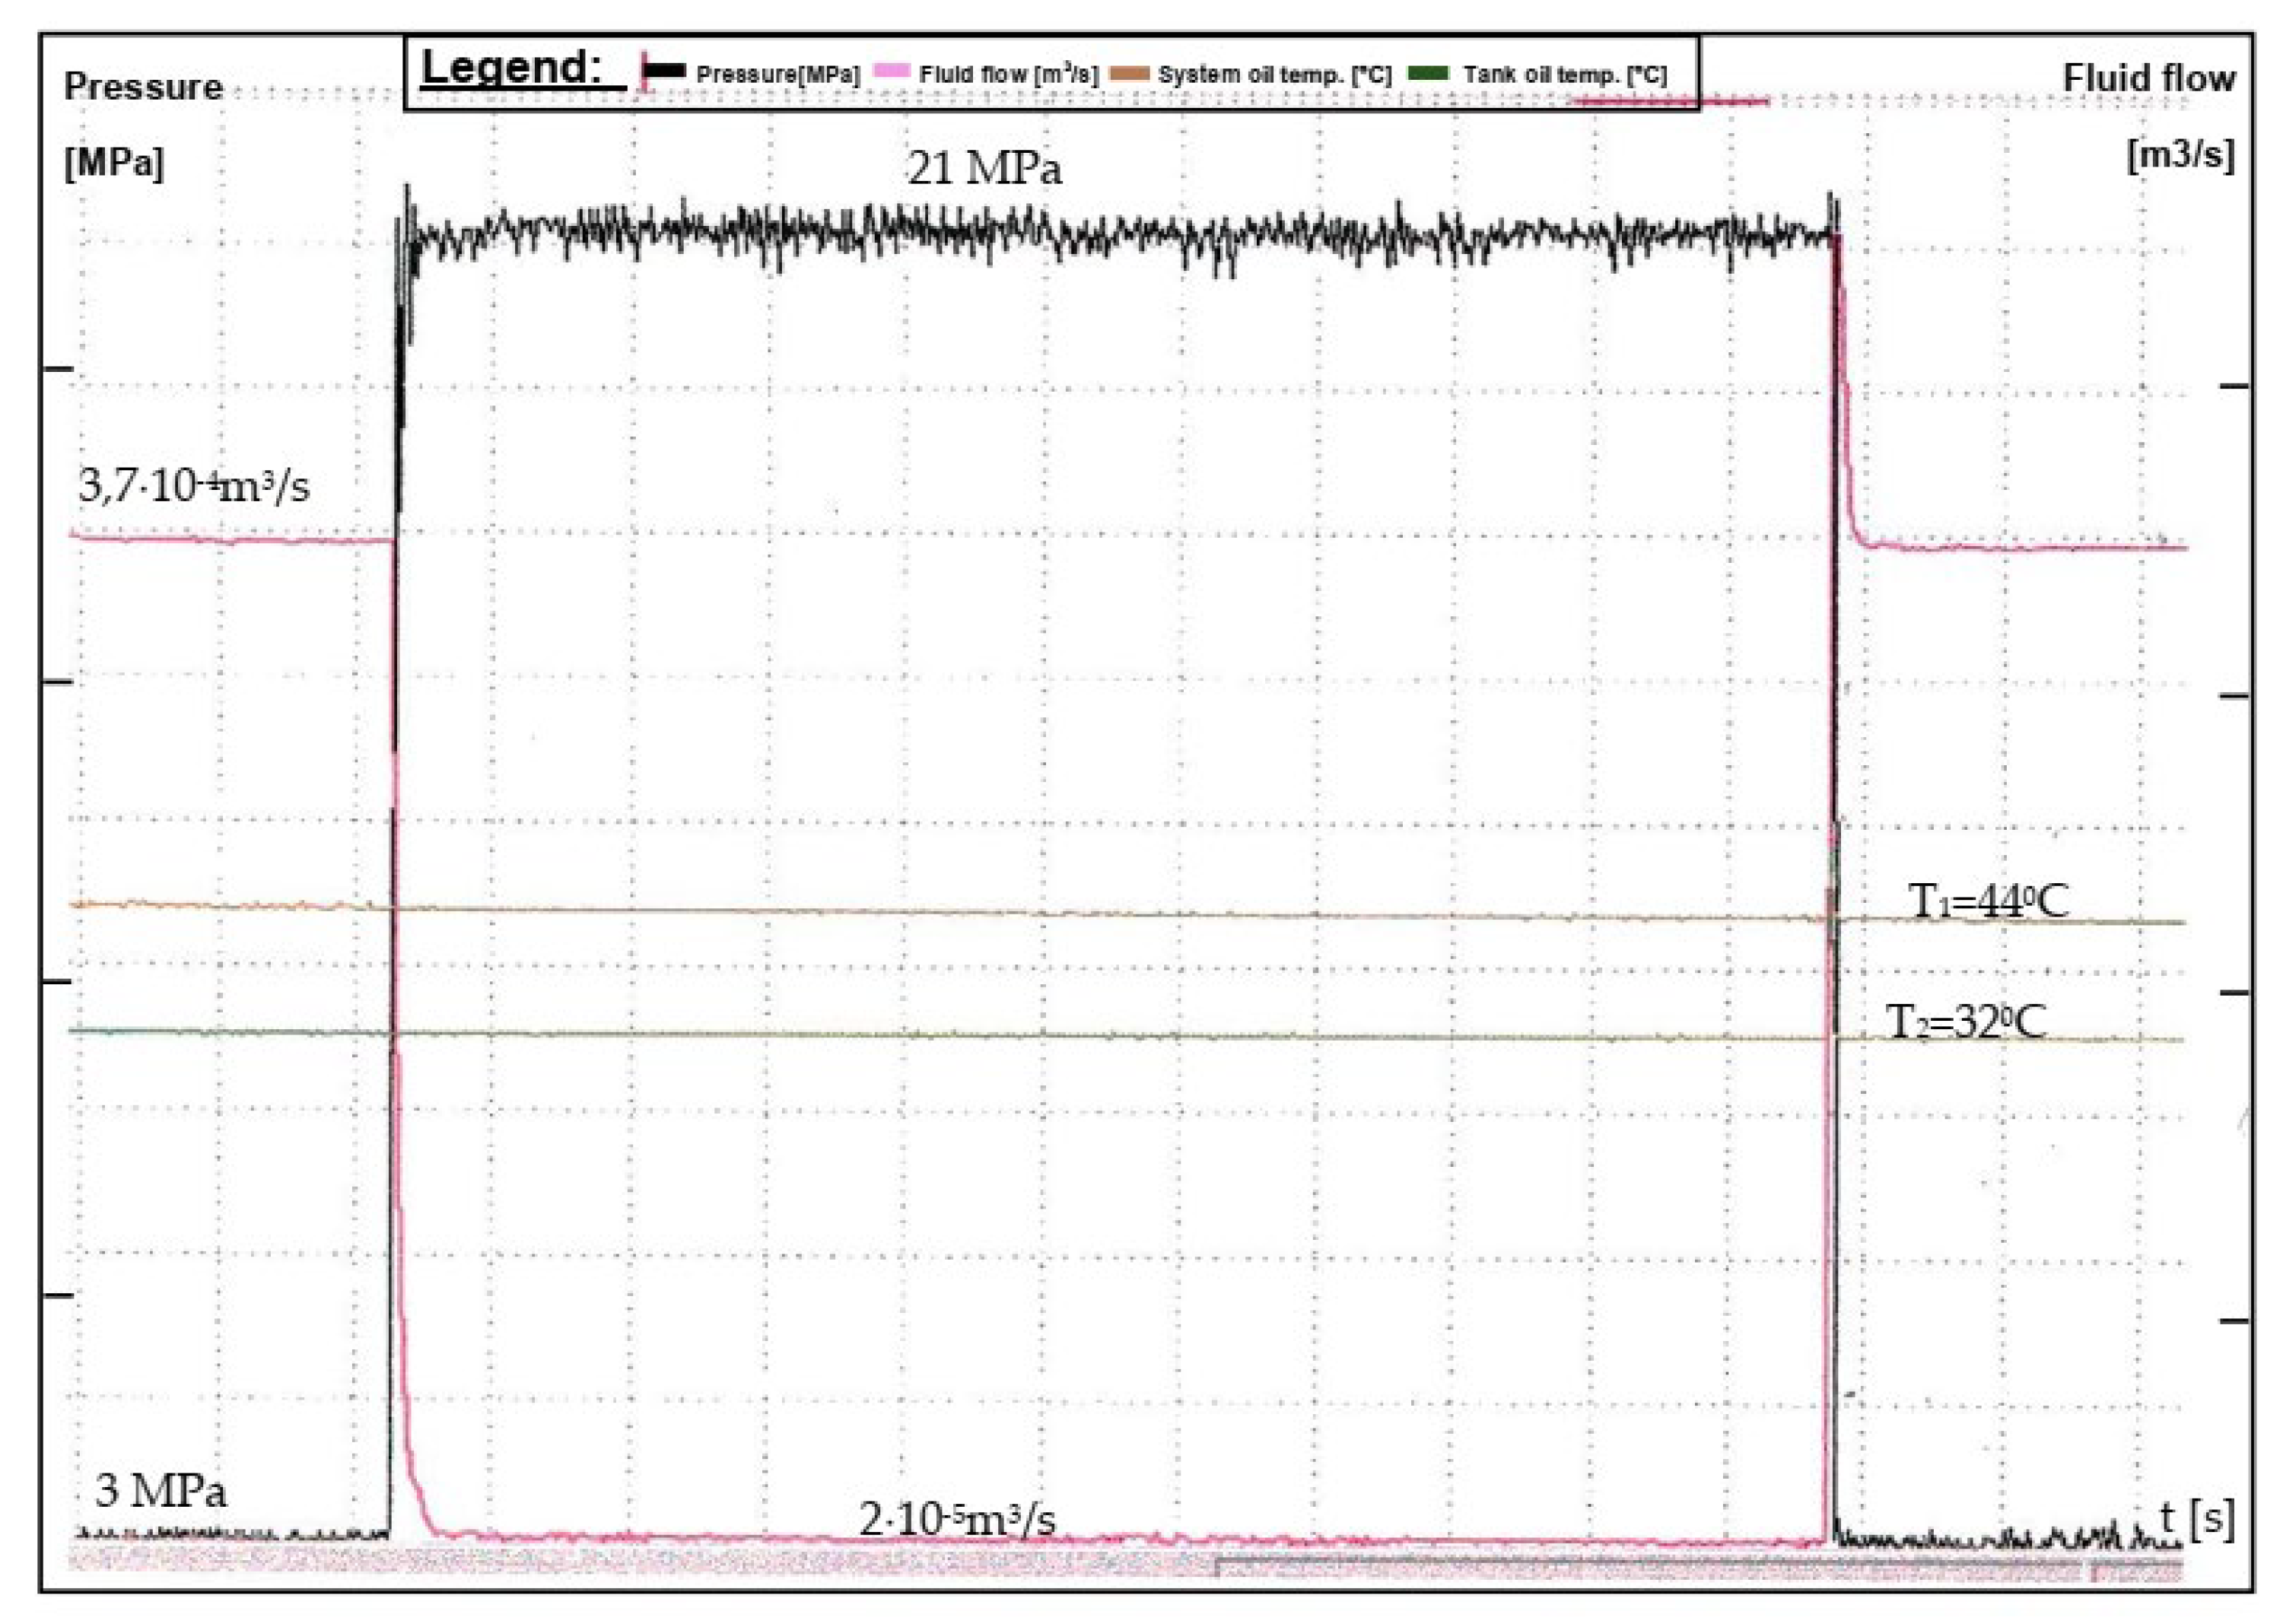
max = 21 MPa. Using the indirect pressure regulator, item 7 (
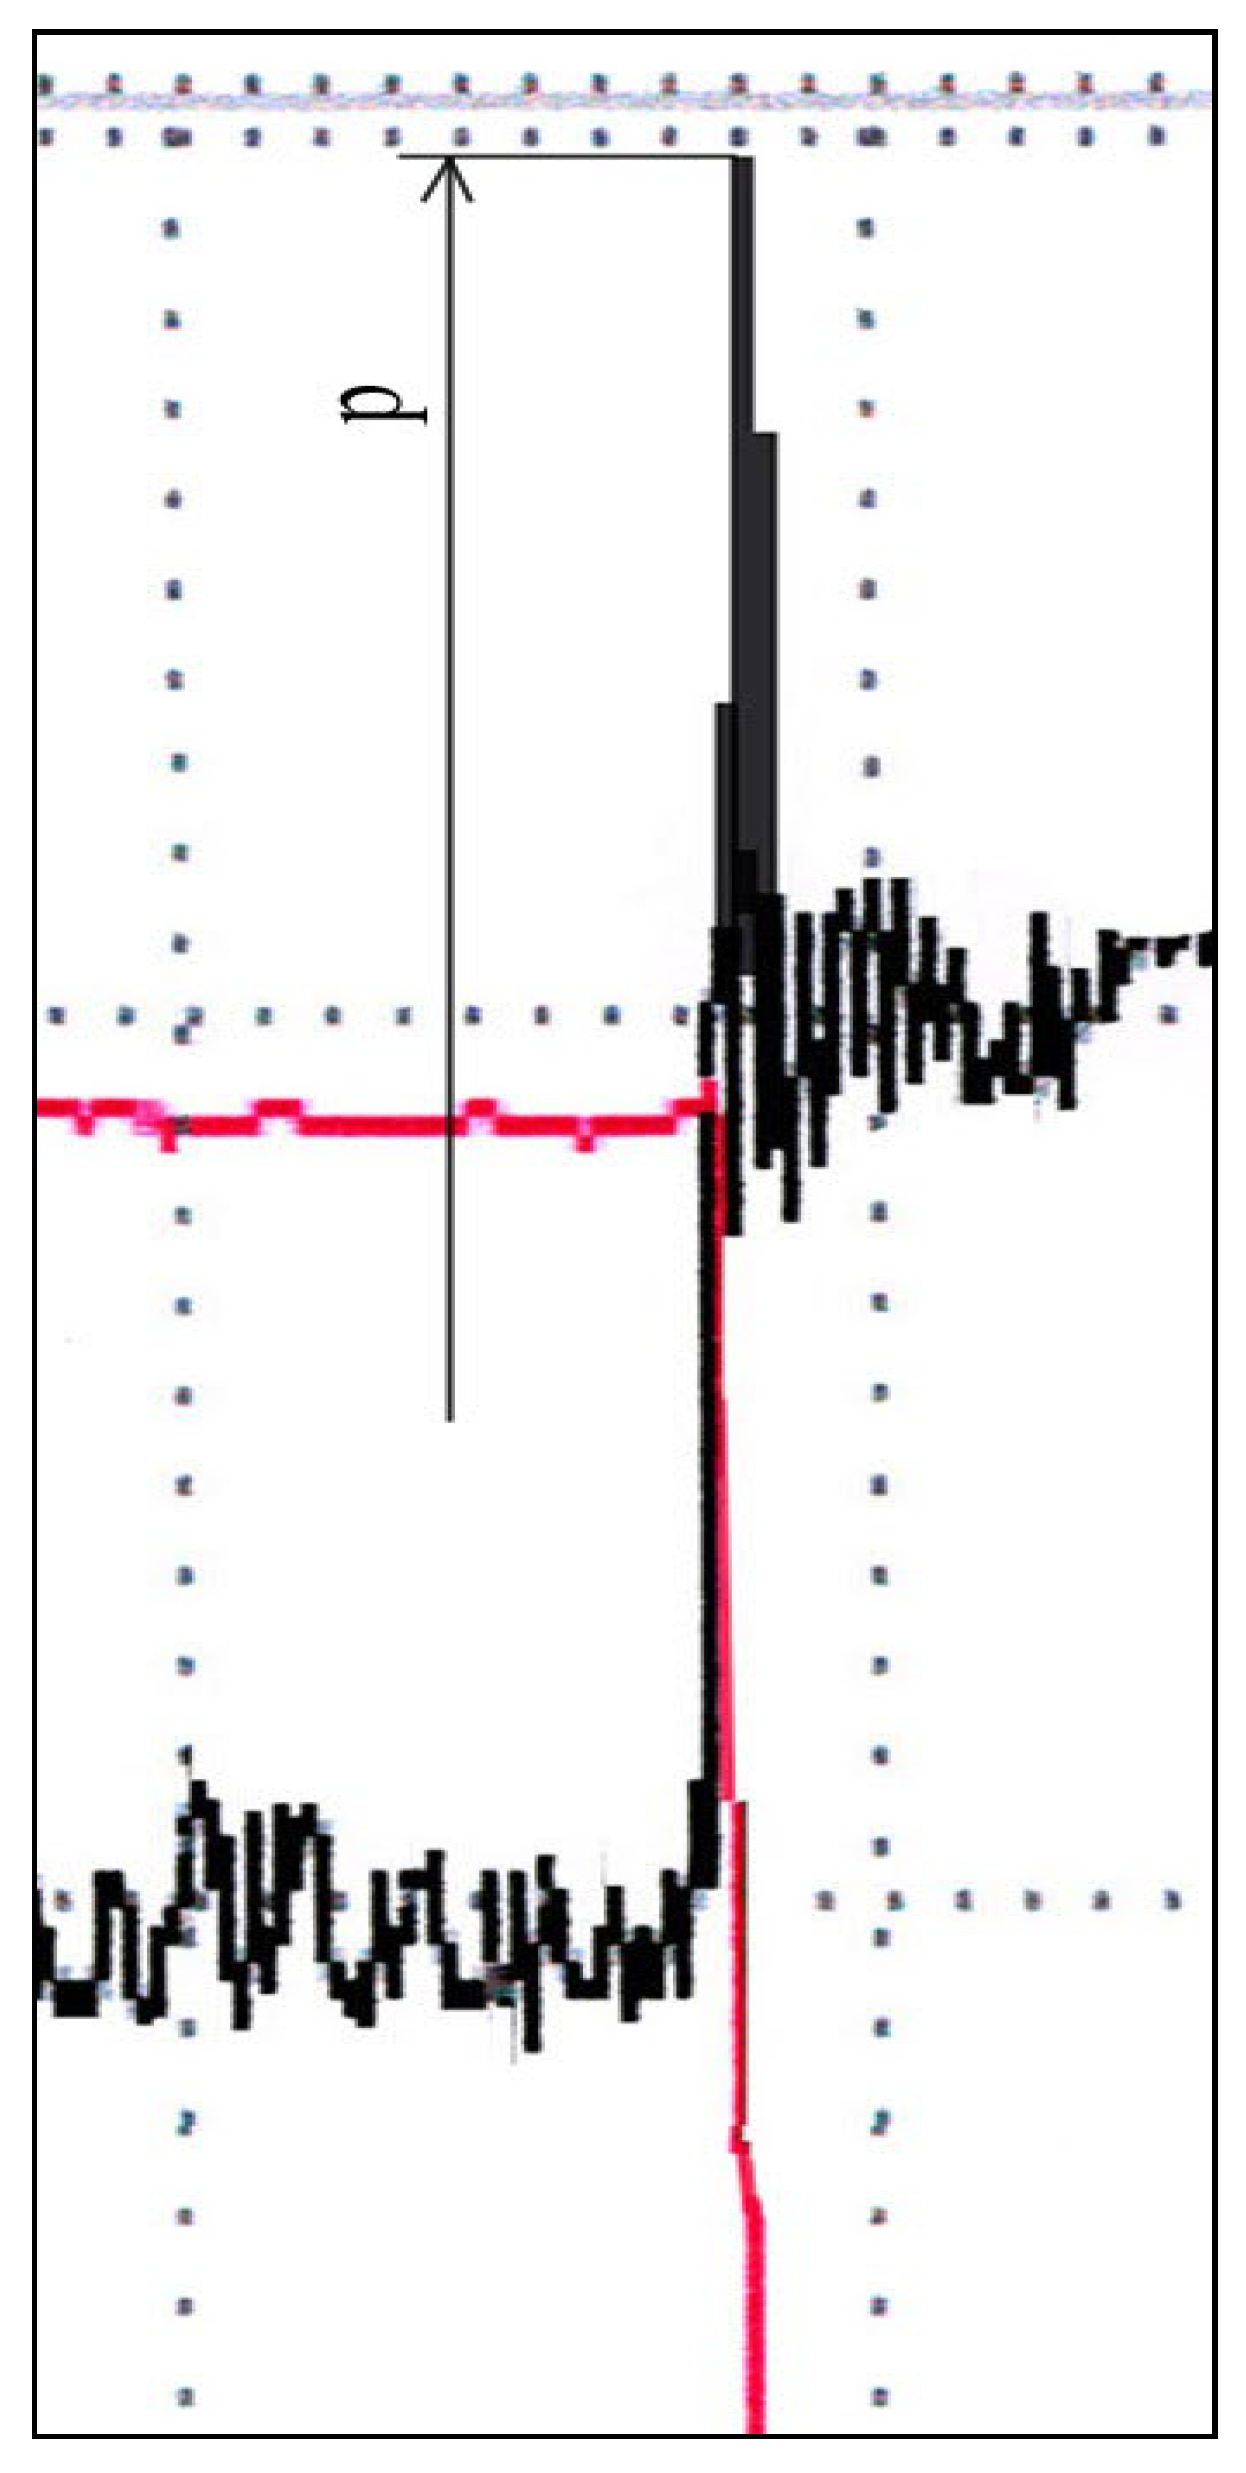
Figure 3), the nominal pressure value is set. Electromagnetic distributor, pos.6 the pump receives a command to work in two modes: with nominal flow and pressure (Q
n = 3.7x10
-4 m
3/s, p
n = 20 MPa), then with minimum flow and maximum pressure (Q
min = 2x10
- 5 m
3/s, p
max = 21 MPa) and again with nominal flow and nominal pressure. The described changes are shown in the diagram given in
Figure 7.
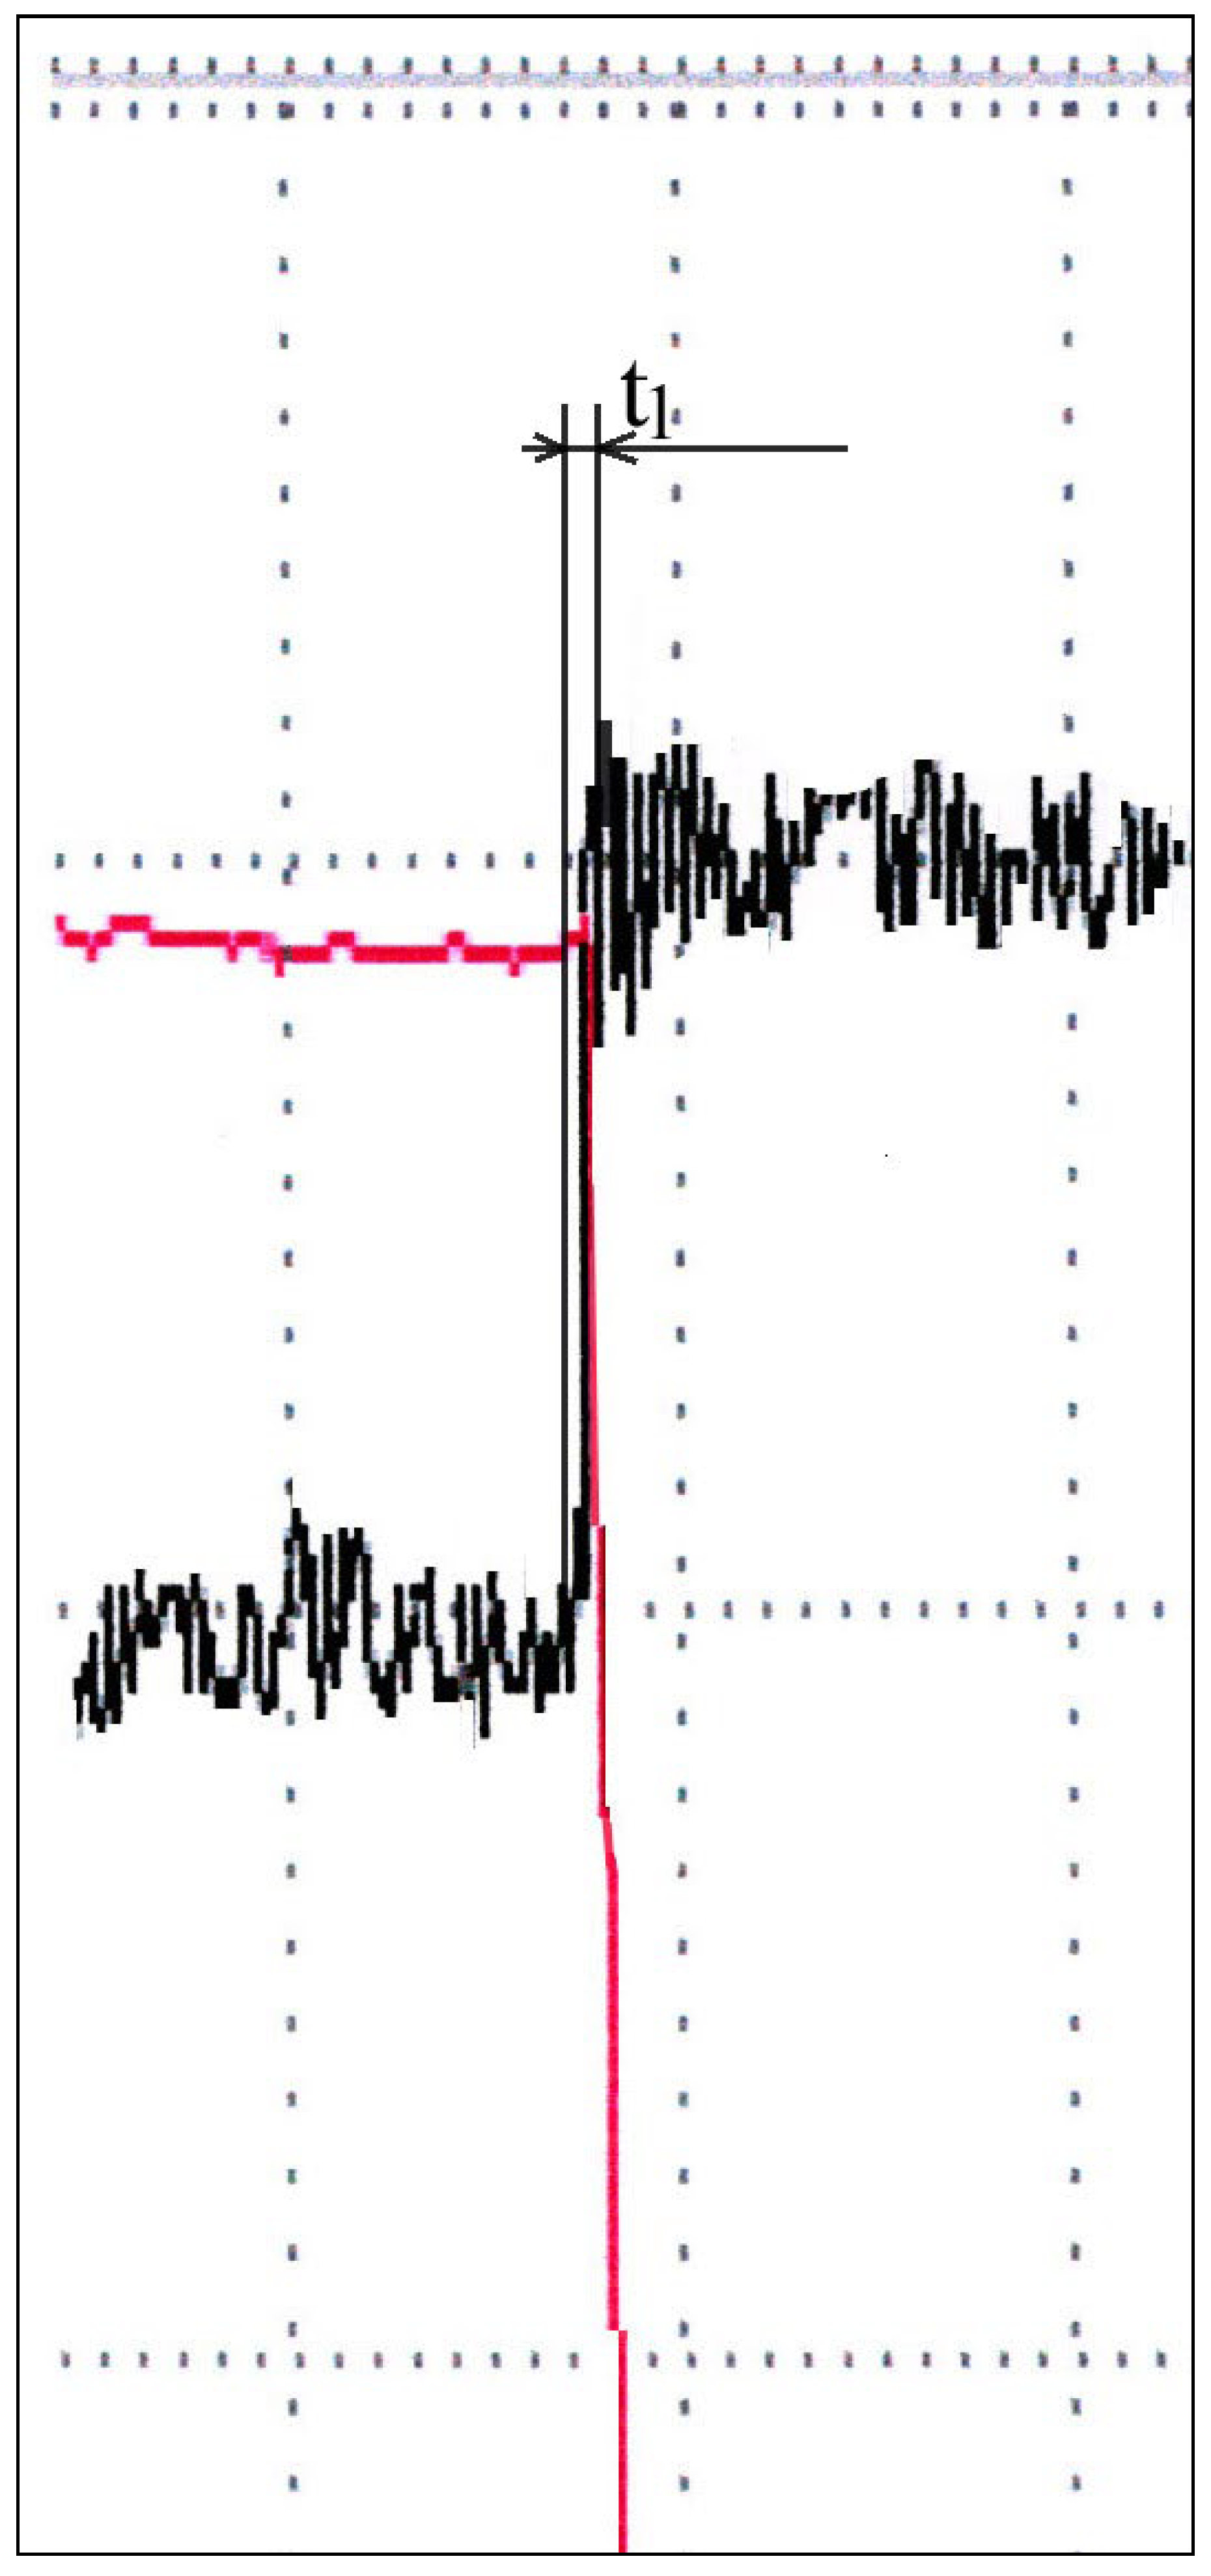
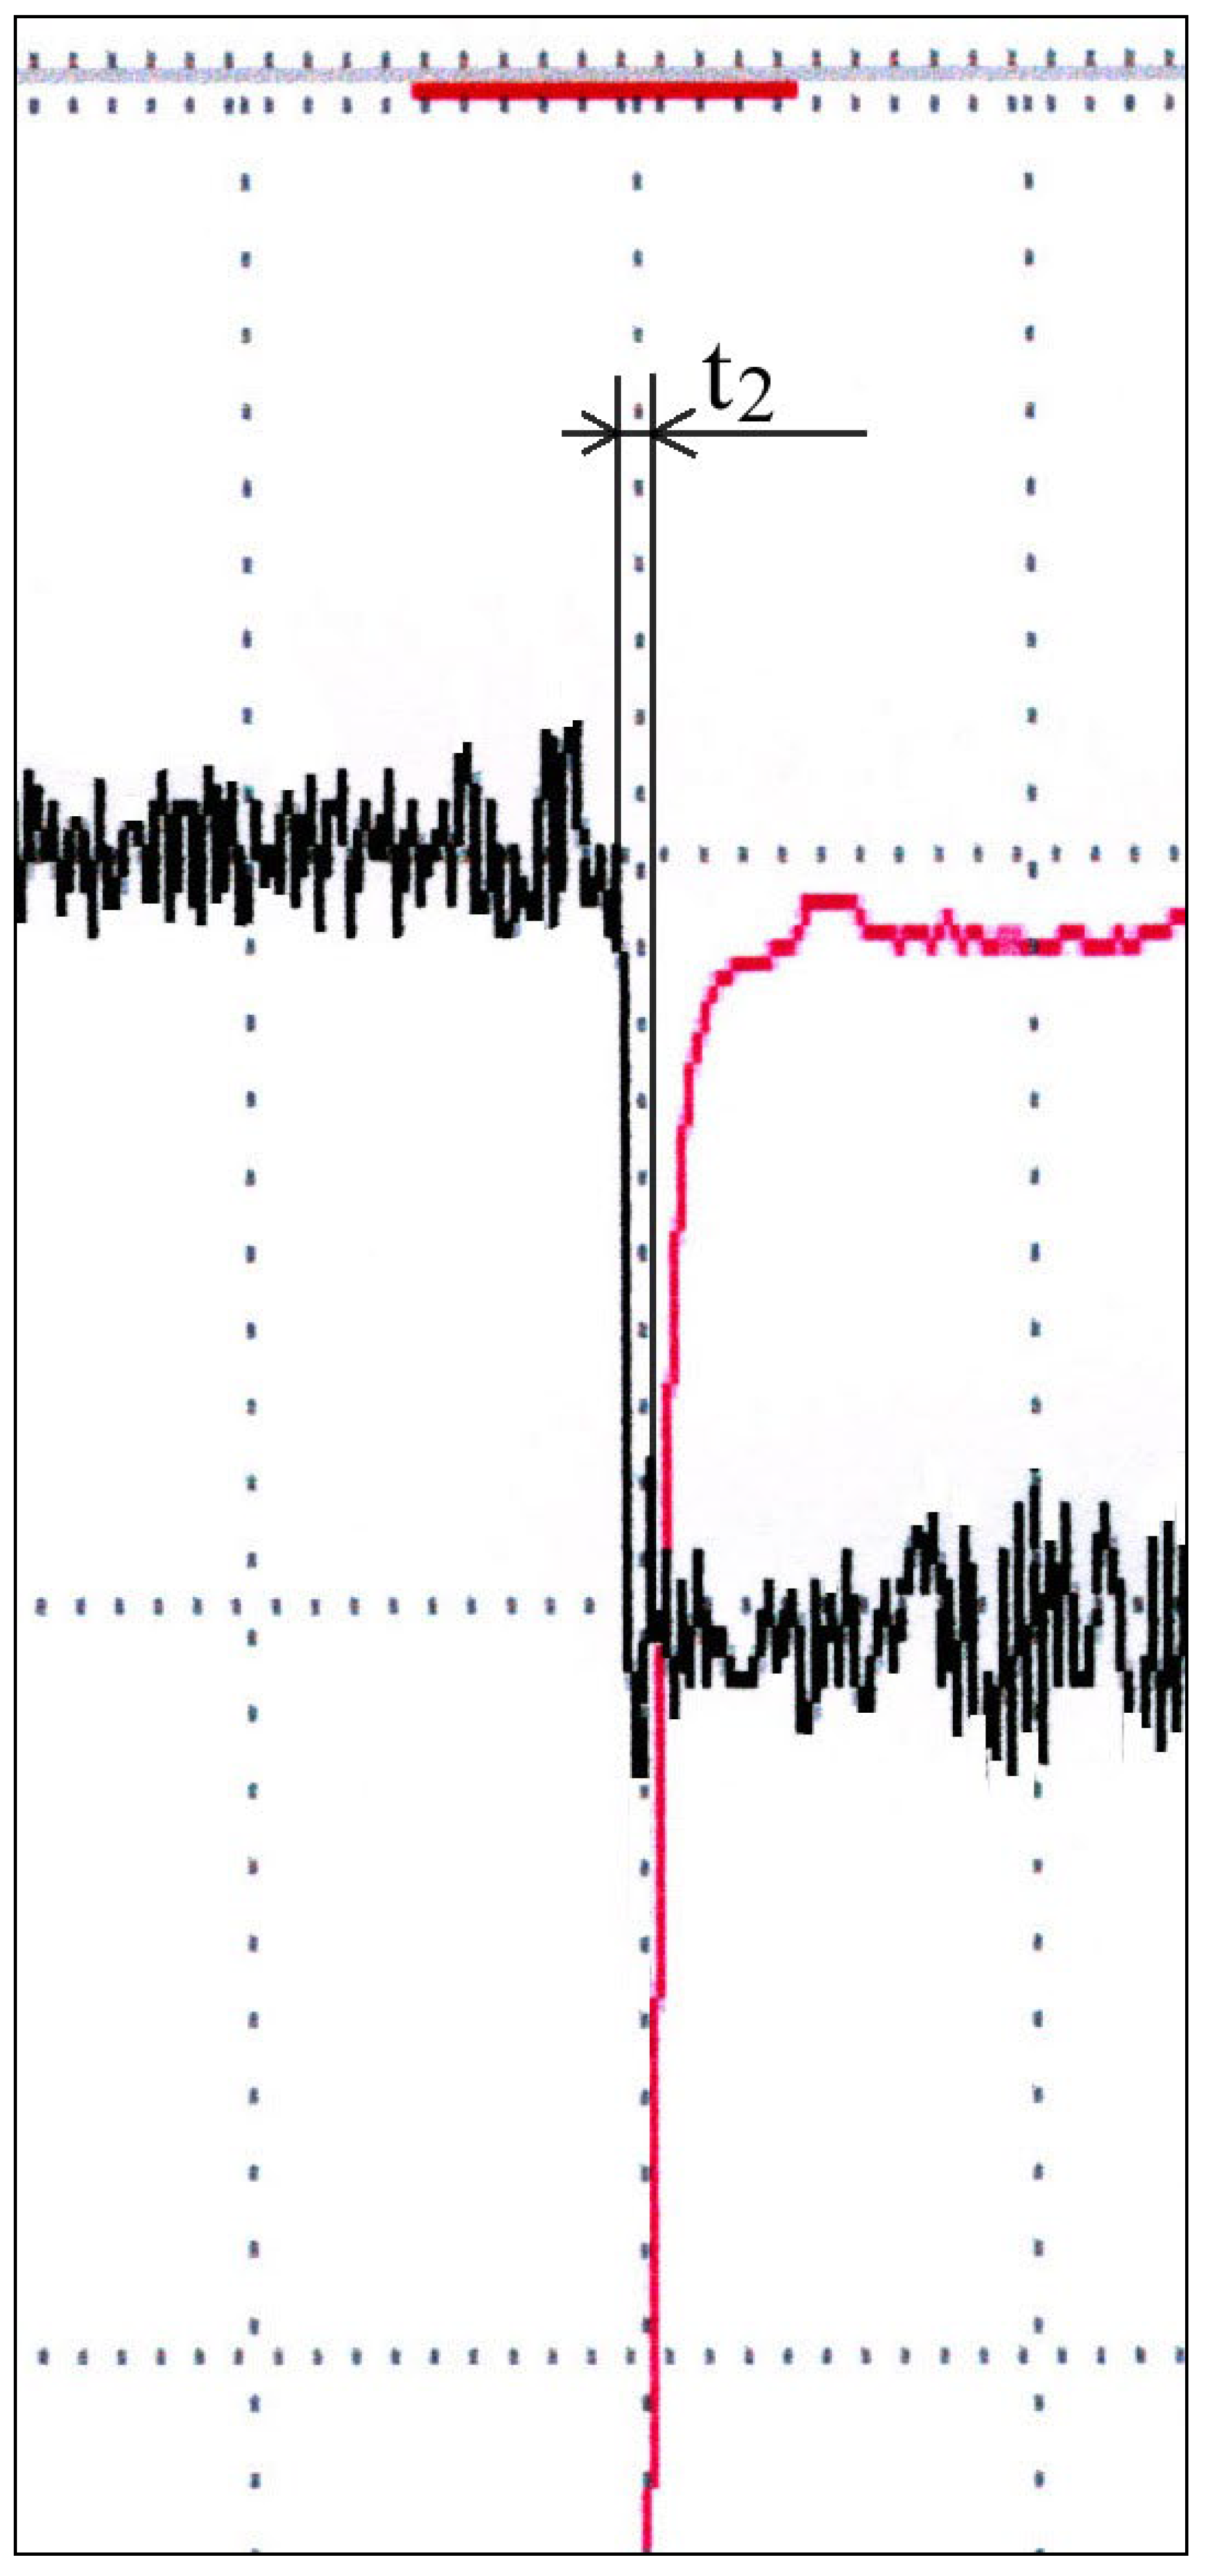
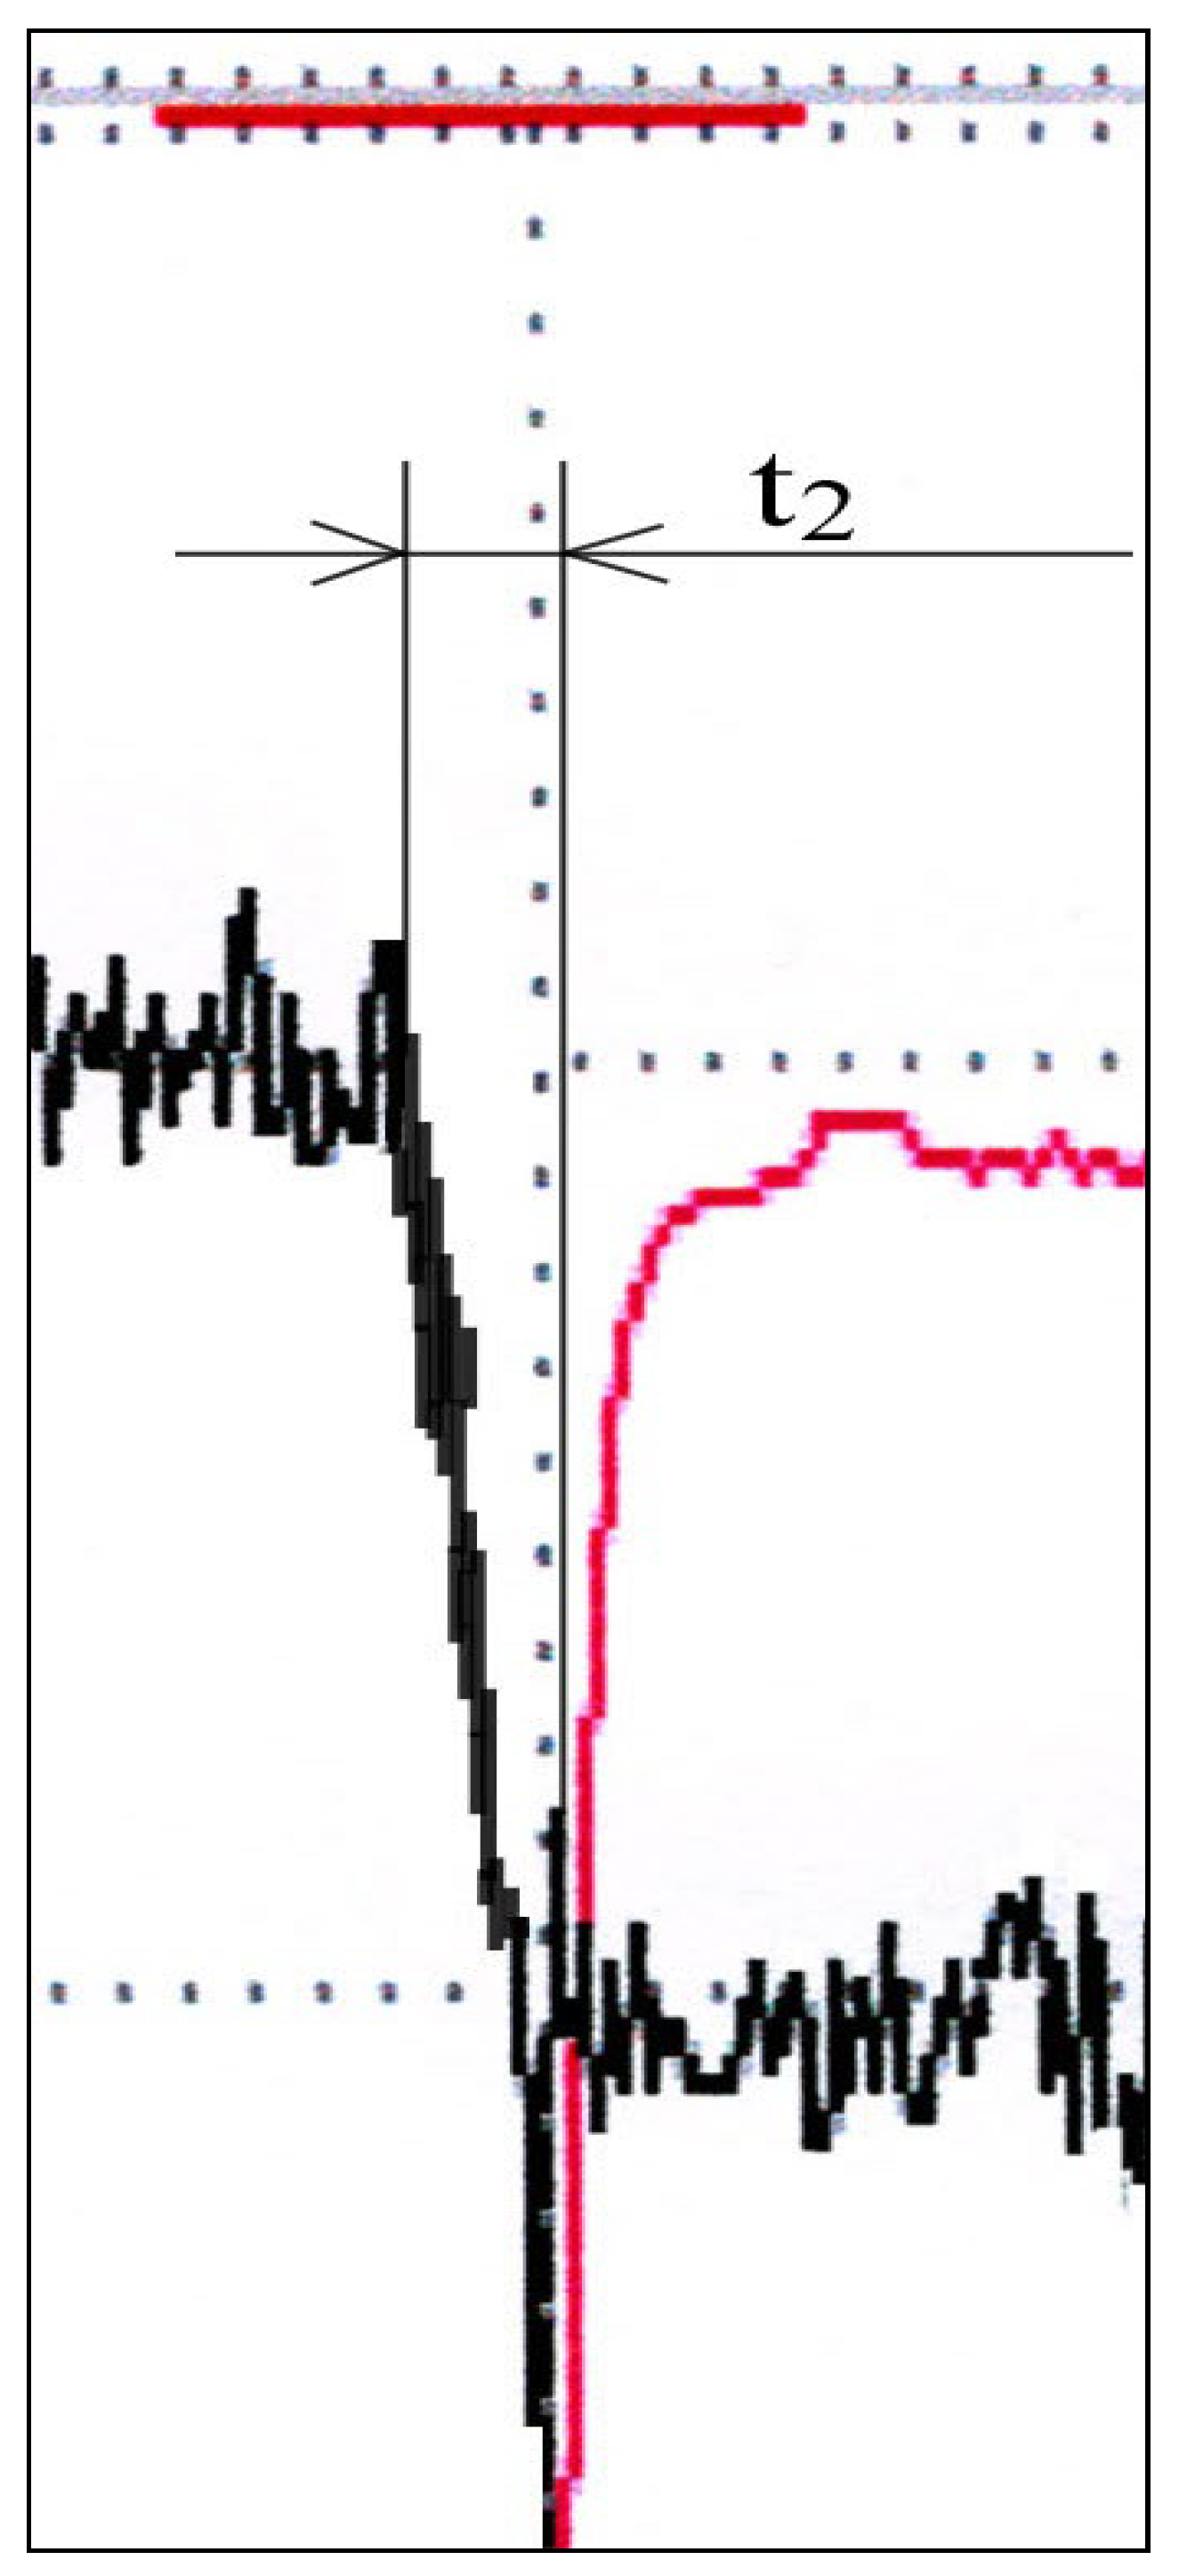
In
Figure 8. and
Figure 9 shows significantly enlarged details of the transition process in the first and second cases. Time constants
t1 and
t2 were read from the diagram and they are within the allowed limits, below 50 ms. In this case, the time constant,
t1, is slightly smaller than the time constant
t2, but both are within the required limits.
Figure 7 shows a diagram of the entire flow regulation process with changed pressure jump values. From that diagram, a significantly enlarged part of the diagram that defines more precisely the size of the jump is separated and it amounts to p = 2 MPa above the nominal pressure.
The diagrams in
Figure 8. and
Figure 9. are significantly enlarged details from the diagram in
Figure 7. Magnification was carried out in order to be able to accurately read the considered magnitudes of pressure jump and time constants. By evaluating the size of the time constants, t
1 and t
2, it can be concluded that they have a value below 0.05s, which meets the regulations in that area as well. Also, the size of the jump pressure meets the regulations because it is only 1.2 MPa above the nominal pressure.
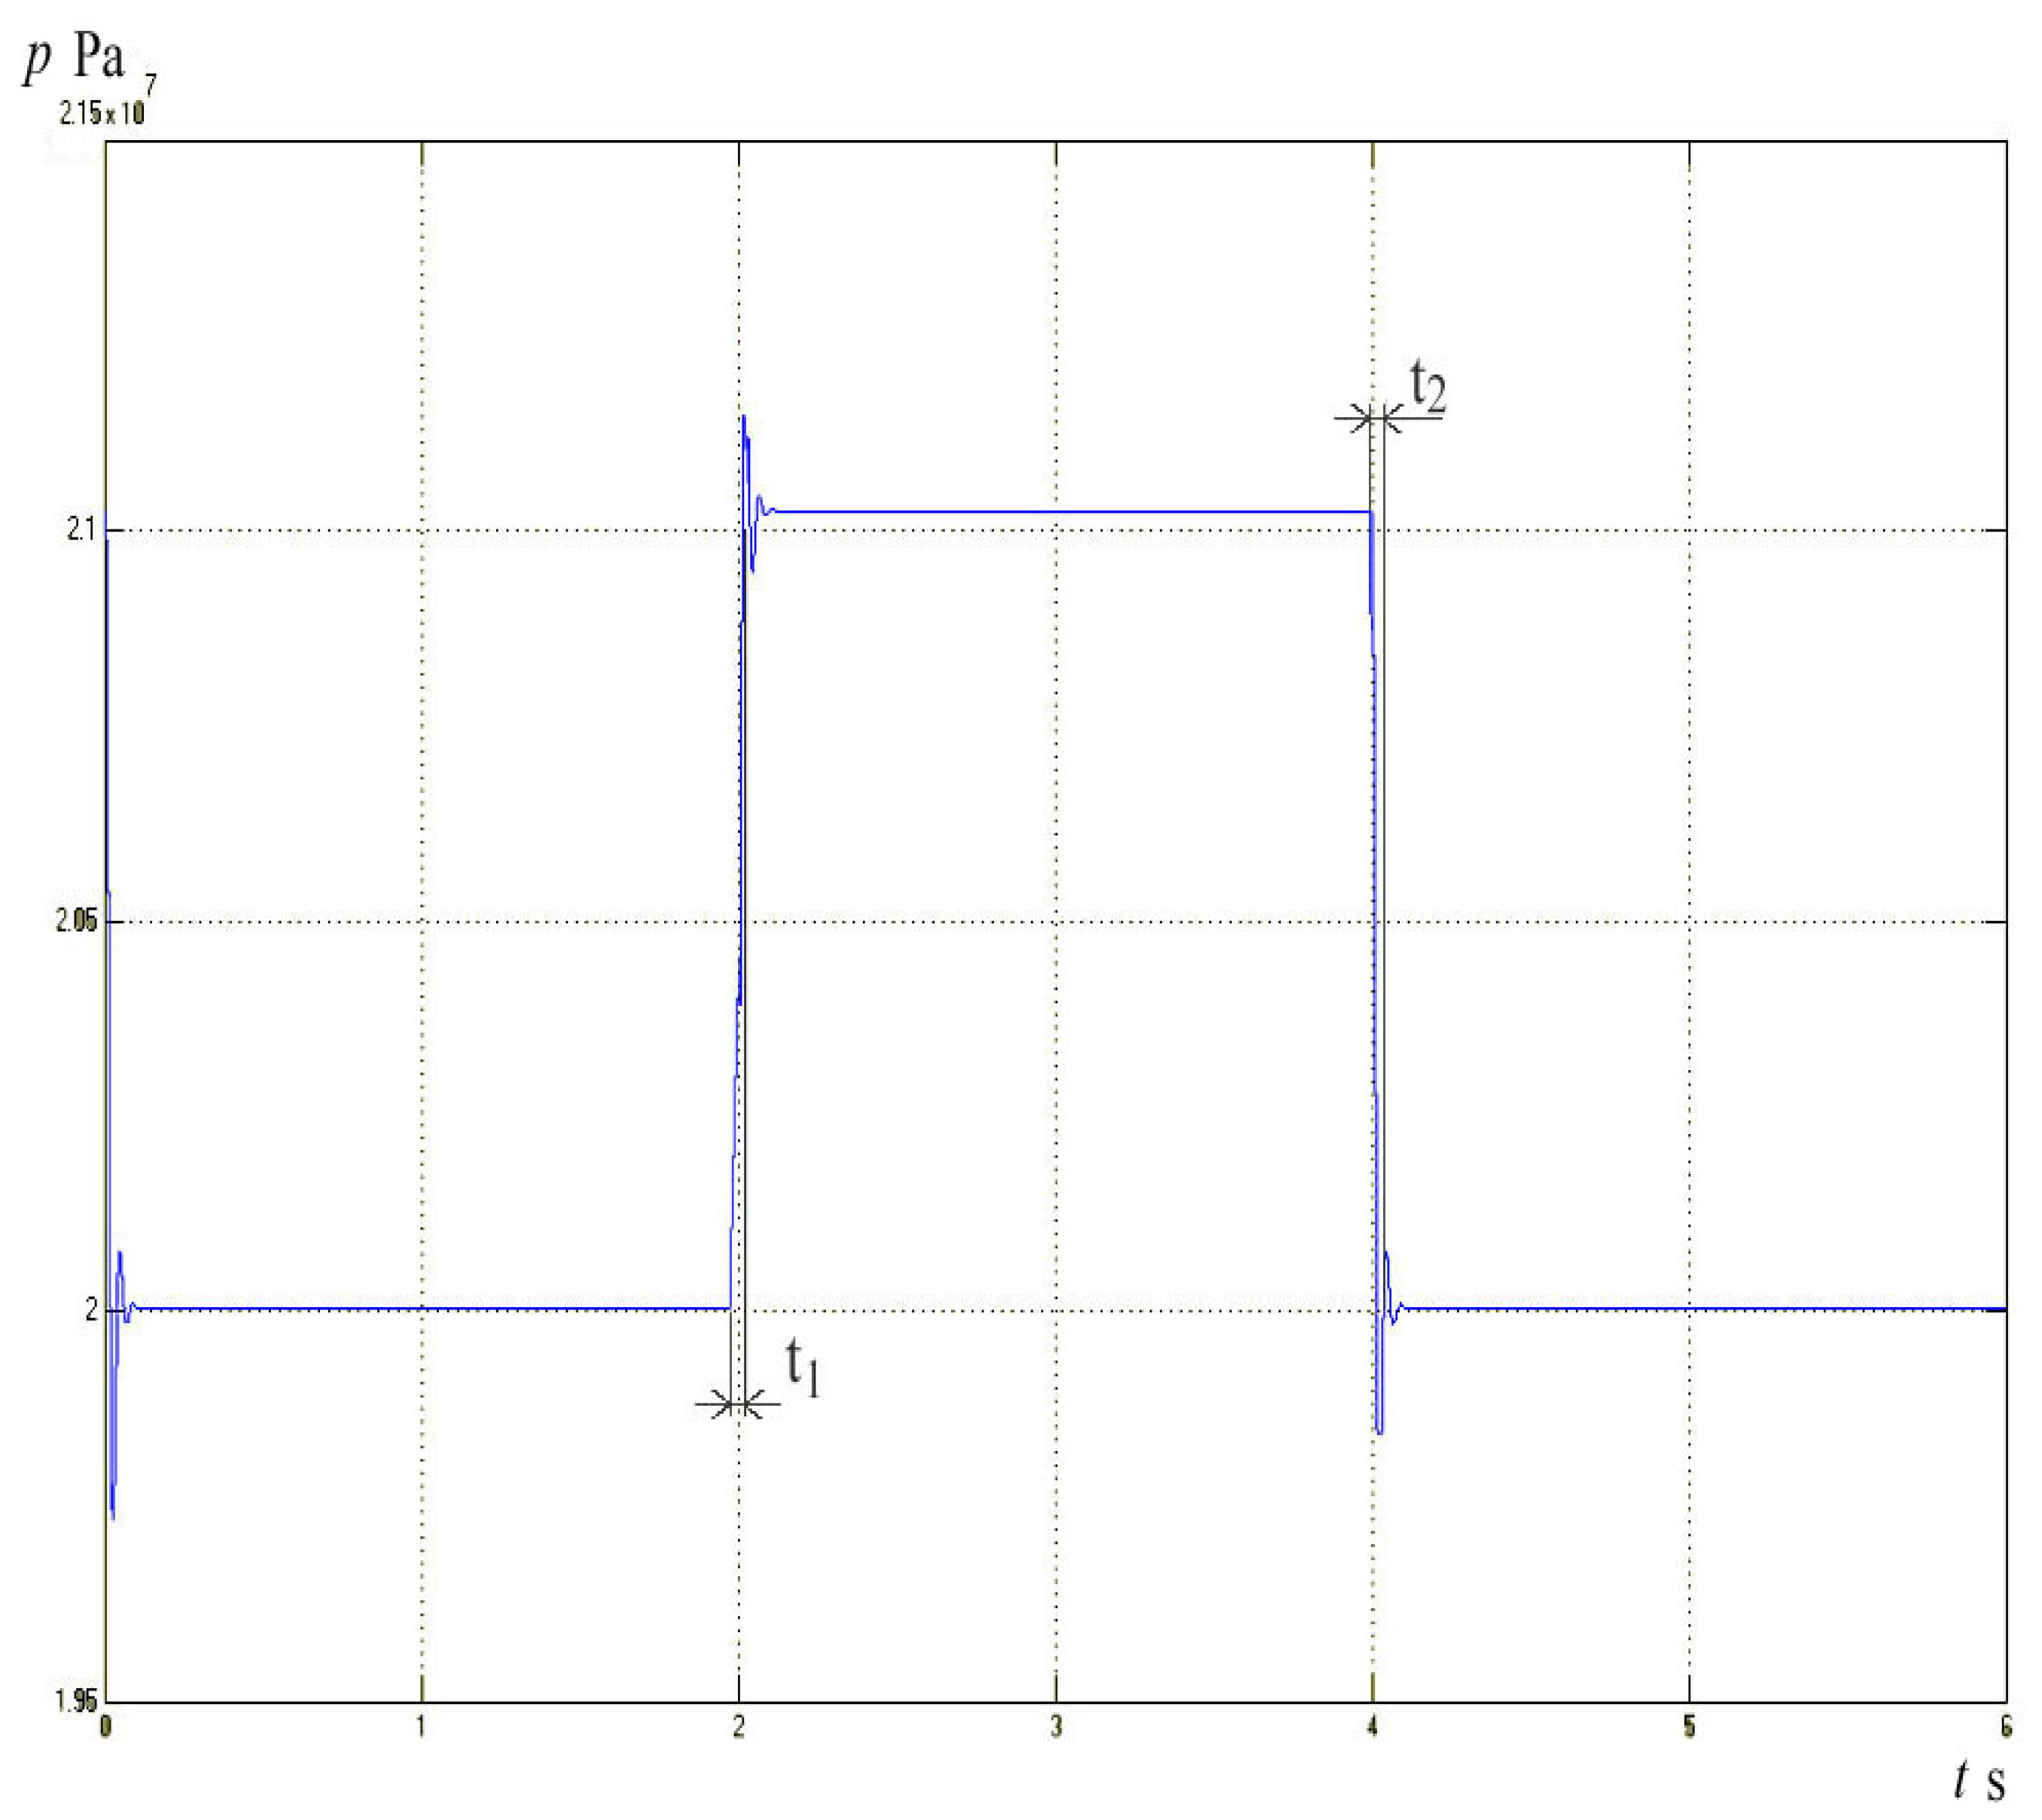
One parameter was changed on the pump, with the aim of correcting the time constant t2. The goal is for the pump to have the smallest possible time constant t2 and its return to full flow in the shortest possible time. This characteristic is important because of the efficient supply of fluid to the hydraulic system.
The stiffness of the spring of the reactive piston significantly affects the transition process of the pump from the mode of minimum flow and maximum pressure to the mode of nominal flow and nominal pressure. In the experiment, the stiffness of the spring was reduced to. The stiffness of the spring, C2, causes a longer transient process and this increases the time constant.
The change diagram is shown in
Figure 10 and in
Figure 11. the right side of the diagram is shown greatly enlarged in order to read the time constant,
t2, which is
t2 = 0.2s.
The experiments mainly included tests of dynamic characteristics such as dynamic processes of transient phenomena and changes during flow regulation. The mentioned characteristics are extremely important for application on hydro systems of aircraft, considering that these systems have extremely fast processes.
Conclusions
This study provides a comprehensive analysis of the dynamic behavior of hydraulic pumps with constant pressure and variable flow, specifically focusing on the determination of pressure jump dependence and time constants. The findings contribute to a deeper understanding of the pump’s response characteristics under varying load conditions, which has direct implications for optimizing hydraulic system performance in real-world applications.
Key insights gained from this research include:
1. Pressure Jump Dependence: The results highlight that pressure jumps in constant pressure pumps are primarily influenced by the rate of flow change and the system's control dynamics. A significant relationship was observed between pressure spikes and flow transitions, underscoring the importance of precise control mechanisms to minimize pressure oscillations, which can otherwise lead to system instability or component fatigue.
2. Time Constants: The identification of time constants in the pump’s response behavior offers valuable data for tuning control systems. The ability of the pump to rapidly adjust its flow rate while maintaining constant pressure demonstrates its suitability for high-demand applications where swift response times are crucial. However, the time constants measured in this study suggest that system designers must account for slight delays to optimize performance, especially in applications with strict timing requirements.
3. Practical Implications: The findings have broad applications in industries where hydraulic pumps are used, such as in manufacturing, aerospace, and automotive sectors. Understanding the dynamic pressure and flow relationships enables engineers to design more robust hydraulic systems, improve energy efficiency, and reduce the wear and tear caused by pressure surges. This knowledge can be further applied to the development of more advanced control algorithms for pressure and flow regulation, enhancing the performance of pumps in variable-flow applications.
4. Recommendations for Future Work: To expand upon this research, future studies could explore the effect of fluid properties, varying environmental conditions (temperature, viscosity), and different control strategies on pressure jump behaviors and time constants. Additionally, the integration of advanced sensors and real-time monitoring systems would allow for more precise measurements and control in high-speed applications.
In conclusion, this study’s findings contribute to the applied science of fluid power systems by offering quantifiable data on the dynamic performance of hydraulic pumps with constant pressure and variable flow. This knowledge can serve as a foundation for improving the reliability, efficiency, and longevity of hydraulic systems across a wide range of industrial applications.
References
- Wei, J.; Guo, K.; Fang, J.; Tian, Q. Nonlinear supply pressure control for a variable displacement axial piston pump. Proc. Inst. Mech. Eng. Part I: J. Syst. Control Eng. 2015, 229, 614–624. [CrossRef]
- Castañeda, L.A.; Luviano-Juárez, A.; Chairez, I. Robust trajectory tracking of a delta robot through adaptive active disturbance rejection control. IEEE Trans. Control Syst. Technol. 2015, 23, 1387–1398. [CrossRef]
- Wang, S.P.; Tomovic, M.; Liu, H. Commercial Aircraft Hydraulic System; Shanghai Jiao Tong University Press: Shanghai, China, 2015; pp. 186–190.
- Ouyang, X.-P.; Li, L.; Fang, X.; Yang, H.-Y. Dynamic characteristics of dual-pressure switch for aircraft piston pump. J. Zhejiang Univ. (Eng. Sci.) 2016, 50, 397–404.
- Willkomm, J., Wahler, M., and Weber, J., “Model Predictive Control of Speed-Variable Variable-Displacement Pumps to Optimize Energy Efficiency,” Proc. of 9th International Fluid Power Conference, Vol. 1, pp.372–385, 2014.
- Kwon, Y.-C. and Hong, Y.-S., “Hybrid Control of the Swash Plate- Type Variable Displacement Hydraulic Piston Pump for an EHA,” Journal of the Korean Society for Aeronautical & Space Sciences, Vol. 41, No. 4, pp. 291–298, 2013. [CrossRef]
- Kemmetmüller, W., Fuchshumer, F., and Kugi, A., “Nonlinear Pressure Control of Self-Supplied Variable Displacement Axial Piston Pumps,” Control Engineering Practice, Vol. 18, No. 1, pp. 84–93, 2010. [CrossRef]
- Axin, M., Eriksson, B., and Krus, P., “A Hybrid of Pressure and Flow Control in Mobile Hydraulic Systems,” Proc. of 9th International Fluid Power Conference (IFK), Vol. 1, pp. 190–201, 2014.
- Lovrec, D. and Ulaga, S., “Pressure Control in Hydraulic Systems with Variable or Constant Pumps?” Experimental Techniques, Vol. 31, No. 2, pp. 33–41, 2007.
- Lovrec, D., Kastrevc, M., and Ulaga, S., “Electro-Hydraulic Load Sensing with a Speed-Controlled Hydraulic Supply System on Forming-Machines,” The International Journal of Advanced Manufacturing Technology, Vol. 41, No. 11-12, pp. 1066–1075, 2009. [CrossRef]
- Xu, M., Jin, B., Chen, G., and Ni, J., “Speed-Control of Energy Regulation based Variable-Speed Electrohydraulic Drive,” Journal of Mechanical Engineering, Vol. 59, No. 7-8, pp. 433–442, 2013. [CrossRef]
- Banaszek, A.; Petrovic, R.;Andjelkovic, M.;Radosavljevic, M. Conceptof Efficiency of a Twin-Two-Pump Hydraulic Power Pack with Pumps Equipped in Constant Pressure Regulators with Different Linear Performance Characteristics.Energies2022, 15, 8100. [CrossRef]
- Todić,N.;Savić,S.;Gordić,D.;Petrović,R.ExperimentalResearchoftheHydrodynamicProcessesofanAxialPistonWaterHydraulicPump.Machines2022,10,728. [CrossRef]
- Huang, B.; Wang, S.; Meng, Y.; Shi, J. Energy-saving optimization for intelligent pumps based on performance reliability restriction. J. Beihang Univ. 2013, 4, 559–563.
- Lu, L.; Tang, Z.; Li, H.; Pei, Z. Fuzzy PID control of intelligent pump. In Proceedings of the 2011 International Conference on IEEE Fluid Power and Mechatronics (FPM), Beijing, China, 17–20 August 2011; pp. 803–808.
- Song, X.D.; Yao, X.X.; Gong, Z.B. Model reference adaptive control for variable pressure pumping source. J. Beijing Inst. Technol. 2011, 31, 944–948.
- Li, H.; Tang, Z.Y.; Pei, Z.C.; Peng, J. PID control of airbone intelligent pump system. Mach. Tool Hydraul. 2010, 38, 97–98.
- Fiebing, C.; Xiujuan, L.; Smolka, S. Pressure compensator (PC) pressure overshoot analysis and experimental research of an open circuit pump. In Proceedings of the IEEE 2015 International Conference on Fluid Power and Mechatronics (FPM), Harbin, China, 5–7 August 2015; pp. 910–913. [CrossRef]
- Achten, P. Dynamic high-frequency behaviour of the swash plate in a variable displacement axial piston pump. Proc. Inst. Mech. Eng. Part I J. Syst. Control Eng. 2013, 227, 529–540. [CrossRef]
- Manring, N.D.; Mehta, V.S. Physical limitations for the bandwidth frequency of a pressure controlled, axial-piston pump. J. Dyn. Syst. Meas. Control 2011, 133, 061005. [CrossRef]
- Mandal, N.P.; Saha, R.; Mookherjee, S.; Sanyal, D. Pressure compensator design for a swash plate axial piston pump. J. Dyn. Syst. Meas. Control 2014, 136, 021001. [CrossRef]
- Kemmetmüller, W.; Fuchshumer, F.; Kugi, A. Nonlinear pressure control of self-supplied variable displacement axial piston pumps. Control Eng. Pract. 2009, 18, 84–93. [CrossRef]
- Wang, S. Generic Modeling and Control of an Open-Circuit Piston Pump—Part I: Theoretical Model and Analysis. J. Dyn. Syst. Meas. Control 2016, 138, 041004. [CrossRef]
- Wang, S. Generic Modeling and Control of an Open-Circuit Piston Pump—Part II: Control Strategies and Designs. J. Dyn. Syst. Meas. Control 2016, 138, 041005. [CrossRef]
- Koivumäki, J.; Mattila, J. Adaptive and nonlinear control of discharge pressure for variable displacement axial piston pumps. J. Dyn. Syst. Meas. Control 2017, 139, 101008. [CrossRef]
|
Disclaimer/Publisher’s Note: The statements, opinions and data contained in all publications are solely those of the individual author(s) and contributor(s) and not of MDPI and/or the editor(s). MDPI and/or the editor(s) disclaim responsibility for any injury to people or property resulting from any ideas, methods, instructions or products referred to in the content. |
© 2024 by the authors. Licensee MDPI, Basel, Switzerland. This article is an open access article distributed under the terms and conditions of the Creative Commons Attribution (CC BY) license (http://creativecommons.org/licenses/by/4.0/).
