1. Introduction
Material stock (MS) is one of the key processes driving economic growth [
1]. However, the accompanying issues such as resource depletion and energy shortage are becoming increasingly severe [
2]. Currently, the sustainable management of material resources, including their flows and stocks, has become a focal point of the UN 2030 Sustainable Development Goals (SDGs) [
3]. In particular, research on the MS of infrastructure, which is characterized by large volumes, a multiple of resources involved, and high energy consumption, has become a hotspot in this field in recent years [
4]. Understanding material use and stockpiling optimizes resource management, reduces waste, and supports a circular economy. It also improves lifespan prediction, ensuring urban development is efficient, sustainable, and resilient [
5].
1.1. Material Metabolism and Infrastructure Stock
The MS in society, a term in Industrial Ecology, refers to the anthropogenic materials in durable products and infrastructures that possess socio-economic output functions and can provide services for people’s daily living and production activities [
6]. Estimates of MS have been conducted for over 70 years. The foundational study can date back to the 1950s when Harrison quantified the steel stock in the United States [
7]. Since 2000, increasing attention has been given to the accumulation of urban stocks from the perspective of urban metabolism [
8,
9]. These studies all focus on the vast transfer of materials from the lithosphere to the anthroposphere, forming buildings, infrastructure, and durable goods with long life cycles [
10,
11]. In the past two decades, the study of MS has witnessed a remarkable boom. Over 70% of the studies have been published during this period, with significant expansions in research scope and approaches [
6,
12].
Table 1 shows the general background of the infrastructure material metabolism according to the objects, methods, and aims of the studies.
Copper, aluminum, steel, and other common metal substances have consistently been the focus of research [
13,
14]. There are also a growing number of studies focusing on non-metallic material stocks, such as nitrogen and phosphorus in the food supply chain, and PVC and cement in the construction process [
15,
16]. Furthermore, there is a shift from merely calculating and analyzing the characteristics and composition of MS. Instead, recent research increasingly focuses on quantitatively linking material stock (MS) studies to life cycle environmental impacts and socio-economic factors. This approach explores the driving forces within the Social-Economic-Natural Complex Ecosystem, examining the interconnections between MS and these systems [
12,
17,
18,
19]. This shift broadens the scope of analysis, emphasizing a deeper understanding of sustainability and resource efficiency.
However, the availability of data has always been a key issue in urban metabolism research [
20]. Data collection in earlier studies mainly relied on governmental statistics, historical literature, and industrial standards. Due to the strong data-dependent nature, the study areas were typically selected from developed countries and regions with relatively complete statistical data [
21]. In recent years, the continuous innovation and widespread application of GIS, Remote Sensing, and AI technology, combined with advanced industrial databases at different scales in many countries, have effectively enhanced data availability [
22,
23]. Some studies have started to apply LiDAR point cloud and machine learning approaches to rebuild the spatial configuration of MS [
24,
25,
26]. These developments have made it more convenient and feasible to construct a bottom-up framework to examine MS.
1.2. Significance of Studying Island Material Stocks
An island is a geographically isolated system surrounded by water, making it environmentally distinct and enclosed. For coastal countries, the development of islands is crucial for exploiting marine energy and boosting the regional economy [
27]. As fixed assets foster socioeconomic growth, infrastructure plays an indispensable role in meeting islanders' basic needs [
28,
29].
Due to their relatively small land area, many islands face a lack of natural resources. The various metallic and non-metallic materials, including steel, timber, and asphalt, required for infrastructure construction activities are primarily supplied from the mainland. At the end of their lifespan, infrastructure demolition projects tend to generate large amounts of debris. These solid wastes could remain on the island for an extended period due to the relatively inefficient waste management systems, potentially posing risks to the local ecological environment. Therefore, research on the MS of infrastructure on an island not only contributes to assessing the urbanization or industrialization level of the local society and the living standards of islanders, but also holds significant value in evaluating resource utilization, providing case studies, and formulating resource-related policies [
30,
31]. With natural and administrative boundaries aligning, islands offer ideal conditions for material metabolism research. Their geographic isolation, limited resources, and environmental sensitivity make the study of island material stocks both a challenging and essential endeavor. However, studies on this issue are rare [
32].
To better understand island development from a MS perspective and provide policymakers with resource-related decision support, we developed a bottom-up MS accounting model and selected Miao Island, a typical small inhabited island in northern China, as the study area. By analyzing the composition and temporal dynamics of MS across various infrastructures, this research aims to offer life-cycle-based resource management strategies for decision-makers in the context of this isolated island system.
2. Materials and Methods
2.1. Study Area
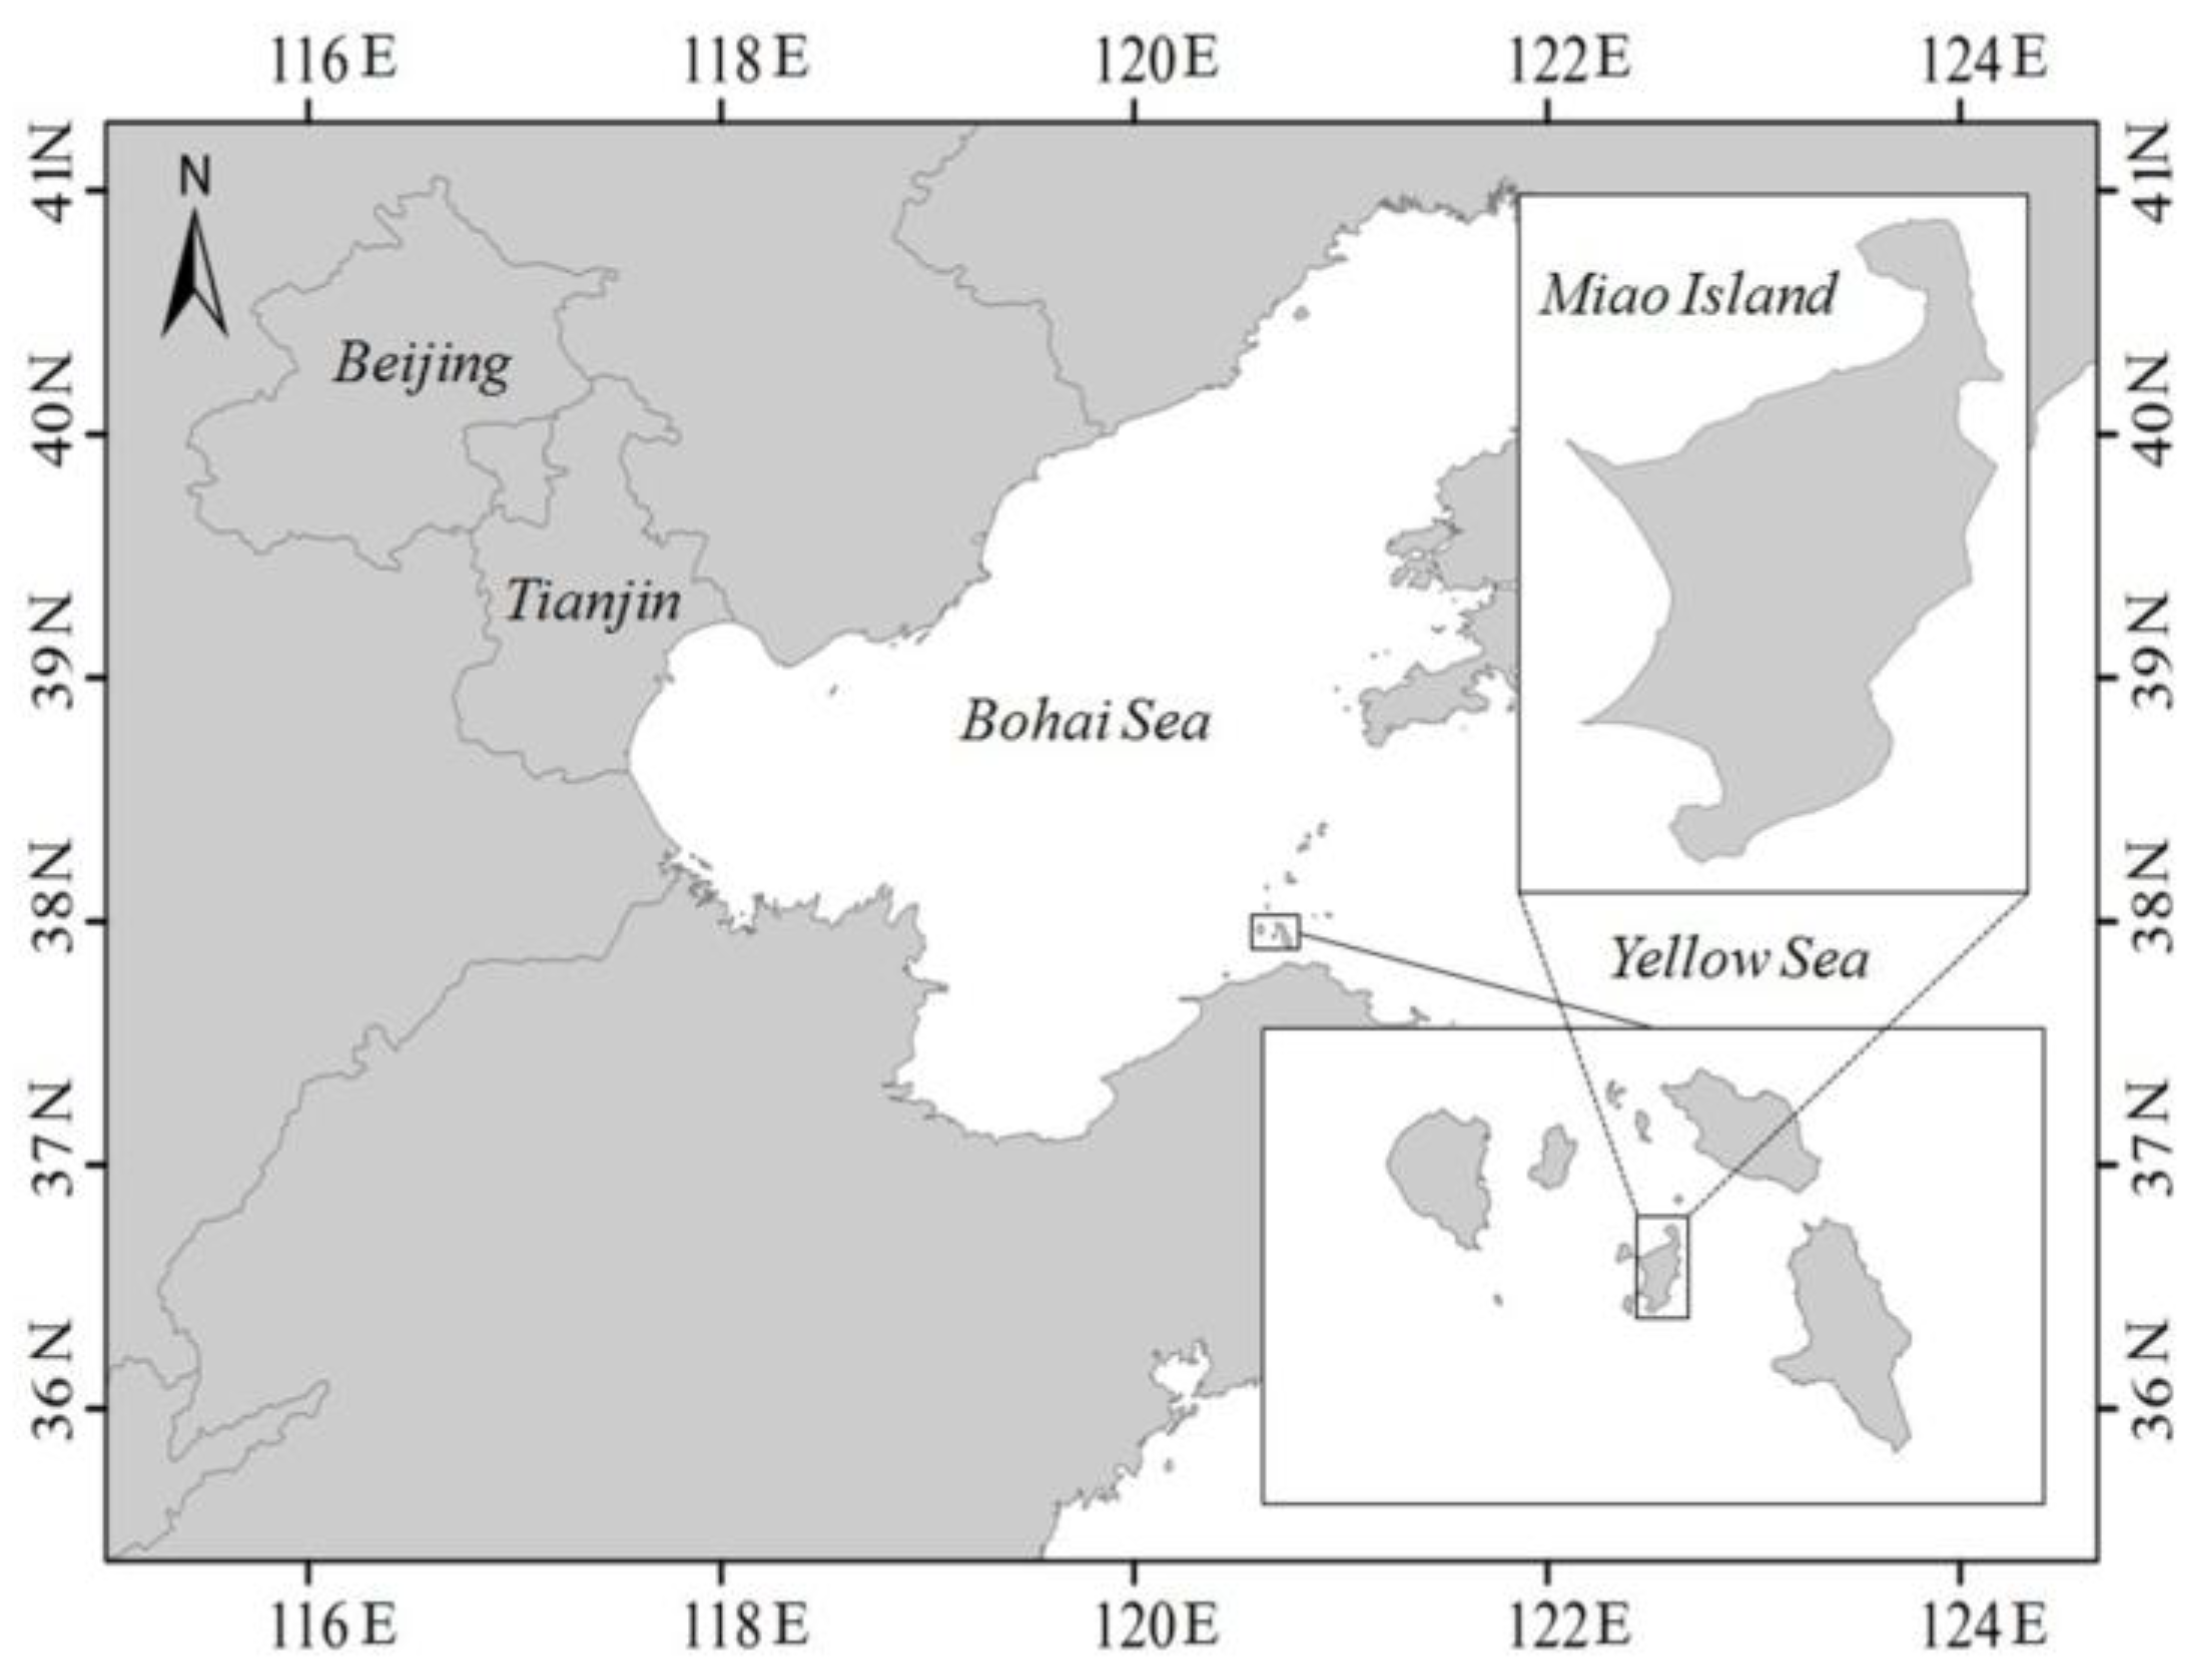
Miao Island is located 12.1 km north of the mainland coastline of Penglai City, Shandong Province (centered at 37°56'N, 120°40'E). It spans an area of 1.5 km2 and has a coastline length of 6.7 km (
Figure 1). The island is part of the Changdao Marine Ecological Civilization Comprehensive Experimental Zone and comprises two administrative villages, located in the northeast and southwest regions of the island. The current permanent population is 448, primarily engaged in aquaculture, fishing, and tourism.
Over the past 30 years, the island's infrastructure has seen significant changes in type, quantity, and scale, following government planning and socioeconomic development. Around 2000, the Chinese government launched the "Large Islands Build, Small Islands Relocate" initiative to move residents from resource-scarce, development-limited small islands to larger islands with better infrastructure and growth opportunities. Miao Island, facing typical island challenges like population decline, stands as a representative inhabited island in northern China.
2.2. MS Classification of Island Infrastructure Based On a Bottom-Up Framework
"Top-down" and "bottom-up" are two general analytical frameworks used in MS studies [
33,
34].
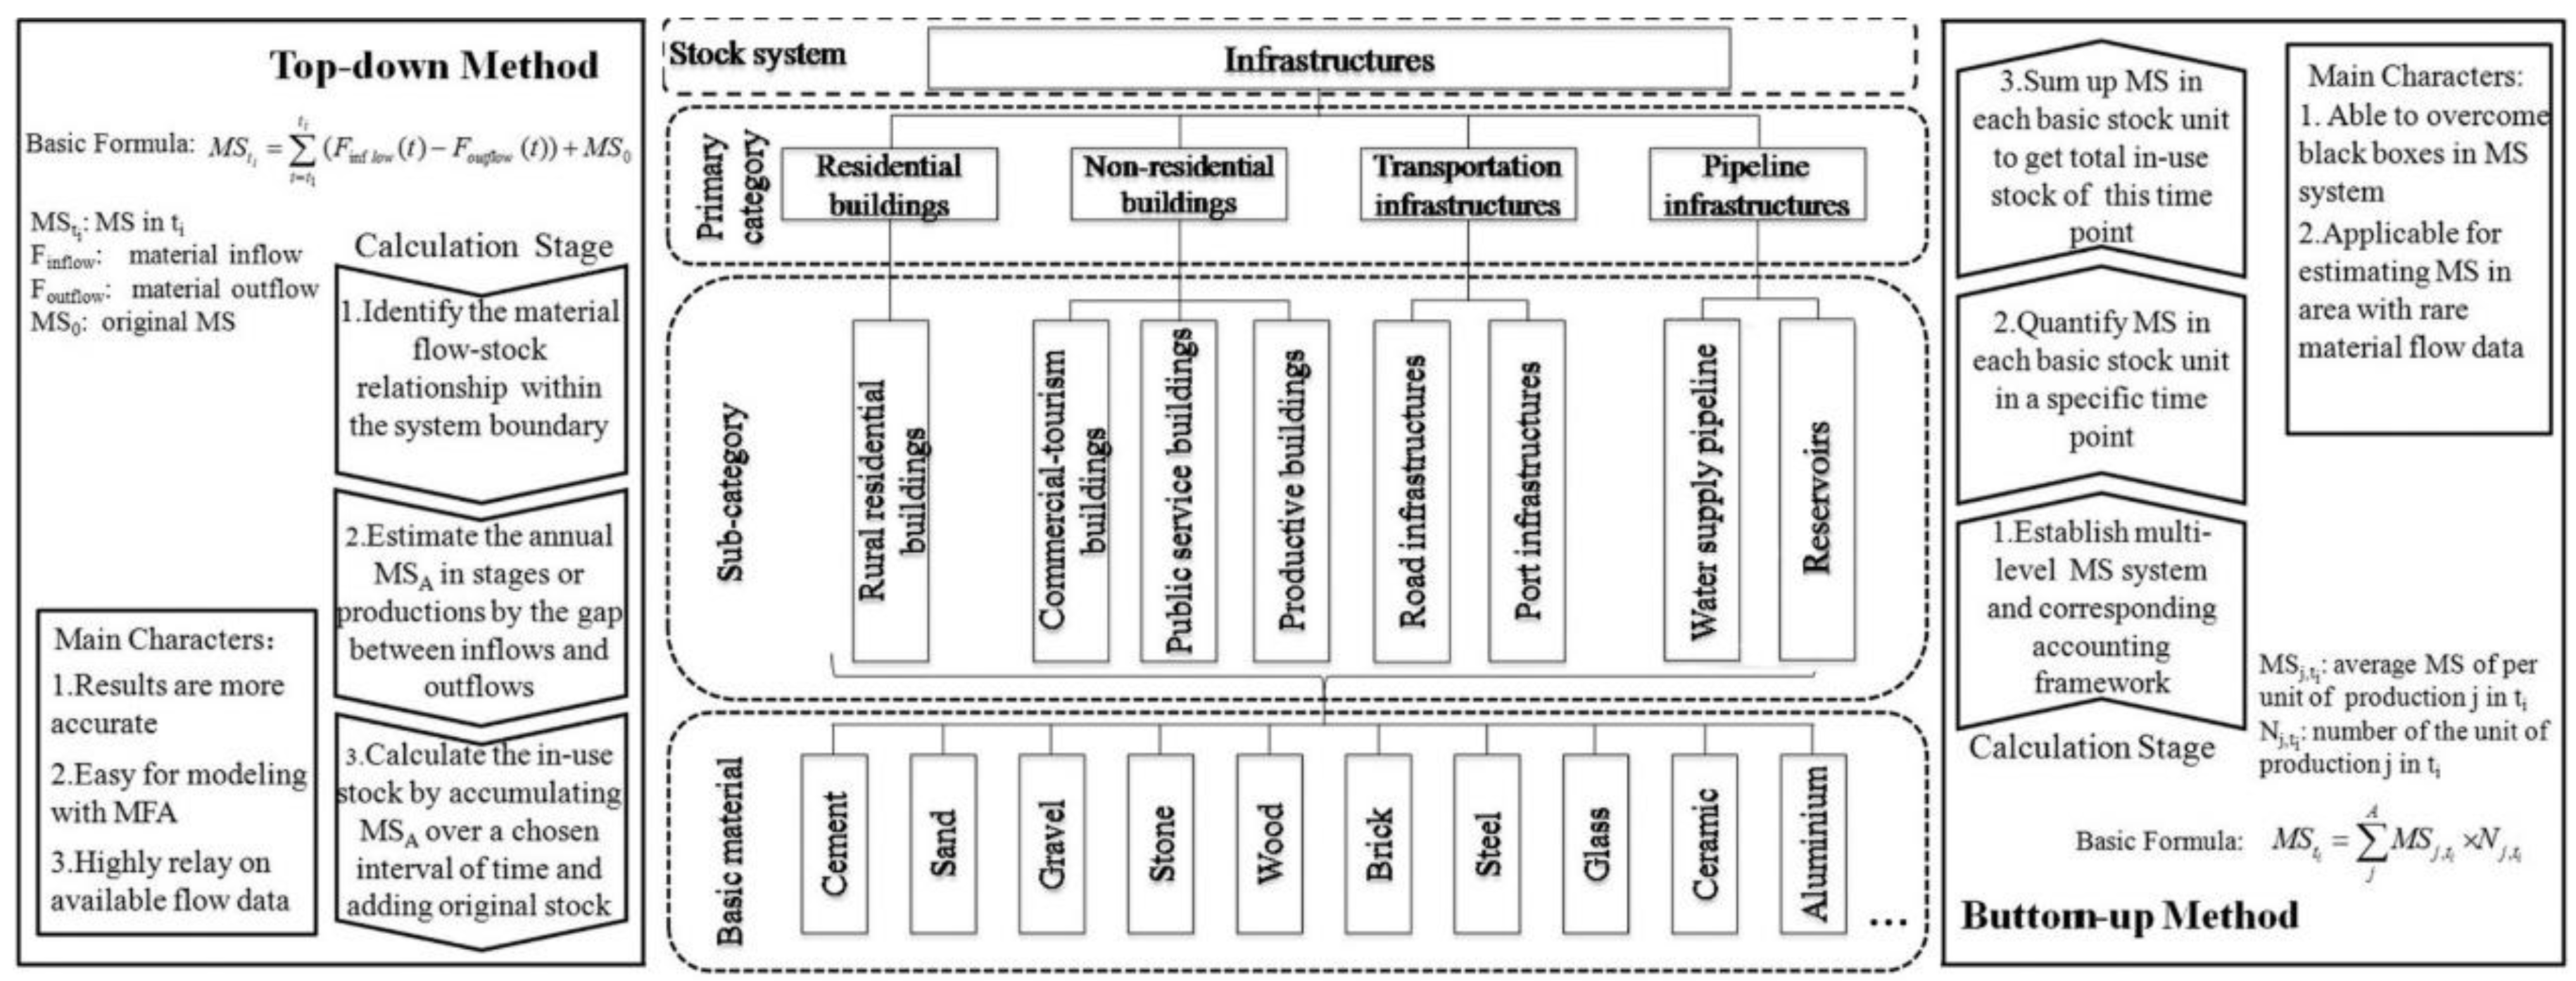
Figure 2 illustrates the characteristics and general steps of them. The top-down approach quantifies material flows by accumulating the differences between inflows and outflows in each specific period [
35]. It is commonly applied in many previous studies in the form of MFA. The bottom-up approach, on the other hand, decomposes a given stock system into multiple sub-units based on different structures or classification systems and calculates the total stock by summing the material quantities of each sub-unit [
36]. This framework is not highly dependent on statistical data but rather relies on industry standards, construction norms, and other GIS/CAD-related sources.
In China, most material flow statistics and input-output data are at the provincial and municipal levels, and there is no material metabolism database or necessary statistical information specifically for islands. The bottom-up approach offers key advantages in material metabolism studies by providing detailed, scalable, and context-specific insights. It enables precise tracking of material flows at micro-levels, which can be aggregated for larger system analyses. Given the actual circumstances, this study adopts a bottom-up approach to assess the MS of infrastructure on Miao Island.
Based on a bottom-up framework, the study analyzed the permanent buildings and infrastructure on the island essential for people's living and production activities. These were categorized into four main categories: residential buildings, non-residential buildings, transportation infrastructure, and pipeline infrastructure.
Residential buildings: Includes bungalows and multi-story buildings;
Non-residential buildings: Classified by function into commercial tourism buildings, public service buildings, and production buildings;
Transportation infrastructure: Includes roads (roadways, pavements, etc.) and port auxiliary facilities (docks, revetments, etc.);
Pipeline infrastructure: Mainly comprises water supply pipes, drainage, and reservoirs.
2.3. Development of an Infrastructure MS Calculation Model
An annual dynamic stock calculation model is developed to reflect temporal variations in MS. Its total formula is shown as Equation 1.
where
MSTotal represents the total MS of all infrastructure within the island, and
MSR,
MSN,
MST, and
MSP are the MS of residential buildings, non-residential buildings, transportation infrastructures, and pipeline infrastructures, respectively.
For infrastructures with complete historical material inventories, we calculate their annual in-use stock by summing the material quantities they contain. For other infrastructures, we use two Material Intensity (MI) methods [
21]:
The dynamic calculation model for each type of infrastructure is detailed in
Table 2.
2.4. Data Collection
Using the MS calculation models, parameters for each type of infrastructure stock on the island were extracted and collected.
The Pleiades satellite's three-view stereo image pair (June 2016, cloud cover <1%) was processed using PCI Geomatica through tie point and ground control point adjustments, and epipolar image creation. From the 0.5 m resolution Digital Orthophoto Map (DOM) and 1 m Digital Surface Model (DSM), infrastructure outlines, heights, volumes, and three-dimensional parameters were extracted.
From 2017 to 2019, four on-site surveys were conducted, collecting 42 questionnaires on infrastructure covering construction time, structure, retrofits, and material consumption. Additionally, inventories for pipeline, road, and dock construction projects from 1980-2020 were provided by the Miao Island Development and Management Office and the Statistics Bureau of Changdao County.
Per unit material intensity of various infrastructures was sourced from field surveys, building codes, engineering cases, literature, and commercial databases (see Supplementary).
3. Results
3.1. Material Flow Analysis of the Island’s Infrastructure
Miao Island’s infrastructure material stock includes residential and non-residential buildings, pipeline, and transportation infrastructure.
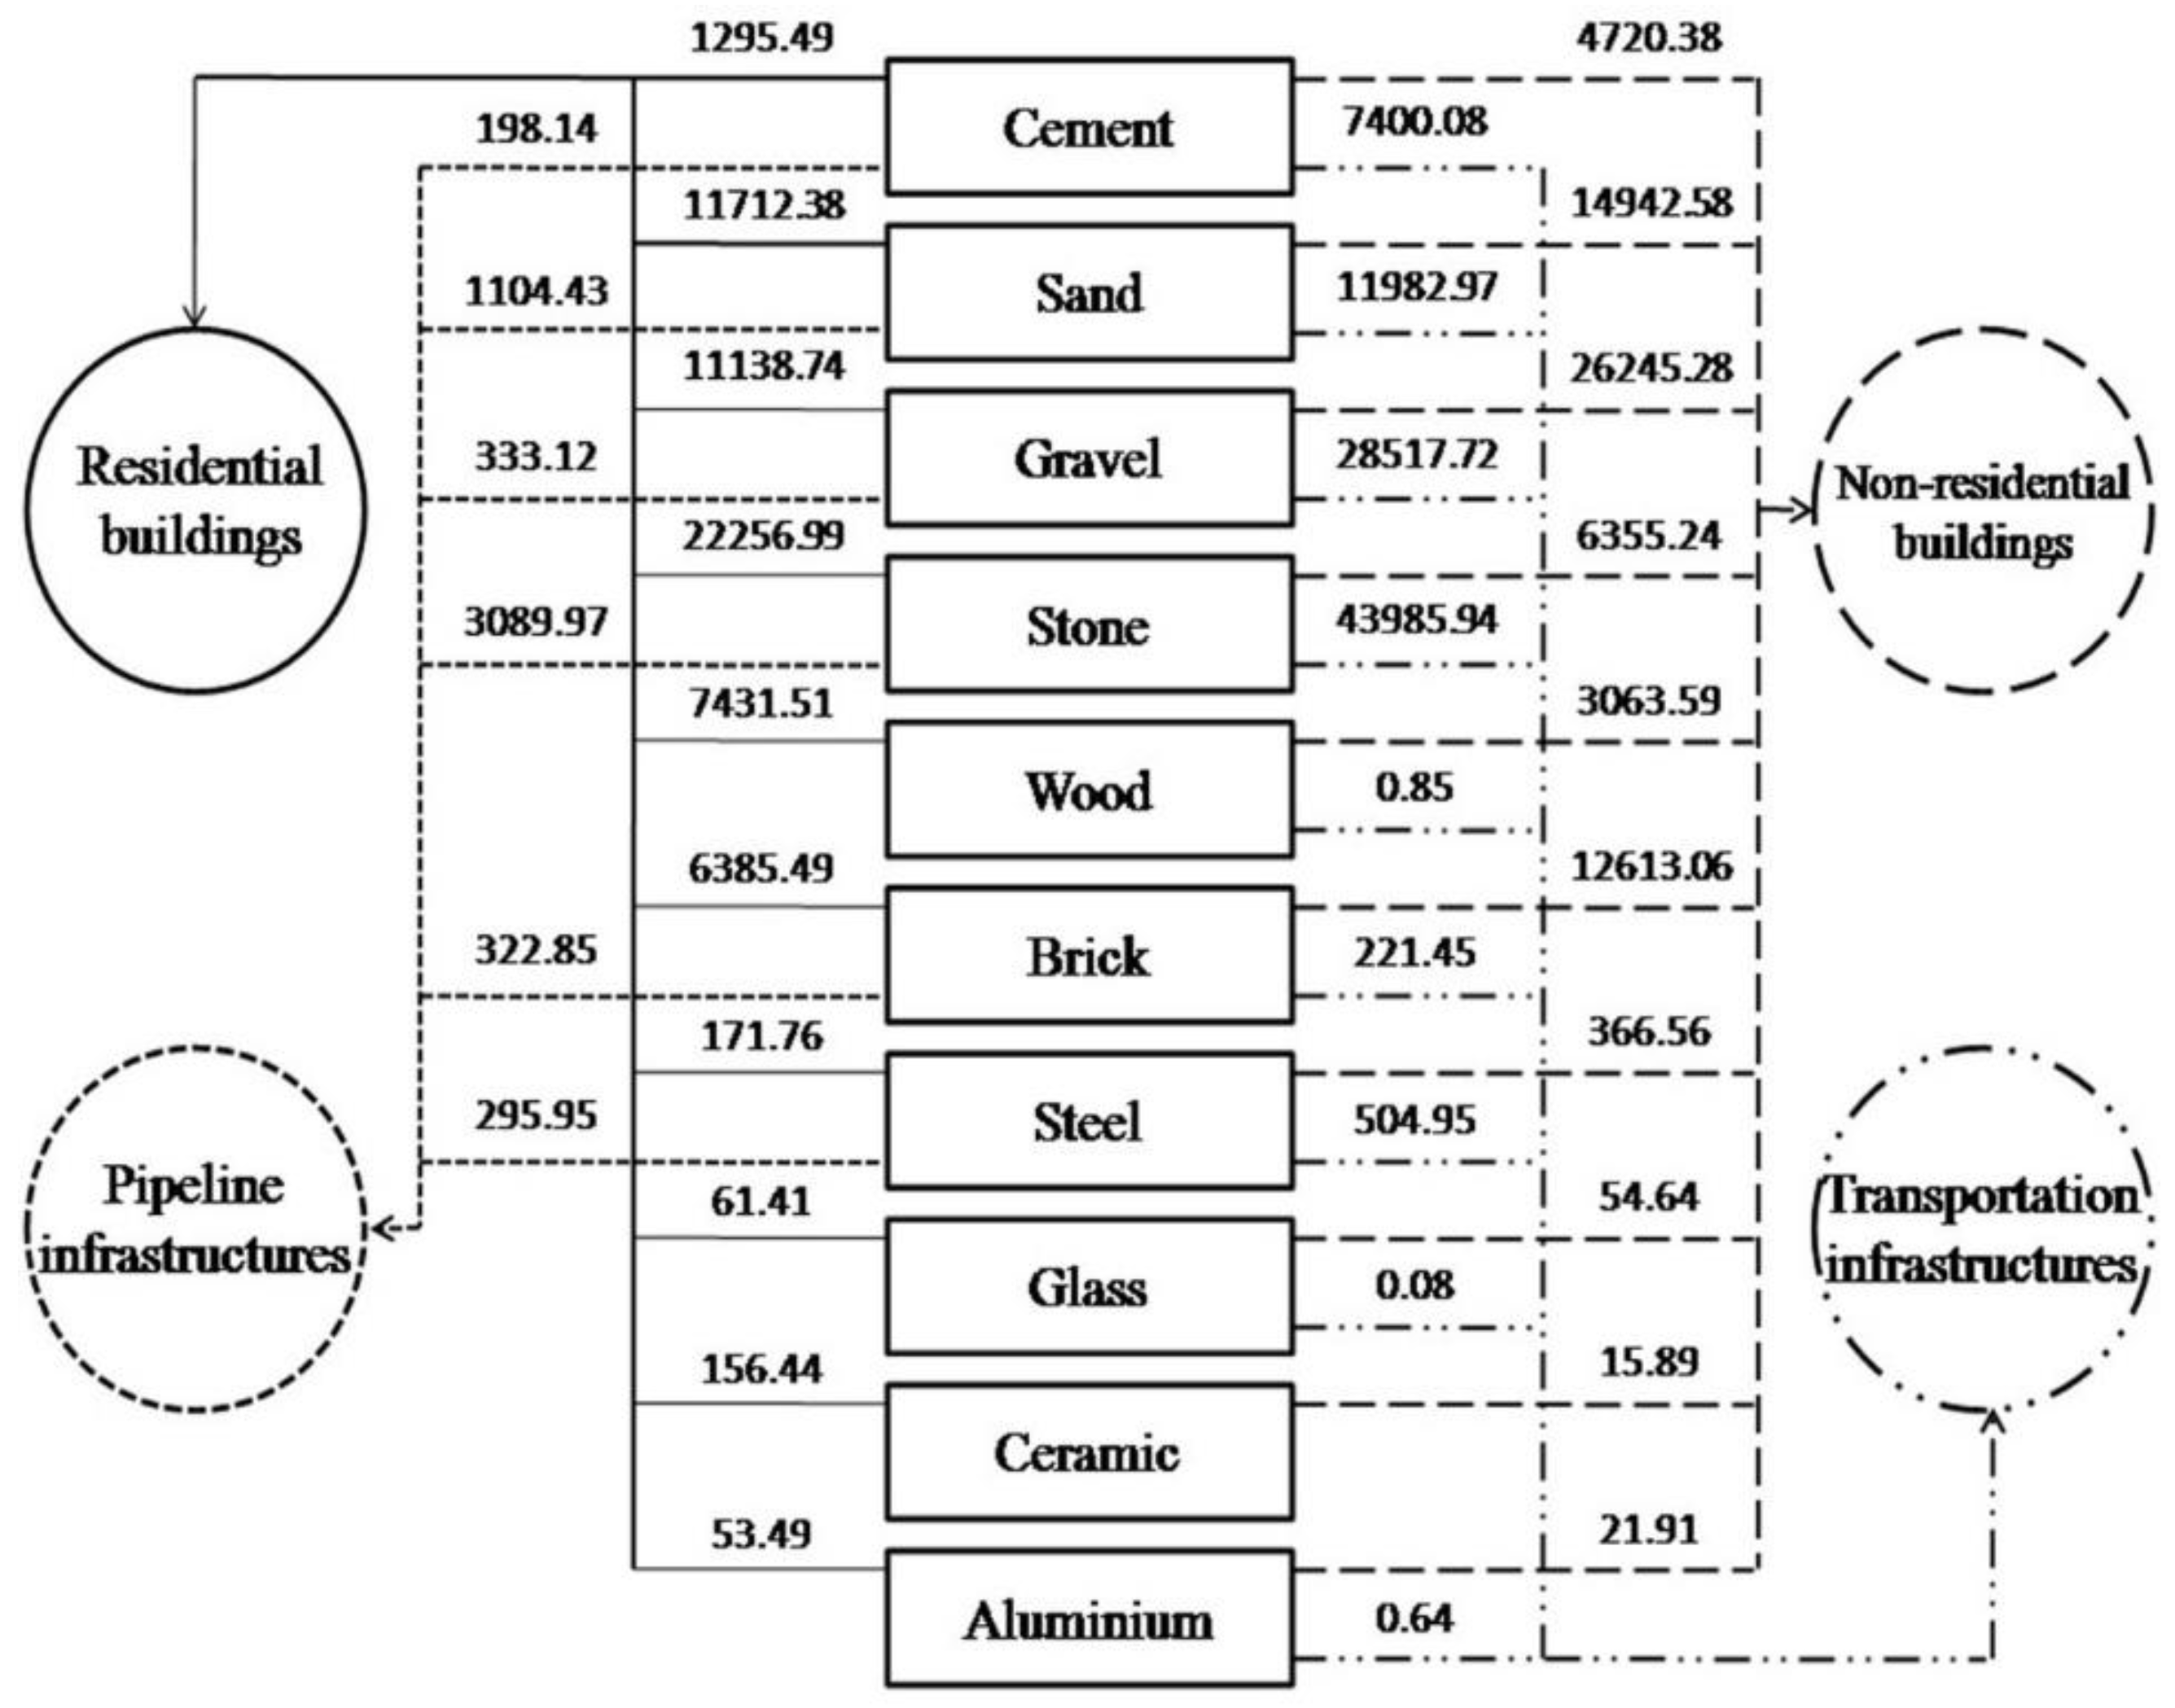
Figure 3 shows that in 2020, the main construction materials were cement, sand, gravel, stone, wood, bricks, steel, glass, ceramics, and aluminum. The stock of these materials varies widely across different building types.
Both residential and non-residential buildings have significant material stocks, with non-residential buildings requiring much more, particularly gravel (26,245.28 t), stone (43,985.94 t), and sand (14,942.58 t). These amounts greatly exceed those of other infrastructure projects. Residential buildings also demand large quantities of stone and gravel, while other materials have smaller, but still notable, stocks. This suggests non-residential buildings, likely large-scale commercial or industrial structures, have a much greater need for resources. Steel (295.95 t) and glass (61.41 t) are mostly concentrated in pipeline infrastructure, reflecting their critical role. In transportation infrastructure, gravel (6,355.24) and sand (4,720.38) are the main materials, with less demand for cement, stone, and wood.
Overall, infrastructure construction shows significant variation in material needs, especially in the consumption of bulk materials like stone and gravel, highlighting a notable imbalance.
3.2. The Material Composition of In-Use Stock
The MS of Miao Island's infrastructure is shown in
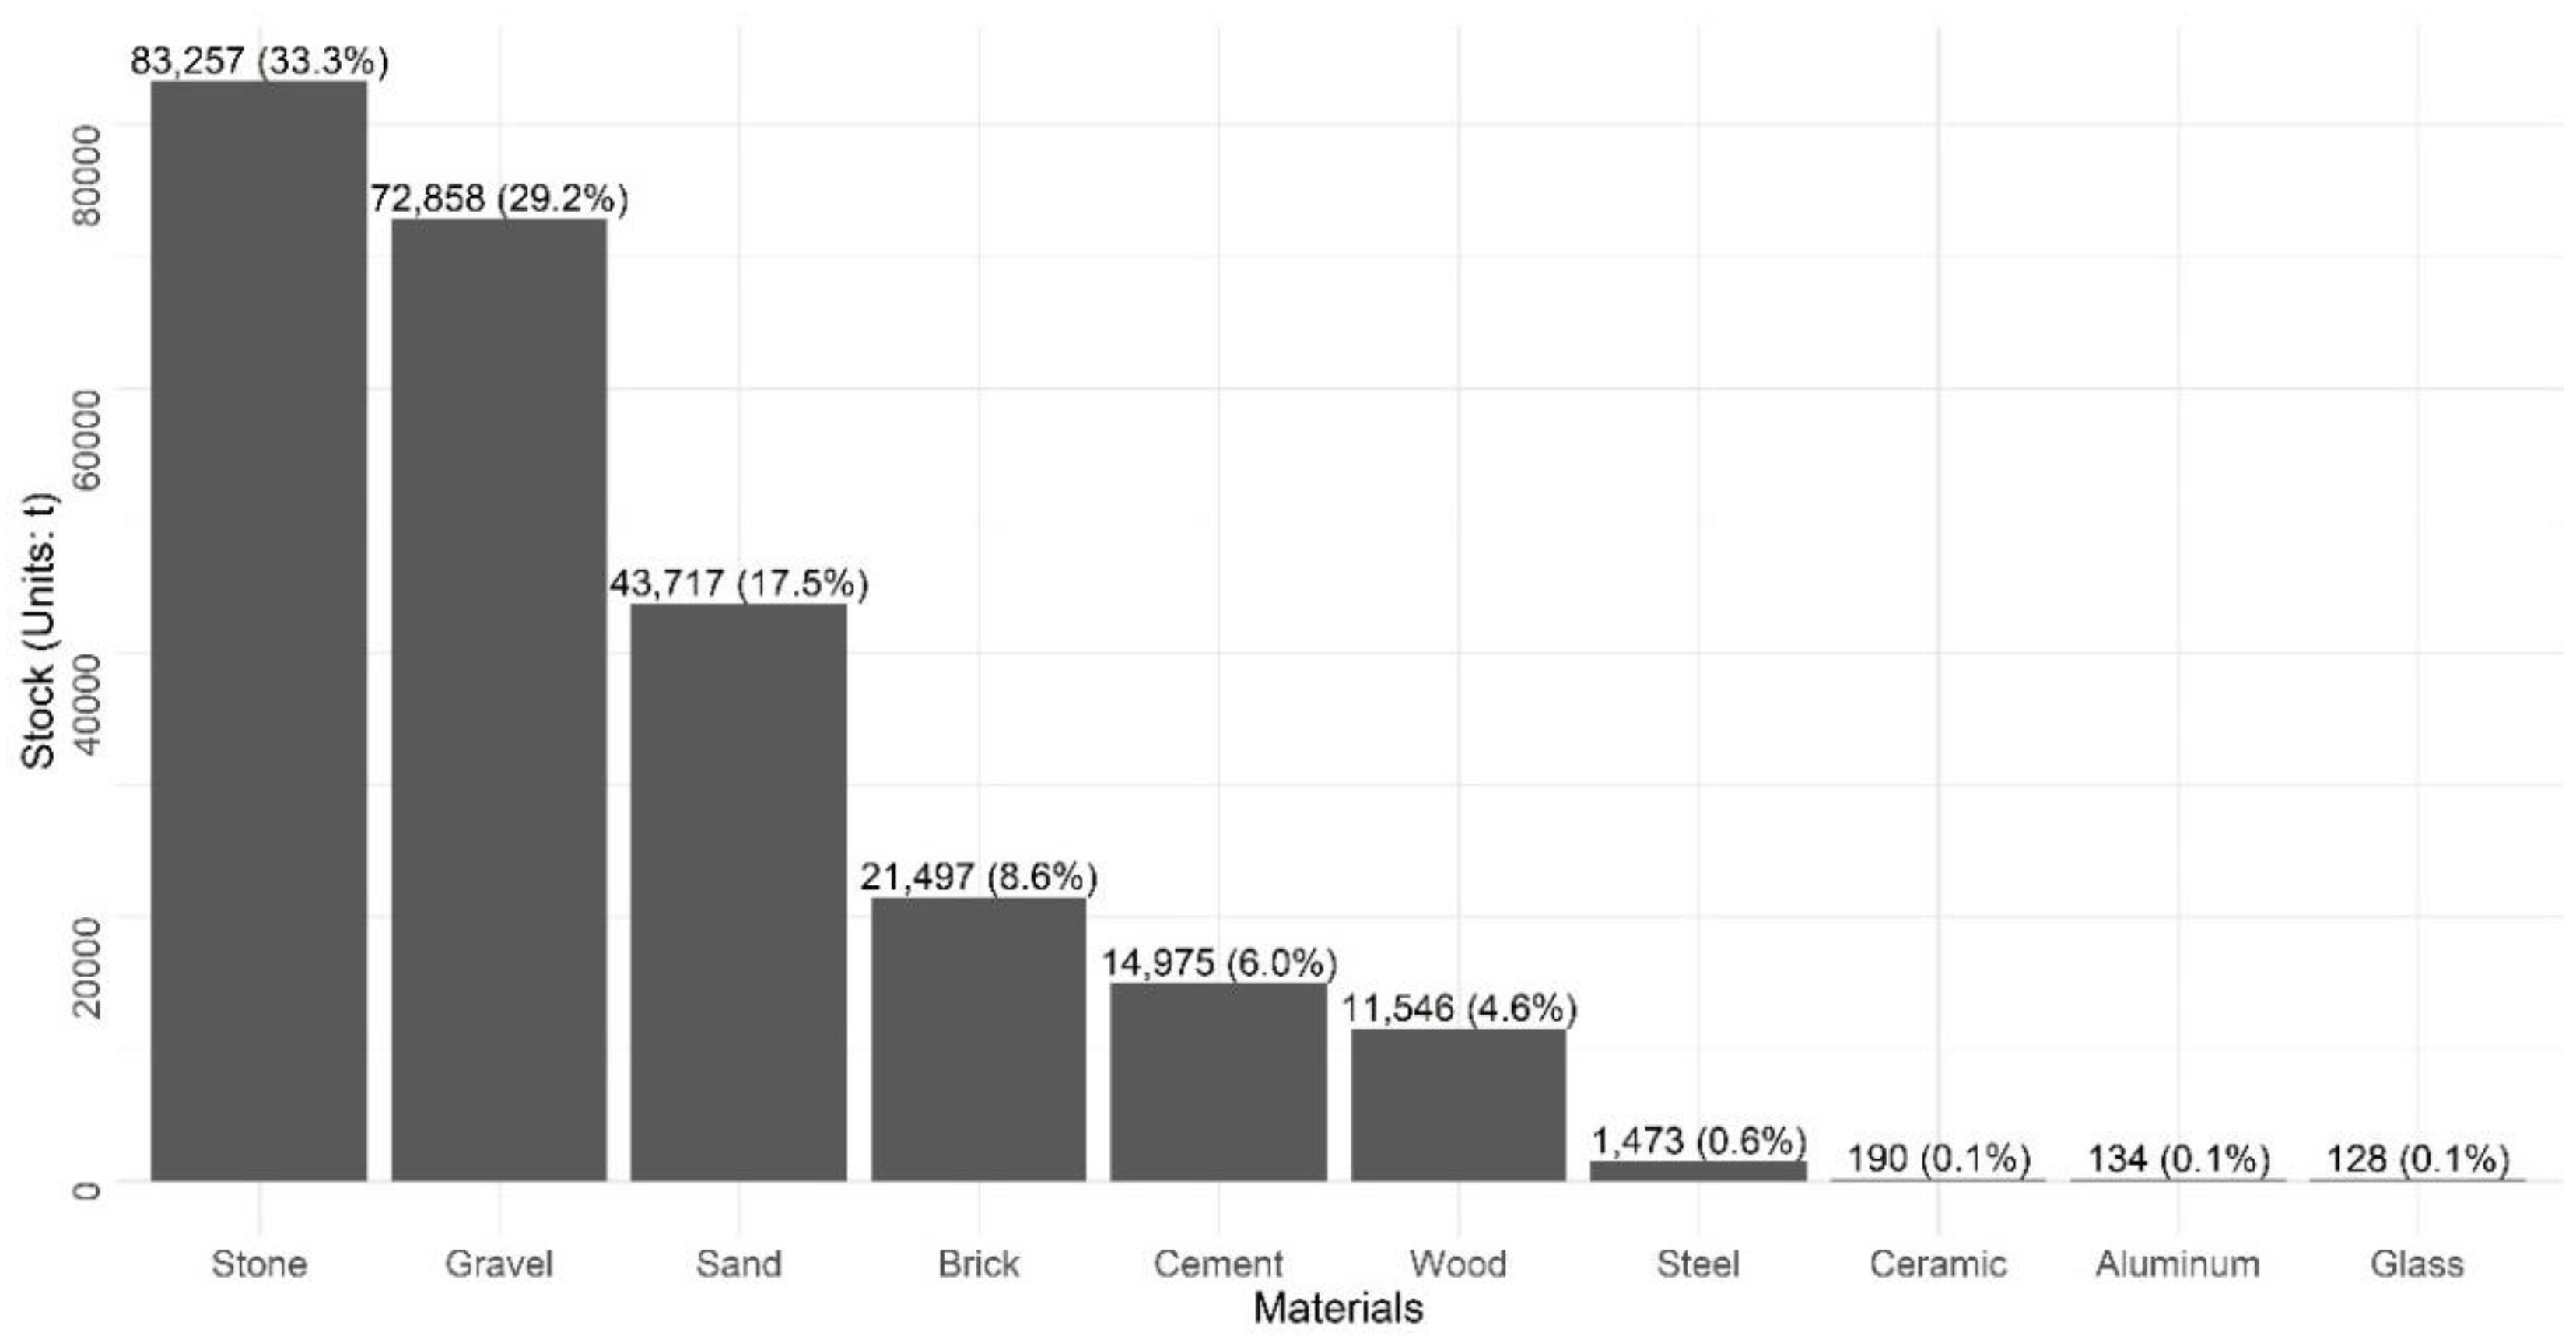
Figure 4. In 2020, the total in-use stock was 249.8 kt. Stone ranked first at 83.3 kt (33.3% of the total), primarily used in road construction, building foundations, and coastal protection due to its stability and durability. Gravel and sand followed, used mainly as concrete aggregates and lime mortar fillers in roadbeds, drainage, and buildings, with stocks of 72.9 kt (29.2%) and 43.7 kt (17.5%), respectively. Together, these three materials constitute about 53% of the total in-use stock, indicating their easy availability on the island. Notably, stone usage on the island is significantly higher than in inland cities.
Materials accounting for 1% to 10% of the total in-use stock include bricks (21.5 kt), cement (15.0 kt), and wood (11.5 kt). Bricks are used for building walls, ground paving, and masonry structures. Cement, serving as an adhesive in construction, is used in concrete and mortar for buildings, roads, and port construction, offering a solid foundation and corrosion resistance. Wood is utilized in wooden structures, fences, and pier piles, with the island's large artificial forest making it readily available.
Materials accounting for less than 1% of the total in-use stock include steel, ceramics, aluminum, and glass. Steel and aluminum, mainly used in the framework structures of residential buildings and other commercial and production buildings, reinforced concrete, and pipeline facilities, provide strength and durability. Ceramics, due to their excellent waterproof and corrosion-resistant properties, are primarily used in building coverings and drainage systems. Glass mainly provides lighting and decorative functions and is widely used in the windows and glass curtain walls of various buildings. These four materials are entirely dependent on external supply to the island and collectively account for 1% of the total stock mass.
3.3. The In-Use Stock Composition of Different Infrastructure Types
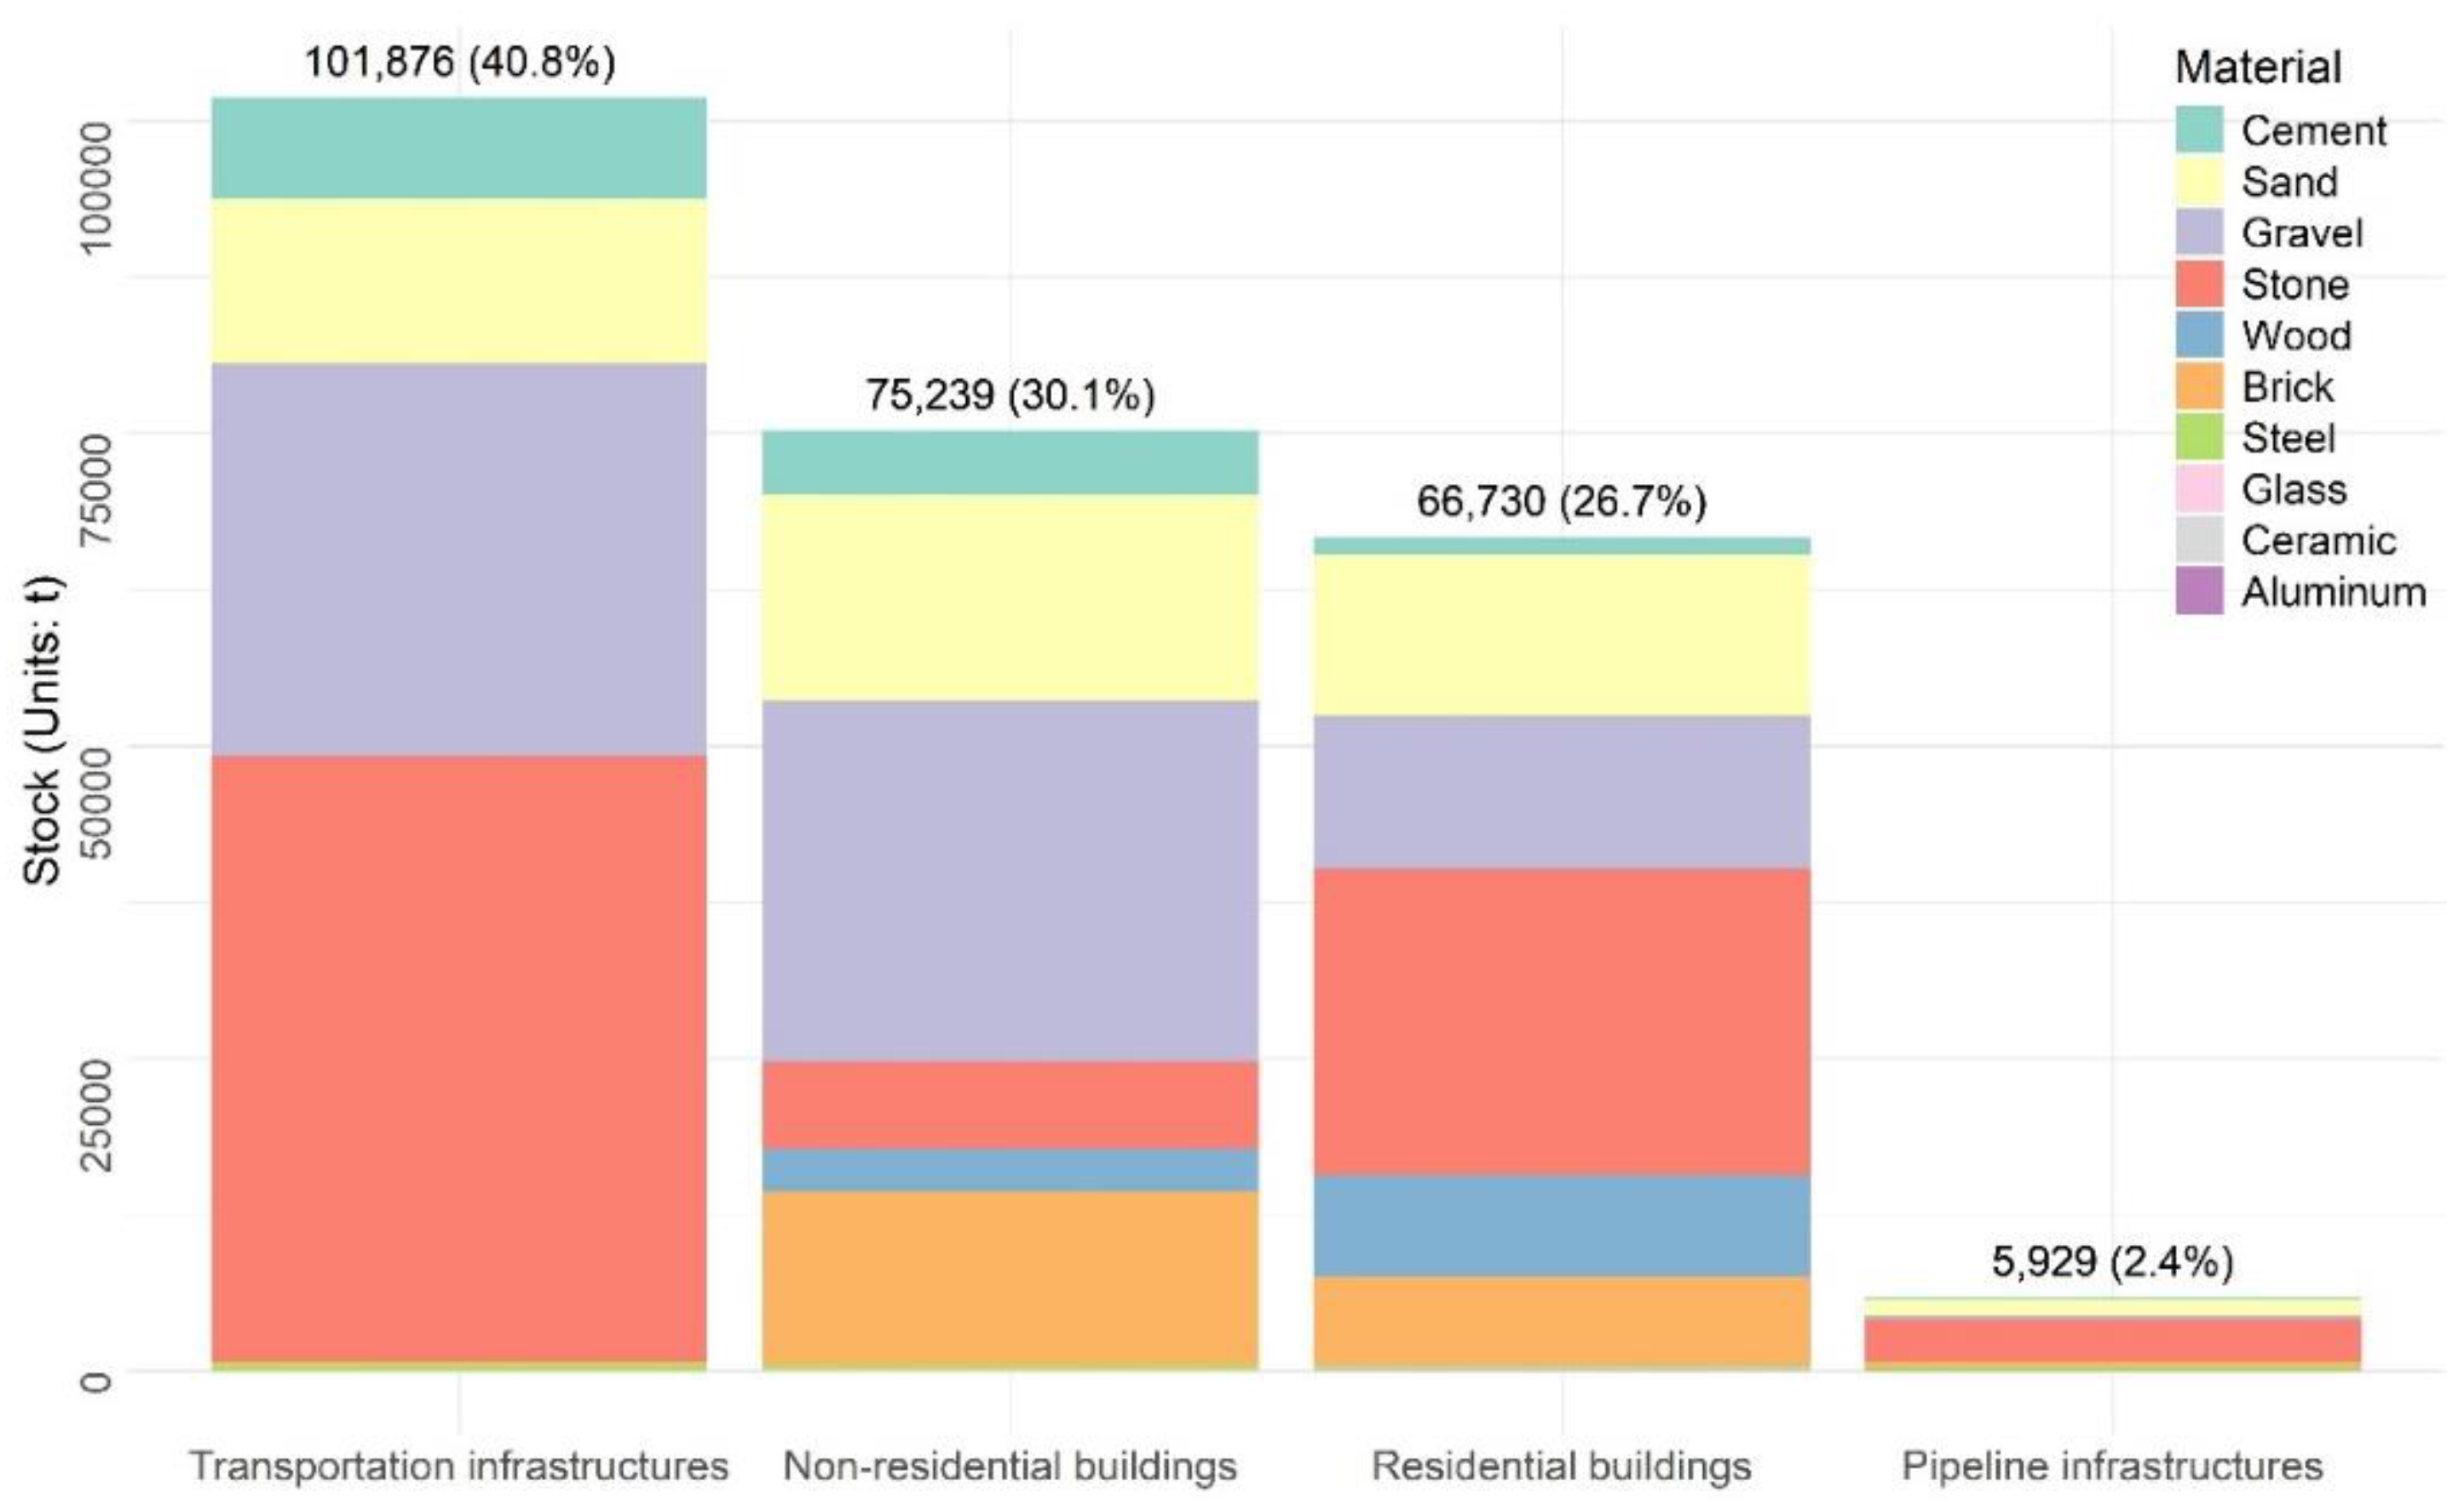
Figure 5 illustrates the MS composition of different infrastructures on Miao Island in 2020. The stock of the four types, ranked from highest to lowest, is transportation infrastructure, non-residential buildings, residential buildings, and pipeline infrastructure. Transportation infrastructure holds the largest share, primarily composed of stone, gravel, sand, and cement, which together make up 99.2% of its total MS. Steel and bricks, measured in hundreds of tons, are used in crash barriers and paving bricks for sidewalks and curbstones. Wood and glass are minimally present in transportation types, each less than one ten-thousandth.
The proportions of non-residential and residential building units in the total stock are roughly equal, at 30.1% and 26.7%, respectively. The primary difference between these two types is that residential buildings have slightly higher proportions of stone and wood compared to non-residential buildings, exceeding 27.4% and 7.8%, respectively.
The pipeline unit has an in-use stock of 5,929 t, accounting for only 2.4% of the island's total infrastructure stock. However, its material composition is distinct, with aluminum and steel comprising 37.5% and 22.1% of their respective total stocks, primarily used in water supply and drainage pipelines.
4. Discussions
4.1. The Temporal Dynamics of In-Use Stock of Island Infrastructure
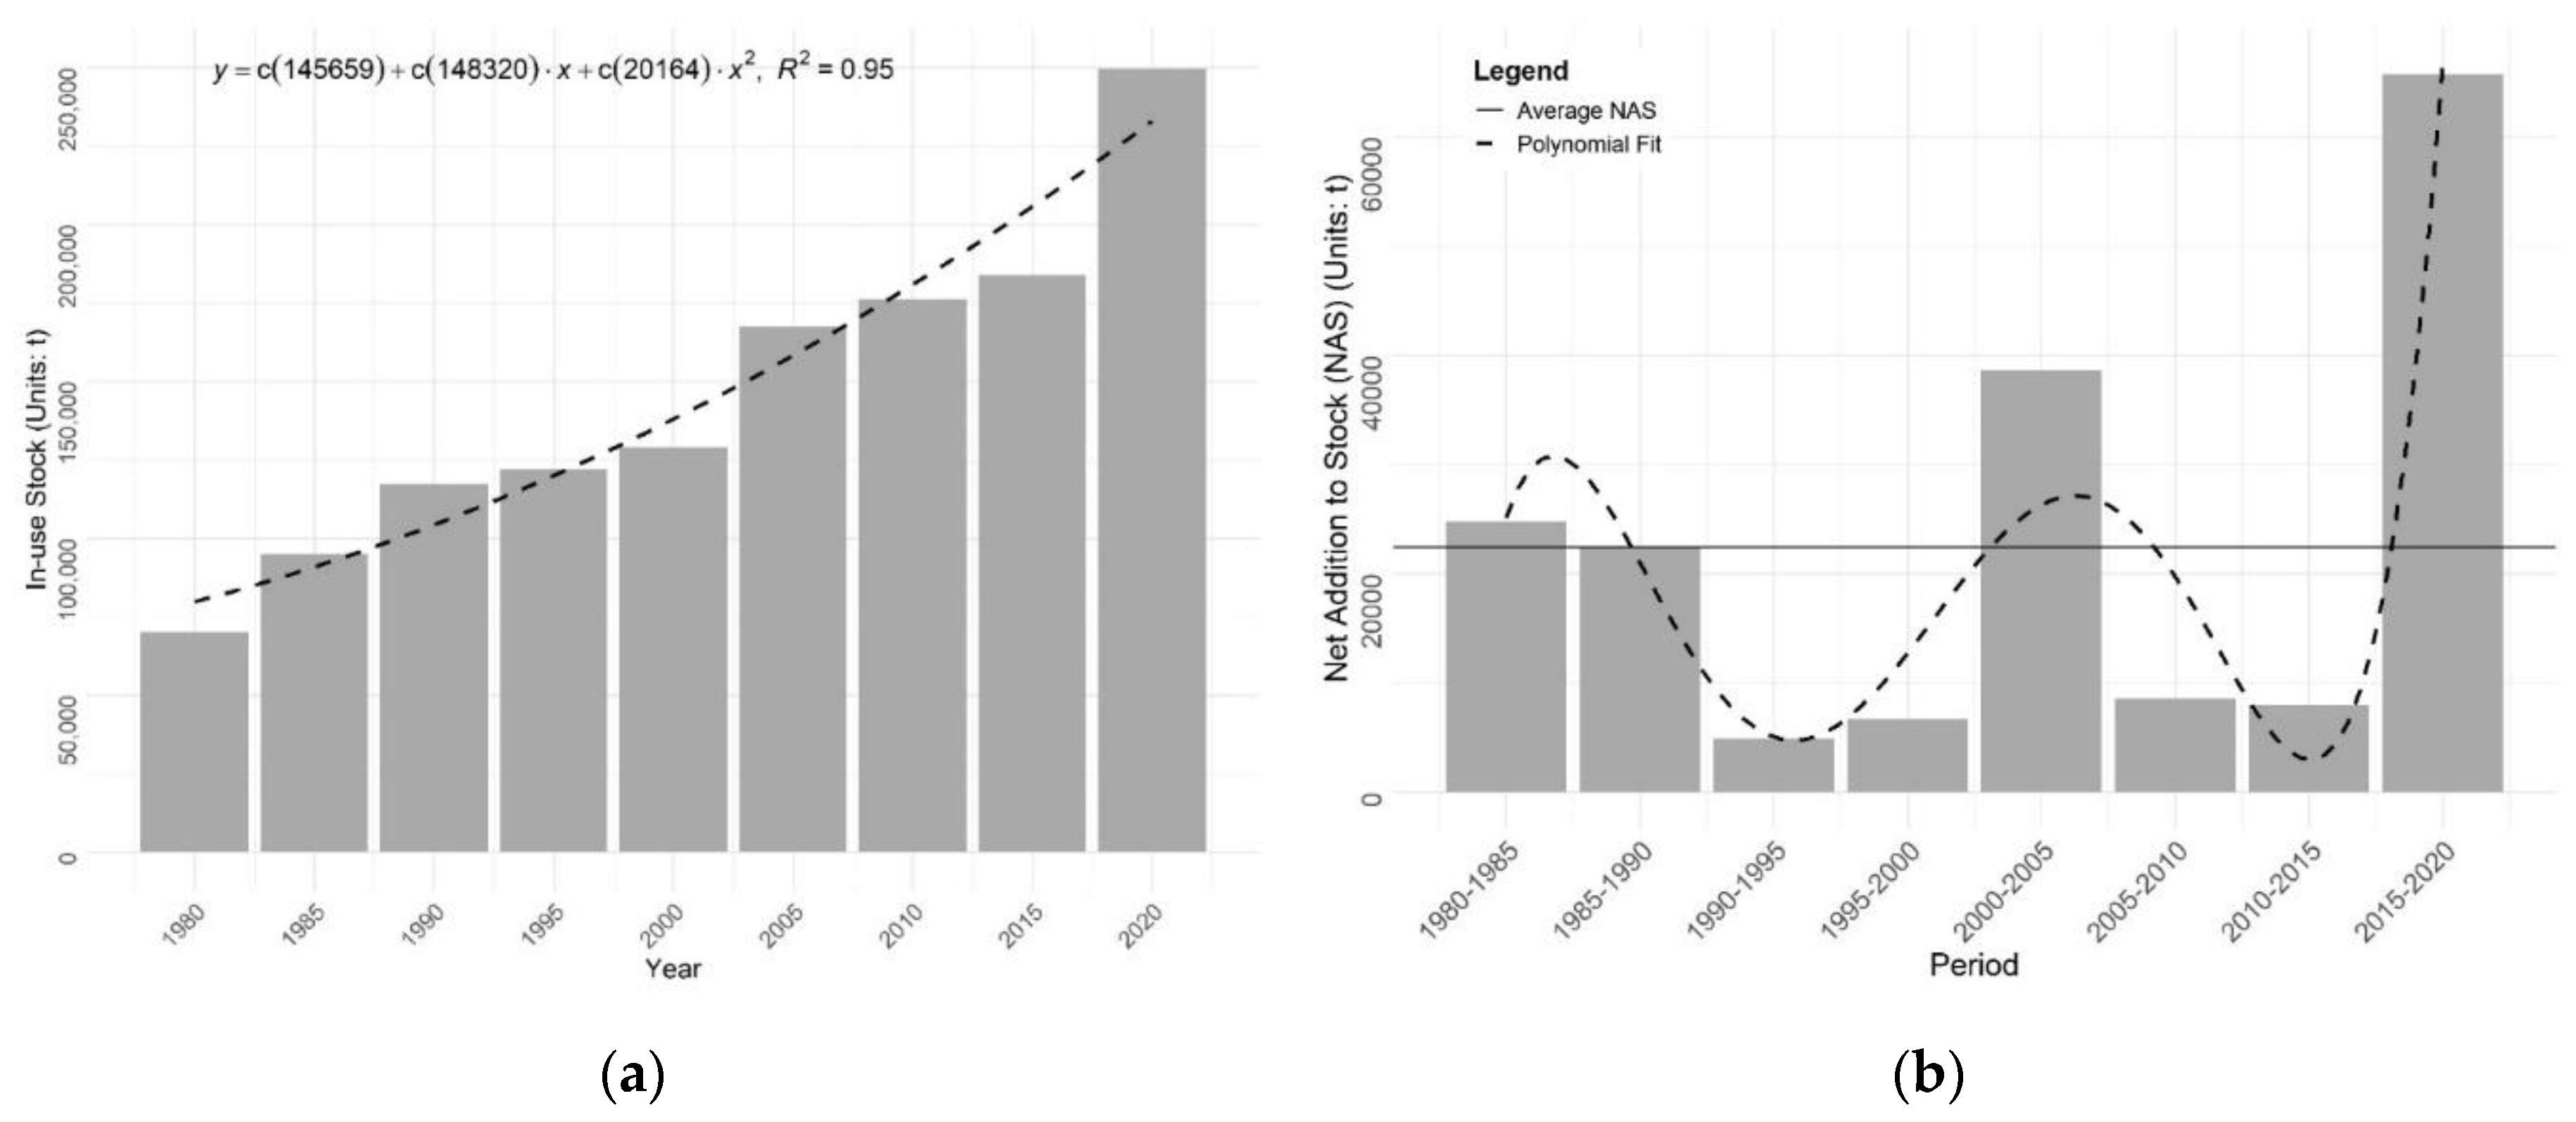
Figure 6 illustrates the dynamic changes in the total in-use stock of island infrastructure every five years from 1980 to 2020. Over these 40 years, the total in-use stock shows a significant upward trend, increasing from 70.2 kt in 1980 to 249.8 kt in 2020, with a net addition to stock (NAS) of 179.6 kt, representing a growth of 256%. The dashed black line represents a quadratic polynomial fit to the data. An R² value of 0.95 suggests a very good fit of the polynomial model, indicating that the increase is accelerating over time.
The temporal dynamics of the NAS of Miao Island infrastructure from 1980 to 2020 show significant fluctuations. From 1980 to 1990, the average five-year NAS was 25.6 kt. In the following decade, this dropped by 75% to 5.8 kt. In the first five years of the new millennium, it rebounded to 38.6 kt, a 64% increase compared to 1980-1990. From 2005 to 2015, the average NAS fell back to levels similar to 1990-2000. In the final period, it saw another significant rise, reaching a historic high of 65.7 kt, nearly double the average five-year NAS from 1980 to 2020.
The dynamics of the NAS highlight three historical development periods of Miao Island infrastructure: (1) 1980-1990: During China's early reform and opening up, the country promoted infrastructure construction, benefiting Miao Island with increased funding and technical support. (2) 2000-2005: After China's WTO accession and Olympic preparations, rapid economic growth led to more investment in infrastructure. As a key tourist and fishery base, Miao Island improved its ports, roads, and electricity infrastructure. (3) 2015-2020: The Chinese government advanced "new-type urbanization," boosting infrastructure investments in coastal areas. Local plans aimed to develop a top-tier tourist resort island, accelerating infrastructure upgrades to enhance competitiveness and attract more tourists [
38].
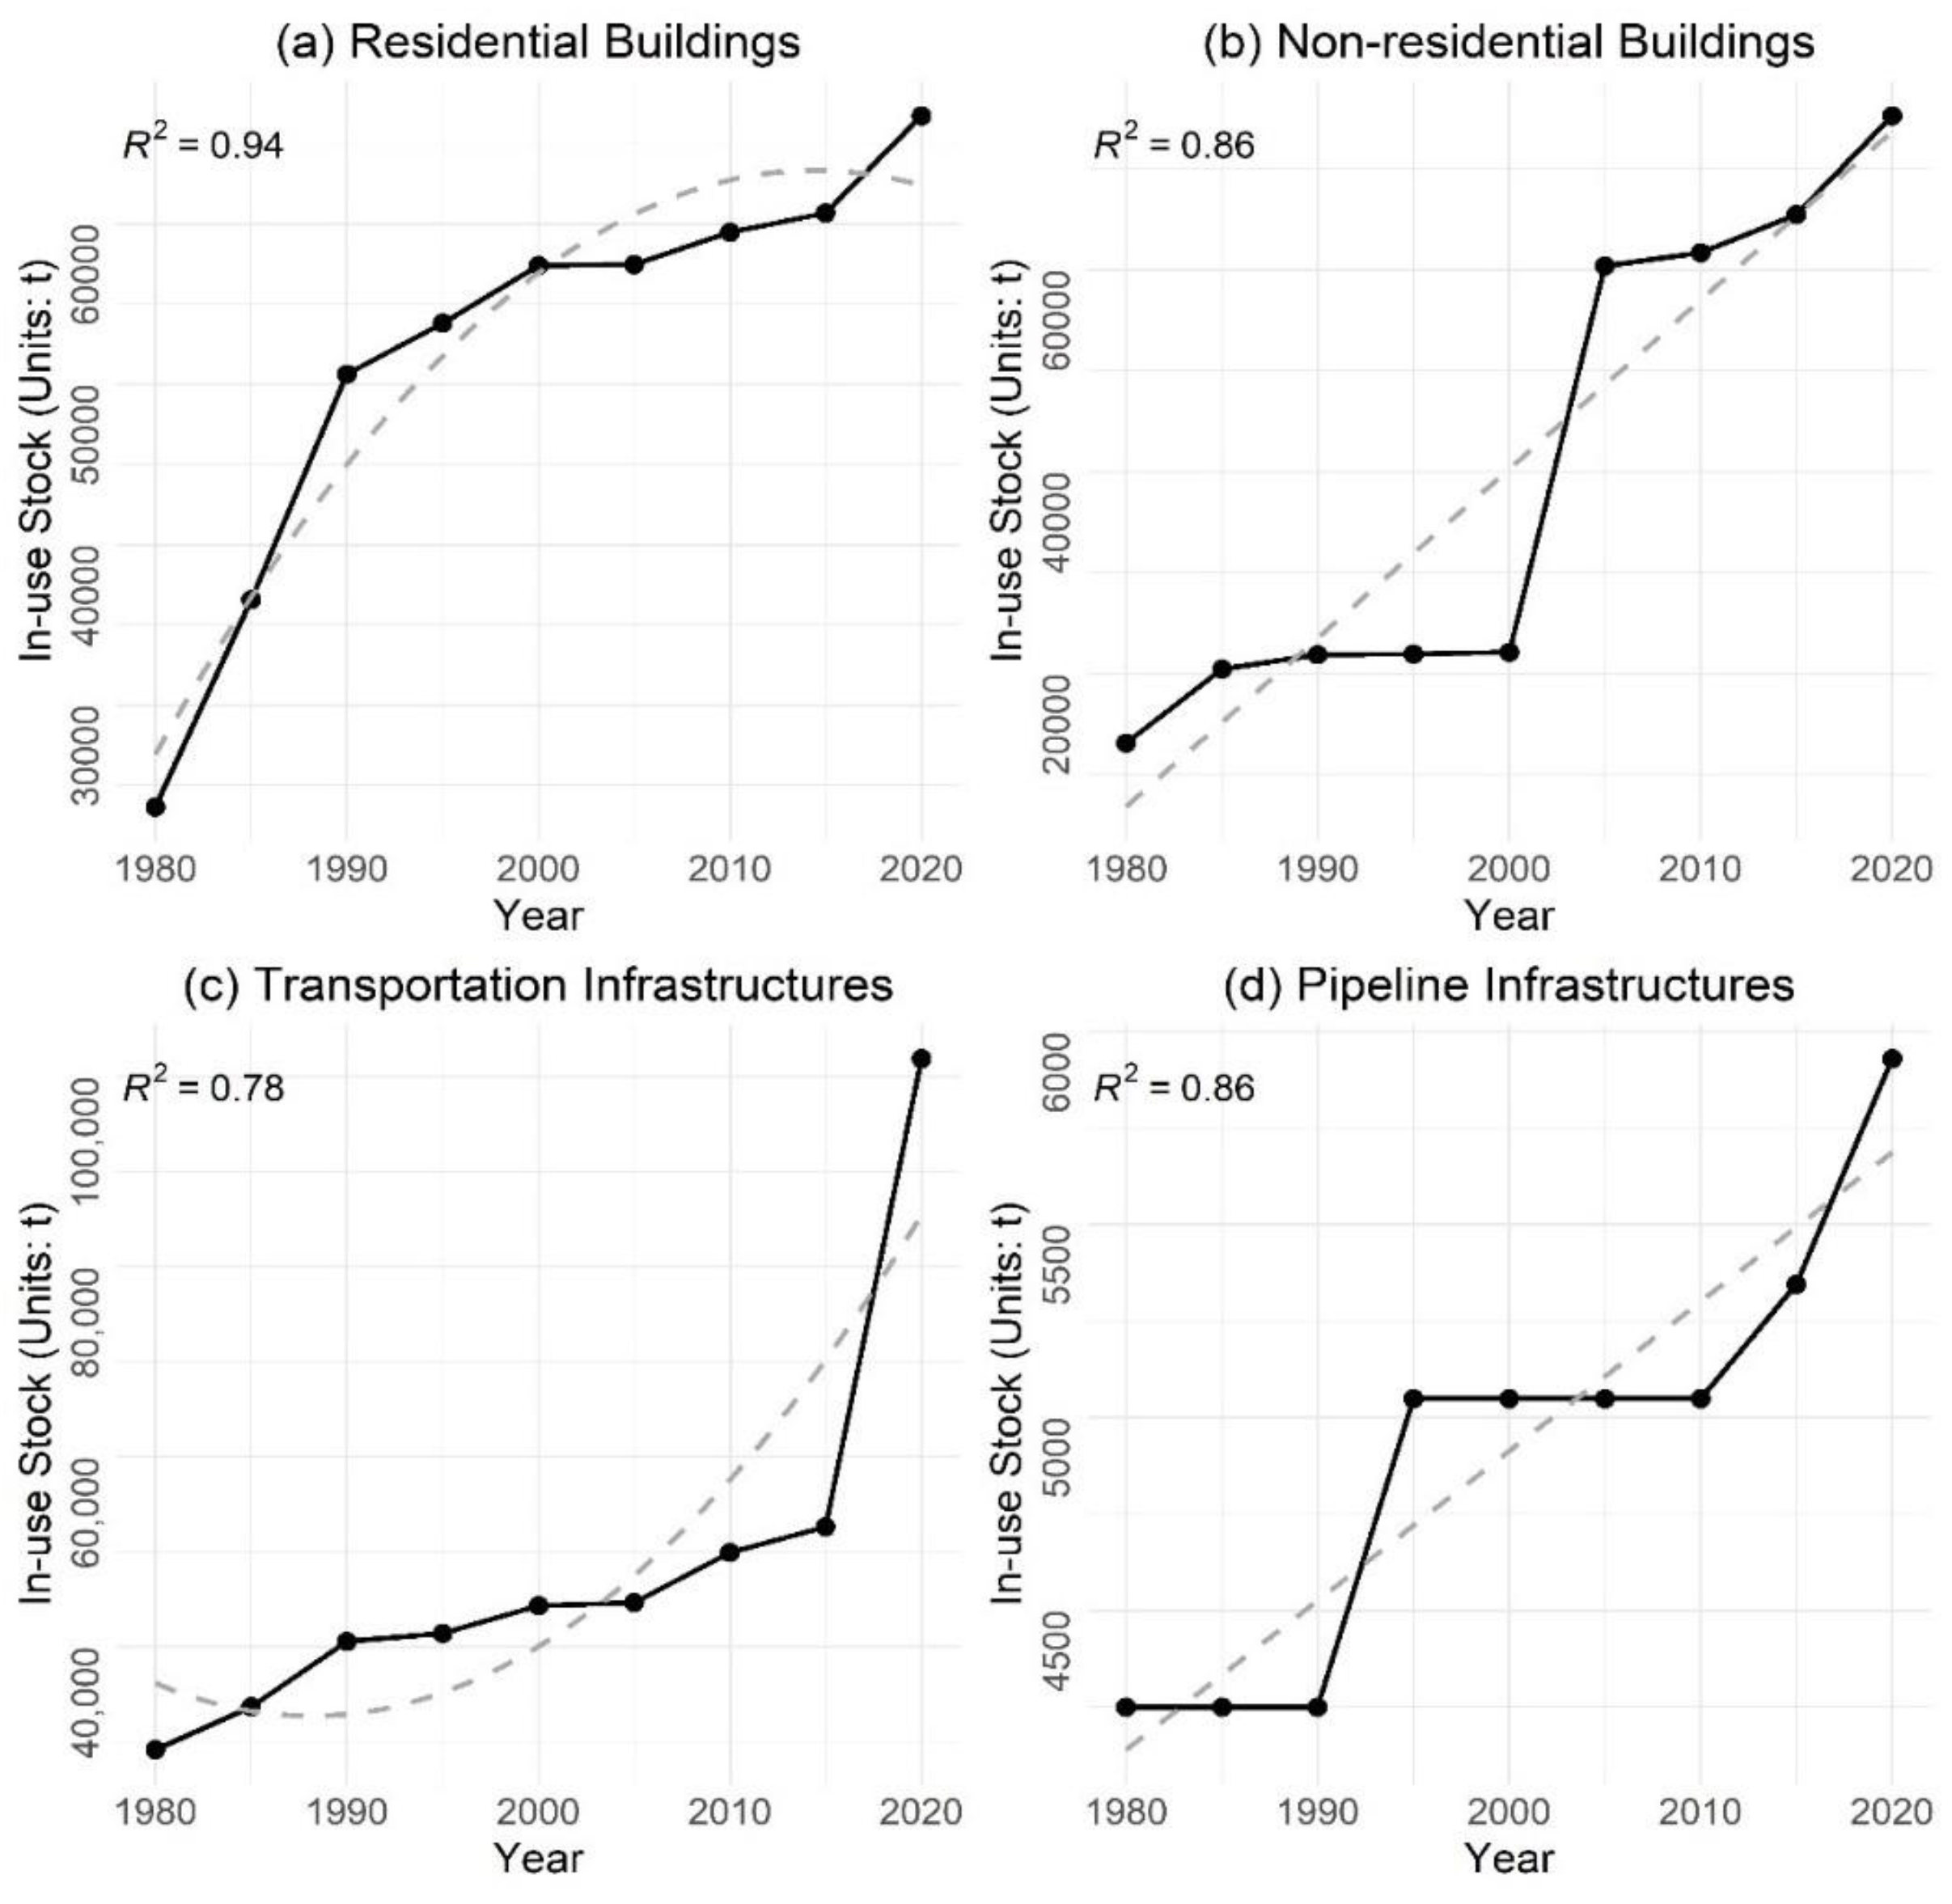
Figure 7 revealed growth across all four infrastructure types over the 40 years. Residential buildings initially grew rapidly but then slowed due to Miao Island's lower population attraction compared to mainland cities. After 2000, suitable land for residential construction was exhausted, and the declining population further reduced housing demand.
Unlike residential buildings, the transportation infrastructure stock showed slow growth initially and rapid growth in the later period. Notably, since 2015, Miao Island has undergone significant infrastructure renovations and upgrades for the fishing and tourism industries, expanding the road system and port facilities. From 2015 to 2020, the 5-year NAS of transportation infrastructure accounted for 67.8% of the total increase in this category over the past 40 years.
In contrast, the stock types of non-residential buildings and pipelines showed a generally linear growth trend, with annual NAS of 1,553 t and 42 t, respectively.
4.2. Comparison of Infrastructure Stock between County-Level Islands and Cities
From an MS perspective, county-level islands like Miao Island show significant differences in construction intensity and growth rates compared to cities. In 2013, the total MS of infrastructure in Beijing, Tianjin, and Shanghai exceeded or was close to one billion tons [
39], while Miao Island's MS was less than 183 kt. The annual growth rate of Miao Island’s infrastructure MS is 3.46%, half that of the three cities. The per capita MS growth rate of Miao Island is 10.12 t/capita·yr, lower than the national average of 13 t/capita·yr [
40]. The island's economic development orientation and limited space constrain its infrastructure scale.
Unlike the widely used reinforced concrete structures in cities, Miao Island has a lower building density, with most buildings being stone-wood structures. This results in lower consumption of bricks and steel per unit area. For example, the steel stock in Miao Island's residential buildings is about 15.62 kg/m², compared to the urban average of 41.3 kg/m² [
41].
Moreover, like most Chinese islands, Miao Island is facing severe population loss due to poor living conditions and limited employment opportunities, which leads to decreased infrastructure utilization efficiency. Some public service agencies, such as primary schools, have closed due to a lack of students. Similarly, more than half of the small-scale aquaculture infrastructure has been abandoned since 2016 due to economic unsustainability and pollution issues. According to this study, about 57.2 kt of in-use stock will soon reach the end of its service period and will inevitably be demolished. This solid waste will pose a significant threat to the island's fragile ecosystem. Promoting the recycling of infrastructure waste and boosting green buildings is crucial for sustainable island development.
5. Conclusions
Analyzing material metabolism offers insights into material flows and accumulation, providing policymakers with new perspectives on resource management and infrastructure planning. In this study, we conducted a comprehensive analysis of the MS of infrastructure on Miao Island, utilizing a bottom-up approach to estimate the quantity, composition, and temporal dynamics of in-use materials. The research findings indicate:
The total in-use material stock on Miao Island in 2020 was 249.8 kt. The predominant materials were stone, gravel, and sand, which together accounted for approximately 80% of the total stock. Stone and wood are abundant resources on the island, whereas steel, ceramics, aluminum, and glass depend entirely on external supply.
Transportation infrastructure held the largest share of the material stock (40.8%), followed by non-residential buildings (30.1%), residential buildings (26.7%), and pipeline infrastructure (2.4%).
The total in-use MS on Miao Island has shown a significant upward trend over the past 40 years, with a NAS of 179.6 kt. Three distinct development periods were identified: 1980-1990, 2000-2005, and 2015-2020, closely linked to China's reform and opening-up policies, and local infrastructure stimulus plans.
Miao Island has lower construction intensity than urban areas, with a per capita MS growth rate of 10.12 t/yr, below the national average of 13 t/yr. The steel stock in residential buildings is 15.62 kg/m², about 37.82% of the urban average. Despite this, the risk from future infrastructure waste will still challenge the island's environmental capacity.
Author Contributions
Conceptualization, Z.G. and A.F.; methodology, Z.G. and Z.Z.; software, P.Z.; validation, Y.Z.; formal analysis, Z.G.; investigation, H.N.; resources, Z.Z.; writing—original draft preparation, Z.G. and P.Z.; funding acquisition, A.F. and Y.Z. All authors have read and agreed to the published version of the manuscript.
Funding
This research was funded by the Fujian Provincial Natural Science (Grant No. 2022J01513 and the National Natural Science Foundation of China (NSFC) (Grant No.42171292 and 42376228).
Institutional Review Board Statement
Not applicable.
Informed Consent Statement
Not applicable.
Data Availability Statement
Data will be made available on request.
Conflicts of Interest
The authors declare no conflicts of interest.
References
- Krausmann, F.; Wiedenhofer, D.; Lauk, C.; Haas, W.; Tanikawa, H.; Fishman, T.; Miatto, A.; Schandl, H.; Haberl, H. Global socioeconomic material stocks rise 23-fold over the 20th century and require half of annual resource use. Proceedings of the National Academy of Sciences 2017, 114, 1880–1885. [Google Scholar] [CrossRef] [PubMed]
- Sun, W.; Yao, G. Impact of mineral resource depletion on energy use: Role of energy extraction, CO2 intensity, and natural resource sustainability. Resources Policy 2023, 86. [Google Scholar] [CrossRef]
- Bontempi, E.; Sorrentino, G.P.; Zanoletti, A.; Alessandri, I.; Depero, L.E.; Caneschi, A. Sustainable Materials and their Contribution to the Sustainable Development Goals (SDGs): A Critical Review Based on an Italian Example. Molecules 2021, 26. [Google Scholar] [CrossRef] [PubMed]
- Wuyts, W.; Miatto, A.; Khumvongsa, K.; Guo, J.; Aalto, P.; Huang, L. How Can Material Stock Studies Assist the Implementation of the Circular Economy in Cities? Environmental Science & Technology 2022, 56, 17523–17530. [Google Scholar] [CrossRef]
- Pianegonda, A.; Favargiotti, S.; Ciolli, M. Rural–Urban Metabolism: A Methodological Approach for Carbon-Positive and Circular Territories. Sustainability 2022, 14. [Google Scholar] [CrossRef]
- Fu, C.; Zhang, Y.; Deng, T.; Daigo, I. The evolution of material stock research: From exploring to rising to hot studies. Journal of Industrial Ecology 2021, 26, 462–476. [Google Scholar] [CrossRef]
- Pauliuk, S.; Wang, T.; Müller, D.B. Steel all over the world: Estimating in-use stocks of iron for 200 countries. Resources, Conservation and Recycling 2013, 71, 22–30. [Google Scholar] [CrossRef]
- Zhang, Y.; Yang, Z.; Yu, X. Urban Metabolism: A Review of Current Knowledge and Directions for Future Study. Environ Sci Technol 2015, 49, 11247–11263. [Google Scholar] [CrossRef]
- Zhang, Y. Urban metabolism: a review of research methodologies. Environ Pollut 2013, 178, 463–473. [Google Scholar] [CrossRef]
- Guo, Z.; Hu, D.; Zhang, F.; Huang, G.; Xiao, Q. An integrated material metabolism model for stocks of urban road system in Beijing, China. Sci Total Environ 2014, 470-471, 883–894. [Google Scholar] [CrossRef]
- Guo, Z.; Shi, H.; Zhang, P.; Chi, Y.; Feng, A. Material metabolism and lifecycle impact assessment towards sustainable resource management: A case study of the highway infrastructural system in Shandong Peninsula, China. Journal of Cleaner Production 2017, 153, 195–208. [Google Scholar] [CrossRef]
- Mastrucci, A.; Marvuglia, A.; Popovici, E.; Leopold, U.; Benetto, E. Geospatial characterization of building material stocks for the life cycle assessment of end-of-life scenarios at the urban scale. Resources, Conservation and Recycling 2017, 123, 54–66. [Google Scholar] [CrossRef]
- Kral, U.; Lin, C.Y.; Kellner, K.; Ma, H.W.; Brunner, P.H. The Copper Balance of Cities: Exploratory Insights into a European and an Asian City. J Ind Ecol 2014, 18, 432–444. [Google Scholar] [CrossRef] [PubMed]
- Fishman, T.; Mastrucci, A.; Peled, Y.; Saxe, S.; van Ruijven, B. RASMI: Global ranges of building material intensities differentiated by region, structure, and function. Scientific Data 2024, 11. [Google Scholar] [CrossRef] [PubMed]
- Ciacci, L.; Passarini, F.; Vassura, I. The European PVC cycle: In-use stock and flows. Resources, Conservation and Recycling 2017, 123, 108–116. [Google Scholar] [CrossRef]
- Antikainen, R.; Lemola, R.; Nousiainen, J.I.; Sokka, L.; Esala, M.; Huhtanen, P.; Rekolainen, S. Stocks and flows of nitrogen and phosphorus in the Finnish food production and consumption system. Agriculture, ecosystems & environment 2005, 107, 287–305. [Google Scholar] [CrossRef]
- Streeck, J.; Wiedenhofer, D.; Krausmann, F.; Haberl, H. Stock-flow relations in the socio-economic metabolism of the United Kingdom 1800–2017. Resources, Conservation and Recycling 2020, 161. [Google Scholar] [CrossRef]
- Dombi, M.; Karcagi-Kováts, A.; Tóth-Szita, K.; Kuti, I. The structure of socio-economic metabolism and its drivers on household level in Hungary. Journal of Cleaner Production 2018, 172, 758–767. [Google Scholar] [CrossRef]
- Maranghi, S.; Parisi, M.L.; Facchini, A.; Rubino, A.; Kordas, O.; Basosi, R. Integrating urban metabolism and life cycle assessment to analyse urban sustainability. Ecological Indicators 2020, 112. [Google Scholar] [CrossRef]
- Lehmann, S. Optimizing Urban Material Flows and Waste Streams in Urban Development through Principles of Zero Waste and Sustainable Consumption. Sustainability 2011, 3, 155–183. [Google Scholar] [CrossRef]
- Fishman, T.; Schandl, H.; Tanikawa, H.; Walker, P.; Krausmann, F. Accounting for the material stock of nations. Journal of Industrial Ecology 2014, 18, 407–420. [Google Scholar] [CrossRef]
- Wang, H.; Chen, D.; Duan, H.; Yin, F.; Niu, Y. Characterizing urban building metabolism with a 4D-GIS model: A case study in China. Journal of Cleaner Production 2019, 228, 1446–1454. [Google Scholar] [CrossRef]
- Rajaratnam, D.; Stewart, R.A.; Liu, T.; Vieira, A.S. Building stock mining for a circular economy: A systematic review on application of GIS and remote sensing. Resources, Conservation & Recycling Advances 2023, 18. [Google Scholar] [CrossRef]
- Fang, B.; Yu, J.; Chen, Z.; Osman, A.I.; Farghali, M.; Ihara, I.; Hamza, E.H.; Rooney, D.W.; Yap, P.-S. Artificial intelligence for waste management in smart cities: a review. Environmental Chemistry Letters 2023, 21, 1959–1989. [Google Scholar] [CrossRef]
- Gil, A.; Arayici, Y.; Kumar, B.; Laing, R. Machine and deep learning implementations for heritage building information modelling: a critical review of theoretical and applied research. ACM Journal on Computing and Cultural Heritage 2024, 17, 1–22. [Google Scholar] [CrossRef]
- Zhu, X.; Lane, R.; Werner, T. Modelling in-use stocks and spatial distributions of household electronic devices and their contained metals based on household survey data. Resources, Conservation and Recycling 2017, 120, 27–37. [Google Scholar] [CrossRef]
- Martínez-Vázquez, R.M.; Milán-García, J.; de Pablo Valenciano, J. Challenges of the Blue Economy: evidence and research trends. Environmental Sciences Europe 2021, 33, 61. [Google Scholar] [CrossRef]
- Adshead, D.; Paszkowski, A.; Gall, S.S.; Peard, A.M.; Adnan, M.S.G.; Verschuur, J.; Hall, J.W. Climate threats to coastal infrastructure and sustainable development outcomes. Nature Climate Change 2024, 14, 344–352. [Google Scholar] [CrossRef]
- Banerjee, O.; Boyle, K.; Rogers, C.T.; Cumberbatch, J.; Kanninen, B.; Lemay, M.; Schling, M. Estimating benefits of investing in resilience of coastal infrastructure in small island developing states: An application to Barbados. Marine Policy 2018, 90, 78–87. [Google Scholar] [CrossRef]
- Symmes, R.; Fishman, T.; Telesford, J.N.; Singh, S.J.; Tan, S.Y.; De Kroon, K. The weight of islands: Leveraging Grenada's material stocks to adapt to climate change. Journal of Industrial Ecology 2020, 24, 369–382. [Google Scholar] [CrossRef]
- Bradshaw, J.; Jit Singh, S.; Tan, S.-Y.; Fishman, T.; Pott, K. GIS-based material stock analysis (MSA) of climate vulnerabilities to the tourism industry in Antigua and Barbuda. Sustainability 2020, 12, 8090. [Google Scholar] [CrossRef]
- Martin del Campo, F.; Singh, S.J.; Fishman, T.; Thomas, A.; Noll, D.; Drescher, M. Can a small island nation build resilience? The significance of resource-use patterns and socio-metabolic risks in The Bahamas. Journal of Industrial Ecology 2023, 27, 491–507. [Google Scholar] [CrossRef]
- Yu, B.; Li, L.; Tian, X.; Yu, Q.; Liu, J.; Wang, Q. Material stock quantification and environmental impact analysis of urban road systems. Transportation Research Part D: Transport and Environment 2021, 93, 102756. [Google Scholar] [CrossRef]
- Augiseau, V.; Barles, S. Studying construction materials flows and stock: A review. Resources, Conservation and Recycling 2017, 123, 153–164. [Google Scholar] [CrossRef]
- Müller, E.; Hilty, L.M.; Widmer, R.; Schluep, M.; Faulstich, M. Modeling metal stocks and flows: a review of dynamic material flow analysis methods. Environmental science & technology 2014, 48, 2102–2113. [Google Scholar] [CrossRef]
- Hirato, T.; Daigo, I.; Matsuno, Y.; Adachi, Y. In-use stock of steel estimated by top-down approach and bottom-up approach. ISIJ international 2009, 49, 1967–1971. [Google Scholar] [CrossRef]
- Cantarino, I.; Carrion, M.A.; Palencia-Jimenez, J.S.; Martínez-Ibáñez, V. Landslide risk management analysis on expansive residential areas–case study of La Marina (Alicante, Spain). Natural Hazards and Earth System Sciences 2021, 21, 1847–1866. [Google Scholar] [CrossRef]
- Bank, W.; Development Research Center of the State Council, t.P.s.R.o.C. Four decades of poverty reduction in China: Drivers, insights for the world, and the way ahead. 2022.
- Huang, C.; Han, J.; Chen, W.-Q. Changing patterns and determinants of infrastructures’ material stocks in Chinese cities. Resources, Conservation and Recycling 2017, 123, 47–53. [Google Scholar] [CrossRef]
- Yoshida, K.; Fishman, T.; Okuoka, K.; Tanikawa, H. Material stock's overburden: Automatic spatial detection and estimation of domestic extraction and hidden material flows. Resources, Conservation and Recycling 2017, 123, 165–175. [Google Scholar] [CrossRef]
- Hu, M.; Pauliuk, S.; Wang, T.; Huppes, G.; van der Voet, E.; Müller, D.B. Iron and steel in Chinese residential buildings: A dynamic analysis. Resources, Conservation and Recycling 2010, 54, 591–600. [Google Scholar] [CrossRef]
|
Disclaimer/Publisher’s Note: The statements, opinions and data contained in all publications are solely those of the individual author(s) and contributor(s) and not of MDPI and/or the editor(s). MDPI and/or the editor(s) disclaim responsibility for any injury to people or property resulting from any ideas, methods, instructions or products referred to in the content. |
© 2024 by the authors. Licensee MDPI, Basel, Switzerland. This article is an open access article distributed under the terms and conditions of the Creative Commons Attribution (CC BY) license (http://creativecommons.org/licenses/by/4.0/).
